Computerized Motion Analysis of Videotaped Neonatal Seizures of Epileptic Origin
17
Epilepsia, 46(6):901–917, 2005 Blackwell Publishing, Inc. C 2005 International League Against Epilepsy Computerized Motion Analysis of Videotaped Neonatal Seizures of Epileptic Origin ∗ Nicolaos B. Karayiannis, ∗ Guozhi Tao, ∗ Yaohua Xiong, ∗ Abdul Sami, ∗ Bindu Varughese, †James D. Frost, Jr., †‡Merrill S. Wise, and †‡Eli M. Mizrahi ∗ Department of Electrical and Computer Engineering, University of Houston; †Peter Kellaway Section of Neurophysiology, Department of Neurology; and ‡Department of Pediatrics, Baylor College of Medicine, Houston, Texas, U.S.A. Summary: Purpose: The main objective of this research is the development of automated video processing and analysis proce- dures aimed at the recognition and characterization of the types of neonatal seizures. The long-term goal of this research is the integration of these computational procedures into the develop- ment of a stand-alone automated system that could be used as a supplement in the neonatal intensive care unit (NICU) to pro- vide 24-h per day noninvasive monitoring of infants at risk for seizures. Methods: We developed and evaluated a variety of compu- tational tools and procedures that may be used to carry out the three essential tasks involved in the development of a seizure recognition and characterization system: the extraction of quantitative motion information from video recordings of neona- tal seizures in the form of motion-strength and motor-activity signals, the selection of quantitative features that convey some unique behavioral characteristics of neonatal seizures, and the training of artificial neural networks to distinguish neonatal seizures from random infant behaviors and to differentiate between myoclonic and focal clonic seizures. Results: The methods were tested on a set of 240 video record- ings of 43 patients exhibiting myoclonic seizures (80 cases), fo- cal clonic seizures (80 cases), and random infant movements (80 cases). The outcome of the experiments verified that optical- flow methods are promising computational tools for quantifying neonatal seizures from video recordings in the form of motion- strength signals. The experimental results also verified that the robust motion trackers developed in this study outperformed con- siderably the motion trackers based on predictive block matching in terms of both reliability and accuracy. The quantitative fea- tures selected from motion-strength and motor-activity signals constitute a satisfactory representation of neonatal seizures and random infant movements and seem to be complementary. Such features lead to trained neural networks that exhibit performance levels exceeding the initial goals of this study, the sensitivity goal being ≥80% and the specificity goal being ≥90%. Conclusions: The outcome of this experimental study pro- vides strong evidence that it is feasible to develop an automated system for the recognition and characterization of the types of neonatal seizures based on video recordings. This will be accomplished by enhancing the accuracy and improving the reli- ability of the computational tools and methods developed during the course of the study outlined here. Key Words: Motion segmentation—Motion tracking—Motion-strength signal— Motor-activity signal—Neonatal seizure—Seizure-type characterization—Seizure-type recognition—Video recording. Seizures occur in two to five per 1,000 live births, depending on studied populations and methods (1–8). Seizure occurrence represents one of the most frequent clinical signs of central nervous system dysfunction in the newborn (9–11) and has been associated with sig- nificant long-term adverse sequelae such as neurologic impairment, developmental delay, and postnatal epilepsy (2–4,10,12–17). Identification of seizures in the newborn initiates a prompt evaluation for a wide range of etiolo- gies and, whenever possible, treatment of the underlying pathologic processes. In some situations, antiepileptic Accepted January 23, 2005. Address correspondence and reprint requests to Dr. N.B. Karayiannis, Dept. of Electrical and Computer Engineering, N308 Engineering Build- ing 1, University of Houston, Houston, TX 77204-4005 U.S.A. E-mail: [email protected] medication is provided to diminish the likelihood of recurrent seizures and to limit any systemic or physiologic instability that may occur during seizures. Prompt recog- nition of clinical seizures by those who care for neonates is the critical first step in the diagnosis and management of underlying neurologic problems. Despite the importance of seizure recognition, a number of limitations exist in rapid and accurate clinical identifi- cation. Seizures in the neonate have clinical characteris- tics that are distinct from those of older children; various seizure types may be based on different pathophysiologic mechanisms; and not all clinical seizures are associated with electroencephalographic seizure activity. Most im- portantly, neonatal seizures may be fleeting—short in du- ration and unpredictable in occurrence and frequency. This requires continuous surveillance for effective recognition. 901
-
Upload
independent -
Category
Documents
-
view
1 -
download
0
Transcript of Computerized Motion Analysis of Videotaped Neonatal Seizures of Epileptic Origin

Epilepsia, 46(6):901–917, 2005Blackwell Publishing, Inc.C© 2005 International League Against Epilepsy
Computerized Motion Analysis of Videotaped Neonatal Seizuresof Epileptic Origin
∗Nicolaos B. Karayiannis, ∗Guozhi Tao, ∗Yaohua Xiong, ∗Abdul Sami, ∗Bindu Varughese,†James D. Frost, Jr., †‡Merrill S. Wise, and †‡Eli M. Mizrahi
∗Department of Electrical and Computer Engineering, University of Houston; †Peter Kellaway Section of Neurophysiology,Department of Neurology; and ‡Department of Pediatrics, Baylor College of Medicine, Houston, Texas, U.S.A.
Summary: Purpose: The main objective of this research is thedevelopment of automated video processing and analysis proce-dures aimed at the recognition and characterization of the typesof neonatal seizures. The long-term goal of this research is theintegration of these computational procedures into the develop-ment of a stand-alone automated system that could be used asa supplement in the neonatal intensive care unit (NICU) to pro-vide 24-h per day noninvasive monitoring of infants at risk forseizures.
Methods: We developed and evaluated a variety of compu-tational tools and procedures that may be used to carry outthe three essential tasks involved in the development of aseizure recognition and characterization system: the extraction ofquantitative motion information from video recordings of neona-tal seizures in the form of motion-strength and motor-activitysignals, the selection of quantitative features that convey someunique behavioral characteristics of neonatal seizures, and thetraining of artificial neural networks to distinguish neonatalseizures from random infant behaviors and to differentiatebetween myoclonic and focal clonic seizures.
Results: The methods were tested on a set of 240 video record-ings of 43 patients exhibiting myoclonic seizures (80 cases), fo-cal clonic seizures (80 cases), and random infant movements
(80 cases). The outcome of the experiments verified that optical-flow methods are promising computational tools for quantifyingneonatal seizures from video recordings in the form of motion-strength signals. The experimental results also verified that therobust motion trackers developed in this study outperformed con-siderably the motion trackers based on predictive block matchingin terms of both reliability and accuracy. The quantitative fea-tures selected from motion-strength and motor-activity signalsconstitute a satisfactory representation of neonatal seizures andrandom infant movements and seem to be complementary. Suchfeatures lead to trained neural networks that exhibit performancelevels exceeding the initial goals of this study, the sensitivity goalbeing ≥80% and the specificity goal being ≥90%.
Conclusions: The outcome of this experimental study pro-vides strong evidence that it is feasible to develop an automatedsystem for the recognition and characterization of the typesof neonatal seizures based on video recordings. This will beaccomplished by enhancing the accuracy and improving the reli-ability of the computational tools and methods developed duringthe course of the study outlined here. Key Words: Motionsegmentation—Motion tracking—Motion-strength signal—Motor-activity signal—Neonatal seizure—Seizure-typecharacterization—Seizure-type recognition—Video recording.
Seizures occur in two to five per 1,000 live births,depending on studied populations and methods (1–8).Seizure occurrence represents one of the most frequentclinical signs of central nervous system dysfunction inthe newborn (9–11) and has been associated with sig-nificant long-term adverse sequelae such as neurologicimpairment, developmental delay, and postnatal epilepsy(2–4,10,12–17). Identification of seizures in the newborninitiates a prompt evaluation for a wide range of etiolo-gies and, whenever possible, treatment of the underlyingpathologic processes. In some situations, antiepileptic
Accepted January 23, 2005.Address correspondence and reprint requests to Dr. N.B. Karayiannis,
Dept. of Electrical and Computer Engineering, N308 Engineering Build-ing 1, University of Houston, Houston, TX 77204-4005 U.S.A. E-mail:[email protected]
medication is provided to diminish the likelihood ofrecurrent seizures and to limit any systemic or physiologicinstability that may occur during seizures. Prompt recog-nition of clinical seizures by those who care for neonatesis the critical first step in the diagnosis and managementof underlying neurologic problems.
Despite the importance of seizure recognition, a numberof limitations exist in rapid and accurate clinical identifi-cation. Seizures in the neonate have clinical characteris-tics that are distinct from those of older children; variousseizure types may be based on different pathophysiologicmechanisms; and not all clinical seizures are associatedwith electroencephalographic seizure activity. Most im-portantly, neonatal seizures may be fleeting—short in du-ration and unpredictable in occurrence and frequency. Thisrequires continuous surveillance for effective recognition.
901

902 N. B. KARAYIANNIS ET AL.
Neonates cared for in intensive care units are atgreatest risk for seizure occurrence. Although this set-ting may provide the greatest opportunity for con-tinuous seizure surveillance, the clinical demands ofcaring for sick neonates limit continuous 24-h/day obser-vation. In addition, significant variability is found amongnursery caregivers in the level of skill and experience inrecognition of clinical seizures. Finally, even when clin-ical seizures are recognized, there is typically no perma-nent visual record of these events that can be reviewedand used for diagnostic confirmation. These factors il-lustrate the clear need for improved seizure surveillancemethods that supplement direct observation by nursesand physicians and that are practical and economicallyfeasible.
Early attempts to characterize neonatal seizures in-volved primarily bedside observation and relatively briefEEG recordings. The development of portable EEG/video/polygraphic monitoring techniques has allowed inves-tigators to assess and characterize neonatal seizures atthe bedside and has permitted retrospective review (18–21). Investigations using these techniques have confirmedthat clinical neonatal seizures are either electroclinical(electrographic and clinical features that are temporallylinked) or clinical only (clinical features with no consistentelectrographic correlate) in character (22). Electrical-onlyseizures are not associated with clinical events. The over-whelming majority of neonatal seizures have a clinicalcomponent (electroclinical or clinical only) (22).
Most research involving neonatal seizures has focusedon analysis of EEG features, and few investigations haveused quantitative techniques to characterize clinical fea-tures (19). However, significant progress has been madein automated video processing and analysis that, untilrecently, has not been applied to clinical seizures. Au-tomated video processing and analysis may supplementand extend human analysis of clinical seizure behav-iors and provide new information leading to more usefulclassification schemes.
The results of our ongoing project, “Video Technolo-gies for Neonatal Seizures,” provided evidence suggest-ing that the analysis of motion in video can facilitate therecognition and characterization of the types of neonatalseizures (23–30) and revealed the potential of comput-erized video as a relatively inexpensive and noninvasivehealth-monitoring tool. Computerized video processingand analysis of video recordings of neonatal seizures cangenerate novel methods for extracting quantitative infor-mation that is relevant only to the seizure. This infor-mation can be used to develop automated mechanismscapable of detecting the onset of clinical seizures, refinethe characterization of repetitive motor behaviors, and fa-cilitate the differentiation of certain clinical seizures fromother abnormal paroxysmal behaviors not associated withseizures.
The main objective of the research outlined here isthe development of automated video analysis proceduresaimed at the recognition and characterization of thetypes of neonatal seizures. The long-term goal of this re-search is the integration of the proposed computationalprocedures into the development of a stand-alone auto-mated system that could be used as a supplement in theneonatal intensive care unit (NICU) to provide 24-h/daynoninvasive monitoring of infants at risk for seizures. Sucha system would be capable of detecting neonatal seizures,processing video recordings of neonatal seizures, and fa-cilitating the analysis and characterization of the types ofvideotaped neonatal seizures by physicians during retro-spective review.
METHODS
Data collection and preprocessingThis study relied on video recordings selected from a
database developed by the Clinical Research Centers forNeonatal Seizures (CRCNS) in Houston, Texas, U.S.A.,established by the National Institute of Neurological Dis-orders and Stroke (31). The overall goal for this ini-tiative was to develop a comprehensive understandingof the clinical and EEG features, predisposing risk fac-tors, etiology, and outcome of seizures in the newborn. Acomprehensive database includes detailed demographicinformation and maternal and infant risk factors, med-ical and neurologic problems, neurologic examinations,weekly tracking of subjects throughout hospitalization,and long-term follow-up at ages 6, 12, and 24 months.As part of this work, bedside video/EEG/polygraphicmonitoring was performed (minimum of 2 h for initialstudy), followed by repeated 1-h studies 3–5 days afterthe initial seizure characterization, and at the time of dis-charge. Additional studies were performed whenever clin-ically indicated, particularly when new seizure behaviorsoccurred.
The CRCNS database contains several hundred indi-vidual clinical seizures, which have been characterizedand classified by a team of clinical neurophysiologistsand neonatal electroencephalographers in terms of theirelectrographic and behavioral features, and the associatedphysiological manifestations have been documented. Inmaking these determinations, the team members stud-ied each video recording together with simultaneouslyrecorded EEG. Decisions on characterization of seizureswere made during group reviews (face-to-face discus-sions) in a way that a consensus was reached for eachseizure included in the CRCNS database. The analogvideo recordings contained in the CRCNS database weredigitized with a temporal sampling rate of 30 frames/s,which is considered high enough to capture sudden andrapid motion. The digitized frames that contained animage of the infant together with EEG were of size
Epilepsia, Vol. 46, No. 6, 2005

ANALYSIS OF VIDEOTAPED NEONATAL SEIZURES 903
352 × 240 pixels. After the elimination of the EEG sig-nals, the video recordings produced sequences of framesof size 203 × 240 pixels.
Extraction of quantitative motion informationfrom video
The first specific aim of this project was to extractquantitative motion information from video recordings ofneonatal seizures and other normal and abnormal clinicalevents not associated with seizures in the form of temporalmotion-strength and motor-activity signals.
Extraction of motion-strength signalsIn principle, motion-strength signals quantify motion
by measuring the area of each frame occupied by mov-ing body parts affected by seizures. As the seizureprogresses in time, the area measurements A producetemporal motion-strength signals A(t). The extraction ofmotion-strength signals requires an automated procedurecapable of segmenting the infants’ moving body part(s) ateach frame of the sequence.
In this study, we attempted to improve the extractionof motion-strength signals by modifying the proceduredeveloped in our preliminary study (23). This investiga-tion resulted in a new procedure, which extracts motion-strength signals from video recordings by applyingnonlinear filtering, clustering, and morphological filter-ing on the differences between adjacent frames (24). Ourexperiments indicated that the combination of the newclustering scheme with morphologic filtering improvesconsiderably the robustness of the new extraction pro-cedure to noise. However, this procedure underestimatedmotion in most of the cases and failed completely in somevideo recordings.
The extraction of quantitative motion information fromvideotaped neonatal seizures in the form of motion-strength signals also was attempted by relying on optical-flow computation methods (25). Optical flow is theterm used to indicate the velocity field generated bythe relative motion between an object and the cam-era in a sequence of frames (32). Optical flow pro-vides important information for analyzing motion invideo. Our work produced a methodology for the de-velopment of regularized optical-flow computation meth-ods based on a continuous formulation that involveda broad variety of smoothness constraints (25). As analternative, we also developed a discrete formulationof the optical-flow problem, which relied on the dis-crete approximation of a family of quadratic function-als (25). The optical-flow methods produced by the pro-posed formulations were used to extract quantitativeinformation from video recordings of neonatal seizuresin the form of motion-strength signals. Motion-strengthsignals were obtained after the computation of the veloc-ity fields by measuring the area at each frame containingall pixels with velocities exceeding a certain threshold.
Extraction of motor-activity signalsIn principle, motor-activity signals are obtained by pro-
jecting to the horizontal and vertical axes an anatomicalsite located on the body part affected by the seizure. As theseizure progresses in time, the projection X of the anatom-ical site of interest to the horizontal axis and its projectionY to the vertical axis produce temporal signals X(t) andY(t) recording motor activity of the body parts of interest.The extraction of motor-activity signals requires an auto-mated procedure capable of tracking an anatomical site ofinterest throughout the video frame sequence.
Temporal motor-activity signals were extracted in ourpreliminary study (23) by the KLT algorithm, which tracksselected anatomical sites throughout a video-frame se-quence by relying on a pure translation block-motionmodel (33,34). The KLT algorithm was generally success-ful in extracting motor-activity signals from video record-ings of neonatal seizures. However, in some cases, the al-gorithm lost anatomical sites that were located on movingbody parts tracked throughout the video-frame sequence(23). The susceptibility of the KLT algorithm to “lostsites” motivated several approaches aimed at the develop-ment of more accurate and reliable motion trackers. Suchapproaches dealt with several aspects of motion track-ing, including the use of more sophisticated block-motionmodels (34,35).
Motion tracking was performed in this study by usingadaptive block matching to track a block of pixels locatedon a moving body part throughout a sequence of frames(26). Although adaptive block matching was generallysuccessful, it was not always reliable, because it attemptsto find the best match of the block of interest within a largesearch window in the next frame. Our investigation led tothe development of predictive block matching, a methoddeveloped to track motion by exploiting the advantagesof block-motion estimation and adaptive block matching(27).
Motion tracking also was performed in this study bytrackers based on novel minimization approaches (28) anda variety of block-motion models (29). The motion track-ers developed in this study overcome most of the problemsassociated with the application of existing motion trackersin video recording of neonatal seizures, with the most no-table being the occasional failure to track throughout thesequence of video frames. However, such motion trackerswere found to be susceptible to noise and other record-ing imperfections. We addressed this problem recently bydeveloping robust motion trackers, which are specificallydesigned to suppress the effect of noise (29).
Motion tracking in video also requires an automatedprocedure capable of selecting anatomical sites on themoving body part, which also was developed in this study(30). This automated procedure was developed even fur-ther to perform tracking of multiple anatomical sites lo-cated on moving body parts. This is necessary because
Epilepsia, Vol. 46, No. 6, 2005

904 N. B. KARAYIANNIS ET AL.
neonatal seizures are frequently associated with motionof multiple extremities.
Selection of quantitative features from videoThe second specific aim of this project was to select
quantitative features that convey some unique behavioralcharacteristics of neonatal seizures and nonseizure in-fant behaviors from temporal signals extracted from videorecordings. Quantitative features can be obtained based ona global view of the temporal signals to represent some oftheir key properties and also to reveal their relation withthe underlying clinical event.
Quantitative features from motion-strength signalsThe quantitative features obtained from motion-
strength signals were the variance of time intervals, theenergy ratio, the maximum spike duration, and the num-ber of spikes. This article shows only the results obtainedfor the first three of the features, which were experimen-tally found to provide the most solid basis for separatingthe classes.
Variance of time intervals. This feature can be obtainedfrom motion-strength signals by computing the varianceof the time intervals between any two adjacent spikes. Ifa motion-strength signal contains one or two spikes, thevariance can be assigned an arbitrary large value. Thisfeature was introduced to measure the rhythmicity of theinfants’ movements based on the observation that rhyth-mic movements would produce variance values close tozero. The variance of time intervals can be useful for dis-tinguishing myoclonic seizures from focal clonic seizuresbecause it is expected to take small values for focal clonicseizures but considerably higher values for myoclonicseizures.
Energy ratio: The correlation sequence of any two sig-nals provides a measure of how similar these signals areand for how long they remain similar when one of themis shifted with respect to the other. The autocorrelationsequence is the correlation sequence of a signal with it-self and may be used to measure the rhythmicity of motionmanifested as quasiperiodic spikes in motion-strength sig-nals. For a motion-strength signal that is N samples long,the autocorrelation was computed by shifting the signalwith respect to itself by up to 0.6 × N samples. The en-ergy ratio of the autocorrelation sequence, or simply theenergy ratio, was calculated as the ratio of the energy con-tained by the last 75% of the samples of the autocorrelationsequence to the energy contained by the first 25% of sam-ples of the autocorrelation sequence. If two signals aresimilar in shape, their correlation sequence decays veryslowly, and the corresponding energy ratio is expected totake large values. This is expected to be the case for theenergy ratio computed for motion-strength signals pro-duced for focal clonic seizures due to the rhythmicity ofmotion that is their signature. In contrast, the energy ratiois expected to take small values for myoclonic seizures
because their autocorrelation sequence decays very fast,whereas most of its energy is contained by a few samplesnear the origin.
Maximum spike duration: The maximal spike durationprovides a quantitative measure of the speed of the infants’movements. The maximum spike duration is expected totake the smallest values for myoclonic seizures, which aretypically associated with rapid movements of short dura-tion. Such values can differentiate neonatal seizures fromrandom infant movements, which are typically slower andproduce spikes of longer duration.
Number of spikes: This feature can be obtained frommotion-strength signals by counting the number of spikesper time unit. Such a feature can be obtained by shiftinga window over the entire frame sequence and countingthe number of spikes per window. By fixing the size of thewindow, this feature becomes independent of the length ofthe frame sequence. The selection of such a feature can bejustified by the fact that myoclonic seizures are expectedto produce a small number of spikes because they are typ-ically associated with isolated and rapid movements. Incontrast, focal clonic seizures are expected to produce alarge number of spikes per time unit because they are typi-cally associated with rhythmic movements of considerableduration.
Quantitative features from motor-activity signalsOur investigation indicated that the selection of quan-
titative features from motor-activity signals can be facili-tated by computing the motion trajectories for each of themoving body parts. The motion trajectory signal Z = Z(t)was computed to measure the fluctuations of the motoractivity signals X = X(t) and Y = Y(t) from their meansX and Y , respectively. The quantitative features selectedfrom the motion trajectory signals were the energy ratio,the maximum spike duration, the variance of the time in-tervals between the extrema, and the number of extrema.Once again, this article shows only the results obtained forthe first three of them, which formed the most successfulset.
Energy ratio: The procedure outlined for computing theenergy ratio for motion-strength signals also can be usedfor computing the energy ratio from the autocorrelation se-quence of motion trajectory signals. For “sawtooth-like”signals produced for focal clonic seizures, the energy ofthe autocorrelation sequence is distributed over all its sam-ples, and the energy ratio is expected to take large values.In contrast, the energy ratio is expected to take relativelysmall values for myoclonic seizures. This can be attributedto the fact that most of the energy of their autocorrelationsequence is contained by a few samples near the origin.
Maximum spike duration: The maximum spike dura-tion provides a quantitative measure of the speed of theinfants’ movements. The maximum spike duration is ob-tained from the gradient of the motion trajectory signals
Epilepsia, Vol. 46, No. 6, 2005

ANALYSIS OF VIDEOTAPED NEONATAL SEIZURES 905
Z = Z(t). If a movement produces a step-like displacementin the motion trajectory signal, the gradient would producea spike at the step location. The duration of the spike wouldprovide a measure of the speed, with rapid movementsproducing sharp spikes of short duration. The maximumspike duration is expected to take the smallest values formyoclonic seizures, which are typically associated withrapid movements of short duration. Such values can dif-ferentiate myoclonic seizures from random infant move-ments, which are typically slower and smoother than thoseassociated with myoclonic seizures.
Variance of time intervals: The rhythmicity of the in-fants’ movements can be quantified by computing thevariance of time intervals between the extrema of themotion trajectory signals. In case of signals containinga single extremum or two extrema, the variance of timeintervals between the extrema can be set to a predefinedhigh value. This measure was established based on the ob-servation that rhythmic movements would produce smallvariance values. Motor-activity signals produced by ran-dom infant movements may contain a large number ofextrema as well, but the duration of the intervals betweenthose extrema may vary considerably. As a result, suchrandom infant movements are expected to produce highvalues for the variance of the intervals between extrema.
Number of extrema: This feature can be obtained frommotor-activity signals by counting the number of extremaper time unit. The selection of such a feature can bejustified by the fact that focal clonic seizures are ex-pected to produce the largest number of extrema. This isconsistent with the rhythmicity of motion characterizingthese clinical events. The number of extrema is expectedto be significantly smaller in the motor-activity signals ex-tracted from myoclonic seizures and random infant move-ments.
Recognition and characterization of neonatal seizuresbased on neural networks
The third specific aim of this project was to train artifi-cial neural networks to recognize neonatal seizures of thefocal clonic and myoclonic types and differentiate themfrom normal and abnormal infant behaviors not associatedwith seizures. The development of an automated seizure-recognition system is essentially the problem of classify-ing a set of temporal signals that describe neonatal seizuresand clinical events not associated with seizures. Neuralnetworks provide a solid basis for the development of aseizure-recognition system because of their versatility andflexibility. Neural networks are nonlinear computationalmodels that can be trained by examples to implement clas-sifiers with no a priori assumptions regarding the statisticsof the data or the size of the available data set (36,37).
The development of an automated seizure-recognitionsystem relied on traditional feed-forward neural networks(FFNNs) (36,37). The FFNNs trained to recognize and
characterize neonatal seizures contained a single hiddenlayer with 20 units and three sigmoid output units thatrepresented the classes myoclonic seizure, focal clonicseizure, and random infant movement. The number of hid-den units was chosen in these experiments by trial anderror. The specific procedure used for determining thenumber of hidden units aimed at selecting the minimalnumber of hidden units required by the FFNNs to im-plement the mapping defined by the training set withoutdegrading the generalization ability of the trained mod-els. The FFNNs were trained by a learning algorithm de-veloped to accelerate the training of supervised neuralnetwork models by gradient descent (38). The trainingwas terminated when the classification error computed onthe testing set increased for five consecutive iterations.
RESULTS
The methods were tested on a set of 240 video record-ings of 43 patients exhibiting myoclonic seizures (80cases), focal clonic seizures (80 cases), and random infantmovements (80 cases).
Extraction of quantitative motion informationfrom video
Figures 1 to 3 show the motion-strength and motor-activity signals extracted by the procedures developedduring this project from video recordings of myoclonicseizures, focal clonic seizures, and random infant move-ments. The locations of the moving body parts during theclinical event are shown in representative frames of eachvideo recording. The frames of the video recordings shownin Figs. 1–3 can be used as a reference to verify the con-sistency of the temporal signals with the correspondingclinical events. The values of the signals correspondingto the frames shown at the top of each figure are indi-cated by dots, whereas the moving body part in each videorecording is shown within a box.
Figure 1 shows the temporal motion-strength andmotor-activity signals produced for a myoclonic seizure.In the myoclonic seizure shown in Fig. 1, the infant’s righthand is moving rapidly toward the bottom of the frame be-tween frames 112 and 122 and from frame 200 to frame220. According to Fig. 1a, this motion was captured andquantified correctly by the optical-flow method, whichalso captured the slow motion between frames 108 and110. The motion-segmentation method based on cluster-ing and morphologic filtering underestimated the area ofthe frames occupied by the moving body part by almost anorder of magnitude. Both methods used for extracting themotor-activity signals shown in Fig. 1b managed to trackthe anatomical site selected by the automated procedureon the infant’s right hand.
Figure 2 shows the temporal motion-strength andmotor-activity signals produced for a focal clonic seizure.The focal clonic seizure shown in Fig. 2 affected the
Epilepsia, Vol. 46, No. 6, 2005
906 N. B. KARAYIANNIS ET AL.
FIG. 1. (i) Selected frames of video recordings of a myoclonic seizure affecting an infant’s right hand and quantitative motion informationextracted in the form of (a) motion-strength signals produced by (ii) the motion-segmentation method based on clustering and morphologicalfiltering and (iii) the optical-flow method, (b) motor-activity signals produced by (ii) the predictive block-matching method and (iii) the robustblock motion-tracking method.
FIG. 2. (i) Selected frames of video recordings of a focal clonic seizure affecting an infant’s left leg and quantitative motion informationextracted in the form of (a) motion-strength signals produced by (ii) the motion-segmentation method based on clustering and morphologicalfiltering and (iii) the optical-flow method, (b) motor-activity signals produced by (ii) the predictive block-matching method and (iii) the robustblock motion-tracking method.
Epilepsia, Vol. 46, No. 6, 2005
ANALYSIS OF VIDEOTAPED NEONATAL SEIZURES 907
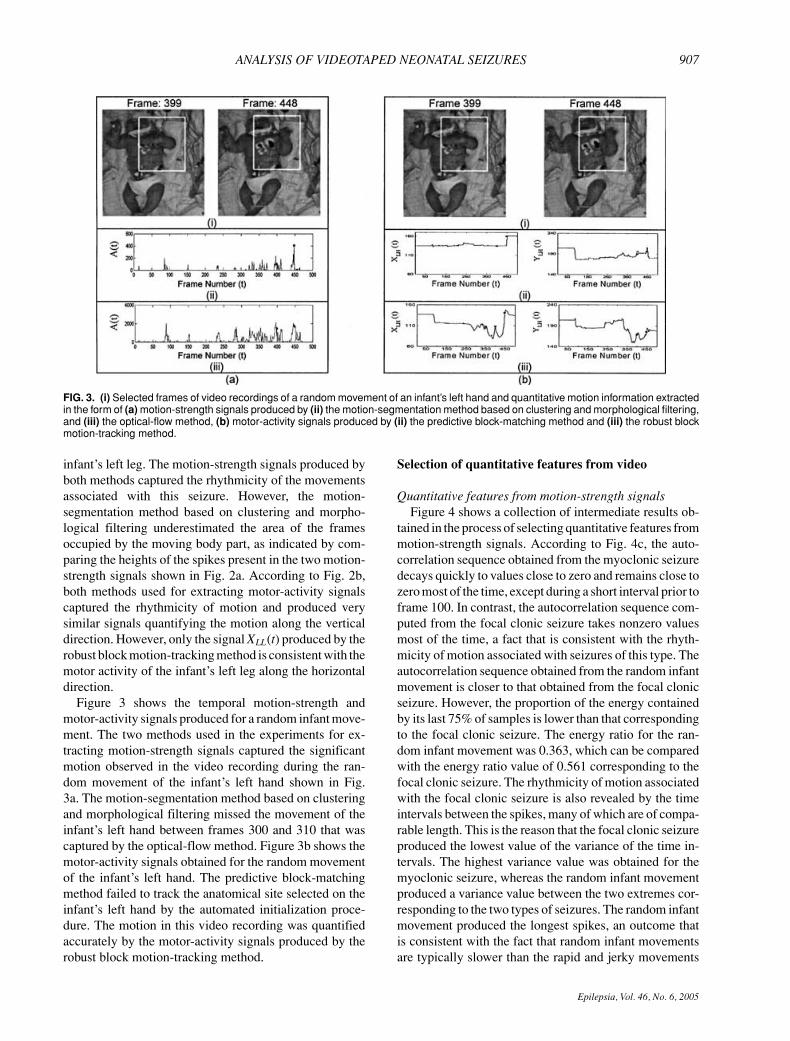
FIG. 3. (i) Selected frames of video recordings of a random movement of an infant’s left hand and quantitative motion information extractedin the form of (a) motion-strength signals produced by (ii) the motion-segmentation method based on clustering and morphological filtering,and (iii) the optical-flow method, (b) motor-activity signals produced by (ii) the predictive block-matching method and (iii) the robust blockmotion-tracking method.
infant’s left leg. The motion-strength signals produced byboth methods captured the rhythmicity of the movementsassociated with this seizure. However, the motion-segmentation method based on clustering and morpho-logical filtering underestimated the area of the framesoccupied by the moving body part, as indicated by com-paring the heights of the spikes present in the two motion-strength signals shown in Fig. 2a. According to Fig. 2b,both methods used for extracting motor-activity signalscaptured the rhythmicity of motion and produced verysimilar signals quantifying the motion along the verticaldirection. However, only the signal XLL(t) produced by therobust block motion-tracking method is consistent with themotor activity of the infant’s left leg along the horizontaldirection.
Figure 3 shows the temporal motion-strength andmotor-activity signals produced for a random infant move-ment. The two methods used in the experiments for ex-tracting motion-strength signals captured the significantmotion observed in the video recording during the ran-dom movement of the infant’s left hand shown in Fig.3a. The motion-segmentation method based on clusteringand morphological filtering missed the movement of theinfant’s left hand between frames 300 and 310 that wascaptured by the optical-flow method. Figure 3b shows themotor-activity signals obtained for the random movementof the infant’s left hand. The predictive block-matchingmethod failed to track the anatomical site selected on theinfant’s left hand by the automated initialization proce-dure. The motion in this video recording was quantifiedaccurately by the motor-activity signals produced by therobust block motion-tracking method.
Selection of quantitative features from video
Quantitative features from motion-strength signalsFigure 4 shows a collection of intermediate results ob-
tained in the process of selecting quantitative features frommotion-strength signals. According to Fig. 4c, the auto-correlation sequence obtained from the myoclonic seizuredecays quickly to values close to zero and remains close tozero most of the time, except during a short interval prior toframe 100. In contrast, the autocorrelation sequence com-puted from the focal clonic seizure takes nonzero valuesmost of the time, a fact that is consistent with the rhyth-micity of motion associated with seizures of this type. Theautocorrelation sequence obtained from the random infantmovement is closer to that obtained from the focal clonicseizure. However, the proportion of the energy containedby its last 75% of samples is lower than that correspondingto the focal clonic seizure. The energy ratio for the ran-dom infant movement was 0.363, which can be comparedwith the energy ratio value of 0.561 corresponding to thefocal clonic seizure. The rhythmicity of motion associatedwith the focal clonic seizure is also revealed by the timeintervals between the spikes, many of which are of compa-rable length. This is the reason that the focal clonic seizureproduced the lowest value of the variance of the time in-tervals. The highest variance value was obtained for themyoclonic seizure, whereas the random infant movementproduced a variance value between the two extremes cor-responding to the two types of seizures. The random infantmovement produced the longest spikes, an outcome thatis consistent with the fact that random infant movementsare typically slower than the rapid and jerky movements
Epilepsia, Vol. 46, No. 6, 2005

908 N. B. KARAYIANNIS ET AL.
FIG. 4. (a) Selected frame from the video recordings of a myoclonic seizure (MCS), focal clonic seizure (FCS), and random infantmovement (RIM); (b) the motion-strength signals A(t) extracted from the video recordings by the optical-flow method; (c) the autocorrelationsequences computed from the motion-strength signals, and (d) the motion-strength signals together with the time intervals between thespikes. Variance of time intervals: 150 (MCS), 12.2 (FCS), 38.1 (RIM); energy ratio: 0.216 (MCS), 0.561 (FCS), 0.363 (RIM); maximalspike duration: 23 (MCS), 15 (FCS), 29 (RIM); and number of spikes per 50 frames: 0.6 (MCS), 1.5 (FCS), 1.1 (RIM)
associated with neonatal seizures. The focal clonic seizureproduced the largest number of spikes, whereas the sec-ond largest number of spikes was obtained for the randominfant movement. This is consistent with the fact that fo-cal clonic seizures are events of considerable duration,whereas myoclonic seizures are manifested as an isolatedmovement or as a short sequence of movements.
Table 1 shows the Fisher ratio (FR) for the three fea-tures selected from motion-strength signals produced by
the motion-segmentation method based on clustering andmorphological filtering for the video recordings of 80cases of myoclonic seizures, 80 cases of focal clonicseizures, and 80 cases of random infant movements. TheFR is a statistical measure of class separability; increasingvalues of the FR computed for two classes reveal improv-ing class separability (39). The FR was computed for threepairs of the classes myoclonic seizure, focal clonic seizure,and random infant movement. Table 1 also shows the
Epilepsia, Vol. 46, No. 6, 2005

ANALYSIS OF VIDEOTAPED NEONATAL SEIZURES 909
TABLE 1. Fisher ratio and generalized Fisher ratio computed for three features selected from motion-strength signals
Variance of time Maximal spikeClass separability measure Classes intervals Energy ratio duration
Fisher ratio Focal clonic seizure/myoclonic seizure 0.806 0.435 0.008Fisher ratio Myoclonic seizure/random movement 0.449 0.410 0.294Fisher ratio Focal clonic/random movement 0.029 0.008 0.183Generalized Fisher ratio All three classes 0.071 0.047 0.027
The motion-strength signals were extracted from video recordings of 80 myoclonic seizures, 80 focal clonic seizures, and 80 random infantmovements by the motion segmentation method based on clustering and morphological filtering.
generalized Fisher ratio (GFR) for the same features,which was computed according to the formula suggestedfor multiple classes by Krishnan and Rao (39). The samemeasures are shown in Table 2 for the features selectedfrom motion-strength signals produced by the optical-flowmethod. Comparison of Tables 1 and 2 reveals the supe-riority of the features selected from the motion-strengthsignals produced by the optical-flow method. Accordingto Table 2, the features selected from motion-strength sig-nals produced by the optical-flow method can be ratedin terms of class separability as follows: variance oftime intervals (highest GFR value), energy ratio, andmaximum spike duration (lowest GFR value). Finally,Table 2 indicates that the most challenging problem isto distinguish random movements from either myoclonicor focal clonic seizures. These conclusions are consistentwith Fig. 5, which shows a scatterplot of the energy ratioand the variance of time intervals obtained for motion-strength signals extracted by the two methods tested inthe experiments from the video recordings of 40 casesof myoclonic seizures, 40 cases of focal clonic seizures,and 40 cases of random infant movements. According toFig. 5a, the motion-segmentation method based on clus-tering and morphological filtering placed a relatively largenumber of random movements in the region occupied bymyoclonic seizures. Even more cases of random move-ments were placed by this method in the region occupiedby focal clonic seizures. According to Fig. 5b, most of themyoclonic seizures produced high values of the varianceof time intervals. Figure 5b also explains why differen-tiating random infant movements from either myoclonicseizures or focal clonic seizures is by far a more chal-lenging problem than distinguishing myoclonic from focalclonic seizures.
TABLE 2. Fisher ratio and generalized Fisher ratio computed for three features selected from motion-strength signals
Variance of time Maximal spikeClass separability measure Classes intervals Energy ratio duration
Fisher ratio Focal clonic seizure/myoclonic seizure 8.711 7.459 0.101Fisher ratio Myoclonic seizure/random movement 3.600 1.812 0.844Fisher ratio Focal clonic/random movement 0.139 1.521 0.012Generalized Fisher ratio All three classes 0.692 0.554 0.053
The motion-strength signals were extracted from video recordings of 80 myoclonic seizures, 80 focal clonic seizures, and 80 random infantmovements by the optical-flow method.
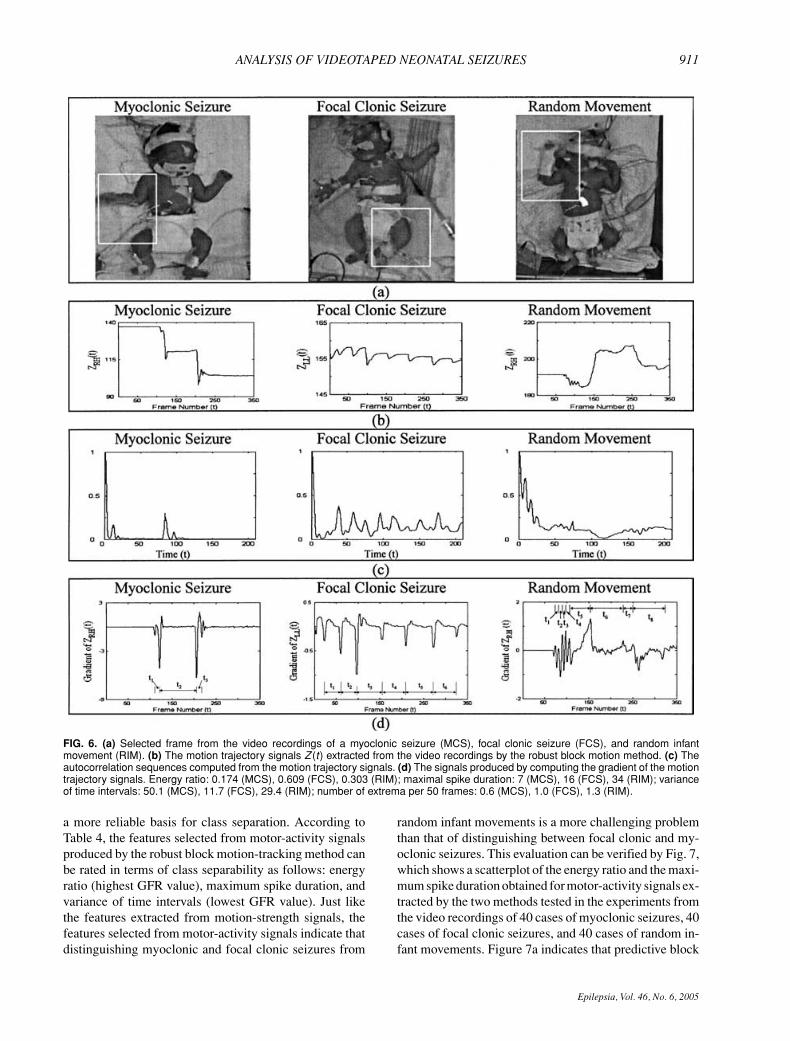
Quantitative features from motor-activity signalsFigure 6 shows a collection of intermediate results ob-
tained in the process of selecting quantitative featuresfrom motion trajectory signals. According to Fig. 6c,the autocorrelation sequence computed for the myoclonicseizure decays very fast and takes values close to zerofor large time intervals. This is consistent with the rapidand jerky movements that are the signature of myoclonicseizures. In contrast, the sustained rhythmic movementsthat characterize focal clonic seizures produce autocor-relation sequences that do not decay to zero, such asthat shown for the focal clonic seizure in Fig. 6c. Ran-dom infant movements can produce a great variety of au-tocorrelation sequences that typically constitute a com-promise between myoclonic and focal clonic seizures interms of their decay patterns. The rapid movements as-sociated with neonatal seizures produce spikes of shortduration, as indicated by the gradient of the motion tra-jectory signals shown in Fig. 6d for the myoclonic andfocal clonic seizures. Figure 6d also describes a situa-tion in which the random infant movement produced asequence of short spikes followed by spikes of longer du-ration. In this case, the maximum spike duration associ-ated with the random infant movement was longer thanthose corresponding to the myoclonic and focal clonicseizures. The sustained rhythmic movements associatedwith focal clonic seizures correspond to time intervals be-tween the extrema that are almost equal in length. Thisis the reason focal clonic seizures lead to small values ofthe interval variance compared with myoclonic seizuresand random infant movements. Such clinical events pro-duce relatively large values of the interval variance be-cause they correspond to irregular time intervals betweenthe extrema, as indicated by Fig. 6d. The number of
Epilepsia, Vol. 46, No. 6, 2005

910 N. B. KARAYIANNIS ET AL.
FIG. 5. Scatterplot of the energy ratio andthe variance of time intervals obtainedfor motion-strength signals extracted fromvideo recordings of myoclonic seizures,focal clonic seizures, and random infantmovements by (a) the motion-segmentationmethod based on clustering and morpholog-ical filtering, and (b) the optical-flow method.
extrema was low for myoclonic seizures, which are typi-cally associated with a few isolated movements, and ran-dom infant movements. Figure 6d shows a situation inwhich the random infant movement produced a highernumber of extrema per time unit compared with both themyoclonic seizure and the focal clonic seizure. This is anindication that this particular quantitative feature may notalways be reliable.
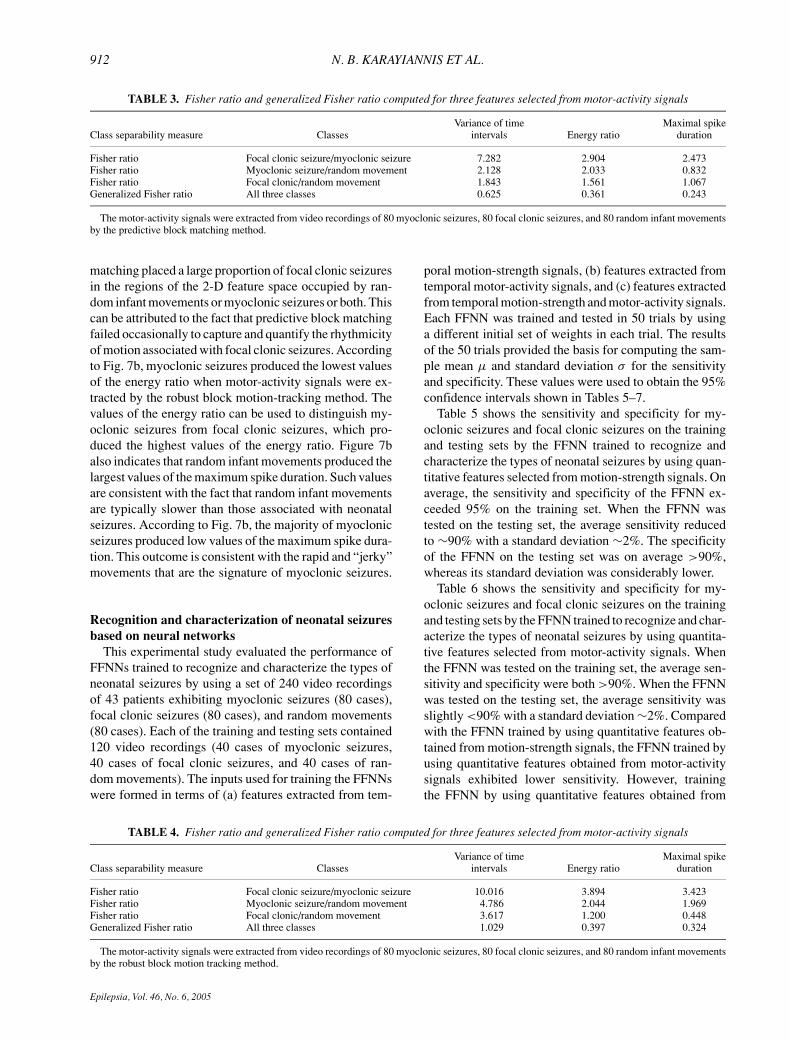
Tables 3 and 4 show the FR and the GFR for the threefeatures selected from motor-activity signals producedby the predictive block-matching method and the robustblock motion-tracking method, respectively, for the videorecordings of 80 cases of myoclonic seizures, 80 casesof focal clonic seizures, and 80 cases of random infantmovements. Tables 3 and 4 indicate that the robust blockmotion-tracking method produced features that provide
Epilepsia, Vol. 46, No. 6, 2005
ANALYSIS OF VIDEOTAPED NEONATAL SEIZURES 911
FIG. 6. (a) Selected frame from the video recordings of a myoclonic seizure (MCS), focal clonic seizure (FCS), and random infantmovement (RIM). (b) The motion trajectory signals Z (t) extracted from the video recordings by the robust block motion method. (c) Theautocorrelation sequences computed from the motion trajectory signals. (d) The signals produced by computing the gradient of the motiontrajectory signals. Energy ratio: 0.174 (MCS), 0.609 (FCS), 0.303 (RIM); maximal spike duration: 7 (MCS), 16 (FCS), 34 (RIM); varianceof time intervals: 50.1 (MCS), 11.7 (FCS), 29.4 (RIM); number of extrema per 50 frames: 0.6 (MCS), 1.0 (FCS), 1.3 (RIM).
a more reliable basis for class separation. According toTable 4, the features selected from motor-activity signalsproduced by the robust block motion-tracking method canbe rated in terms of class separability as follows: energyratio (highest GFR value), maximum spike duration, andvariance of time intervals (lowest GFR value). Just likethe features extracted from motion-strength signals, thefeatures selected from motor-activity signals indicate thatdistinguishing myoclonic and focal clonic seizures from
random infant movements is a more challenging problemthan that of distinguishing between focal clonic and my-oclonic seizures. This evaluation can be verified by Fig. 7,which shows a scatterplot of the energy ratio and the maxi-mum spike duration obtained for motor-activity signals ex-tracted by the two methods tested in the experiments fromthe video recordings of 40 cases of myoclonic seizures, 40cases of focal clonic seizures, and 40 cases of random in-fant movements. Figure 7a indicates that predictive block
Epilepsia, Vol. 46, No. 6, 2005
912 N. B. KARAYIANNIS ET AL.
TABLE 3. Fisher ratio and generalized Fisher ratio computed for three features selected from motor-activity signals
Variance of time Maximal spikeClass separability measure Classes intervals Energy ratio duration
Fisher ratio Focal clonic seizure/myoclonic seizure 7.282 2.904 2.473Fisher ratio Myoclonic seizure/random movement 2.128 2.033 0.832Fisher ratio Focal clonic/random movement 1.843 1.561 1.067Generalized Fisher ratio All three classes 0.625 0.361 0.243
The motor-activity signals were extracted from video recordings of 80 myoclonic seizures, 80 focal clonic seizures, and 80 random infant movementsby the predictive block matching method.
matching placed a large proportion of focal clonic seizuresin the regions of the 2-D feature space occupied by ran-dom infant movements or myoclonic seizures or both. Thiscan be attributed to the fact that predictive block matchingfailed occasionally to capture and quantify the rhythmicityof motion associated with focal clonic seizures. Accordingto Fig. 7b, myoclonic seizures produced the lowest valuesof the energy ratio when motor-activity signals were ex-tracted by the robust block motion-tracking method. Thevalues of the energy ratio can be used to distinguish my-oclonic seizures from focal clonic seizures, which pro-duced the highest values of the energy ratio. Figure 7balso indicates that random infant movements produced thelargest values of the maximum spike duration. Such valuesare consistent with the fact that random infant movementsare typically slower than those associated with neonatalseizures. According to Fig. 7b, the majority of myoclonicseizures produced low values of the maximum spike dura-tion. This outcome is consistent with the rapid and “jerky”movements that are the signature of myoclonic seizures.
Recognition and characterization of neonatal seizuresbased on neural networks
This experimental study evaluated the performance ofFFNNs trained to recognize and characterize the types ofneonatal seizures by using a set of 240 video recordingsof 43 patients exhibiting myoclonic seizures (80 cases),focal clonic seizures (80 cases), and random movements(80 cases). Each of the training and testing sets contained120 video recordings (40 cases of myoclonic seizures,40 cases of focal clonic seizures, and 40 cases of ran-dom movements). The inputs used for training the FFNNswere formed in terms of (a) features extracted from tem-
TABLE 4. Fisher ratio and generalized Fisher ratio computed for three features selected from motor-activity signals
Variance of time Maximal spikeClass separability measure Classes intervals Energy ratio duration
Fisher ratio Focal clonic seizure/myoclonic seizure 10.016 3.894 3.423Fisher ratio Myoclonic seizure/random movement 4.786 2.044 1.969Fisher ratio Focal clonic/random movement 3.617 1.200 0.448Generalized Fisher ratio All three classes 1.029 0.397 0.324
The motor-activity signals were extracted from video recordings of 80 myoclonic seizures, 80 focal clonic seizures, and 80 random infant movementsby the robust block motion tracking method.
poral motion-strength signals, (b) features extracted fromtemporal motor-activity signals, and (c) features extractedfrom temporal motion-strength and motor-activity signals.Each FFNN was trained and tested in 50 trials by usinga different initial set of weights in each trial. The resultsof the 50 trials provided the basis for computing the sam-ple mean µ and standard deviation σ for the sensitivityand specificity. These values were used to obtain the 95%confidence intervals shown in Tables 5–7.
Table 5 shows the sensitivity and specificity for my-oclonic seizures and focal clonic seizures on the trainingand testing sets by the FFNN trained to recognize andcharacterize the types of neonatal seizures by using quan-titative features selected from motion-strength signals. Onaverage, the sensitivity and specificity of the FFNN ex-ceeded 95% on the training set. When the FFNN wastested on the testing set, the average sensitivity reducedto ∼90% with a standard deviation ∼2%. The specificityof the FFNN on the testing set was on average >90%,whereas its standard deviation was considerably lower.
Table 6 shows the sensitivity and specificity for my-oclonic seizures and focal clonic seizures on the trainingand testing sets by the FFNN trained to recognize and char-acterize the types of neonatal seizures by using quantita-tive features selected from motor-activity signals. Whenthe FFNN was tested on the training set, the average sen-sitivity and specificity were both >90%. When the FFNNwas tested on the testing set, the average sensitivity wasslightly <90% with a standard deviation ∼2%. Comparedwith the FFNN trained by using quantitative features ob-tained from motion-strength signals, the FFNN trained byusing quantitative features obtained from motor-activitysignals exhibited lower sensitivity. However, trainingthe FFNN by using quantitative features obtained from
Epilepsia, Vol. 46, No. 6, 2005

ANALYSIS OF VIDEOTAPED NEONATAL SEIZURES 913
FIG. 7. Scatterplot of the energy ratio andthe maximum spike duration obtained formotor-activity signals extracted from videorecordings of myoclonic seizures, focal clonicseizures, and random infant movements by(a) the predictive block-matching method and(b) the robust block motion-tracking method.
motor-activity signals led to specificity values >90%.The sensitivity for myoclonic seizures was higher thanthat of the FFNN trained by using quantitative featuresobtained from motion-strength signals.
Table 7 shows the sensitivity and specificity for my-oclonic seizures and focal clonic seizures on the trainingand testing sets by the FFNN trained to recognize andcharacterize the types of neonatal seizures by using quan-
titative features selected from motion-strength and motor-activity signals. Training the FFNN by using quantitativefeatures obtained from both motion-strength and motor-activity signals led to sensitivity and specificity values>95% on the training set. This training strategy also in-creased the average sensitivity values obtained on the test-ing set, with the sensitivity for myoclonic seizures reach-ing values well above 90% and specificity values >95%.
Epilepsia, Vol. 46, No. 6, 2005

914 N. B. KARAYIANNIS ET AL.
TABLE 5. Recognition and characterization of neonatal seizures based on three features extracted from motion-strength signals(variance of time intervals, energy ratio, and maximum spike duration)
Training set Testing set
Sensitivity (%) Specificity (%) Sensitivity (%) Specificity (%)
Myoclonic seizure 94.6 ± 1.9 99.1 ± 2.2 92.5 ± 1.7 92.5 ± 0.8Focal clonic seizure 92.5 ± 1.2 96.8 ± 1.7 89.4 ± 2.4 96.3 ± 0.4
Sensitivity and specificity (95% confidence intervals) produced for the training and testing sets by a feed-forward neural networks trained torecognize myoclonic seizures, focal clonic seizures, and random infant movements.
Compared with the FFNNs trained by using quantitativefeatures obtained from either motion-strength or motor-activity signals, the FFNN trained in these experiments ex-hibited a lower sensitivity for focal clonic seizures (∼85%)but higher sensitivity for myoclonic seizures (∼95%). Thespecificity values shown in Table 7 for the testing set arehigher than those of the FFNNs trained by using quan-titative features obtained from either motion-strength ormotor-activity signals.
DISCUSSION
In the study outlined here, we developed and evaluateda variety of computational tools and procedures that maybe used to carry out the essential tasks involved in thedevelopment of a computerized video system for moni-toring infants at risk for seizures; these tasks include theextraction of quantitative motion information from videorecordings of neonatal seizures in the form of motion-strength and motor-activity signals, the selection of quan-titative features that convey some unique behavioralcharacteristics of neonatal seizures, and the training ofneural networks to recognize and characterize the types ofneonatal seizures. These three tasks were carried out byrelying on short video segments containing either neonatalseizures or random infant movements not associated withseizures. The computational tools and procedures devel-oped to carry out each of the three tasks were tested andevaluated separately by using as a sole criterion the ob-jective of each task. To achieve the long-term goals ofthis project, we plan to upgrade the procedures developedduring the ongoing project by automating their operation,enhancing their accuracy, and improving their robustnessand reliability. The upgraded computational tools and pro-
TABLE 6. Recognition and characterization of neonatal seizures based on three features extracted from motor-activity signals(energy ratio, maximum spike duration, and variance of time intervals)
Training set Testing set
Sensitivity (%) Specificity (%) Sensitivity (%) Specificity (%)
Myoclonic seizure 90.6 ± 2.5 98.4 ± 1.1 89.2 ± 4.9 95.7 ± 2.5Focal clonic seizure 95.4 ± 3.6 94.0 ± 2.1 88.7 ± 3.9 93.5 ± 2.2
Extracted from motor-activity signals (energy ratio, maximal spike duration, and variance of time intervals). Sensitivity and specificity (95%confidence intervals) produced for the training and testing sets by an FFNN trained to recognize myoclonic seizures, focal clonic seizures, and randominfant movements.
cedures will be used to enhance the diagnostic value ofvideo recordings of infants monitored for seizures. Thiswill be accomplished by developing automated quantifica-tion procedures and visualization tools designed to assistphysicians during retrospective review. The same compu-tational tools and procedures will be integrated to developan automated system trained to recognize and characterizethe types of neonatal seizures in long recordings that maycontain neonatal seizures. The remainder of this sectiondiscusses some open problems revealed by our experimen-tal study and outlines some of our future research plans.
Extraction of quantitative motion informationfrom video
The signals produced by the optical-flow method con-tain spikes that are wider than those produced for thesame movements by the motion-segmentation methodbased on clustering and morphological filtering. Thisis an indication that the motion-segmentation methodbased on clustering and morphological filtering underes-timated the duration of most of the infants’ movementsbecause it missed the beginnings and the ends of thosemovements. This experimental study indicated that themotion-strength signals produced by the best regular-ized optical-flow methods captured and quantified thedefining characteristics of focal clonic and myoclonicseizures.
The experiments indicated that predictive block match-ing failed on some occasions to track the anatomical siteselected on the moving body part throughout the framesequence. Tracking motion based on block motion mod-els appeared to be a more reliable approach. Block motionestimation improved considerably from the introductionof fractional block-motion models, which outperformed
Epilepsia, Vol. 46, No. 6, 2005

ANALYSIS OF VIDEOTAPED NEONATAL SEIZURES 915
TABLE 7. Recognition and characterization of neonatal seizures. Based on three features extracted from motion-strength signals(variance of time intervals, energy ratio, and maximum spike duration) and three features extracted from motor-activity signals
(energy ratio, maximal spike duration, and variance of time intervals)
Training set Testing set
Sensitivity (%) Specificity (%) Sensitivity (%) Specificity (%)
Myoclonic seizure 100.0 ± 0.0 100.0 ± 0.0 94.4 ± 2.0 96.1 ± 0.8Focal clonic seizure 95.0 ± 1.0 98.4 ± 1.2 85.5 ± 1.3 97.9 ± 1.2
Sensitivity and specificity (95% confidence intervals) produced for the training and testing sets by a feed-forward neural network with three outputunits trained to recognize and characterize neonatal seizures.
considerably a pure translation model and an affine block-motion model. The experimental results verified that therobust motion trackers developed in this study are resistantto noise and other recording imperfections.
Selection of quantitative features from videoThe Fisher ratio measure used in this experimental study
provided the basis for evaluating the quantitative featuresobtained from motion-strength and motor-activity signalsusing as a criterion the class separability. This evalua-tion is of critical importance given the long-tem goalsof this project. The outcome of these experiments ver-ified that optical-flow methods are more reliable thanthe method based on clustering and morphological filter-ing for quantifying neonatal seizures from video record-ings in the form of motion-strength signals. Even whenthe motion-segmentation method based on clustering andmorphological filtering managed to quantify motion, theoptical-flow method produced motion-strength signalsthat constitute a more accurate representation of the in-fants’ movements. The experimental results also verifiedthat the robust motion trackers developed in this studyoutperformed considerably the motion trackers based onpredictive block matching in terms of both reliability andaccuracy.
The quantitative features selected from motion-strengthand motor-activity signals constitute a satisfactory repre-sentation of neonatal seizures and random infant move-ments. Nevertheless, the set of quantitative featuresextracted in this study is not unique. Other features mayexist whose combination provides a more effective rep-resentation of neonatal seizures and random infant move-ments. Thus the search for the best quantitative featuresfrom motion-strength and motor-activity signals is still anopen problem worthy of further investigation.
Recognition and characterization of neonatal seizuresbased on neural networks
The outcome of this experimental study provides ev-idence suggesting that it is feasible to develop an au-tomated system for the recognition and characterizationof the types of neonatal seizures based on video record-ings. This will be accomplished by enhancing the accu-racy and improving the reliability of the computational
tools and methods developed during the course of the on-going study. In the next phase of this project, we planto evaluate the available computational tools and proce-dures when they become the ingredients of the proposedseizure-recognition system. This evaluation will be carriedout at three levels:
Level 1Can the system recognize most of the true seizures while
minimizing the proportion of true seizures classified asnonseizure behaviors? This measures sensitivity, the goalof the next phase of this project being ≥90%.
Level 2Can the system recognize most of the nonseizure infant
behaviors while minimizing the proportion of nonseizureinfant behaviors classified as seizures? This measuresspecificity, the goal of the next phase of this project being≥95%.
Level 3Can the system assign a degree of certainty to seizure
classification that is consistent with the evaluation of hu-man experts? This assessment will investigate whether theresponse of the trained neural networks provides a reliablebasis for identifying and quantifying uncertainty.
The ongoing study revealed that the performance ofneural network models trained to perform seizure recog-nition and characterization is affected mainly by the ex-istence of uncertain events. One source of uncertainty isthe lack of contextual information. In the case of electro-clinical seizures, the physicians who classified the videosegments of the CRCNS database were able to observesimultaneous EEG recordings over multiple channels.These EEG recordings provided the physicians with nu-merous hints and clues that were critical for seizure recog-nition. However, such contextual information is not readilyavailable to a classifier trained by examples to recognizeneonatal seizures from video recordings.
Seizure recognition and characterization was performedduring the ongoing study by training conventional FFNNs(36,37). However, despite their advantages, FFNNs arenot capable of effectively dealing with the uncertaintytypically involved in pattern-classification tasks. The in-ability of FFNNs to deal effectively with uncertainty
Epilepsia, Vol. 46, No. 6, 2005

916 N. B. KARAYIANNIS ET AL.
motivated the development of a class of inherently fuzzyneural networks known as quantum neural networks(QNNs) (40,41). QNNs use multilevel hidden units thatproduce a better structured representation of the inputspace by identifying overlapping between different classesof data. As a result, QNNs can identify and quantify the un-certainty typically associated with pattern-classificationtasks. The superior performance of QNNs in the presenceof uncertainty was revealed by a recent study that reliedon FFNNs and QNNs to improve the detection of epilepticsegments from neonatal EEG (42,43).
Combination of video with EEG analysisOne of our future goals is to enhance the overall ac-
curacy and improve the reliability of automated seizurerecognition by merging the video-analysis proceduresand tools developed in this project with complementarytechniques and procedures developed to analyze neonatalEEGs (42–46). Although recognition of seizures in theintensive care environment is still largely dependent onhuman observation, this mode is ineffective in the case oftherapeutically paralyzed or restrained infants and doesnot identify patients experiencing purely EEG events.On the other hand, clinical seizures that have no elec-trographic correlate cannot be detected by EEG analysis.Consequently, an appropriate combination of automatedvideo and EEG analytic approaches would be expected toresult in a significant improvement in the ability to de-tect promptly the occurrence of all seizure types in thispopulation.
Acknowledgment: This work was supported by the NationalInstitute of Biomedical Imaging and Bioengineering under grant1 R01 EB00183, the National Institute of Neurological Disordersand Stroke under contract N01-NS-2316, and the Peter KellawayResearch Endowment, Baylor College of Medicine.
REFERENCES
1. Eriksson M, Zetterstrom R. Neonatal convulsions: incidence andcauses in the Stockholm area. Acta Paediatri Scand 1979;68:807–11.
2. Holden KR, Mellitis ED, Freeman JM. Neonatal seizures, I: cor-relation of prenatal and perinatal events with outcomes. Pediatrics1982;70:165–76.
3. Bergman I, Painter MJ, Hirsch RP, et al. Outcome in neonateswith convulsions treated in an intensive care unit. Ann Neurol1983;14:642–7.
4. Ellenberg JH, Hirtz DG, Nelson KB. Age at onset of seizures inyoung children. Ann Neurol 1984;15:127–34.
5. Spellacy WN, Peterson PQ, Winegar A, et al. Neonatal seizuresafter cesarean delivery: higher risk with labor. Am J Obstet Gynecol1987;157:377–9.
6. Lanska MJ, Lanska DJ, Baumann RJ, et al. A population-basedstudy of neonatal seizures in Fayette County, Kentucky. Neurology1995;45:724–32.
7. Ronen GM, Penney S. The epidemiology of clinical neonatalseizures in Newfoundland, Canada: a five-year cohort. Ann Neu-rol 1995;38:518–9.
8. Saliba R, Annegers JF, Mizrahi EM. The incidence of neona-tal seizures, Harris County, Texas; 1992-1994. Am J Epidemiol1999;150:763–9.
9. Fenichel GM. Neonatal neurology. 3rd ed. New York: Churchill-Livingstone, 1990.
10. Volpe JJ. Neurology of the newborn. Philadelphia: WB Saunders,1995.
11. Mizrahi EM. Neonatal seizures. In: Shinnar S, Amir N, Branski D,eds. Childhood seizures: pediatric and adolescent medicine. Basel:Krager, 1995;6:18–31.
12. Mellitis ED, Holden KR, Freeman JM. Neonatal seizures, II: amultivariate analysis of factors associated with outcome. Pediatrics1982;70:177–85.
13. Clancy RR, Legido A. Postnatal epilepsy after EEG-confirmedneonatal seizures. Epilepsia 1991;32:69–76.
14. Scher MS, Aso K, Beggarly M, et al. Electrographic seizures inpreterm and full-term neonates: clinical correlates, associated brainlesions, and risk for neurologic sequelae. Pediatrics 1993;91:128–34.
15. Ortibus EL, Sum JM, Hahn JS. Predictive value of EEG for outcomeand epilepsy following neonatal seizures. Electroencephalogr ClinNeurophysiol 1996;98:175–85.
16. Bye AME, Cunningham CA, Chee KY, et al. Outcome of neonateswith electrographically identified seizures, or at risk of seizures.Pediatr Neurol 1997;16:225–31.
17. Mizrahi EM. Acute and chronic effects of seizures in the develop-ing brain: lessons from clinical experience. Epilepsia 1999;40(suppl1):S42–50.
18. Mizrahi EM, Kellaway P. Characterization of seizures inneonates and young infants by time-synchronized electroencephalo-graphic/polygraphic/video monitoring. Ann Neurol 1984;16:383.
19. Kellaway P, Frost JD Jr. Monitoring at the Baylor College ofMedicine, Houston. In: Gotman J, Ives JR, Gloor P, eds. Long-termmonitoring in epilepsy. Amsterdam: Elsevier Science, 1985:403–14.
20. Mizrahi EM. Neonatal electroencephalography: clinical features ofthe newborn, techniques of recording, and characteristics of the nor-mal EEG. Am J EEG Tech 1986;26:81–103.
21. Wise MS, Mizrahi EM, Hrachovy RA, et al. Seizures in very lowbirthweight (VLBW) infants: seizure characterization using bedsideEEG/video/polygraphic monitoring. Epilepsia 1999;40:161.
22. Mizrahi EM, Kellaway P. Characterization and classification ofneonatal seizures. Neurology 1987;37:1837–44.
23. Karayiannis NB, Srinivasan S, Bhattacharya R, et al. Extraction ofmotion strength and motor activity signals from video recordings ofneonatal seizures. IEEE Trans Med Imaging 2001;20:965–80.
24. Karayiannis NB, Tao G. Improving the extraction of temporal mo-tion strength signals from video recordings of neonatal seizures.Proc 2003 IEEE Conference on Advances in Video Signal-BasedSurveillance. Miami, Florida, 2003:87–92.
25. Karayiannis NB, Varughese B, Tao G, et al. Quantifying motion invideo recordings of neonatal seizures by regularized optical flowmethods. IEEE Trans Image Process (in press).
26. Karayiannis NB, Sami A, Frost JD Jr, et al. Automated extraction oftemporal motor activity signals from video recordings of neonatalseizures based on adaptive block matching. IEEE Trans Biomed Eng2005;52:676–86.
27. Karayiannis NB, Sami A, Frost JD Jr, et al. Quantifying motion invideo recordings of neonatal seizures by feature trackers based onpredictive block matching. Proc 26th International Conference ofIEEE EMBS, San Francisco, 2004:1447–50.
28. Karayiannis NB, Xiong Y, Frost JD Jr, et al. Improving the accu-racy and reliability of motion tracking methods used for extractingtemporal motor activity signals from video recordings of neonatalseizures. IEEE Trans Biomed Eng 2005;52:747–9.
29. Karayiannis NB, Xiong Y, Frost JD Jr, et al. Quantifying motionin video recordings of neonatal seizures by robust feature trackersbased on block motion models. IEEE Trans Biomed Eng (in press).
30. Sami A, Karayiannis NB, Frost JD Jr, et al. Automated tracking ofmultiple body parts in video recordings of neonatal seizures. Proc2004 Int Symp Biomed Imaging, Arlington, Virginia, 2004:312–5.
31. Mizrahi EM, Clancy RR, Dunn JK, et al. Neurologic impairment,developmental delay, and postneonatal seizures 2 years after EEG-video documented seizures in near-term and term neonates: re-port of the clinical research centers for neonatal seizures. Epilepsia2001;42(suppl 7):102–3.
Epilepsia, Vol. 46, No. 6, 2005

ANALYSIS OF VIDEOTAPED NEONATAL SEIZURES 917
32. Horn BKP, Schunck BG. Determining optical flow. Artif Intell1981;17:185–203.
33. Tomasi C, Kanade T. Detection and tracking of point features. Tech-nical Report CMU-CS-91–132. Carnegie Mellon University, 1991.
34. Shi J, Tomasi C. Good features to track. Proc IEEE Conf ComputVision Pattern Recogn Seattle, Washington, 1994:593–600.
35. Tommasini T, Fusiello A, Trucco E, et al. Making good featurestrack better. Proc IEEE Int Conf Comput Vision Pattern Recogn,Santa Barbara, California, 1998:178–83.
36. Bishop CM. Neural networks for pattern recognition. Oxford: Ox-ford University Press, 1995.
37. Haykin S. Neural networks: a comprehensive foundation. UpperSaddle River, NJ: Prentice Hall, 1999.
38. Karayiannis NB. Accelerating the training of feed-forward neu-ral networks using generalized Hebbian rules for initializing theinternal representations. IEEE Trans Neural Netw 1996;7:419–26.
39. Krishnan S, Rao PVS. Feature selection for pattern classificationwith Gaussian mixture models: a new objective criterion. PatternRecogn Lett 1996;17:803–9.
40. Purushothaman G, Karayiannis NB. Quantum neural networks
(QNNs): inherently fuzzy feed-forward neural networks. IEEETrans Neural Netw 1997;8:679–93.
41. Purushothaman G, Karayiannis NB. Feed-forward neural architec-tures for membership estimation and fuzzy classification. Int J SmartEng System Design 1998;1:163–85.
42. Karayiannis NB, Mukherjee A, Glover JR, et al. Quantifying andvisualizing uncertainty in EEG data of neonatal seizures. Proc 26thInt Conf IEEE EMBS, San Francisco, California, 2004:423–26.
43. Karayiannis NB, Mukherjee A, Glover JR, et al. An evaluation ofquantum neural networks in the detection of epileptic seizures in theneonatal EEG. Soft Comput J (in press).
44. Glover JR, Ktonas PY, Shastry M, et al. Methodology and sys-tem architecture for automated detection of epileptic seizures in theneonatal EEG. Proc 24th Int Conf IEEE EMBS, Houston, Texas,2002:70–1.
45. Gotman J, Flanagan D, Zhang J, et al. Automated seizure detectionin the newborn: methods and initial evaluation. ElectroencephalogrClin Neurophysiol 1997;103:356–62.
46. Gotman J, Flanagan D, Rosenblatt B, et al. Evaluation of an auto-mated seizure detection method for the newborn EEG. Electroen-cephalogr Clin Neurophysiol 1997;103:363–9.
Epilepsia, Vol. 46, No. 6, 2005