Postmitotic Specification of Drosophila Insulinergic Neurons from Pioneer Neurons
Upload
st-andrewsCategory
view
2download
0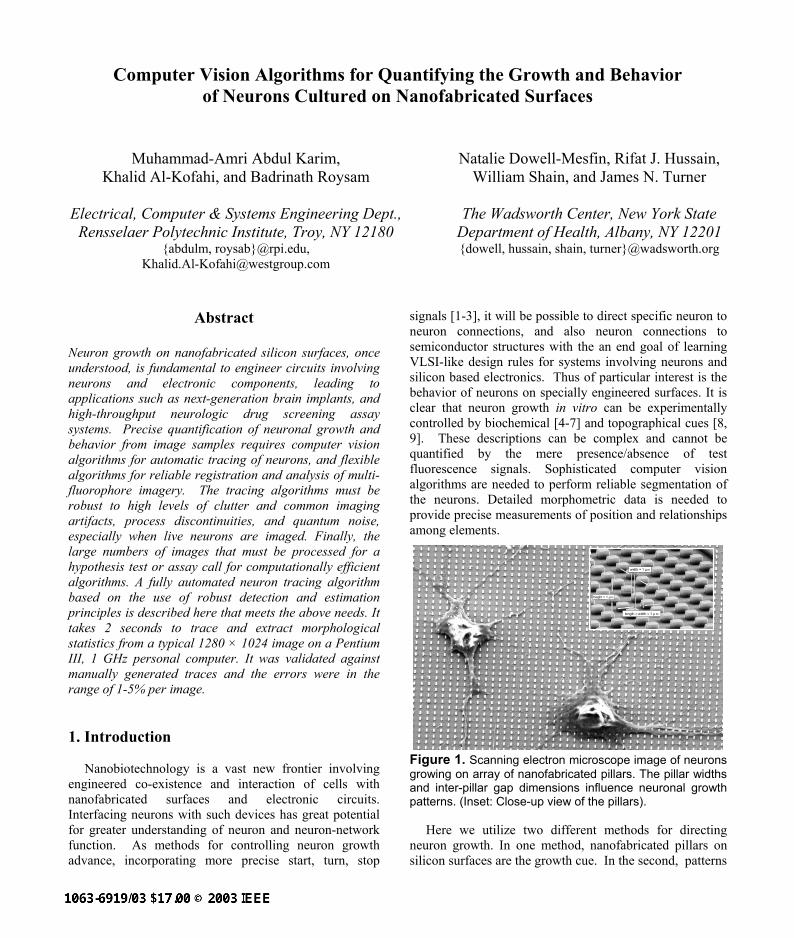
Computer Vision Algorithms for Quantifying the Growth and Behavior of Neurons Cultured on Nanofabricated Surfaces
Muhammad-Amri Abdul Karim, Khalid Al-Kofahi, and Badrinath Roysam
Electrical, Computer & Systems Engineering Dept.,
Rensselaer Polytechnic Institute, Troy, NY 12180 {abdulm, roysab}@rpi.edu,
Natalie Dowell-Mesfin, Rifat J. Hussain, William Shain, and James N. Turner
The Wadsworth Center, New York State
Department of Health, Albany, NY 12201 {dowell, hussain, shain, turner}@wadsworth.org
Abstract Neuron growth on nanofabricated silicon surfaces, once understood, is fundamental to engineer circuits involving neurons and electronic components, leading to applications such as next-generation brain implants, and high-throughput neurologic drug screening assay systems. Precise quantification of neuronal growth and behavior from image samples requires computer vision algorithms for automatic tracing of neurons, and flexible algorithms for reliable registration and analysis of multi-fluorophore imagery. The tracing algorithms must be robust to high levels of clutter and common imaging artifacts, process discontinuities, and quantum noise, especially when live neurons are imaged. Finally, the large numbers of images that must be processed for a hypothesis test or assay call for computationally efficient algorithms. A fully automated neuron tracing algorithm based on the use of robust detection and estimation principles is described here that meets the above needs. It takes 2 seconds to trace and extract morphological statistics from a typical 1280 × 1024 image on a Pentium III, 1 GHz personal computer. It was validated against manually generated traces and the errors were in the range of 1-5% per image. 1. Introduction
Nanobiotechnology is a vast new frontier involving engineered co-existence and interaction of cells with nanofabricated surfaces and electronic circuits. Interfacing neurons with such devices has great potential for greater understanding of neuron and neuron-network function. As methods for controlling neuron growth advance, incorporating more precise start, turn, stop
signals [1-3], it will be possible to direct specific neuron to neuron connections, and also neuron connections to semiconductor structures with the an end goal of learning VLSI-like design rules for systems involving neurons and silicon based electronics. Thus of particular interest is the behavior of neurons on specially engineered surfaces. It is clear that neuron growth in vitro can be experimentally controlled by biochemical [4-7] and topographical cues [8, 9]. These descriptions can be complex and cannot be quantified by the mere presence/absence of test fluorescence signals. Sophisticated computer vision algorithms are needed to perform reliable segmentation of the neurons. Detailed morphometric data is needed to provide precise measurements of position and relationships among elements.
height = 1 µ m
width = 1 µ m
length = width = 1 µ m
Figure 1. Scanning electron microscope image of neurons growing on array of nanofabricated pillars. The pillar widths and inter-pillar gap dimensions influence neuronal growth patterns. (Inset: Close-up view of the pillars).
Here we utilize two different methods for directing neuron growth. In one method, nanofabricated pillars on silicon surfaces are the growth cue. In the second, patterns
Pillar width = 2 µm, inter-pillar gap = 1.5 µm Pillar width = 0.5 µm, inter-pillar gap = 3.0 µm
Pillar width = 2 µm, inter-pillar gap = 4.5 µm Smooth surface
Figure 2. Epifluorescence images of neurons grown on four different nanofabricated surface topologies (1280 × 1024 8-bit/pixel), 14 days in culture. It is qualitatively obvious that the surface topology influences the “degree of directionality” of neurite growth. of biomolecules are printed onto surfaces. The topographical cues were fabricated using standard photolithographic techniques producing surfaces with fields containing different pillar widths and interpillar spacings [10]. These surfaces were uniformly coated with poly-L-lysine and plated with dispersed suspensions of hippocampal neurons [7] (Figure 1). Similar suspensions of neurons were plated onto surfaces fabricated using microcontact printing to produce patterns of poly-L-lysine [4, 11].
These investigations require large amount of samples of neurons grown on different topological surfaces (Figure 2). Consequently, given the large amount of data, the image analysis must avoid both the tedium and
subjectivity of manual or semi-automated, interactive methods. Here, a fully-automated algorithm incorporating robust statistical techniques [12], is utilized to extract neuronal morphometry. The extracted statistics are analyzed to quantitate the growth patterns as a function of surface topology. Also of interest to neuroscience is the growth pattern of specific neuronal parts with distinct inter-neuron communication functionalities, namely the axons and the dendrites, which are referred collectively as neurites in this paper. Separate images of dendrites and axons are acquired by multi-fluorophore labeling techniques. Traced structures of one label are registered with the other, and the extracted statistics then are dendrite- or axon-specific.
2. Challenges to quantitative analysis
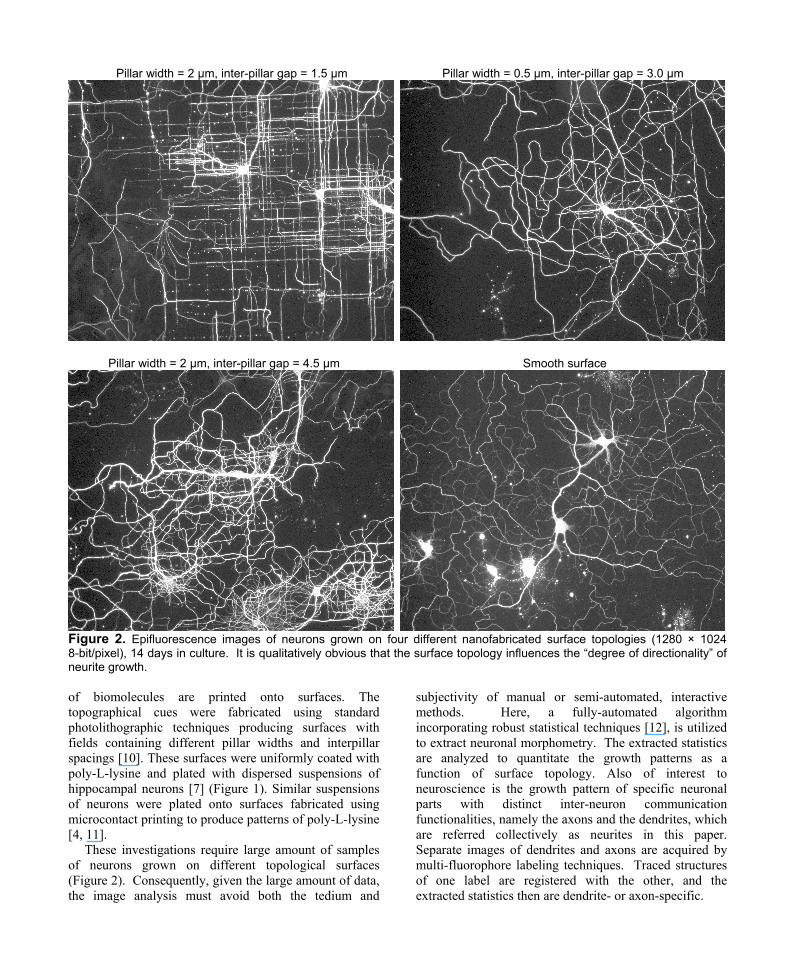
The images of interest are naturally complex, and several types of artifacts are unavoidable. First, the desire to image large regions leads to the use of low-magnification lenses. The desire to minimize photodamage, and/or the natural weakness of common fluorophores leads to noisy images. The desire to test subtle hypotheses requires large numbers of images to be acquired and analyzed in a maximally automated manner. Finally, natural biological variability, and the difficulty of specimen preparation and imaging result in imaging artifacts. Artifacts such as blobs, structural discontinuity, non-uniform dye distribution, and deceitful noise (Figure 3) have to be handled while maintaining rapid execution speed. Another challenge relates to the lack of topological image analysis constraints. The neurons of interest do not behave naturally, like in the in vivo brain. For instance, axons can make synaptic connections with axons. In addition, the presence of multiple tangled and inter-connected neurons without 3-D depth information implies that structural tree-like constraints such the absence of loops cannot be exploited in the image analysis.
Figure 3. Examples of imaging artifacts. (A) Blobs of dye. (B) Neurites with dim and discontinuous appearance. (C) Strip of noise, resembling neurites. 3. Robust neurite tracing algorithm
Tube-like objects such as neurites in a 3-D image are modeled as deformed cylinders. To account for the structural irregularity common in neuron images, the cylinder model is allowed to have non-parallel walls and a non-circular cross sectional area. This model is specialized in 2-D as planes cutting through the cylinder, resulting a pair of almost parallel boundaries. Several geometrical constraints and tolerance are built into the model to avoid detecting uninteresting blobs in images.
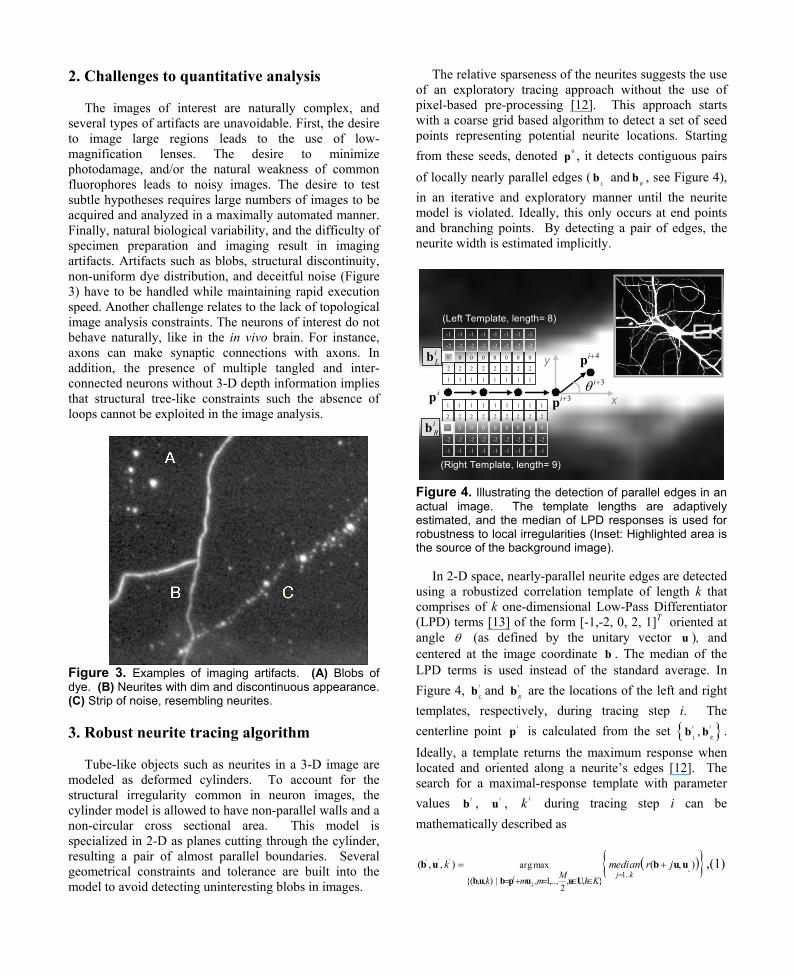
The relative sparseness of the neurites suggests the use of an exploratory tracing approach without the use of pixel-based pre-processing [12]. This approach starts with a coarse grid based algorithm to detect a set of seed points representing potential neurite locations. Starting from these seeds, denoted 0p , it detects contiguous pairs of locally nearly parallel edges (
Lb and
Rb , see Figure 4),
in an iterative and exploratory manner until the neurite model is violated. Ideally, this only occurs at end points and branching points. By detecting a pair of edges, the neurite width is estimated implicitly.
0
-2
-1
2
1
0
-2
-1
2
1
0
-2
-1
2
1
0
-2
-1
2
1
0
-2
-1
2
1
0
-2
-1
2
1
-1
-2
2
1
0
-1
-2
2
1
0
-1
-2
2
1
0
-1
-2
2
1
0
-1
-2
2
1
0
-1
-2
2
1
0
-1
-2
2
1
0
-1
-2
2
1
0
0
-2
-1
2
1
ip
4i+p
3i+p
0
-2
-1
2
1
-1
-2
2
1
0
3iθ +
(Left Template, length= 8)
(Right Template, length= 9)
y
x
iLb
iRb
Figure 4. Illustrating the detection of parallel edges in an actual image. The template lengths are adaptively estimated, and the median of LPD responses is used for robustness to local irregularities (Inset: Highlighted area is the source of the background image).
In 2-D space, nearly-parallel neurite edges are detected using a robustized correlation template of length k that comprises of k one-dimensional Low-Pass Differentiator (LPD) terms [13] of the form [-1,-2, 0, 2, 1]T oriented at angle θ (as defined by the unitary vector u ), and centered at the image coordinate b . The median of the LPD terms is used instead of the standard average. In Figure 4, i
Lb and i
Rb are the locations of the left and right
templates, respectively, during tracing step i. The centerline point ip is calculated from the set { },i i
L Rb b .
Ideally, a template returns the maximum response when located and oriented along a neurite’s edges [12]. The search for a maximal-response template with parameter values ib , iu , ik during tracing step i can be mathematically described as
( ){ }1..
arg max
{( , , ) | , 1,.., , , }2
( , , ) ( , )i i i
i j kMk m m k K
k median r j⊥
⊥=
= + = ∈ ∈
= +bu b p u u U
b u b u u ,(1)
where ( , )r x u is the response of a single 1-D LPD kernel at x , along the direction u . M is the maximum expected neurite width as specified by the user, K is a set of empirically-chosen template lengths, and U is the set of all 2-D directions consisting of unit vectors each at a particular angle θ (as defined by the unitary vector u ). The 2-D direction space is discretized into 32 discrete directions, giving an angular precision of 11.25°. Continuing with centerline tracing, we step from ip to 1i+p
using orientation of detected edges iθ (as defined by iu ), calculated from the set { },i i
L Rb b , and scaled by is (see
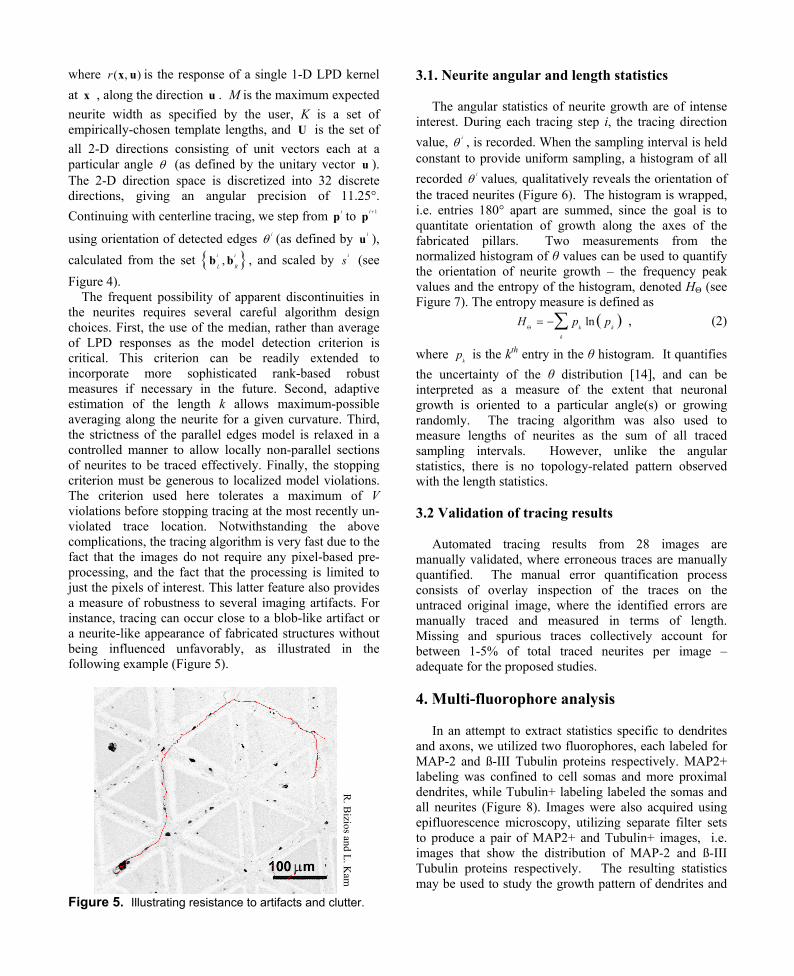
Figure 4). The frequent possibility of apparent discontinuities in the neurites requires several careful algorithm design choices. First, the use of the median, rather than average of LPD responses as the model detection criterion is critical. This criterion can be readily extended to incorporate more sophisticated rank-based robust measures if necessary in the future. Second, adaptive estimation of the length k allows maximum-possible averaging along the neurite for a given curvature. Third, the strictness of the parallel edges model is relaxed in a controlled manner to allow locally non-parallel sections of neurites to be traced effectively. Finally, the stopping criterion must be generous to localized model violations. The criterion used here tolerates a maximum of V violations before stopping tracing at the most recently un-violated trace location. Notwithstanding the above complications, the tracing algorithm is very fast due to the fact that the images do not require any pixel-based pre-processing, and the fact that the processing is limited to just the pixels of interest. This latter feature also provides a measure of robustness to several imaging artifacts. For instance, tracing can occur close to a blob-like artifact or a neurite-like appearance of fabricated structures without being influenced unfavorably, as illustrated in the following example (Figure 5).
R. B
izios and L. Kam
Figure 5. Illustrating resistance to artifacts and clutter.
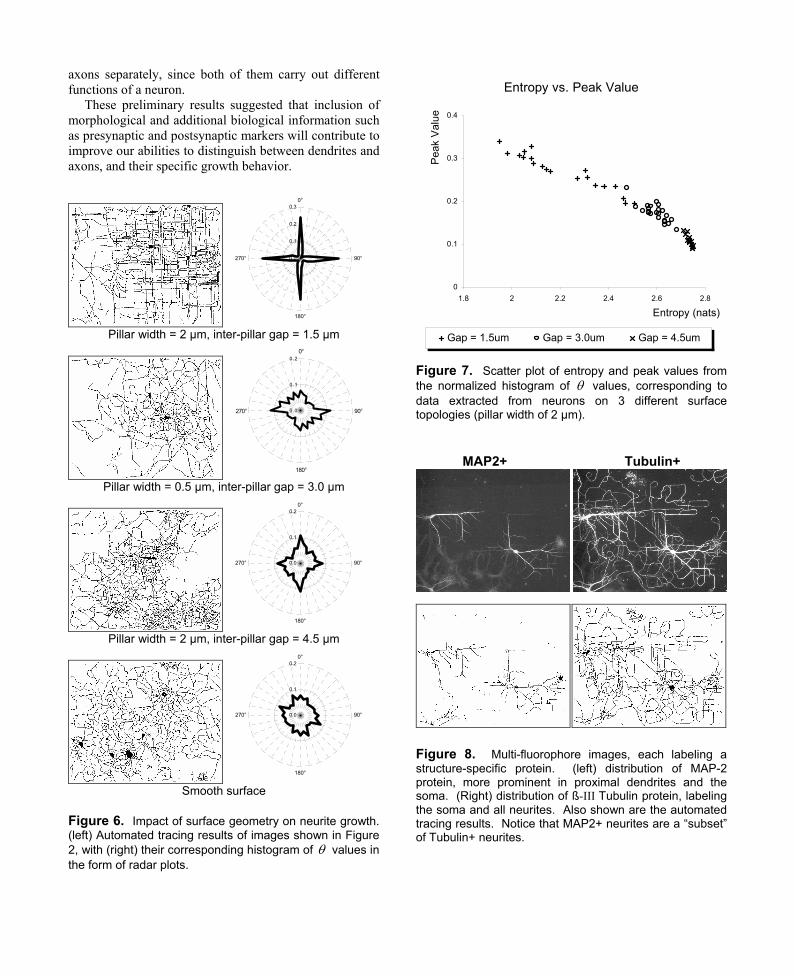
3.1. Neurite angular and length statistics The angular statistics of neurite growth are of intense
interest. During each tracing step i, the tracing direction value, iθ , is recorded. When the sampling interval is held constant to provide uniform sampling, a histogram of all recorded iθ values, qualitatively reveals the orientation of the traced neurites (Figure 6). The histogram is wrapped, i.e. entries 180° apart are summed, since the goal is to quantitate orientation of growth along the axes of the fabricated pillars. Two measurements from the normalized histogram of θ values can be used to quantify the orientation of neurite growth – the frequency peak values and the entropy of the histogram, denoted HΘ (see Figure 7). The entropy measure is defined as
( )lnk k
k
H p pΘ= −∑ , (2)
where k
p is the kth entry in the θ histogram. It quantifies the uncertainty of the θ distribution [14], and can be interpreted as a measure of the extent that neuronal growth is oriented to a particular angle(s) or growing randomly. The tracing algorithm was also used to measure lengths of neurites as the sum of all traced sampling intervals. However, unlike the angular statistics, there is no topology-related pattern observed with the length statistics. 3.2 Validation of tracing results
Automated tracing results from 28 images are manually validated, where erroneous traces are manually quantified. The manual error quantification process consists of overlay inspection of the traces on the untraced original image, where the identified errors are manually traced and measured in terms of length. Missing and spurious traces collectively account for between 1-5% of total traced neurites per image – adequate for the proposed studies. 4. Multi-fluorophore analysis
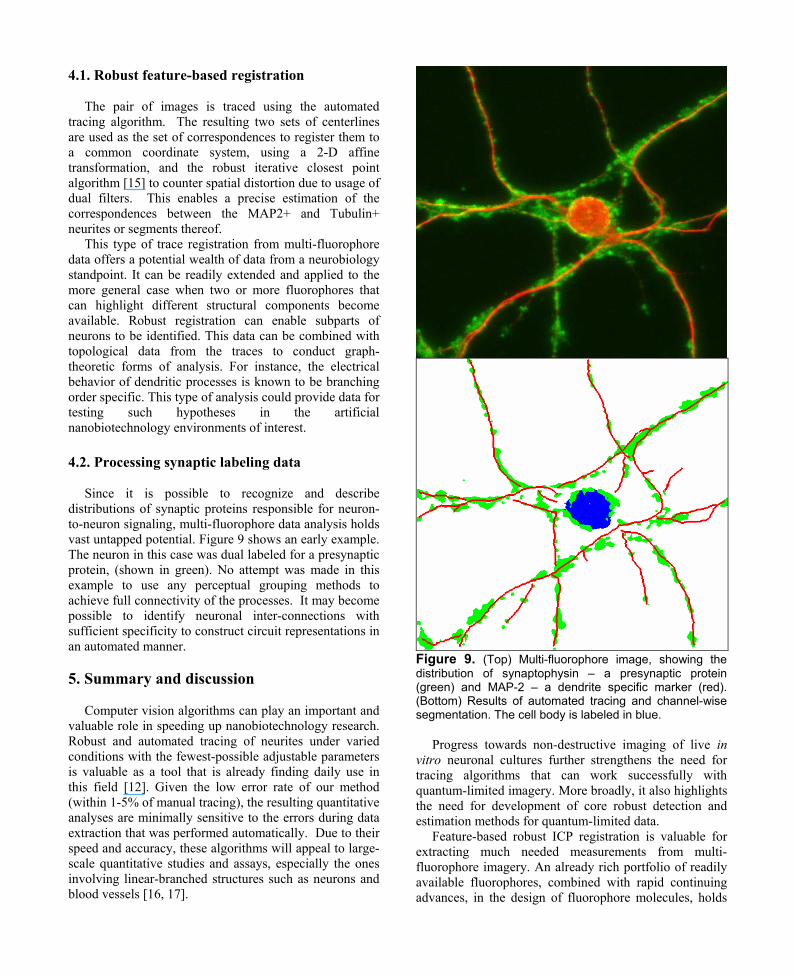
In an attempt to extract statistics specific to dendrites
and axons, we utilized two fluorophores, each labeled for MAP-2 and ß-III Tubulin proteins respectively. MAP2+ labeling was confined to cell somas and more proximal dendrites, while Tubulin+ labeling labeled the somas and all neurites (Figure 8). Images were also acquired using epifluorescence microscopy, utilizing separate filter sets to produce a pair of MAP2+ and Tubulin+ images, i.e. images that show the distribution of MAP-2 and ß-III Tubulin proteins respectively. The resulting statistics may be used to study the growth pattern of dendrites and
axons separately, since both of them carry out different functions of a neuron.
These preliminary results suggested that inclusion of morphological and additional biological information such as presynaptic and postsynaptic markers will contribute to improve our abilities to distinguish between dendrites and axons, and their specific growth behavior.
0.0
0.1
0.2
0.30°
90°
180°
270°
Pillar width = 2 µm, inter-pillar gap = 1.5 µm
0.0
0.1
0.20°
90°
180°
270°
Pillar width = 0.5 µm, inter-pillar gap = 3.0 µm
0.0
0.1
0.20°
90°
180°
270°
Pillar width = 2 µm, inter-pillar gap = 4.5 µm
0.0
0.1
0.20°
90°
180°
270°
Smooth surface
Figure 6. Impact of surface geometry on neurite growth. (left) Automated tracing results of images shown in Figure 2, with (right) their corresponding histogram of θ values in the form of radar plots.
Entropy vs. Peak Value
0
0.1
0.2
0.3
0.4
1.8 2 2.2 2.4 2.6 2.8
Entropy (nats)
Pea
k V
alue
Gap = 1.5um Gap = 3.0um Gap = 4.5um
Figure 7. Scatter plot of entropy and peak values from the normalized histogram of θ values, corresponding to data extracted from neurons on 3 different surface topologies (pillar width of 2 µm).
MAP2+ Tubulin+
Figure 8. Multi-fluorophore images, each labeling a structure-specific protein. (left) distribution of MAP-2 protein, more prominent in proximal dendrites and the soma. (Right) distribution of ß-III Tubulin protein, labeling the soma and all neurites. Also shown are the automated tracing results. Notice that MAP2+ neurites are a “subset” of Tubulin+ neurites.
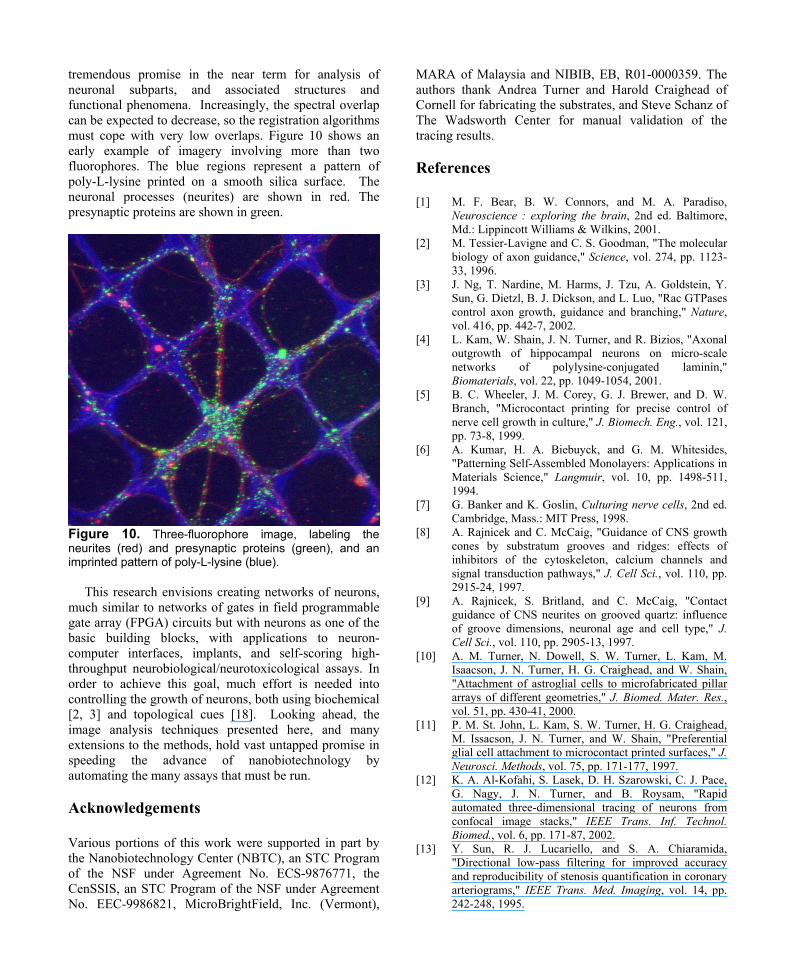
4.1. Robust feature-based registration
The pair of images is traced using the automated tracing algorithm. The resulting two sets of centerlines are used as the set of correspondences to register them to a common coordinate system, using a 2-D affine transformation, and the robust iterative closest point algorithm [15] to counter spatial distortion due to usage of dual filters. This enables a precise estimation of the correspondences between the MAP2+ and Tubulin+ neurites or segments thereof.
This type of trace registration from multi-fluorophore data offers a potential wealth of data from a neurobiology standpoint. It can be readily extended and applied to the more general case when two or more fluorophores that can highlight different structural components become available. Robust registration can enable subparts of neurons to be identified. This data can be combined with topological data from the traces to conduct graph-theoretic forms of analysis. For instance, the electrical behavior of dendritic processes is known to be branching order specific. This type of analysis could provide data for testing such hypotheses in the artificial nanobiotechnology environments of interest. 4.2. Processing synaptic labeling data
Since it is possible to recognize and describe distributions of synaptic proteins responsible for neuron-to-neuron signaling, multi-fluorophore data analysis holds vast untapped potential. Figure 9 shows an early example. The neuron in this case was dual labeled for a presynaptic protein, (shown in green). No attempt was made in this example to use any perceptual grouping methods to achieve full connectivity of the processes. It may become possible to identify neuronal inter-connections with sufficient specificity to construct circuit representations in an automated manner. 5. Summary and discussion
Computer vision algorithms can play an important and
valuable role in speeding up nanobiotechnology research. Robust and automated tracing of neurites under varied conditions with the fewest-possible adjustable parameters is valuable as a tool that is already finding daily use in this field [12]. Given the low error rate of our method (within 1-5% of manual tracing), the resulting quantitative analyses are minimally sensitive to the errors during data extraction that was performed automatically. Due to their speed and accuracy, these algorithms will appeal to large-scale quantitative studies and assays, especially the ones involving linear-branched structures such as neurons and blood vessels [16, 17].
Figure 9. (Top) Multi-fluorophore image, showing the distribution of synaptophysin – a presynaptic protein (green) and MAP-2 – a dendrite specific marker (red). (Bottom) Results of automated tracing and channel-wise segmentation. The cell body is labeled in blue.
Progress towards non-destructive imaging of live in vitro neuronal cultures further strengthens the need for tracing algorithms that can work successfully with quantum-limited imagery. More broadly, it also highlights the need for development of core robust detection and estimation methods for quantum-limited data.
Feature-based robust ICP registration is valuable for extracting much needed measurements from multi-fluorophore imagery. An already rich portfolio of readily available fluorophores, combined with rapid continuing advances, in the design of fluorophore molecules, holds
tremendous promise in the near term for analysis of neuronal subparts, and associated structures and functional phenomena. Increasingly, the spectral overlap can be expected to decrease, so the registration algorithms must cope with very low overlaps. Figure 10 shows an early example of imagery involving more than two fluorophores. The blue regions represent a pattern of poly-L-lysine printed on a smooth silica surface. The neuronal processes (neurites) are shown in red. The presynaptic proteins are shown in green.
Figure 10. Three-fluorophore image, labeling the neurites (red) and presynaptic proteins (green), and an imprinted pattern of poly-L-lysine (blue).
This research envisions creating networks of neurons,
much similar to networks of gates in field programmable gate array (FPGA) circuits but with neurons as one of the basic building blocks, with applications to neuron-computer interfaces, implants, and self-scoring high-throughput neurobiological/neurotoxicological assays. In order to achieve this goal, much effort is needed into controlling the growth of neurons, both using biochemical [2, 3] and topological cues [18]. Looking ahead, the image analysis techniques presented here, and many extensions to the methods, hold vast untapped promise in speeding the advance of nanobiotechnology by automating the many assays that must be run.
Acknowledgements Various portions of this work were supported in part by the Nanobiotechnology Center (NBTC), an STC Program of the NSF under Agreement No. ECS-9876771, the CenSSIS, an STC Program of the NSF under Agreement No. EEC-9986821, MicroBrightField, Inc. (Vermont),
MARA of Malaysia and NIBIB, EB, R01-0000359. The authors thank Andrea Turner and Harold Craighead of Cornell for fabricating the substrates, and Steve Schanz of The Wadsworth Center for manual validation of the tracing results. References [1] M. F. Bear, B. W. Connors, and M. A. Paradiso,
Neuroscience : exploring the brain, 2nd ed. Baltimore, Md.: Lippincott Williams & Wilkins, 2001.
[2] M. Tessier-Lavigne and C. S. Goodman, "The molecular biology of axon guidance," Science, vol. 274, pp. 1123-33, 1996.
[3] J. Ng, T. Nardine, M. Harms, J. Tzu, A. Goldstein, Y. Sun, G. Dietzl, B. J. Dickson, and L. Luo, "Rac GTPases control axon growth, guidance and branching," Nature, vol. 416, pp. 442-7, 2002.
[4] L. Kam, W. Shain, J. N. Turner, and R. Bizios, "Axonal outgrowth of hippocampal neurons on micro-scale networks of polylysine-conjugated laminin," Biomaterials, vol. 22, pp. 1049-1054, 2001.
[5] B. C. Wheeler, J. M. Corey, G. J. Brewer, and D. W. Branch, "Microcontact printing for precise control of nerve cell growth in culture," J. Biomech. Eng., vol. 121, pp. 73-8, 1999.
[6] A. Kumar, H. A. Biebuyck, and G. M. Whitesides, "Patterning Self-Assembled Monolayers: Applications in Materials Science," Langmuir, vol. 10, pp. 1498-511, 1994.
[7] G. Banker and K. Goslin, Culturing nerve cells, 2nd ed. Cambridge, Mass.: MIT Press, 1998.
[8] A. Rajnicek and C. McCaig, "Guidance of CNS growth cones by substratum grooves and ridges: effects of inhibitors of the cytoskeleton, calcium channels and signal transduction pathways," J. Cell Sci., vol. 110, pp. 2915-24, 1997.
[9] A. Rajnicek, S. Britland, and C. McCaig, "Contact guidance of CNS neurites on grooved quartz: influence of groove dimensions, neuronal age and cell type," J. Cell Sci., vol. 110, pp. 2905-13, 1997.
[10] A. M. Turner, N. Dowell, S. W. Turner, L. Kam, M. Isaacson, J. N. Turner, H. G. Craighead, and W. Shain, "Attachment of astroglial cells to microfabricated pillar arrays of different geometries," J. Biomed. Mater. Res., vol. 51, pp. 430-41, 2000.
[11] P. M. St. John, L. Kam, S. W. Turner, H. G. Craighead, M. Issacson, J. N. Turner, and W. Shain, "Preferential glial cell attachment to microcontact printed surfaces," J. Neurosci. Methods, vol. 75, pp. 171-177, 1997.
[12] K. A. Al-Kofahi, S. Lasek, D. H. Szarowski, C. J. Pace, G. Nagy, J. N. Turner, and B. Roysam, "Rapid automated three-dimensional tracing of neurons from confocal image stacks," IEEE Trans. Inf. Technol. Biomed., vol. 6, pp. 171-87, 2002.
[13] Y. Sun, R. J. Lucariello, and S. A. Chiaramida, "Directional low-pass filtering for improved accuracy and reproducibility of stenosis quantification in coronary arteriograms," IEEE Trans. Med. Imaging, vol. 14, pp. 242-248, 1995.
[14] A. Leon-Garcia, Probability and random processes for electrical engineering / Alberto Leon-Garcia., 2nd ed. ed. Reading, Mass.: Addison-Wesley, 1994.
[15] P. J. Besl and H. D. McKay, "A method for registration of 3-D shapes," IEEE Trans. Pattern Anal. Mach. Intell. , vol. 14, pp. 239-256, 1992.
[16] A. Can, H. Shen, J. N. Turner, H. L. Tanenbaum, and B. Roysam, "Rapid automated tracing and feature extraction from retinal fundus images using direct exploratory algorithms," IEEE Trans. Inf. Technol. Biomed., vol. 3, pp. 125-38, 1999.
[17] H. Shen, B. Roysam, C. V. Stewart, J. N. Turner, and H. L. Tanenbaum, "Optimal scheduling of tracing computations for real-time vascular landmark extraction from retinal fundus images," IEEE Trans. Inf. Technol. Biomed., vol. 5, pp. 77-91, 2001.
[18] R. G. Flemming, C. J. Murphy, G. A. Abrams, S. L. Goodman, and P. F. Nealey, "Effects of synthetic micro- and nano-structured surfaces on cell behavior," Biomaterials, vol. 20, pp. 573-88, 1999.
Copyright © 2022 FDOKUMEN


![Role of desensitization of AMPA receptors on the neuronal viability and on the [Ca2+]i changes in cultured rat hippocampal neurons](https://static.fdokumen.com/doc/165x107/63230bd664690856e1096f90/role-of-desensitization-of-ampa-receptors-on-the-neuronal-viability-and-on-the-ca2i.jpg)