Computer-based grading of haematoxylin-eosin stained tissue sections of urinary bladder carcinomas
12
Computer-based grading of haematoxylin-eosin stained tissue sections of urinary bladder carcinomas P. SPYRIDONOS{, P. RAVAZOULA{, D. CAVOURAS}, K. BERBERIDIS} and G. NIKIFORIDIS*{ {Computer Laboratory, School of Medicine, University of Patras, Rio, Patras 265 00, Greece {Department of Pathology, University Hospital, Rio, Patras 265 00, Greece }Department of Medical Instrumentation Technology, Technological Education Institution of Athens, Ag. Spyridonos Street, Aigaleo, 122 10 Athens, Greece }Department of Computer Engineering and Informatics, School of Engineering, University of Patras, Rio, Patras 265 00, Greece Abstract. Purpose: A computer-based image analysis system was developed for assessing the malignancy of urinary bladder carcinomas in a more objective manner. Tumours characterized in accordance with the WHO grading system were classified into low-risk (grades I and II) and high-risk (grades III and IV). Materials and methods: Images from 92 haematoxylin-eosin stained sections of urinary bladder carcinomas were digitized and analysed. An adequate number of nuclei were segmented from each image for morphologic and textural analysis. Image segmentation was performed by an efficient algorithm, which used pattern recognition methods to automatically characterize image pixels as nucleus or background. Image classification into low-risk or high-risk tumours was performed by means of the quadratic non-linear Bayesian classifier, which was designed employing 36 textural and morphological features of the nucleus. Results: Automatic segmentation of nuclei on all images was about 90% on average. Overall system accuracy in correctly classifying tumours into low-risk or high-risk was 88%, employing the leave-one-out method and the best combination of three textural and one morphological feature. Classification accuracy for low-risk tumours was 88.8% and for high-risk tumours 86.2%. Conclusion: The proposed image analysis system may be of value to the objective assessment of the malignancy of urine bladder carcinomas, since it relies on nuclear parameters that are employed in visual grading and their prognostic value has been proved. Keywords: Computer-based classification; Grading of bladder carcinoma; nuclei morphome- try; Multivariate statistical methods. 1. Introduction Grading histological sections of urinary bladder tumours is used for cancer prognosis and consequently the choice of treatment is highly dependent on it [1]. Tumours characterized by the World Health Organization (WHO) grading system [2] are classified into low-grade and high-grade [3]. Low-grade tumours are less *Author for correspondence; e-mail: [email protected] MED. INFORM. (2001) VOL. 26, NO. 3, 179–190 Medical Informatics & The Internet in Medicine ISSN 1463-923 8 print/ISSN 1464-523 8 online Ó 2001 Taylor and Francis Ltd http://www.tandf.co.uk/journals DOI: 10.1080/1463923011006575 7
Transcript of Computer-based grading of haematoxylin-eosin stained tissue sections of urinary bladder carcinomas

Computer-based grading of haematoxylin-eosin stained tissuesections of urinary bladder carcinomas
P. SPYRIDONOS{, P. RAVAZOULA{, D. CAVOURAS},K. BERBERIDIS} and G. NIKIFORIDIS*{
{Computer Laboratory, School of Medicine, University of Patras, Rio,Patras 265 00, Greece{Department of Pathology, University Hospital, Rio, Patras 265 00,Greece}Department of Medical Instrumentation Technology, TechnologicalEducation Institution of Athens, Ag. Spyridonos Street, Aigaleo, 122 10Athens, Greece}Department of Computer Engineering and Informatics, School ofEngineering, University of Patras, Rio, Patras 265 00, Greece
Abstract. Purpose: A computer-based image analysis system was developed for assessingthe malignancy of urinary bladder carcinomas in a more objective manner. Tumourscharacterized in accordance with the WHO grading system were classified into low-risk(grades I and II) and high-risk (grades III and IV).Materials and methods: Images from 92 haematoxylin-eosin stained sections of urinarybladder carcinomas were digitized and analysed. An adequate number of nuclei weresegmented from each image for morphologic and textural analysis. Image segmentationwas performed by an efficient algorithm, which used pattern recognition methods toautomatically characterize image pixels as nucleus or background. Image classificationinto low-risk or high-risk tumours was performed by means of the quadratic non-linearBayesian classifier, which was designed employing 36 textural and morphologicalfeatures of the nucleus.Results: Automatic segmentation of nuclei on all images was about 90% on average. Overallsystem accuracy in correctly classifying tumours into low-risk or high-risk was 88%,employing the leave-one-out method and the best combination of three textural and onemorphological feature. Classification accuracy for low-risk tumours was 88.8% and forhigh-risk tumours 86.2%.Conclusion: The proposed image analysis system may be of value to the objectiveassessment of the malignancy of urine bladder carcinomas, since it relies on nuclearparameters that are employed in visual grading and their prognostic value has beenproved.
Keywords: Computer-based classification; Grading of bladder carcinoma; nuclei morphome-try; Multivariate statistical methods.
1. IntroductionGrading histological sections of urinary bladder tumours is used for cancer
prognosis and consequently the choice of treatment is highly dependent on it [1].Tumours characterized by the World Health Organization (WHO) grading system[2] are classified into low-grade and high-grade [3]. Low-grade tumours are less
*Author for correspondence; e-mail: [email protected]
MED. INFORM. (2001) VOL. 26, NO. 3, 179–190
Medical Informatics & The Internet in Medicine ISSN 1463-923 8 print/ISSN 1464-523 8 online Ó 2001 Taylor and Francis Ltdhttp://www.tandf.co.uk/journals
DOI: 10.1080/1463923011006575 7

aggressive and are less likely to grow or spread and they encompass tumours of gradeI or II. Tumours of grade III or IV are assigned high-grade. Grading performed by apathologist incorporates various tissue, cell, and nuclear characteristics, which areassumed to be correlated to the degree of malignancy [4]. Thus, the final decisionabout the tumour is highly subjective [5]. Especially for intermediate tumours ofgrade II, which seem to be a continuum between grades I and III, the inter- andintra-observer reproducibility is low. From a clinical point of view it is importantto distinguish low-grade tumours, which can generally be treated conservatively incontrast to high-grade tumours. The latter often require a more aggressive therapybecause of a high-risk cancer progression [6]. Hence, there is a need for thedevelopment of reliable and reproducible systems for assesing tumouraggressiveness. Several approaches using computer-based methods have attemptedto quantitate the malignancy of cancer in a more objective manner [7–11].
Previous studies on computer-based automatic classification of bladdercarcinoma [9, 10] have used in the design of their systems a modification to theWHO grading system, using I, IIA, IIB, III tumour grading [12]. They haverelied on tissue characteristics, relational or textural, rather than individual nuclearfeatures. However, as recent studies [13–16] have revealed, features concerning themorphology or texture of the nucleus could provide significant prognosticinformation.
In the present study, we have developed a computer-based image analysis systemfor the automatic characterization of bladder carcinoma as high risk (grades III andIV) or low risk (grades I and II), employing the WHO grading system andmorphological and textural features of the nucleus.
2. Materials and methodsThe Department of Pathology of the University Hospital of Patras, Greece, has
provided the haematoxylin-eosin (HE) stained was paraffin tissue sections of 92patients (cases) with urine bladder carcinoma used in the present study. All caseshad been characterized by four independent pathologists using the WHO gradingsystem, and sixty-three cases had been classified as low grade and 29 as high grade.Images (fields) of tissue specimens were captured using a light microscopyimaging system consisting of a Zeiss KF2 microscope and an Ikegami colour videocamera. From each case up to three randomly selected fields were captured at amagnification of X400 from a region predefined by the pathologists. Additionally,each digitized image (7686576624-bit resolution) was converted into an 8-bitgrey scale image for further processing and analysis.
2.1. Image segmentationAn adequate number of nuclei were segmented from each case of morphologic
and texture analysis. For image segmentation, an efficient algorithm based on theprinciple of minimum distance was developed as follows. From each bladderimage, a large number of small 565 pixel image samples from the nucleus andfrom the surrounding nucleus texture (background) were selected, thus formingtwo distinct classes: nucleus and non-nucleus image samples. Two texturalfeatures from the auto-correlation function [17] (Appendix A, equations A6–7)were evaluated from each image sample, which were then employed in the designof a minimum distance decision rule. Segmentation was then performed by
180 P. Spyridonos et al.

scanning each image by a 565 pixel mask and characterizing each image pixel asnucleus or background, on the basis of local textural evaluations and distancesfrom the representative means (Appendix A, equation A1). In this way, eachbladder image was transformed into a nucleus-image by retaining only those pixelsbelonging to the nucleus class. In the case of misclassification (about 10% of thenuclei) due to nucleus overlapping, suitable morphological filters (Appendix A,equations A8–9) were employed for nucleus delineation or morphological featureswere used for nucleus rejection.
2.2. Feature generationFor each case at least 30 nuclei (Appendix C) were extracted, from one or more
fields, in order to be employed in the design of the image analysis system. For eachnucleus 36 morphological and textural features were evaluated. Morphologicalfeatures consisted of nucleus area, roundness, and concavity [18]. Texturalfeatures included mean value, variance, skewness, and kurtosis from the nucleusintensity histogram, and the rest were computed from the co-occurrence matrix[19–22], which is a two-dimenstional histogram describing the frequency withwhich two adjacent pixels occur in the nucleus’s image. Finally, each one of the92 cases was represented by a 36 feature vector, each feature being forms as themean feature of all nuclei evaluated in each case.
2.3. Feature selection and classificationBest features selection was based on the performance of the classifier. Features
were combined in all possible ways (i.e. 2, 3, 4, 5 feature combinations) by theBayesian classifier [23] (Appendix C, equation C1) in order to determine thehighest classification accuracy achieved with the minimum number of features [24](Appendix B).
Classifier performance evaluation was tested by means of the leave-one-outmethod [25], and the results were presented in a truth table, revealing theclassification accuracy of the system.
3. ResultsEach greyscale image was automatically segmented into nuclei and background
and at least 30 nuclei were extracted from each case. Since the number of accuratesegmented nuclei per section field ranged approximately between 17 and 65, twofields were mostly sampled in each case. Only one case of grade IV required morethan 3 fields. In all cases, nuclei were located with an overall accuracy of about90%. Figures 1 and 2 show samples of bladder carcinoma and figures 3 and 4 showthe results of the segmentation algorithm.
The best classification result was obtained in four-dimension feature space. Theoverall classification accuracy was 88%, employing the variance ofnucleus histogram,the texture feature correlation for d = 1 and d = 3, and the standard deviation ofconcavity (Appendix B).
As shown in table 1, 88.8% (56/63) of the low-risk cases were correctly classifiedwhile 7 cases were misclassified as high-risk. This false positive finding (11%)concerned only grade II tumours. In the high-risk group the correct classificationwas 86.2% (25/29) and four cases were misclassified as low-risk tumours. This falsenegative finding (13.7%) concerned grade III tumours.
Computer-based grading of stained tissue sections 181
4. DiscussionSubjective assessment in pathologic diagnosis may be influenced by various
factors including the reproductibility of some grading systems, which can be aslow as 30–40% [26, 27], on the psycho-physiological performance of thediagnostician [28], and on the quality of the definition of each category.Particular problems may arise in distinguishing grade II and grade IIItumours [29], which may characterize a tumour as of low or high risk. Someresearch workers [10] have developed image perception techniques instead ofsubjectively characterizing tumours. Other studies [30, 31] have attempted toassist pathologic diagnosis by introducing computer-aided image analysismethods during the last 32 years. Such methods have claimed a moreobjective and reproducible manner in urinary bladder carcinoma prognosis[7, 15].
The aim of this study was to develop an automatic image analysis method forcharacterizing urinary bladder carcinomas as low-risk tumours (grades I and II)or high-risk tumours (grades III and IV). In contrast to previous studies [9, 10],
Figures 1 and 2. Samples of bladder carcinoma.
182 P. Spyridonos et al.

it has been our objective from the beginning to rely on the WHO grading system,which is widely adopted by pathologists, and to employ morphological and texturalfeatures of the nucleus, since such parameters are used in visual grading and theirprognostic value has been proved [13–16]. In this way our method would be closelyassociated to the work performed by the pathologist.
Locating the nuclei from their background on each field is a difficult task thathas been mainly dealt with thresholding techniques. Previous studies [9, 10] haveused global thresholding techniques for the initial labeling of nuclei regions.However, in our case image intensity properties of HE stained sections variedwidely and the internal part of nuclei was very heterogeneous to adapt a similarmethod. Our segmentation method relied on a different approach, that ofapplying pattern recognition methods in characterizing image pixels asbelongings to nucleus or to background (figures 1–4). Segmentation results onall images of the present study revealed a high percentage (about 90%) accuracyin automatic delination of all image nuclei. The method was fast, reproducible,and without operator bias.
The quadratic non-linear Bayesian classifier was trained to classify a set of 92cases in two classes according to the degree of malignacy. Each case was definedby 36 parameters, comprising only morphological and textural nucleus features.Previous studies [9, 10] have relied on linear discriminant classificationtechniques, which however are less sensitive to wide pattern clustering. Theoverall classification accuracy of the image analysis system that we havedeveloped was 88% in distinguishing high-risk from low-risk bladdercarcinomas. The results appear encouraging considering that they have beenobtained by using only textural and morphological parameters of the nucleus,which may contain important information on the nature as well as theprogression or recurrence of the disease. Additionally, grading based on HEstained sections is a widely used method adopted in everyday practice by manylaboratories and our intention has been to develop a diagnostic tool for thatgrading procedure. Previous studies on computer-aided classification of urinarybladder carcinoma [9, 10] have relied on different features with no particularfocus on the nucleus, have employed a different tumour subjective gradingsystem (modified WHO grading), and have used a different tissue sectionstaining procedure.
Figure B1. An arbitrary position of the chords on the nuclear contour. For this particularnucleus 39 different chord positions will give the mean value of concavity.
Computer-based grading of stained tissue sections 183
The classification accuracy for the low-risk tumours was 88.8%. Consideringthat in the low-risk class we have included all grade II tumours, results are verysatisfactory since grade II is a confusing category signifying the continuumbetween grade I and grade III [8, 11]. This may be also verified in our results,since all seven misclassified tumours have been characterized as grade II.Perhaps this is the reason that has led previous studies to adopting a modified
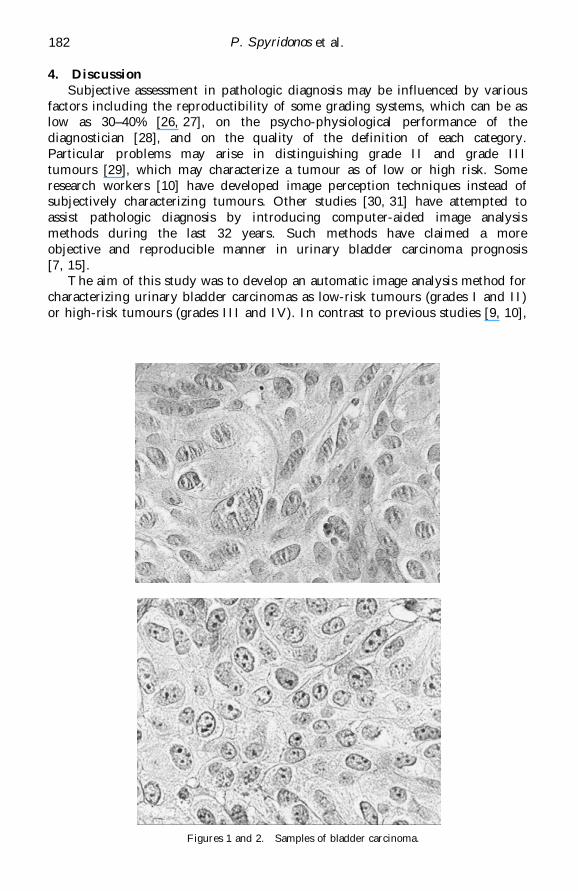
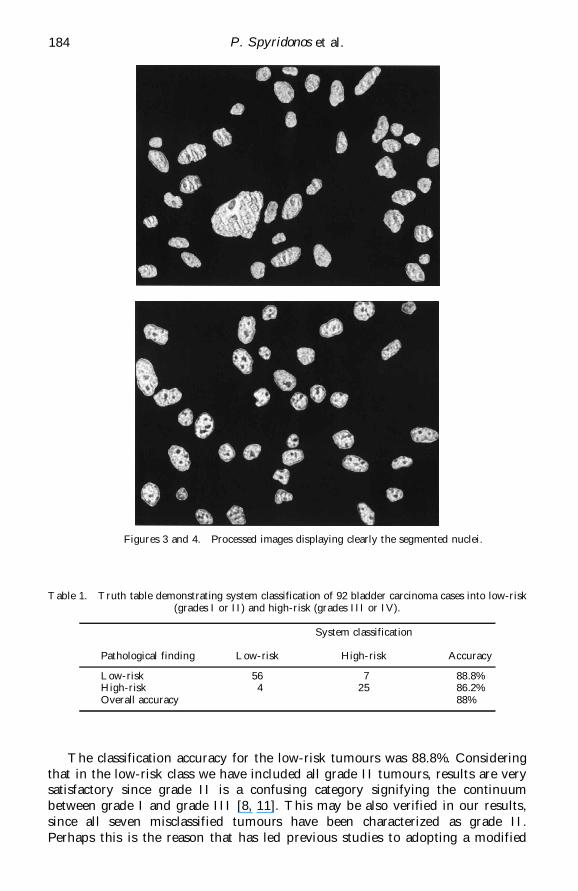
Figures 3 and 4. Processed images displaying clearly the segmented nuclei.
Table 1. Truth table demonstrating system classification of 92 bladder carcinoma cases into low-risk(grades I or II) and high-risk (grades III or IV).
System classification
Pathological finding Low-risk High-risk Accuracy
Low-riskHigh-riskOverall accuracy
564
725
88.8%86.2%88%
184 P. Spyridonos et al.

WHO grading system, by splitting grade II tumours into the low-risk and high-risk groups. Regarding the high-risk tumour classification accuracy, 86.2% of thetumours were correctly classified, while four (13.7%) grade III tumours werewrongly characterized as low-risk. The importance of this result may be assessedby considering that the burden for low-grading a tumour may be decisive inpatient management and, thus, in the progression or recurrence of the disease.Therefore, it was important to employ textural and morphological features ofthe nucleus for estimating tumour grading, because of their high prognostic value.
Regarding the nuclear features used for achieving the highest classificationaccuracy, the best combination consisted of three textural features and onemorphological feature (Appendix B). The variance of the nucleus intensity(Appendix B, equation B1) signifies the inhomogeneity of the chromatin textureof the nucleus [11], the correlation (Appendix B, equation B4) signifies grey-tone linear dependencies in the nucleus image [20], and the concavity is themorphological descriptor sensing slight irregularities in the nucleus borders.
In conclusion, an automatic image analysis method has been developed forcharacterizing urinary bladder carcinomas as low-risk tumours (grades I and II)or high-risk tumours (grades III and IV), based on textural and morphologicalfeatures of the nucleus and on the WHO grading system. The usefulness of thesystem is its ability to automatically segment the nuclei on digitized tissuesections, following the widely used HE tissue-section staining procedure, and toprovide diagnostic information with high accuracy.
References1. COLLAN, Y., MAKINEN, J. and HEIKKINEN, A., 1979, Histological grading to TC tumors of the
bladder. Value of histological grading (WHO) in prognosis. European Urology, 5–311.2. JONATHAN, I. E., MAHUL, B. A., VICTOR, R. R. and MOSTOFI, F. K., 1998, The World Health
Organization/International Society of Urological Pathology consensus classification of urothelial(transitional cell) neoplasms of the urinary bladder. American Journal of Surgical Pathology, 22,1435–1448.
3. MURPHY, W. M., 1989, Diseases of the urinary bladder, urethra, ureters, and renal pelves. InUrological pathology, edited by W. M. Murphy (Philadelphia: WB Saunders), 64–96.
4. BUSCH, C., ENGBERG, A., NORLEN, B. J. and STENKVIST, B., 1977, Malignancy grading of epithelialbladder tumors. Scandinavian Journal of Urology and Nephrology, 11, 143–148.
5. OOMS, E. C. M., KURVER, P. H. J., VELDHUIZEN, R. W. and ALONS, C. L., 1983, Morphometricgrading of bladder tumours in comparison with histologic grading by pathologists. HumanPathology, 14, 140–143.
6. MALMSTROM , P.-U., BUSCH, C. and NORLEN, B. J., 1987, Recurrence, progression and survival inbladder cancer. Scandinavian Journal of Urology and Nephrology, 21, 185–195.
7. PREWITT, J. M. S., 1978, On some applications of pattern recognition and image processing tocytology, cytogenetics and histology. Doctoral dissertation, Department of Computer Scienceand Department of Clinical Cytology, Uppsala University.
8. DE MEESTER, U., YOUNG, I. T., LINDEMAN, J.and VAN DER LINDEN, H. C., 1991, Towards aquantitative grading of bladder tumors. Cytometry, 12, 602–613.
9. JARKRANS , T., VASKO, J., BENGTSSON, E., CHOI, H.-K., MALSTROM , P.-U., WESTER, K. and BUSCH,C., 1995, Grading of transitional cell bladder carcinoma by image analysis of histological sections.Analytical Cellular Pathology, 18, 135–138.
10. CHOI, H.-K., VASKO, J., BENGTSSON, E., JARKRANS, T., MALMSTROM, P.-U., WESTER, K. and BUSCH,C., 1994, Grading of transitional cell bladder carcinoma by texture analysis of histological sections.Analytical Cellular Pathology, 6, 327–343.
Computer-based grading of stained tissue sections 185

11. VAN VELTHOVEN, R., PETEIN, M., ZLOTTA, A., OOSTERLINCK,W., MEIJDEN, A., ZANDONA, C., ROELS,H., PASTELS, J.L., SCHULMAN, C., and KISS, R. 1994, Computer-assisted chromatin texturecharacterization of Feulgen-stained nuclei in a series of 331 transitional bladder cell carcinomas.Journal of Pathology, 173, 235–242.
12. PAUWELS, R. P. E., SCHAPERS, R. F. M., SMEETS, A. W. G. B., DEBRUYNE, F. M. J. and GARAEDTS, J.P. M., 1988, Grading in superficial bladder cancer: (1) morphological criteria. British Journal ofUrology, 61, 129–134.
13. FUKUZAWA, S., HASHIMURA, T., SASAKI, M., YAMABE, H. and YOSHIDA, O., 1995. Nuclearmorphometry for improved prediction of the prognosis of human bladder carcinoma. Cancer, 10(76), 1790–1796.
14. LIPPONEN, P. K., ESKELINEN, M. J., KIVIRANTA, J. and NORDLING, S., 1991. Classic prognosticfactors, flow cytometric data, nuclear morphometric variables and mitotic indexes as predictorsin transitional cell bladder cancer. Anticancer Research, 11, 911–916.
15. SOWTER, C., SLAVIN, G. and ROSEN, D., 1990, Morphometry of bladder carcinoma. Definition of anew variable. Analytical Cellular Pathology, 2, 205–213.
16. DE PREZ, C., DE LAUNOIT, Y., KISS, R., PETEIN, M., PASTEELS, J., VERHEST, A. and VAN VELTHOVEN,R., 1990, Computerized morphonuclear cell image analyses of malignant disease in bladder tissues.Journal of Urology, 143, 694–699.
17. FAUGERAS, O., and PRATT, W., 1980, Decorrelation methods of texture feature extraction. IEEETransactions on Pattern Analysis and Machine Intelligence, PAMI-2, 14, 323–332.
18. STREET, W. N., WOLBERG, W. H. and MANGASARIAN , O. L., 1993, Nuclear feature extraction forbreast tumor diagnosis. International Symposium on Electronic Imaging: Science and Technology,San Jose, California, 1905, 861–870.
19. CONNERS, R. and HARLOW , C., 1980, A theoretical comparison of texture algorithms. IEEETransactions on Pattern Analysis and Machine Intelligence, 3, 204–222.
20. HARRALICK, R. and SHANMUGAM, K., 1973, Textural features for image classification. IEEETransactions on Systems, Man, and Cybernetics, 3 (6), 610–621.
21. OHANIAN, P. and DUBES, R., 1992, Performance evaluation for four classes of textural features.Pattern Recognition, 8 (25), 819–833.
22. WALKER, R. F., JACKWAY, P. T. and LOVELL, B., 1995, Cervical cell classification via co-occurrenceand Markov random field features. Proceedings of Digital Image Computing: Techniques andApplications, 294–299.
23. THEODORIDIS, S., and KOUTROUMBAS, K., 1998, Classifiers based on Bayes decision theory. InPattern Recognition. (Academic Press), 13–28.
24. THEODORIDIS, S. and KOUTROUMBAS, K., 1998, Feature Subset Selection. In Pattern Recognition.(Academic Press), 159–160.
25. THEODORIDIS, S. and KOUTROUMBAS, K., 1998, System evaluation. In Pattern Recognition.(Academic Press), 342–343.
26. OOMS, E. C. M., ANDERSON, W. A. D., ALONS, C. L., BOON, M. E. and VELDHUIZEN, R. W., 1983,An analysis of the performance of pathologists in the grading of bladder tumors. Human Pathology,14, 140–143.
27. STENDAHL, U., WILLEN, H. and WILLEN, R., 1981, Invasive squamous cell carcinoma of the uterinecervix II: reproducibility of a histopathological malignancy system. Acta Radiologica Oncology, 20,65–70.
28. LANGLEY, F. A. and BAAK, J. P. A., 1984, Quantitative methods in diagnostic gynaecologicalpathology. Clinical Obstetrics and Gynecology, 11, 79–92.
29. SCHAPERS, R. F. M., PLOEM-ZAAIJER, J. J., PAUWELS, R. P., SMEETS, N. B., BRANDT, P., TANKE, A.J., BOSMAN, F. T., 1993. Image cytometric analysis in transitional cell carcinoma of the bladder.Cancer, 72, 182–189.
30. PREWITT, J. M. S., 1972, Objective characterization of tissue sections by digital image processing.Proc of the 17th Annual Conference on Engineering in Medicine and Biology, 481.
31. SOWTER, C., SLAVIN, G. and ROSEN, D., 1987, Morphometry of bladder carcinoma. The automaticdelineation of urothelial nuclei in tissue sections using an IBAS II image array processor. Journal ofPathology, 153, 289–297.
32. GONZALEZ, R. C. and WOODS, R. E., 1992, Recognition and interpretation. In Digital ImageProcessing. (Addison-Weslay), 580–581
33. DU BUF, J. M. H., KARDAN, M. and SPANN, M., 1990, Texture feature performance for imagesegmentation. Pattern Recognition, 3, 291–309, 23.
34. GONZALEZ, R. C. and WOODS, R. E., 1992, Representation and description. In Digital ImageProcessing. (Addison-Weslay), 518–528.
35. WALKER, F. R., JACKWAY, P. and LONGSTAFF, I. D., 1995, Improving co-occurrence matrix featurediscrimination. Proceedings of DICTA ’95, The 3rd Conference on Digital Image Computing:Techniques and Applications, 643–648.
186 P. Spyridonos et al.

36. CHEN, P.C., and PAVLIDIS, T., PATRICK, C. C. and THEODOSIOS, P., 1979, Segmentation by textureusing a co-occurrence matrix and a split-and-merge algorithm. Computer Graphic and ImageProcessing, 10, 172–182.
37. KRUGER, P. R., THOMPSON, W. B. and TURNER, A. F., 1974, Computer diagnosis ofpneumoconiosis. IEEE Trans. Systems Man Cybernetics SMC-4, 40–49.
38. http://www.richland.cc.il.us/james/lecture/m170/ch07-clt.html
Appendix A
Image segmentationIn isolating nuclei from the surrounding background tissue, a minimum
distance classifier [32] was used, employing auto-correlation textural features[17]. The decision function of the classifer is of the form:
di…x† ˆ x0mi-12
m0imi; i ˆ 1; 2 …A1†
where x’: is the transposed feature vector; and m1: is the mean feature vector forclass i.
The minimum distance classification rule can be stated as:
If d1…x† > d2…x†; x is classified to class 1:
If d1…x† < d2…x†; x is classified to class 2:
Textural features were computed from:
S…u; v† ˆX5
mˆ0
X5
nˆ¡5
…m ¡ nm†u…n ¡ nn†vAF…m; n† …A2†
where,
nm ˆX5
mˆ0
X5
nˆ¡5
mAF…m; n† …A3†
nn
X5
mˆ0
X5
nˆ¡5
nAF…m; n† …A4†
In equations A2–A4, computation is only over one-half of the autocorrelationfunction because of its symmetry [17].
Finally,
AF…m; n† ˆX
j
X
k
F…j; k†F…j ¡ m; k ¡ n† …A5†
is the auto-correlation function over a 565 window. F is the function of theproperly zero padded 565 image sub-region.
Since texture is a region property [33], bigger windows capture better thecontext of texture but eliminate the accuracy of nuclei contours. A window sizeof 565 was an optimum compromise between texture discrimination ability andnuclei boundary detection.
Computer-based grading of stained tissue sections 187
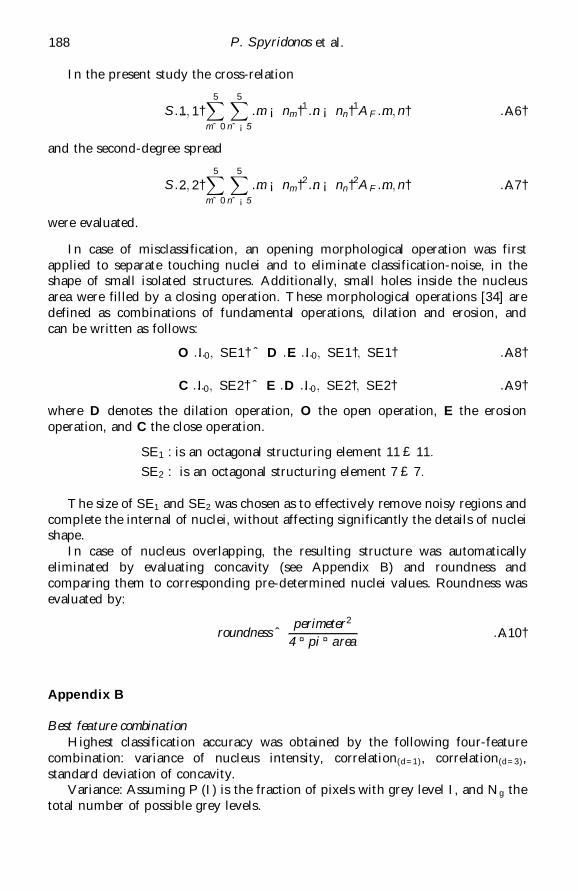
In the present study the cross-relation
S…1; 1†X5
mˆ0
X5
nˆ¡5
…m ¡ nm†1…n ¡ nn†1AF…m; n† …A6†
and the second-degree spread
S…2; 2†X5
mˆ0
X5
nˆ¡5
…m ¡ nm†2…n ¡ nn†2AF…m; n† …A7†
were evaluated.
In case of misclassification, an opening morphological operation was firstapplied to separate touching nuclei and to eliminate classification-noise, in theshape of small isolated structures. Additionally, small holes inside the nucleusarea were filled by a closing operation. These morphological operations [34] aredefined as combinations of fundamental operations, dilation and erosion, andcan be written as follows:
O …I0; SE1† ˆ D …E …I0; SE1†; SE1† …A8†
C …I0; SE2† ˆ E …D …I0; SE2†; SE2† …A9†
where D denotes the dilation operation, O the open operation, E the erosionoperation, and C the close operation.
SE1 : is an octagonal structuring element 11 £ 11:
SE2 : is an octagonal structuring element 7 £ 7:
The size of SE1 and SE2 was chosen as to effectively remove noisy regions andcomplete the internal of nuclei, without affecting significantly the details of nucleishape.
In case of nucleus overlapping, the resulting structure was automaticallyeliminated by evaluating concavity (see Appendix B) and roundness andcomparing them to corresponding pre-determined nuclei values. Roundness wasevaluated by:
roundness ˆ perimeter2
4 ¤ pi ¤ area…A10†
Appendix B
Best feature combinationHighest classification accuracy was obtained by the following four-feature
combination: variance of nucleus intensity, correlation(d=1), correlation(d=3),standard deviation of concavity.
Variance: Assuming P (I) is the fraction of pixels with grey level I, and Ng thetotal number of possible grey levels.
188 P. Spyridonos et al.

2 ˆXNg
Iˆ0
…I ¡ m†2 ¤ P…I† …B1†
where m ˆXNg
Iˆ0
I ¤ P…I† is the mean value: …B2†
Correlation: Texture feature of correlation estimated from the co-occurrencematrix [19–22]
P…i; jjd† ˆ 14
¤X
ˆ0;45;90;135
…Pi; jjd; † …B3†
Each P (i,j|d,F) is the probability of going from grey level i to grey level j, giventhat the inter-sample spacing is d, and the direction is given by angle F.
The correlation was estimated as follows:
Correlation ˆPNg¡1
iˆ0
PNg¡1jˆ0 …i ¡ x†…j ¡ y†P…i; jjd†
x y…B4†
where:
x ˆXNg¡1
iˆ0
iXNg¡1
jˆ0
P…i; jjd†; …B5†
y ˆXNg¡1
jˆ0
jXNg¡1
iˆ0
P…i; jjd†; …B6†
2x ˆ
XNg¡1
iˆ0
…i ¡ x†2XNg¡1
jˆ0
P…i; jjd†; …B7†
2y ˆ
XNg¡1
jˆ0
…j ¡ y†2XNg¡1
iˆ0
P…i; jjd†: …B8†
Ng is the number of grey scales.
Since each grey level is not efficiently employed to describe the picture, theco-occurrence matrix (Ng6Ng) should have many fewer entries than the totalnumber of pixels in the image to avoid a sparse matrix [21]. A reasonablechoice of Ng depends therefore on the application image size. To reduce thenumber of grey levels, each nuclear image is re-quantized to 16 levels(Ng = 16) via histogram equalization, so that enough resolution kept to retainthe texture of each nucleus, and Ng6Ng is small enough compared to the totalnumber of pixels in the nucleus.
This technique has been used by a number of research workers as an imagepreprocessing before texture features are computed from the co-occurrencematrices [35–37].
Computer-based grading of stained tissue sections 189

Finally, each co-occurrence feature was esimated for inter-sample spacingd = 1 and d = 3, and four angles (F = 08, 458, 908, 1358). For each inter-samplespacing we are averaging across the four angles equation (B3).
Concavity: This feature attempts to measure the severity of concavities or theindentations of a nucleus and was computed as follows:
Chords are drawn between non-adjacent contour points, and the ratio of thenumber of pixels lying inside the chords to the total number of pixelscomprising the nucleus border was estimated. The chords joined contour pointsevery twenty pixels and they moved in a circle every five pixels (figure B1).
It turned out that taking the features in groups of five did not improve theclassification accuracy significantly. The best 5-dimensional feature vector gave90.4% (57/63) accuracy for the low-risk cases, and 86.2% (25/29) accuracy for thehigh risk cases. The gain was one additional case classified correctly in the low-risk class.
To design a well-generalized classifer, we kept the minimum feature vectordimension beyond which no important gain in performance was obtained [24].
Appendix CThe Bayes classifier is based on parametric methods, where gaussian
distributed data is assumed. The gaussian model of features is a well-fittedmodel as far as the mean value of the nuclei features are concerned. Accordingto the Central Limit Theorem the distribution of sample means should beapproximately normal if the samples are large enough. Taking a sample of atleast 30 nuclei, the sample distribution of the mean of a parameter (feature) willbe approximately normal no matter the shape of the distribution of theindividual values in the population [38].
Assuming that patterns x follow the general multivariate normal density in the4-dimensional feature space, the Bayes decision function is of the form [23]:
di…x† ˆ log…P!i†- 12
logjCij-12
‰…x-mi†0C¡1i …x-miŠ; …C1†
Ci: 464 covariance matrix for class oi,
Ci ˆ 1Ni
X
x2!i
‰xx0 ¡ mim0iŠ …C2†
m1: the mean feature vector for each class oi.x’: the transposed feature vector.Poi: The a priori probability estimated from the available training patterns.
Assuming N the total number of feature vectors and Ni of them belonging to oi,then P!i º Ni
N . In our case the a priori probability for the low-risk class wasP!1 ˆ 63
92, and the a priori probability for the high-risk class was P!2 ˆ 2992.
190 P. Spyridonos et al.