Stable and Unstable Malaria Hotspots in Longitudinal Cohort Studies in Kenya
d n a r e p a i r 5 ( 2 0 0 6 ) 1346–1363
avai lab le at www.sc iencedi rec t .com
journa l homepage: www.e lsev ier .com/ locate /dnarepai r
Computational analyses show A-to-G mutationscorrelate with nascent mRNA hairpins at somatichypermutation hotspots
Edward J. Steelea,d,∗, Robyn A. Lindleyb, Jiayu Wenc,d, Georg F. Weiller c,d
a Genomic Interactions Group & CILR, Research School of Biological Sciences, Australian National University, Canberra, Australiab Silverbrook Research, Balmain, Sydney, Australiac Bioinformatics Laboratory, Genomic Interactions Group, Research School of Biological Sciences,Australian National University, Canberra, Australiad ARC Centre of Excellence for Integrative Legume Research (CILR), Australian National University, Australia
a r t i c l e i n f o
Article history:
Received 6 June 2006
Accepted 6 June 2006
Published on line 1 August 2006
Keywords:
Ig somatic hypermutation
A-T targeted Phase II SHM
A-to-I RNA editing
ADAR1
DNA polymerase eta (-�)
a b s t r a c t
Activation-induced cytidine deaminase (AID) initiates Phase I somatic hypermutation (SHM)
of antibody genes by deaminating deoxy-cytosine to deoxy-uracil (C-to-U). These lesions
trigger Phase II, a poorly understood process of error-prone repair targeting A-T pairs by
DNA polymerase � (Pol �). Since Pol � is also a reverse transcriptase, Phase II could involve
copying off RNA as well as DNA templates. We explore this idea further since in an RNA-
based pathway it is conceivable that adenosine-to-inosine (A-to-I) RNA editing causes A-
to-G transitions since I like G pairs with C. Adenosine deaminases (ADARs) are known to
preferentially edit A nucleotides that are preceded by an A or U (W) in double-stranded
RNA substrates. On this assumption and using a theoretical bioinformatics approach we
show that a significant and specific correlation (P < 0.002) exists between the frequency of
WA-to-WG mutations and the number of mRNA hairpins that could potentially form at
reverse transcription the mutation site. This implies roles for both RNA editing and reverse transcription during
SHM in vivo and suggests definitive genetic experiments targeting the appropriate ADAR1
isoform (�INF-ADAR1) and/or Ig pre-mRNA templates.
first on theoretical grounds [6] and then in genetic studies in E.
1. Introduction
Following antigenic stimulation in mammals the rearrangedimmunoglobulin (Ig) variable (V) region genes encodingheavy and light chains are mutated at a very high rate(∼10−3/bp/generation) in germinal center B lymphocytes(reviewed in Ref. [1]). This extraordinary genetic diversifica-
tion mechanism, termed ‘somatic hypermutation’ (SHM), isthe molecular process underpinning antigen-driven affinitymaturation of antibodies during an immune response [2,3].∗ Corresponding author. Tel.: +61 2 422 66432; fax: +61 2 422 66432.E-mail address: [email protected] (E.J. Steele).
1568-7864/$ – see front matter © 2006 Elsevier B.V. All rights reserved.doi:10.1016/j.dnarep.2006.06.002
© 2006 Elsevier B.V. All rights reserved.
Honjo and co-workers have shown that cytidine deaminase(AID) is essential for the induction of both SHM and Ig classswitch recombination (CSR) in mouse and human immunesystems [4,5]. It was thought initially that AID acted indirectlyas a C-to-U RNA editor modifying the mRNA of a commonenzyme involved in both pathways [4]. It then became clear,
coli [7,8] as well as biochemical analyses [9,10] that AID deam-inates C-to-U directly in single-stranded (ss)DNA regions ofthe transcription bubble, viz. the displaced non-transcribed
0 0 6 ) 1346–1363 1347
s([lswncststesUDirocSlADtasi
fabDpvBbApet
tfrwIrra[ier[atp
i
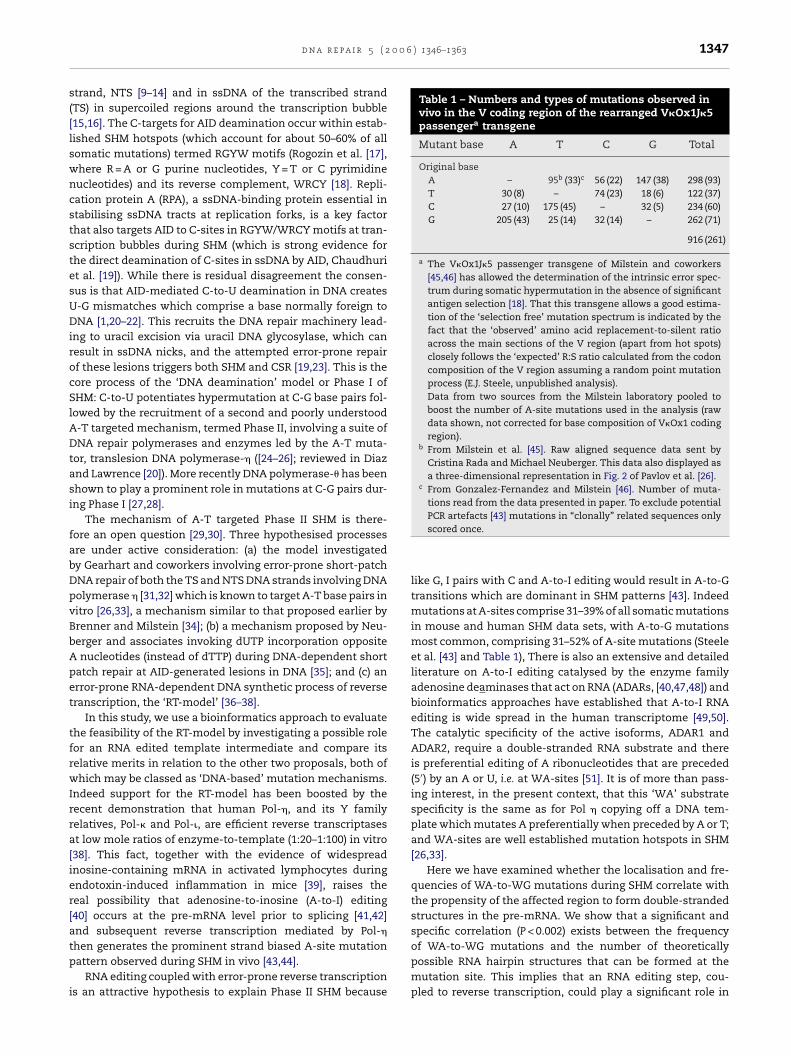
Table 1 – Numbers and types of mutations observed invivo in the V coding region of the rearranged V�Ox1J�5passengera transgene
Mutant base A T C G Total
Original baseA – 95b (33)c 56 (22) 147 (38) 298 (93)T 30 (8) – 74 (23) 18 (6) 122 (37)C 27 (10) 175 (45) – 32 (5) 234 (60)G 205 (43) 25 (14) 32 (14) – 262 (71)
916 (261)
a The V�Ox1J�5 passenger transgene of Milstein and coworkers[45,46] has allowed the determination of the intrinsic error spec-trum during somatic hypermutation in the absence of significantantigen selection [18]. That this transgene allows a good estima-tion of the ‘selection free’ mutation spectrum is indicated by thefact that the ‘observed’ amino acid replacement-to-silent ratioacross the main sections of the V region (apart from hot spots)closely follows the ‘expected’ R:S ratio calculated from the codoncomposition of the V region assuming a random point mutationprocess (E.J. Steele, unpublished analysis).Data from two sources from the Milstein laboratory pooled toboost the number of A-site mutations used in the analysis (rawdata shown, not corrected for base composition of V�Ox1 codingregion).
b From Milstein et al. [45]. Raw aligned sequence data sent byCristina Rada and Michael Neuberger. This data also displayed asa three-dimensional representation in Fig. 2 of Pavlov et al. [26].
c From Gonzalez-Fernandez and Milstein [46]. Number of muta-tions read from the data presented in paper. To exclude potential
d n a r e p a i r 5 ( 2
trand, NTS [9–14] and in ssDNA of the transcribed strandTS) in supercoiled regions around the transcription bubble15,16]. The C-targets for AID deamination occur within estab-ished SHM hotspots (which account for about 50–60% of allomatic mutations) termed RGYW motifs (Rogozin et al. [17],here R = A or G purine nucleotides, Y = T or C pyrimidineucleotides) and its reverse complement, WRCY [18]. Repli-ation protein A (RPA), a ssDNA-binding protein essential intabilising ssDNA tracts at replication forks, is a key factorhat also targets AID to C-sites in RGYW/WRCY motifs at tran-cription bubbles during SHM (which is strong evidence forhe direct deamination of C-sites in ssDNA by AID, Chaudhurit al. [19]). While there is residual disagreement the consen-us is that AID-mediated C-to-U deamination in DNA creates-G mismatches which comprise a base normally foreign toNA [1,20–22]. This recruits the DNA repair machinery lead-
ng to uracil excision via uracil DNA glycosylase, which canesult in ssDNA nicks, and the attempted error-prone repairf these lesions triggers both SHM and CSR [19,23]. This is theore process of the ‘DNA deamination’ model or Phase I ofHM: C-to-U potentiates hypermutation at C-G base pairs fol-
owed by the recruitment of a second and poorly understood-T targeted mechanism, termed Phase II, involving a suite ofNA repair polymerases and enzymes led by the A-T muta-
or, translesion DNA polymerase-� ([24–26]; reviewed in Diaznd Lawrence [20]). More recently DNA polymerase-� has beenhown to play a prominent role in mutations at C-G pairs dur-ng Phase I [27,28].
The mechanism of A-T targeted Phase II SHM is there-ore an open question [29,30]. Three hypothesised processesre under active consideration: (a) the model investigatedy Gearhart and coworkers involving error-prone short-patchNA repair of both the TS and NTS DNA strands involving DNAolymerase � [31,32] which is known to target A-T base pairs initro [26,33], a mechanism similar to that proposed earlier byrenner and Milstein [34]; (b) a mechanism proposed by Neu-erger and associates invoking dUTP incorporation oppositenucleotides (instead of dTTP) during DNA-dependent short
atch repair at AID-generated lesions in DNA [35]; and (c) anrror-prone RNA-dependent DNA synthetic process of reverseranscription, the ‘RT-model’ [36–38].
In this study, we use a bioinformatics approach to evaluatehe feasibility of the RT-model by investigating a possible roleor an RNA edited template intermediate and compare itselative merits in relation to the other two proposals, both ofhich may be classed as ‘DNA-based’ mutation mechanisms.
ndeed support for the RT-model has been boosted by theecent demonstration that human Pol-�, and its Y familyelatives, Pol-� and Pol-�, are efficient reverse transcriptasest low mole ratios of enzyme-to-template (1:20–1:100) in vitro38]. This fact, together with the evidence of widespreadnosine-containing mRNA in activated lymphocytes duringndotoxin-induced inflammation in mice [39], raises theeal possibility that adenosine-to-inosine (A-to-I) editing40] occurs at the pre-mRNA level prior to splicing [41,42]nd subsequent reverse transcription mediated by Pol-�
hen generates the prominent strand biased A-site mutationattern observed during SHM in vivo [43,44].
RNA editing coupled with error-prone reverse transcriptions an attractive hypothesis to explain Phase II SHM because
PCR artefacts [43] mutations in “clonally” related sequences onlyscored once.
like G, I pairs with C and A-to-I editing would result in A-to-Gtransitions which are dominant in SHM patterns [43]. Indeedmutations at A-sites comprise 31–39% of all somatic mutationsin mouse and human SHM data sets, with A-to-G mutationsmost common, comprising 31–52% of A-site mutations (Steeleet al. [43] and Table 1), There is also an extensive and detailedliterature on A-to-I editing catalysed by the enzyme familyadenosine deaminases that act on RNA (ADARs, [40,47,48]) andbioinformatics approaches have established that A-to-I RNAediting is wide spread in the human transcriptome [49,50].The catalytic specificity of the active isoforms, ADAR1 andADAR2, require a double-stranded RNA substrate and thereis preferential editing of A ribonucleotides that are preceded(5′) by an A or U, i.e. at WA-sites [51]. It is of more than pass-ing interest, in the present context, that this ‘WA’ substratespecificity is the same as for Pol � copying off a DNA tem-plate which mutates A preferentially when preceded by A or T;and WA-sites are well established mutation hotspots in SHM[26,33].
Here we have examined whether the localisation and fre-quencies of WA-to-WG mutations during SHM correlate withthe propensity of the affected region to form double-strandedstructures in the pre-mRNA. We show that a significant andspecific correlation (P < 0.002) exists between the frequency
of WA-to-WG mutations and the number of theoreticallypossible RNA hairpin structures that can be formed at themutation site. This implies that an RNA editing step, cou-pled to reverse transcription, could play a significant role in
( 2 0
1348 d n a r e p a i r 5somatic hypermutation of rearranged Ig genes. As far as weare aware, this strong statistical association, between quanti-tative patterns of dsRNA secondary structure and the A-to-Gmutation spectrum, provides the first tangible evidence of alink between SHM and A-to-I RNA editing, which have hith-erto been considered to be very different ‘hypermutational’processes.
2. Materials and methods
2.1. DNA Sequence and SHM mutation data base
The DNA sequence of the L�-V�Ox1J�5 pre-mRNA transcript is shown in
Fig. 1. The primary aligned DNA sequence data of mutated derivatives
of the L�-V�Ox1 passenger transgene analysed in Milstein et al. [45]
was provided by C. Rada and M.S. Neuberger of the MRC Laboratory
Molecular Biology, Cambridge, UK. These data were supplemented by
that published in Gonzalez-Fernandez and Milstein [46]. Summaries of
these data are shown in Table 1, and the A-to-G and A-to-Y mutation
spectra are shown in Fig. 2.
2.2. Local alignment RNA stem loop algorithm
The 810 nt sequence of the V�Ox1 transgene pre-mRNA transcript was
aligned with its reverse sequence using the local Smith-Waterman
Fig. 1 – DNA sequence of L�-V�Ox1 pre-mRNA transcript. The 81Milstein [46], Rada et al. [52] and the aligned V�Ox1 sequence dasequence is that of the mRNA of V�Ox1 reported in Berek et al. [5transcription start site. Numbers in brackets refer to nucleotide p
0 6 ) 1346–1363
alignment algorithm (http://www-hto.usc.edu/software/seqaln/).
Alignments were computed scoring 1 for G-U, 2 for A-U and 3 for
G-C pairs, −4 for mismatches, −5 for gap-openings and −4 for
gap-extensions, leading to a total of 9,484 aligned stems with scores
≥5 that were stored in a relational data base. We joined all stem
loop structures with all A-sites of V�Ox1 where the A-site occurs
in either the 5′ (5′-A-stem) or the 3′ (3′-A-stem) strand of the stem,
resulting in a set of 10,404 records. The relational data base is in a
excel spread sheet,“Stem loop data set.xls”. A copy of this 3.6 MB
spreadsheet and associated explanatory notes has been deposited
with the DNA Repair editorial office, and is available on request or by
emailing EJS ([email protected]), or GFW (Georg.Weiller@anu.
edu.au).
3. Results
We sought evidence implicating an IgV mRNA template inSHM by investigating whether such an intermediate could bethe target of A-to-I editing and thus contribute to the fre-quent mutations observed at A-T base pairs in Phase II ofSHM in vivo. We examined whether the spectrum of mutation
observed with A-to-I RNA editing, i.e. elevated A-to-G muta-tions especially at WA-sites that form part of dsRNA struc-tures, resembles the spectrum of mutation observed duringSMH. Our basic assumption is that the likelihood of a region0 nt sequence assembled from Gonzalez-Fernandez andta sent by C. Rada 26.11.04 (Milstein et al. [45]). This3] and the J�5-C� intron sequence from Ref. [54]. Tss,osition in the continuous sequence.

d n a r e p a i r 5 ( 2 0 0 6 ) 1346–1363 1349
Fig. 2 – Distribution of A-to-G and A-to-Y Mutations in the V�Ox1 transgene. A-site mutations recorded in the codingsequence of the V�Ox1 passenger transgene assembled from the data reported in Gonzalez-Fernandez and Milstein [46]and in Milstein et al. [45] (see Table 1). The coding sequence for the 94 codons for the V�Ox1 element is as shown in Fig. 1.There are 71 A-sites, in 24 sites the 5′ neighbour is an A or T (termed a WA-site), and, in 47 sites, the 5′ neighbour is a G orC (termed a SA-site). Reading left-to-right the filled ( ) columns show the number of A-to-G (A) or A-to-Y (B) mutations ateach WA-site; open columns ( ) show the number of A-to-G or A-to-Y mutations at each SA-site. The flat oval symbol ( )indicates no A-to-G or A-to-Y mutations observed at that site. WA-sites are located in the following codons (codonnumber.position in codon) 1.3, 2.1, 10.1, 18.2, 28.1, 29.3, 30.1, 31.2, 35.2, 38.2, 44.2, 44.3, 45.1, 48.2, 52.2, 52.3, 70.2, 74.1,80.3, 85.2, 86.2, 92.1, 93.1, 93.2; the SA-sites are at positions 1.2, 5.1, 6.2, 8.3, 9.3, 11.1, 13.3, 15.3,17.2, 18.1, 20.1, 21.1, 22.1,2 .3, 47
to
3T
TvtpnataaaTSa
3
Tbttrmdro3
≥l(
4.1, 26.1, 27.3, 32.1, 33.2, 36.2, 37.2, 38.1, 39.3, 41.1, 44.1, 455.1, 76.1, 77.1, 78.2, 80.2, 84.1, 88.2, 89.2, 91.1, 94.3.
o be double-stranded is proportional to the number of sec-ndary structures it could form.
.1. A-to-G and A-to-Y mutation spectra in the V�Ox1ransgene
he well characterised V�Ox1 passenger transgene [45,46] pro-ides a large comprehensive source of SHM data and we usehese data (Figs. 1 and 2, Table 1) to compare the number ofossible RNA hairpins that can be formed at WA-sites with theumber of A-to-G mutations (diagnostic of A-to-I editing, [40])t these sites. The V�Ox1 coding region analysed for muta-ions contains 71 A-sites (Figs. 1 and 2) comprising 24 WA-sitesnd 47 SA-sites (S = G or C). The mutation data set contains anverage of 4.58 A-to-G mutations per WA-site (standard devi-tion = 2.84) and 1.66 per SA-site (standard deviation = 1.36).his 2.8-fold elevation of A-to-G mutations at WA-sites overA-sites is significant, with a Student’s t-test value of 3.5376nd P < 0.001 for a two-tailed test with 69 degrees of freedom.
.2. Potential RNA stem loop structures in V�Ox1
o examine the potential RNA stem loop structures that coulde formed by the 282 bp region (codons 1–94) of the V�Ox1ransgene, we examined a 810 nucleotide sequence regionhat included 264 nucleotides both before and after the V�Ox1egion (Fig. 1). All potential stem loops (or RNA hairpins) with a
inimum of four base pairs per stem and stem scores ≥5 wereetermined using the local Smith-Waterman alignment algo-ithm (see Section 2.2). When the A-site occurs in the 5′ strandf the stem it is termed a ‘5′-A-stem’ and when it occurs in the′ strand of the stem it is referred to as a ‘3′-A-stem’ (Fig. 3).
Most stem loops fall in the range of stem scores between6 and ≥16 (Fig. 4). Although there is some variability, stem
ength is directly proportional to stem score for both WA-sitesFig. 4A) and SA-sites (Fig. 4B). With respect to the current
7.1, 49.2, 50.1, 50.3, 52.1, 56.3, 62.1, 64.1, 68.1, 73.1, 73.3,
analysis, the biologically significant hairpins most suitable foroptimum A-to-I deamination are likely to be those with stemscores ≥11 since in vitro experiments show ADARs requireabout one turn of the dsRNA helix (∼11–12 bp, [51]).
3.3. Correlation of A-to-G spectrum with stem loops atWA-sites
We then determined the Pearson correlation (r) between theA-to-G mutation frequency (abbreviated as the ‘A-to-G spec-trum’) and the number of potential stem loops for differentstem score thresholds. Given that ADARs deaminate A-to-I preferentially at WA-sites in dsRNA [40,51] we analysedthe data for WA-sites and SA-sites separately. We initiallyincluded all stem structures without restricting the distance(loop length) between the upstream and downstream partnerstrands. For stems involving WA-sites a statistically significantcorrelation (P < 0.02) is observed between the A-to-G spectrum(Fig. 2) and the frequency distribution of stems with scores of≥12 (Fig. 5A). Similar significant correlations (P < 0.02) are evi-dent also for stem score thresholds ≥9, ≥10 and ≥11 (Fig. 6A).A similar analysis for SA-sites yielded no significant corre-lations (Fig. 7 and data not shown). In addition, the A-to-Ymutation spectrum (Fig. 2B) at both WA- and SA-sites does notcorrelate with stem frequencies at any stem score threshold(Figs. 6B, 8 and 9).
We then investigated whether significant correlations withthe A-to-G spectrum at WA-sites exist with the 5′-A-stem orthe 3′-A-stem. If only 3′-A-stems are considered this correla-tion improves (Fig. 5C). There is no correlation for 5′-A-stems(Fig. 5B). This striking pattern of improved r-values for 3′-A-stems of unrestricted loop length is consistent across the
range of stem score thresholds from ≥5 to ≥16 (Fig. 6A) and isclearly specific for the A-to-G spectrum and not for the A-to-Y spectrum (Fig. 6B). Indeed the r-values approach or exceedthe critical P-value cut-off of 0.002 for 3′-A-stems at stem score
1350 d n a r e p a i r 5 ( 2 0 0 6 ) 1346–1363
Fig. 3 – Examples of stem loops at a WA-site. These are taken from WA-site at A position 541 in codon 93 (Fig. 1). Stem score≥12 and loop length ≤50 nt. A and U base pairing complements highlighted in bold red. These structures are examples onlyand they are not necessarily representative of the numerous potential stem loops in the data base (e.g. see Fig. 4). (Forinterpretation of the references to colour in this figure legend, the reader is referred to the web version of the article.)

d n a r e p a i r 5 ( 2 0 0 6 ) 1346–1363 1351
Fig. 4 – Distribution of stem number and average stem length as a function of stem score for WA-sites and SA-sites inV�Ox1 (A) WA-sites. Top: The number of stem loops at each stem score from 5 to 47. Bottom: Average stem length at eachcorresponding stem score from 5 to 47. Filled columns, 3′-A-stems; open columns, 5′-A-stems. (B) SA-sites. Top: Then m: A5 s.
titi
3a
Ws
umber of stem loops at each stem score from 5 to 47. Bottoto 47. Filled columns, 3′-A-stems; open columns, 5′-A-stem
hresholds ≥9, ≥10 and ≥11 (Fig. 6A). The systematic increasen r-values for 3′-A-stems versus all A-stems strongly suggestshat the 5′-A-stems contribute negatively to the overall signif-cant correlation found at WA-sites.
.4. A-to-G spectrum correlates with nascent hairpinst WA-sites
e then considered the components contributing to thistrong positive correlation. The 5′ to 3′ polarity with respect
verage stem length at each corresponding stem score from
to the position of the A nucleotide suggests an associa-tion with transcription. Indeed ADAR1 is known to physi-cally associate with the RNA polymerase complex bindingthe left-handed Z-DNA conformation which forms behindthe moving RNA polymerase and presumably allows ADAR1to target nascent double-stranded Z-RNA [55,56] prior to
splicing of the pre-mRNA [41,42]. Biologically relevant stemstructures may therefore include mRNA hairpins recentlyemergent from the transcription bubble. Two contributingsources of stem loop structures at WA-sites were then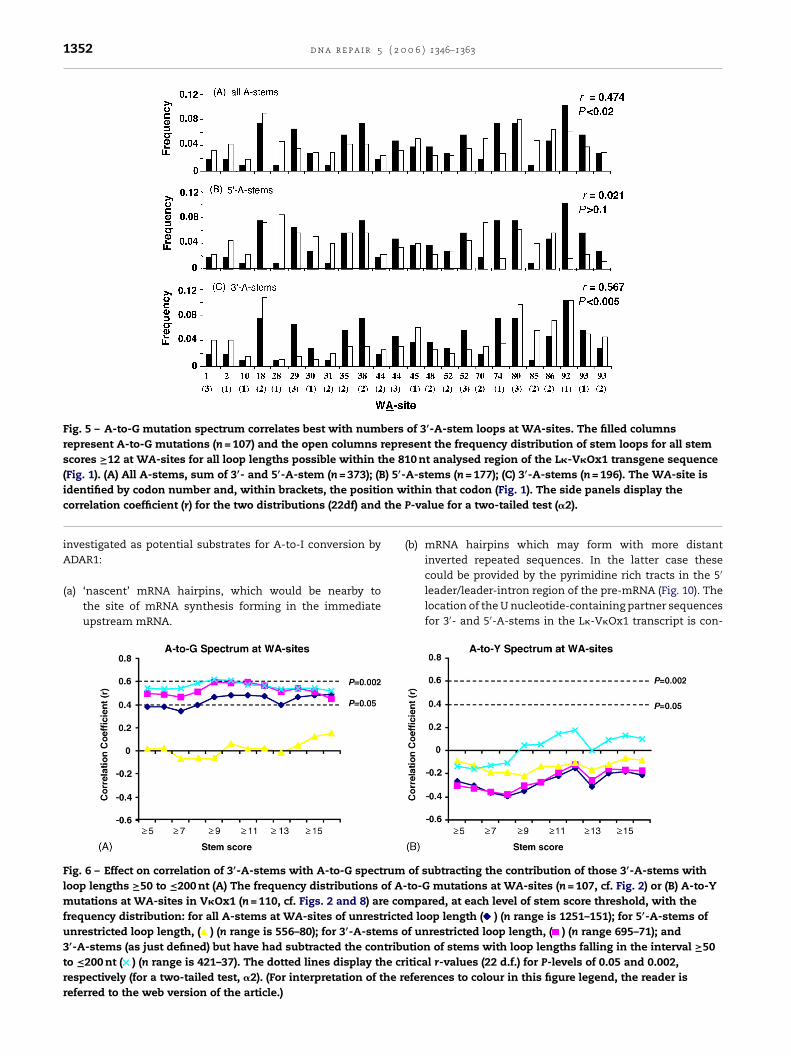
1352 d n a r e p a i r 5 ( 2 0 0 6 ) 1346–1363
Fig. 5 – A-to-G mutation spectrum correlates best with numbers of 3′-A-stem loops at WA-sites. The filled columnsrepresent A-to-G mutations (n = 107) and the open columns represent the frequency distribution of stem loops for all stemscores ≥12 at WA-sites for all loop lengths possible within the 810 nt analysed region of the L�-V�Ox1 transgene sequence(Fig. 1). (A) All A-stems, sum of 3′- and 5′-A-stem (n = 373); (B) 5′-A-stems (n = 177); (C) 3′-A-stems (n = 196). The WA-site is
n wthe
identified by codon number and, within brackets, the positiocorrelation coefficient (r) for the two distributions (22df) and
investigated as potential substrates for A-to-I conversion byADAR1:
(a) ‘nascent’ mRNA hairpins, which would be nearby tothe site of mRNA synthesis forming in the immediateupstream mRNA.
Fig. 6 – Effect on correlation of 3′-A-stems with A-to-G spectrumloop lengths ≥50 to ≤200 nt (A) The frequency distributions of A-mutations at WA-sites in V�Ox1 (n = 110, cf. Figs. 2 and 8) are comfrequency distribution: for all A-stems at WA-sites of unrestricteunrestricted loop length, ( ) (n range is 556–80); for 3′-A-stems o3′-A-stems (as just defined) but have had subtracted the contributo ≤200 nt ( ) (n range is 421–37). The dotted lines display the crrespectively (for a two-tailed test, �2). (For interpretation of the rereferred to the web version of the article.)
ithin that codon (Fig. 1). The side panels display theP-value for a two-tailed test (�2).
(b) mRNA hairpins which may form with more distantinverted repeated sequences. In the latter case these
could be provided by the pyrimidine rich tracts in the 5′leader/leader-intron region of the pre-mRNA (Fig. 10). Thelocation of the U nucleotide-containing partner sequencesfor 3′- and 5′-A-stems in the L�-V�Ox1 transcript is con-
of subtracting the contribution of those 3′-A-stems withto-G mutations at WA-sites (n = 107, cf. Fig. 2) or (B) A-to-Y
pared, at each level of stem score threshold, with thed loop length ( ) (n range is 1251–151); for 5′-A-stems off unrestricted loop length, ( ) (n range 695–71); andtion of stems with loop lengths falling in the interval ≥50
itical r-values (22 d.f.) for P-levels of 0.05 and 0.002,ferences to colour in this figure legend, the reader is

d n a r e p a i r 5 ( 2 0 0 6 ) 1346–1363 1353
Fig. 7 – A-to-G spectrum does not correlate with the frequency distribution of stem loops at SA-sites. The filled columnsrepresent A-to-G mutation frequencies (n = 78) and the open columns represent the frequencies of stem loops with scores≥12 at SA-sites for all loop lengths possible within the 810 nt analysed region of the L�-V�Ox1 transgene sequence (Fig. 1).(A) All A-stems (n = 930); (B) 5′-A-stems (n = 453); (C) 3′-A-stems (n = 477). The codon number and position within that codonof each of the 47 SA-sites is listed in the legend of Fig. 2. The side panels display the correlation coefficient (r) for the twod 2).
p
Fr≥(pt
istributions (45 d.f.) and the P-value for a two-tailed test (�
sistent with this picture: the 5′ leader/leader-V intronprovides 30–40%, the V region provides 20–30% and thepolypyrimidine tracts in the immediate downstream J-Cintron provide 20–30% of potential U-partner sequences
(Fig. 10).We first looked at the contribution of nascent mRNA hair-ins close to the site of mRNA synthesis. We searched the stem
ig. 8 – A-to-Y mutation spectrum does not correlate with the freepresent A-to-Y mutation frequencies (n = 110) and the open col12 at WA-sites for all loop lengths possible within the 810 nt an
A) All A-stems (n = 373); (B) 5′-A-stems (n = 177) and (C) 3′-A-stemosition within that codon (Fig. 1). The side panels display the cohe P-value for a two-tailed test (�2).
loop data base by increasing stem score from ≥5 to ≥16 anddecreasing stem loop length from ≤200 nt down to ≤25 nt. Wethen determined the correlation coefficients for the compari-son of the frequency of A-to-G (or A-to-Y) mutations with RNA
hairpin frequency for each category of stem score and looplength for both WA- and SA-sites (Fig. 11).Note that analyses involving possible associations ofnascent mRNA hairpin frequency with A-to-Y frequency at
quency of stem loops at WA-sites. The filled columnsumns represent the frequencies of stem loops with scoresalysed region of the L�-V�Ox1 transgene sequence (Fig. 1).s (n = 196). The WA-site is identified by codon number andrrelation coefficient (r) for the two distributions (22 d.f.) and

1354 d n a r e p a i r 5 ( 2 0 0 6 ) 1346–1363
Fig. 9 – A-to-Y spectrum does not correlate with the frequency distribution of stem loops at SA-sites. The filled columnsrepresent A-to-Y mutation frequencies (n = 96) and the open columns represent the frequencies of stem loops with scores≥12 at SA-sitesfor all loop lengths possible within the 810 nt analysed region of the L�-V�Ox1 transgene sequence (Fig. 1).(A) All A-stems (n = 930); (B) 5′-A-stems (n = 453) and (C) 3′-A-stems (n = 477). The codon number and position within that
. 2. Tst (�2
codon of each of the 47 SA-sites is listed in the legend to Figtwo distributions (45 d.f.) and the P-value for a two-tailed te
WA-sites gave, with one exception of borderline significance,r-values below the critical Pa2 level of P = 0.05 (Fig. 11B) asdid r-values for similar analyses at SA-sites for both A-to-G
and A-to-Y frequency distributions (Fig. 11C and D). In con-trast, high correlation coefficients with r-values approachingor exceeding the critical Pa2 cut-off value of 0.002, were notedfor comparisons of the A-to-G spectrum at WA-sites, and theFig. 10 – The location of the U nucleotide-containing stem partnetransgene. The U nucleotide-containing stem partner sequencesaccording to their sequence location. Stem loops for all loop lengV�Ox1 transgene and the regions are as in Fig. 1, viz. tss-ATG5′ uunspliced leader; 5′-uspl L, the codons of the unspliced 5′ leaderunspliced leader piece; 5′ in V, the U-stem is located upstream oV, the U-stem is located downstream of the A-complement withidownstream in J�5 element; and J-C intron, the U-stem is locatedcolumns indicate stem loop frequencies for WA-sites; open columscore threshold set at ≥8, giving 941 stem loops for WA-sites andset at ≥12, giving 373 stem loops for WA-sites and 930 stem loop
he side panels display the correlation coefficient (r) for the).
corresponding frequency distribution of mRNA hairpins withloop lengths ≤50 nt and stem score thresholds ≥10 to ≥16(Fig. 11A). It is clear from this figure there are many other
comparisons within the stem score range which also gen-erate statistically significant r-values. For hairpins with veryshort loop lengths (≤25 nt) the r-values only become statis-tically significant at stem scores ≥14. For accumulated stemr sequences for 3′- and 5′-A-stems in the L�-V�Ox1(U-stem) in the L�-V�Ox1 sequence analysed are groupedths possible within the 810 nt analysed region of thespl L, from transcription start site to the first ATG of the 5′
; L-V intron, the leader intron; 3′-uspl L, codons of the 3′
f the A-complement within the codons of the V region; 3′ inn the codons of the V region; J�5, the U-stem is located
within 225 nt downstream of the J�5 element. Filledns indicate stem loop frequencies for SA-sites. In (A) stem1995 stem loops for SA-sites. In (B) stem score threshold
s for SA-sites.

d n a r e p a i r 5 ( 2 0 0 6 ) 1346–1363 1355
Fig. 11 – A-to-G mutation spectrum correlates with nascent mRNA hairpins at WA-sites in V�Ox1. The frequencies of A-to-Gand A-to-Y mutations at WA-sites and SA-sites are compared to the frequency of mRNA hairpins for various thresholds ofstem score and loop length and the Pearson correlation coefficients (r) are given. The total number of A-to-G and A-to-Ymutations are: A, n = 1 07; B, n = 110; C, n = 78; D, n = 96. The r-values for each comparison are plotted against the stem scorethreshold as indicated for panels A to D. The colour key for the loop lengths is shown below. Horizontal broken lines arecritical r-values for statistical significance as indicated for 22 degrees of freedom (WA-sites A and B) and 45 degrees offreedom (SA-sites C and D). Total stem loop numbers (n) for each distribution are tabulated in Table 2. ( ) Lp Len ≤ 25 nt; ( )L Lent f the
lrt
ltpnswTsrso
fdarsbs
p Len ≤ 50 nt; ( ) Lp Len ≤ 100 nt; ( ) Lp Len ≤ 150 nt; ( ) Lphis figure legend, the reader is referred to the web version o
oop numbers up to and including loop lengths of 200 nt the-values are of borderline significance (P ≤ 0.05) at stem scorehresholds ≥14 and ≥15.
The lower degree of correlation for hairpins with loopength ≤25 nt may be due to the smaller number analysed inhis group (Table 2). This cannot be the explanation for theoor correlation for hairpins with loop lengths ≤200 nt as theumber for most comparisons is at least ≥100 (Table 2). Iteems likely that the lower degree of correlation for hairpinsith loop lengths ≤25 nt is because the n-value is too small.hus, if the hairpins in this category are deducted at each WA-ite from those counted for loop lengths ≤50 to ≤125 nt, the-values systematically decline suggesting that the stems withhorter loop lengths contribute to the significant correlationbserved (data not shown).
We then investigated if the 5′-to-3′ polarity, noted earlieror stems with loops of unrestricted length (Fig. 5), was evi-ent in the nascent hairpin data (Fig. 11A). Nascent 3′-A-stemsnd nascent 5′-A-stems both contribute to the significant cor-
elation observed at WA-sites (Fig. 11A). This is shown by theystematic lowering of r-values in all cases and variable contri-utions of each type to the overall correlation across the stemcore range examined, ≥5 to ≥16 (Fig. 12). At higher stem score≤ 200 nt. (For interpretation of the references to colour inarticle.)
thresholds there could be a stronger correlation signal for 3′-A-stems over 5′-A-stems in some cases (loop lengths ≤50 to≤100 nt, Fig. 12) but nothing as dramatic as observed for theunrestricted loop length data (Figs. 5 and 6).
3.5. Correlation of A-to-G mutations with hairpinswith long loops
We next investigated the contribution of stem loops thatmight involve at least one stem partner at some distancefrom the site of mRNA synthesis. It has already been estab-lished that 5′-A-stems of unrestricted loop length do not cor-relate with the A-to-G spectrum (Fig. 5B). This implies thatstems that form with the pyrimidine rich tracts in the imme-diate downstream J-C intron (Fig. 10) do not contribute tothe significant correlation with the A-to-G mutation spec-trum. We therefore determined the r-values for the numbersof potential 3′-A-stems with loop lengths of increasing size≥50, ≥100 and ≥200 nt. From Fig. 13 it is clear that in all
categories of stem score threshold a significant correlationsignal is associated with 3′-A-stems which is always greaterthan the r-values for all A-stems (5′- + 3′-A-stems). In all casesthere is no correlation with 5′-A-stems (Fig. 13), and the all A-
1356 d n a r e p a i r 5 ( 2 0 0 6 ) 1346–1363
Table 2 – Stem loop n-values for WA-sites and SA-sites
Stem Lp Len ≤ 25 nt Lp Len ≤ 50 nt Lp Len ≤ 100 nt Lp Len ≤ 150 nt Lp Len ≤ 200 nt
Score All 5′ 3′ All 5′ 3′ All 5′ 3′ All 5′ 3′ All 5′ 3′
WA-sites—Fig. 11A and B≥5 87 36 51 127 56 71 273 128 144 426 187 239 602 258 344≥6 84 34 50 122 52 70 264 123 141 417 181 236 592 251 341≥7 77 31 46 114 49 65 244 110 134 388 166 222 548 230 318≥8 75 30 45 102 45 57 205 92 113 335 141 194 465 194 271≥9 69 28 41 95 43 52 176 80 96 272 117 155 378 163 215
≥10 59 23 36 84 38 46 148 66 82 232 98 134 317 136 181≥11 53 21 32 78 36 42 126 56 70 192 78 114 259 108 151≥12 48 18 30 72 33 39 108 46 62 163 68 95 216 96 120≥13 37 13 24 56 25 31 86 36 50 128 53 75 178 79 99≥14 30 11 19 48 23 25 69 30 39 101 42 59 146 67 79≥15 23 9 14 38 19 19 54 25 29 83 35 48 115 52 63≥16 18 7 11 31 15 16 45 20 25 70 30 40 96 46 50
SA-sites—Fig. 11C and D≥5 198 87 111 303 150 153 632 305 327 983 467 516 1305 629 676≥6 196 87 109 301 150 151 624 301 323 967 457 510 1277 613 664≥7 187 81 106 284 138 146 584 275 309 900 419 481 1197 570 627≥8 174 71 103 261 124 137 528 244 284 809 370 439 1065 503 562≥9 167 68 99 251 119 132 493 227 266 727 334 393 947 454 493
≥10 145 59 86 217 102 115 423 193 230 621 281 340 812 384 428≥11 131 52 79 189 89 100 357 161 196 520 228 292 679 314 365≥12 119 47 72 173 81 92 308 139 169 442 197 245 581 276 305≥13 95 38 57 134 65 69 249 118 131 359 166 193 480 233 247≥14 78 33 45 110 54 56 199 95 104 289 135 154 399 198 201
≥15 61 27 34 89 47 42 165 8≥16 55 24 31 79 40 39 143 7Fig. 12 – Correlation of A-to-G spectrum at WA sites and stem loand 3′-A-stems. The dotted lines display the critical r-values (22tailed test, �2). n-Values in Table 2 and Fig. 11. All A-stems ( ); 5references to colour in this figure legend, the reader is referred to
5 80 247 121 126 325 168 1571 72 205 103 102 274 146 128
ops with decreasing loop size for all A-stems, 5′-A-stems,d.f.) for P-levels of 0.05 and 0.002, respectively (for a two′-A-stems ( ); 3′-A-stems ( ). (For interpretation of thethe web version of the article.)
d n a r e p a i r 5 ( 2 0 0 6 ) 1346–1363 1357
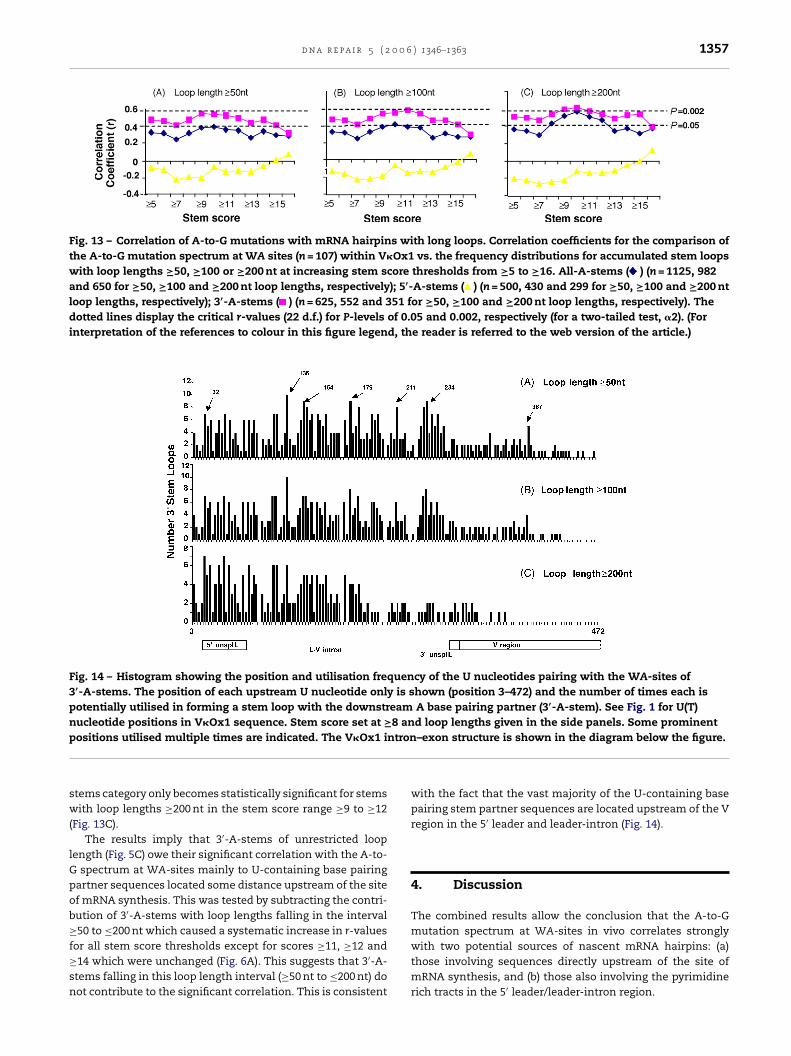
Fig. 13 – Correlation of A-to-G mutations with mRNA hairpins with long loops. Correlation coefficients for the comparison ofthe A-to-G mutation spectrum at WA sites (n = 107) within V�Ox1 vs. the frequency distributions for accumulated stem loopswith loop lengths ≥50, ≥100 or ≥200 nt at increasing stem score thresholds from ≥5 to ≥16. All-A-stems ( ) (n = 1125, 982and 650 for ≥50, ≥100 and ≥200 nt loop lengths, respectively); 5′-A-stems ( ) (n = 500, 430 and 299 for ≥50, ≥100 and ≥200 ntloop lengths, respectively); 3′-A-stems ( ) (n = 625, 552 and 351 for ≥50, ≥100 and ≥200 nt loop lengths, respectively). Thedotted lines display the critical r-values (22 d.f.) for P-levels of 0.05 and 0.002, respectively (for a two-tailed test, �2). (Forinterpretation of the references to colour in this figure legend, the reader is referred to the web version of the article.)
Fig. 14 – Histogram showing the position and utilisation frequency of the U nucleotides pairing with the WA-sites of3′-A-stems. The position of each upstream U nucleotide only is shown (position 3–472) and the number of times each ispotentially utilised in forming a stem loop with the downstream A base pairing partner (3′-A-stem). See Fig. 1 for U(T)nucleotide positions in V�Ox1 sequence. Stem score set at ≥8 and loop lengths given in the side panels. Some prominentp ntron
sw(
lGpob≥f≥sn
ositions utilised multiple times are indicated. The V�Ox1 i
tems category only becomes statistically significant for stemsith loop lengths ≥200 nt in the stem score range ≥9 to ≥12
Fig. 13C).The results imply that 3′-A-stems of unrestricted loop
ength (Fig. 5C) owe their significant correlation with the A-to-spectrum at WA-sites mainly to U-containing base pairing
artner sequences located some distance upstream of the sitef mRNA synthesis. This was tested by subtracting the contri-ution of 3′-A-stems with loop lengths falling in the interval50 to ≤200 nt which caused a systematic increase in r-values
or all stem score thresholds except for scores ≥11, ≥12 and14 which were unchanged (Fig. 6A). This suggests that 3′-A-tems falling in this loop length interval (≥50 nt to ≤200 nt) doot contribute to the significant correlation. This is consistent
–exon structure is shown in the diagram below the figure.
with the fact that the vast majority of the U-containing basepairing stem partner sequences are located upstream of the Vregion in the 5′ leader and leader-intron (Fig. 14).
4. Discussion
The combined results allow the conclusion that the A-to-Gmutation spectrum at WA-sites in vivo correlates strongly
with two potential sources of nascent mRNA hairpins: (a)those involving sequences directly upstream of the site ofmRNA synthesis, and (b) those also involving the pyrimidinerich tracts in the 5′ leader/leader-intron region.
1358 d n a r e p a i r 5 ( 2 0 0 6 ) 1346–1363
Fig. 15 – Transcription-coupled DNA and RNA deamination and reverse transcription as an explanation of somatichypermutation. See text for discussion and references of the respective roles of AID, MSH2-MSH6, Pol �, RPA, andtranscription-coupled �INF-ADAR1 mediated A-to-I pre-mRNA editing. The RNA Polymerase II complex copies thetranscribed strand (TS) recruiting RPA, AID, MSH2-MSH6, Pol � and ADAR1. AID deaminates C-to-U (looping orange arrow)on both DNA strands with possibly a slight preference in vivo for the NTS. ADAR1 deaminates emerging A nucleotides(looping green arrow) in the nascent pre-mRNA to inosine (A-to-I) in the context of both an imperfect dsRNA and a WAmotif corresponding to WA-site mutation hotspots. Thus, AID deamination leads to C-G mutational targeting at WRCY sites(Phase I) and ADAR1 deamination subsequently leads to A-T mutational targeting at WA sites in DNA following error-pronereverse transcription by Pol-� to produce the cDNA copy of the TS (Phase II). The RNA Polymerase II may be stalled bynascent RNA hairpin formation [57] and/or by G-U mispair-MSH2-MSH6-Pol-� complexes and two general pathways of“Transcription-Coupled Mutagenesis” could then occur. First, the DNA-based pathway, where deoxyuracil excision andshort-patch error-prone DNA-dependant DNA repair of the TS by translesion DNA repair enzymes which would includePol-� and the recently reported mutational role targeting C-G for DNA Pol-�. Second, an RNA-based pathway wherefollowing dU removal an endonuclease activity associated with the MSH2-MSH6 complex (Exonuclease 1) could create assDNA nick on the TS exposing a 3′-OH which together with the nascent pre-mRNA template allows RT-Pol-� to be primedinitiating reverse transcription of the Inosine-containing pre-mRNA template and synthesis of the TS (other scenarios forRT priming are also possible, [38,44,58]). It has not escaped our notice that features of this process are similar to the
singis d
proposed role of nascent RNA secondary structures and pauhowever our interpretation of the totality of the current data
A schematic model consistent with the data reportedherein is shown in Fig. 15. We propose an updated RT-modelof SHM involving the three main molecular players to explainsomatic hypermutation of rearranged Ig genes: AID, Pol-� andthe interferon-inducible (�IFN) isoform of the mammalianRNA adenosine deaminase ADAR1 [60,61] together generatingmutations at C-G and A-T base pairs. In this model �IFN-ADAR1 is physically associated with the RNA Pol II transcrip-tion complex [41,42] as shown, and deaminates A-to-I withintransient and imperfectly paired dsRNA stem substrates innewly synthesised mRNA in the nucleus. This model is consis-tent with the recent demonstration that Pol-� is a reverse tran-scriptase [38] together with two other recently reported find-
ings: (a) the tight physical and functional interaction betweenMSH2-MSH6 and Pol-� most likely at AID-generated G-U mis-pairs [31], and (b) the complete loss of A-T targeted mutationsin UNG−/− MSH2−/− double-deficient mice [23].of RNA polymerase during transcription Storb et al. [59],ifferent to these authors.
We speculate that ADAR1 acts on the WA-site closest to thetranscription bubble and therefore the A-stem partner has tobe previously synthesised. This explains the preference of 3′-A-stems over 5′-A-stems (Figs. 5, 6 and 12). High scoring stemswith small loops are preferred (Figs. 11 and 12). An exceptionis that for 5′-A-stems formed in the immediate vicinity of thetranscription bubble allowing only for short loops and stems(low scoring, Fig. 12). A second exception is that hairpins canbe formed using the U-rich region in the leader/leader-intronas the upstream stem partner regardless of the length of theloop (Fig. 14). It is therefore possible that these 5′ sequenceshave evolved specifically to increase the frequency of SHM.If so then the recently described transcript tethering mecha-
nisms utilised by RNA Polymerase II [62] might be necessary tobring these U-rich regions close to the site of mRNA synthesisto allow rapid RNA duplex formation with WA-sites recentlyemergent from the transcription bubble.
0 0 6
slwcsWfmkpcRs
bVtmsaIctrtbAud
RoaDbaeSbspten
d n a r e p a i r 5 ( 2
Taken together, the results in this paper fit the hypothe-ised RNA editing-coupled-reverse transcription model out-ined in Fig. 15. We are not aware of any other molecular modelhich can easily accommodate the data reported herein. We
onclude that A-to-G mutations (and not A-to-Y mutations)trongly correlate with potential nascent mRNA hairpins at
A hotspots. This provides evidence consistent with a roleor A-to-I pre-mRNA editing, and thus a mRNA template inter-
ediate, in SHM. A role for an RNA intermediate in SHM is aey and obligatory prediction of the RT-model originally pro-osed by Steele and Pollard in 1987 [36]. Other observationsonsistent with this up-dated RT-model, as well as proposedT-priming mechanisms at 3′-OH DNA ends in the transcribedtrand, are discussed elsewhere [38,43,44,58].
Recently reported data on the versatile homologous recom-ination promoting properties of Pol-� [63] both in the chickenpseudogene gene conversion program in DT40 cells [64] and
he promotion of DNA synthesis from strand invasion inter-ediates for homologous recombination in the human XP-V
ystem [65] are entirely consistent with the RT-priming mech-nisms proposed for Pol-� during Phase II SHM [38,43,44,58].ndeed we published earlier an analysis of the chicken geneonversion process and concluded that the quantitative fea-ures of the non-random gene conversion pattern at the rear-anged chicken light chain Ig locus is compatible with “reverseranscription to produce cDNA from RNA transcripts followedy homologous recombination into chromosomal DNA” [66].t the time we felt that our conclusions unified at the molec-lar level what had hitherto been considered as two entirelyifferent gene diversification processes.
The RNA-based mutation pathway predicted under theT-model for SHM does not have to be mutually exclusivef a DNA-based mutational pathway as both could conceiv-bly operate during a hypermutation episode in vivo. TheNA-based error-prone repair mechanism for Pol-� proposedy Gearhart and colleagues is consistent with available datand no doubt occurs in vivo [31,32]. The question is to whatxtent does the proposed RNA-based pathway impact on theHM mutation patterns observed in vivo? If the results of theioinformatics analyses reported herein are to be believed ituggests that this impact is significant, particularly for the
rominent A-to-G component of the SHM mutation spec-rum. However, the RNA-based mutation pathway can alsoconomically explain a number of other key in vivo SHM phe-omena such as A � T mutational strand bias [43,67] as wellTable 3 – The pattern of A-site mutations generated in V�Ox1 dPol-� copying V�Ox1 in vitro
A-to-G
A-site mutationV�Ox1 in vivoa 185 (47.3%)V�Ox1 Pol-� in vitrob (DNA template) 382 (64.4%)
Chi-square 28.64 for 2 d.f. gives P < 0.001.a The in vivo data for the V�Ox1 transgene assembled from Gonzalez-Fernb The in vitro generated DNA Pol-� mutation data shown as the sum of th
strands, respectively, appropriately corrected by a factor of 1.22 for lowpercentage is shown in brackets. Additional factors other than short patargeted Phase II SHM.
) 1346–1363 1359
as mutational strand balance at C-G base pairs [43,44] whichthe mainstream DNA-based model cannot easily explain [67].Moreover the precise location of the 5′ boundary of mutationwithin the leader intron of the V�Ox1 transgene is consistentwith an RT mechanism as it coincides with a pyrimidine-richtract likely to allow binding of the splicing-associated proteinU2AF that may block RT progression further upstream to thetranscription start site [68].
The DNA-based mutation pathway requires that the shortpatch error-prone mechanism be strand biased. DNA poly-merase � has been shown to result in a biased A-site mutationspectrum, broadly similar to the in vivo pattern, when copy-ing V�Ox1 DNA templates in vitro, particularly the synthesisof the NTS using the TS as a template [26]. It was concludedthat strand bias relies on the intrinsic sequence features of theTS which serves as the template Pol-� for short patch error-prone synthesis to produce the NTS since Pol-� is known topreferentially misinsert dG opposite template dT in vitro [26](an interpretation which has attracted sound criticism [67]).However, a comparative analysis of the primary data of A-sitemutations in the mouse V�Ox1 passenger transgene in vivo[45,46] with the Pol-� driven A-site mutation pattern off V�Ox1DNA templates in vitro [26] reveals that the ratio in vivo ofA-to-G transitions versus A-to-Y transversions is significantlylower than that seen in vitro suggesting that additional factorsother than short patch error-prone DNA repair are involved inA-T targeted Phase II SHM in vivo (Table 3). In our opinion theRNA editing and reverse transcription processes outlined hereare just some of the additional factors we consider are oper-ating in vivo. For example, two hypothetical processes cometo mind: (a) AID-deaminations causing C-to-U in the cDNAbecause of RNase action degrading the predicted RNA: cDNAhybrid – analogous to APOBEC3G action during the replicationcycle of HIV-1 [69] – would lead to C-to-U lesions occurringin both NTS and TS strands [44] without the need to invokea role for supercoiling of DNA to explain C-to-U deaminationon the TS [15,16]; and (b) an unstable RNA: cDNA intermedi-ate allowing such C-to-U deaminations could also reverse, andthus compensate for, the potential mutagenic action of A-to-Iediting events at the mRNA level.
A criticism often made of the RT-model of SHM is that
it is unnecessarily complex and that the simplest explana-tion involves AID action coupled with active transcription andthen mutagenic repair by DNA pol-� copying DNA templates(the ‘mainstream model’). A critical analysis of current data byuring SHM in vivo differs from the pattern generated by
A-to-T A-to-C Total
128 (32.7%) 78 (19.9%) 391135 (22.8%) 76 (12.8%) 593
andez and Milstein [46] and Milstein et al. [45] (and Table 1).e synthesis of the V�Ox1 non-transcribed (NTS) and transcribed (TS)er total base substitutions for sTS (Table 2 in Pavlov et al. [26]). Thetch error-prone repair by Pol-� appear to be involved in vivo in A-T

( 2 0
1360 d n a r e p a i r 5Franklin and Blanden shows that this model does not explainthe many molecular features of SHM and leaves the dooropen for serous consideration of RNA-dependent DNA syn-thesis as essential to the mechanism of A-T targeted Phase II[67].
The novel mechanism proposed by Neuberger et al. invok-ing dUTP incorporation [35] may contribute to some mutationat A-T pairs in vivo. The main difficulty with the proposal beinga major in vivo mechanism is conceiving how it might explainthe strand bias of A-site mutations over those at T nucleotides[30,67] as well as the precise location of the 5′ boundary ofmutation within the leader intron of the V�Ox1 transgene [68].
A general fact consistent with the findings reported hereinis that A-to-I editing is widespread in mouse lymphocyte totalmRNA and human transcriptome (cDNA) libraries [39,49,50].However, apart from a few well characterised genes wherethe A target and sequence context has been clearly identi-fied [40] very few of the in vivo edited A-sites, estimated in thethousands, have been identified. Further, it is unclear to whatextent the A-to-I events in vivo are mediated exclusively byADAR1 or ADAR2 or a combination of both [72], and whetherthe rules for 5′ nearest neighbour preferences for ADARs estab-lished on stable preformed dsRNA structures in vitro [51] reallyapply to various dynamic contexts in situ within the cell, e.g.during pre-mRNA synthesis as envisaged in the present study.We have assumed that the WA preference over SA sites inimperfect RNA duplex structures is a reasonable and wellestablished analytical criterion on which to base our analyses.This assumption is supported by the results of the WA-sitespreferentially deaminated in vivo by ADAR1 and ADAR2 withinthe imperfect RNA duplex of the foldback ADAR2 transcript[72]. In the Lehmann and Bass study [51] the average efficiencyof deamination (expressed as % deaminated) of adenosinesdetermined in vitro for UA, AA, CA and GA is 32, 27, 13 and9% deaminated, respectively (Table 1 in Ref. [51]) showing thaton average WA sites are deaminated 2.7-fold more efficientlythan SA-sites. It is of interest in this regard there is a significant2.8-fold elevation of A-to-G mutations at WA-sites over SA-sites during SHM of the V�Ox1 transgene (cf. Fig. 2 and Section3.1). However, given that deamination efficiency determinedin vitro at CA-sites does exceed that at GA-sites (above andTable 1 in Ref. [51]) we tested for correlations between the A-to-G spectrum in V�Ox1 at CA-sites and GA-sites, respectively,for short loop hairpins with stem scores ≥12. No correlationswere established with r-values approaching zero in both cases(data not shown).
The biological role of A-to-I editing in cell biology is under-scored by the fact that ADAR1 genetic deficiency is a dom-inant embryonic lethal phenotype in mice through disrup-tion of foetal liver erythropoiesis [70,71]. Moreover, humanand mouse ADAR1 exist in either short or long isoformseach transcript initiated by separate promoters [60,61]. Thelong transcript encodes the gamma interferon inducible iso-form (�INF-ADAR1) and the shorter transcript encodes the‘constitutive’ isoform [60,61]. These findings suggest that theinducible variant [61] may well be responsible for the sig-
nificant elevation of inosine-containing RNA in lymphocytesfrom endotoxin-stimulated mice [39]. Further, the data sug-gest that lethal ADAR1 genetic deficiency maybe due to theloss of ‘constitutive’ A-to-I editing essential to gene expres-0 6 ) 1346–1363
sion/regulation in early embryonic development. This is con-sistent with our contention (and below) that genetic deficiencytargeting �INF-ADAR1 may open the way to interesting exper-iments on the role of ADAR1 mediated A-to-I editing duringboth the course of an antigen-induced immune response andsomatic hypermutation in particular (although it is not knownif �INF-ADAR1 expression is elevated in germinal centerB lymphocytes).
Another issue not directly addressed concerns the positionof the WA-site within a stem, as in vitro studies show there isless efficient deamination for WA-sites near the ends of a helix[51]. We are reluctant to directly address this in the presentdata set since reduction of the data into smaller categoriesmakes interpretation of correlation coefficients less reliable asn-values decrease. Moreover, in the study by Dawson et al. [72]the vast majority of the A-sites edited in vivo are preceded 5′ byan A or U, and most of these are within one or two nucleotides(5′ or 3′) of a mismatch, bulge or loop (and some of the A-sitesthemselves are mispaired). So while it is unknown which ofthe numerous potential WA-containing stems we have iden-tified would be optimally deaminated (under the assumptionsof our analysis, Section 3) our treatment at the level of ‘popula-tions of WA-stems’ (of varying stability/length) clearly shows astrong positive correlation with the numbers of A-to-G muta-tions at these WA-sites in imperfect RNA duplex structures.
Deamination efficiency in vitro may not just depend onposition of the adenosine within the helix but also the lengthof the stem as ADARs appear to require at least one turn ofthe helix (or 11–12 base pairs, [51]). However, this is qualifiedby the editing data from the in vivo study by Dawson et al.which shows that the mean length of continuously base pairedregions (terminated by mispairs, bulges and loops) is ∼4 bp[72]. In our analysis the strongest correlations (P ≤ 0.002) withthe A-to-G spectrum at WA-sites are observed for short loopnascent hairpins with stem scores ≥12 to ≥16, or stem lengths≥11 bp (Fig. 11A and see Fig. 4A). Thus, there is good agree-ment between the results of our analyses and the imperfectdsRNA substrate requirements for A-to-I editing establishedby in vitro and in vivo experiments.
A potentially confounding yet interesting interpretativefactor which should be highlighted again is that DNA Pol-� and ADARs are both targeted to a WA motif in DNA ordsRNA substrates. It is conceivable they share evolutionaryrelated antecedent domains. It therefore remains to be deter-mined what the error-spectrum of Pol-� would be when thepolymerase copies from an RNA template, with and with-out inosine conversions, to produce a cDNA. These assaysand direct genetic targeting of pre-mRNA, or relevant pro-teins which act on pre-mRNA (e.g. �INF-ADAR1), are importantnext experiments in developing our understanding of the pre-cise sequence of steps involving reverse transcription in thesomatic hypermutation of IgV genes.
Acknowledgements
We thank Christina Rada and Michael S. Neuberger for gener-ously providing mutant V�Ox1 sequences. We thank Gerald W.Both for critical comments on an early draft of the manuscript,Carolyn Weiller for data entry assistance and support with
0 0
pfte
Isddpmaft
r
d n a r e p a i r 5 ( 2
reparing the final manuscript. We also thank Barry G. Rolfeor his continued encouragement and support. One of us (E.J.S.)hanks John A. Schuster for interesting discussions on the gen-ral implications of the study.
Author contributions: E.J.S. conceived of the idea that A-to-RNA editing plays a role in SHM; conceived the analyticaltrategy to search for the signature of an RNA-edited interme-iate in established SHM data bases; carried out the primaryata assembly and analysis and wrote the first draft of theaper. G.F.W. developed the stem loop data base and provideduch insight into the analytical strategy for mRNA hairpins
nd wrote subsequent drafts of the paper with E.J.S. R.A.L. per-ormed the initial pattern recognition analysis and providedechnical assistance. J.W. provided programming assistance.
e f e r e n c e s
[1] N. Maizels, Immunoglobulin gene diversification, Annu. Rev.Genet. 39 (2005) 23–46.
[2] C. Berek, C. Milstein, Mutation drift and repertoire shift inthe maturation of the immune response, Immunol. Rev. 96(1987) 23–41.
[3] C. Berek, C. Milstein, The dynamic nature of the antibodyrepertoire, Immunol. Rev. 105 (1988) 5–26.
[4] M. Muramatsu, K. Kinoshita, S. Fagarasan, S. Yamada, Y.Shinkai, T. Honjo, Class switch recombination andhypermutation require activation-induced cytidinedeaminase (AID), a potential RNA editing enzyme, Cell 102(2000) 553–563.
[5] P. Revy, T. Muto, Y. Levy, F. Geissmann, A. Plebani, O. Sanal,N. Catalan, M. Forveille, R. Dufourcq-Labelouse, A. Gennery,I. Tezcan, F. Ersoy, H. Kayserili, A.G. Ugazio, N. Brousse, M.Muramatsu, L.D. Notarangelo, K. Kinoshita, T. Honjo, A.Fischer, A. Durandy, Activation-induced cytidine deaminase(AID) deficiency causes the autosomal recessive form of theHyper-IgM syndrome (HIGM2), Cell 102 (2000) 565–575.
[6] V. Poltoratsky, M.F. Goodman, M.D. Scharff, Error-pronecandidates vie for somatic mutation, J. Exp. Med. 192 (2000)F27–F30.
[7] S.K. Petersen-Mahrt, R.S. Harris, M.S. Neuberger, AIDmutates E. coli suggesting a DNA deamination mechanismfor antibody diversification, Nature 418 (2002) 99–104.
[8] J. Di Noia, M.S. Neuberger, Altering the pathway ofimmunoglobulin hypermutation by inhibiting uracil-DNAglycosylase, Nature 419 (2002) 43–48.
[9] R. Bransteitter, P. Pham, M.D. Scharff, M.F. Goodman,Activation-induced cytidine deaminase deaminatesdeoxcytidine on single-stranded DNA but requires the actionof RNase, Proc. Natl. Acad. Sci. U.S.A. 100 (2003) 4102–4107.
[10] A. Sohail, J. Klapacz, M. Samaranayake, A. Ullah, A.S.Bhagwat, Human activation-induced cytidine deaminasecauses transcription dependent, strand-biased C to Udeaminations, Nucleic Acids Res. 31 (2003) 2990–2994.
[11] J. Chaudhuri, M. Tian, C. Khuong, K. Chua, E. Pinaud, F.W.Alt, Transcription-targeted DNA deamination by the AIDantibody diversification enzyme, Nature 422 (2003) 726–730.
[12] S.K. Dickerson, E. Market, E. Besmer, F.N. Papvasiliou, AIDmediates hypermutation by deaminating single strandedDNA, J. Exp. Med. 197 (2003) 1291–1296.
[13] A.R. Ramiro, P. Stavropoulos, M. Jankovic, M.C. Nussenzweig,
Transcription enhances AID-mediated cytidine deaminationby exposing single stranded DNA on the nontemplatestrand, Nat. Immunol. 4 (2003) 452–456.[14] P. Pham, R. Bransteitter, J. Petruska, M.F. Goodman,Processive AID-catalysed cytosine deamination on
6 ) 1346–1363 1361
single-stranded DNA simulates somatic hypermutation,Nature 424 (2003) 103–107.
[15] B.E. Wright, K.H. Schmidt, M.F. Minnick, Mechanisms bywhich transcription can regulate somatic hypermutation,Genes Immun. 5 (2004) 176–182.
[16] H.M. Shen, U. Storb, Activation-induced cytidine deaminase(AID) can target both DNA strands when the DNA issupercoiled, Proc. Natl. Acad. Sci. U.S.A. 101 (2004)12997–13002.
[17] I.B. Rogozin, V.V. Solovyov, N.A. Kolchanov, Somatichypermutagenesis in immunoglobulin genes. I. Correlationbetween somatic mutations and repeats. Somatic mutationproperties and clonal selection, Biochim. Biophys. Acta 1089(1991) 175–182.
[18] A.G. Betz, M.S. Neuberger, C. Milstein, Discriminatingintrinsic and antigen-selected mutational hotspots inimmunoglobulin V genes, Immunol. Today 14 (1993) 405–411.
[19] J. Chaudhuri, C. Khuong, F.W. Alt, Replication protein Ainteracts with AID to promote deamination of somatichypermutation targets, Nature 430 (2004) 992–998.
[20] M. Diaz, C. Lawrence, An update on the role of translesionsynthesis DNA polymerases in Ig hypermutation, TrendsImmunol. 26 (2005) 215–220.
[21] V.M. Barreto, A.R. Ramiro, M.C. Nussenzweig,Activation-induced deaminase: controversies and openquestions, Trends Immunol. 26 (2005) 90–96.
[22] S. Longerich, U. Basu, F. Alt, U. Storb, AID in somatichypermutation and class switch recombination, Curr. Opin.Immunol. 18 (2006) 164–174.
[23] C. Rada, J.M. Di Noia, M.S. Neuberger, Mismatch recognitionand uracil excision provide complementary paths to both Igswitching and the A/T-focused phase of somatic mutation,Mol. Cell 16 (2004) 163–171.
[24] X. Zeng, D.B. Winter, C. Kasmer, K.H. Kraemer, A.R.Lehmann, P.J. Gearhart, DNA polymerase � is an A-Tmutator in somatic hypermutation of immunoglobulinvariable genes, Nat. Immunol. 2 (2001) 537–541.
[25] F. Delbos, A. De Smet, A. Faili, S. Aoufouchi, J.C. Weill, C.-A.Reynaud, Contribution of DNA polymerase eta toimmunoglobulin gene hypermutation in the mouse, J. Exp.Med. 201 (2005) 1191–1196.
[26] Y.I. Pavlov, I.B. Rogozin, A.P. Galkin, A.V. Aksenova, F.Hanaoka, C. Rada, T.A. Kunkel, Correlation of somatichypermutation specificity and A-T base pair substitutionerrors by DNA polymerase � during copying of a mouseimmunoglobulin � light chain transgene, Proc. Natl. Acad.Sci. U.S.A. 99 (2002) 9954–9959.
[27] K. Masuda, R. Ouchida, A. Takeuchi, T. Saito, H. Koseki, K.Kawamura, M. Tagawa, T. Tokuhisa, T. Azuma, J. O-Wang,DNA polymerase � contributes to the generation of C/Gmutations during somatic hypermutation of Ig genes, Proc.Natl. Acad. Sci. U.S.A. 102 (2005) 13986–13991.
[28] H. Zan, N. Shima, Z. Xu, A. Al-Qahtani, Iii.A.J. Evinger, Y.Zhong, J.C. Schimenti, P. Casali, The translesion DNApolymerase � plays a dominant role in immunoglobulingene somatic hypermutation, EMBO J. 24 (2005) 3757–3769.
[29] M.S. Neuberger, J.M. Di Noia, R.C. Beale, G.T. Williams, Z.Yang, C. Rada, The mechanism of somatic hypermutation atA-T pairs remains an open question, Nat. Rev. Immunol.(2005), published online 1 September 2005doi:10.1038/nri1553-c2.
[30] A. Franklin, R.V. Blanden, Somatic hypermutation at A-Tpairs: critical analysis of the dUTP-incorporation model,Nat. Rev. Immunol. (2005), published online 1 September
2005 doi:10.1038/nri1553-c1.[31] T.M. Wilson, A. Vaisman, S.A. Martomo, P. Sullivan, L. Lan, F.Hanaoka, A. Yasui, R. Woodgate, P.J. Gearhart, MSH2-MSH6stimulates DNA polymerase eta, suggesting a role for A:T

(
1362 d n a r e p a i r 5mutations in antibody genes, J. Exp. Med. 201 (2005)637–645.
[32] S.A. Martomo, P.J. Gearhart, Somatic hypermutation:subverted DNA repair, Curr. Opin. Immunol. 18 (2006)243–248.
[33] I.B. Rogozin, Y.I. Pavlov, K. Bebenek, T. Matsuda, T.A. Kunkel,Somatic mutation hotspots correlate with DNA polymeraseeta error spectrum, Nat. Immunol. 2 (2001) 530–536.
[34] S. Brenner, C. Milstein, Origin of antibody variation, Nature211 (1966) 242–243.
[35] M.S. Neuberger, J.M. Di Noia, R.C. Beale, G.T. Williams, Z.Yang, C. Rada, Opinion: somatic hypermutation at A.T pairs:polymerase error versus dUTP incorporation, Nat. Rev.Immunol. 5 (2005) 171–178.
[36] E.J. Steele, J.W. Pollard, Hypothesis: somatic hypermutationby gene conversion via the error prone DNA-to-RNA-to DNAinformation loop, Mol. Immunol. 24 (1987) 667–673.
[37] E.J. Steele, R.V. Blanden, The reverse transcriptase model ofsomatic hypermutation, Philos. Trans. R. Soc. (Series B): Biol.Sci. 356 (2001) 61–66.
[38] A. Franklin, P.J. Milburn, R.V. Blanden, E.J. Steele, HumanDNA polymerase-�, an A-T mutator in somatichypermutation of rearranged immunoglobulin genes, is areverse transcriptase, Immunol. Cell Biol. 82 (2004) 219–225.
[39] J.-H. Yang, X. Luo, Y. Nie, Y. Su, Q. Zhao, K. Kabir, D. Zhang, R.Rabinovici, Widespread inosine-containing mRNA inlymphocytes regulated by ADAR1 in response toinflammation, Immunology 109 (2003) 15–23.
[40] B.L. Bass, RNA editing by adenosine deaminases that act onRNA, Ann. Rev. Biochem. 71 (2002) 817–846.
[41] A. Herbert, J. Alfken, Y.-G. Kim, I.S. Mian, K. Nishikura, A.Rich, A Z-binding domain present in the human editingenzyme, double-stranded RNA adenosine deaminase, Proc.Natl. Acad. Sci. U.S.A. 94 (1997) 8421–8426.
[42] A. Herbert, A. Rich, The role of binding domains for dsRNAand Z-DNA in the in vivo editing of minimal substrates byADAR1, Proc. Natl. Acad. Sci. U.S.A. 98 (2001) 12132–12137.
[43] E.J. Steele, A. Franklin, R.V. Blanden, Genesis of the strandbiased signature in somatic hypermutation of rearrangedimmunoglobulin variable genes, Immunol. Cell Biol. 82(2004) 208–218.
[44] E.J. Steele, DNA Polymerase-� as a reverse transcriptase:implications for mechanisms of hypermutation in innateanti-retroviral defences and antibody SHM systems, DNARep. 3 (2004) 687–692.
[45] C. Milstein, M.S. Neuberger, R. Staden, Both DNA strands ofantibody genes are hypermutation targets, Proc. Natl. Acad.Sci. U.S.A. 95 (1998) 8791–8794.
[46] A. Gonzalez-Fernandez, C. Milstein, Analysis of somatichypermutation in mouse Peyer’s patches usingimmunoglobulin � light-chain transgenes, Proc. Natl. Acad.Sci. U.S.A. 90 (1993) 9862–9866.
[47] S. Maas, A. Rich, K. Nishikura, A-to-I RNA editing: recentnews and residual mysteries, J. Biol. Chem. 278 (2003)1391–1394.
[48] P.H. Seeburg, J. Hartner, Regulation of ionchannel/neurotransmitter receptor function by RNA editing,Curr. Opin. Neurobiol. 13 (2003) 279–283.
[49] E.Y. Levanon, E. Eisenberg, R. Yelin, S. Nemzer, M. Hallegger,R. Shemesh, Z.Y. Fligelman, A. Shoshan, S.R. Pollock, D.Sztybel, M. Olshansky, G. Rechavi, M.F. Jantsch, Systematicidentification of abundant A-to-I editing sites in the humantranscriptome, Nat. Biotechnol. 22 (2004) 1001–1005.
[50] A. Athanasiadis, A. Rich, S. Maas, Widespread A-to-I RNAediting of Alu-containing mRNAs in the human
transcriptome, PLoS Biol. 2 (2004) e391.[51] K.A. Lehmann, B.L. Bass, Double-stranded RNA adenosinedeaminases ADAR1 and ADAR2 have overlappingspecificities, Biochemisty 39 (2000) 12875–12884.
2 0 0 6 ) 1346–1363
[52] C. Rada, A. Gonzalez-Fernandez, J.M. Jarvis, C. Milstein, The5′ boundary of somatic hypermutation in a V� gene is in theleader intron, Eur. J. Immunol. 24 (1994) 1453–1457.
[53] C. Berek, G.M. Griffiths, C. Milstein, Molecular events duringmaturation of the immune response to oxazolone, Nature316 (1985) 412–418.
[54] S.G. Lebecque, P.J. Gearhart, Boundaries of somatic mutationin rearranged immunoglobulin genes: 5′ boundary is nearthe promoter, 3′ boundary is approximately 1 kb from V-D-Jgene, J. Exp. Med. 172 (1990) 1717–1727.
[55] B.A. Brown, K. Lowenhaupt, C.M. Wilbert, E.B. Hanlon, A.Rich, The Z� domain of the editing enzyme dsRNAadenosine deaminase binds left-handed Z-RNA as well asZ-DNA, Proc. Natl. Acad. Sci. U.S.A. 97 (2000) 13532–13536.
[56] M. Koeris, L. Funke, J. Shrestha, A. Rich, Modulation ofADAR1 editing activity by Z-RNA in vitro, Nucleic Acids Res.33 (2005) 5362–5370.
[57] R.A. Mooney, I. Artsinovitch, R. Landick, Informationprocessing by RNA polymerase: recognition of regulatorysignals during RNA chain elongation, J. Bact. 180 (1998)3265–3275.
[58] A. Franklin, R.V. Blanden, On the molecular mechanism ofsomatic hypermutation of rearranged immunoglobulingenes, Immunol. Cell Biol. 82 (2004) 557–567.
[59] U. Storb, E.L. Klotz, J. Hacket, K. Kage, G. Bozek, T.E. Martin, Ahypermutatable insert in an immunoglobulin transgenecontains hotspots of somatic mutation and sequencespredicting highly stable structures in the RNA transcript, J.Exp. Med. 188 (1998) 689–698.
[60] C.X. George, C.E. Samuel, Human RNA-specific adenosinedeaminase ADAR1 transcripts possess alternative exon 1structures that initiate from different promoters, oneconstitutively active and the other interferon inducible,Proc. Natl. Acad. Sci. U.S.A. 96 (1999) 4621–4626.
[61] C.X. George, M.V. Wagner, C.E. Samuel, Expression ofinterferon-inducible RNA adenosine deaminase ADAR1during pathogen infection and mouse embryo developmentinvolves tissue-selective promoter utilization andalternative splicing, J. Biol. Chem. 280 (2005) 15020–15028.
[62] M.J. Dye, N. Gromak, N.J. Proudfoot, Exon tethering intranscription by RNA polymerase II, Mol. Cell. 21 (2006)849–859.
[63] A.J. Rattray, J.N. Strathern, Homologous recombination ispromoted by translesion polymerase Pol �, Mol. Cell 20(2005) 658–659.
[64] T. Kawamoto, K. Araki, E. Sonoda, Y.M. Yamashita, K.Harada, K. Kikuchi, C. Masutani, F. Hanaoka, K. Nozaki, N.Hashimoto, S. Takeda, Dual roles for DNA polymerase eta inhomologous DNA recombination and translesion DNAsynthesis, Mol. Cell 20 (2005) 793–799.
[65] M.J. McIlwraith, A. Vaisman, Y. Liu, E. Fanning, R. Woodgate,S.C. West, Human DNA polymerase eta promotes DNAsynthesis from strand invasion intermediates ofhomologous recombination, Mol. Cell 20 (2005) 783–792.
[66] R.V. Blanden, E.J. Steele, A unifying hypothesis for themolecular mechanism of somatic mutation and geneconversion in rearranged immunoglobulin variable genes,Immunol. Cell Biol. 76 (1998) 288–293.
[67] A. Franklin, R.V. Blanden, A/T-targeted somatichypermutation: critique of the mainstream model, TrendsBiochem. Sci. 31 (2006) 252–258.
[68] R.V. Blanden, A. Franklin, E.J. Steele, The boundaries of thedistribution of somatic hypermutation of rearranged
immunoglobulin variable genes, Immunol. Cell Biol. 82(2004) 205–208.[69] R.S. Harris, K.N. Bishop, A.M. Sheehy, H.M. Craig, S.K.Petersen-Mahrt, I.N. Watt, M.S. Neuberger, M.H. Malin, DNA

0 0 6
d n a r e p a i r 5 ( 2deamination mediates innate immunity to retroviralinfection, Cell 113 (2003) 803–809.
[70] Q. Wang, J. Khillan, P. Gadue, K. Nishikura, Requirement ofthe RNA editing deaminase ADAR1 gene for embryonicerythropoiesis, Science 290 (2000) 1765–1768.
[71] Q. Wang, M. Miyakoda, W. Yang, J. Khillan, D.L. Stachura, M.J.Weiss, K. Nishikura, Stress-induced apoptosis associated
) 1346–1363 1363
with null mutation of ADAR1 RNA editing deaminase gene, J.Biol. Chem. 279 (2004)
4952–4961.[72] T.R. Dawson, C.L. Sansam, R.B. Emeson, Structure andsequence determinants required for the RNA editing ofADAR2 substrates, J. Biol. Chem. 279 (2004)4941–4951.
Copyright © 2022 FDOKUMEN