The Molecular Neurobiology of Twelve Steps Program & Fellowship: Connecting the Dots for Recovery
Upload
independentCategory
view
4download
0
“Connecting the …… dots between economy, demographic trends and current-new property hotspots” REI Group of Companies - Presentation by Dr. Daniele Gambero
“Today we shouldn’t look at tomorrow but at a tomorrow that is 10 years from today”
“Malaysian Economy: Performance 2013 and Outlook 2014”
How Economic Performance Affects the Commercial Property Market:
New Key Trends and Drivers to a Sustainable Market ”

CONSULTANCY - Strategic Marketing - Property Market Surveys - Property Market Reporting - Property Market Analysis - Branding - Creative
- latest information on future
market trends in property development
- insights on developers information, new forthcoming hotspots and proposed infrastructures
Gambero Property Market Intelligence (Gambero PMI) - access updated information & data on both Regional
& Local economic indicators
…………What we do

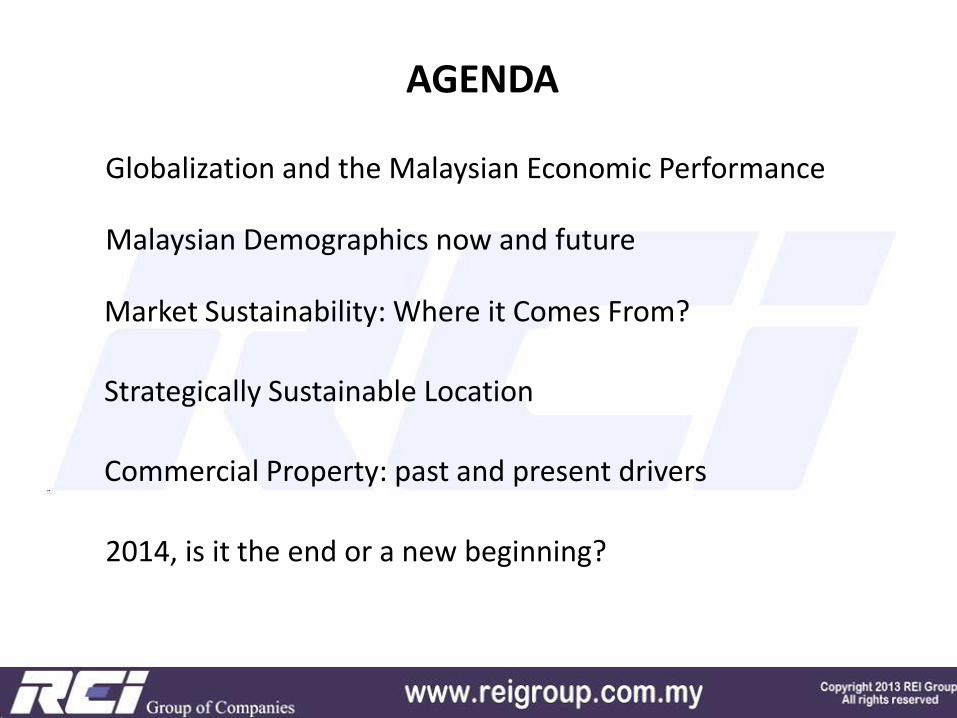
AGENDA
Globalization and the Malaysian Economic Performance
Malaysian Demographics now and future
Market Sustainability: Where it Comes From?
Strategically Sustainable Location
Commercial Property: past and present drivers
2014, is it the end or a new beginning?

Malaysian Economic and Property Market Performance: 2013 Outlook

Malaysian Economic and Property Market Performance: 2013 -2014 Outlook ……. Are we in the bricks?

GLOBAL & MALAYSIAN ECONOMY - FACT FILE
USA EU JAPAN AUSTRALIA UK MALAYSIA
GDP Growth 2.10% -0.90% 0.90% 0.55% 0.63% 4.70%
Gov debt as % of GDP 101.60% 90.60% 218% 21% 92% 54.80%
Gov deficit as % of GDP -8.50% -3.7% -9.2% -3.1% -6.3% -4%
Balance of current acc -440 USD Bil 25.9 USD Bil 60 USD Bil -57 USD Bil -93.5 USD Bil 18.6 USD Bil
Inflation 1.5% 1.10% 1.10% 2.20% 2.70% 2.50%
Unemployment 7.20% 12% 4.10% 5.60% 7.70% 3.10%
Business confidence 56 -1 12 12 7 115.2
consumer confidence 73 -14 45.2 108 -18 125.3

GLOBAL & MALAYSIAN ECONOMY - FACT FILE

GLOBAL & MALAYSIAN ECONOMY - FACT FILE
Country
Result
over 3
years
2010 2013 2010 2013 2010 2013 2010 2013 2010 2013 2010 2013 2010 Rank 2013 Rank
SINGAPORE 1 1 4 4 2 2 16 36 1 1 13 12 0 37 1 56 2
NEW ZEALAND 2 3 1 1 5 6 3 2 26 25 10 17 -1 47 2 54 1
HONG KONG 3 2 18 6 1 1 75 60 2 2 3 10 +2 102 5 81 3
US 4 4 8 13 25 17 12 25 18 22 8 6 -1 75 3 87 4
UK 5 7 16 19 16 20 23 73 16 14 23 21 -2 99 4 154 6
THAILAND 12 18 55 85 13 16 6 26 12 20 24 23 -4 122 6 188 7
JAPAN 15 24 91 114 45 72 54 64 17 19 20 35 -6 242 8 328 9
S. KOREA 19 8 53 24 23 26 71 75 8 3 5 2 +2 179 7 138 5
MALAYSIA 23 12 88 54 109 96 86 33 35 11 59 33 +6 400 9 239 8
Overall Ranking
Ease of
doing
business
Starting a
business
Dealing with
construction
permits
Registering a
property
Trading
across
borders
Enforcing
contracts

MALAYSIAN DEMOGRAPHIC - FACT FILE
+1.6 M
+3.6 M
+2.6 M
+6 M

MALAYSIAN MIGRATION FLOWS - FACT FILE
2012: 21,000,000 Malaysians live in urban areas 3.5% growth every year
2012: 72.5% of the Malaysian population lives in urban areas
15,000,000.00
16,000,000.00
17,000,000.00
18,000,000.00
19,000,000.00
20,000,000.00
21,000,000.00
22,000,000.00
2003 2004 2005 2006 2007 2008 2009 2010 2011 2012
MALAYSIAN FLOW
Malaysian Migration Flow Rural to Urban Areas
Source: World Bank Statistics

FEW CONSIDERATION ON MALAYSIANS WEALTH:
Malaysian average per capita income (2012) – Source IMF
USD10,304 per year = RM3,200 (per month)
Malaysian Wealth Distribution
Lowest 20% Highest 20%
Share 5% of Malaysian wealth Share 40% of Malaysian wealth
=
Median 60% share 55%
MALAYSIAN WEALTH DISTRIBUTION - FACT FILE
18,000,000

FEW CONSIDERATION ON MALAYSIANS WEALTH:
MALAYSIAN WEALTH DISTRIBUTION - FACT FILE
State GDP @
const prices
2009 2010 2011 2012 2012
RM RM RM RM % RM Billion
Kuala Lumpur 57,040 62,075 68,072 73,931 1,768,680 5.90% 114,106
Sarawak 31,286 34,136 39,324 40,414 2,601,000 8.68% 71,874
Pulau Pinang 30,098 33,601 35,188 37,006 1,664,640 5.56% 52,530
Selangor 28,468 31,457 33,727 36,135 5,826,240 19.44% 176,239
Malacca 25,397 28,328 31,093 33,550 832,320 2.78% 21,953
Negeri Sembilan 25,595 28,586 31,295 32,511 1,040,400 3.47% 27,717
2012 % on
Malaysia
Population
PER CAPITA INCOME STATISTICS
GDP per Capita at current prices State by
state
Population
in 2012
Pahang 20,548 23,008 26,066 26,197 1,560,600 5.21% 30,750
Johor 18,878 21,329 23,593 24,574 3,537,360 11.81% 68,791
Terengganu 19,102 20,581 22,220 22,733 1,144,440 3.82% 19,627
Perak 15,809 17,341 19,362 20,569 2,496,960 8.33% 39,627
Sabah 15,515 17,118 19,038 19,010 3,537,360 11.81% 44,434
Perlis 15,186 16,175 16,992 18,119 208,080 0.69% 3,535
Kedah 12,481 13,744 15,388 15,814 2,080,800 6.94% 25,307
Kelantan 8,421 9,322 10,366 10,617 1,664,640 5.56% 13,461

HOUSING EXISTING STOCK AND FUTURE SUPPLY
STATE
SUPPLY OF
LANDED TILL
2020
SUPPLY OF LOW
COST TILL 2020
LOW COST ON
POPULATION %
SUPPLY OF
HIGH RISE TILL
2020
TOTAL HOUSES
SUPPLY BY 2020
POPULATION BY
2020
NEED/OVERSUPPLY
OF HOUSES BY
2020
KUALA LUMPUR 113,005 156,915 8.39% 251,854 521,774 1,870,000 101,559
SELANGOR 833,155 491,584 7.83% 342,154 1,666,893 6,279,686 426,336
JOHOR 652,827 260,616 5.79% 87,968 1,001,411 4,499,432 498,400
PENANG 204,903 214,780 13.15% 63,728 483,411 1,633,703 61,157
MALACCA 138,607 50,244 5.49% 18,979 207,830 914,506 97,005
NEGERI SEMBILAN 265,638 90,725 7.11% 47,461 403,824 1,276,244 21,591
PAHANG 230,251 69,856 4.17% 17,862 317,969 1,674,660 240,251
PERAK 383,460 95,873 3.84% 12,909 492,242 2,494,237 339,170
PERLIS 19,804 9,294 3.82% 1,602 30,700 243,400 30,150
KELANTAN 67,511 12,722 0.83% 4,189 84,422 1,533,613 426,782
TERENGGANU 91,254 43,173 4.13% 1,026 135,453 1,045,864 213,168
KEDAH 247,710 115,217 5.92% 3,173 366,100 1,947,472 283,057
SABAH 98,335 62,930 1.83% 41,618 202,883 3,443,107 485,738
SARAWAK 189,640 51,915 2.04% 14,893 256,448 2,543,759 252,304
GRAND TOTAL FOR
MALAYSIA3,536,100 1,725,844 5.50% 909,416 6,171,360 31,399,685 3,476,669
EXISTING STOCK AND HOUSE SUPPLY TILL 2020

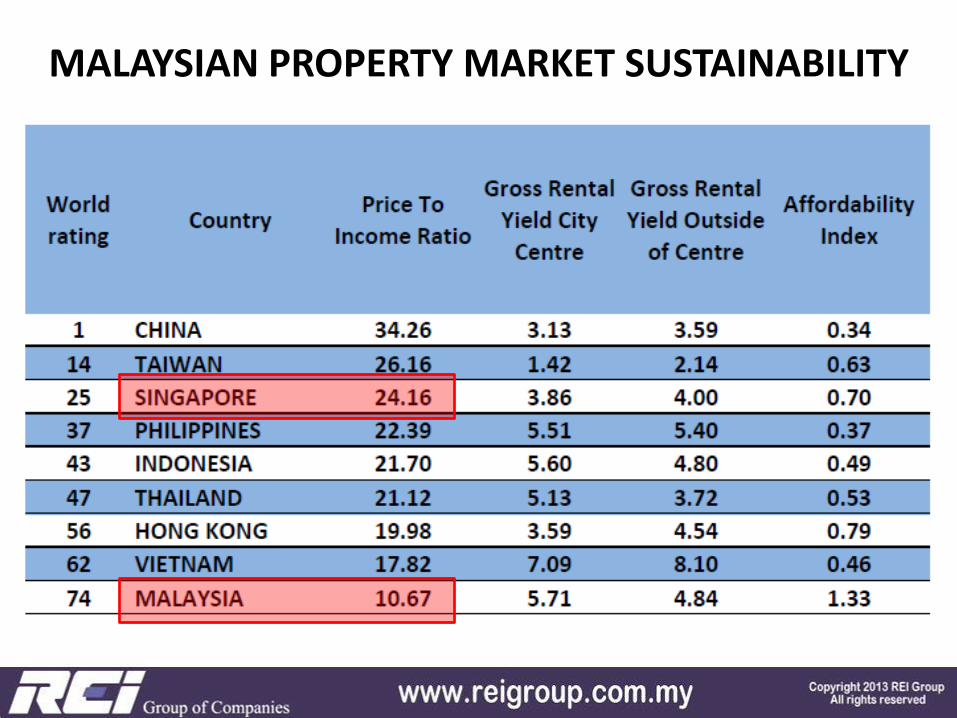
MALAYSIAN PROPERTY MARKET SUSTAINABILITY
House - Income trend 2000 2001 2002 2003 2004 2005 2006 2007 2008 2009 2010 2011 2012 2013
House price index 100.0 101.1 103.5 107.5 112.4 115.0 117.2 123.1 128.6 130.5 138.8 151.2 167.2 178.4
Income statistics 213.0 232.1 238.2 244.2 250.0 260.8 271.5 282.2 294.6 307.0 330.0 352.9 375.8
How House Price Index and Per Capita income index are strictly correlated,
what is this comparison showing?
House price index growth 2000 – 2012 = +67%
Median income growth 2000 – 2012 = +175%

MALAYSIAN PROPERTY MARKET SUSTAINABILITY
House - Income trend 2000 2001 2002 2003 2004 2005 2006 2007 2008 2009 2010 2011 2012 2013
House price index 100.0 101.1 103.5 107.5 112.4 115.0 117.2 123.1 128.6 130.5 138.8 151.2 167.2 178.4
Income statistics 213.0 232.1 238.2 244.2 250.0 260.8 271.5 282.2 294.6 307.0 330.0 352.9 375.8
How House Price Index and Per Capita income index are strictly correlated,
what is this comparison showing?
House price index +67%
Median income +175%
MALAYSIAN PROPERTY MARKET SUSTAINABILITY

MALAYSIAN BUDGET 2014 - SUSTAINABILITY
STRENGTHENING ECONOMIC RESILIENCE ACCELERATING TRANSFORMATION
Today we shouldn’t look at tomorrow but at a tomorrow that is 10 years from today
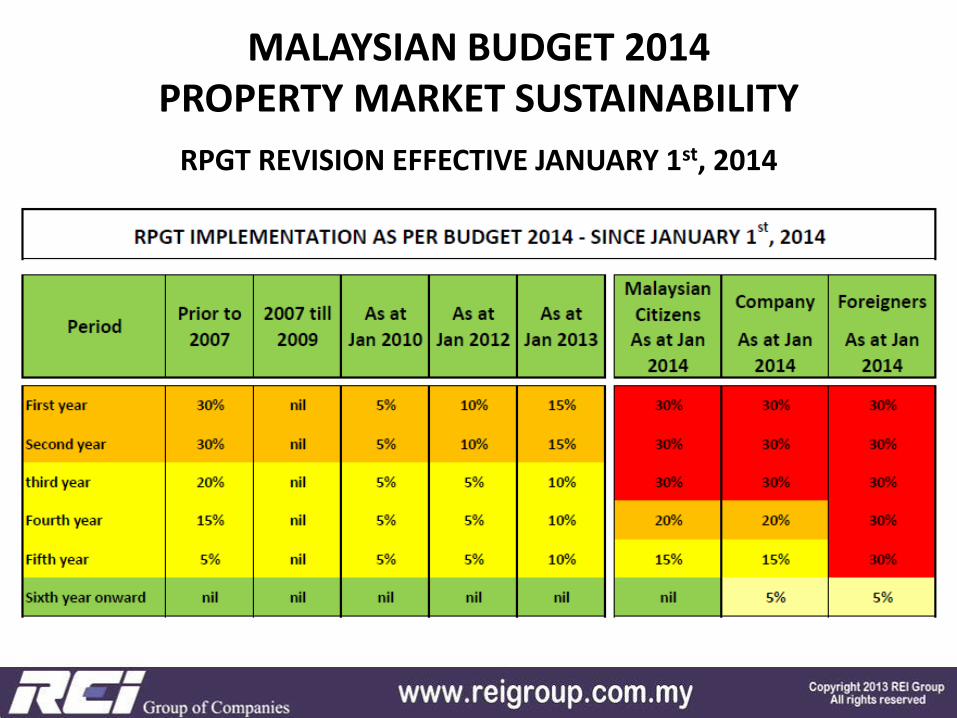
MALAYSIAN BUDGET 2014 PROPERTY MARKET SUSTAINABILITY
RPGT REVISION EFFECTIVE JANUARY 1st, 2014

MALAYSIAN BUDGET 2014 PROPERTY MARKET SUSTAINABILITY
RPGT: HOW IT WORKS?
THIS IS WHY RPGT WILL NOT AFFECT THE PROPERTY MARKET BUT
ONLY PENALIZE UNSCRUPULOUS SPECULATORS.
CAN SELL
WITH NO TAXACTUAL HOLDING PERIOD
CURRENT LOCK-IN PERIOD IMPOSED BY BANKS
ON CONVENTIONAL FINANCING
Under
construction
Delivery
Vacant Poss.
RPGT @
20%
RPGT @
15%
RPGT @
0%
RPGT @
30%
RPGT @
30%
RPGT @
30%
Year 1 Year 6
Under
construction
Year 2 Year 3
Under
construction
Year 4 Year 5

MALAYSIAN BUDGET 2014 PROPERTY MARKET SUSTAINABILITY
MINIMUM PURCHASING VALUE FOR FOREIGNERS RAISED TO RM1,000,000.00
- Properties priced RM900,000 and below will be not at all affected by this new regulation.
- The only properties which values might be pushed up by developers to attract possible foreigner purchasers are the ones priced RM900/950,000 and above
- In Iskandar Malaysia, considered to be the hottest Property Market in Malaysia for foreigners, less than 8% of the transactions in 2013 have been actually done by foreigner purchasers.

MALAYSIAN BUDGET 2014 – SUSTAINABILITY HOW DOES “TRANSPARENCY” APPLY?

EFFECT OF THIS MOVE House prices will re-adjust in the short term
to more real-actual Values!
MALAYSIAN BUDGET 2014 – “The Aftermath”

EFFECT OF THIS MOVE House prices will re-adjust in the short term
to more real-actual Values!
EXPECTED VALUES ADJUSTMENT +2%
to max -5 to 6%
MALAYSIAN BUDGET 2014 – “The Aftermath”

MALAYSIAN PROPERTY MARKET SUSTAINABILITY

MALAYSIAN PROPERTY MARKET SUSTAINABILITY
Kuantan: the new commercial port, the already committed investment from Chinese, European and American Multinational Corporation
Kota Baru: the Northern Educational Hub with 15 Local and International Universities already working to establish a northern campus
Penang: the 8th destination worldwide to retire.
Ipoh: retirement homes and health tourism
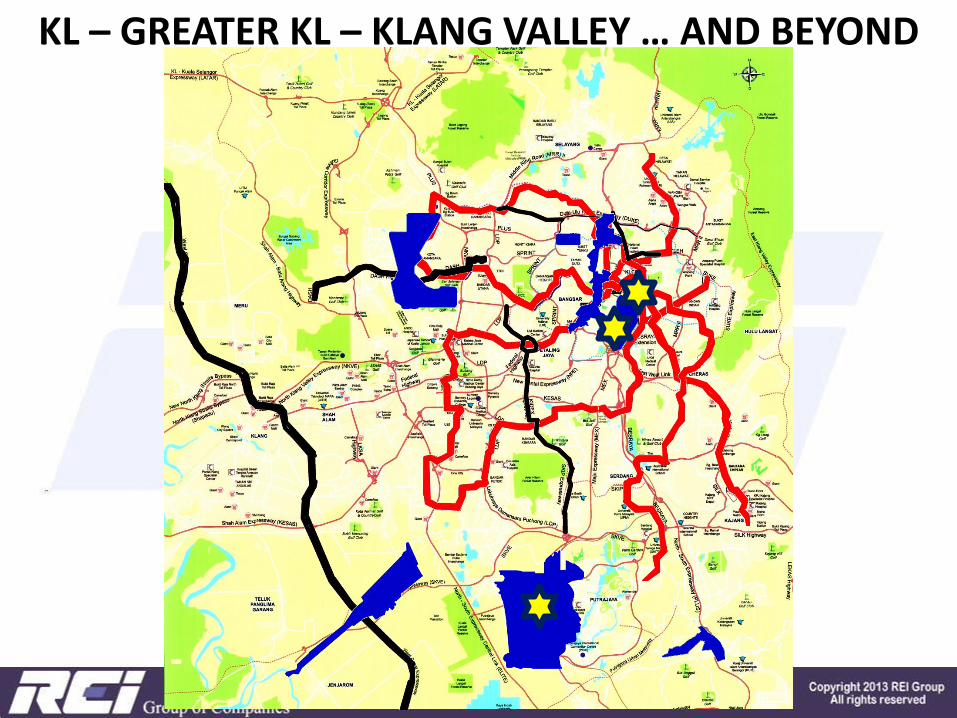
Klang Valley: the Northern, Southern and Western Corridor and the Megaprojects
Iskandar Malaysia: the most Strategically Sustainable Location in the region (SEA)

KL – GREATER KL – KLANG VALLEY … AND BEYOND

KL – GREATER KL – KLANG VALLEY … AND BEYOND
Klang Valley 1990 Klang Valley 2012

Klang Valley: 7,800,000 population Hong Kong: 7,200,000 population
Just a consideration on how Greater KL should evolve…
Klang Valley view from 130 km Hong Kong view from 130 km
KL – GREATER KL – KLANG VALLEY … AND BEYOND

Klang Valley: 7,800,000 population Hong Kong: 7,200,000 population
Just a consideration on how Greater KL should evolve…
Klang Valley view from 130 km Hong Kong view from 130 km
KL – GREATER KL – KLANG VALLEY … AND BEYOND

KL – GREATER KL – KLANG VALLEY … AND BEYOND

KL – GREATER KL – KLANG VALLEY … AND BEYOND

KL – GREATER KL – KLANG VALLEY … AND BEYOND

KL – GREATER KL – KLANG VALLEY … AND BEYOND

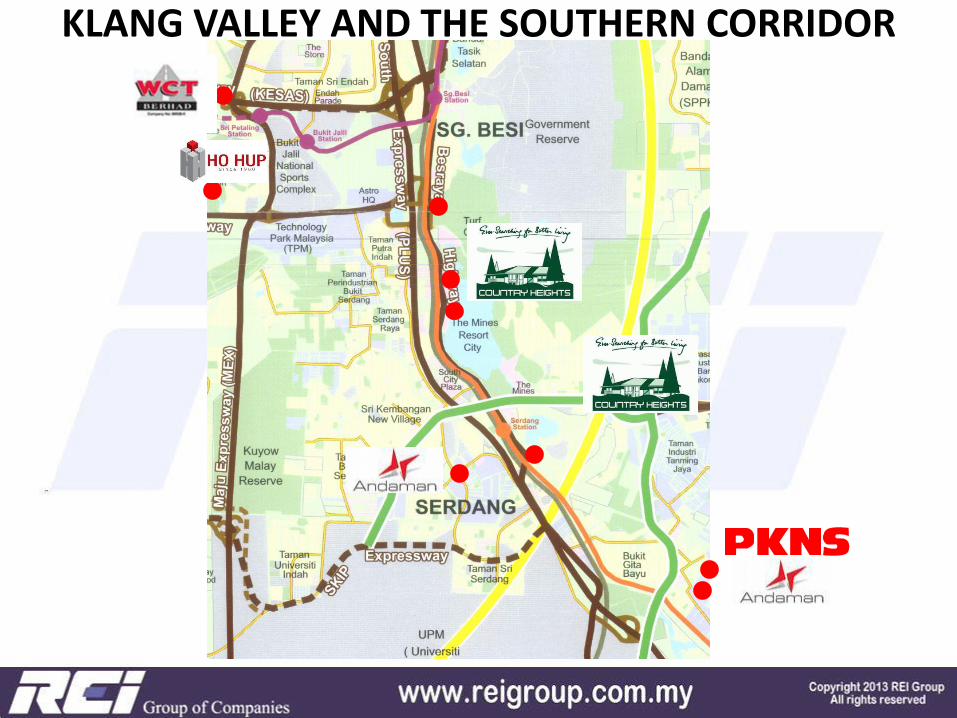
KLANG VALLEY AND THE SOUTHERN CORRIDOR
KLANG VALLEY AND THE SOUTHERN CORRIDOR

KLANG VALLEY AND THE SOUTHERN CORRIDOR

KLANG VALLEY AND THE SOUTHERN CORRIDOR

KLANG VALLEY AND THE SOUTHERN CORRIDOR

KLANG VALLEY AND THE SOUTHERN CORRIDOR

KLANG VALLEY AND THE SOUTHERN CORRIDOR

Bangi1& 2DATUM BANGI I RM1.5 billion, 17-storey
hotel, service apartments & convention hall, and 3 storeys of retail mall & office suites.
75,000 square meters of Gross Floor Area (GFA).
Datum Bangi I
Datum Bangi II
DATUM BANGI II 2 towers service apartment,
convention centre. Retail and office complex.
Bangi1& 2 byKLANG VALLEY AND THE SOUTHERN CORRIDOR

Block A Block B
New office tower, hotel & service
apartment by PKNS
KLANG VALLEY AND THE SOUTHERN CORRIDOR

KLANG VALLEY AND THE SOUTHERN CORRIDOR

KLANG VALLEY AND THE SOUTHERN CORRIDOR The return of Cyberjaya

KLANG VALLEY AND THE SOUTHERN CORRIDOR The return of Cyberjaya

LRT 3
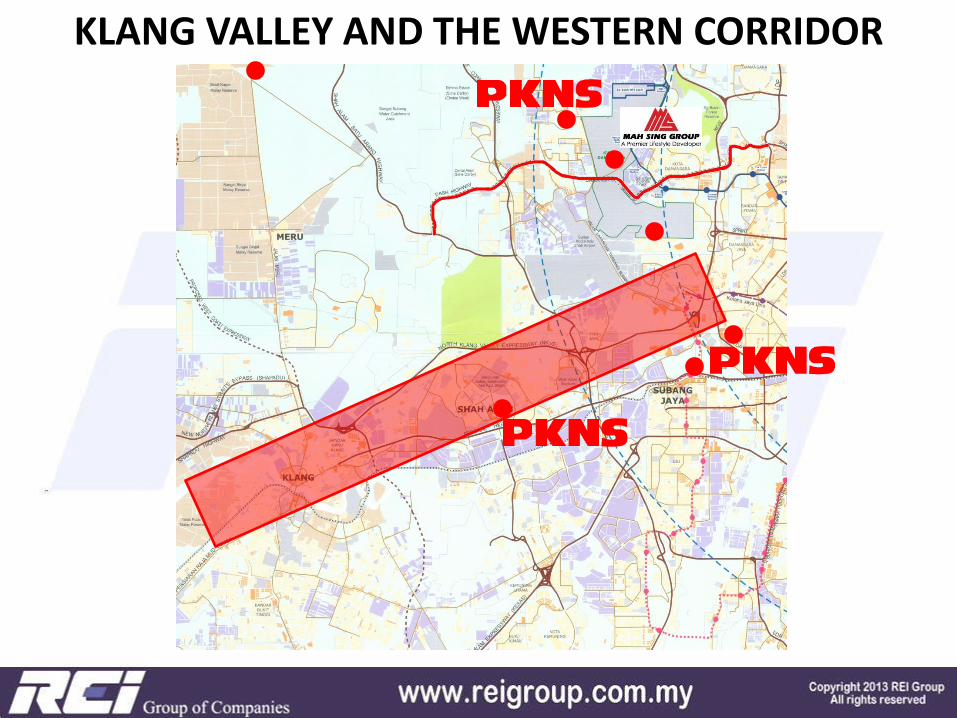
KLANG VALLEY AND THE WESTERN CORRIDOR

KLANG VALLEY AND THE WESTERN CORRIDOR

Damansara – Shah Alam (DASH) highway alignment
KLANG VALLEY AND THE WESTERN CORRIDOR
KLANG VALLEY AND THE WESTERN CORRIDOR

Phase 2
Phase 1
KLANG VALLEY AND THE SOUTHERN CORRIDOR

SACC RM2.5 billion GDV, 31.5 acre urban
regeneration in Shah Alam City Centre. Garden City concept with Islamic
architecture & Biophilic features for sustainable living.
KLANG VALLEY AND THE SOUTHERN CORRIDOR

GREATER KL, KLANG VALLEY AND THE FUTURE OF COMMERCIAL PROPERTIES

MALAYSIAN PROPERTY MARKET SUSTAINABILITY MARKET PERCEPTION
KL – GREATER KL – KLANG VALLEY … AND BEYOND

TRX
KL METROPOLIS
Bukit Bintang City Centre – Ex Pudu Jail
City of Malaysia
KL Central
KL Eco City
WARISAN MERDEKA
KL – GREATER KL – KLANG VALLEY … AND BEYOND

PROJECTS LOCATION SIZE (ha) SIZE (acres)
Bangsar South City KUALA LUMPUR 24.00 59.30
Platinum Park KLCC KUALA LUMPUR 3.70 9.14
Bukit Jelutong Commercial Centre SHAH ALAM 72.80 179.89
KL Sentral KUALA LUMPUR 29.00 71.66
Datum Jelatek KUALA LUMPUR 2.40 5.93
MPHB's Golden Triangle Develp. KUALA LUMPUR n.a. n.a.
Damansara Avenue SELANGOR 19.00 46.95
KL City Centre Redevelop. Kg Baru KUALA LUMPUR 152.00 375.59
Bukit Bintang City Centre KUALA LUMPUR 8.60 21.25
Bangsar/KL Eco City KUALA LUMPUR 9.70 23.97
Pekeliling Tamansari Riverside Garden City KUALA LUMPUR 22.00 54.36
TRX KUALA LUMPUR 34.00 84.01
Merdeka Park City KUALA LUMPUR n.a. n.a.
City of Malaysia - Sg Besi KUALA LUMPUR 162.00 400.30
Jln Cochrane-Jln Peel Development Cheras KUALA LUMPUR n.a. n.a.
KL Media City - Kerinchi/Pantai Dalam KUALA LUMPUR n.a. n.a.
Sungai Buloh Urban Development - RRIM KUALA LUMPUR 1,370.00 3,385.27
Bukit Jalil Green City KUALA LUMPUR 24.00 59.30
Bukit Jalil Link 2 KUALA LUMPUR 21.00 51.89
Kesas new Shopping Mall Sri Petaling KUALA LUMPUR 19.90 49.17
Naza KL Metropolis KUALA LUMPUR 3.00 7.41
PJ Sentral Garden SELANGOR 4.80 11.86
TOTAL 1,981.90 4,897.27
NEW KLANG VALLEY GROWTH AREAS
KL – GREATER KL – KLANG VALLEY … AND BEYOND

GREATER KL, KLANG VALLEY AND THE FUTURE OF COMMERCIAL PROPERTIES

GREATER KL, KLANG VALLEY AND THE FUTURE OF COMMERCIAL PROPERTIES
OFFICE OCCUPANCY RATES IN MALAYSIA
SELANGOR
MALAYSIA
PENANG
MALACCA
KLJOHOR
100%95%70%
PERLIS
TERENGGANU
KELANTAN
PERAK
SARAWAK
75% 80% 85% 90%
KEDAH
NG. SEMBILAN
SABAH
PAHANG

GREATER KL, KLANG VALLEY AND THE FUTURE OF COMMERCIAL PROPERTIES
COMPARISON BETWEEN: DEMAND-SUPPLY-ACTUAL OCCUPANCY

GREATER KL, KLANG VALLEY AND THE FUTURE OF COMMERCIAL PROPERTIES

GREATER KL, KLANG VALLEY AND THE FUTURE OF COMMERCIAL PROPERTIES
OCCUPANCY RATE AND RENTAL RATES – OPPOSITE TREND

GREATER KL, KLANG VALLEY AND THE FUTURE OF COMMERCIAL PROPERTIES
FDI Flow since year 2000

GREATER KL, KLANG VALLEY AND THE FUTURE OF COMMERCIAL PROPERTIES
BANK’S EXPOSURE TO COMMERCIAL PROPERTIES

THE 2020 INVESTMENT PLAN
What and why…..
THE 2020 INVESTMENT PLAN
What and why…..
pre-check your financing capabilities....
Choose the area and product

THE 2020 INVESTMENT PLAN
What and why…..
….. all on one and ….. Pray God that it will go right!
Multiple choice = Risk management
and Possible higher return
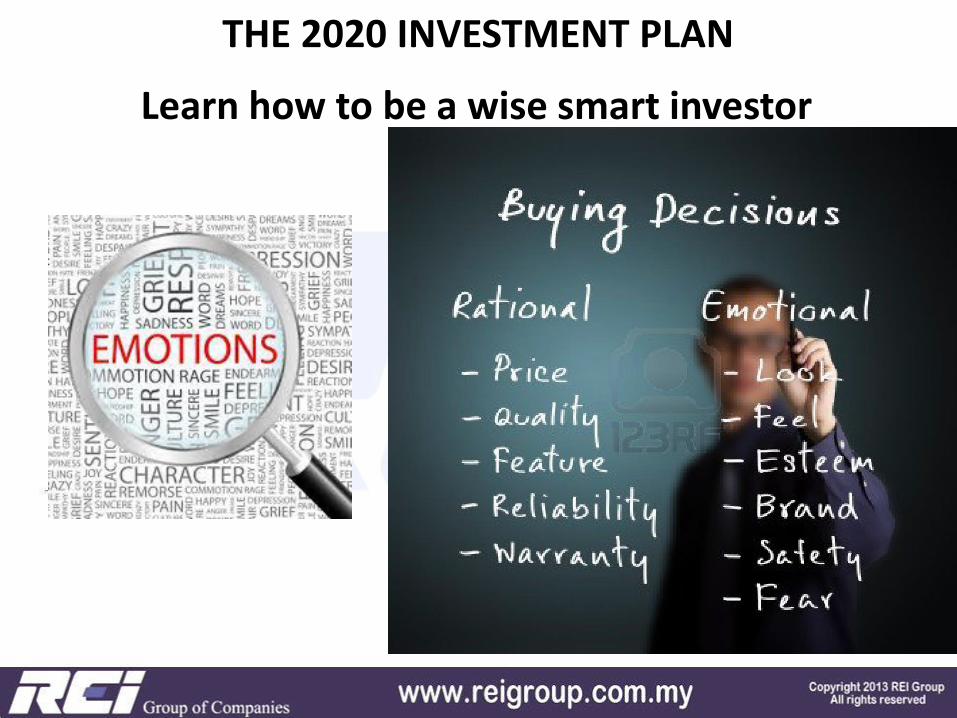
THE 2020 INVESTMENT PLAN
Learn how to be a wise smart investor
Copyright © 2022 FDOKUMEN