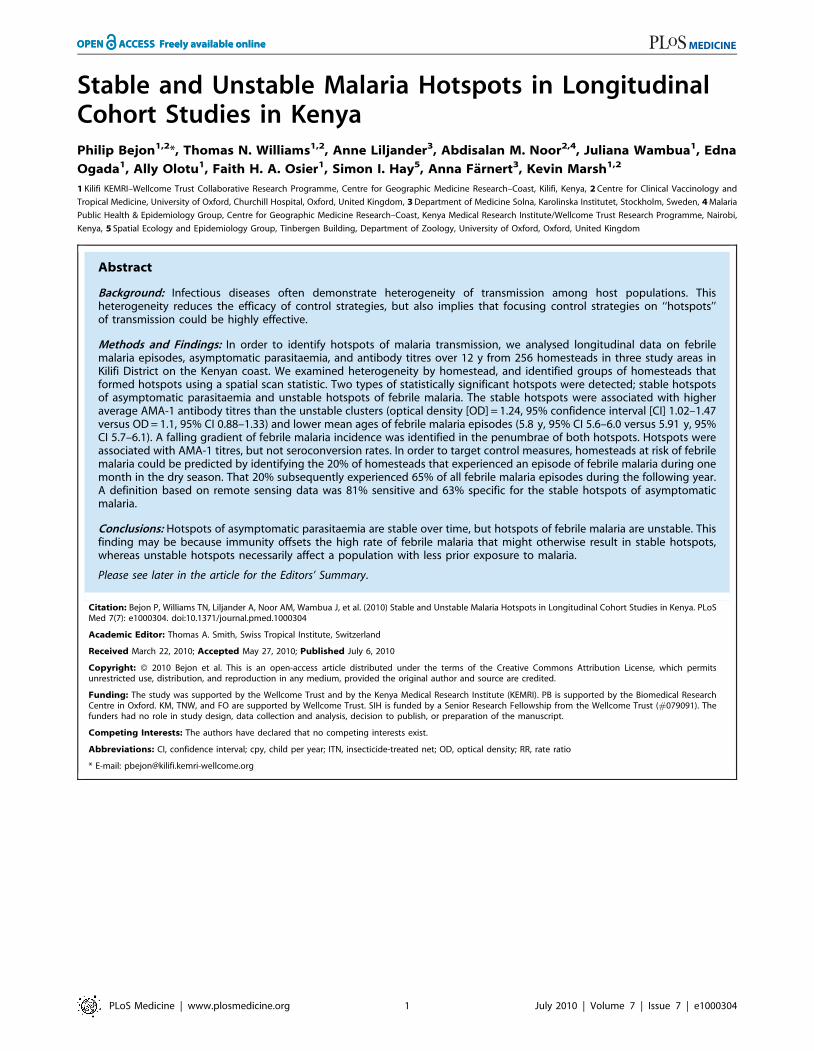
Stable and Unstable Malaria Hotspots in Longitudinal Cohort Studies in Kenya
14
Stable and Unstable Malaria Hotspots in Longitudinal Cohort Studies in Kenya Philip Bejon 1,2 *, Thomas N. Williams 1,2 , Anne Liljander 3 , Abdisalan M. Noor 2,4 , Juliana Wambua 1 , Edna Ogada 1 , Ally Olotu 1 , Faith H. A. Osier 1 , Simon I. Hay 5 , Anna Fa ¨ rnert 3 , Kevin Marsh 1,2 1 Kilifi KEMRI–Wellcome Trust Collaborative Research Programme, Centre for Geographic Medicine Research–Coast, Kilifi, Kenya, 2 Centre for Clinical Vaccinology and Tropical Medicine, University of Oxford, Churchill Hospital, Oxford, United Kingdom, 3 Department of Medicine Solna, Karolinska Institutet, Stockholm, Sweden, 4 Malaria Public Health & Epidemiology Group, Centre for Geographic Medicine Research–Coast, Kenya Medical Research Institute/Wellcome Trust Research Programme, Nairobi, Kenya, 5 Spatial Ecology and Epidemiology Group, Tinbergen Building, Department of Zoology, University of Oxford, Oxford, United Kingdom Abstract Background: Infectious diseases often demonstrate heterogeneity of transmission among host populations. This heterogeneity reduces the efficacy of control strategies, but also implies that focusing control strategies on ‘‘hotspots’’ of transmission could be highly effective. Methods and Findings: In order to identify hotspots of malaria transmission, we analysed longitudinal data on febrile malaria episodes, asymptomatic parasitaemia, and antibody titres over 12 y from 256 homesteads in three study areas in Kilifi District on the Kenyan coast. We examined heterogeneity by homestead, and identified groups of homesteads that formed hotspots using a spatial scan statistic. Two types of statistically significant hotspots were detected; stable hotspots of asymptomatic parasitaemia and unstable hotspots of febrile malaria. The stable hotspots were associated with higher average AMA-1 antibody titres than the unstable clusters (optical density [OD] = 1.24, 95% confidence interval [CI] 1.02–1.47 versus OD = 1.1, 95% CI 0.88–1.33) and lower mean ages of febrile malaria episodes (5.8 y, 95% CI 5.6–6.0 versus 5.91 y, 95% CI 5.7–6.1). A falling gradient of febrile malaria incidence was identified in the penumbrae of both hotspots. Hotspots were associated with AMA-1 titres, but not seroconversion rates. In order to target control measures, homesteads at risk of febrile malaria could be predicted by identifying the 20% of homesteads that experienced an episode of febrile malaria during one month in the dry season. That 20% subsequently experienced 65% of all febrile malaria episodes during the following year. A definition based on remote sensing data was 81% sensitive and 63% specific for the stable hotspots of asymptomatic malaria. Conclusions: Hotspots of asymptomatic parasitaemia are stable over time, but hotspots of febrile malaria are unstable. This finding may be because immunity offsets the high rate of febrile malaria that might otherwise result in stable hotspots, whereas unstable hotspots necessarily affect a population with less prior exposure to malaria. Please see later in the article for the Editors’ Summary. Citation: Bejon P, Williams TN, Liljander A, Noor AM, Wambua J, et al. (2010) Stable and Unstable Malaria Hotspots in Longitudinal Cohort Studies in Kenya. PLoS Med 7(7): e1000304. doi:10.1371/journal.pmed.1000304 Academic Editor: Thomas A. Smith, Swiss Tropical Institute, Switzerland Received March 22, 2010; Accepted May 27, 2010; Published July 6, 2010 Copyright: ß 2010 Bejon et al. This is an open-access article distributed under the terms of the Creative Commons Attribution License, which permits unrestricted use, distribution, and reproduction in any medium, provided the original author and source are credited. Funding: The study was supported by the Wellcome Trust and by the Kenya Medical Research Institute (KEMRI). PB is supported by the Biomedical Research Centre in Oxford. KM, TNW, and FO are supported by Wellcome Trust. SIH is funded by a Senior Research Fellowship from the Wellcome Trust (#079091). The funders had no role in study design, data collection and analysis, decision to publish, or preparation of the manuscript. Competing Interests: The authors have declared that no competing interests exist. Abbreviations: CI, confidence interval; cpy, child per year; ITN, insecticide-treated net; OD, optical density; RR, rate ratio * E-mail: [email protected] PLoS Medicine | www.plosmedicine.org 1 July 2010 | Volume 7 | Issue 7 | e1000304
-
Upload
independent -
Category
Documents
-
view
2 -
download
0
Transcript of Stable and Unstable Malaria Hotspots in Longitudinal Cohort Studies in Kenya
Stable and Unstable Malaria Hotspots in LongitudinalCohort Studies in KenyaPhilip Bejon1,2*, Thomas N. Williams1,2, Anne Liljander3, Abdisalan M. Noor2,4, Juliana Wambua1, Edna
Ogada1, Ally Olotu1, Faith H. A. Osier1, Simon I. Hay5, Anna Farnert3, Kevin Marsh1,2
1 Kilifi KEMRI–Wellcome Trust Collaborative Research Programme, Centre for Geographic Medicine Research–Coast, Kilifi, Kenya, 2 Centre for Clinical Vaccinology and
Tropical Medicine, University of Oxford, Churchill Hospital, Oxford, United Kingdom, 3 Department of Medicine Solna, Karolinska Institutet, Stockholm, Sweden, 4 Malaria
Public Health & Epidemiology Group, Centre for Geographic Medicine Research–Coast, Kenya Medical Research Institute/Wellcome Trust Research Programme, Nairobi,
Kenya, 5 Spatial Ecology and Epidemiology Group, Tinbergen Building, Department of Zoology, University of Oxford, Oxford, United Kingdom
Abstract
Background: Infectious diseases often demonstrate heterogeneity of transmission among host populations. Thisheterogeneity reduces the efficacy of control strategies, but also implies that focusing control strategies on ‘‘hotspots’’of transmission could be highly effective.
Methods and Findings: In order to identify hotspots of malaria transmission, we analysed longitudinal data on febrilemalaria episodes, asymptomatic parasitaemia, and antibody titres over 12 y from 256 homesteads in three study areas inKilifi District on the Kenyan coast. We examined heterogeneity by homestead, and identified groups of homesteads thatformed hotspots using a spatial scan statistic. Two types of statistically significant hotspots were detected; stable hotspotsof asymptomatic parasitaemia and unstable hotspots of febrile malaria. The stable hotspots were associated with higheraverage AMA-1 antibody titres than the unstable clusters (optical density [OD] = 1.24, 95% confidence interval [CI] 1.02–1.47versus OD = 1.1, 95% CI 0.88–1.33) and lower mean ages of febrile malaria episodes (5.8 y, 95% CI 5.6–6.0 versus 5.91 y, 95%CI 5.7–6.1). A falling gradient of febrile malaria incidence was identified in the penumbrae of both hotspots. Hotspots wereassociated with AMA-1 titres, but not seroconversion rates. In order to target control measures, homesteads at risk of febrilemalaria could be predicted by identifying the 20% of homesteads that experienced an episode of febrile malaria during onemonth in the dry season. That 20% subsequently experienced 65% of all febrile malaria episodes during the following year.A definition based on remote sensing data was 81% sensitive and 63% specific for the stable hotspots of asymptomaticmalaria.
Conclusions: Hotspots of asymptomatic parasitaemia are stable over time, but hotspots of febrile malaria are unstable. Thisfinding may be because immunity offsets the high rate of febrile malaria that might otherwise result in stable hotspots,whereas unstable hotspots necessarily affect a population with less prior exposure to malaria.
Please see later in the article for the Editors’ Summary.
Citation: Bejon P, Williams TN, Liljander A, Noor AM, Wambua J, et al. (2010) Stable and Unstable Malaria Hotspots in Longitudinal Cohort Studies in Kenya. PLoSMed 7(7): e1000304. doi:10.1371/journal.pmed.1000304
Academic Editor: Thomas A. Smith, Swiss Tropical Institute, Switzerland
Received March 22, 2010; Accepted May 27, 2010; Published July 6, 2010
Copyright: � 2010 Bejon et al. This is an open-access article distributed under the terms of the Creative Commons Attribution License, which permitsunrestricted use, distribution, and reproduction in any medium, provided the original author and source are credited.
Funding: The study was supported by the Wellcome Trust and by the Kenya Medical Research Institute (KEMRI). PB is supported by the Biomedical ResearchCentre in Oxford. KM, TNW, and FO are supported by Wellcome Trust. SIH is funded by a Senior Research Fellowship from the Wellcome Trust (#079091). Thefunders had no role in study design, data collection and analysis, decision to publish, or preparation of the manuscript.
Competing Interests: The authors have declared that no competing interests exist.
Abbreviations: CI, confidence interval; cpy, child per year; ITN, insecticide-treated net; OD, optical density; RR, rate ratio
* E-mail: [email protected]
PLoS Medicine | www.plosmedicine.org 1 July 2010 | Volume 7 | Issue 7 | e1000304
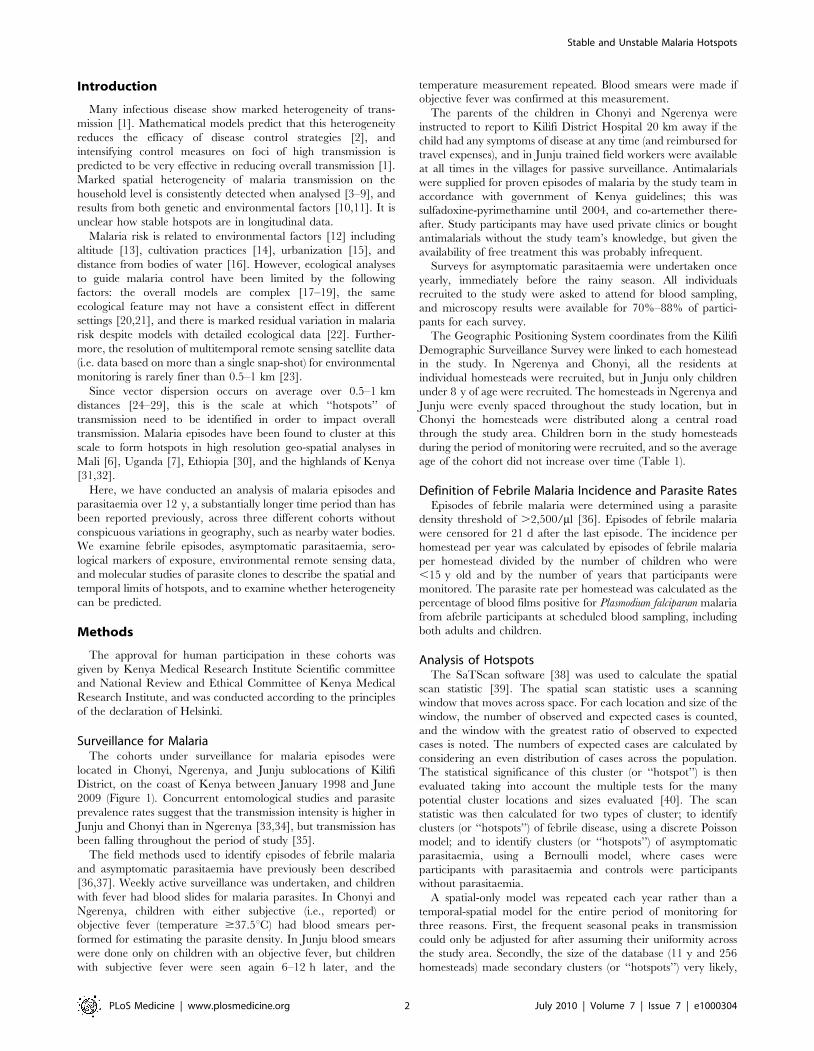
Introduction
Many infectious disease show marked heterogeneity of trans-
mission [1]. Mathematical models predict that this heterogeneity
reduces the efficacy of disease control strategies [2], and
intensifying control measures on foci of high transmission is
predicted to be very effective in reducing overall transmission [1].
Marked spatial heterogeneity of malaria transmission on the
household level is consistently detected when analysed [3–9], and
results from both genetic and environmental factors [10,11]. It is
unclear how stable hotspots are in longitudinal data.
Malaria risk is related to environmental factors [12] including
altitude [13], cultivation practices [14], urbanization [15], and
distance from bodies of water [16]. However, ecological analyses
to guide malaria control have been limited by the following
factors: the overall models are complex [17–19], the same
ecological feature may not have a consistent effect in different
settings [20,21], and there is marked residual variation in malaria
risk despite models with detailed ecological data [22]. Further-
more, the resolution of multitemporal remote sensing satellite data
(i.e. data based on more than a single snap-shot) for environmental
monitoring is rarely finer than 0.5–1 km [23].
Since vector dispersion occurs on average over 0.5–1 km
distances [24–29], this is the scale at which ‘‘hotspots’’ of
transmission need to be identified in order to impact overall
transmission. Malaria episodes have been found to cluster at this
scale to form hotspots in high resolution geo-spatial analyses in
Mali [6], Uganda [7], Ethiopia [30], and the highlands of Kenya
[31,32].
Here, we have conducted an analysis of malaria episodes and
parasitaemia over 12 y, a substantially longer time period than has
been reported previously, across three different cohorts without
conspicuous variations in geography, such as nearby water bodies.
We examine febrile episodes, asymptomatic parasitaemia, sero-
logical markers of exposure, environmental remote sensing data,
and molecular studies of parasite clones to describe the spatial and
temporal limits of hotspots, and to examine whether heterogeneity
can be predicted.
Methods
The approval for human participation in these cohorts was
given by Kenya Medical Research Institute Scientific committee
and National Review and Ethical Committee of Kenya Medical
Research Institute, and was conducted according to the principles
of the declaration of Helsinki.
Surveillance for MalariaThe cohorts under surveillance for malaria episodes were
located in Chonyi, Ngerenya, and Junju sublocations of Kilifi
District, on the coast of Kenya between January 1998 and June
2009 (Figure 1). Concurrent entomological studies and parasite
prevalence rates suggest that the transmission intensity is higher in
Junju and Chonyi than in Ngerenya [33,34], but transmission has
been falling throughout the period of study [35].
The field methods used to identify episodes of febrile malaria
and asymptomatic parasitaemia have previously been described
[36,37]. Weekly active surveillance was undertaken, and children
with fever had blood slides for malaria parasites. In Chonyi and
Ngerenya, children with either subjective (i.e., reported) or
objective fever (temperature $37.5uC) had blood smears per-
formed for estimating the parasite density. In Junju blood smears
were done only on children with an objective fever, but children
with subjective fever were seen again 6–12 h later, and the
temperature measurement repeated. Blood smears were made if
objective fever was confirmed at this measurement.
The parents of the children in Chonyi and Ngerenya were
instructed to report to Kilifi District Hospital 20 km away if the
child had any symptoms of disease at any time (and reimbursed for
travel expenses), and in Junju trained field workers were available
at all times in the villages for passive surveillance. Antimalarials
were supplied for proven episodes of malaria by the study team in
accordance with government of Kenya guidelines; this was
sulfadoxine-pyrimethamine until 2004, and co-artemether there-
after. Study participants may have used private clinics or bought
antimalarials without the study team’s knowledge, but given the
availability of free treatment this was probably infrequent.
Surveys for asymptomatic parasitaemia were undertaken once
yearly, immediately before the rainy season. All individuals
recruited to the study were asked to attend for blood sampling,
and microscopy results were available for 70%–88% of partici-
pants for each survey.
The Geographic Positioning System coordinates from the Kilifi
Demographic Surveillance Survey were linked to each homestead
in the study. In Ngerenya and Chonyi, all the residents at
individual homesteads were recruited, but in Junju only children
under 8 y of age were recruited. The homesteads in Ngerenya and
Junju were evenly spaced throughout the study location, but in
Chonyi the homesteads were distributed along a central road
through the study area. Children born in the study homesteads
during the period of monitoring were recruited, and so the average
age of the cohort did not increase over time (Table 1).
Definition of Febrile Malaria Incidence and Parasite RatesEpisodes of febrile malaria were determined using a parasite
density threshold of .2,500/ml [36]. Episodes of febrile malaria
were censored for 21 d after the last episode. The incidence per
homestead per year was calculated by episodes of febrile malaria
per homestead divided by the number of children who were
,15 y old and by the number of years that participants were
monitored. The parasite rate per homestead was calculated as the
percentage of blood films positive for Plasmodium falciparum malaria
from afebrile participants at scheduled blood sampling, including
both adults and children.
Analysis of HotspotsThe SaTScan software [38] was used to calculate the spatial
scan statistic [39]. The spatial scan statistic uses a scanning
window that moves across space. For each location and size of the
window, the number of observed and expected cases is counted,
and the window with the greatest ratio of observed to expected
cases is noted. The numbers of expected cases are calculated by
considering an even distribution of cases across the population.
The statistical significance of this cluster (or ‘‘hotspot’’) is then
evaluated taking into account the multiple tests for the many
potential cluster locations and sizes evaluated [40]. The scan
statistic was then calculated for two types of cluster; to identify
clusters (or ‘‘hotspots’’) of febrile disease, using a discrete Poisson
model; and to identify clusters (or ‘‘hotspots’’) of asymptomatic
parasitaemia, using a Bernoulli model, where cases were
participants with parasitaemia and controls were participants
without parasitaemia.
A spatial-only model was repeated each year rather than a
temporal-spatial model for the entire period of monitoring for
three reasons. First, the frequent seasonal peaks in transmission
could only be adjusted for after assuming their uniformity across
the study area. Secondly, the size of the database (11 y and 256
homesteads) made secondary clusters (or ‘‘hotspots’’) very likely,
Stable and Unstable Malaria Hotspots
PLoS Medicine | www.plosmedicine.org 2 July 2010 | Volume 7 | Issue 7 | e1000304
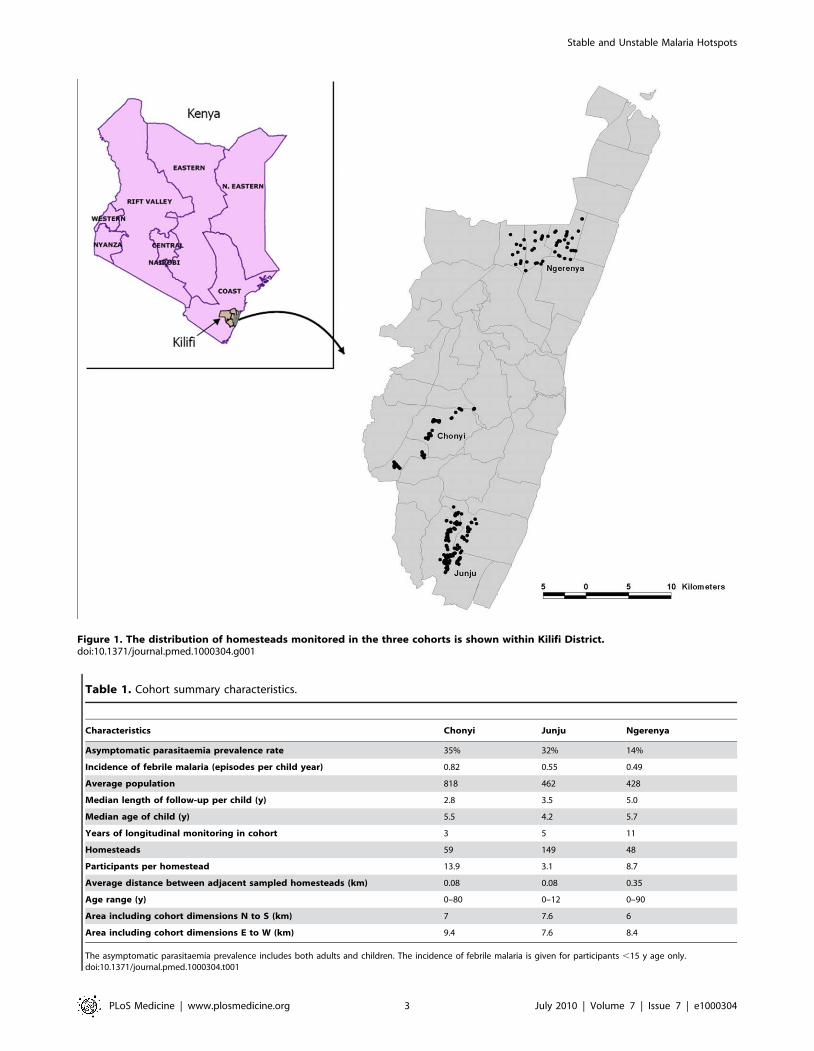
Figure 1. The distribution of homesteads monitored in the three cohorts is shown within Kilifi District.doi:10.1371/journal.pmed.1000304.g001
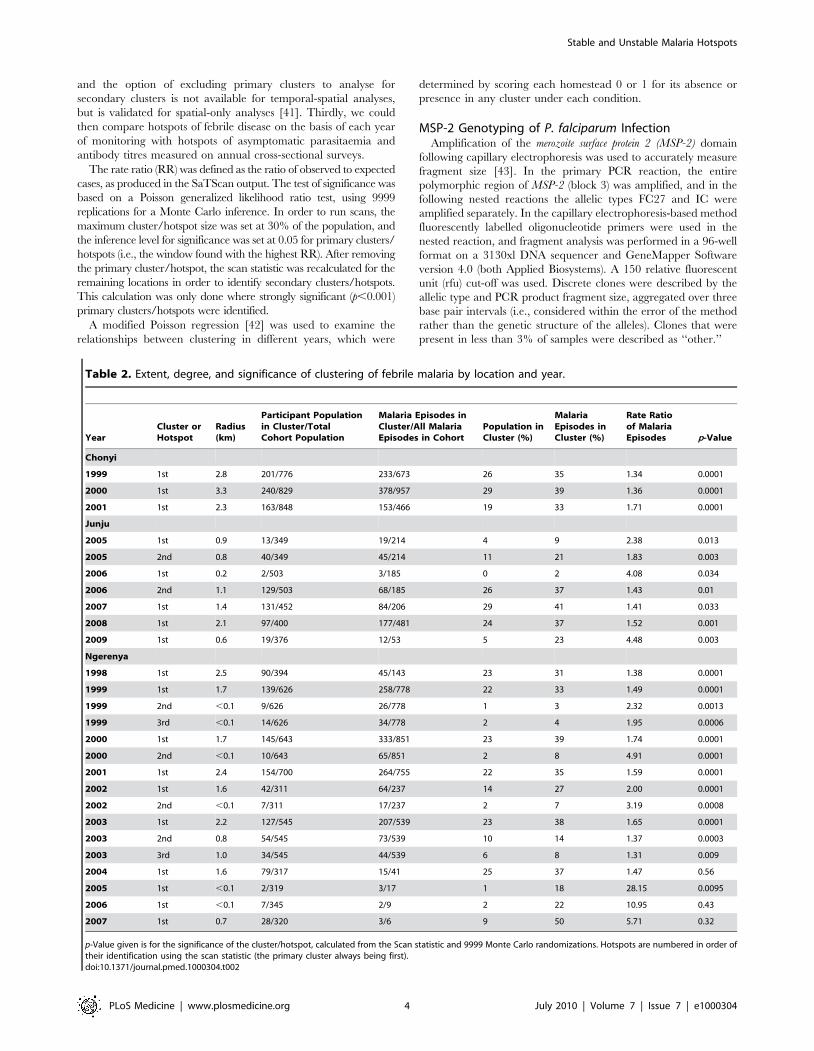
Table 1. Cohort summary characteristics.
Characteristics Chonyi Junju Ngerenya
Asymptomatic parasitaemia prevalence rate 35% 32% 14%
Incidence of febrile malaria (episodes per child year) 0.82 0.55 0.49
Average population 818 462 428
Median length of follow-up per child (y) 2.8 3.5 5.0
Median age of child (y) 5.5 4.2 5.7
Years of longitudinal monitoring in cohort 3 5 11
Homesteads 59 149 48
Participants per homestead 13.9 3.1 8.7
Average distance between adjacent sampled homesteads (km) 0.08 0.08 0.35
Age range (y) 0–80 0–12 0–90
Area including cohort dimensions N to S (km) 7 7.6 6
Area including cohort dimensions E to W (km) 9.4 7.6 8.4
The asymptomatic parasitaemia prevalence includes both adults and children. The incidence of febrile malaria is given for participants ,15 y age only.doi:10.1371/journal.pmed.1000304.t001
Stable and Unstable Malaria Hotspots
PLoS Medicine | www.plosmedicine.org 3 July 2010 | Volume 7 | Issue 7 | e1000304
and the option of excluding primary clusters to analyse for
secondary clusters is not available for temporal-spatial analyses,
but is validated for spatial-only analyses [41]. Thirdly, we could
then compare hotspots of febrile disease on the basis of each year
of monitoring with hotspots of asymptomatic parasitaemia and
antibody titres measured on annual cross-sectional surveys.
The rate ratio (RR) was defined as the ratio of observed to expected
cases, as produced in the SaTScan output. The test of significance was
based on a Poisson generalized likelihood ratio test, using 9999
replications for a Monte Carlo inference. In order to run scans, the
maximum cluster/hotspot size was set at 30% of the population, and
the inference level for significance was set at 0.05 for primary clusters/
hotspots (i.e., the window found with the highest RR). After removing
the primary cluster/hotspot, the scan statistic was recalculated for the
remaining locations in order to identify secondary clusters/hotspots.
This calculation was only done where strongly significant (p,0.001)
primary clusters/hotspots were identified.
A modified Poisson regression [42] was used to examine the
relationships between clustering in different years, which were
determined by scoring each homestead 0 or 1 for its absence or
presence in any cluster under each condition.
MSP-2 Genotyping of P. falciparum InfectionAmplification of the merozoite surface protein 2 (MSP-2) domain
following capillary electrophoresis was used to accurately measure
fragment size [43]. In the primary PCR reaction, the entire
polymorphic region of MSP-2 (block 3) was amplified, and in the
following nested reactions the allelic types FC27 and IC were
amplified separately. In the capillary electrophoresis-based method
fluorescently labelled oligonucleotide primers were used in the
nested reaction, and fragment analysis was performed in a 96-well
format on a 3130xl DNA sequencer and GeneMapper Software
version 4.0 (both Applied Biosystems). A 150 relative fluorescent
unit (rfu) cut-off was used. Discrete clones were described by the
allelic type and PCR product fragment size, aggregated over three
base pair intervals (i.e., considered within the error of the method
rather than the genetic structure of the alleles). Clones that were
present in less than 3% of samples were described as ‘‘other.’’
Table 2. Extent, degree, and significance of clustering of febrile malaria by location and year.
YearCluster orHotspot
Radius(km)
Participant Populationin Cluster/TotalCohort Population
Malaria Episodes inCluster/All MalariaEpisodes in Cohort
Population inCluster (%)
MalariaEpisodes inCluster (%)
Rate Ratioof MalariaEpisodes p-Value
Chonyi
1999 1st 2.8 201/776 233/673 26 35 1.34 0.0001
2000 1st 3.3 240/829 378/957 29 39 1.36 0.0001
2001 1st 2.3 163/848 153/466 19 33 1.71 0.0001
Junju
2005 1st 0.9 13/349 19/214 4 9 2.38 0.013
2005 2nd 0.8 40/349 45/214 11 21 1.83 0.003
2006 1st 0.2 2/503 3/185 0 2 4.08 0.034
2006 2nd 1.1 129/503 68/185 26 37 1.43 0.01
2007 1st 1.4 131/452 84/206 29 41 1.41 0.033
2008 1st 2.1 97/400 177/481 24 37 1.52 0.001
2009 1st 0.6 19/376 12/53 5 23 4.48 0.003
Ngerenya
1998 1st 2.5 90/394 45/143 23 31 1.38 0.0001
1999 1st 1.7 139/626 258/778 22 33 1.49 0.0001
1999 2nd ,0.1 9/626 26/778 1 3 2.32 0.0013
1999 3rd ,0.1 14/626 34/778 2 4 1.95 0.0006
2000 1st 1.7 145/643 333/851 23 39 1.74 0.0001
2000 2nd ,0.1 10/643 65/851 2 8 4.91 0.0001
2001 1st 2.4 154/700 264/755 22 35 1.59 0.0001
2002 1st 1.6 42/311 64/237 14 27 2.00 0.0001
2002 2nd ,0.1 7/311 17/237 2 7 3.19 0.0008
2003 1st 2.2 127/545 207/539 23 38 1.65 0.0001
2003 2nd 0.8 54/545 73/539 10 14 1.37 0.0003
2003 3rd 1.0 34/545 44/539 6 8 1.31 0.009
2004 1st 1.6 79/317 15/41 25 37 1.47 0.56
2005 1st ,0.1 2/319 3/17 1 18 28.15 0.0095
2006 1st ,0.1 7/345 2/9 2 22 10.95 0.43
2007 1st 0.7 28/320 3/6 9 50 5.71 0.32
p-Value given is for the significance of the cluster/hotspot, calculated from the Scan statistic and 9999 Monte Carlo randomizations. Hotspots are numbered in order oftheir identification using the scan statistic (the primary cluster always being first).doi:10.1371/journal.pmed.1000304.t002
Stable and Unstable Malaria Hotspots
PLoS Medicine | www.plosmedicine.org 4 July 2010 | Volume 7 | Issue 7 | e1000304
Antibody StudiesAntibody titres against recombinant antigens of P. falciparum
(3D7) were measured in a standard ELISA as reported in previous
studies in Chonyi [44–46] and in Ngerenya [45,46]. Antibody
titres were not available from Junju. The recombinant antigen
AMA-1 was provided by Sheetij Dutta and David Lanar [47], and
recombinant MSP-2 was provided by Dave Conway and Spencer
Polley using a plasmid provided by Jana McBride and David
Cavanagh [46]. The optical density (OD) reading was used as a
proxy for antibody concentration, and seropositivity was deter-
mined by an OD reading above the mean response plus three
standard deviations for nonexposed control sera.
Remote SensingMODIS is a sensor on board two NASA satellites. MODIS-
derived temperature and reflectance layers were acquired for the
years 2001 through 2008 [48]. A set of four channels; middle infra-
red reflectance, daytime land surface temperature, night-time land
surface temperature, and the enhanced vegetation index (EVI)
were then processed by a temporal Fourier algorithm to achieve
temporal ordination of the data time series while preserving
important aspects of seasonal variation in the measures [49]. Each
channel was then described by the following parameters: mean,
minimum and maximum, and the amplitude, phase and variance
of annual and bi-annual cycles decomposed from the data. A
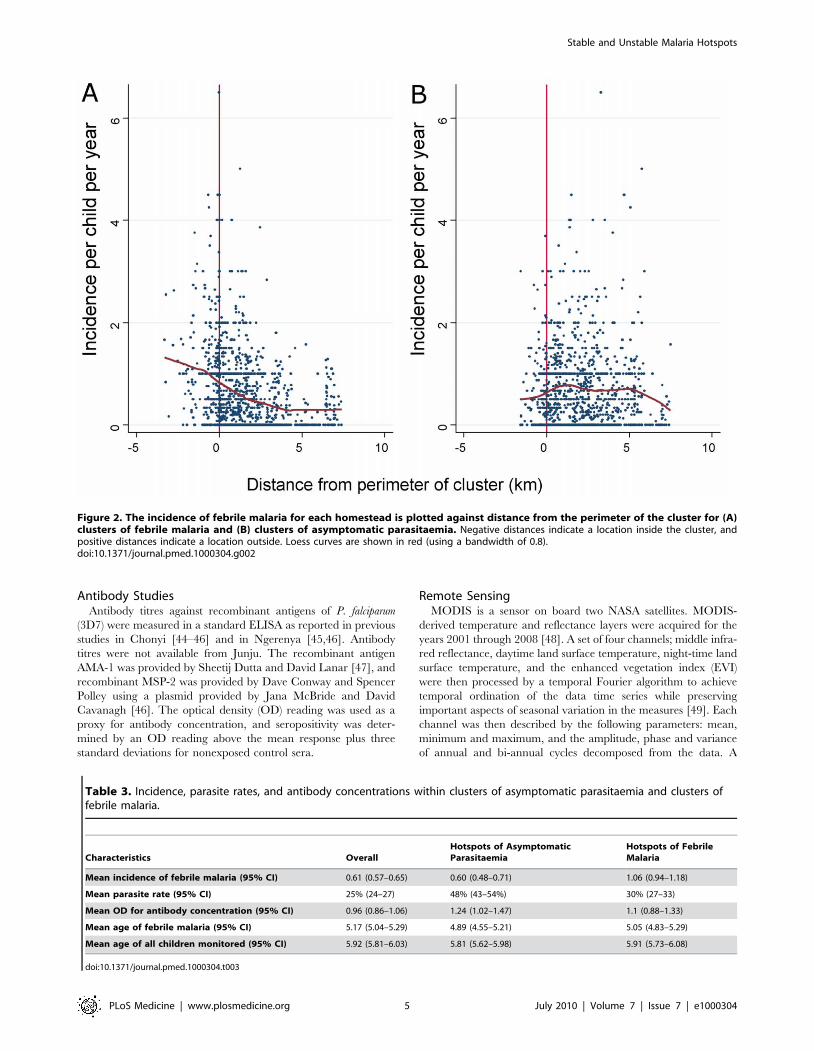
Figure 2. The incidence of febrile malaria for each homestead is plotted against distance from the perimeter of the cluster for (A)clusters of febrile malaria and (B) clusters of asymptomatic parasitaemia. Negative distances indicate a location inside the cluster, andpositive distances indicate a location outside. Loess curves are shown in red (using a bandwidth of 0.8).doi:10.1371/journal.pmed.1000304.g002
Table 3. Incidence, parasite rates, and antibody concentrations within clusters of asymptomatic parasitaemia and clusters offebrile malaria.
Characteristics OverallHotspots of AsymptomaticParasitaemia
Hotspots of FebrileMalaria
Mean incidence of febrile malaria (95% CI) 0.61 (0.57–0.65) 0.60 (0.48–0.71) 1.06 (0.94–1.18)
Mean parasite rate (95% CI) 25% (24–27) 48% (43–54%) 30% (27–33)
Mean OD for antibody concentration (95% CI) 0.96 (0.86–1.06) 1.24 (1.02–1.47) 1.1 (0.88–1.33)
Mean age of febrile malaria (95% CI) 5.17 (5.04–5.29) 4.89 (4.55–5.21) 5.05 (4.83–5.29)
Mean age of all children monitored (95% CI) 5.92 (5.81–6.03) 5.81 (5.62–5.98) 5.91 (5.73–6.08)
doi:10.1371/journal.pmed.1000304.t003
Stable and Unstable Malaria Hotspots
PLoS Medicine | www.plosmedicine.org 5 July 2010 | Volume 7 | Issue 7 | e1000304
multivariable logistic regression model to predict hotspots using
these parameters was developed from the best fit parameter in
each channel, with subsequent exclusion of nonsignificant
parameters (p.0.05). The most significant parameters from each
channel were then combined in a final multivariable logistic
regression model, with further exclusion of nonsignificant
parameters (p.0.05). There are approximately 120 MODIS
picture elements (pixels) widths/heights to each degree of
latitude/longitude at the equator (i.e., approximately 1 km
squared per pixel), so several homesteads are included in each
pixel. The logistic regression models were therefore adjusted to
take account of the nonindependence of observations by using the
sandwich estimator to group observations by pixel [50]. The
coefficients and constant from the final model (i.e., with p,0.05)
were then used with the observed remote sensing data, to derive a
predicted probability of a hotspot, which was then used to derive
sensitivity and specificities for hotspot prediction.
Results
Data were analysed from 256 homesteads in three study
cohorts, where 5,600 episodes of febrile malaria were recorded
over 32,452 person years of observation. The average incidence of
malaria was 0.49 per child per year (cpy) in the lowest incidence
cohort, and 0.82 per cpy in the highest incidence cohort (Table 1).
Behind these summary statistics was substantial heterogeneity,
with individual homestead incidences of febrile malaria ranging
from zero to two episodes per cpy over the 3–11 y of monitoring
(Figures S1 and S2).
Spatial Limits of Clusters of MalariaEpisodes of febrile malaria were aggregated in ‘‘hotspots’’ or
clusters (Table 2). The geometric mean of the RR for the
clusters was 2.35 (range 1.3–28). 14% of the population
monitored were within a hotspot at any one time. A total of
23 of the 26 hotspots were significant (i.e., p,0.05) and retained
for further analysis. 17 of the 26 were strongly significant (i.e.,
p,0.005).
The average hotspot had a 1.3-km radius. There were six
hotspots, where the apparent radius was less than the closest
distance between sampled homesteads (i.e., the hotspot was a
single homestead). All these hotspots were in Ngerenya, where
there was the greatest distance between sampled homesteads
(Table 1).
Asymptomatic parasitaemia was also aggregated into hotspots,
with a geometric mean RR of 2.9 (range 1.5–15). 14% of the
population monitored were within a hotspot. 19 of the 35 potential
hotspots identified were significant (p,0.05) and retained for
further analysis. Six were strongly significant (p,0.005). The
average radius of these hotspots was 1 km.
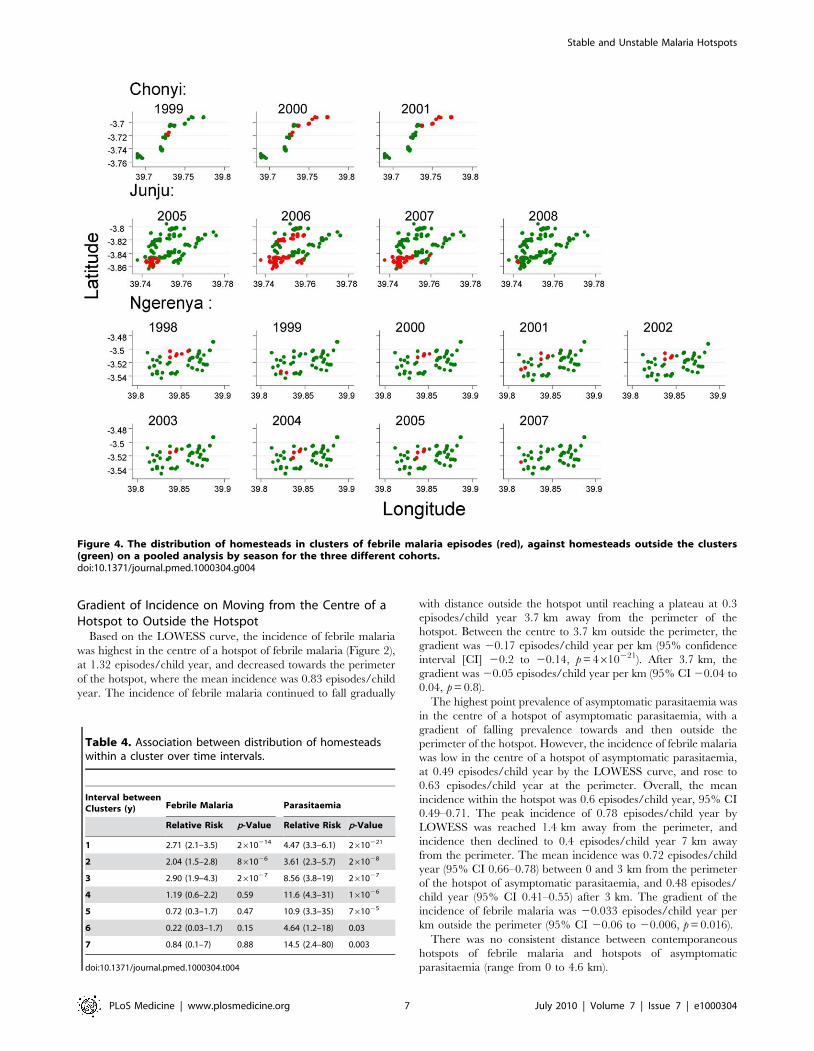
Figure 3. The distribution of homesteads in clusters of febrile malaria episodes (red), against homesteads outside the clusters(green) by year of monitoring for the three different cohorts.doi:10.1371/journal.pmed.1000304.g003
Stable and Unstable Malaria Hotspots
PLoS Medicine | www.plosmedicine.org 6 July 2010 | Volume 7 | Issue 7 | e1000304
Gradient of Incidence on Moving from the Centre of aHotspot to Outside the Hotspot
Based on the LOWESS curve, the incidence of febrile malaria
was highest in the centre of a hotspot of febrile malaria (Figure 2),
at 1.32 episodes/child year, and decreased towards the perimeter
of the hotspot, where the mean incidence was 0.83 episodes/child
year. The incidence of febrile malaria continued to fall gradually
with distance outside the hotspot until reaching a plateau at 0.3
episodes/child year 3.7 km away from the perimeter of the
hotspot. Between the centre to 3.7 km outside the perimeter, the
gradient was 20.17 episodes/child year per km (95% confidence
interval [CI] 20.2 to 20.14, p = 4610221). After 3.7 km, the
gradient was 20.05 episodes/child year per km (95% CI 20.04 to
0.04, p = 0.8).
The highest point prevalence of asymptomatic parasitaemia was
in the centre of a hotspot of asymptomatic parasitaemia, with a
gradient of falling prevalence towards and then outside the
perimeter of the hotspot. However, the incidence of febrile malaria
was low in the centre of a hotspot of asymptomatic parasitaemia,
at 0.49 episodes/child year by the LOWESS curve, and rose to
0.63 episodes/child year at the perimeter. Overall, the mean
incidence within the hotspot was 0.6 episodes/child year, 95% CI
0.49–0.71. The peak incidence of 0.78 episodes/child year by
LOWESS was reached 1.4 km away from the perimeter, and
incidence then declined to 0.4 episodes/child year 7 km away
from the perimeter. The mean incidence was 0.72 episodes/child
year (95% CI 0.66–0.78) between 0 and 3 km from the perimeter
of the hotspot of asymptomatic parasitaemia, and 0.48 episodes/
child year (95% CI 0.41–0.55) after 3 km. The gradient of the
incidence of febrile malaria was 20.033 episodes/child year per
km outside the perimeter (95% CI 20.06 to 20.006, p = 0.016).
There was no consistent distance between contemporaneous
hotspots of febrile malaria and hotspots of asymptomatic
parasitaemia (range from 0 to 4.6 km).
Figure 4. The distribution of homesteads in clusters of febrile malaria episodes (red), against homesteads outside the clusters(green) on a pooled analysis by season for the three different cohorts.doi:10.1371/journal.pmed.1000304.g004
Table 4. Association between distribution of homesteadswithin a cluster over time intervals.
Interval betweenClusters (y) Febrile Malaria Parasitaemia
Relative Risk p-Value Relative Risk p-Value
1 2.71 (2.1–3.5) 2610214 4.47 (3.3–6.1) 2610221
2 2.04 (1.5–2.8) 861026 3.61 (2.3–5.7) 261028
3 2.90 (1.9–4.3) 261027 8.56 (3.8–19) 261027
4 1.19 (0.6–2.2) 0.59 11.6 (4.3–31) 161026
5 0.72 (0.3–1.7) 0.47 10.9 (3.3–35) 761025
6 0.22 (0.03–1.7) 0.15 4.64 (1.2–18) 0.03
7 0.84 (0.1–7) 0.88 14.5 (2.4–80) 0.003
doi:10.1371/journal.pmed.1000304.t004
Stable and Unstable Malaria Hotspots
PLoS Medicine | www.plosmedicine.org 7 July 2010 | Volume 7 | Issue 7 | e1000304
Malariometrics of Hotspots of Febrile Malaria VersusHotspots of Asymptomatic Parasitaemia
Children within hotspots of asymptomatic parasitaemia had
higher antibody titres on cross-sectional samples, and a lower
mean age at the time of febrile malaria than children in hotspots of
febrile malaria (Table 3). As a consequence of their respective
definitions, the parasite rates were higher in hotspots of
asymptomatic parasitaemia and the incidence of febrile malaria
higher in hotspots of febrile malaria.
Temporal Stability of HotspotsThe position of hotspoting of febrile malaria changed from year
to year in two study areas, although there was a subset of houses
that remained within hotspots from year to year (Figure 3).
Overall, the distribution of homesteads in a hotspot was
moderately predictive of the distribution of hotspots for the
following year, but became less predictive of the hotspots present
after 4 y or longer. In contrast, hotspots of asymptomatic
parasitaemia were more stable over time (Figure 4). The
distribution of homesteads was more strongly predictive of
hotspots the next year, and was still predictive of hotspots 7 y
later (Table 4).
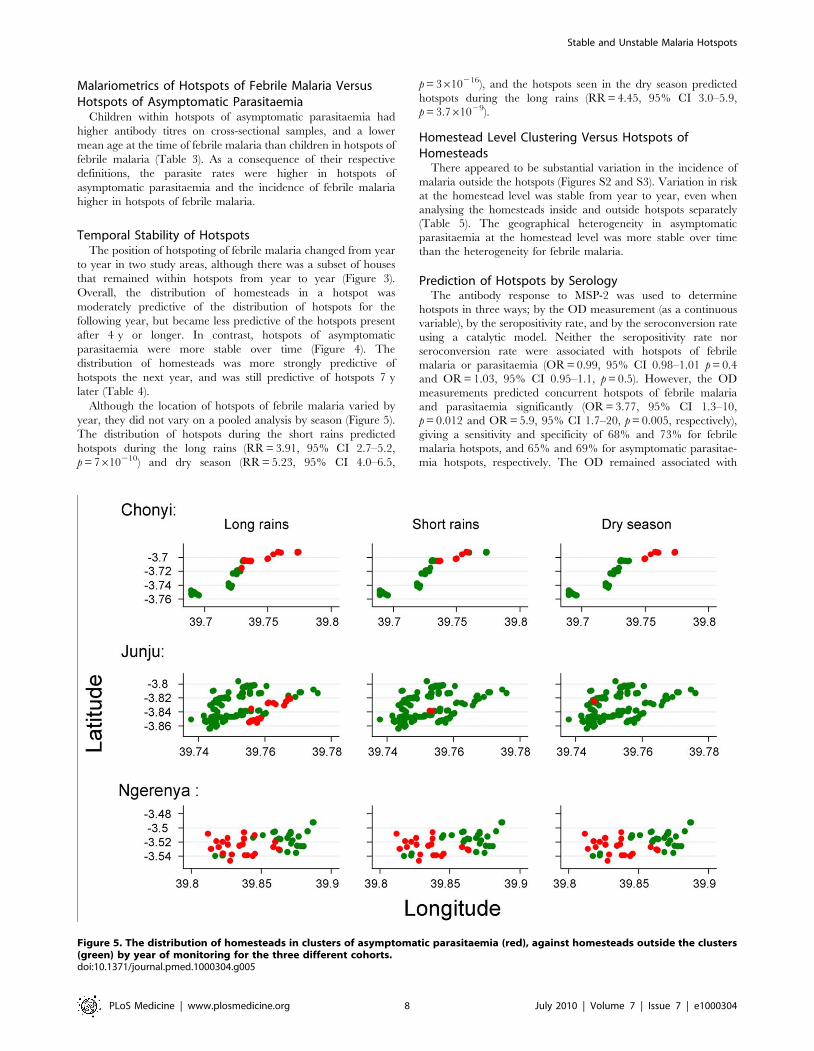
Although the location of hotspots of febrile malaria varied by
year, they did not vary on a pooled analysis by season (Figure 5).
The distribution of hotspots during the short rains predicted
hotspots during the long rains (RR = 3.91, 95% CI 2.7–5.2,
p = 7610210) and dry season (RR = 5.23, 95% CI 4.0–6.5,
p = 3610216), and the hotspots seen in the dry season predicted
hotspots during the long rains (RR = 4.45, 95% CI 3.0–5.9,
p = 3.761029).
Homestead Level Clustering Versus Hotspots ofHomesteads
There appeared to be substantial variation in the incidence of
malaria outside the hotspots (Figures S2 and S3). Variation in risk
at the homestead level was stable from year to year, even when
analysing the homesteads inside and outside hotspots separately
(Table 5). The geographical heterogeneity in asymptomatic
parasitaemia at the homestead level was more stable over time
than the heterogeneity for febrile malaria.
Prediction of Hotspots by SerologyThe antibody response to MSP-2 was used to determine
hotspots in three ways; by the OD measurement (as a continuous
variable), by the seropositivity rate, and by the seroconversion rate
using a catalytic model. Neither the seropositivity rate nor
seroconversion rate were associated with hotspots of febrile
malaria or parasitaemia (OR = 0.99, 95% CI 0.98–1.01 p = 0.4
and OR = 1.03, 95% CI 0.95–1.1, p = 0.5). However, the OD
measurements predicted concurrent hotspots of febrile malaria
and parasitaemia significantly (OR = 3.77, 95% CI 1.3–10,
p = 0.012 and OR = 5.9, 95% CI 1.7–20, p = 0.005, respectively),
giving a sensitivity and specificity of 68% and 73% for febrile
malaria hotspots, and 65% and 69% for asymptomatic parasitae-
mia hotspots, respectively. The OD remained associated with
Figure 5. The distribution of homesteads in clusters of asymptomatic parasitaemia (red), against homesteads outside the clusters(green) by year of monitoring for the three different cohorts.doi:10.1371/journal.pmed.1000304.g005
Stable and Unstable Malaria Hotspots
PLoS Medicine | www.plosmedicine.org 8 July 2010 | Volume 7 | Issue 7 | e1000304

asymptomatic parasitaemia hotspots 3 y after the original
measurement (OR = 20.1, 95% CI 1.2–300, p = 0.037), and with
febrile malaria hotspots 2 y later (OR = 4.1, 95% CI 1.5–11,
p = 0.005) but not at 3 y (OR = 2.5, 95% CI 0.3–18, p = 0.4).
AMA-1 responses were associated with hotspots of asymptom-
atic parasitaemia (OR = 3.5, 95% CI 1.3–10, p = 0.016) but not
hotspots of febrile malaria (OR = 1.5, 95% CI 0.7–3.5, p = 0.3)
(See Figure S1 for receiver operating characteristic [ROC] curves
for antibody titres).
Prediction of Hotspots by Remote Sensing DataEnvironmental factors indicated by remote sensing data were
strongly implicated in determining hotspots of asymptomatic
parasitaemia, either by selection of dominant parameters or from
principal component analysis (Table 6). The first three components
of the principal component analysis had Eigenvalues of 7.09, 5.97,
and 4.43, accounting for 49% of the total variance. The remaining
components had Eigenvalues ,3, and each accounted for 8% or
less of the total variance. Definitions based on the logistic regression
models from the MODIS satellite data were 65% sensitive and 67%
specific from principal component analysis or 81% sensitive and
63% specific based on the model of selected independent predictors.
Hotspots of febrile malaria were less strongly linked to the
remote sensing data, and the significant factors differed from those
that identified hotspots of asymptomatic parasitaemia. Definitions
for febrile malaria hotspots were only 62% sensitive and 30%
specific from principal components or 81% sensitive and 50%
specific from the selected independent predictor (see Figure S3).
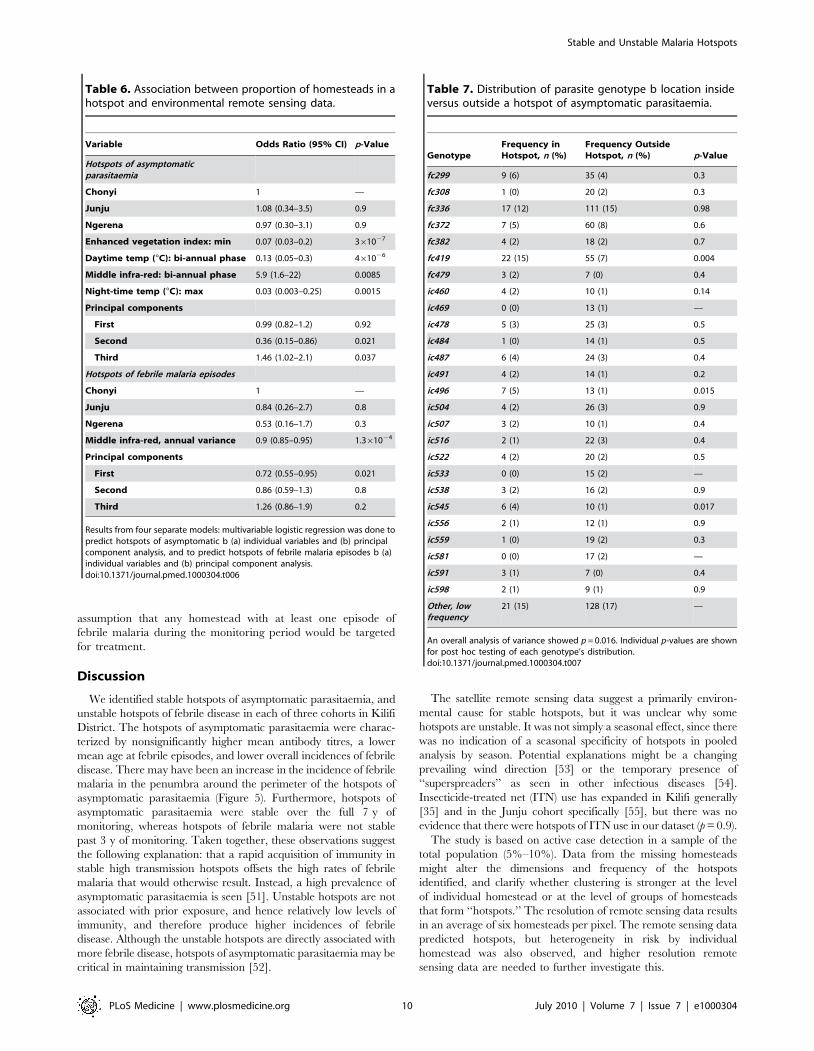
Parasite Genotyping Data by HotspotIn Junju parasite genotypes according to MSP-2 fragment size
by capillary tube electrophoresis were available. There were 26
common alleles (i.e., represented in more than ten individuals)
and 66 less common alleles that were classified as ‘‘other’’. An
overall analysis of variance showed significant variation in the
distribution of clones (p = 0.016). Post hoc testing (Table 7)
suggested that this variation was due to three genotypes that were
overrepresented inside the hotspot: fc419 (16% versus 8%,
p = 0.004); ic496 (5% versus 2%, p = 0.015); and ic545 (4% versus
1%, p = 0.017).
Predicted Operational Performance of Predictors ofHeterogeneity
Using antibody titres, 20% of homesteads would be identified
for an intervention with a cut-off of mean titre .1.0 OD, but only
37% of the whole cohort’s malaria episodes would occur in these
homesteads. In order to include 50% of the malaria episodes, a
cut-off of 0.85 would be required, and this would require 32% of
the homesteads in the study area to be treated.
Table 8 shows the results of monitoring episodes of febrile
malaria during 1 or 2 mo of surveillance to predict febrile
malaria episodes during the following year, on the basis of the
Table 5. Association between incidence and parasite rates by individual homesteads over time intervals.
Interval between Clusters (y) Febrile malaria Parasitaemia
Correlation Coefficient (r) p-Value Correlation Coefficient (r) p-Value
Overall
1 0.57 ,0.00005 0.52 ,0.00005
2 0.44 ,0.00005 0.43 ,0.00005
3 0.41 ,0.00005 0.47 ,0.00005
4 0.25 ,0.00005 0.3 ,0.00005
5 20.12 0.03 0.29 ,0.00005
6 20.02 0.8 0.16 0.018
7 20.06 0.33 0.1 0.22
Inside cluster
1 0.4 ,0.00005 0.37 ,0.00005
2 0.24 0.026 0.38 0.016
3 0.37 0.003 0.64 0.001
4 0.2 0.15 0.2 0.45
5 20.26 0.12 0.38 0.22
6 0.06 0.83 20.14 0.7
7 20.07 0.86 0.03 0.9
Outside cluster
1 0.46 ,0.00005 0.46 ,0.00005
2 0.29 ,0.00005 0.39 ,0.00005
3 0.11 0.06 0.39 ,0.00005
4 0.03 0.63 0.2 0.0016
5 20.16 0.02 0.21 0.0039
6 20.02 0.77 0.1 0.24
7 20.07 0.41 20.03 0.7
doi:10.1371/journal.pmed.1000304.t005
Stable and Unstable Malaria Hotspots
PLoS Medicine | www.plosmedicine.org 9 July 2010 | Volume 7 | Issue 7 | e1000304
assumption that any homestead with at least one episode of
febrile malaria during the monitoring period would be targeted
for treatment.
Discussion
We identified stable hotspots of asymptomatic parasitaemia, and
unstable hotspots of febrile disease in each of three cohorts in Kilifi
District. The hotspots of asymptomatic parasitaemia were charac-
terized by nonsignificantly higher mean antibody titres, a lower
mean age at febrile episodes, and lower overall incidences of febrile
disease. There may have been an increase in the incidence of febrile
malaria in the penumbra around the perimeter of the hotspots of
asymptomatic parasitaemia (Figure 5). Furthermore, hotspots of
asymptomatic parasitaemia were stable over the full 7 y of
monitoring, whereas hotspots of febrile malaria were not stable
past 3 y of monitoring. Taken together, these observations suggest
the following explanation: that a rapid acquisition of immunity in
stable high transmission hotspots offsets the high rates of febrile
malaria that would otherwise result. Instead, a high prevalence of
asymptomatic parasitaemia is seen [51]. Unstable hotspots are not
associated with prior exposure, and hence relatively low levels of
immunity, and therefore produce higher incidences of febrile
disease. Although the unstable hotspots are directly associated with
more febrile disease, hotspots of asymptomatic parasitaemia may be
critical in maintaining transmission [52].
The satellite remote sensing data suggest a primarily environ-
mental cause for stable hotspots, but it was unclear why some
hotspots are unstable. It was not simply a seasonal effect, since there
was no indication of a seasonal specificity of hotspots in pooled
analysis by season. Potential explanations might be a changing
prevailing wind direction [53] or the temporary presence of
‘‘superspreaders’’ as seen in other infectious diseases [54].
Insecticide-treated net (ITN) use has expanded in Kilifi generally
[35] and in the Junju cohort specifically [55], but there was no
evidence that there were hotspots of ITN use in our dataset (p = 0.9).
The study is based on active case detection in a sample of the
total population (5%–10%). Data from the missing homesteads
might alter the dimensions and frequency of the hotspots
identified, and clarify whether clustering is stronger at the level
of individual homestead or at the level of groups of homesteads
that form ‘‘hotspots.’’ The resolution of remote sensing data results
in an average of six homesteads per pixel. The remote sensing data
predicted hotspots, but heterogeneity in risk by individual
homestead was also observed, and higher resolution remote
sensing data are needed to further investigate this.
Table 6. Association between proportion of homesteads in ahotspot and environmental remote sensing data.
Variable Odds Ratio (95% CI) p-Value
Hotspots of asymptomaticparasitaemia
Chonyi 1 —
Junju 1.08 (0.34–3.5) 0.9
Ngerena 0.97 (0.30–3.1) 0.9
Enhanced vegetation index: min 0.07 (0.03–0.2) 361027
Daytime temp (uC): bi-annual phase 0.13 (0.05–0.3) 461026
Middle infra-red: bi-annual phase 5.9 (1.6–22) 0.0085
Night-time temp (uC): max 0.03 (0.003–0.25) 0.0015
Principal components
First 0.99 (0.82–1.2) 0.92
Second 0.36 (0.15–0.86) 0.021
Third 1.46 (1.02–2.1) 0.037
Hotspots of febrile malaria episodes
Chonyi 1 —
Junju 0.84 (0.26–2.7) 0.8
Ngerena 0.53 (0.16–1.7) 0.3
Middle infra-red, annual variance 0.9 (0.85–0.95) 1.361024
Principal components
First 0.72 (0.55–0.95) 0.021
Second 0.86 (0.59–1.3) 0.8
Third 1.26 (0.86–1.9) 0.2
Results from four separate models: multivariable logistic regression was done topredict hotspots of asymptomatic b (a) individual variables and (b) principalcomponent analysis, and to predict hotspots of febrile malaria episodes b (a)individual variables and (b) principal component analysis.doi:10.1371/journal.pmed.1000304.t006
Table 7. Distribution of parasite genotype b location insideversus outside a hotspot of asymptomatic parasitaemia.
GenotypeFrequency inHotspot, n (%)
Frequency OutsideHotspot, n (%) p-Value
fc299 9 (6) 35 (4) 0.3
fc308 1 (0) 20 (2) 0.3
fc336 17 (12) 111 (15) 0.98
fc372 7 (5) 60 (8) 0.6
fc382 4 (2) 18 (2) 0.7
fc419 22 (15) 55 (7) 0.004
fc479 3 (2) 7 (0) 0.4
ic460 4 (2) 10 (1) 0.14
ic469 0 (0) 13 (1) —
ic478 5 (3) 25 (3) 0.5
ic484 1 (0) 14 (1) 0.5
ic487 6 (4) 24 (3) 0.4
ic491 4 (2) 14 (1) 0.2
ic496 7 (5) 13 (1) 0.015
ic504 4 (2) 26 (3) 0.9
ic507 3 (2) 10 (1) 0.4
ic516 2 (1) 22 (3) 0.4
ic522 4 (2) 20 (2) 0.5
ic533 0 (0) 15 (2) —
ic538 3 (2) 16 (2) 0.9
ic545 6 (4) 10 (1) 0.017
ic556 2 (1) 12 (1) 0.9
ic559 1 (0) 19 (2) 0.3
ic581 0 (0) 17 (2) —
ic591 3 (1) 7 (0) 0.4
ic598 2 (1) 9 (1) 0.9
Other, lowfrequency
21 (15) 128 (17) —
An overall analysis of variance showed p = 0.016. Individual p-values are shownfor post hoc testing of each genotype’s distribution.doi:10.1371/journal.pmed.1000304.t007
Stable and Unstable Malaria Hotspots
PLoS Medicine | www.plosmedicine.org 10 July 2010 | Volume 7 | Issue 7 | e1000304
The instability of hotspots of febrile malaria was not simply due
to variations in age of the children monitored (Table 3).
Furthermore, stable hotspots of asymptomatic parasitaemia were
observed in Junju, where only children and not adults were
recruited to the cohort. Although the three cohorts monitored
were from geographically different areas, the study is limited by
presenting data from a single district, and so cannot represent the
great diversity of ecology that will be seen across sub-Saharan
Africa. Other cohorts undergoing longitudinal surveillance should
be examined to confirm our findings.
Malaria transmission varies by geographical features such as
altitude [13], cultivation practices [14], streams and dams [16],
house construction [56], socioeconomic factors [57], and ITN use
[58]. Data on these factors were not available for the analysis
presented here, although there were no large water bodies in the
study area. However, a previous analysis in one of the study areas
demonstrated that both environmental factors at the homestead
level and host genetic factors contributed substantially to variation
in malaria risk [10].
Our analysis suggests that environmental factors identified by
remote sensing are associated with stable hotspots of asymptomatic
parasitaemia. The environment in Kenya is seasonal, with two
rainy seasons per year. The strongest individual factors from
remote sensing were not the means of any index, but rather the
minimum, and phases for a vegetation index and indicators of
temperature, consistent with previous studies that have demon-
strated the importance of temporal monitoring [12]. The remote
sensing data show strong cross-correlation, and significant
individual factors are likely to be proxies for more complex
environmental determinants of transmission. 48 different measures
of remote sensing were tested, but after a Bonferroni correction
p = 1.461025 and p = 261024 for the two most significant
individual factors.
The evidence for environmental causation of the unstable
hotspots of febrile malaria was less strong. Nevertheless, p = 0.006
after a Bonferroni correction for the single individual factor
retained in the final model.
On principle component analysis the second and third
components were significantly associated with hotspots of
asymptomatic parasitaemia, but the first component was associ-
ated with hotspots of febrile malaria. This finding is consistent with
a complex environmental causation of hotspots rather than a
single factor, and different environmental causes for the two types
of hotspot.
Anti-AMA antibody titres were associated with hotspots, but
seroprevalence and seroconversion rates did not predict hotspots.
This association contrasts with previous findings on a larger
geographical scale [59]. The effects of individual variation may
become more noticeable on a smaller scale [60], and smaller scale
hotspots are unlikely to be as stable as environmental features such
as altitude that operate on a larger scale [61].
There was substantial heterogeneity of transmission inside and
outside hotspots. This heterogeneity was not simply random
variation, since the previous year’s incidence per homestead was
strongly predictive of subsequent risk (r = 0.57). Variation in
malaria risk at the homestead level has been shown to be due to a
mixture of genetic and environmental factors [10,11]. Irrespective
of the cause, hotspots have a substantial effect on overall
transmission in the community [2]. Here, we demonstrate two
levels of clustering; clustering at the homestead level, and hotspots
of groups of high risk homesteads in 1.3-km radius areas. The
‘‘gradient’’ effect away from the perimeter of a hotspot is
consistent with transmission in the majority of the cohort being
maintained by transmission from within the hotspot of home-
steads. Hence, targeting the 73% of febrile malaria within the 28%
highest risk homesteads is likely to benefit the wider community,
since the highest risk homesteads will increase transmission in the
surrounding area [1].
The genotyping data suggest that individual parasite clones are
associated with a hotspot of asymptomatic parasitaemia. This
finding may be because particular hosts more frequently transmit
their parasites within a hotspot [54], or because particular parasite
clones have adapted to a geographical micro-environment,
determined, for instance, by the vector species [62]. Genotypes
were not available from febrile disease episodes.
Clustering of episodes by individual is reported in many infectious
diseases [1], and has been relevant to the control of diverse
pathogens such as Escherichia coli [54], tuberculosis [63], gonorrhea
[64], SARS [65], and leishmaniasis [66]. Clustering of malaria
episodes by homestead [10] and larger geographical hotspots
including groups of homesteads is well described [3–9,67], but there
are few data on the temporal stability of hotspots.
Targeted strategies for malaria control need to consider two
kinds of hotspot; stable hotspots of asymptomatic parasitaemia and
unstable hotspots of febrile disease. One might argue against
intervening in hotspots of asymptomatic parasitaemia, since rates
of febrile disease are not high, and intervention might reduce host
immunity. However, where transmission has fallen in areas of high
transmission, substantial direct and indirect mortality and public
health gains have been described in the short and long term
[35,68,69]. Furthermore, these stable hotspots probably feed
transmission in their penumbrae for a distance of several
kilometres because of vector dispersion [24–29]. Hotspots of
asymptomatic parasitaemia can be identified by parasite surveys,
serological surveys, or, more conveniently, remote sensing.
Hotspots of febrile disease may be targeted by monitoring
presentations to the local dispensary during the dry season, and
targeting the effected homesteads during the subsequent rains.
The optimal protocol would be to monitor during the dry season
in September and then treat for the following year, which would
result in targeting 20% of the homesteads, accounting for 65% of
the febrile malaria episodes during the following year. It is optimal
to cover 100% of the homesteads with any control intervention
(particularly ITN distribution). However, some other interventions
are currently not practical on community-wide scale, such as
repeated mass drug administration [70,71], environmental
modification [72–74], mass vaccination [75], or (in some
circumstances) indoor residual spraying (IRS) [76–78], but
become feasible if targeted on the 20% of homesteads at greatest
risk.
Table 8. Predicted performance if all homesteads with one ormore episode of febrile malaria during 1-mo monitoring aretargeted for measures to interrupt transmission over thefollowing year.
MonitoringPercent HomesteadsTargeted
Percent MalariaCovered
January (short rains) 28 73
March (dry) 17 48
May (start long rains) 26 68
September (dry) 20 65
November (dry) 17 56
doi:10.1371/journal.pmed.1000304.t008
Stable and Unstable Malaria Hotspots
PLoS Medicine | www.plosmedicine.org 11 July 2010 | Volume 7 | Issue 7 | e1000304
When transmission has reduced to very low levels, transmission
remains geographically clustered [9,79], and intensified control in
these hotspots is key to achieving elimination. In our setting, as in
much of sub-Saharan Africa, there is not an immediate prospect of
elimination. Additional targeted control measures may be viewed
simply as a cost-effective way of ensuring that those most in need
get the intervention, but the stronger justification is that reducing
transmission in hotspots will reduce transmission on the wider
community [1].
Environmental interactions are complex in determining malaria
risk per se [12], and so these findings should be validated in other
datasets before firm recommendations for malaria control
programmes are made.
Supporting Information
Figure S1 Receiver operator characteristics (ROCs) are shown
for AMA-1 antibodies, MSP-2 antibodies, and for the model on
the basis of selected remote sensing variables and principle
component analysis of the remote sensing variables. The areas
under the ROC curves were 0.61, 0.67, 0.68, and 0.68 for
prediction of febrile malaria hotspots by AMA-1 and MSP-2
antibodies, and for the model and principal component analyses,
respectively. For asymptomatic parasitaemia hotspots the areas
under the curves were 0.70, 0.72, 0.82, and 0.73, respectively.
Found at: doi:10.1371/journal.pmed.1000304.s001 (0.61 MB
TIF)
Figure S2 The incidence of febrile malaria episodes cpy is
shown for the three cohorts. More intense green colouring
indicates higher incidence.
Found at: doi:10.1371/journal.pmed.1000304.s002 (0.48 MB
TIF)
Figure S3 The prevalence of asymptomatic malaria is shown for
the three cohorts. More intense green colouring indicates higher
incidence.
Found at: doi:10.1371/journal.pmed.1000304.s003 (0.47 MB
TIF)
Acknowledgments
The paper is published with the permission of the director of the KEMRI.
MODIS data were processed and made available by David Benz, Spatial
Ecology and Epidemiology group, Department of Zoology, University of
Oxford. Greg Fegan, David Conway, and Teun Bousema are thanked for
helpful comments on the analysis and write-up. Jana McBride and David
Cavanagh provided plasmid clones to produce MSP-2; Sheetij Dutta and
David Lanar provided AMA-1 recombinant antigen; and David Conway,
Spencer Polley, and Kevin Tetteh provided support in producing
recombinant antigens.
Author Contributions
ICMJE criteria for authorship read and met: PB TNW AL AMN JW EO
AO FHO SIH AF KM. Agree with the manuscript’s results and
conclusions: PB TNW AL AMN JW EO AO FHO SIH AF KM.
Designed the experiments/the study: PB FHO KM. Analyzed the data:
PB. Collected data/did experiments for the study: PB TNW AL JW EO
AO FHO SIH. Enrolled patients: PB TNW JW EO. Wrote the first draft of
the paper: PB. Contributed to the writing of the paper: PB TNW AL AMN
AO FHO SIH KM. Overall data manager for the cohorts from which
these data were derived and was responsible for data integrity: EO.
Contributed data, interpretation, and writing of the paper: AF.
References
1. Woolhouse ME, Dye C, Etard JF, Smith T, Charlwood JD, et al. (1997)
Heterogeneities in the transmission of infectious agents: implications for the
design of control programs. Proc Natl Acad Sci U S A 94: 338–342.
2. Smith DL, McKenzie FE, Snow RW, Hay SI (2007) Revisiting the basic
reproductive number for malaria and its implications for malaria control. PLoS
Biol 5: e42. doi:10.1371/journal.pbio.0050042.
3. Mackinnon MJ, Gunawardena DM, Rajakaruna J, Weerasingha S, Mendis KN,
et al. (2000) Quantifying genetic and nongenetic contributions to malarial
infection in a Sri Lankan population. Proc Natl Acad Sci U S A 97:
12661–12666.
4. Gamage-Mendis AC, Carter R, Mendis C, De Zoysa AP, Herath PR, et al.
(1991) Clustering of malaria infections within an endemic population: risk of
malaria associated with the type of housing construction. Am J Trop Med Hyg
45: 77–85.
5. Ghebreyesus TA, Haile M, Witten KH, Getachew A, Yohannes M, et al. (2000)
Household risk factors for malaria among children in the Ethiopian highlands.
Trans R Soc Trop Med Hyg 94: 17–21.
6. Gaudart J, Poudiougou B, Dicko A, Ranque S, Toure O, et al. (2006) Space-
time clustering of childhood malaria at the household level: a dynamic cohort in
a Mali village. BMC Public Health 6: 286.
7. Kreuels B, Kobbe R, Adjei S, Kreuzberg C, von Reden C, et al. (2008) Spatial
variation of malaria incidence in young children from a geographically
homogeneous area with high endemicity. J Infect Dis 197: 85–93.
8. Smith DL, Dushoff J, Snow RW, Hay SI (2005) The entomological inoculation
rate and Plasmodium falciparum infection in African children. Nature 438:
492–495.
9. Belizario VY, Saul A, Bustos MD, Lansang MA, Pasay CJ, et al. (1997) Field
epidemiological studies on malaria in a low endemic area in the Philippines.
Acta Trop 63: 241–256.
10. Mackinnon MJ, Mwangi TW, Snow RW, Marsh K, Williams TN (2005)
Heritability of malaria in Africa. PLoS Med 2: e340. doi:10.1371/
journal.pmed.0020340.
11. Mwangi TW, Fegan G, Williams TN, Kinyanjui SM, Snow RW, et al. (2008)
Evidence for over-dispersion in the distribution of clinical malaria episodes in
children. PLoS ONE 3: e2196. doi:10.1371/journal.pone.0002196.
12. Rogers DJ, Randolph SE, Snow RW, Hay SI (2002) Satellite imagery in the
study and forecast of malaria. Nature 415: 710–715.
13. Reyburn H, Mbatia R, Drakeley C, Bruce J, Carneiro I, et al. (2005) Association
of transmission intensity and age with clinical manifestations and case fatality of
severe Plasmodium falciparum malaria. JAMA 293: 1461–1470.
14. Lindsay SW, Wilkins HA, Zieler HA, Daly RJ, Petrarca V, et al. (1991) Ability ofAnopheles gambiae mosquitoes to transmit malaria during the dry and wet seasons
in an area of irrigated rice cultivation in The Gambia. J Trop Med Hyg 94:313–324.
15. Hay SI, Guerra CA, Tatem AJ, Atkinson PM, Snow RW (2005) Urbanization,
malaria transmission and disease burden in Africa. Nat Rev Microbiol 3: 81–90.
16. Ghebreyesus TA, Haile M, Witten KH, Getachew A, Yohannes AM, et al.
(1999) Incidence of malaria among children living near dams in northernEthiopia: community based incidence survey. BMJ 319: 663–666.
17. Omumbo JA, Hay SI, Snow RW, Tatem AJ, Rogers DJ (2005) Modelling
malaria risk in East Africa at high-spatial resolution. Trop Med Int Health 10:557–566.
18. Craig MH, Sharp BL, Mabaso ML, Kleinschmidt I (2007) Developing a spatial-
statistical model and map of historical malaria prevalence in Botswana using astaged variable selection procedure. Int J Health Geogr 6: 44.
19. Snow RW, Gouws E, Omumbo J, Rapuoda B, Craig MH, et al. (1998) Models
to predict the intensity of Plasmodium falciparum transmission: applications to the
burden of disease in Kenya. Trans R Soc Trop Med Hyg 92: 601–606.
20. Gemperli A, Sogoba N, Fondjo E, Mabaso M, Bagayoko M, et al. (2006)Mapping malaria transmission in West and Central Africa. Trop Med Int
Health 11: 1032–1046.
21. Noor AM, Clements AC, Gething PW, Moloney G, Borle M, et al. (2008)Spatial prediction of Plasmodium falciparum prevalence in Somalia. Malar J 7: 159.
22. Kleinschmidt I, Sharp BL, Clarke GP, Curtis B, Fraser C (2001) Use of
generalized linear mixed models in the spatial analysis of small-area malaria
incidence rates in Kwazulu Natal, South Africa. Am J Epidemiol 153:1213–1221.
23. Hay SI (2000) An overview of remote sensing and geodesy for epidemiology and
public health application. Adv Parasitol 47: 1–35.
24. Trape JF, Lefebvre-Zante E, Legros F, Ndiaye G, Bouganali H, et al. (1992)Vector density gradients and the epidemiology of urban malaria in Dakar,
Senegal. Am J Trop Med Hyg 47: 181–189.
25. Thompson R, Begtrup K, Cuamba N, Dgedge M, Mendis C, et al. (1997) The
Matola malaria project: a temporal and spatial study of malaria transmission anddisease in a suburban area of Maputo, Mozambique. Am J Trop Med Hyg 57:
550–559.
26. Thomas CJ, Lindsay SW (2000) Local-scale variation in malaria infectionamongst rural Gambian children estimated by satellite remote sensing.
Trans R Soc Trop Med Hyg 94: 159–163.
27. Lindsay SW, Alonso PL, Armstrong Schellenberg JR, Hemingway J, Thomas PJ,
et al. (1993) A malaria control trial using insecticide-treated bed nets and
Stable and Unstable Malaria Hotspots
PLoS Medicine | www.plosmedicine.org 12 July 2010 | Volume 7 | Issue 7 | e1000304
targeted chemoprophylaxis in a rural area of The Gambia, west Africa. 3.
Entomological characteristics of the study area. Trans R Soc Trop Med Hyg 87Suppl 2: 19–23.
28. Bogh C, Lindsay SW, Clarke SE, Dean A, Jawara M, et al. (2007) High spatialresolution mapping of malaria transmission risk in the Gambia, west Africa,
using LANDSAT TM satellite imagery. Am J Trop Med Hyg 76: 875–881.
29. Midega JT, Mbogo CM, Mwnambi H, Wilson MD, Ojwang G, et al. (2007)
Estimating dispersal and survival of Anopheles gambiae and Anopheles funestus alongthe Kenyan coast by using mark-release-recapture methods. J Med Entomol 44:
923–929.
30. Yeshiwondim AK, Gopal S, Hailemariam AT, Dengela DO, Patel HP (2009)
Spatial analysis of malaria incidence at the village level in areas with unstabletransmission in Ethiopia. Int J Health Geogr 8: 5.
31. Brooker S, Clarke S, Njagi JK, Polack S, Mugo B, et al. (2004) Spatial clustering
of malaria and associated risk factors during an epidemic in a highland area of
western Kenya. Trop Med Int Health 9: 757–766.
32. Ernst KC, Adoka SO, Kowuor DO, Wilson ML, John CC (2006) Malariahotspot areas in a highland Kenya site are consistent in epidemic and non-
epidemic years and are associated with ecological factors. Malar J 5: 78.
33. Mbogo CM, Mwangangi JM, Nzovu J, Gu W, Yan G, et al. (2003) Spatial and
temporal heterogeneity of Anopheles mosquitoes and Plasmodium falciparum
transmission along the Kenyan coast. Am J Trop Med Hyg 68: 734–742.
34. Bejon P, Berkley JA, Mwangi T, Ogada E, Mwangi I, et al. (2007) Defining
childhood severe falciparum malaria for intervention studies. PLoS Med 4: e251.
doi:10.1371/journal.pmed.0040251.
35. O’Meara WP, Bejon P, Mwangi TW, Okiro EA, Peshu N, et al. (2008) Effect ofa fall in malaria transmission on morbidity and mortality in Kilifi, Kenya. Lancet
372: 1555–1562.
36. Mwangi TW, Ross A, Snow RW, Marsh K (2005) Case definitions of clinical
malaria under different transmission conditions in Kilifi District, Kenya. J InfectDis 191: 1932–1939.
37. Bejon P, Mwacharo J, Kai O, Mwangi T, Milligan P, et al. (2006) A phase 2brandomised trial of the candidate malaria vaccines FP9 ME-TRAP and MVA
ME-TRAP among children in Kenya. PLoS Clin Trials 1: e29. doi:10.1371/journal.pctr.0010029.
38. Kulldorff M (2010) SaTScan - Software for the spatial, temporal, and space-timescan statistics. Boston: Harvard Medical School and Harvard Pilgrim Health
Care.
39. Kulldorff M, Heffernan R, Hartman J, Assuncao R, Mostashari F (2005) A
space-time permutation scan statistic for disease outbreak detection. PLoS Med2: e59. doi:10.1371/journal.pmed.0020059.
40. Naus J (1965) The distribution of the size of maximum cluster of points on the
line. J Am Stat Assoc 60: 532–538.
41. Kulldorff M (1997) A spatial-scan statistic. Commun Stat Theory Methods 26:
1481–1496.
42. Zou G (2004) A modified poisson regression approach to prospective studies withbinary data. Am J Epidemiol 159: 702–706.
43. Liljander A, Wiklund L, Falk N, Kweku M, Martensson A, et al. (2009)Optimization and validation of multi-coloured capillary electrophoresis for
genotyping of Plasmodium falciparum merozoite surface proteins (msp1 and 2).Malar J 8: 78.
44. Osier FH, Fegan G, Polley SD, Murungi L, Verra F, et al. (2008) Breadth andmagnitude of antibody responses to multiple Plasmodium falciparum merozoite
antigens are associated with protection from clinical malaria. Infect Immun 76:2240–2248.
45. Polley SD, Conway DJ, Cavanagh DR, McBride JS, Lowe BS, et al. (2006) Highlevels of serum antibodies to merozoite surface protein 2 of Plasmodium falciparum
are associated with reduced risk of clinical malaria in coastal Kenya. Vaccine 24:4233–4246.
46. Polley SD, Mwangi T, Kocken CH, Thomas AW, Dutta S, et al. (2004) Humanantibodies to recombinant protein constructs of Plasmodium falciparum Apical
Membrane Antigen 1 (AMA1) and their associations with protection frommalaria. Vaccine 23: 718–728.
47. Dutta S, Lalitha PV, Ware LA, Barbosa A, Moch JK, et al. (2002) Purification,characterization, and immunogenicity of the refolded ectodomain of the
Plasmodium falciparum apical membrane antigen 1 expressed in Escherichia coli.Infect Immun 70: 3101–3110.
48. Tatem AJ, Goetz SJ, Hay SI (2004) Terra and Aqua: new data for epidemiology
and public health. Int J Appl Earth Obs 6: 33–46.
49. Scharlemann JP, Benz D, Hay SI, Purse BV, Tatem AJ, et al. (2008) Global data
for ecology and epidemiology: a novel algorithm for temporal Fourier processingMODIS data. PLoS One 3: e1408. doi:10.1371/journal.pone.0001408.
50. Armitage P, Berry G, Matthews J (2001) Using STATA’s robust clustercommand as appropriate. Statistical methods in medical research. 4th Edition.
Oxford: Blackwell Scientific Publications.
51. Snow RW, Omumbo JA, Lowe B, Molyneux CS, Obiero JO, et al. (1997)
Relation between severe malaria morbidity in children and level of Plasmodium
falciparum transmission in Africa. Lancet 349: 1650–1654.
52. Okell LC, Drakeley CJ, Bousema T, Whitty CJ, Ghani AC (2008) Modelling the
impact of artemisinin combination therapy and long-acting treatments on
malaria transmission intensity. PLoS Med 5: e226. doi:10.1371/journal.
pmed.0050226.53. Ellis AM (2008) Linking movement and oviposition behaviour to spatial
population distribution in the tree hole mosquito Ochlerotatus triseriatus. J Anim
Ecol 77: 156–166.54. Chase-Topping M, Gally D, Low C, Matthews L, Woolhouse M (2008) Super-
shedding and the link between human infection and livestock carriage ofEscherichia coli O157. Nat Rev Microbiol 6: 904–912.
55. Bejon P, Ogada E, Peshu N, Marsh K (2009) Interactions between age and ITN
use determine the risk of febrile malaria in children. PLoS One 4: e8321.doi:10.1371/journal.pone.0008321.
56. Lindsay SW, Snow RW (1988) The trouble with eaves; house entry by vectors ofmalaria. Trans R Soc Trop Med Hyg 82: 645–646.
57. Baragatti M, Fournet F, Henry MC, Assi S, Ouedraogo H, et al. (2009) Socialand environmental malaria risk factors in urban areas of Ouagadougou, Burkina
Faso. Malar J 8: 13.
58. Graves PM, Richards FO, Ngondi J, Emerson PM, Shargie EB, et al. (2009)Individual, household and environmental risk factors for malaria infection in
Amhara, Oromia and SNNP regions of Ethiopia. Trans R Soc Trop Med Hyg103: 1211–1220.
59. Drakeley CJ, Corran PH, Coleman PG, Tongren JE, McDonald SL, et al.
(2005) Estimating medium- and long-term trends in malaria transmission byusing serological markers of malaria exposure. Proc Natl Acad Sci U S A 102:
5108–5113.60. Duah NO, Weiss HA, Jepson A, Tetteh KK, Whittle HC, et al. (2009)
Heritability of antibody isotype and subclass responses to Plasmodium falciparum
antigens. PLoS One 4: e7381. doi:10.1371/journal.pone.0007381.
61. Noor AM, Gething PW, Alegana VA, Patil AP, Hay SI, et al. (2009) The risks of
malaria infection in Kenya in 2009. BMC Infect Dis 9: 180.62. Shililu J, Ghebremeskel T, Seulu F, Mengistu S, Fekadu H, et al. (2003) Larval
habitat diversity and ecology of anopheline larvae in Eritrea. J Med Entomol 40:921–929.
63. Geng E, Kreiswirth B, Driver C, Li J, Burzynski J, et al. (2002) Changes in the
transmission of tuberculosis in New York City from 1990 to 1999. N Engl J Med346: 1453–1458.
64. Jennings JM, Curriero FC, Celentano D, Ellen JM (2005) Geographicidentification of high gonorrhea transmission areas in Baltimore, Maryland.
Am J Epidemiol 161: 73–80.65. Riley S, Fraser C, Donnelly CA, Ghani AC, Abu-Raddad LJ, et al. (2003)
Transmission dynamics of the etiological agent of SARS in Hong Kong: impact
of public health interventions. Science 300: 1961–1966.66. Werneck GL, Costa CH, Walker AM, David JR, Wand M, et al. (2002) The
urban spread of visceral leishmaniasis: clues from spatial analysis. Epidemiology13: 364–367.
67. Bousema T, Drakeley C, Gesase S, Hashim R, Magesa S, et al. Identification of
hot spots of malaria transmission for targeted malaria control. J Infect Dis 201:1764–1774.
68. Kleinschmidt I, Schwabe C, Benavente L, Torrez M, Ridl FC, et al. (2009)Marked increase in child survival after four years of intensive malaria control.
Am J Trop Med Hyg 80: 882–888.69. Ceesay SJ, Casals-Pascual C, Erskine J, Anya SE, Duah NO, et al. (2008)
Changes in malaria indices between 1999 and 2007 in The Gambia: a
retrospective analysis. Lancet 372: 1545–1554.70. von Seidlein L, Greenwood BM (2003) Mass administrations of antimalarial
drugs. Trends Parasitol 19: 452–460.71. Kaneko A, Taleo G, Kalkoa M, Yamar S, Kobayakawa T, et al. (2000) Malaria
eradication on islands. Lancet 356: 1560–1564.
72. Utzinger J, Tozan Y, Singer BH (2001) Efficacy and cost-effectiveness ofenvironmental management for malaria control. Trop Med Int Health 6:
677–687.73. Gu W, Novak RJ (2005) Habitat-based modeling of impacts of mosquito larval
interventions on entomological inoculation rates, incidence, and prevalence of
malaria. Am J Trop Med Hyg 73: 546–552.74. Gu W, Utzinger J, Novak RJ (2008) Habitat-based larval interventions: a new
perspective for malaria control. Am J Trop Med Hyg 78: 2–6.75. Penny MA, Maire N, Studer A, Schapira A, Smith TA (2008) What should
vaccine developers ask? Simulation of the effectiveness of malaria vaccines. PLoSONE 3: e3193. doi:10.1371/journal.pone.0003193.
76. Protopopoff N, Van Bortel W, Marcotty T, Van Herp M, Maes P, et al. (2008)
Spatial targeted vector control is able to reduce malaria prevalence in thehighlands of Burundi. Am J Trop Med Hyg 79: 12–18.
77. Protopopoff N, Van Bortel W, Marcotty T, Van Herp M, Maes P, et al. (2007)Spatial targeted vector control in the highlands of Burundi and its impact on
malaria transmission. Malar J 6: 158.
78. Rodriguez MH, Betanzos-Reyes AF, Hernandez-Avila JE, Mendez-Galvan JF,Danis-Lozano R, et al. (2009) The participation of secondary clinical episodes in
the epidemiology of vivax malaria during pre- and post-implementation of focalcontrol in the state of Oaxaca, Mexico. Am J Trop Med Hyg 80: 889–895.
79. Coleman M, Mabuza AM, Kok G, Coetzee M, Durrheim DN (2009) Using theSaTScan method to detect local malaria clusters for guiding malaria control
programmes. Malar J 8: 68.
Stable and Unstable Malaria Hotspots
PLoS Medicine | www.plosmedicine.org 13 July 2010 | Volume 7 | Issue 7 | e1000304
Editors’ Summary
Background. Malaria, a mosquito-borne parasitic disease, isa major global public-health problem. About half the world’spopulation is at risk of malaria and about one million people(mainly children living in sub-Saharan Africa) die each yearfrom the disease. Malaria is transmitted to people throughthe bite of an infected mosquito. Initially, the parasitereplicates inside human liver cells but, about a week afterinfection, these cells release ‘‘merozoites’’ (one of the life-stages of the parasite), which invade red blood cells. Here,the merozoites replicate rapidly before bursting out after 2–3days and infecting more red blood cells. The cyclical andmassive increase in parasitemia (parasites in thebloodstream) that results from this pattern of replication isresponsible for malaria’s recurring fevers and can cause life-threatening organ damage and anemia (a lack of red bloodcells). Malaria can be prevented by controlling themosquitoes that spread the parasite and by avoidingmosquito bites. Effective treatment with antimalarial drugscan also reduce malaria transmission.
Why Was This Study Done? Like many other infectiousdiseases, the transmission of malaria is heterogeneous. Thatis, even in places where malaria is always present, there are‘‘hotspots’’ of transmission, areas where the risk of catchingmalaria is particularly high. The existence of these hotspots,which are caused by a combination of genetic factors (forexample, host susceptibility to infection) and environmentalfactors (for example, distance from mosquito breeding sites),reduces the efficacy of control strategies. However,mathematical models suggest that focusing controlstrategies on transmission hotspots might be an effectiveway to reduce overall malaria transmission. Efforts have beenmade to identify such hotspots using environmental datacollected by satellites but with limited success. In this study,therefore, the researchers investigate the heterogeneityof malaria transmission in the Kilifi District of Kenya overtime by analyzing data collected over up to 12 years(‘‘longitudinal’’ data) on malaria episodes and parasitemia inthree groups (cohorts) of children living in 256 homesteads.
What Did the Researchers Do and Find? The researchersidentified febrile malaria episodes in the homesteads bytaking blood from children with fever (febrile children) toanalyze for parasitemia. They took blood once a year from allthe study participants just before the rainy season (whenmalaria peaks) to look for symptom-free parasitemia andthey also looked for antibodies (proteins made by theimmune system that fight disease) against malaria parasitesin the blood of the participants. They then used a ‘‘spatialscan statistic’’ to look for heterogeneity of transmission andto identify transmission hotspots (groups of homesteads
where the observed incidence of malaria or parasitemia washigher than would be expected if cases were evenlydistributed). The researchers identified two types ofhotspots—stable hotspots of symptom-free parasitemiathat were still hotspots several years later and unstablehotspots of febrile malaria that rarely stayed in the sameplace for more than a year or two. Children living in thestable hotspots had slightly higher average amounts ofantimalaria antibodies and developed malaria at a slightlylower average age than children living in the unstablehotspots.
What Do These Findings Mean? These findings showthat in Kilifi District, Kenya, hotspots of symptom-freeparasitemia are stable over time but hotspots of febrilemalaria are unstable. The researchers suggest that rapidacquisition of immunity in the stable hotspots reduces theoccurrence of febrile malaria whereas in the unstablehotspots there is a high incidence of febrile malariabecause lack of previous exposure to the parasite meansthere is a low level of immunity. Targeted strategies formalaria control should target both types of hotspots,suggest the researchers. Stable hotspots of symptom-freeparasitemia (which can be identified by parasite or antibodysurveys or by remote environmental sensing) should betargeted because mosquito dispersion probably increasesmalaria transmission rates near these hotspots. Unstablehotspots of febrile disease should be targeted to reduceboth the burden of disease and transmission in the widercommunity. Unstable hotspots of febrile malaria, theresearchers suggest, could be efficiently identified in KilifiDistrict (and maybe elsewhere) by determining whichhomesteads had malaria outbreaks during September (partof the dry season) one year and then focusing controlinterventions on these homesteads the next year.
Additional Information. Please access these Web sites viathe online version of this summary at http://dx.doi.org/10.1371/journal.pmed.1000304.
N Information is available from the World Health Organiza-tion on malaria (in several languages)
N The US Centers for Disease Control and Prevention provideinformation on malaria (in English and Spanish)
N MedlinePlus provides links to additional information onmalaria (in English and Spanish)
N Information is available from the Roll Back MalariaPartnership on the global control of malaria (in Englishand French) and on malaria in Kenya
Stable and Unstable Malaria Hotspots
PLoS Medicine | www.plosmedicine.org 14 July 2010 | Volume 7 | Issue 7 | e1000304