Spatial and spatiotemporal clustering methods for detecting elephant poaching hotspots
7
Ecological Modelling 297 (2015) 180–186 Contents lists available at ScienceDirect Ecological Modelling j ourna l h omepa ge: www.elsevier.com/locate/ecolmodel Spatial and spatiotemporal clustering methods for detecting elephant poaching hotspots Parinaz Rashidi a,∗ , Tiejun Wang a , Andrew Skidmore a , Anton Vrieling a , Roshanak Darvishzadeh a , Bert Toxopeus a , Shadrack Ngene b , Patrick Omondi b a Department of Natural Resources, Faculty of Geo-information Science and Earth Observation (ITC), University of Twente, PO Box 217, 7500 AE Enschede, The Netherlands b Kenya Wildlife Service, PO Box 40241, Nairobi 00100, Kenya a r t i c l e i n f o Article history: Received 4 June 2014 Received in revised form 12 November 2014 Accepted 17 November 2014 Keywords: Cluster analysis Hotspot mapping Prediction accuracy Tsavo ecosystem Kenya a b s t r a c t Spatial and spatiotemporal cluster methods are used for a wide range of applications including the study of criminal activities, but have never been compared for studying a specific form of crime, i.e. wildlife poaching. We aimed to identify elephant poaching hotspots by analyzing the differences in clusters of poached elephants in the Tsavo ecosystem (Kenya) that emerged from different cluster detection meth- ods. Reports of elephant poaching in the Tsavo ecosystem were obtained for 2002–2012 from the Kenya Wildlife Service. The study area was divided into 34 blocks for analysis. Two spatial- and two spatiotempo- ral clustering methods were applied to the data. The predictive accuracy of the spatial methods in defining hotspots was assessed using the prediction accuracy index (PAI), which was then modified (MPAI) for measuring the predictive accuracy of the spatiotemporal methods. The results from the spatial methods indicated eight consistent poaching blocks, with Kulldorff’s spatial scan statistic having a slightly higher PAI value than the flexible scan statistic (2.39 vs 2.12). The spatiotemporal clustering methods revealed four consistent poaching blocks. The MPAI value was higher for the spatiotemporal scan statistic than the spatiotemporal permutation scan statistic (1.46 vs 0.97). The results demonstrated that although the hotspot predictions varied for the different methods, three blocks were consistently identified as poach- ing hotspots. Our findings may assist wildlife departments such as the Kenyan Wildlife Service to allocate their financial and human resources as effectively as possible in combating poaching. Further research is needed to examine the environmental and human factors contributing to the patterns that have been observed in elephant poaching. © 2014 Elsevier B.V. All rights reserved. 1. Introduction Cluster analysis aids in identifying the presence of spatial and temporal patterns (Quick and Law, 2013). It can discern areas or periods of high occurrence (hotspots) of a specific feature from other areas or periods with a more random occurrence. Many meth- ods for testing the presence of clusters in spatial point features have been defined and they can be broadly divided into global and local clustering methods (Chiu et al., 2008). In global clustering methods, the average tendency (a typical value for a probability distribu- tion, e.g. mean or median) in a dataset is measured to test the null hypothesis of spatial randomness over the whole study area. How- ever, the specific location or significance of individual clusters is not ∗ Corresponding author. Tel.: +31 649820959; fax: +31 53 4874388. E-mail address: [email protected] (P. Rashidi). specified by global methods (Burra et al., 2002; Chakravorty, 1995; Quick and Law, 2013). In contrast, local clustering methods identify the location of individual clusters by processing subsets of global data; local clustering methods recognize neighboring regions that show exceedingly high or low occurrences relative to the null hypothesis of spatial randomness (Anselin, 1995; Anselin et al., 2000; Kulldorff et al., 2003; Quick and Law, 2013). Local cluster- ing can be classified in three groups: temporal clustering, spatial clustering, or spatiotemporal clustering (Tango, 2010). Temporal clustering investigates whether cases show a tendency to be placed close to each other in time (Tango, 2010). Spatial clustering inves- tigates if the occurrence of a specific feature is particularly high in some geographical areas, irrespective of when it occurred during the study period. Spatiotemporal clustering investigates whether events that are close in space are also close in time (Tango, 2010). Cluster analysis used in epidemiology (Hanson and Wieczorek, 2002; Kulldorff, 1997; Torabi and Rosychuk, 2011) and has been http://dx.doi.org/10.1016/j.ecolmodel.2014.11.017 0304-3800/© 2014 Elsevier B.V. All rights reserved.
Transcript of Spatial and spatiotemporal clustering methods for detecting elephant poaching hotspots

Sp
PRa
Tb
a
ARR1A
KCHPTK
1
tpoobctthe
h0
Ecological Modelling 297 (2015) 180–186
Contents lists available at ScienceDirect
Ecological Modelling
j ourna l h omepa ge: www.elsev ier .com/ locate /eco lmodel
patial and spatiotemporal clustering methods for detecting elephantoaching hotspots
arinaz Rashidia,∗, Tiejun Wanga, Andrew Skidmorea, Anton Vrielinga,oshanak Darvishzadeha, Bert Toxopeusa, Shadrack Ngeneb, Patrick Omondib
Department of Natural Resources, Faculty of Geo-information Science and Earth Observation (ITC), University of Twente, PO Box 217, 7500 AE Enschede,he NetherlandsKenya Wildlife Service, PO Box 40241, Nairobi 00100, Kenya
r t i c l e i n f o
rticle history:eceived 4 June 2014eceived in revised form2 November 2014ccepted 17 November 2014
eywords:luster analysisotspot mappingrediction accuracysavo ecosystemenya
a b s t r a c t
Spatial and spatiotemporal cluster methods are used for a wide range of applications including the studyof criminal activities, but have never been compared for studying a specific form of crime, i.e. wildlifepoaching. We aimed to identify elephant poaching hotspots by analyzing the differences in clusters ofpoached elephants in the Tsavo ecosystem (Kenya) that emerged from different cluster detection meth-ods. Reports of elephant poaching in the Tsavo ecosystem were obtained for 2002–2012 from the KenyaWildlife Service. The study area was divided into 34 blocks for analysis. Two spatial- and two spatiotempo-ral clustering methods were applied to the data. The predictive accuracy of the spatial methods in defininghotspots was assessed using the prediction accuracy index (PAI), which was then modified (MPAI) formeasuring the predictive accuracy of the spatiotemporal methods. The results from the spatial methodsindicated eight consistent poaching blocks, with Kulldorff’s spatial scan statistic having a slightly higherPAI value than the flexible scan statistic (2.39 vs 2.12). The spatiotemporal clustering methods revealedfour consistent poaching blocks. The MPAI value was higher for the spatiotemporal scan statistic thanthe spatiotemporal permutation scan statistic (1.46 vs 0.97). The results demonstrated that although the
hotspot predictions varied for the different methods, three blocks were consistently identified as poach-ing hotspots. Our findings may assist wildlife departments such as the Kenyan Wildlife Service to allocatetheir financial and human resources as effectively as possible in combating poaching. Further researchis needed to examine the environmental and human factors contributing to the patterns that have beenobserved in elephant poaching.© 2014 Elsevier B.V. All rights reserved.
. Introduction
Cluster analysis aids in identifying the presence of spatial andemporal patterns (Quick and Law, 2013). It can discern areas oreriods of high occurrence (hotspots) of a specific feature fromther areas or periods with a more random occurrence. Many meth-ds for testing the presence of clusters in spatial point features haveeen defined and they can be broadly divided into global and locallustering methods (Chiu et al., 2008). In global clustering methods,he average tendency (a typical value for a probability distribu-
ion, e.g. mean or median) in a dataset is measured to test the nullypothesis of spatial randomness over the whole study area. How-ver, the specific location or significance of individual clusters is not∗ Corresponding author. Tel.: +31 649820959; fax: +31 53 4874388.E-mail address: [email protected] (P. Rashidi).
ttp://dx.doi.org/10.1016/j.ecolmodel.2014.11.017304-3800/© 2014 Elsevier B.V. All rights reserved.
specified by global methods (Burra et al., 2002; Chakravorty, 1995;Quick and Law, 2013). In contrast, local clustering methods identifythe location of individual clusters by processing subsets of globaldata; local clustering methods recognize neighboring regions thatshow exceedingly high or low occurrences relative to the nullhypothesis of spatial randomness (Anselin, 1995; Anselin et al.,2000; Kulldorff et al., 2003; Quick and Law, 2013). Local cluster-ing can be classified in three groups: temporal clustering, spatialclustering, or spatiotemporal clustering (Tango, 2010). Temporalclustering investigates whether cases show a tendency to be placedclose to each other in time (Tango, 2010). Spatial clustering inves-tigates if the occurrence of a specific feature is particularly high insome geographical areas, irrespective of when it occurred during
the study period. Spatiotemporal clustering investigates whetherevents that are close in space are also close in time (Tango, 2010).Cluster analysis used in epidemiology (Hanson and Wieczorek,2002; Kulldorff, 1997; Torabi and Rosychuk, 2011) and has been

P. Rashidi et al. / Ecological Modelling 297 (2015) 180–186 181
g the
awo(ac(Ctp
riAvamPpnsssceyefpv
aiofrqa
Fig. 1. Location of the Tsavo ecosystem in south-eastern Kenya, showin
pplied to crime data to assist decision-making on where andhen to address potential crime clusters in future, e.g. for drug
ffenses (Quick and Law, 2013) or city violence and property crimesUittenbogaard and Ceccato, 2012). However, few studies exist thatimed at detecting spatial and spatiotemporal patterns in the spe-ific criminal act of wildlife poaching. One example is Haines et al.2012) who studied white-tailed deer poaching activity in Fayetteounty, Iowa, USA, in terms of temporal, spatial, and environmen-al patterns. They used logistic regression models and producedoaching activity hotspots map.
Although elephant populations are declining across their habitatange in Africa and poaching is a significant source of mortal-ty, little attention has been paid to predicting poaching hotspots.nalysis of data related to poaching is important for wildlife conser-ation. Based on elephant mortality data collected between 1989nd 2005 Kyale et al. (2011) identified spatial patterns of elephantortality, which is largely due to poaching, in Tsavo East National
ark in Kenya. They used kernel density analyses and found that theatterns were clustered, with poaching being more intensive in theorthern and central areas of the park. Maingi et al. (2012) studiedpatial patterns of elephant poaching separately for wet and dryeason for the period between January 1990 and December 2009 inouth-eastern Kenya. They used kernel density analyses and con-luded that poaching was more common in the dry season when thelephants aggregate along permanent rivers. However, their anal-sis merely separated the two seasons and assessed hotspots forach, but did not address both space and time in a single model. Inact, poaching hotspots have never been mapped using spatiotem-oral methods and the differences in hotspots that emerge fromarious clustering methods have not been evaluated.
We therefore set out to identify elephant poaching hotspots bynalyzing the differences in emerging clusters of poached elephantsn the Tsavo ecosystem. We used different cluster detection meth-ds on data covering a continuous period of ten years. We selected
our common clustering methods (two spatial, two spatiotempo-al) for this purpose. Our study aimed to answer the following fiveuestions: (1) Where are the consistent elephant poaching hotspotss determined by various spatial and spatiotemporal clusteringlocations where elephants are being poached and the types of land use.
methods? (2) What are the differences between the emerging clus-ters obtained by the different spatial clustering methods? (3) Dospatial clustering methods differ in their ability to predict wherehotspots may occur? (4) What are the differences between theemerging clusters obtained by different spatiotemporal clusteringmethods? (5) Do the spatiotemporal clustering methods differ intheir ability to predict where and when hotspots may occur?
2. Materials and methods
2.1. Study area
The Tsavo ecosystem covers an area of about 38,128 km2 insouth-east Kenya (Fig. 1). The ecosystem lies between 2–4◦ S, and37.5–39.5◦ E (Ngene, 2013). It has a population of about 11,000 ele-phants (Kyale et al., 2014), and the highest reported poaching ofelephants, in Kenya (Maingi et al., 2012). The anti-poaching activi-ties in the Tsavo ecosystem are challenged by inadequate resources(human and financial), and the extensive area covered (Maingi et al.,2012). Various rivers traverse the ecosystem, including the Galana,Voi, Tiva, Tsavo and Athirivers (Maingi et al., 2012). Our study areacomprised the Tsavo East national park north, Tsavo East nationalpark south, and Tsavo West national parks, with the remainder cov-ered by private ranches (Fig. 1). The climate of the area is semi-arid,with the long rainy season occurring between March and May, andthe short rainy season in November and December. Mean annualrainfall varies locally between 250 and 500 mm (Maingi et al., 2012).Vegetation in the Tsavo ecosystem is dominated by Commiphorasavanna (Maingi et al., 2012).
2.2. Elephant data
The poaching and population data on elephants used for thisstudy were obtained from the Kenya Wildlife Service (KWS). The
poaching data were collected from aerial patrols and daily groundpatrols carried out by KWS through monitoring illegal killing ofelephants (MIKE) program. Regular patrols and extensive coverageof monitored sites is essential to collect comprehensive data for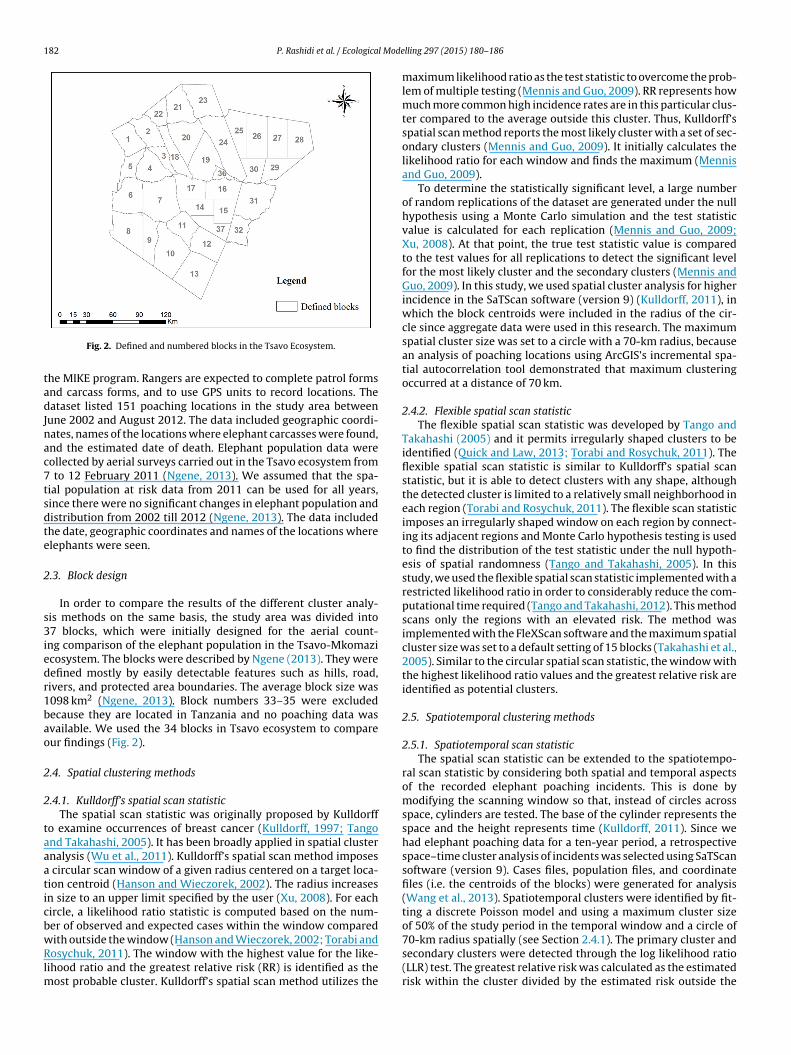
182 P. Rashidi et al. / Ecological Mode
tadJnac7tsdte
2
s3iedr1bao
2
2
taaaticbwRlm
Fig. 2. Defined and numbered blocks in the Tsavo Ecosystem.
he MIKE program. Rangers are expected to complete patrol formsnd carcass forms, and to use GPS units to record locations. Theataset listed 151 poaching locations in the study area between
une 2002 and August 2012. The data included geographic coordi-ates, names of the locations where elephant carcasses were found,nd the estimated date of death. Elephant population data wereollected by aerial surveys carried out in the Tsavo ecosystem from
to 12 February 2011 (Ngene, 2013). We assumed that the spa-ial population at risk data from 2011 can be used for all years,ince there were no significant changes in elephant population andistribution from 2002 till 2012 (Ngene, 2013). The data includedhe date, geographic coordinates and names of the locations wherelephants were seen.
.3. Block design
In order to compare the results of the different cluster analy-is methods on the same basis, the study area was divided into7 blocks, which were initially designed for the aerial count-
ng comparison of the elephant population in the Tsavo-Mkomazicosystem. The blocks were described by Ngene (2013). They wereefined mostly by easily detectable features such as hills, road,ivers, and protected area boundaries. The average block size was098 km2 (Ngene, 2013). Block numbers 33–35 were excludedecause they are located in Tanzania and no poaching data wasvailable. We used the 34 blocks in Tsavo ecosystem to compareur findings (Fig. 2).
.4. Spatial clustering methods
.4.1. Kulldorff’s spatial scan statisticThe spatial scan statistic was originally proposed by Kulldorff
o examine occurrences of breast cancer (Kulldorff, 1997; Tangond Takahashi, 2005). It has been broadly applied in spatial clusternalysis (Wu et al., 2011). Kulldorff’s spatial scan method imposes
circular scan window of a given radius centered on a target loca-ion centroid (Hanson and Wieczorek, 2002). The radius increasesn size to an upper limit specified by the user (Xu, 2008). For eachircle, a likelihood ratio statistic is computed based on the num-er of observed and expected cases within the window compared
ith outside the window (Hanson and Wieczorek, 2002; Torabi andosychuk, 2011). The window with the highest value for the like-ihood ratio and the greatest relative risk (RR) is identified as theost probable cluster. Kulldorff’s spatial scan method utilizes the
lling 297 (2015) 180–186
maximum likelihood ratio as the test statistic to overcome the prob-lem of multiple testing (Mennis and Guo, 2009). RR represents howmuch more common high incidence rates are in this particular clus-ter compared to the average outside this cluster. Thus, Kulldorff’sspatial scan method reports the most likely cluster with a set of sec-ondary clusters (Mennis and Guo, 2009). It initially calculates thelikelihood ratio for each window and finds the maximum (Mennisand Guo, 2009).
To determine the statistically significant level, a large numberof random replications of the dataset are generated under the nullhypothesis using a Monte Carlo simulation and the test statisticvalue is calculated for each replication (Mennis and Guo, 2009;Xu, 2008). At that point, the true test statistic value is comparedto the test values for all replications to detect the significant levelfor the most likely cluster and the secondary clusters (Mennis andGuo, 2009). In this study, we used spatial cluster analysis for higherincidence in the SaTScan software (version 9) (Kulldorff, 2011), inwhich the block centroids were included in the radius of the cir-cle since aggregate data were used in this research. The maximumspatial cluster size was set to a circle with a 70-km radius, becausean analysis of poaching locations using ArcGIS’s incremental spa-tial autocorrelation tool demonstrated that maximum clusteringoccurred at a distance of 70 km.
2.4.2. Flexible spatial scan statisticThe flexible spatial scan statistic was developed by Tango and
Takahashi (2005) and it permits irregularly shaped clusters to beidentified (Quick and Law, 2013; Torabi and Rosychuk, 2011). Theflexible spatial scan statistic is similar to Kulldorff’s spatial scanstatistic, but it is able to detect clusters with any shape, althoughthe detected cluster is limited to a relatively small neighborhood ineach region (Torabi and Rosychuk, 2011). The flexible scan statisticimposes an irregularly shaped window on each region by connect-ing its adjacent regions and Monte Carlo hypothesis testing is usedto find the distribution of the test statistic under the null hypoth-esis of spatial randomness (Tango and Takahashi, 2005). In thisstudy, we used the flexible spatial scan statistic implemented with arestricted likelihood ratio in order to considerably reduce the com-putational time required (Tango and Takahashi, 2012). This methodscans only the regions with an elevated risk. The method wasimplemented with the FleXScan software and the maximum spatialcluster size was set to a default setting of 15 blocks (Takahashi et al.,2005). Similar to the circular spatial scan statistic, the window withthe highest likelihood ratio values and the greatest relative risk areidentified as potential clusters.
2.5. Spatiotemporal clustering methods
2.5.1. Spatiotemporal scan statisticThe spatial scan statistic can be extended to the spatiotempo-
ral scan statistic by considering both spatial and temporal aspectsof the recorded elephant poaching incidents. This is done bymodifying the scanning window so that, instead of circles acrossspace, cylinders are tested. The base of the cylinder represents thespace and the height represents time (Kulldorff, 2011). Since wehad elephant poaching data for a ten-year period, a retrospectivespace–time cluster analysis of incidents was selected using SaTScansoftware (version 9). Cases files, population files, and coordinatefiles (i.e. the centroids of the blocks) were generated for analysis(Wang et al., 2013). Spatiotemporal clusters were identified by fit-ting a discrete Poisson model and using a maximum cluster sizeof 50% of the study period in the temporal window and a circle of
70-km radius spatially (see Section 2.4.1). The primary cluster andsecondary clusters were detected through the log likelihood ratio(LLR) test. The greatest relative risk was calculated as the estimatedrisk within the cluster divided by the estimated risk outside the
l Modelling 297 (2015) 180–186 183
citiccnprhi
2
ccaTdnnierachfcChdTttgatbas9
2
p2mo
P
wietii
nm
P. Rashidi et al. / Ecologica
luster (Kulldorff, 2011). We tested the null-hypothesis that theres no cluster of occurrence inside the window against the alterna-ive hypothesis that there is an elevated risk inside the windown comparison with outside (Xu, 2008). The p-values for identifiedlusters were computed by utilizing Monte Carlo simulations toreate various random replications of the dataset under the properull hypothesis (Liu et al., 2013). To ensure sufficient statisticalower, and taking computation times in to account, we created 999andom simulations to obtain p-values (Liu et al., 2013). The nullypothesis of a spatiotemporally random distribution was rejected
f the p-values was <0.05 (Wang et al., 2013).
.5.2. Spatiotemporal permutation scan statisticThe spatiotemporal permutation scan statistic uses a cylindri-
al window while scanning. A circular or ellipsoid radius of theylinder indicates the number of incidents covered by the cluster,nd the height of the cylinder corresponds to the time covered.he spatiotemporal permutation scan statistic requires only caseata (with information about the location and date) and does noteed population-at-risk data (Kulldorff et al., 2005). The expectedumber of elephant poaching incidents was calculated by assum-
ng complete spatial randomness, which is the same if the observedvents with a persistent average were roughly independent Poissonandom parameters (Si et al., 2009). A likelihood ratio, based on thispproximation, was estimated to determine whether the cylinderontained a cluster or not. One cylinder with the maximum likeli-ood ratio test statistic is then considered to be the key candidate
or the most likely cluster (Kulldorff et al., 2005). The statisti-al significance of detected clusters was evaluated using a Montearlo simulation (Dwass, 1957). The rank of the maximum likeli-oods from the real dataset were compared to those of the randomatasets to compute the p-values (Dwass, 1957; Kulldorff, 2006).he space–time permutation scan statistic was used to detect clus-ers mathematically. The center of the window was positioned athe centroid of each block (the latitude/longitude information ofeometric center was obtained using ArcGIS geocoding function),nd the radius of the circular window varied continuously from zeroo a maximum radius of 70 km (see Section 2.4.1). For each spatialase, the height of the cylinder was modified from the shortest timeggregation length of 1 month to a maximum of 50% of the wholetudy period. The number of Monte Carlo replications was set at99 and the statistical significance at 0.05.
.6. The prediction accuracy index
The Prediction Accuracy Index (PAI) was used to measure theredictive accuracy of the spatial clustering methods (Chainey et al.,008). This index provides a single measure of how reliable such aethod is for predicting where hotspots may occur. A higher value
f PAI reflects a greater accuracy. The index is calculated by:
AI = (n/N) × 100(a/A) × 100
(1)
here n is the number of poached elephants in areas where poach-ng is predicted to occur (hotspots), N is the total number oflephants poached in the study area in the 10-year study period, a ishe area where poaching is predicted to occur (e.g. area of hotspotsn km2) and A is the whole study area in km2. A higher PAI value
ndicates higher prediction accuracy.Since the PAI is suitable for spatial clustering methods but doesot consider the temporal aspects of incidents, in this study, weodified the PAI (MPAI) by adding a time factor to evaluate the
Fig. 3. The most likely clusters identified by the two spatial clustering methods:(a) Kulldorff’s spatial scan statistic, and (b) the flexible spatial scan statistic with arestricted likelihood ratio.
spatiotemporal methods. Eq. (2) shows how this new index wascalculated.
MPAI = (nt/NT ) × 100(a/A) × 100
(2)
where nt is the number of elephants poached in areas where poach-ing is predicted to occur (hotspots) and in the time range (t) ofoccurrence, NT is the number of elephants poached in the wholestudy area during the total study period, a is the area where poach-ing is predicted to occur (e.g. area of hotspots in km2) and A is thewhole study area in km2.
3. Results
Kulldorff’s spatial scan statistic detected two significant clusters(p < 0.05) ranging in size from 1–7 blocks (Fig. 3). The most likely
cluster consisted of seven blocks, defined by the highest relative risk(RR = 21.75) and log likelihood ratio (LLR = 146.89). The secondaryclusters included one block, with a smaller RR (11.85) and LLR (9.23)compared with the most likely clusters (Fig. 3).
184 P. Rashidi et al. / Ecological Modelling 297 (2015) 180–186
Fus
rlawc
settrpiwttaw
ecb
Fig. 5. Consistent blocks of elephant poaching in the Tsavo ecosystem, Kenya. Theywere derived from (a) spatial clustering methods, and (b) spatiotemporal clusteringmethods.
ig. 4. The most likely clusters identified by two spatiotemporal cluster methods,sing monthly spatiotemporal data from 2000 to 2012. (a) Spatiotemporal scantatistic and (b) spatiotemporal permutation scan statistic.
The flexible spatial scan statistic with a restricted likelihoodatio resulted in two significant clusters (p < 0.05) (Fig. 3). The mostikely cluster consisted of seven blocks with the greatest RR (10.01)nd LLR (146.89). The secondary clusters consisted of two blocksith smaller RR (5.76) and LLR (11.44) compared to the most likely
luster.The results for the spatiotemporal scan statistic cluster are
hown in Fig. 4. The spatiotemporal cluster analysis of cases oflephant poaching in 2002–2012 in the Tsavo ecosystem showedhat elephant poaching was not distributed randomly in space andime. Using the maximum spatial cluster size of a circle with 70-kmadius, and the maximum temporal cluster size of 50% of the studyeriod, one most likely cluster and two secondary clusters were
dentified (Fig. 4). The most likely cluster consisted of seven blocksith the greatest RR (77.10) and LLR (235.33). It was detected for
he period December 2009 to August 2012. The two secondary clus-ers also consisted of seven blocks; the RR of these clusters (69.62nd 32.51 respectively) within a non-random distribution patternas also significant (p < 0.05) (Fig. 4).
The retrospective spatiotemporal permutation scan analysis oflephant poaching data during 2002–2012 detected two significantlusters (p < 0.05) (Fig. 4). The most likely cluster consisted of sevenlocks with the greatest likelihood ratio test statistic (LLR = 8.46).
It was detected between August 2002 and August 2006. The sec-ondary clusters consisted of three blocks with a smaller test statisticcompared to the most likely cluster (LLR = 6.61).
As can been seen from Fig. 5a, eight blocks were detected ashaving high poaching, irrespective of the spatial clustering methodused. When the spatiotemporal analyses were included (Fig. 5b),four blocks were detected as having high poaching, irrespectiveof the method used. Three of these blocks overlapped in space andtime (8, 9, and 10), but one overlapped in space, but not time (block20). Fig. 5 shows the locations of these consistent blocks.
The PAI results for the two spatial clustering methods indicatedthat the cluster analysis methods vary in their ability to predictpatterns of poaching events. Our results showed that Kulldorff’sspatial scan statistic had a slightly higher PAI value than the flexiblescan statistic (2.39 vs 2.12).
An evaluation of the modified PAI results for the two spatiotem-poral clustering methods showed that the spatiotemporal scanstatistic predicts when and where hotspots occur with greater accu-racy than the spatiotemporal permutation scan statistic (1.46 vs
0.97).
P. Rashidi et al. / Ecological Mode
4
eAcasWT
dewdnfls2s(i
csstBrTp
omtsbaslrpr(
Fig. 6. Hotspots of elephant poaching in the Tsavo ecosystem, Kenya.
. Discussion
A number of consistent elephant poaching hotspots in the Tsavocosystem emerged from the different cluster detection methods.mong the 34 blocks in the study area, three blocks were selectedonsistently, irrespective of the clustering method used, indicating
consistently high risk of poaching in these areas (Fig. 6). The con-istently detected hotspots are located in Taita ranches and Tsavo
est National Park and most were located along the border ofanzania.
Our results indicated that similarities occurred between clustersetected by different cluster detection methods, but also differ-nces emerged. This is partly due to variations in the sizes of searchindow and because the input data used are different. Our (Kull-orff’s spatial scan statistic method) results identified a smallerumber of combined blocks as a potential cluster compared toexible scan statistic method. This may be due to the non-circularhape of the regions in the Tsavo ecosystem (Torabi and Rosychuk,011). Despite the small deviation, the results of the spatial scantatistics and flexible spatial scan statistics were largely consistentFig. 5a). This suggests that both spatial methods could be usednterchangeably for application in the field of the poaching.
The PAI was used to assess the predictive accuracy of the spatiallustering methods. The results using PAI indicated that Kulldorff’spatial scan statistic had a slightly higher PAI value than the flexiblecan statistic (2.39 vs 2.12). This finding implies that the shape ofhe search window has a small effect on the prediction accuracy.ased on the PAI value, Kulldorff’s spatial scan statistics showedeasonably good prediction accuracy in detecting circular clusters.he flexible scan statistic also showed a reasonably good PAI valuelus the ability to detect non-circular clusters (Fig. 3).
Clusters that emerged from the spatiotemporal clustering meth-ds demonstrated an interesting phenomenon. For instance theost likely cluster in the spatiotemporal permutation scan statis-
ic was selected as the area of the secondary cluster by thepatiotemporal scan statistic (Fig. 4). This different result maye partly explained by the influence of the input data, whichre different for both methods. The spatiotemporal permutationcan statistic requires only case data, with information about theocation and time for each case, but it does not need population-at-
isk data, whereas the spatiotemporal scan statistics does requireopulation-at-risk data. When comparing the two spatiotempo-al methods, a few consistent poaching clusters were detectedFig. 5b), which indicates the importance of considering thelling 297 (2015) 180–186 185
assumptions made in the scan statistic models in relation to thedata being used (Alton et al., 2013). For example, when using thespatio-temporal scan statistics, the expected number of cases ineach area is proportional to the population of the cases in thatarea, whereas for the spatiotemporal permutation scan statistic,the expected values are calculated only on the basis of cases. Thepermutation scan statistic is advantageous if population data aremissing, but it may not be appropriate for analyzing poaching activ-ities due to their covert nature and the fact that some cases ofelephant poaching may not be reported (Burn et al., 2011).
By modifying the prediction accuracy index (MPAI), we demon-strated that it is possible to evaluate the predictive accuracy ofspatiotemporal clustering methods over time. Our results indicatethat the spatiotemporal scan statistic had a higher MPAI value whendetecting cluster areas than the spatiotemporal permutation scanstatistic (1.46 vs 0.97). This lower accuracy may be explained bythe spatiotemporal permutation scan statistic being independentof the population-at-risk and a cluster being detected if an area hasa higher proportion of cases during a specific time period comparedto the remaining geographical areas (Alzahrani et al., 2013).
5. Conclusions
Clustering methods are useful for understanding the patternof criminal activities; in this paper we compared four clusteringmethods for the purpose of examining one such activity, i.e. ele-phant poaching, using 10 years of patrol data. Elephant poachingclusters in the Tsavo ecosystem from two spatial methods (flexi-ble scan statistic and Kulldorff’s scan statistics) almost coincidedand had a similar predictive accuracy. The two spatiotemporalmethods showed larger differences; the spatiotemporal scan statis-tic outperformed the spatiotemporal permutation scan statisticin accurately predicting elephant poaching hotspots in the Tsavoecosystem, based on a modified Predication Accuracy Index (MPAI).This difference can largely be explained by the fact that the per-mutation scan statistic does not use population-at-risk input data,which we had available in the form of an aerial elephant survey.Our results and methodological comparison may assist the KenyaWildlife Service in allocating financial and human resources effec-tively to tackle (elephant and other species) poaching.
Acknowledgments
This work was funded by the Erasmus Mundus program of theEuropean Union and co-funded by the ITC Research Fund, TheNetherlands. We would like to thank Babak Naimi for his commentson an earlier version of the manuscript and Jackie Senior for edit-ing work. We thank the Kenya Wildlife Service for providing theelephant poaching data.
References
Alton, G.D., Pearl, D.L., Bateman, K.G., McNab, B., Berke, O., 2013. Comparison ofcovariate adjustment methods using space–time scan statistics for food animalsyndromic surveillance. BMC Vet. Res. 9, 231.
Alzahrani, A.G., Al Mazroa, M.A., Alrabeah, A.M., Ibrahim, A.M., Mokdad, A.H.,Memish, Z.A., 2013. Geographical distribution and spatio-temporal patterns ofdengue cases in Jeddah Governorate from 2006–2008. Trans. R. Soc. Trop. Med.Hyg. 107, 23–29.
Anselin, L., 1995. Local indicators of spatial association – LISA. Geogr. Anal. 27,93–115.
Anselin, L., Cohen, J., Cook, D., Gorr, W., Tita, G., 2000. Spatial analyses of crime. J.Crim. Just. 4, 213–262.
Burn, R.W., Underwood, F.M., Blanc, J., 2011. Global trends and factors associated
with the illegal killing of elephants: a hierarchical Bayesian analysis of carcassencounter data. PLoS ONE 6, e24165.Burra, T., Jerrett, M., Burnett, R.T., Anderson, M., 2002. Conceptual and practicalissues in the detection of local disease clusters: a study of mortality in Hamilton,Ontario. Can. Geogr. 46, 160–171.

1 l Mode
C
C
C
D
H
H
KK
K
K
K
K
K
L
86 P. Rashidi et al. / Ecologica
hainey, S., Tompson, L., Uhlig, S., 2008. The utility of hotspot mapping for predictingspatial patterns of crime. Secur. J. 21, 4–28.
hakravorty, S., 1995. Identifying crime clusters: the spatial principles. Middle StatesGeogr. 28, 53–58.
hiu, Y.-W., Wang, M.-Q., Chuang, H.-Y., Hsu, C.E., Nkhoma, E.T., 2008. A new appli-cation of spatiotemporal analysis for detecting demographic variations in AIDSmortality: an example from Florida. Kaohsiung J. Med. Sci. 24, 568–576.
wass, M., 1957. Modified randomization tests for nonparametric hypotheses. Ann.Math. Stat. 28, 181–187.
aines, A.M., Elledge, D., Wilsing, L.K., Grabe, M., Barske, M.D., Burke, N., Webb, S.L.,2012. Spatially explicit analysis of poaching activity as a conservation manage-ment tool. Wildl. Soc. B 36, 685–692.
anson, C.E., Wieczorek, W.F., 2002. Alcohol mortality: a comparison of spatial clus-tering methods. Soc. Sci. Med. 55, 791–802.
ulldorff, M., 1997. A spatial scan statistic. Commun. Stat.-Theorem 26, 1481–1496.ulldorff, M., 2006. Satscan User Guide for Version 7.0., Available at:
http://www.satscan.orgulldorff, M., 2011. SaTScan User Guide for Version 9.0, Available at:
http://www.satscan.orgulldorff, M., Heffernan, R., Hartman, J., Assuncao, R., Mostashari, F., 2005. A
space–time permutation scan statistic for disease outbreak detection. PLoS Med.2, e59.
ulldorff, M., Tango, T., Park, P.J., 2003. Power comparisons for disease clusteringtests. Comput. Stat. Data Anal. 42, 665–684.
yale, D.M., Ngene, S., Maingi, J., 2011. Biophysical and human factors determinethe distribution of poached elephants in Tsavo East National Park, Kenya. Pachy-derm, 48–60.
yale, D.M., Mukeka, J.M., Kimitei, K.K., Munyao, M.N., Lala, F.O., 2014.Tsavo-Mkomazi Total Aerial Census for Elephants and Large Animals. Atechnical Report for Kenya Wildlife Service (KWS), Kenya, Available at:
https://drive.google.com/file/d/0B0QkOGKYnkM6NEhjQnZDdWR1Mmc/view?usp=sharingiu, Y., Wang, X., Liu, Y., Sun, D., Ding, S., Zhang, B., Du, Z., Xue, F., 2013. Detectingspatial-temporal clusters of HFMD from 2007 to 2011 in Shandong province,China. PLOS ONE 8, e63447.
lling 297 (2015) 180–186
Maingi, J.K., Mukeka, J.M., Kyale, D.M., Muasya, R.M., 2012. Spatiotempo-ral patterns of elephant poaching in south-eastern Kenya. Wildl. Res. 39,234–249.
Mennis, J., Guo, D., 2009. Spatial data mining and geographic knowledge discovery– an introduction. Comput. Environ. Urban Syst. 33, 403–408.
Ngene, S.M., 2013. Status and trends of the elephant population in theTsavo–Mkomazi ecosystem. Pachyderm, 38–50.
Quick, M., Law, J., 2013. Exploring hotspots of drug offences in toronto: a compari-son of four local spatial cluster detection methods 1. Can. J. Criminol. Crim. 55,215–238.
Si, Y., Skidmore, A.K., Wang, T., De Boer, W.F., Debba, P., Toxopeus, A.G., Li, L., Prins,H.H., 2009. Spatio-temporal dynamics of global H5N1 outbreaks match birdmigration patterns. Geospat. Health 4, 65–78.
Takahashi, K., Yokoyama, T., Tango, T., 2005. FleXScan User Guide for Version 3.1.2,Available at: http://www.niph.go.jp/soshiki/gijutsu/download/flexscan/
Tango, T., 2010. Statistical Methods for Disease Clustering. Springer.Tango, T., Takahashi, K., 2005. A flexibly shaped spatial scan statistic for detecting
clusters. Int. J. Health Geogr. 4, 11.Tango, T., Takahashi, K., 2012. A flexible spatial scan statistic with a
restricted likelihood ratio for detecting disease clusters. Stat. Med. 31,4207–4218.
Torabi, M., Rosychuk, R., 2011. An examination of five spatial disease clusteringmethodologies for the identification of childhood cancer clusters in Alberta,Canada. Spat. Spatiotempor. Epidemiol. 2, 321–330.
Uittenbogaard, A.C., Ceccato, V., 2012. Space–time clusters of crime in Stockholm,Sweden. Rev. Eur. Stud. 4, 148–156.
Wang, L.-Y., Zhang, W.-Y., Ding, F., Hu, W.-B., Magalhaes, R.J.S., Sun, H.-L., Li, Y.-X., Zou, W., Wang, Y., Liu, Q.-Y., 2013. Spatiotemporal patternsof Japanese encephalitis in China, 2002–2010. PLoS Neglect. Trop. D 7,e2285.
Wu, W., Guo, J., Guan, P., Sun, Y., Zhou, B., 2011. Clusters of spatial, temporal, andspace–time distribution of hemorrhagic fever with renal syndrome in LiaoningProvince, Northeastern China. BMC Infect. Dis. 11, 229.
Xu, B., 2008. Spatial and Temporal Analysis of Hemorrhagic Disease in White-tailedDeer in Southeast USA. University of Georgia, Athens (Ph.D. thesis).