Comprehensive trend analysis of nutrients and related variables in a large eutrophic estuary: A...
25
463 Limnol. Oceanogr., 51(1, part 2), 2006, 463–487 q 2006, by the American Society of Limnology and Oceanography, Inc. Comprehensive trend analysis of nutrients and related variables in a large eutrophic estuary: A decadal study of anthropogenic and climatic influences JoAnn M. Burkholder 1 Center for Applied Aquatic Ecology, North Carolina State University, Raleigh, North Carolina 27606 David A. Dickey Department of Statistics, North Carolina State University, Raleigh, North Carolina 27695-8203 Carol A. Kinder and Robert E. Reed Center for Applied Aquatic Ecology, North Carolina State University, Raleigh, North Carolina 27606 Michael A. Mallin and Matthew R. McIver Center for Marine Science, University of North Carolina Wilmington, Wilmington, North Carolina 28409 Lawrence B. Cahoon Department of Biological Sciences, University of North Carolina Wilmington, Wilmington, North Carolina 28403 Greg Melia 2 Center for Applied Aquatic Ecology, North Carolina State University, Raleigh, North Carolina 27606 Cavell Brownie and Joy Smith Department of Statistics, North Carolina State University, Raleigh, North Carolina 27695-8203 Nora Deamer, Jeffrey Springer, Howard B. Glasgow, and David Toms 3 Center for Applied Aquatic Ecology, North Carolina State University, Raleigh, North Carolina 27606 Abstract We used a decadal data set, with weekly to biweekly sampling in April–October and monthly sampling in November– March, to characterize climatic (hurricane-level storms, a sustained 3-yr drought) and anthropogenic influences on N and P concentrations and loadings to a large eutrophic, poorly flushed estuary, the Neuse Estuary of the Albemarle–Pamlico Estuarine System. Mass volume transport data were obtained with cross-estuary transect flow measurements taken near the entrance to the estuary. Although trends were minimally influenced by hurricanes, analyses were significantly affected by the sustained drought near the end of the study. As examples, decreasing trends in total N (TN), total P (TP), and bottom-water dissolved oxygen concentrations, and in TN loadings were significant considering all data, but these trends were not significant when the sustained drought was excluded from analysis. In addition, the trend in TN loading was especially sensitive to the initial sampling period. NH concentrations dramatically increased (overall by ;500%) as a 1 4 persistent trend regardless of attempts to control for climatic events. An increasing trend in NH also was documented 1 4 in an adjacent, rapidly flushed Coastal Plain estuary, the Cape Fear. The NH data suggest a regional-scale effect of high 1 4 inputs from inadequately controlled, increasing nonpoint sources. The fragility of TN loading trends, the striking increase in NH concentrations, and the lack of management emphasis on controlling nonpoint sources such as ‘‘new’’ industri- 1 4 alized swine production collectively do not support recent reports of achievement of a 30% reduction in TN loading to the Neuse. Nonpoint sources remain a critical target for reduction to alleviate the negative effects of cultural eutrophication in this system, as in many estuaries throughout the world. 1 Corresponding author. 2 Present address: North Carolina Department of Environment and Natural Resources, Ecosystem Enhancement Program, Raleigh, North Carolina 27699. 3 Present address: North Carolina Department of Environment and Natural Resources, Division of Water Quality–Basinwide Planning, Ra- leigh, North Carolina 27699. Acknowledgments North Carolina Department of Environment and Natural Resources staff E. Fensin, J. Manning, D. Briley, R. Dove, A. Krambrink, M. Larsen, R. Nall, M. Zartarian, and the Center for Applied Aquatic Ecol- ogy staff and students assisted in field and laboratory efforts. A. Lewitus, P. Rublee, and S. Shumway provided counsel on the manuscript. Funding support for this research was provided by the Water Re- sources Research Institute of the University of North Carolina, the U.S. Marine Air Station at Cherry Point (U.S. Army Center for En- vironmental Health), the U.S. Environmental Protection Agency (grants CR827831-01-0 and CP-97437001), the National Science Foundation (grant OCE9912089), the Lower Cape Fear River Pro- gram, an anonymous foundation, the Z. Smith Reynolds Foundation, the North Carolina General Assembly, and the Department of Botany and College of Agriculture and Life Sciences at North Carolina State University. We dedicate this study to Robert G. Wetzel, in tribute to his integ- rity and his many seminal contributions that have significantly ad- vanced aquatic science.
-
Upload
independent -
Category
Documents
-
view
1 -
download
0
Transcript of Comprehensive trend analysis of nutrients and related variables in a large eutrophic estuary: A...

463
Limnol. Oceanogr., 51(1, part 2), 2006, 463–487q 2006, by the American Society of Limnology and Oceanography, Inc.
Comprehensive trend analysis of nutrients and related variables in a large eutrophicestuary: A decadal study of anthropogenic and climatic influences
JoAnn M. Burkholder1
Center for Applied Aquatic Ecology, North Carolina State University, Raleigh, North Carolina 27606
David A. DickeyDepartment of Statistics, North Carolina State University, Raleigh, North Carolina 27695-8203
Carol A. Kinder and Robert E. ReedCenter for Applied Aquatic Ecology, North Carolina State University, Raleigh, North Carolina 27606
Michael A. Mallin and Matthew R. McIverCenter for Marine Science, University of North Carolina Wilmington, Wilmington, North Carolina 28409
Lawrence B. CahoonDepartment of Biological Sciences, University of North Carolina Wilmington, Wilmington, North Carolina 28403
Greg Melia2
Center for Applied Aquatic Ecology, North Carolina State University, Raleigh, North Carolina 27606
Cavell Brownie and Joy SmithDepartment of Statistics, North Carolina State University, Raleigh, North Carolina 27695-8203
Nora Deamer, Jeffrey Springer, Howard B. Glasgow, and David Toms3
Center for Applied Aquatic Ecology, North Carolina State University, Raleigh, North Carolina 27606
Abstract
We used a decadal data set, with weekly to biweekly sampling in April–October and monthly sampling in November–March, to characterize climatic (hurricane-level storms, a sustained 3-yr drought) and anthropogenic influences on N andP concentrations and loadings to a large eutrophic, poorly flushed estuary, the Neuse Estuary of the Albemarle–PamlicoEstuarine System. Mass volume transport data were obtained with cross-estuary transect flow measurements taken nearthe entrance to the estuary. Although trends were minimally influenced by hurricanes, analyses were significantly affectedby the sustained drought near the end of the study. As examples, decreasing trends in total N (TN), total P (TP), andbottom-water dissolved oxygen concentrations, and in TN loadings were significant considering all data, but these trendswere not significant when the sustained drought was excluded from analysis. In addition, the trend in TN loading wasespecially sensitive to the initial sampling period. NH concentrations dramatically increased (overall by ;500%) as a1
4
persistent trend regardless of attempts to control for climatic events. An increasing trend in NH also was documented14
in an adjacent, rapidly flushed Coastal Plain estuary, the Cape Fear. The NH data suggest a regional-scale effect of high14
inputs from inadequately controlled, increasing nonpoint sources. The fragility of TN loading trends, the striking increasein NH concentrations, and the lack of management emphasis on controlling nonpoint sources such as ‘‘new’’ industri-1
4
alized swine production collectively do not support recent reports of achievement of a 30% reduction in TN loading tothe Neuse. Nonpoint sources remain a critical target for reduction to alleviate the negative effects of cultural eutrophicationin this system, as in many estuaries throughout the world.
1 Corresponding author.2 Present address: North Carolina Department of Environment and
Natural Resources, Ecosystem Enhancement Program, Raleigh, NorthCarolina 27699.
3 Present address: North Carolina Department of Environment andNatural Resources, Division of Water Quality–Basinwide Planning, Ra-leigh, North Carolina 27699.Acknowledgments
North Carolina Department of Environment and Natural Resourcesstaff E. Fensin, J. Manning, D. Briley, R. Dove, A. Krambrink, M.Larsen, R. Nall, M. Zartarian, and the Center for Applied Aquatic Ecol-ogy staff and students assisted in field and laboratory efforts. A. Lewitus,P. Rublee, and S. Shumway provided counsel on the manuscript.
Funding support for this research was provided by the Water Re-sources Research Institute of the University of North Carolina, theU.S. Marine Air Station at Cherry Point (U.S. Army Center for En-vironmental Health), the U.S. Environmental Protection Agency(grants CR827831-01-0 and CP-97437001), the National ScienceFoundation (grant OCE9912089), the Lower Cape Fear River Pro-gram, an anonymous foundation, the Z. Smith Reynolds Foundation,the North Carolina General Assembly, and the Department of Botanyand College of Agriculture and Life Sciences at North Carolina StateUniversity.
We dedicate this study to Robert G. Wetzel, in tribute to his integ-rity and his many seminal contributions that have significantly ad-vanced aquatic science.

464 Burkholder et al.
. . . anthropogenic impacts on water quality are strong andthe need for characterizing ambient conditions and temporaltrends in these conditions is correspondingly urgent.
—Jassby et al. (1997)
More than two thirds of coastal rivers and bays in theUnited States are moderately to severely degraded from cul-tural eutrophication, exacerbated by poor flushing and sig-nificant human population growth in coastal areas (Brickeret al. 1999; National Research Council [NRC] 2000). De-spite this general recognition, there are as yet few successstories in achieving significant reductions, especially of non-point nutrient sources, to estuaries and coastal embayments(NRC 2000).
Cloern (2001) described three phases in the evolving con-ceptualization of the overall effects of cultural eutrophicationin aquatic ecosystems: Phase I historically emphasizedchanging nutrient inputs, phytoplankton response, and bot-tom-water oxygen depletion; Phase II, described as the con-temporary phase, has emphasized system-specific attributesthat modulate a complex suite of direct and indirect respons-es to enrichment, leading to large differences among fresh-waters and estuarine–coastal systems in their sensitivity toeutrophication; and Phase III, for the early 21st century, wasprojected to address several questions about effects of sys-tem-specific attributes on ecosystem response to eutrophi-cation, nutrient enrichment interactions with other stressors,and response linkages. As an additional question proposedfor guiding scientific research in Phase III, Cloern (2001)asked how deeper scientific understanding of coastal eutro-phication can be used to improve ecosystem restoration orrehabilitation. In this paper, we describe a decadal study thatfalls within Cloern’s (2001) Phase I, with some limited PhaseII insights. Yet this study illustrates the present status ofprogress in understanding cultural eutrophication: that formost estuarine–coastal aquatic ecosystems, sufficient long-term data are only beginning to become available to assesstrends in nutrient concentrations and loadings; that there isstill only limited understanding of climatic influences onthese trends; and that the trends themselves are a ‘‘movingtarget,’’ changing significantly depending on the period usedas time zero (Tinitial ). Accordingly, Jassby et al. (1997) de-scribed apparent Phase I research from Cloern (2001), thequantitative characterization of trends in anthropogenic ef-fects on water quality, as an ongoing, urgent need.
Here, we describe a decadal effort to address that need ina major U.S. estuary toward addressing the question of howimproved understanding of trends in nutrient concentrationsand loadings in this system can be used to improve effortsto restore it. The eutrophic Albemarle–Pamlico EstuarineEcosystem of North Carolina is the second largest estuaryand the largest lagoonal estuary on the U.S. mainland (Steel1991). The Outer Banks enclose this estuary except for sev-eral narrow inlets connecting it with the Atlantic Ocean. Thischaracteristic enhances the Albemarle–Pamlico’s function asa significant fish nursery ground; the broad, shallow (depthgenerally 2–4 m), sheltered system provides fully half of thetotal nursery area for commercially important species alongthe entire U.S. Atlantic Coast (Steel 1991). Its enclosed wa-ters are wind mixed, with little tidal effect (Reed et al. 2004),
and poorly flushed, with mean residence times in major trib-utaries estimated at 50–100 d over an annual cycle (Christianet al. 1991; Steel 1991).
These features make the Albemarle–Pamlico especiallysensitive to anthropogenic nutrient loading. Winds easily re-suspend nutrients that were deposited in the sediments, andpoor flushing tends to retain nutrients in these waters (Chris-tian et al. 1991; Giffin and Corbett 2003). Water quality inmany of its tributaries is degraded by excessive turbidity andnutrient loading from human activities (Steel 1991), and theestuary is considered one of the most eutrophic in the south-eastern United States (Bricker et al. 1999). Moreover, theAlbemarle–Pamlico is hurricane prone: Over the past ;100yr, more severe storms have struck the U.S. Atlantic Coastthan any other region on Earth, with North Carolina secondonly to Florida in the number of major storms that havemade landfall (U.S. Weather Service 2005). These majorstorms have caused flooding of concentrated (confined)swine feed operations (CAFOs), which have occurred inhigh density since the late 1980s in the watershed near theupper estuary (Burkholder et al. 1997). Moderate to highprecipitation has also led to bypassing of raw sewage frommunicipal wastewater treatment plants (WWTPs); floodingof WWTPs in the aftermath of Hurricanes Fran (1996) andFloyd (1999) led to sustained treatment bypasses and therelease of large amounts of raw sewage for weeks followingthe storms (Bales 2003). Although such major storms cancause acute short-term adverse effects on estuarine systems,they can also function beneficially in system flushing andrenewal (Bales 2003; Burkholder et al. 2004).
Numerous publications have described environmentalconditions and trends in the Albemarle–Pamlico at the endof the 20th century, especially in one of its major tributariesand largest nutrient contributor (McMahon and Woodside1997), the Neuse Estuary (Qian et al. 2000; North CarolinaDepartment of Environment and Natural Resources [NCDENR, formerly the Department of Environment, Health,and Natural Resources, DEHNR] 2001; Stow et al. 2001).However, in estimating nutrient loadings to the Neuse Es-tuary, researchers often were forced to rely on concentrationand flow data from locations 13–70 km upstream from theentrance to the estuary, with differences in basin drainagearea ranging from 11% to 65% (Epperley and Ross 1986;Bales and Robbins 1999). Extrapolative nutrient loadingmodels were developed in some cases to account for thesedifferences, but their accuracy was reduced by subsequentinstallation of dams, roads, or other flow modifiers. Similarapproaches commonly have been used in other estuaries(e.g., Jaworski 1981; Boynton et al. 1995). In addition, mod-els generally have had to rely on a synthesis of data onnutrient concentration from multiple sources, with variationsimposed by differences in sampling, analytical methodolo-gies, and uneven temporal and spatial distributions. Thesefactors have impeded adequate assessment of trends in nu-trient concentrations and loadings and effectiveness of man-agement strategies designed to reduce eutrophication. For theNeuse, nutrient loading estimates derived from these con-centration and flow data have been used to evaluate the suc-cess of management strategies to reduce oxygen deficits, al-gal blooms, and massive fish kills through targeted reduction

465Nutrient trends in a large estuary
of a total maximum daily load for nitrogen (NC DENR 1999;Reckhow 2003; Wool et al. 2003).
In this study, we used a network of long-term monitoringstations and a newly developed flow model to assess trendsin nutrient concentrations and loadings and response vari-ables in the Neuse Estuary. Our study differs from previousefforts in the following features: Other recent studies datefrom 1998 to 2000, and most were based on monthly data(one data point per month). Our study adds ;5 additionalyears of new information and used monthly averages froma higher frequency data set during April—October (two tofour data points per month; one data point per month inNovember—March). Previous studies (e.g., Qian et al. 2000;Stow et al. 2001; Borsuk et al. 2003) were also based onmidchannel data only, taken from the highest flushing area,which could have underestimated nutrient concentrationsand loadings. Our study captured conditions in side chan-nels, where much of the nutrient loading and algal bloomsoccur (Glasgow and Burkholder 2000). The previous studiesused flow data ;13–75 km upstream from the estuary, orattempted to extrapolate downstream to the estuary fromthose data. In contrast, the flow model used in this study wasbased on empirical acoustic Doppler current profiling datacollected near the oligohaline edge of the estuary. The dataused for this model encompassed conditions ranging fromlow flow (during a sustained 3-yr drought) to very high flow(1999, post–Hurricanes Dennis, Floyd, and Irene). Finally,other recent studies (e.g., Stow et al. 2001; Stow and Borsuk2003; Borsuk et al. 2004) used flow-adjusted concentrations,which ideally can help to account for flow variability andprovide a more accurate estimate of monthly concentrationsin riparian systems (U.S. Geological Survey [USGS] 2001).In the Neuse system, however, flow-adjusted models haveexplained only ;20–55% of the variance in nitrogen con-centrations at selected stations along the river, with lowercorrelations at stations near the estuary (Stow and Borsuk2003). Our flow model, developed for this study with em-pirically collected flow data near the estuary, was used incombination with concentration data that were measuredover the decadal period at the same locations. As an addi-tional novel contribution, we examined climatic (hurricane-level storms and a sustained drought) influences on eutro-phication in this estuary, augmented by a series ofautoregression models and an overview of some major nu-trient sources in the Neuse watershed.
Our analysis indicates decreasing trends in total N (TN)and total P (TP) concentrations and loadings and in bottom-water dissolved oxygen (DO) concentrations in the estuaryover the past decade, but these trends can primarily be ex-plained by climatic events (a sustained 3-yr drought near theend of the study) rather than management actions becausenutrient reductions from improved management practices inthe Neuse watershed over the past decade have been offsetby increases in human and swine populations and relatedfactors. In contrast, we report a striking increase in NH1
4
concentrations. We present evidence for a similar increasein NH concentrations in another major Coastal Plain river1
4
basin. Analysis of the NH concentration data, reflecting14
‘‘new N’’ as well as regenerative inputs, indicates that de-spite certain nutrient sources targeted for reduction in present
management plans, eutrophication is progressing in this es-tuary from addition of inorganic N (Ni) by inadequately con-trolled nonpoint nutrient sources.
Study area
The Neuse River and Estuary flow ;320 km through thePiedmont and Coastal Plain to Pamlico Sound (Fig. 1). Theupstream boundary of the study area (area drained, 1.37 3104 km2, or about 85% of the basin) was 13 km downstreamfrom New Bern (population 23,000; NC DENR 2002), in thevicinity of the entrance to the oligohaline estuary under av-erage flow conditions (Bowen and Hieronymus 2003; Fig.1). At New Bern, the Neuse abruptly widens and changesfrom a flowing river to a wind-mixed estuary that eventuallyflows into Pamlico Sound (Fig. 1). Approximately 50% ofthe Neuse waters in the Coastal Plain are contributed bysubsurface flow during low-flow conditions (Spruill 1997;Weaver 1998).
The watershed contains ;16,900 km of stream length,with ;66 km2 of run-of-river impoundments and 1.5 3 103
km2 of estuaries (NC DENR 2002). The system drains ;1.623 104 km2, with natural and cultivated forests (38%), agri-culture (29%), and wetlands (14%) dominating the water-shed (U.S. Environmental Protection Agency [EPA] 1999;U.S. Department of Agriculture [USDA] 2001). Urban areas,which compose ;13% of the Neuse watershed, continue torapidly expand and diversify (USDA 2001). The estuarinestudy area is mesohaline and has typical estuarine flow dy-namics, with outflow at the surface and inflow at the bottomalong with a predominant south shore surface outflow (Reedet al. 2004). Statistically significant cross-estuary and along-estuary differences occur in the mesohaline estuary in bothhalocline structure and nutrient concentrations (Reed et al.2004). The broad and shallow nature of this system resultsin complex hydrodynamics, including wind-induced upwell-ing of high-salinity bottom water.
At present, the Neuse watershed contains ;1.35 3 106
people (about 16% of the state’s population; NC DENR2002), with 54% of the basin population located in ;10%of the land area. Forest and cultivated croplands decreased;7.28 3 103 km2 over the past decade, giving way to landdevelopment (USDA 2001; Line et al. 2002; National Ag-ricultural Statistics Service 2004). The watershed also con-tains ;1.75 3 106 swine (;3.53106 swine produced peryear, or 18% of the state’s annual total, mostly in concen-trated animal feed operations or CAFOs), contributing anequivalent in sewage of about 7 million people (AmericanSociety of Agricultural Engineers 1998), and ;4.8 3 107
poultry produced per year (USDA 2001; Table 1). CAFOsare a recent feature on the landscape, mostly added since thelate 1980s (reviewed in Burkholder et al. 1997), with;1.93107 swine produced in North Carolina per year (NCDENR 2002). Thus, CAFOs represent a relatively new non-point source of mammal wastes (Table 1). Most CAFOs inNorth Carolina, including the Neuse watershed, are in theeastern Coastal Plain near the estuaries on former wetlands(Burkholder et al. 1997). The water table lies about 1 m, onaverage, from the surface soils; moreover, much of the land

466 Burkholder et al.
Fig. 1. The Neuse River and Estuary, showing USGS flow stations and the Mills Branch (MB)gate (generally the oligohaline edge of the estuary) for the flow model. The six main estuarinesampling sites are also shown, each ;750 m out from shore: Carolina Pines (CLP), Kennel Beach(KEN), the Neuse near the Beard Creek confluence (BRD), the Neuse near the Slocum Creekconfluence (SLC), Minnesott Beach (MIN), and Cherry Point (CHY). Municipal boundaries (NewBern, Havelock, Minnesott) are indicated in grey. Note that prevailing winds tend to mix the watersespecially toward the north shore, with the south shore relatively more protected (Reed et al. 2004).
Table 1. Estimated N and P contributions (average per year) of point and selected nonpointsources to the Neuse watershed.
Source* No. N (kg yr21) P (kg yr21)
Major WWTPs (discharge) 157 1.13105 4.83105
Other major point sources (discharge) 21 8.83104 3.73103
Synthetic fertilizers 2.93108 kg 2.93107 1.33106
Swine CAFOs (3.53106 animals produced)ActiveInactive
46075
2.03107
1?4.63106
1?Broiler chickens (CAFOs, other;
3.793107 animals produced) 4 6.43105 2.03105
Turkeys (1.043107 produced) — 4.13106 1.13106
Cattle (8.53105 animals produced) 7 3.63106 9.03105
* Major point sources are defined as discharging $3.73106 L d21 (1.0 million gallons per day); estimates excludesludge and bypasses. Swine CAFOs are defined as containing $250 animals as standing stock (NC DENR2004). Broiler chicken and turkey CAFOs are defined as having $30,000 birds as standing stock; the four inoperation account for a small portion of the standing crop of ;4.833107 birds produced yr21 in the Neusewatershed. Cattle operations are defined as containing $1,000 confined beef or 700 mature dairy cattle (liquidmanure systems requiring National Pollution Discharge Elimination System general permits) or 100 confinedcattle (liquid manure systems requiring a state general nondischarge permit). The above estimates excludematerials leached from dead animals (1–8% of production in swine) and leachate from inactive swine CAFOs.Synthetic fertilizer quantities pertain to multinutrient and single-nutrient fertilizers shipped within the watershedannually per fiscal year. Livestock, poultry, and fertilizer data are from Powers and Van Horn (1998) and NCDACS (2002).
previously had been ditched or tile-drained to channel runoffto receiving rivers and estuaries (Steel 1991). CAFOs releasehigh quantities of NH3 and other nutrient forms into the at-mosphere and adjacent surface and subsurface waters (e.g.,Burkholder et al. 1997; Mallin 2000; Walker et al. 2000).
The Neuse contributes the largest percentage of N and Pto the Albemarle–Pamlico Sound, accounting for almost
35% of the N and 50% of the P loadings, although it rep-resents only ;20% of the total contributing drainage area(Spruill et al. 1998; USDA 2001; North Carolina Center forGeographic Information and Analysis 2002). The state’s‘‘nutrient-sensitive waters’’ (NSW) classification was ap-plied to the eutrophic Neuse River and Estuary in the late1980s because the system sustains major algal blooms, ox-

467Nutrient trends in a large estuary
ygen deficits, and fish kills during most annual cycles (NCDENR 1997a). Through 1997, P was the nutrient targetedfor reduction in the Neuse system. Focus shifted in 1998 todevelopment of a total maximum daily load (TMDL; NCDENR 1999) for total nitrogen. Run-of-river impoundmentsin the upper Neuse, as well as lower freshwater segments,have supported late summer cyanobacterial blooms (e.g., Mi-crocystis aeruginosa Kutzing; Christian et al. 1986), andcryptic cyanobacteria have also been abundant in the estuary(Fensin 1997). Freshwater blooms, limited by light avail-ability and P inputs (e.g., Christian et al. 1986; Cuker et al.1990), give way to estuarine blooms of dinoflagellates andother flagellates (Mallin 1994; Pinckney et al. 1997; Burk-holder et al. 1999).
The mesohaline estuary supports massive dinoflagellateblooms, especially during high-precipitation winter–springseasons (Mallin 1994; Springer et al. 2004). Mesohalinephytoplankton productivity has been positively correlatedwith delivery of nitrate from upper freshwater segments(Mallin et al. 1993). Colimitation of both N and P has beendemonstrated for the estuarine plankton during spring (Ru-dek et al. 1991), indicative of high nutrient loading (e.g.,Fisher et al. 1992), with N limitation invoked for the re-mainder of the annual cycle (Rudek et al. 1991). Other re-searchers, however, have reported that the N : P concentrationratio might have substantially increased and have suggestedthat the estuary could be sustaining a shift toward P limi-tation extending longer than the spring season (Qian et al.2000). The relative isolation of the Neuse Estuary fromocean inputs and the extended flushing rates promote non-conservative mixing and substantial recycling of these nu-trients (Christian et al. 1991).
During this decadal study, human population in the Neusewatershed increased by 16% (North Carolina State DataCenter 2004), impervious surface area from urbanizationdoubled (USGS 1980; EPA 1999), and use of synthetic fer-tilizers decreased by ;20% (NC Department of Agricultureand Consumer Services 2002). The swine population in-creased ;285% since 1990. At the same time, nutrient re-ductions occurred through improved effluent treatment insome municipal WWTPs, and an agreement was also forgedby cropland agriculturalists to plan to apply ;40% less fer-tilizer (Center for Agricultural Partnerships 2002).
Materials and methods
Sampling design and measurements—The estuarine waterquality study extended from May 1993 to June 2003. Sixsites in the mesohaline Neuse Estuary were sampled (Fig.1): Carolina Pines (CLP; Global Positioning System [GPS]coordinates 34.9693N, 76.9125W; referred to as site 38 orFLN in Glasgow and Burkholder 2000), Kennel Beach(KEN; GPS coordinates 35.0171N, 76.9068W), Beard Creek(BRD; GPS coordinates 34.9981N, 76.8709W; referred to assite 36 in Glasgow and Burkholder 2000), Slocum Creek(SLC; GPS coordinates 34.9568N, 76.8851W; referred to asRAD in Glasgow and Burkholder 2000), Cherry Point(CHY; GPS coordinates 34.9474N, 76.8159W), and Min-nesott Beach (MIN; GPS coordinates 34.9638N, 76.8124W).
It should be noted that station SLC was also the dischargearea of a major point source to the Neuse Estuary, theWWTP of the U.S. Marine Corps Air Station, Cherry Point.This WWTP began discharge in 1994 (7.6 3 106 L d21;maximum capacity 1.33 3 107 L d21) and was permitted at#30 mg NO L21 and #2 mg TP L21 (NC DENR–DWQ2
3
permitting records). The six stations were sampled weeklythroughout 1993–1998. From 1999 to 2003 they were sam-pled biweekly from April through October, and monthlyfrom November through March. Infrequent departures fromthis schedule resulted from field instrumentation malfunc-tions or from severe storms that prevented sampling. A sev-enth station, Mills Branch (MB), near the oligohaline edgeof the estuary under average flow conditions (Bowen andHieronymus 2003), was added for the last 4.5 yr of the study(January 1999–June 2003; Fig. 1).
Sampling and analytical procedures recognized by stateand federal regulatory agencies (40CFR Part 136; AmericanPublic Health Association [APHA] et al. 1992; EPA 1993)were used together with sanctioned modifications as EPAvariances for analysis of N and P species. Certification withDWQ and EPA involved external audit of analytical proce-dures, data and quality assurance measures, and participationin blind performance evaluation studies. Certain physicaland chemical variables were determined in situ with a Hy-drolab H2O multiprobe and transmitter with SVR4-DL da-talogger and included depth profiles (0.5-m intervals) fortemperature, salinity, pH, and DO. The Hydrolab datasondewas calibrated daily during use periods. Photosyntheticallyactive radiation was recorded with a LiCor datalogger and4p spherical sensor with light attenuation coefficients cal-culated following Wetzel and Likens (2001). Transparencywas also assessed from Secchi depth data (Wetzel and Likens2001). An integrated water column sampler (modified fromCuker et al. 1990) was used to collect samples from theupper and lower water column (0.0–1.5 m, and 1.5 m to justabove the bottom sediments at 2.5–3.5 m, respectively, indeeper sites). The water column sampler was thoroughlyrinsed with site water before sampling. Samples were main-tained in darkness on ice for transport to the laboratory andwere then refrigerated or frozen as appropriate until analysis(EPA 1993).
In addition to the routine monitoring regime describedabove, event-driven sampling efforts were undertaken(1998–2003) to track phytoplankton blooms (chlorophyll a[Chl a] . 40 mg L21, the state standard for acceptable waterquality; NC DEHNR 1996a) throughout the study area fromMills Branch (MB) to MIN–CHY (Fig. 1). Bloom eventswere detected on the basis of observations by field personnelduring routine monitoring or through detection by our re-mote monitoring network (from 2000 on; Glasgow et al.2004) of instrumented platforms at the six sites on the basisof pH and DO profiles. Subsamples were preserved withacidic Lugol’s solution (Wetzel and Likens 2001) in the fieldand held at 48C until analysis for bloom-forming taxa (lightmicroscopy for nontoxic dinoflagellates forming winterblooms.
Samples for analysis of suspended solids (SS) were main-tained at #48C, filtered within 48 h, and measured gravi-metrically (method 2540D, APHA et al. 1992). Chl a sam-

468 Burkholder et al.
ples were filtered under low vacuum (Whatman GF/C filters,55–69 kPa) and low light (20 mmol photons m22 s21) within12 h of collection and were stored frozen (2208C) with des-iccant in darkness until analysis within 2 months. Chl a wasextracted in 90% basic acetone (EPA 1997a; Wetzel andLikens 2001), and fluorescence was determined with a Turn-er 10-AU fluorometer.
Nutrients were analyzed with a Technicon (Traacs 800) orLachat Instruments (Quickchem 8000) autoanalyzer. Vari-ances from the EPA and the NC DENR–DWQ were obtainedto enable use of procedures for nutrient sample storage andanalysis (substitution of freezing at 2208C for acidification;2-month limit) that accommodated low-level analysis of es-tuarine matrices (EPA 1992, 1997b). Water samples for TPanalysis were frozen at 2208C until analysis with a varianceof EPA method 365.1 (EPA 1992, 1993; practical quantita-tion limit [APHA et al. 1992] 10 mg L21). NH samples were1
4
preserved immediately with phenol in the field (Glasgow andBurkholder 2000) and were held in darkness on ice duringtransport. Analysis followed a variance of EPA method350.1 (EPA 1993; practical quantitation limit 12 mg NH1
4
L21). Samples for NO 1 NO analysis (hereafter referred2 23 2
to as nitrate) were frozen and analyzed within 2 months witha variance of EPA method 353.4 (EPA 1992; practical quan-titation limit 6 mg NO L21). Samples for total Kjeldahl N2
3
analysis (TKN 5 free NH3 1 No [organic N]) were assayedas in Glasgow and Burkholder (2000) with a state-certifiedmethod and a detection limit of 1,000 mg L21 from May1993–April 1994; for the remainder of the study, we used amodification of EPA method 351.2 (EPA 1993; samples heldat 2208C and not preserved with sulfuric acid; practicalquantitation limit 140 mg N L21). Values for TN (as TKN1 NO ) and TP were used to calculate TN : TP ratios (June2
3
1994–June 2003; molar basis).
Mass water transport—A boat-mounted acoustic Dopplercurrent profiler (ADCP; Workhorse Rio Grande model, 1,200kHz direct reading; RD Instruments) was used to obtain dis-charge measurements from cross-estuary transects taken atMills Branch, New Bern, North Carolina (Fig. 1). As men-tioned, this site is located in the vicinity of the estuary’soligohaline edge under average flow conditions (Bowen andHieronymus 2003). ADCP with bottom-tracking technologycan more accurately estimate river discharge into estuarinesystems (as opposed to measurements extrapolated from asingle point–determined or fixed-location gauging station atsubstantial distance upstream), by effectively separating outbidirectional (upriver and downriver) estuarine influences(reviewed in Glasgow and Burkholder 2000; Reed et al.2004). Such estuarine influences can include increased localwinds (directed upstream and downstream) or precipitationevents (Reed et al. 2004). The separation of bidirectionalestuarine influences made it possible to exclude upstreammovement in calculating net downstream volume of flow.
The ADCP was configured to give short-term velocity er-rors of 2.6 cm s21. The error value of this standard config-uration is ;1.6-fold greater than the theoretical standard de-viation of a perfect ADCP system (Therault 1986). TheADCP was attached to a boom mounted to the bow of asmall boat (8-m-long customized Albemarle boat with cen-
tral console). Data were taken from shore to shore at MillsBranch at a boat velocity of 4–5 knots h21. The positioningantenna for the differential GPS (Ashtech BR2G) wasmounted on a raised standard that was attached to the ADCPboom, allowing maximum accuracy in positioning the boatfor transect replication. The ADCP data included 28 tran-sects with $95% downstream flow (N 5 28 dates; cross-estuary transects taken in January 1999–August 2001; 53cross-estuary transects generated 1,737 ADCP ensembles).If more than one transect on a given date met the 95% down-stream flow criterion, the data were averaged (e.g., 12 tran-sects on 3 March 2001, 9 transects on 4 April 2001). Thenumber of ensembles in each transect was dependent on boatspeed, water depth, ADCP configuration, and other param-eters.
The estimates for mass water transport into the estuary onthe basis of these data were compared with estimated valuesfrom another model that has been used historically in theNeuse. That model relies on an equation that was developedby Weyerhaeuser (Thut 1980) before installation of a majordam on the Neuse in the upper watershed (Falls of theNeuse, which impounded 35 km of the river; NC DEHNR1993; NC DENR 2002), which extrapolates discharge mea-sured by a fixed-point USGS station at Kinston, North Car-olina (;70 km upstream from Mills Branch). On the basisof the results of a linear regression between the measuredADCP and the estimated extrapolated Weyerhaeuser values,the Weyerhaeuser equation tended to underestimate flowduring lower flow conditions and to overestimate duringhigher flow conditions.
The ADCP data were used to develop an updated, seg-mented linear regression model to predict discharge at MillsBranch, North Carolina, from measured flow (USGS fixed-point station) at Kinston, North Carolina. These ADCP dataencompassed conditions ranging from low flow (droughtyears) to very high flow (1999, post–Hurricanes Dennis,Floyd, and Irene). Flow rates at Kinston in the data set usedto develop the prediction equations ranged from 13 to 750m3 s21, compared with a range of 7 to 1,014 m3 s21 for thecomplete decadal data set. Predicted values for the largerdata set involved extrapolation of higher flow data only from6 d post–Hurricane Fran (0.15% of the data) during the 10-yr study. Overall, the new model should be more accuratethan those based on the older straight line model. MillsBranch was used as the model gate because it is locatedfarther downstream near the oligohaline edge of the estuaryand was more inclusive of upstream hydrologic contributionsthan USGS gauging stations that historically have been usedfor regulatory-based assessments of nutrient loadings to theNeuse Estuary (e.g., DiPiero et al. 1994; NC DENR 1999;Qian et al. 2000; Fig. 1). It also included the flow from amajor groundwater discharge area located in the vicinity ofNew Bern and the oligohaline edge of the estuary, importantbecause subsurface flow contributes ;50% of the totalNeuse flow during low-flow conditions (Spruill 1997; Weav-er 1998). In addition, the location for the new gate includesinput from where the Castle Hayne aquifer is exposed to theland surface and comes into direct contact with the NeuseRiver (Winner and Coble 1996; Weaver 1998). The CastleHayne aquifer was determined to be the source of a large
469Nutrient trends in a large estuary
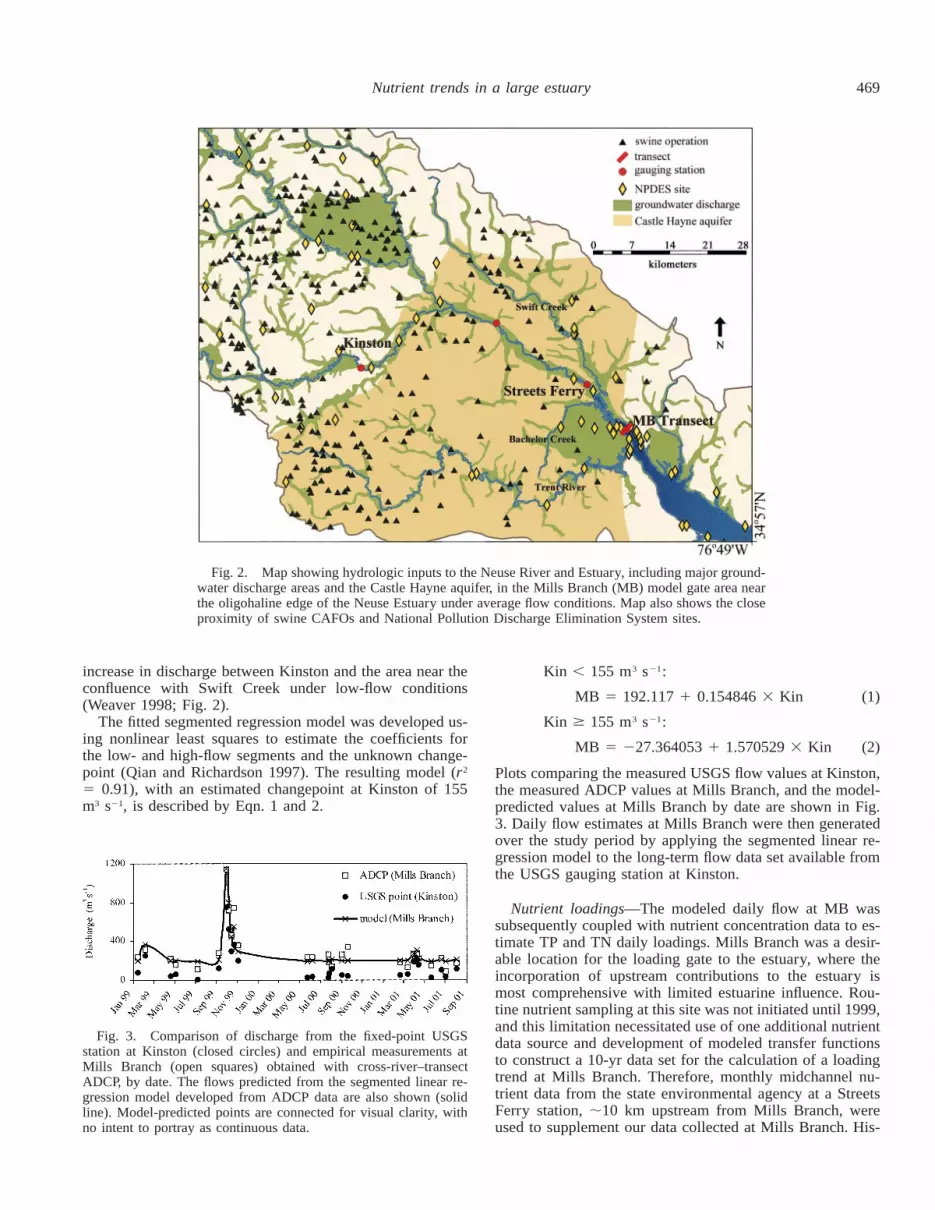
Fig. 2. Map showing hydrologic inputs to the Neuse River and Estuary, including major ground-water discharge areas and the Castle Hayne aquifer, in the Mills Branch (MB) model gate area nearthe oligohaline edge of the Neuse Estuary under average flow conditions. Map also shows the closeproximity of swine CAFOs and National Pollution Discharge Elimination System sites.
Fig. 3. Comparison of discharge from the fixed-point USGSstation at Kinston (closed circles) and empirical measurements atMills Branch (open squares) obtained with cross-river–transectADCP, by date. The flows predicted from the segmented linear re-gression model developed from ADCP data are also shown (solidline). Model-predicted points are connected for visual clarity, withno intent to portray as continuous data.
increase in discharge between Kinston and the area near theconfluence with Swift Creek under low-flow conditions(Weaver 1998; Fig. 2).
The fitted segmented regression model was developed us-ing nonlinear least squares to estimate the coefficients forthe low- and high-flow segments and the unknown change-point (Qian and Richardson 1997). The resulting model (r2
5 0.91), with an estimated changepoint at Kinston of 155m3 s21, is described by Eqn. 1 and 2.
3 21Kin , 155 m s :
MB 5 192.117 1 0.154846 3 Kin (1)3 21Kin $ 155 m s :
MB 5 227.364053 1 1.570529 3 Kin (2)
Plots comparing the measured USGS flow values at Kinston,the measured ADCP values at Mills Branch, and the model-predicted values at Mills Branch by date are shown in Fig.3. Daily flow estimates at Mills Branch were then generatedover the study period by applying the segmented linear re-gression model to the long-term flow data set available fromthe USGS gauging station at Kinston.
Nutrient loadings—The modeled daily flow at MB wassubsequently coupled with nutrient concentration data to es-timate TP and TN daily loadings. Mills Branch was a desir-able location for the loading gate to the estuary, where theincorporation of upstream contributions to the estuary ismost comprehensive with limited estuarine influence. Rou-tine nutrient sampling at this site was not initiated until 1999,and this limitation necessitated use of one additional nutrientdata source and development of modeled transfer functionsto construct a 10-yr data set for the calculation of a loadingtrend at Mills Branch. Therefore, monthly midchannel nu-trient data from the state environmental agency at a StreetsFerry station, ;10 km upstream from Mills Branch, wereused to supplement our data collected at Mills Branch. His-

470 Burkholder et al.
torically, the state data set was coupled with direct flow mea-surements from upstream USGS gauging stations, or withflow models based on these stations, to estimate nutrientloadings (e.g., Thut 1980; NC DENR 1999; Stow et al.2001).
It was determined from PROC UNIVARIATE t-tests(SAS Institute 1999) that TP concentrations from these twolocations (Mills Branch and Streets Ferry) collected over thesame period (January 1999–December 2001) were not sta-tistically different. Thus, the January 1993–1998 Streets Fer-ry data and the 1999–2003 Mills Branch data were pooledto estimate the approximate decadal trend in TP loading(January 1993–June 2003). However, the TN data from thetwo locations collected during the 1999–2001 period werestatistically different (p , 0.05). Therefore, differences be-tween TN concentrations from Streets Ferry and MillsBranch during 1999–2001 were modeled with PROC ARI-MA (SAS Institute 1999) to produce a transfer function(Brocklebank and Dickey 2003) that was then used to back-cast TN concentrations at Mills Branch for January 1993–December 1998. Specifically, we calculated the percent dif-ference (P) between the two sites, P 5 (X 2 Y)/X, where Xrepresents the observed concentration at Streets Ferry and Yrepresents the concentration at Mills Branch. We determinedP from the data (available in 1999–2001) on X and Y andused the relationship Y 5 (1 2 P)X to impute a value of Yfrom the observed X when Y was missing. Because P mightnot be a constant function over time, we fitted a model to Pover the period when X and Y data were available. We thenreversed the time order of those data so that a ‘‘forecast’’would actually move backward in time from the first ob-served available P. We refer to these forecasts from the re-verse-ordered data as ‘‘backcasts.’’ After considering severalmodels, we selected the estimated general least squares mod-el for the P data to account for autocorrelation, with a period12 sine wave plus ARIMA errors. In this way, the directmeasurements available from Mills Branch from January1999 to June 2003 were then coupled with the backcasteddata for use with the flow estimates to estimate TN loadingsand the associated trend analysis. It should be noted that wefound no significant trend in flow over the decadal study,and very low correlation between flow and TN concentration(Mills Branch station: r2 5 0.07 for all years; r2 5 0.17,yearly mean) and did not use flow-adjusted concentrationsto estimate nutrient loadings because flow-adjusted concen-tration models have explained only ;35–40% of the vari-ance in nitrogen concentrations in the lower Neuse near theestuary (Stow and Borsuk 2003).
Data management and statistical analyses—Data wereanalyzed with Statistical Analysis System software (SAS–PC SAS version 8.01; SAS Institute 1999). The data matrixcontained .135,000 observations on physical, chemical, andbiological variables from .350 sampling periods, includingmore than ;4,030 records on nutrient concentrations.
Time series models for the nutrient data were created withPROC ARIMA, a parametric autoregressive, integrated,moving average modeling technique that assumes normalityin distribution and allows strong statistical evaluation of sea-sonal and linear trends (SAS Institute 1999). Analyses were
completed with and without extreme values, which did notsignificantly influence the trends in the data. Various modelshave been used in previous work to assess nutrient trends inthe Neuse and other estuaries, such as nonparametric models(e.g., Berryman et al. 1988; Reckhow et al. 1992; Qian etal. 2000) or dynamic regressions (e.g., Lamon et al. 2004),which allow the magnitudes of the seasonality terms and thetrend slopes to change over time. The modeling approachused here combined the parametric PROC ARIMA withsome nonparametric features. PROC ARIMA was used rath-er than seasonal trend decomposition (STL) using loess (lo-cally weighted regression; Cleveland et al. 1990) becauseloess is a regression technique that uses local smoothing anddoes not take into account the beginning and end of the timeseries. Seasonal Kendall Tau would divide the data seriesinto 12 segments (months); the data would then be analyzedby shorter segments for trends, which can produce errors andresults that have less power. ARIMA, in contrast, has thecapability of analyzing forward and backward (i.e., as amoving average; Brocklebank and Dickey 2003).
PROC ARIMA was performed on monthly averages toensure equal spacing of the data and to preserve the envi-ronmental variability observed in nutrient concentrations,which tend to exemplify extreme value distributions. A nat-ural log transformation was then performed on all nutrientdata. This gave a more symmetric error distribution and re-duced the magnitude of any large errors. A further advantageto the use of transformed data is that percent changes be-come additive changes on the logarithmic scale, making thedata more amenable to statistical evaluation, in that moststatistical models are additive in nature. The model-buildingprocess consisted of choosing from several model compo-nents in addition to the linear trend term to measure long-term secular movement. They included a sine and cosine ofperiod 12 months, which would deliver an exact sine waveof period 12 and harmonic sine and cosine pairs (Brockle-bank and Dickey 2003). For example, the first harmonic hadperiod 6 months and went through two cycles per year; thenext went through three cycles. The result was a period-12function that allowed for flexibility in the sine wave, whileimposing regular behavior (i.e., a deterministic monotonetrend and a repeating seasonal pattern).
The autoregressive and moving average coefficients p andq, respectively, were obtained by analyzing the normal, par-tial, and inverse autocorrelation functions. The p and q termswere included so that the model used data from the previousmonth and the same month from the previous year. The finalmodel was selected by minimizing the Akaike informationcriterion (AIC) and checking that the residuals were random,or white noise. This method ensured that each parameter wasindividually tailored to select the model with the best fit.Among the models considered were some with seasonal au-toregressive terms, thus allowing local departures from thelinear trend and seasonal pattern. Autoregressive terms wereadded at lags 1 and 12 in a seasonal multiplicative model(Brocklebank and Dickey 2003). The lag 1 term consideredthe previous month’s deviation from that regular pattern andadjusted the forecast up or down accordingly. The lag 12term made a similar adjustment on the basis of the deviationobserved for the same month in the last year. In this way,

471Nutrient trends in a large estuary
Table 2. Comparison of trend results from ARIMA (parametric) and seasonal Kendall Tau (nonparametric) models. Bold indicatessignificance.
Nutrient YearsTrend
p valueTrendvalue AIC†
Changein units Unit Model
ARIMATPTN
1NH4
12 2NO NO3 2
TKN
93–0394–0393–0393–0393–03
0.036**0.027**
,0.0001***0.4030.102
20.002220.0028
0.01490.068
20.0019
40.12125.1
240.8380.8
2107.5
2262272
4923
2179
mgmgmgmgmg
p51; time cos cos2 sin sin2p5(1)(12); time cos cos2 sin sin2q51; time cos cos2 sin sin2p5(1)(12); time cos cos2 sin sin2p51 q51; time cos cos2 sin sin2
SSSRPChl aTN : TP‡TP load
93–0393–0393–0393–0393–03
0.011**0.4910.5330.5130.220
20.002320.0020
0.00140.0013
20.0016
65.6203.0195.7
43.812.9
222533
21.53104
mgmgmg—kg
p51 q51; time cos cos2 sin sin2p5(1)(12); time cos cos2 sin sin2p51; time cos sinp51 q51; time cos cos2 sin sin2p51 q51; time cos cos2 sin sin2
TP loadTN loadTN load
93-9993–0393–99
0.9630.017**0.313
0.000120.002620.0019
31.0212.2
3.1
70422.53105
21.33105
kgkgkg
q52; time cos sinp51; time cos cos2 sin sin2p51; time cos sin
p valueTau
statisticSlope
statistic
Seasonal Kendall TauTPTN
1NH4
12 2NO NO3 2
TKN
93–0394–0393–0393–0393–03
0.099*0.027**0.004***0.4240.020**
20.243720.4559
0.53610.0741
20.4524
22.4235.8
4.10.1
226.9
2252325
421
2272
mgmgmgmgmg
SSSRPChl aTN : TP‡TP load
93–0393–0393–0393–0393–03
,0.0001***0.2360.4540.5640.268
20.294320.1228
0.056520.087320.1333
20.220.4
0.220.2
21,181
22242
2221.23104
mgmgmg—kg
TP loadTN loadTN load
93–9993–0393–99
0.7630.012**0.194
20.039720.392620.1905
2421230,461229,298
22,94623.23105
22.13105
kgkgkg
† Akaike information criterion.‡ Molar ratio.* p#0.1** p#0.05.*** p#0.005.
the trend and seasonal influence become more flexible. Theresulting model created with the ARIMA method represent-ed a linear combination of the past values of a given nutrient,past errors (also called shocks or innovations), and currentand past values of other time series (SAS Institute 1999).
The parametric statistical modeling approach used hereincluded some nonparametric features, which provided ahigher level of power with the parametric method than couldhave been achieved with a nonparametric test alone. Themodels were evaluated to ensure that they were reasonable(including examination of AIC, chi-square residuals for au-tocorrelation, etc.; see Table 2 for the model and AIC as-sociated with each model formation for the principal set ofdecadal data). Although parametric models are more pow-erful if the assumptions are correct, assumption failure cancause problems in some aspects of inference (Brocklebankand Dickey 2003). Nonparametric models (e.g., Qian et al.2000) guard against failure of some assumptions at the ex-pense of sacrificing some power to detect effects when theyare actually there. In recognition of these trade-offs, we also
analyzed the primary data set with the seasonal Kendall Taumodeling approach (Reckhow et al. 1992) for comparison.On the basis of the preferred methodology in the literatureand because the seasonal Kendall Tau assigns ranks, we usedthe median statistic when analyzing the monthly concentra-tion data for each parameter with this approach.
Trend analysis was performed for each of the followingparameters in the Neuse data set—concentrations of SS, TP,SRP, TN, NO 1 NO , TKN, and NH —with the use of2 2 1
3 2 4
monthly means (ARIMA) calculated from the data and withTN and TP loadings summed by month from the daily load-ings. The concentration trends were determined from the me-sohaline estuary stations; the loading trends were predictedfor the Mills Branch site with the NC DENR data from theStreets Ferry station to augment our Mills Branch data. TNloading trends for 1993–2003 were compared with trendsfrom June 1994 to 2003, considering the previously men-tioned methodological differences among data sources.Trend analyses were also conducted for the TN : TP molarratios (June 1994–June 2003,) and Chl a. (1) Evaluation of

472 Burkholder et al.
Fig. 4. Annual volume of flow to the Neuse Estuary at MillsBranch during the 1990s to 2003, estimated from daily USGS flowdata at Kinston by the segmented linear regression model (namesindicate tropical storms). Note that mass water transport at MillsBranch was 15% lower per year during 2000–2002 than during allother years of the study because of a sustained 3-yr drought.
the entire data set (May 1993–June 2003), which included10 tropical cyclones, was compared with (2) analysis of thisdata set, excluding the most intensive hurricane seasons in1996 and 1999; (3) analysis of the 1993–1999 data to assesseffects of an ;3-yr sustained drought (2000–2002); and (4)analysis of the 1993–1999 data set, excluding the 1996 and1999 hurricanes. (5) Other alterations included separating thedecadal data set into upper and lower depth bins. In addition,we examined the influence of the starting point (Tinitial ) ontrend analyses for TP concentrations and loadings, TN con-centrations and loadings, DO concentrations (depth $ 3.0m), and Chl a by running the analyses with each of the first6 months as Tinitial.
All statistical analyses were performed at an a 5 0.05level of significance; significance at a # 0.10 was also re-ported. The null hypothesis of zero slope over time was test-ed. If the model(s) indicated a significant linear trend, thenull hypothesis was rejected, and the trend parameter wasused to calculate beginning and end values of the trend andto calculate percent change over the series. All models wererun on the log-transformed data and then transformed backto the original units for graphical display. Although the trendanalysis plots showing concentrations (i.e., untransformedunits) from ARIMA appear linear, they actually were cur-vilinear; depending on the range of data, this was difficultto visually discern. Transformation bias (i.e., from trans-forming back to the original scale from the log scale; Sprue-gel 1983) was not accounted for because such effort wouldhave introduced an unknown error term into the equation; itwould have been difficult to add or subtract an unknownquantity of error and evaluate whether the resulting trendwas in the correct direction.
Finally, flow was examined as a potential covariate to de-termine whether it was necessary to adjust for the influenceof flow on concentration (i.e., to check whether an observedtrend in a response variable might have simply been due toincreased or decreased flow). There were no significanttrends in either the Kinston flow or the predicted flow atMills Branch over the study. The flat trend line in flow,considered together with the low correlation of flow-adjustedconcentrations at downstream sites (reported in Stow andBorsuk 2003), did not support use of flow-adjusted concen-trations (USGS 2001).
Results
Climatic conditions—During this study, the Neuse Estu-ary was affected by 10 tropical cyclones with high floodingand a sustained 3-yr drought (2000–2002; Fig. 4). EasternNorth Carolina was under drought conditions throughoutmost of summer 1993, followed by precipitation from Hur-ricane Emily (category 3), which passed near the OuterBanks in late August. Precipitation in 1994 was close to thelong-term average (on the basis of the 100-yr annual meanfor North Carolina; Southeast Regional Climate Center2004), followed by a high-precipitation year in late winterthrough midsummer 1995, setting a 100-yr record for thePiedmont in the upper Neuse watershed (State Climate Of-fice of North Carolina 2004). A second high-precipitation
year, 1996, included intense storms, especially HurricanesBertha (level 3; early July) and Fran (level 3; early Septem-ber). Fran was the most severe of the hurricanes in 1993–1996, in part because its path followed the length of theNeuse watershed (Bales and Childress 1996; Bales 2003).Although spring 1998 was a wet period (highest precipita-tion period on record since 1930 at the Kinston USGS sta-tion and double the mean seasonal flow), annual precipita-tion totals in 1997–1998 approximated the long-term mean.A highly active hurricane season characterized 1999, includ-ing Hurricanes Dennis (which struck North Carolina twice),Floyd, and Irene (Burkholder et al. 2004). Of these, Floydcaused a 500-yr flood in some areas of the Neuse basin(Bales 2003).
In marked contrast, the sustained drought affected thestudy area during 2000–2002 (State Climate Office of NorthCarolina 2003). This long-term drought was evaluated as theworst sustained by North Carolina in more than 100 yr, andmuch of the state was declared a federal drought disasterarea for agriculture. The precipitation total for 2000–2002was the fourth lowest on record, and the mid and upperNeuse watershed accrued rainfall deficits equivalent to morethan a year’s average precipitation (Southeast Regional Cli-mate Center 2004). This sustained drought was followed byan above-average precipitation year in 2003 (State ClimateOffice of North Carolina 2003), especially for the first 6months included in this study.
General environment—Site-specific and interannual vari-ability in salinity and halocline depth occurred in this eco-system (Reed et al. 2004). Depending on seasonal precipi-tation patterns, surface salinities (means 6 1 SE) varied from4.1 6 2.3 to 12.1 6 5.3 (grand mean, surface waters 9.3 60.1) and ranged from 0.0 to 26.8. These variable ranges en-compassed conditions reported in other studies of this sys-tem (e.g., Pinckney et al. 1997; Glasgow and Burkholder2000). Analysis of the light attenuation values indicated sub-stantial turbidity in this estuary. High SS values were re-corded in the lower water column during winter–spring1995–1996 (25–30 mg L21, twofold higher than maxima dur-ing other years), and reflected both sediments from runoff

473Nutrient trends in a large estuary
Fig. 5. Suspended solids concentrations in the Neuse Estuary,considering the six mesohaline stations collectively (A) over thedecadal study (1993–2003; n 5 121 months; 4,015 samples) and(B) excluding the period post-1999 with the sustained drought (n5 79 months; 2,664 samples). Linear trend lines (dashed) werecalculated by least squares means for all sites. Also shown are the95% confidence limits (dotted lines), predicted (model-fitted) values(solid line), p value (probability associated with the linear slope),percent change in SS, and corresponding change in SS concentra-tion (in parentheses).
and a massive nontoxic dinoflagellate bloom. High SS wasalso measured after major storms (e.g., up to 22 mg L21
post–Hurricane Fran vs. ;5.5 6 1.0 mg L21 pre-Fran). Over-all, SS concentrations decreased by 24% over the study(1993–2003, p 5 0.01) or predrought years 1993–1999 (p, 0.0001; Fig. 5).
Dissolved oxygen—During warmer months in all years,hypoxia/anoxia occurred in the lower third of the water col-umn at all six mesohaline sites, in violation of the state stan-dard for fish health ($5 mg DO L21; NC DEHNR 1996a;Fig. 6). Density stratification with formation of salt wedgesexacerbated bottom-water hypoxia. Runoff associated withhigh precipitation in late winter and early spring, with con-tributed organic loadings, likely led to the bottom-water ox-
ygen sags that were sometimes observed early in the grow-ing season (mid-March through early April). Hypoxia/anoxiain more than the lower third of the water column occurredinfrequently in localized areas during most years. Exceptionsoccurred during July 1995, several days in early October1995, and in localized areas for short periods following hur-ricanes. During late summer 1996, Hurricane Fran causedloading of millions of liters of raw sewage, swine industrywastes, and swamp waters into the Neuse (NC DEHNR1996b), resulting in complete water column anoxia and fishkills in upstream freshwater segments, but not in the meso-haline estuary (Burkholder et al. 1999). In contrast, the high-er flood volume and dilution of Hurricanes Dennis, Floyd,and Irene resulted mostly in short-term bottom-water hyp-oxia; no major fish kills were reported (Burkholder et al.2004).
Trend analysis indicated that for all mesohaline sites con-sidered collectively, water column DO decreased (total watercolumn by 9%, p 5 0.070; depth $ 0.5 m by 211%, p 50.047) and bottom-water DO significantly decreased (depth$ 3 m by 219%; p 5 0.040) over the decadal study (Table3; Fig. 6A–C). However, there was no significant change inDO when post-1999 years, including the sustained drought,were excluded from the analysis (1993–1999, p 5 0.372–0.501; Fig. 6D–F). For the six sites considered separately (N5 121 dates with $2,170 records per site), overall watercolumn DO concentrations significantly decreased at SLC(by 15%, p 5 0.032), KEN (by 10%, borderline significanceat p 5 0.056), and CLP (by 14%, p 5 0.020).
Phytoplankton—Phytoplankton biomass as Chl a gener-ally was 15–25 mg L21 over the decadal study (grand mean20.3 6 0.3 mg L21), indicative of eutrophic conditions (Mal-lin 1994; Bricker et al. 1999; Fig. 7). In the mesohalineestuary, trend analysis indicated no significant change in Chla over the decadal study, with or without the 1996 and 1999hurricane seasons, except at KEN (61% increase from 1993to 2003, p 5 0.038, n 5 120; 693 samples), where severaldense winter–early spring blooms occurred. During the last4 yr of the study, including the sustained drought, analysisof the Chl a data showed a significant increasing trend (75%increase from 2000 to 2003; p 5 0.0001, n 5 40; 1,348samples), indicating enhancement of algal blooms duringsustained drought conditions, with high Chl a especially inwinter 2001–2002.
Winter blooms of dinoflagellates and cryptophytes weredocumented during 5 of the 10 yr (Figs. 8, 9). Dominanttaxa included the dinoflagellates Heterocapsa rotundata,Heterocapsa triquetra, and toxigenic Prorocentrum mini-mum. Lower densities of cryptophytes [Chroomonas marina(Buttner) Butcher and Ochromonas minima Throndsen] wereoften associated with dinoflagellate-dominated blooms. Dur-ing the first winter of the study, a major bloom consistingmostly of P. minimum occurred in the mesohaline estuary,with Chl a concentrations of .100 mg L21 for 2 months.Maximal Chl a levels were sustained from January throughApril (150–180 mg L21), with #300 mg L21 in March. Theyoccurred during high-precipitation winters and have beencorrelated with TN inputs (e.g., Mallin 1994). Similarblooms occurred in the subsequent two winters: winter

474 Burkholder et al.
Fig. 6. Dissolved oxygen concentrations in the Neuse Estuary over the decadal study consid-ering the six mesohaline stations collectively, and plotted separately for depth $ 0.5 m and depth$ 3.0 m. Linear trend lines (dashed) were calculated by least squares means for all sites. Alsoshown are the 95% confidence limits (dotted lines), predicted (model-fitted) values (solid line), pvalue (probability associated with the linear slope), percent change in DO, and corresponding change(in parentheses) in concentration (A–C) over the decadal study (1993–2003) as (A) total watercolumn (n 5 121 months; 13,192 samples), (B) depth $0.5 m (n 5 121 months; 11,171 samples),(C) depth $3.0 m (n 5 121 months; 2,106 samples); (D–F) excluding the period post-1999 withthe sustained drought (1993–1999) as (D) total water column (n 5 79 months; 7,585 samples), (E)depth $0.5 m (n 5 79 months; 6,547 samples), and (F) depth $3.0 m (n 5 79 months; 1,322samples).
1998–1999 (three-species equal mix of P. minimum, H. tri-quetra, and H. rotundata) and winter 2001–2002 (Fig. 8).Beyond the monthly winter sampling regime, additionalsampling documented Chl a concentrations as high as 800mg L21 (28 March 2002) in bloom patches. Blooms of di-noflagellates did not form in winters following the highestintensity hurricane seasons, probably reflecting washout andburial of cysts during these major storms. Summer bloomsof toxigenic dinoflagellates (Pfiesteria spp.; Burkholder etal. 1999, 2005; Brownie et al. 2002) were common in yearswith few or no tropical cyclones (1991–1995); smaller
blooms occurred after the 1996 hurricane season in 1997–1998, and no toxic Pfiesteria activity was documented dur-ing or after hurricane year 1999 (Burkholder et al. 2004).
Nutrient concentrations—TP and TN concentrations(grand mean for the mesohaline estuary sites collectively,120 6 1 mg TP L21, range 10–690 mg TP L21; 890 6 5 mgTN L21, range 70–5,295 mg L21) indicated eutrophic con-ditions, as expected (Figs. 9, 10A). Throughout the study,TNi and TP increased during periods of higher precipitation,as reported in other work on the Neuse (e.g., Christian et al.

475Nutrient trends in a large estuary
Table 3. Depth-dependent trends in dissolved oxygen (DO) con-centrations in the mesohaline Neuse Estuary study area. Data werelog transformed over a period of 121 months. Bold indicates sig-nificance.
Depth (m)Total
samplesTrend
p valueChange over
series (%)
Change overseries
(mg DOL21)
All depths$0.5$1.0$1.5$2.0$2.5$3.0
13,19211,1719,3197,3885,5683,7752,106
0.070*0.047**0.1630.090*0.1440.1840.040**
29211212213213213219
20.7020.8520.9020.9520.8820.8621.17
* p#0.1.** p#0.05.
Fig. 7. Phytoplankton Chl a concentrations in the Neuse estuaryconsidering the six mesohaline stations collectively (A) over thedecadal study (n 5 121 months; 3,993 samples), and (B) excludingthe period post-1999 with the sustained drought (n 5 79 months;2,645 samples). Linear trend lines (dashed) were calculated by leastsquares means for all sites. Also shown are the 95% confidencelimits (dotted lines), predicted (model-fitted) values (solid line), pvalue (probability associated with the linear slope), percent changein Chl a, and corresponding change (in parentheses) in concentra-tion.
1991; Rudek et al. 1991; Mallin et al. 1993). During warmermonths, NH significantly increased in the bottom waters1
4
compared with colder months (Student’s t-test: total watercolumn, p 5 0.0002; lower water column, p , 0.0001; datanot shown), likely associated with decomposition and regen-eration processes (Glibert 1988) and with salt wedge andhypoxic conditions in the enriched reducing environment ofthe lower water column (Boyer et al. 1994).
Trend models indicated that TP concentrations decreasedover the study, with or without inclusion the 1996 and 1999hurricane seasons (1993–2003 1 hurricane data, 23% de-crease, p 5 0.036; Table 4; Fig. 9A), especially in the lowerwater column (229%, p 5 0.001). The trend was also sig-nificant when the two most severe hurricane periods and thepost-1999 years with the sustained drought were excludedfrom analysis (1993–1999; p 5 0.0046; Table 4). However,the trend was not significant when the analysis excluded onlythe post-1999 data (p 5 0.201; Table 4; Fig. 9B). Total Nconcentrations significantly decreased over the decadal pe-riod, considering the mesohaline stations collectively (1993–2003 or 1994–2003; p 5 0.069 and 0.027, respectively), butwhen post-1999 years were excluded, there was no signifi-cant trend (e.g., Tables 4, 5; Fig. 10A,D). With the para-metric approach, there also were no significant trends inTKN concentrations over the 10-yr study, with or withoutconsideration of hurricane periods or the sustained drought.Analyses with and without periods with Hurricanes Fran andFloyd generally yielded similar N trends. Among N species,NO composed 30 6 1% (grand mean 6 1 SE) of the total2
3
Ni concentration available throughout the water column inthe mesohaline estuary, but only ;5% of the TN. In asso-ciation with precipitation events, NO increased by ;120%2
3
(maximum concentrations at ;500 mg L21) throughout thestudy area. However, the NO trends for 1993–2003 and2
3
1993–1999 were not significant (6hurricane periods, 6thesustained drought; p . 0.10; Fig. 10B,E). Although trendanalyses for most parameters were sensitive to the beginningperiod used (Table 6), the majority of the analyses that useddifferent months as Tinitial supported the trends describedabove. The trend analysis for TN was most sensitive to Tinitial
(Table 6). Nevertheless, 50% (67%, if the trend with Tinitial
5 October 1994 is considered significant at p 5 0.059) ofthe analyses with each month from June to November 1994as Tinitial yielded significant negative trends in TN concentra-tions (Table 6).
Ammonium generally was ,40 mg L21 during low-pre-cipitation periods in the first half of the study, increasing to;250 mg L21 in the lower water column during early sum-mer precipitation events, then to 250 mg L21 and .600 mgL21 in the upper and lower water columns, respectively, fol-lowing high-precipitation periods in summer. There was astriking increase in NH concentrations over the decadal1
4
study (1993–2003; Table 4; Fig. 10C). Thus, overall, coin-cident with the decline in TN concentrations over that pe-riod, NH concentrations increased significantly in the me-1
4
sohaline estuary (503% increase from 1993 to 2003, p ,0.0001). The increasing trend was also significant when the

476 Burkholder et al.
Fig. 8. Chl a maxima during winter blooms from the routinemonthly sampling regime, indicating dominant taxa as P (Proro-centrum minimum), Ht (Heterocapsa triquetra), and Hr (Heterocap-sa rotundata). These taxa made up more than 90% of the totalphytoplankton cells. Corresponding cell densities were as follows:1993–1994, 6.10 3 104 P. minimum cells ml21 and 0.9 3 103 H.triquetra cells ml21; 1994–1995, 1.02 3 105 P. minimum cells ml21;1995–1996, 1.90 3 104 P. minimum cells ml21; 1998–1999, 1.153 104 cells ml21 each of P. minimum, H. triquetra, and H. rotun-data; and 2001–2002, 3.15 3 104 P. minimum cells ml21 and 1.903 104 H. triquetra cells ml21. The dashed line represents NorthCarolina’s Chl a standard for acceptable water quality (,40 mg L21;NC DENR 1996a).
post-1999 years with the sustained drought were excludedfrom the analysis (increase of 188% from 1993 to 1999, p5 0.015; Table 4; Fig. 10F).
Molar TN : TP ratios were similar among sites and weregenerally ,30 (grand mean from June 1994 to June 2003,21.3 6 0.2, N 5 108 dates; 3,547 records), indicating atransition between potential N and potential P limitation(Geider and La Roche 2002). TN : TP ratios were lowest inthe summer season (mean 16.6 6 0.2). Higher TN : TP ratioswere observed in spring (March–April; seasons statisticallydetermined as in Glasgow and Burkholder 2000), with max-ima typically at 36 to 48 (mean 25.0 6 0.3). Winter TN : TPratios were also high (mean 31.1 6 0.7). In addition, therewere significant decreasing trends for TN : TP ratios in themesohaline estuary (1994–2003; overall, 22% decrease, p 50.019). The data support an increased potential importanceof phosphorus in controlling phytoplankton production, asreported in other studies (Rudek et al. 1991, down-estuary;Qian et al. 2000). However, there was no significant trendin TN : TP molar ratios when the post-1999 years with thesustained drought were excluded from analysis, with or with-out the hurricane periods (p . 0.3–0.9). Moreover, duringmuch of the year, elevated N and P indicated enriched con-ditions for both nutrients in supporting phytoplanktongrowth (Hecky and Kilham 1988).
Generally, results compared well between the parametricand nonparametric approaches, with the exception of TKN(Table 2). Although the ARIMA detected no significant trendin TKN over the decadal data set, the seasonal Kendall Taudetected a significant decreasing trend (p 5 0.020). Changesin concentration units and p values for the other parameterswere similar, except that the trend for TP had a lower levelof significance, whereas the trend for SS had a higher levelof significance with the seasonal Kendall Tau. The overallconclusions of decreasing or increasing trends were thesame.
Nutrient loadings—Over the decadal study, loadings tothe oligohaline estuary were estimated at 9.7 3 105 kg TP
yr21 and 9.6 3 106 kg TN yr21. There was no significanttrend in TP loading from 1993 to 2003, with or without the1996 and 1999 hurricane seasons or the sustained droughtpost-1999 (Table 4; Fig. 11A,D). There was a decreasingtrend in TN loading (by 28% from 1993 to 2003, p 5 0.017)with or without the 1996 and 1999 hurricane seasons (Table4; Fig. 11B), but TN loading did not change significantlywhen the sustained drought was excluded from the analysis(p 5 0.313; Table 4; Fig. 11E). A comparison of loadingtrends between the ARIMA and seasonal Kendall Tau ap-proaches yielded similar p values and conclusions (Table 2).The TN loading trend was highly sensitive to the beginningperiod used (Tables 4–6; Fig. 11C,F); analysis from June1994 to June 2003 yielded no significant trend (p 5 0.127).
Discussion
Assessment of the effects of cultural eutrophication onaquatic ecosystems fundamentally requires consideration oftemporal scale and sources of variation for reliable evalua-tion of changes in TN and other nutrient inputs over time(Phase I of Cloern’s [2001] evolving conceptual model ofcoastal eutrophication problems). The detailed, decadal dataset from this study contributes new information about cli-matic effects on trends in nutrient concentrations and load-ings to a major eutrophic estuary, with implications aboutshifts in various nutrient sources, progress in managementstrategies to control them, and future efforts needed to re-duce eutrophication. Our statistical approach used a movingaverage and incorporated harmonics and covariance termsdesigned to address seasonal aspects of the data set, as wellas the potential influences of autocorrelation. Nevertheless,interpretations are complicated, as in other studies (e.g., Ga-llegos et al. 1992; Jassby 1998), by the sensitivity of trendanalysis to the disproportionate influence of points at thebeginning and end of the evaluation period and the potentialvariation from one period to the next, which can be large inshallow, wind-driven systems such as the Neuse Estuary.
It has been estimated that pristine temperate zone ecosys-tems in North America and Europe export 75–230 kg Nkm22 yr21 (median 133 kg N km22 yr21; NRC 2000), buthuman activity is estimated to have increased the N flux(e.g., by .4-fold in the Mississippi River, 8-fold in riversof the northeastern United States, and 11-fold in rivers drain-ing to the North Sea; Howarth et al. 2002). Over the pastdecade, the Neuse had moderate nutrient loadings (9.7 3 105
kg TP yr21 and 9.6 3 106 kg TN yr21, or, averaged over thewatershed from the headwaters to New Bern, 86 kg P km22
yr21 and 850 kg N km22 yr21) compared with other systems.As examples, the average N flux per area for waters flowinginto the North Atlantic Ocean (Howarth et al. 1996) wasestimated at 486 kg N km22 yr21, with high fluxes along thecoasts of northwestern Europe (1,300–1,450 kg N km22
yr21), the northeastern United States (1,070 kg N km22 yr21),and the Chesapeake Bay (840–1,022 kg N km22 yr21). Aflux of ;42 kg P km22 yr21 was estimated for the main stemupper Chesapeake Bay (Magnien et al. 1992), and 4.5 kg Pkm22 yr21 for relatively pristine rivers in northern Canada(Howarth et al. 1996). The sensitivity of the poorly flushed

477Nutrient trends in a large estuary
Fig. 9. Total phosphorus concentrations in the Neuse Estuaryconsidering the six mesohaline stations collectively (A) over thedecadal study (n 5 121 months; 4,006 samples) and (B) excludingthe period post-1999 with the sustained drought. Linear trend lines(dashed) were calculated by least squares means for all sites. Alsoshown are the 95% confidence limits (dotted lines), predicted (mod-el-fitted) values (solid line), p value (probability associated with thelinear slope), percent change in TP, and corresponding change inconcentration (in parentheses).
Neuse to only moderate nutrient loading is manifested bythe high phytoplankton biomass, extensive bottom-waterhypoxia, and massive fish kills that continue to characterizethis system, as is true of many other estuaries despite on-going efforts to reduce nutrient concentrations and loads(NRC 2000).
Climatic changes (droughts, El Ninos, hurricanes, wet sea-sons) have been shown to strongly influence estuarine eco-systems, alone or with interacting anthropogenic effects(e.g., Valiela et al. 1996; Verity 2002). In this study, hurri-cane-level storms, represented by the two most severe eventsduring the decadal period, had little effect on the outcomeof trend analyses for the parameters examined. Others havealso reported that, in shallow estuaries frequently disturbedby hurricanes, there can be relatively rapid recovery in waterquality and have suggested that estuaries, like stream eco-
systems (Yount and Niemi 1990), can be resilient to suchstorms (Constanza et al. 1993; Burkholder et al. 2004). Incontrast, the sustained 3-yr drought near the end of the studysignificantly affected the trend analyses.
Nutrient concentrations—Although nutrient loading esti-mates are important for management considerations (e.g.,TMDLs imposed by the federal Clean Water Act; NRC2001), ambient nutrient concentrations are a key variablesupporting algal assemblage shifts, excessive algal produc-tion, and associated adverse effects of eutrophication (Heckyand Kilham 1988). The strength of the data set contributedby this decadal study lies especially in its extensive nutrientconcentration measurements.
Concentrations of TN and TP significantly decreased inthe Neuse Estuary, but the decreases were drought related.These findings extend temporally beyond Glasgow andBurkholder (2000) and Qian et al. (2000), who had earlierfound that pronounced decreases in P concentrations detect-ed in the upper Neuse River because of the P detergent ban(1988; NC DEHNR 1991) persisted downstream in the es-tuary. In contrast, nitrate concentrations did not significantlychange overall (1993–2003), with or without inclusion of thesustained drought in the analysis, although nitrate had sig-nificantly increased over the first half of the study (Glasgowand Burkholder 2000). As a major new finding, NH con-1
4
centrations dramatically increased in the mesohaline estuaryover the 10-yr period, whether the data were analyzed withor without inclusion of major hurricane seasons or the sus-tained 3-yr drought that occurred near the end of the study.Analysis of other experimental data has suggested thatNH is the major nutrient that supports the winter phyto-1
4
plankton blooms, which contribute the highest algal produc-tion in this system (e.g., Fan et al. 2003). Two questions aremerited: Is the Neuse unique in this striking ammonium in-crease? What major sources might be involved?
On the basis of the source data and proximity, we sus-pected inputs from swine CAFOs as a major NH source.1
4
North Carolina’s Coastal Plain contains the highest densityof swine CAFOs in the United States, known to contributehigh ammonia in both leachate and aerosols from effluentspraying and land application waste management practices(Walker et al. 2000). In the North Carolina Coastal Plain,NH is a major component of wet N atmospheric flux and1
4
has been increasing over the past two decades (see NationalAtmospheric Deposition Program data in NC DENR 2001).Walker et al. (2000) estimated that ammonia accounts for;42% of the N emissions in North Carolina, and suggestedthat a significant fraction of the N deposited to North Car-olina coastal and estuarine waters could be in the form ofNHx. They reported that atmospheric emissions in easternNorth Carolina from swine CAFOs (p , 0.01), fertilizers (p, 0.10), and turkey/broiler operations (p , 0.05) were sig-nificantly higher in 1990–1997 than in 1982–1989; onlyemissions from non–broiler chickens decreased during1990–1997 (p , 0.01). Furthermore, the increase in averageswine emissions accounted for ;84% of the increase in av-erage annual emissions from all sources between the twoperiods analyzed by Walker et al. (2000). Atmospheric NH3
is deposited in surface waters within a ;100-km radius from

478 Burkholder et al.
Fig. 10. Nitrogen concentrations in the Neuse Estuary considering the six mesohaline stationscollectively (A–C) over the decadal study as (A) TN (n 5 108 months; 3,567 samples), (B) NO2
3
(n 5 121 months; 3,982 samples), and (C) NH (n 5 121 months; 3,987 samples) and (D–F)14
excluding the period post-1999 with the sustained drought as (D) TN (n 5 66 months; 2,220samples), (E) NO (n 5 79 months; 2,629 samples), and (F) NH (n 5 79 months; 2,650 samples).2 1
3 4
Note that trends for NO and NH concentrations were based on data from 1993 on, whereas the2 13 4
trend for TN concentrations was based on data from June 1994 on because of methodologicaldifferences in data collection prior to June 1994. Linear trend lines (dashed) were calculated byleast squares means for all sites. Also shown are the 95% confidence limits (dotted lines), predicted(model-fitted) values (solid line), p value (probability associated with the linear slope), percentchange in the N species, and corresponding change in concentration (in parentheses).
the emission source, and both wet and dry deposition likelyare important (Asman and Van Jaarsveld 1992; Aneja et al.2003). Data from two National Atmospheric Deposition Pro-gram stations in eastern North Carolina estimate wet depo-sition of NO and NH at 8.8–13.7 3 1022 kg N km22 yr21,2 1
3 4
although ;80% of the N was in the oxidized form (EPA2000b). Dry deposition of particulate NO and NH and2 1
3 4
gaseous HNO3 has been estimated at 1.5–3.2 3 1022 kg Nkm22 yr21 (EPA 2000a).
We compared our results with data collected for an adja-cent river, the Cape Fear, with the use of comparable meth-
ods over a similar period (Fig. 12). This system drains thelargest watershed in North Carolina, with 27% of the State’shuman population and 50% of the swine population (;5 3106 swine), the latter mostly in the Northeast Cape Fear andBlack River tributaries, which lie within the Coastal Plain(Mallin 2000). Ammonium data were examined from fourrepresentative Cape Fear stations (Fig. 12). Station Navassa(NAV; GPS coordinates 34.2594N, 77.9877W) is in the mainstem Cape Fear River ;7 km upstream from its confluencewith the Northeast Cape Fear River. This station is oligo-haline and mostly influenced by freshwater discharge from

479Nutrient trends in a large estuary
Table 4. Trend analyses in nutrient concentrations and loadings and Chl a concentrations, depending on the data source and initial periodused, from PROC ARIMA analysis (1993–2003 or 1993–1999, excluding the sustained 3-yr drought). Bold indicates significance.
Period [TP] TP load [TN] TN load [ ]1NH4 [Chl a]
993–2003 (all; 1hurricanes, sustained drought)
p value% changen (months)No. of samples95% CI
0.036**223%
1214,006
223.5% to 223.2%
0.220218%
1243,803
218.0% to 217.6%
0.069*221%
1203,948
222.1% to 220.7%
0.017**228%
1243,818
227.9% to 227.6%
,0.0001***1503%
1213,987
1501% to 1506%
0.533118%
1213,993
117.3% to 118.2%
1993–2003, excluding 1996, 1999 hurricane periods
p value% changen (months)No. of samples95% CI
0.005***226%
1213,901
225.7% to 225.4%
0.197217%
1243,621
217.7% to 217.1%
0.280216%
1203,842
218.2% to 214.3%
0.028**228%
1243,621
228.7% to 227.3%
,0.0001***1509%
1213,879
1498% to 1520%
0.437121%
1213,886
20.6% to 22.0%
1993–1999 (1hurricanes, 2sustained drought)
p value% changen (months)No. of samples95% CI
0.201219%
792,657
219.4% to 219.4%
0.96311%
832,556
10.58% to 11.17%
0.92221%
782,601
21.2% to 21.0%
0.313215%
832,556
214.9% to 214.6%
0.015**1188%
792,650
1188% to 1188%
0.91224.1%
792,645
24.3% to 23.9%
1993–1999 (2hurricanes, 2sustained drought)
p value% changen (months)No. of samples95% CI
0.0046***232%
792,552
231.2% to 231.9%
0.471212%
832,374
213.2% to 210.7%
0.83822%
782,495
22.7% to 21.8%
0.134223%
832,374
225.2% to 221.5%
0.061*1171%
792,542
1154% to 1188%
0.704115%
792,538
113.0% to 116.5%
* p#0.10.** p#0.05.*** p#0.005.
Table 5. Trend analyses in TN concentrations and loadings from June 1994 to 2003 or June 1994 to 1999 data, excluding the sustained3-yr drought. The data from 1993 were excluded here for comparison to Table 4. Bold indicates significance.
Parameter1994–2003(all data)
1994–2003(21996, 1999
hurricane periods)
1994–1999(1hurricanes,
23-yr drought)
1994–1999(21996, 199hurricanes,
23-yr drought)
TN concentrationp value% changen (months)No. of samples95% CI
0.027*226%
1083,567
227.6% to 225.2%
0.013*227%
1083,461
228.2% to 226.6%
0.239213%
662,220
213.5% to 212.4%
0.213214%
662,114
214.3% to 212.6%
TN loadingp value% changen (months)No. of samples95% CI
0.127220%
1073,287
220.5% to 220.0%
0.311214%
1073,105
214.2% to 213.4%
0.73825%
662,040
25.0% to 24.7%
0.82624%
661,858
26.0% to 21.8%
* p#0.05.
the Piedmont, as well as the Coastal Plain-derived BlackRiver about 23 km upstream. Station Sarecta (SAR; GPScoordinates 34.9797N, 77.8625W) is located in the North-east Cape Fear River. There are ;340 swine CAFOs withina 20-km radius of this station (Mallin and Cahoon 2003).The third station, Sta. NCF117 (GPS coordinates 34.3634N,
77.8968W) is 110 km downstream from Sarecta and ;40km upstream from the city of Wilmington in a tidally influ-enced, freshwater segment of the Northeast Cape Fear Riverat its confluence with the main-stem Cape Fear. The fourthstation, Channel Marker 61 (M61; GPS coordinates34.1938N, 77.9573W), is in the upper Cape Fear Estuary

480 Burkholder et al.
Table 6. Sensitivity of trend analysis to the beginning conditions, showing variability from consideration of each of the first six monthsas Tinitial [TP concentration, DO, and Chl a, 116–121 months (May–Oct 93–03); TN concentration, 119–124 months (Jun–Nov 94–03); TNand TP loads, 103–108 months (Jan–May 93–03). Bold indicates significance.
Trend statistics [TP] TP load [TN] TN load [DO] [Chl a]
Avg. p valueAvg. SDAvg. changeAvg. SD
0.035**0.013224%1.56
0.4390.204212%4.84
0.076*0.065224%4.02
0.049**0.028225%2.78
0.059*0.020219%1.61
0.6410.07313%2.96
p value (range)Trend (range)
0.018 to 0.056226.4% to 221.9%
0.220 to 0.771217.8% to 24.5%
0.008 to 0.164230.6% to 219.7%
0.017 to 0.083228.1% to 221.7%
0.031 to 0.085221.1% to 216.1%
0.533 to 0.72819.8% to 117.8%
* p#0.10.** p#0.05.
(mean salinity of 6 for 2002–2003) near the Port of Wil-mington, ;8 km downstream from Sta. NCF117. Samplesat these stations were collected monthly on the outgoing tidefor ;8 yr, from June 1995 (NAV, NCF116, M61) or Feb-ruary 1996 (SAR) through June 2003.
In the lower Cape Fear during 1996–2003, significant in-creasing trends in NH concentrations were documented at1
4
all four stations (Fig. 12), whereas significant changes in TNand nitrate concentrations were not discerned. The largestincreases in NH occurred at Stas. NCF117 (315% increase,1
4
p , 0.0001, n 5 96) and SAR (148% increase, p 5 0.028)on the Northeast Cape Fear with a high density of CAFOsin its watershed; the lowest increase occurred at Sta. NAV(64% increase, p 5 0.025), on the main-stem Cape Fearbelow the Black River and above the Northeast Cape Feartributary. The increases, although substantial, have beenlower than in the Neuse, likely because the Cape Fear istidal with high flushing (Mallin et al. 2000), whereas theNeuse waters have a longer residence time and are windmixed with little tidal influence (Reed et al. 2004).
Analysis of these data, considered together with our datafor the Neuse, indicates that significant increases in NH1
4
concentrations over the past decade may characterize estu-aries draining watersheds and airsheds with high densities ofswine and poultry CAFOs, via runoff and leachate into sub-surface flow (see review in Burkholder et al. 1997) and at-mospheric wet and dry deposition (Walker et al. 2000; Whi-tall et al. 2002). The TN load to the Albemarle–Pamlicowatershed from atmospheric deposition and subsequent dryor wet fallout has been estimated at ;38%, among the high-est known for U.S. watersheds (EPA 2000a). The contribu-tion of atmospheric NH3 and P deposition by CAFO animalconfinement buildings, lagoons, and sprayfields to nutrientbudgets in natural systems has not been fully characterized,but .80% of total swine NH3 emissions in the southeasternUnited States originate in North Carolina (EPA 1998; Anejaet al. 2003), and there was a 30% increase in airborne NH3
during the 1990s, 47% and 25% of which was contributedby swine and poultry industrialized animal operations, re-spectively (NC DENR 1997b, 2002). N and P loading fromdirect runoff would be more substantial when CAFOs wereflooded and in direct contact with surface waters (Mallin2000; Mallin et al. 2000) or following major effluent spillsfrom ruptured CAFO lagoons (nutrients as well as rich or-ganics, fecal coliforms, and microbial pathogens; Burkholderet al. 1997). CAFOs would be expected to contribute sig-
nificant loadings of NH , as well, to other waterways in the14
Americas and Europe, where this industry has expanded(Webb and Archer 1994; USDA 2001). The NH in the1
4
North Carolina estuaries would also have been contributedfrom other external sources, such as WWTPs and land-ap-plied sludge, stack emissions, and septic systems with in-adequate nitrification. Internal NH loading from regenera-1
4
tion, partial denitrification, and resuspension (Glibert 1988;Koike and Sørensen 1988), and increased rates of bacterialdecomposition of No from wetland waters could be importantas well.
Partitioning the relative contribution of the different com-ponents that compose NH loading is a challenge because1
4
of the many potential input sources. Atmospheric wet anddry deposition (Walker et al. 2000; Whitall et al. 2002),groundwater (Harned et al. 1995), estuarine sediments (Gif-fin and Corbett 2003), and partial denitrification (Glibert1988) are all potential sources that must be addressed infuture research to determine the source contributions of thestriking increases in NH concentration that were docu-1
4
mented in both the Neuse and Cape Fear systems, and tofurther evaluate the overall importance of NH in driving1
4
phytoplankton production and bloom formation (Fan et al.2003).
Nutrient loadings—Trend analysis of TP loading was rel-atively insensitive to Tinitial in this study, and no significantchange was detected with or without consideration of thesustained 3-yr drought. Thus, although potential P sourceshave continued to increase in the watershed, there is as yetno apparent signal for increased P loading to the estuary.These findings differ from earlier trend analyses, which hadsuggested a significant decreasing trend in TP loading (Glas-gow and Burkholder 2000; Qian et al. 2000). Although P isrelatively insoluble, it can be moved by precipitation intoadjacent waters from P-saturated soils or from manures ap-plied to soils (NRC 2000). Phosphorus accumulation in soilsused for disposal of swine CAFO wastes in the Neuse wa-tershed was already appreciable in 1993, when three counties(;20% of the land) within the watershed had sufficient Pfrom CAFO wastes to exceed the P requirements of all non-legume crops and forages (Barker and Zublena 1995). Thelack of a significant decreasing trend in TP loading over thepast decade suggests that benefits earlier derived from the Pdetergent ban in the late 1980s (NC DEHNR 1991) and otherimprovements (e.g. biological nutrient removal in major

481Nutrient trends in a large estuary
Fig. 11. Total phosphorus and total nitrogen loadings considering the six mesohaline stationscollectively (A–C) including the sustained 3-yr drought as (A) TP loading (1993–2003; n 5 124months; 3,803 samples), (B) TN loading (1993–2003; n 5 124 months; 3,818 samples), (C) TNloading from 1994 to 2003 (n 5 107 months; 3,287 samples), and (D–F) excluding the period post-1999 with the sustained drought as (D) TP loading (1993–1999; n 5 83 months; 2,556 samples),(E) TN loading (1993–1999; n 5 83 months; 2,556 samples), and (F) TN loading (1994–2003; n5 66 months; 2,040 samples). Linear trend lines (dashed) were calculated by least squares meansfor all sites. Also shown are the 95% confidence limits (dotted lines), predicted (model-fitted) values(solid line), p value (probability associated with the linear slope), percent change in TP or TNloading, and corresponding change in concentration (in parentheses).
WWTPs) have gradually been offset by increasing P inputs.Thus, P could become increasingly important in eutrophi-cation of the Neuse, as has been hypothesized for other es-tuaries (e.g., Fisher et al. 1992; Hagy et al. 2004) underincreasing watershed development. The overall decrease(22%, p 5 0.019) in TN : TP concentration ratios in theNeuse Estuary (also reported by Qian et al. 2000) lend ad-ditional support for increased importance of P.
As mentioned, TN trend analyses can be especially sen-sitive to Tinitial, given the broad range and variability in con-centrations measured from one date to the next. We found asignificant decreasing trend (28%) in TN loading to the
Neuse Estuary only when 1993 and the sustained 3-yrdrought near the end of the study were included in the anal-ysis. Our findings for the Neuse Estuary differ from thoseof several other studies (e.g., Stow et al. 2001; Stow andBorsuk 2003). Some long-term analyses have indicated thatTN loads to the Neuse Estuary have increased by at least30% over recent decades (Stanley 1988; Dodd et al. 1993).In contrast, other analyses through 1998–2000 for the upperwatershed indicate that TN levels have been decreasing orstationary since 1995 (Qian et al. 2000; NC DENR 2001).However, the lower river and estuary historically have sus-tained high nutrient loading (Steel 1991), and in the lower

482 Burkholder et al.
Fig. 12. Ammonium concentrations at four stations in the Cape Fear Estuary from monthly dataas (A) Sta. NCF 117 (June 1995–June 2003; n 5 96 months; 97 samples), an oligohaline segmentof the Northeast Cape Fear River at its confluence with the main stem Cape Fear; (B) Sta. Sarecta(SAR, February 1996–June 2003; n 5 88 months; 89 samples), an oligohaline segment in theNortheast Cape Fear; (C) Sta. Navassa (NAV, June 1995–June 2003; n 5 96 months; 97 samples),in the mainstem Cape Fear River ;7 km upstream from its confluence with the Northeast CapeFear River; and (D) Channel Marker 61 (M61, June 1995–June 2003; n 5 96 months; 97 samples),in the upper Cape Fear Estuary ;8 km downstream from NCF 117. Linear trend lines (dashed)were calculated by least squares means for all sites. Also shown are the 95% confidence limits(dotted lines), predicted (model-fitted) values (solid line), p value (probability associated with thelinear slope), percent change in DO, and corresponding change in concentration (in parentheses).
Neuse watershed, a major nonpoint nutrient source, swineCAFOs, sustained exponential growth from the late 1980sthrough the mid-1990s.
The differences between our estimates and others’ partlyreflect reliance among those studies on concentration datacollected with diverse methods and different sampling lo-cations and frequencies over different periods. Differentmodeling approaches have also been used (e.g., Stow et al.2003; Wool et al. 2003). Some researchers, as mentioned,have attempted to control for climatic events through the useof flow-adjusted concentrations (e.g., Stow et al. 2001; Stowand Borsuk 2003). This approach showed a decline in flow-adjusted TN concentrations at Kinston and Fort Barnwellfrom 1995 to 2000, after ;15 yr of relative stability (1979–1995; Stow and Borsuk 2003), but as mentioned, the modelcould explain only ;35–40% of the variability in TN con-centrations at the station nearest the estuary and closest toour study area (Fort Barnwell; Stow and Borsuk 2003). Re-searchers have applied different methods, as well, for esti-mating volume of flow to the estuary. Ours is the first studybased on flow data obtained in close proximity to the NeuseEstuary, collected by ADCP to directly measure inflow andoutflow across the estuary. In related research, ADCP was
used to demonstrate a varied flow field in both the horizontaland vertical extent of the estuary, with meteorological-de-pendent bidirectional discharges and resulting shear layers(Reed et al. 2004). Although valuable information wasgained with single transect data, long-term flow patternscould not be discerned, but long-term flow patterns weredistinguishable from composite ADCP visualizations. Thepersistent circulation patterns over time are important in ex-plaining variations in observed lateral differences in flow orsite-specific differences in biological phenomena. Areas ofincreased or decreased water mass retention (eddies, nullzones, areas of low or high flow) were identified with acomposite method of processing multiple ADCP transectdata sets, which can be used to plan an improved monitoringscheme for ongoing efforts. The improved accuracy in es-timating these bidirectional flows will also be an importantconsideration in refining nutrient loadings and residencetimes.
Eutrophication of the Neuse: The science–policy inter-face—Cloern (2001) suggested that scientists’ evolving con-ceptual model of eutrophication needs to consider how im-proved understanding of trends in nutrient concentrations

483Nutrient trends in a large estuary
and loadings in estuaries can be used to improve efforts torestore aquatic ecosystems. The following points are includ-ed toward addressing that goal.
Management strategies for water quality protection inmany U.S. estuaries during the 1970s to mid-1990s focusedmostly on P control of point source discharges (e.g., NCDEHNR 1991; NRC 2000). Because these efforts previouslytargeted P reductions without concomitant N reductions, themagnitude of algal blooms in the Neuse, as well as otherlower rivers and estuaries, has probably increased. In theChesapeake Bay, experiments by Fisher et al. (1992) showedthat P reductions caused decreased growth of freshwater al-gae so that Ni uptake was reduced during downstream trans-port (e.g., of highly mobile nitrate), and more Ni thus wasavailable to support estuarine blooms. The premise that in-creased P limitation in upstream freshwater segments pro-motes increased N concentrations and phytoplankton pro-duction downstream in estuaries was supported by analysisof a long-term data set in the Chesapeake Bay (Harding andPerry 1997). In the Neuse, Mallin et al. (1993) found a sig-nificant correlation between upper watershed river flow andestuarine nitrate loading and phytoplankton productivity fol-lowing a 2-week lag period, indicating that nitrate fromfreshwater segments can travel long distances and stimulateestuarine phytoplankton. Comanagement of N and P is ex-pensive and sometimes uses conflicting best-managementpractices (BMPs; Clausen et al. 1989; NRC 2000); therefore,in many locations, N controls are only beginning to be im-posed (NRC 2000). As for the Neuse, data available formany estuaries under increasing cultural eutrophication pointto the need for N and P comanagement to reduce the adverseeffects of eutrophication and help restore water quality. It isalso important to note that attempts to quantitatively updatenutrient inventories for U.S. watersheds will be hampered,as in this study, because of changes in required agriculturalreporting in 2001 and thereafter. Adequate monitoring andreporting of anthropogenic point and nonpoint sources con-tinues to be a critical need for resource managers and sci-entists in assessing eutrophication effects and the success ofrestoration efforts (NRC 2000).
As exemplified by the Neuse Estuary, the importance ofcontrolling agricultural, urban, and other nonpoint nutrientsources to reduce eutrophication to aquatic ecosystems, al-though scientifically established, continues to be overlookedor underemphasized because of economic and political con-straints (e.g., Chesapeake Bay Program 1997; NRC 2000).Even in well-funded efforts to reduce nutrient loading andhypoxia, targeted goals generally have not been realized be-cause of increased nonpoint loading. In the late 1980s, forexample, resource managers targeted a 40% reduction incontrollable nitrogen sources to the Chesapeake Bay (Ches-apeake Bay Program 1997), but ,20% reduction in TN load-ing was achieved over an ;15-yr period despite major de-creases in point source loadings, increased buffer areas, andother imposed management strategies (Chesapeake Bay Pro-gram 2005). Thus, Hagy et al. (2004) recommended that asignificant decrease in the area affected by anoxia in theChesapeake Bay would (still) require 40% reduction in TNloading.
The TMDL developed for the Neuse targeted a 30% re-
duction in TN loading by all sources to the estuary, to beaccomplished during the 5-yr period from 1998 to 2002 (NCDENR 1997a). The fragility of TN loading trends, as shownin this study; the striking increase in NH concentrations;1
4
and the lack of management emphasis on achieving majorreductions in most nonpoint sources collectively do not sup-port reports to the general citizenry of achievement of a 30%reduction in TN loading to the Neuse by anthropogenicsources over the past 5 yr. Aside from improved treatmentof municipal sewage point sources, cropland farmers locatedmostly in the upper and mid watershed initiated a programin 1998 to decrease their N fertilizer application by 30%,and additional BMPs for cropland agriculture were installedfrom 1996 to 2003 as well (Neuse Basin Oversight Com-mittee 2004). A noticeable decrease in TN concentrationswithin the estuary from this program might not be detected,however, until a lag period of a decade or more. Althoughthe Neuse Basin Oversight Committee (2004, p. 10) reportedthat ‘‘for the basin as a whole, the Neuse agricultural com-munity in 2003 has achieved a 42% nitrogen reduction,’’ thestatement pertains to cropland farmers and refers to N fer-tilizer use, rather than in-stream N levels. Efforts to reduceN loading actually have not been widely adopted by othermajor sources of agricultural loading, such as industrializedanimal agriculture. Moreover, contributions of certain non-point sources, such as leachate from septic tanks (Simpson2004) and land application of sludge from human wastes(Rockefeller 2002), are poorly known but could also be sub-stantial with increased pressures from coastal development.
Stationary or increasing trends in nutrients, as in theNeuse, despite concerted efforts by resource managers toreduce nutrient inputs, likely reflect expanding nonpointsources that continue to be inadequately addressed, mainlythrough voluntary BMPs (Steel 1991; Burkholder et al.1997). Thus, it is not surprising that declining TN and TPtrends in the Neuse Estuary can be explained primarily byclimatic events, as nutrient reductions from improved man-agement practices in the Neuse watershed over the past de-cade have been offset by increases in human and animalpopulations (especially swine) and related factors. Given on-going, increased development of watersheds drained by es-tuaries in many regions of the world (Vitousek et al. 1997),goals for nutrient reduction that do not account for increasedcoastal and basin development should be adjusted upward at5–10-yr intervals, and interpretations from long-term ($10yr) data sets, on the basis of consistent methodologies withadequate detection limits, must recognize the importance ofclimatic events that can drive trend analyses. Indirect meth-ods (e.g., transfer function and ARIMA procedures) willcontinue to be necessary to estimate anthropogenic- andevent-driven climatic changes in estuaries increasingly af-fected by watershed development and cultural eutrophica-tion. With further long-term observations, greater confidencein loading estimates will be realized, which in turn willstrengthen the reliability of predictive models for eutrophi-cation effects and system recovery.
References
AMERICAN SOCIETY OF AGRICULTURAL ENGINEERS. 1998.Manure production and characteristics. Data sheet ASAED384.1.DEC98. ASAE.

484 Burkholder et al.
ANEJA, V. P., D. R. NELSON, P. A. ROELLE, AND J. T. WALKER. 2003.Agricultural ammonia emissions and ammonium concentra-tions associated with aerosols and precipitation in the southeastUnited States. J. Geophys. Res. 108: ACH12-1–12-11.
[APHA] AMERICAN PUBLIC HEALTH ASSOCIATION, AMERICAN WA-TER WORKS ASSOCIATION, AND WATER ENVIRONMENT FED-ERATION. 1992. Standard methods for the examination of waterand wastewater, 18th ed. APHA.
ASMAN, W. A. H., AND J. A. VAN JAARSVELD. 1992. A variableresolution transport model applied for NHx in Europe. Atmos.Environ. 26A: 445–464.
BALES, J. D. 2003. Effects of Hurricane Floyd inland flooding, Sep-tember–October 1999, on tributaries to Pamlico Sound, NorthCarolina. Estuaries 26: 1319–1328.
, AND C. J. O. CHILDRESS. 1996. Aftermath of HurricaneFran in North Carolina: Preliminary data on flooding and waterquality. U.S. Geological Survey Open File Report 96-499.
, AND J. C. ROBBINS. 1999. A dynamic Water-quality mod-eling framework for the Neuse River estuary, North Carolina.Prepared in cooperation with the NCDENR Division of WaterQuality. USGS in cooperation with Water Resources Investi-gations Report 99-4017.
BARKER, J. C., AND J. ZUBLENA. 1995. Livestock manure assess-ment in North Carolina, p. 98–106. In C. C. Ross [ed.], Pro-ceedings of the 7th International Symposium on Agricultureand Food Processing Wastes. American Society of AgriculturalEngineers.
BERRYMAN, D., B. BOBEE, D. CLUIS, AND J. HAEMMERLI. 1988.Nonparametric tests for trend detection in water quality timeseries. Water Res. Bull. 24: 545–556.
BORSUK, M. E., C. A. STOW, AND K. H. RECKHOW. 2003. Integratedapproach to total maximum daily load development for NeuseRiver estuary using Bayesian probability network model (Neu-BERN). J. Water Resour. Plann. Manage. 129: 271–282.
, , AND . 2004. Confounding effect of flow onestuarine response to nitrogen loading. J. Environ. Eng. 130:605–614.
BOWEN, J. D., AND J. W. HIERONYMUS. 2003. A CE-QUAL-W2model of Neuse estuary for total maximum daily load devel-opment. J. Water Resour. Plan. Manag. 129: 283–294.
BOYER, J. N., D. W. STANLEY, AND R. R. CHRISTIAN. 1994. Dy-namics of NH and NO uptake in the water column of the1 2
4 3
Neuse River estuary, North Carolina. Estuaries 17: 361–371.BOYNTON, W. R., J. H. GARBER, R. SUMMERS, AND W. M. KEMP.
1995. Inputs, transformations, and transport of nitrogen andphosphorus in Chesapeake Bay and selected tributaries. Estu-aries 18: 285–314.
BRICKER, S. B., C. G. CLEMENT, D. E. PIRHALLA, S. P. ORLAND,AND D. G. G. FARROW. 1999. National estuarine eutrophicationassessment: A summary of conditions. National Oceanic andAtmospheric Administration.
BROCKLEBANK, J. C., AND D. A. DICKEY. 2003. SAS system forforecasting time series. SAS Series in Statistical Applications,SAS Institute, Inc.
BROWNIE, C., H. B. GLASGOW, J. M. BURKHOLDER, R. E. REED,AND Y. TANG. 2002. Re-evaluation of the relationship betweenPfiesteria and estuarine fish kills. Ecosystems 6: 1–10.
BURKHOLDER, J., AND OTHERS. 2004. Comparative impacts of twomajor hurricane seasons on the Neuse River and western Pam-lico Sound. Proc. Natl. Acad. Sci. USA 101: 9291–9296.
BURKHOLDER, J. M., AND OTHERS. 2005. Demonstration of toxicityto fish and to mammalian cells by Pfiesteria species: Compar-ison of assay methods and multiple strains. Proc. Natl. Acad.Sci. USA 102: 3471–3476.
, M. A. MALLIN, AND H. B. GLASGOW. 1999. Fish kills,
bottom-water hypoxia, and the toxic Pfiesteria complex in theNeuse River and estuary. Mar. Ecol. Prog. Ser. 179: 301–310.
, , , AND OTHERS. 1997. Impacts to a coastalriver and estuary from rupture of a large swine waste holdinglagoon. J. Environ. Qual. 26: 1451–1466.
CENTER FOR AGRICULTURAL PARTNERSHIPS. 2002. Working fromthe ground up [Internet]. [Accessed 2005 May]. Available fromhttp://www.agcenter.org/proggroundup.html
CHESAPEAKE BAY PROGRAM. 1997. Chesapeake Bay nutrient re-duction progress and future directions. Nutrient reduction re-evaluation summary report CBP/TRS 189/97. Chesapeake BayProgram.
. 2005. Bay trends & indicators [Internet]. [Accessed 2005May]. Available from http://www.chesapeakebay.net/indicators.htm
CHRISTIAN, R. R., J. N. BOYER, AND D. W. STANLEY. 1991. Multi-year distribution patterns of nutrients within the Neuse Riverestuary, North Carolina. Mar. Ecol. Prog. Ser. 71: 259–274.
, W. L. BRYANT, AND D. W. STANLEY. 1986. The relationshipbetween river flow and Microcystis aeruginosa blooms in theNeuse River, North Carolina. Water Resources Research Insti-tute of the Univ. of North Carolina Report 223.
CLAUSEN, D., J. CERASO, AND D. W. MEALS, JR. 1989. Water qualityachievable with agricultural best management practices. J. SoilWater Conserv. 44: 593–596.
CLEVELAND, R. B., W. S. CLEVELAND, J. E. MCRAE, AND I. TER-PENNING. 1990. A seasonal-trend decomposition procedure onloess. J. Off. Stat. 6: 3–73.
CLOERN, J. E. 2001. Our evolving conceptual model of the coastaleutrophication problem. Mar. Ecol. Prog. Ser. 210: 223–253.
COSTANZA, R., W. M. KEMP, AND W. R. BOYNTON. 1993. Predict-ability, scale and biodiversity in coastal and estuarine ecosys-tems: Implication for management. Ambio 22: 88–96.
CUKER, B. E., P. GAMA, AND J. M. BURKHOLDER. 1990. Type ofsuspended clay influences lake productivity and phytoplanktoncommunity response to phosphorus loading. Limnol. Oceanogr.35: 830–839.
DIPIERO, S. J., B. ROGERS, AND R. B. HERMANN. 1994. Weyer-haeuser studies on the Neuse River assimilative capacity. Wey-erhaeuser.
DODD, R. C., P. A. CUNNINGHAM, R. J. CURRY, AND S. J. STICHTER.1993. Watershed planning in the Albemarle–Pamlico estuarinesystem. Research Triangle Institute Report 93-01.
[EPA] U.S. ENVIRONMENTAL PROTECTION AGENCY. 1992. Methodsfor the determination of chemical substances in marine andestuarine samples. EPA Office of Research and DevelopmentDocument EPA/600/R-92/121.
. 1993. Methods for determination of inorganic substancesin environmental samples. EPA Office of Research and De-velopment Document EPA/600/R-93/100.
. 1997a. Method 445.0: In vitro determination of chlorophylla and pheophytin a in marine and freshwater algae by fluores-cence. EPA Office of Research and Development.
. 1997b. Methods for the determination of chemical sub-stances in marine and estuarine environmental matrices, 2nded. EPA Office of Research and Development Document EPA/600/R-97-072.
. 1998. Environmental impacts of animal feeding operations.EPA Office of Water, Standards, and Applied Sciences Divi-sion.
. 1999. Landscape characterization: Virtual field referencedata base [Internet]. [Accessed 2005 May]. Available fromhttp://www.epa.gov/nerlesd1/land-sci/lcb/nrb/VFRDB/
. 2000a. Deposition of air pollutants to the Great Waters.3rd report to the U.S. Congress, (1) Section A, Chapter 4—

485Nutrient trends in a large estuary
water quality issues related to multiple watersheds in the NeuseRiver Basin. EPA.
. 2000b. National Atmospheric Deposition Program [Inter-net]. [Accessed 2005 May]. Available from http://nadp.sws.uiuc.edu/
EPPERLEY, S. P., AND S. W. ROSS. 1986. Characterization of theNorth Carolina Pamlico–Albemarle estuarine complex. Nation-al Oceanic and Atmospheric Administration Technical Mem-orandum NMFS-SEFC-175.
FAN, C., P. M. GLIBERT, AND J. M. BURKHOLDER. 2003. Character-ization of the affinity for nitrogen, uptake kinetics, and envi-ronmental relationships for Prorocentrum minimum in naturalblooms and laboratory cultures. Harmful Algae 2: 283–299.
FENSIN, E. E. 1997. Population dynamics of Pfiesteria-like dinofla-gellates, and environmental controls in the mesohaline Neuseestuary, North Carolina, U.S.A. M.S. thesis, Department ofBotany, North Carolina State Univ.
FISHER, T. R., E. R. PEELE, J. W. AMMERMAN, AND L. W. HARDING,JR. 1992. Nutrient limitation of phytoplankton in ChesapeakeBay. Mar. Ecol. Prog. Ser. 82: 51–63.
GALLEGOS, C. L., T. E. JORDAN, AND D. L. CORRELL. 1992. Event-scale response of phytoplankton to watershed inputs in a sub-estuary: Timing, location, and magnitude of blooms. Limnol.Oceanogr. 37: 813–828.
GEIDER, R. J., AND J. LA ROCHE. 2002. Redfield revisited: Vari-ability of C : N : P in marine microalgae and its biochemicalbasis. Eur. J. Phycol. 37: 1–17.
GIFFIN, D., AND D. R. CORBETT. 2003. Evaluation of sediment dy-namics in coastal systems via short-lived radioisotopes. J. Mar.Sys. 42: 83–96.
GLASGOW, H. B., AND J. M. BURKHOLDER. 2000. Water qualitytrends and management implications from a five-year study ofa eutrophic estuary. Ecol. Appl. 10: 1024–1046.
, , R. E. REED, A. J. LEWITUS, AND J. E. KLEINMAN.2004. Real-time remote monitoring of water quality: A reviewof current applications, and advancements in sensor, telemetry,and computing technologies. J. Exp. Mar. Biol. Ecol. 300:409–448.
GLIBERT, P. M. 1988. Primary productivity and pelagic nitrogencycling, p. 3–31. In T. H. Blackburn and J. Sørensen [eds.],Nitrogen cycling in coastal marine environments. ScientificCommittee on Problems of the Environment, of the Interna-tional Council of Scientific Unions, SCOPE 33. John Wileyand Sons.
HAGY, J. D., W. R. BOYNTON, C. W. KEEFE, AND K. V. WOOD.2004. Hypoxia in Chesapeake Bay, 1950–2001: Long-termchange in relation to nutrient loading and river flow. Estuaries27: 634–658.
HARDING, L. W., JR., AND E. S. PERRY. 1997. Long-term increaseof phytoplankton biomass in Chesapeake Bay, 1950–1994.Mar. Ecol. Prog. Ser. 157: 39–52.
HARNED, D. A., G. MCMAHON, T. B. SPRUILL, AND M. D. WOOD-SIDE. 1995. Water-quality assessment of the Albemarle–Pam-lico drainage basin, North Carolina and Virginia—character-ization of suspended sediment, nutrients and pesticides. U.S.Geological Service Open-File Report 95-191.
HECKY, R. E., AND P. KILHAM. 1988. Nutrient limitation of phyto-plankton in freshwater and marine environments: A review ofrecent evidence on the effects of enrichment. Limnol. Ocean-ogr. 33: 796–822.
HOWARTH, R. W., AND OTHERS. 1996. Regional nitrogen budgetsand riverine N and P fluxes for the drainages to the NorthAtlantic Ocean: Natural and human influences. Biogeochem-istry 35: 75–139.
, E. W. BOYER, W. J. PABICH, AND J. N. GALLOWAY. 2002.
Nitrogen use in the United States from 1961–2000 and poten-tial future trends. Ambio 31: 88–96.
JASSBY, A. D. 1998. Interannual variability at three inland watersites: Implications for sentinel ecosystems. Ecol. Appl. 8: 277–287.
, B. E. COLE, AND J. E. CLOERN. 1997. The design of sam-pling transects for characterizing water quality in estuaries. Es-tuar. Coast. Shelf Sci. 45: 285–302.
JAWORSKI, N. A. 1981. Sources of nutrients and the scale of eutro-phication problems in estuaries, p. 83–110. In B. J. Nielsonand L. E. Conrin [eds.], Estuaries and nutrients. Human Press.
KOIKE, I., AND J. SøRENSEN. 1988. Nitrate reduction and denitrifi-cation in marine sediments, p. 251–273. In T. H. Blackburnand J. Sørensen [eds.], Nitrogen cycling in coastal marine en-vironments. Scientific Committee on Problems of the Environ-ment, of the International Council of Scientific Unions, SCOPE33. John Wiley and Sons.
LAMON, E. C., S. S. QIAN, AND D. D. RICHTER. 2004. Temporalchanges in the Yadkin River flow versus suspended sedimentconcentration relationship. J. Am. Water Resour. Assoc. 40:1219–1229.
LINE, D. E., N. M. WHITE, D. L. OSMOND, G. D. JENNINGS, AND
C. B. MOJONNIER. 2002. Pollutant export from various landuses in the upper Neuse River Basin. Water Env. Res. 74: 100–108.
MAGNIEN, R. E., R. M. SUMMERS, AND K. G. SELLER. 1992. Ex-ternal nutrient sources, internal nutrient pools, and phytoplank-ton production in Chesapeake Bay. Estuaries 15: 497–516.
MALLIN, M. A. 2000. Impacts of industrial-scale swine and poultryproduction on rivers and estuaries. Am. Sci. 88: 26–37.
. 1994. Phytoplankton ecology in North Carolina estuaries.Estuaries 17: 561–574.
, AND L. B. CAHOON. 2003. Industrialized animal produc-tion—a major source of nutrient and microbial pollution toaquatic ecosystems. Pop. Environ. 24: 369–385.
, H. W. PAERL, J. RUDEK, AND P. W. BATES. 1993. Regula-tion of estuarine primary production by watershed rainfall andriver flow. Mar. Ecol. Prog. Ser. 93: 199–203.
, M. H. POSEY, M. R. MCIVER, D. C. PARSONS, S. H. EN-SIGN, AND T. D. ALPHIN. 2000. Impacts and recovery frommultiple hurricanes in a Piedmont–Coastal Plain river system.BioScience 52: 999–1010.
MCMAHON, G., AND M. D. WOODSIDE 1997. Nutrient mass balancefor the Albemarle–Pamlico drainage basin, North Carolina andVirginia. J. Am. Water Resour. Assoc. 33: 573–590.
NATIONAL AGRICULTURAL STATISTICS SERVICE. 2004. Agriculturalstatistics [Internet]. [Accessed 2005 May]. Available from http://www.usda.gov/nass/pubs/agstats.htm
[NRC] NATIONAL RESEARCH COUNCIL. 2000. Clean coastal wa-ters—understanding and reducing the effects of nutrient pol-lution. National Academy Press.
. 2001. Assessing the TMDL approach to water quality man-agement. National Academy Press.
NEUSE BASIN OVERSIGHT COMMITTEE. 2004. Annual progress reporton the Neuse Agricultural Rule (15A NCAC 2B .0238). Reportto the Environmental Management Commission (EMC)—item04-39. North Carolina Department of Environment and NaturalResources.
NORTH CAROLINA CENTER FOR GEOGRAPHIC INFORMATION AND
ANALYSIS. 2002. [Internet]. [Accessed 2005 May]. Availablefrom http://cgia.cgia.state.nc.us/cgia/
[NC DACS] NORTH CAROLINA DEPARTMENT OF AGRICULTURE AND
CONSUMER SERVICES. 2002. Agricultural yearbook. NC DACS.[NC DENR] NORTH CAROLINA DEPARTMENT OF ENVIRONMENT AND
NATURAL RESOURCES. 1997a. Neuse River nutrient-sensitivewaters (NSW) management strategy. NC DENR.
486 Burkholder et al.
. 1997b. Assessment plan for atmospheric nitrogen com-pounds: emissions, transport, transformation, and deposition.NC DENR.
[NC DENR] NORTH CAROLINA DEPARTMENT OF ENVIRONMENT AND
NATURAL RESOURCES. 1999. Total maximum daily load fortotal nitrogen to the Neuse River estuary, North Carolina. NCDENR.
. 2001. Phase II of the total maximum daily load for totalnitrogen to the Neuse River estuary, North Carolina. NCDENR.
. 2002. Neuse River basinwide water quality plan. NCDENR.
. 2004. CAFO (confined animal feeding operation) permitsadvisory group [Internet]. [Accessed 2005 May]. Availablefrom http://h2o.enr.state.nc.us/admin/cafo/
[NC DEHNR] NORTH CAROLINA DEPARTMENT OF ENVIRONMENT,HEALTH, AND NATURAL RESOURCES. 1991. An evaluation ofthe effects of the North Carolina phosphate detergent ban. Re-port 91-04. NC DEHNR.
. 1993. Neuse River basin wide water quality managementplan. NC DEHNR.
. 1996a. Classifications and water quality standards appli-cable to surface waters of North Carolina. North Carolina ad-ministrative code sections 15A NCAC2B.0100 and 15ANCAC2B.0200. North Carolina Environmental ManagementCommission.
. 1996b. Weather-related situations at animal facilities/pub-licly wwned treatment facilities affected by Fran. NC DEHNR.
NORTH CAROLINA STATE DATA CENTER. 2004. [Internet]. [Accessed2005 May]. Available from http://sdc.state.nc.us/
PINCKNEY, J. L., D. F. MILLIE, B. T. VINYARD, AND H. W. PAERL.1997. Environmental controls of phytoplankton bloom dynam-ics in the Neuse River estuary, North Carolina, U.S.A. Can. J.Fish. Aquat. Sci. 54: 2491–2501.
POWERS, W., AND H. H. VAN HORN. 1998. Whole-farm nutrientbudgeting: A nutritional approach to manure management, p.276–280. In Soil and Water Conservation Society [eds.], Ma-nure management in harmony with the environment and soci-ety. Soil and Water Conservation Society West North CentralRegion.
QIAN, S. S., M. E. BORSUK, AND C. A. STOW. 2000. Seasonal andlong-term nutrient trend decomposition along a spatial gradientin the Neuse River watershed. Environ. Sci. Technol. 34:4474–4482.
, AND C. J. RICHARDSON. 1997. Estimating the long-termphosphorus accretion rate in the Everglades: A Bayesian ap-proach with risk assessment. Water Resour. Res. 33: 1681–1688.
RECKHOW, K. H. 2003. On the need for uncertainty assessment inTMDL modeling and implementation. J. Water Resourc. Plan.Manag. 192: 245–246.
, K. KEPFORD, AND W. WARREN-HICKS. 1992. Methods forthe analysis of lake water quality trends. Report prepared forthe U.S. Environmental Protection Agency, School of the En-vironment, Duke Univ.
REED, R. E., H. B. GLASGOW, J. M. BURKHOLDER, AND C. BROWN-IE. 2004. Seasonal halocline structure, nutrient distributions,and acoustic Doppler current profiler flow patterns over mul-tiple years in a shallow, stratified estuary. Estuar. Coast. ShelfSci. 60: 549–566.
ROCKEFELLER, A. A. 2002. Sewers, sewage treatment, sludge: Dam-age without end. New Solutions 12: 341–346.
RUDEK, J., H. W. PAERL, M. A. MALLIN, AND P. W. BATES. 1991.Seasonal and hydrological control of phytoplankton nutrientlimitation in the lower Neuse River estuary, North Carolina.Mar. Ecol. Prog. Ser. 75: 133–142.
SAS INSTITUTE. 1999. SAS/STAT guide for personal computers.Ver. 8. SAS Institute, Inc.
SIMPSON, A. 2004. A snapshot of septic system repair fundingin North Carolina: A comprehensive catalogue of policy op-tions and funding resources [Internet]. [Accessed 2005May]. Available from http://www.efc.unc.edu/projects/Onsite%20Wastewater%20Systems/Adrienne%20Capstone%20Paper.pdf
SOUTHEAST REGIONAL CLIMATE CENTER. 2004. [Internet]. [Ac-cessed 2005 May]. Available from http://www.dnr.state.sc.us/climate/sercc/services.html
SPRINGER, J. J., J. M. BURKHOLDER, P. M. GLIBERT, AND R. E.REED. 2004. Use of a real-time remote monitoring network andshipborne sampling to characterize a dinoflagellate bloom inthe Neuse estuary, North Carolina, U.S.A. Harmful Algae 4:533–551.
SPRUEGEL, D. G. 1983. Correcting for bias in log transformed al-lometric equations. Ecology 64: 209–210.
SPRUILL, T. B. 1997. Geologic sources of phosphorus in the NeuseRiver and implications for management. Summary of Albe-marle–Pamlico Estuarine Study Comprehensive Conservationand Management Plan Implementation Forum, June 5–6. U.S.Geological Survey.
, D. A. HARNED, P. M. RUHL, J. E. EIMERS, G. MCMAHON,K. E. SMITH, D. R. GALEONE, AND M. D. WOODSIDE. 1998.Water quality in the Albemarle–Pamlico drainage basin, NorthCarolina and Virginia. U.S. Geological Survey Circular 1157.
STANLEY, D. W. 1988. Historical trends in nutrient loading to theNeuse River estuary, NC, p. 155–164. In W. L. Lyke and T. J.Hoban [eds.], Proceedings of the American Water ResourcesAssociation (AWRA) Symposium on Coastal Water Resources.AWRA Technical Publications, Series TPS-88-1.
STATE CLIMATE OFFICE OF NORTH CAROLINA. 2003. [Internet]. [Ac-cessed 2005 May]. Available from http://www.nc-climate.ncsu.edu/
STEEL, J. (ED.). 1991. Status and trends report of the Albemarle–Pamlico estuarine study. North Carolina Department of Envi-ronment, Health, and Natural Resources and U.S. Environmen-tal Protection Agency National Estuarine Program.
STOW, C. A., AND M. E. BORSUK. 2003. Assessing TMDL effec-tiveness using flow-adjusted concentrations: A case study ofthe Neuse River, NC. Environ. Sci. Technol. 37: 2043–2050.
, M. E. BORSUK, AND D. W. STANLEY. 2001. Long-termchanges in watershed nutrient inputs and riverine exports inthe Neuse River, North Carolina. Water Res. 35: 1489–1499.
, C. ROESSLER, M. E. BORSUK, J. D. BOWEN, AND K. H.RECKHOW. 2003. Comparison of estuarine water quality mod-els for total maximum daily load development in Neuse Riverestuary. J. Water Resour. Plan. Manag. 129: 307–314.
THERAULT, K. B. 1986. Incoherent multibeam doppler current pro-filer performance: Part I—estimation of variance. IEEE J. Oce-anic. Eng. OE-11: 7–15.
THUT, R. N. 1980. Neuse River waste assimilation study. Weyer-haeuser.
[USDA] U.S. DEPARTMENT OF AGRICULTURE. 2001. National re-sources inventory. Natural Resources Conservation Service,U.S. Department of Agriculture–North Carolina State Office(Raleigh).
[USGS] U.S. GEOLOGICAL SERVICE. 1980. [Internet]. [Accessed2005 May]. Available from http://www.usgs.gov
[USGS] U.S. GEOLOGICAL SURVEY. 2001. Summary of trends andstatus analysis for flow, nutrients, and sediments at selectednontidal sites, Chesapeake Bay basin, 1985–99. U.S. Geolog-ical Survey Open File Report 01-73.
U.S. WEATHER SERVICE. 2005. U.S. mainland hurricane strikes by

487Nutrient trends in a large estuary
state, 1900–2004 [Internet]. [Accessed 2005 May]. Availablefrom http://www.nhc.noaa.gov/paststate.shtml
VALEILA, I., AND OTHERS. 1996. Hurricane Bob on Cape Cod. Am.Sci. 84: 154–165.
VERITY, P. G. 2002. A decade of change in the Skidaway Riverestuary. I. Hydrography and nutrients. Estuaries 25: 944–960.
VITOUSEK, P. M., AND OTHERS. 1997. Human alteration of the globalnitrogen cycle: Causes and consequences. Ecol. Appl. 7: 737–750.
WALKER, J., D. NELSON, AND V. P. ANEJA. 2000. Trends in am-monium concentration in precipitation and atmospheric am-monia emissions at a Coastal Plain site in North Carolina,U.S.A. Environ. Sci. Technol. 34: 3527–3534.
WEAVER, C. J. 1998. Low-flow characteristics and discharge pro-files for selected streams in the Neuse basin, North Carolina.U.S. Geological Survey Water Resources Investigations Report98-4135.
WEBB, J., AND J. R. ARCHER. 1994. Pollution of soils and water-courses by wastes from livestock production systems, p. 189–204. In I. A. Dewi, R. F. E. Axford, A. Marai, and H. M. Omed[eds.], Pollution in livestock production systems. CAB Inter-national.
WETZEL, R. G., AND G. E. LIKENS. 2001. Limnological analyses,2nd ed. WB Saunders.
WHITALL, D., B. HENDRICKSON, AND H. PAERL. 2002. Importanceof atmospherically deposited nitrogen to the annual nitrogenbudget of the Neuse River estuary, North Carolina. Environ.Int. 1027: 1–7.
WINNER, M. D., JR., AND R. W. COBLE. 1996. Hydrogeologic frame-work of the North Carolina Coastal Plain. U.S. Geological Sur-vey Professional Paper 1404-I.
WOOL, T. A., S. R. DAVIE, AND H. N. RODRIGUEZ. 2003. Devel-opment of three-dimensional hydrodynamic and water qualitymodels to support total maximum daily load decision processfor the Neuse River estuary, North Carolina. J. Water Resour.Plan. Manag. 129: 295–306.
YOUNT, J. D., AND G. J. NIEMI. 1990. Recovery of lotic commu-nities and ecosystems from disturbance: A narrative review ofcase studies. Environ. Manag. 14: 547–569.
Received: 23 November 2004Accepted: 31 January 2005
Amended: 31 March 2005