
Comprehensive mapping of the human kinome to epidermal growth factor receptor signaling
20
Comprehensive Mapping of the Human Kinome to Epidermal Growth Factor Receptor Signaling * □ S Received for publication, November 24, 2009, and in revised form April 26, 2010 Published, JBC Papers in Press, April 26, 2010, DOI 10.1074/jbc.M110.137828 Kakajan Komurov ‡1 , David Padron § , Tzuling Cheng ‡ , Michael Roth § , Kevin P. Rosenblatt ¶ , and Michael A. White ‡2 From the Departments of ‡ Cell Biology and § Biochemistry, University of Texas Southwestern Medical Center, Dallas, Texas 75390 and the ¶ Center for Clinical and Translational Sciences, Brown Foundation Institute of Molecular Medicine, Houston, Texas 77030 Disregulation of epidermal growth factor receptor (EGFR) signaling directly promotes bypass of proliferation and survival restraints in a high frequency of epithelia-derived cancer. As such, much effort is currently focused on decoding the molecu- lar architecture supporting EGFR activation and function. Here, we have leveraged high throughput reverse phase protein lysate arrays, with a sensitive fluorescent nanocrystal-based phosphoprotein detection assay, together with large scale siRNA-mediated loss of function to execute a quantitative inter- rogation of all elements of the human kinome supporting EGF-dependent signaling. This screening platform has captured multiple novel contributions of diverse protein kinases to mod- ulation of EGFR signal generation, signal amplitude, and signal duration. As examples, the prometastatic SNF1/AMPK-related kinase hormonally upregulated Neu kinase was found to sup- port EGFR activation in response to ligand binding, whereas the enigmatic kinase MGC16169 selectively supports coupling of active EGFR to ERK1/2 regulation. Of note, the receptor tyro- sine kinase MERTK and the pyrimidine kinase UCK1 were both found to be required for surface accumulation of EGFR and sub- sequent pathway activation in multiple cancer cell backgrounds and may represent new targets for therapeutic intervention. The capacity of cells to mount discrete responses to complex environmental cues is, at least in part, the consequence of highly integrated networks of signal transduction cascades. Much is understood about the organization of regulatory mol- ecules into signaling pathways, but much remains to be learned about pathway modulators, connectivity among pathways, and the contribution of this connectivity to distinct cellular re- sponses (1–3). Knowledge of how cell regulatory systems are organized to allow the coupling of stimulus to response with appropriate fidelity is central to predicting drug action, under- standing pathological regulatory conditions, and identifying effective molecular targets for drug discovery. The recent development of robust technologies for high throughput quan- titative measurements of protein concentrations and post- translational modifications (4), together with the advent of effective RNA interference-based human somatic cell genetics (5), affords the exceptional opportunity for the comprehensive unbiased analyses of molecular frameworks supporting cell reg- ulatory systems. Here, we have combined quantitative high density protein lysate microarrays with a large scale synthetic siRNA collection for a systematic interrogation of the epider- mal growth factor receptor (EGFR) 3 tyrosine kinase-induced mitogenic signaling network. We used direct measurements of the activation states of STAT3 and the ERK1/2 protein kinase cascades, acutely engaged upon EGFR stimulation, to evaluate the consequences of individual gene knockdowns on EGFR net- work assembly and function. This analysis has revealed 1) novel obligate components of EGFR signaling cascades; 2) pathway- specific signal modulators; and 3) new molecular couplers that specify the dynamics of the EGF signaling infrastructure. EXPERIMENTAL PROCEDURES siRNA Delivery—The primary screen was performed with the human kinome siRNA library (Dharmacon and ThermoFisher) in a 96-well microtiterplate format. Each well in this library contains a pool of four synthetic siRNA oligonucleotides target- ing one of 672 distinct genes. For high throughput transfection, 5 l of 2 micromolar siRNA (10 pmol) was transferred from the stock plates using a Biomek FX robotic liquid handler (Beck- man Coulter) and mixed with 30 l of Dharmacon cell culture reagent for each of three assay plates per library stock plate. Following a 5-min incubation at room temperature, 10 l of DharmaFECT 3 (Dharmacon, ThermoFisher) diluted 1:10 in Dharmacon cell culture reagent was delivered to each well with a TiterTek Multidrop. Following an additional 30-min incuba- tion, all wells were seeded with 8,000 cells/well in a volume of 160 l from a single-cell suspension of A431 cells in Dulbecco’s modified Eagle’s medium and 10% fetal bovine serum (no antibiotics). Plate Processing—We found that EGF responsiveness in A431 cells is equivalent under serum-starved (overnight incu- bation in serum-free Dulbecco’s modified Eagle’s medium) or serum-adapted conditions (no media change over the course of 72 h) (see supplemental Fig. 1 and data not shown). Therefore, to minimize artifacts induced by the plate manipulations required for a serum-starvation step, we elected to employ serum-adapted conditions as the no EGF baseline. 72 h post- * This work was supported by the Welch Foundation (I-1414) and the National Cancer Institute (CA71443). □ S The on-line version of this article (available at http://www.jbc.org) contains supplemental Table 1, methods, and Figs. 1– 6. 1 Present address: Dept. of Systems Biology, University of Texas M.D. Ander- son Cancer Center, Houston, TX 77054. 2 To whom correspondence should be addressed: Dept. of Cell Biology, University of Texas Southwestern Medical Center, 5323 Harry Hines Blvd., Dallas, TX 75220-9039. Tel.: 214-648-2861; E-mail: michael.white@ utsouthwestern.edu. 3 The abbreviations used are: EGFR, epidermal growth factor receptor; ERK, extracellular signal-regulated kinase; siRNA, small interfering RNA; RPPA, reverse-phase protein lysate array; MAPK, mitogen-activated protein kinase; MERTK, c-mer proto-oncogene tyrosine kinase. THE JOURNAL OF BIOLOGICAL CHEMISTRY VOL. 285, NO. 27, pp. 21134 –21142, July 2, 2010 © 2010 by The American Society for Biochemistry and Molecular Biology, Inc. Printed in the U.S.A. 21134 JOURNAL OF BIOLOGICAL CHEMISTRY VOLUME 285 • NUMBER 27 • JULY 2, 2010 by guest on May 2, 2016 http://www.jbc.org/ Downloaded from by guest on May 2, 2016 http://www.jbc.org/ Downloaded from by guest on May 2, 2016 http://www.jbc.org/ Downloaded from by guest on May 2, 2016 http://www.jbc.org/ Downloaded from by guest on May 2, 2016 http://www.jbc.org/ Downloaded from by guest on May 2, 2016 http://www.jbc.org/ Downloaded from by guest on May 2, 2016 http://www.jbc.org/ Downloaded from by guest on May 2, 2016 http://www.jbc.org/ Downloaded from by guest on May 2, 2016 http://www.jbc.org/ Downloaded from by guest on May 2, 2016 http://www.jbc.org/ Downloaded from by guest on May 2, 2016 http://www.jbc.org/ Downloaded from by guest on May 2, 2016 http://www.jbc.org/ Downloaded from
-
Upload
utsouthwestern -
Category
Documents
-
view
4 -
download
0
Transcript of Comprehensive mapping of the human kinome to epidermal growth factor receptor signaling
Comprehensive Mapping of the Human Kinome to EpidermalGrowth Factor Receptor Signaling*□S
Received for publication, November 24, 2009, and in revised form April 26, 2010 Published, JBC Papers in Press, April 26, 2010, DOI 10.1074/jbc.M110.137828
Kakajan Komurov‡1, David Padron§, Tzuling Cheng‡, Michael Roth§, Kevin P. Rosenblatt¶, and Michael A. White‡2
From the Departments of ‡Cell Biology and §Biochemistry, University of Texas Southwestern Medical Center, Dallas, Texas 75390and the ¶Center for Clinical and Translational Sciences, Brown Foundation Institute of Molecular Medicine, Houston, Texas 77030
Disregulation of epidermal growth factor receptor (EGFR)signaling directly promotes bypass of proliferation and survivalrestraints in a high frequency of epithelia-derived cancer. Assuch, much effort is currently focused on decoding the molecu-lar architecture supporting EGFR activation and function.Here,we have leveraged high throughput reverse phase proteinlysate arrays, with a sensitive fluorescent nanocrystal-basedphosphoprotein detection assay, together with large scalesiRNA-mediated loss of function to execute a quantitative inter-rogation of all elements of the human kinome supportingEGF-dependent signaling.This screeningplatformhas capturedmultiple novel contributions of diverse protein kinases to mod-ulation of EGFR signal generation, signal amplitude, and signalduration. As examples, the prometastatic SNF1/AMPK-relatedkinase hormonally upregulated Neu kinase was found to sup-port EGFR activation in response to ligand binding, whereas theenigmatic kinase MGC16169 selectively supports coupling ofactive EGFR to ERK1/2 regulation. Of note, the receptor tyro-sine kinaseMERTK and the pyrimidine kinase UCK1 were bothfound to be required for surface accumulation of EGFR and sub-sequent pathway activation inmultiple cancer cell backgroundsand may represent new targets for therapeutic intervention.
The capacity of cells tomount discrete responses to complexenvironmental cues is, at least in part, the consequence ofhighly integrated networks of signal transduction cascades.Much is understood about the organization of regulatory mol-ecules into signaling pathways, but much remains to be learnedabout pathway modulators, connectivity among pathways, andthe contribution of this connectivity to distinct cellular re-sponses (1–3). Knowledge of how cell regulatory systems areorganized to allow the coupling of stimulus to response withappropriate fidelity is central to predicting drug action, under-standing pathological regulatory conditions, and identifyingeffective molecular targets for drug discovery. The recentdevelopment of robust technologies for high throughput quan-titative measurements of protein concentrations and post-
translational modifications (4), together with the advent ofeffective RNA interference-based human somatic cell genetics(5), affords the exceptional opportunity for the comprehensiveunbiased analyses ofmolecular frameworks supporting cell reg-ulatory systems. Here, we have combined quantitative highdensity protein lysate microarrays with a large scale syntheticsiRNA collection for a systematic interrogation of the epider-mal growth factor receptor (EGFR)3 tyrosine kinase-inducedmitogenic signaling network. We used direct measurements ofthe activation states of STAT3 and the ERK1/2 protein kinasecascades, acutely engaged upon EGFR stimulation, to evaluatethe consequences of individual gene knockdowns on EGFRnet-work assembly and function. This analysis has revealed 1) novelobligate components of EGFR signaling cascades; 2) pathway-specific signal modulators; and 3) new molecular couplers thatspecify the dynamics of the EGF signaling infrastructure.
EXPERIMENTAL PROCEDURES
siRNADelivery—Theprimary screenwas performedwith thehuman kinome siRNA library (Dharmacon and ThermoFisher)in a 96-well microtiterplate format. Each well in this librarycontains a pool of four synthetic siRNAoligonucleotides target-ing one of 672 distinct genes. For high throughput transfection,5�l of 2micromolar siRNA (10 pmol) was transferred from thestock plates using a Biomek FX robotic liquid handler (Beck-man Coulter) and mixed with 30 �l of Dharmacon cell culturereagent for each of three assay plates per library stock plate.Following a 5-min incubation at room temperature, 10 �l ofDharmaFECT 3 (Dharmacon, ThermoFisher) diluted 1:10 inDharmacon cell culture reagent was delivered to each well witha TiterTek Multidrop. Following an additional 30-min incuba-tion, all wells were seeded with 8,000 cells/well in a volume of160 �l from a single-cell suspension of A431 cells in Dulbecco’smodified Eagle’s medium and 10% fetal bovine serum (noantibiotics).Plate Processing—We found that EGF responsiveness in
A431 cells is equivalent under serum-starved (overnight incu-bation in serum-free Dulbecco’s modified Eagle’s medium) orserum-adapted conditions (nomedia change over the course of72 h) (see supplemental Fig. 1 and data not shown). Therefore,to minimize artifacts induced by the plate manipulationsrequired for a serum-starvation step, we elected to employserum-adapted conditions as the no EGF baseline. 72 h post-
* This work was supported by the Welch Foundation (I-1414) and theNational Cancer Institute (CA71443).
□S The on-line version of this article (available at http://www.jbc.org) containssupplemental Table 1, methods, and Figs. 1– 6.
1 Present address: Dept. of Systems Biology, University of Texas M.D. Ander-son Cancer Center, Houston, TX 77054.
2 To whom correspondence should be addressed: Dept. of Cell Biology,University of Texas Southwestern Medical Center, 5323 Harry HinesBlvd., Dallas, TX 75220-9039. Tel.: 214-648-2861; E-mail: [email protected].
3 The abbreviations used are: EGFR, epidermal growth factor receptor; ERK,extracellular signal-regulated kinase; siRNA, small interfering RNA; RPPA,reverse-phase protein lysate array; MAPK, mitogen-activated proteinkinase; MERTK, c-mer proto-oncogene tyrosine kinase.
THE JOURNAL OF BIOLOGICAL CHEMISTRY VOL. 285, NO. 27, pp. 21134 –21142, July 2, 2010© 2010 by The American Society for Biochemistry and Molecular Biology, Inc. Printed in the U.S.A.
21134 JOURNAL OF BIOLOGICAL CHEMISTRY VOLUME 285 • NUMBER 27 • JULY 2, 2010
by guest on May 2, 2016
http://ww
w.jbc.org/
Dow
nloaded from
by guest on May 2, 2016
http://ww
w.jbc.org/
Dow
nloaded from
by guest on May 2, 2016
http://ww
w.jbc.org/
Dow
nloaded from
by guest on May 2, 2016
http://ww
w.jbc.org/
Dow
nloaded from
by guest on May 2, 2016
http://ww
w.jbc.org/
Dow
nloaded from
by guest on May 2, 2016
http://ww
w.jbc.org/
Dow
nloaded from
by guest on May 2, 2016
http://ww
w.jbc.org/
Dow
nloaded from
by guest on May 2, 2016
http://ww
w.jbc.org/
Dow
nloaded from
by guest on May 2, 2016
http://ww
w.jbc.org/
Dow
nloaded from
by guest on May 2, 2016
http://ww
w.jbc.org/
Dow
nloaded from
by guest on May 2, 2016
http://ww
w.jbc.org/
Dow
nloaded from
by guest on May 2, 2016
http://ww
w.jbc.org/
Dow
nloaded from
transfection, 50�l of a 250 ng/ml EGF (Sigma) stock solution inDulbecco’s modified Eagle’s medium was added to each well,with the exception of wells in column 1, for a final concentra-tion of 50 ng/ml and incubated for 5 min at 37 °C. The culturemedia was then dumped and replaced with 100 �l of 2% SDSlysis buffer (2% SDS, 5% glycerol, 1% �-mercaptoethanol, 68mM Tris, pH 6.8). To facilitate lysis and eliminate viscosity,plateswere then incubated at 80 °C for 45min and filtered using96-well 0.7 micron filter plates.Slide Printing and Hybridization—Lysate printing was per-
formed with a four-pin SpotArray 24 (PerkinElmer) usingnitrocellulose-coated FAST slides (Whattman). Slides wereprintedwith�1.5 nl of lysate per spot for a fractional cell equiv-alent of �3.5 cells/spot. 9 plates were arrayed per slide, witheach plate in a single column and with each well in triplicate fora total of 2592 spots/slide. Slides were dried for 2 h at roomtemperature or at 4° C overnight prior to incubation in 1� Re-blot Plus Mild (Chemicon) for 7 min, followed by three washesin 1� Tris Buffered Saline Tween-20 (Dako Cytomation).Then, slides were blocked in SEA BLOCK (Pierce) for 2 h atroom temperature or at 4° C overnight. The next incubationsteps were performed in the following order: 5 min in 0.03%hydrogen peroxide (Dako Cytomation), 10 min in avidin block(Dako Cytomation), 10min in biotin block (Dako Cytomation),15 min in protein block (Dako Cytomation), 45 min in primaryantibody (p-ERK, Cell Signaling), p-Y705-STAT3 (Cell Signal-ing), actin (Sigma)) diluted 1:1000 in antibody diluent (DakoCytomation), 20min in respective secondary antibody at 1:5000in antibody diluent (Dako Cytomation), 15 min streptavidincomplex (Dako Cytomation, prepared exactly as described inthe kit manual), 15 min amplification reagent (Dako Cytoma-tion), and 15 min streptavidin-conjugated 655 nm Quantum-dots (Invitrogen), after which slides were extensively washed inphosphate-buffered saline. Between each step above, slideswere washed three times for 5 min each in Tris Buffered SalineTween-20. Finally, slides were briefly rinsed in milli-Q waterand dried by centrifugation.Imaging and Data Processing—Slides were scanned with a
480 nm laser using a ProScanArray microarray scanner(PerkinElmer). Spot detection and quantitation was performedusing ProScanArray Express software (PerkinElmer). Raw val-ues of technical triplicateswere averaged andnormalized by themean of the 9 nearest neighbors within a column. Biologicaltriplicates were then averaged for each gene. Those with dis-cordant values across the three replicates were discarded fromfurther analyses.Network Analysis—The comprehensive network of human
genes was constructed by compiling protein-protein interac-tions in Human Protein Reference Database (6), Entrez Gene(7), Biomolecular Interaction Database (8), and IntAct (9). Sig-naling interactions were compiled from Biocarta and KyotoEncyclopedia of Genes and Genomes (KEGG) (10) as well asthrough manual curation. Transcription factor target interac-tions were obtained from ORegAnno (11). Functional interac-tions between geneswere constructed based on the significanceof overlap of their gene ontology (12) annotations as well astheir common assignment to a KEGGmetabolic pathway. Can-cer mutation data were obtained from COSMIC (13) and from
Refs. 14–18. Scoring of network components (nodes and edges)for their relevance to a given data set is done by a randomwalk-based scoring strategy (19) by using the data values ofnodes as transition probabilities. First, each interaction i-j isassigned a probability value (pij) based on the data values ofnodes in the neighborhood:
p ij �wj
�k�Niwk(Eq. 1)
wherewj is the experimental value for node j, andNi is the set ofimmediate downstream neighbors of node i. If there are nodownstream nodes of the node i (�Ni� � 0), pij is set to pij � 1/nfor all j, where n is the total number of nodes in the network.Also, at each step, we assigned a small probability (q � 0.01)that the random walk would jump to any other node in the net-work. Final relevance scores of nodes are given by their visitationfrequenciesby the randomwalk in theendof infinite iterations (i.e.value at the stationary distribution of the randomwalk (19)).
RESULTS AND DISCUSSION
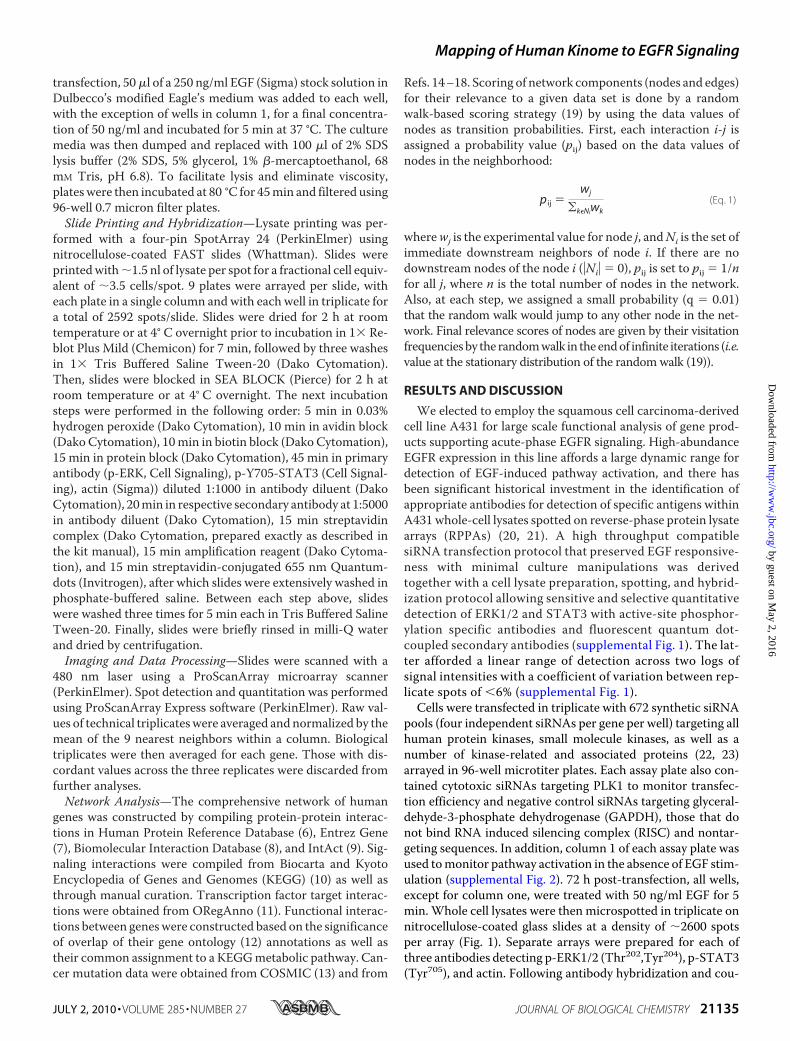
We elected to employ the squamous cell carcinoma-derivedcell line A431 for large scale functional analysis of gene prod-ucts supporting acute-phase EGFR signaling. High-abundanceEGFR expression in this line affords a large dynamic range fordetection of EGF-induced pathway activation, and there hasbeen significant historical investment in the identification ofappropriate antibodies for detection of specific antigens withinA431whole-cell lysates spotted on reverse-phase protein lysatearrays (RPPAs) (20, 21). A high throughput compatiblesiRNA transfection protocol that preserved EGF responsive-ness with minimal culture manipulations was derivedtogether with a cell lysate preparation, spotting, and hybrid-ization protocol allowing sensitive and selective quantitativedetection of ERK1/2 and STAT3 with active-site phosphor-ylation specific antibodies and fluorescent quantum dot-coupled secondary antibodies (supplemental Fig. 1). The lat-ter afforded a linear range of detection across two logs ofsignal intensities with a coefficient of variation between rep-licate spots of �6% (supplemental Fig. 1).Cells were transfected in triplicate with 672 synthetic siRNA
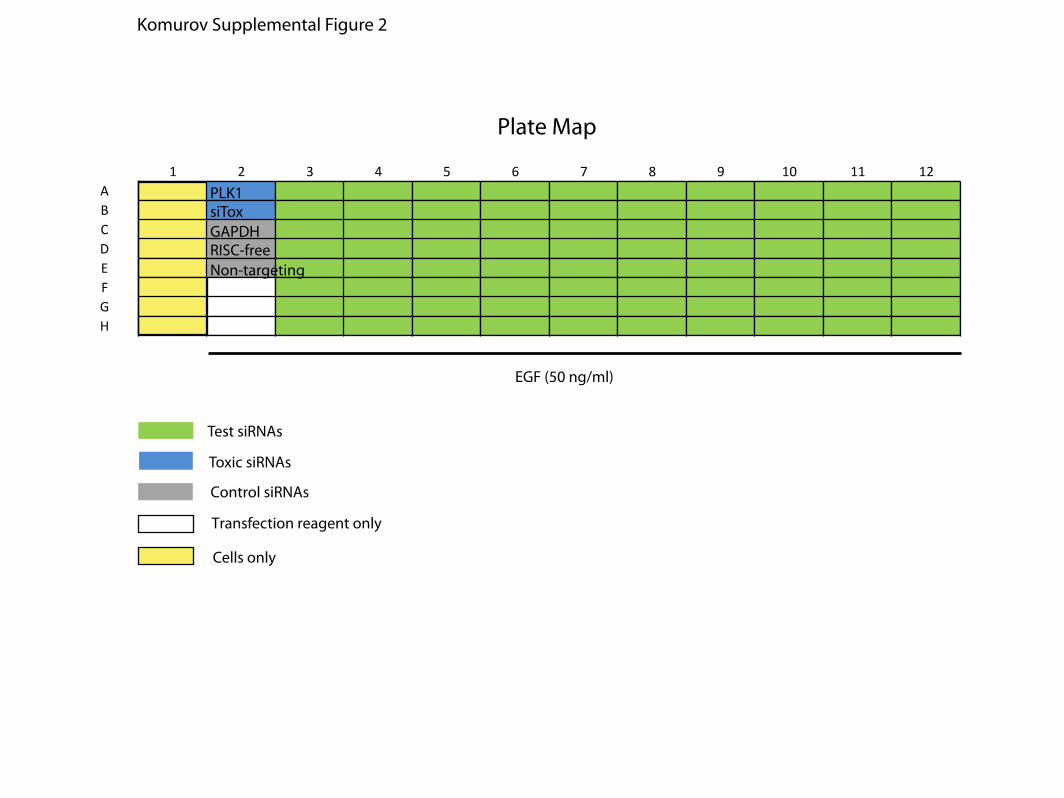
pools (four independent siRNAs per gene per well) targeting allhuman protein kinases, small molecule kinases, as well as anumber of kinase-related and associated proteins (22, 23)arrayed in 96-well microtiter plates. Each assay plate also con-tained cytotoxic siRNAs targeting PLK1 to monitor transfec-tion efficiency and negative control siRNAs targeting glyceral-dehyde-3-phosphate dehydrogenase (GAPDH), those that donot bind RNA induced silencing complex (RISC) and nontar-geting sequences. In addition, column 1 of each assay plate wasused tomonitor pathway activation in the absence of EGF stim-ulation (supplemental Fig. 2). 72 h post-transfection, all wells,except for column one, were treated with 50 ng/ml EGF for 5min.Whole cell lysates were then microspotted in triplicate onnitrocellulose-coated glass slides at a density of �2600 spotsper array (Fig. 1). Separate arrays were prepared for each ofthree antibodies detecting p-ERK1/2 (Thr202,Tyr204), p-STAT3(Tyr705), and actin. Following antibody hybridization and cou-
Mapping of Human Kinome to EGFR Signaling
JULY 2, 2010 • VOLUME 285 • NUMBER 27 JOURNAL OF BIOLOGICAL CHEMISTRY 21135
by guest on May 2, 2016
http://ww
w.jbc.org/
Dow
nloaded from
pling of fluorescent nanocrystals (Qdot 655 nM), antibody-an-tigen interactionswere quantified as a per-spotmeasure of fluo-rescence intensity using a 480 nmmicroarray laser scanner. Asshown in the false color image of a representative slide stainedwith anti-phospho-ERK1/2 (Fig. 1), position-specific variationin signal intensity was corrected by nearest neighbor normal-ization (see “Experimental Procedures”). Accordingly, normal-
ized value distributions for p-ERK, p-STAT3, and actin werecentered at 1 with a relatively narrow overall variance andmin-imized position-specific artifacts (Fig. 1). Samples that did notreproduce in at least two of three biological replicates, or thosewith dubious spots were excluded from further analyses. Themean of the resulting biological replicates was used as the rela-tive value for each sample with each antibody.
FIGURE 1. Kinome screening protocol. For each kinome siRNA library master plate (2 �M siRNA concentration in each well), three assay plates with 8.6 pmolof siRNA per well was generated. Transfections were performed in triplicate for biological replicates. After 72 h of transfection, cells were stimulated with 50ng/ml EGF for 5 min. Lysates were printed onto nitrocellulose slides at a density of 9 plates per slide. Each well was spotted in triplicate for technicalreproducibility. Slides were incubated with antibodies against pERK, pSTAT3, and actin. A representative false color image of a slide immunostained with pERKis shown. Each plate has �EGF and �EGF control wells as indicated in the enlarged panel at bottom left. Qualitative consequences of pERK signal intensity uponMAPK1 depletion are evident in the enlarged panel at the top left panel. Due to position-specific artifacts in slide processing, there is a significant position-specific variation in the spot intensity values across the slide (bottom left panel). Nearest neighbor normalization resulted in a consistent distribution of spotintensities across the slides (bottom right panel).
Mapping of Human Kinome to EGFR Signaling
21136 JOURNAL OF BIOLOGICAL CHEMISTRY VOLUME 285 • NUMBER 27 • JULY 2, 2010
by guest on May 2, 2016
http://ww
w.jbc.org/
Dow
nloaded from
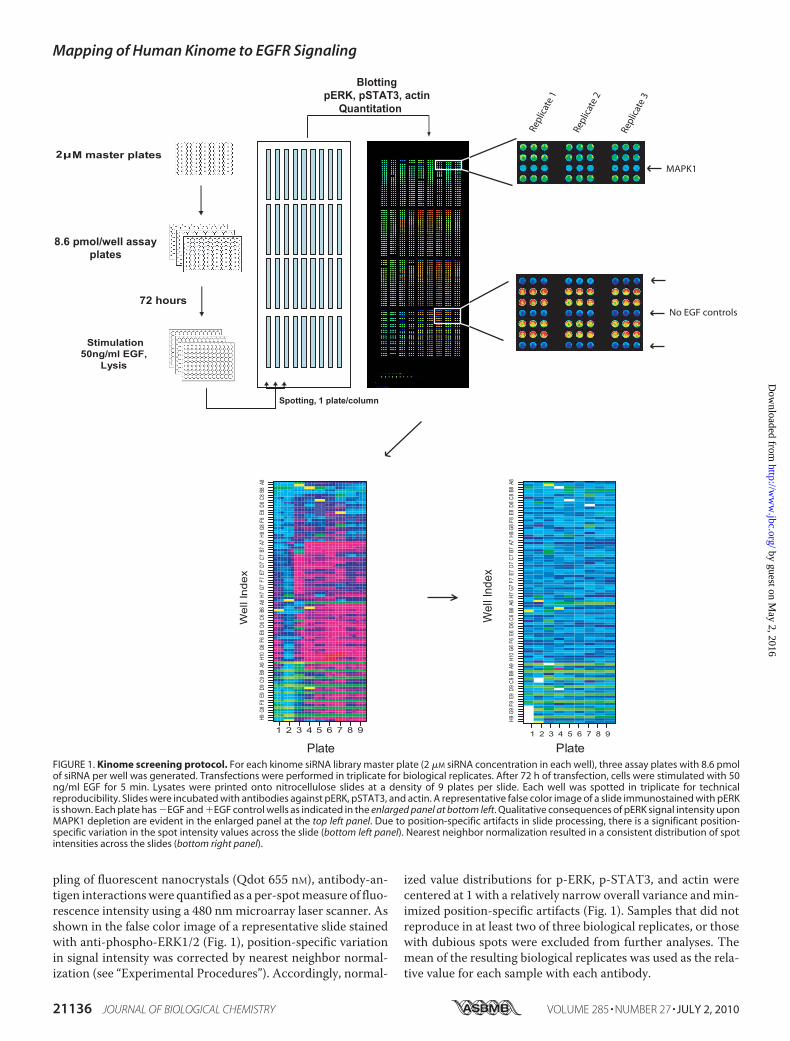
As expected, cytotoxic PLK1 siRNAs on all slides resulted insignificant signal reductions from all three antibodies, whilesiRNAs targeting MAPK1 (ERK2) selectively reduced thep-ERK signal (Fig. 2A). To select hits that potentially modulateEGF-induced signal propagation, all values were normalized toactin signals as a control for protein abundance and filtered forthose displaying at least a 20% change (up or down) in relativep-STAT3 or p-ERK signal intensity (Fig. 2B). A distributive
retesting of 17 candidates across this panel by immunoblotanalysis of independent transfections showed concordancewith the high throughput RPPA-derived observations (Fig. 2C).Analysis by RPPA across a time course of EGF stimulation wascarried out to examine the consequence of target depletion onsignal amplitude together with signal duration. The testedsiRNA pools that blunted ERK1/2 and/or STAT3 responsive-ness did so across the full time course, suggesting that the tar-
FIGURE 2. Candidate modulators of EGF-induced ERK1/2 and STAT3 activation. A, the heat map of normalized mean intensity values for siRNAs targetingEGFR, MAPK1, MAPK3, PLK1, and glyceraldehyde-3-phosphate dehydrogenase (GAPDH) is shown. B, the 52 gene hit list. Those siRNA pools with reproducibleconsequences on ERK1/2 and/or STAT3 activation are shown. The heat map color scale indicates normalized intensity values for respective antibodies. The genetargets were clustered according to their normalized intensity values (unsupervised hierarchical cluster). C, immunoblot validation of a representative panel ofhits. Whole-cell lysates prepared from independent transfections were separated by SDS-PAGE and immunoblotted as indicated. Nontargeting siRNAs wereused as controls. D, box plots of MNT1 and H1155 cell lethality z-score values for pERK hits relative to other kinases in the screen. E, Heat maps of RPPA analysisof the time courses of EGF stimulation in response to knockdown of the indicated genes. After a 72-h transfection with respective siRNA oligonucleotides, cellswere stimulated with 10 (right panel) or 100 ng/ml EGF and collected after 5, 30, or 60 min. The heat map color scale indicates raw intensity values for respectiveantibodies. SUR8 is included as a positive control of ERK signal abrogation in response to EGF. The right panel shows pSTAT3 stimulation in response to low EGFconcentration.
Mapping of Human Kinome to EGFR Signaling
JULY 2, 2010 • VOLUME 285 • NUMBER 27 JOURNAL OF BIOLOGICAL CHEMISTRY 21137
by guest on May 2, 2016
http://ww
w.jbc.org/
Dow
nloaded from
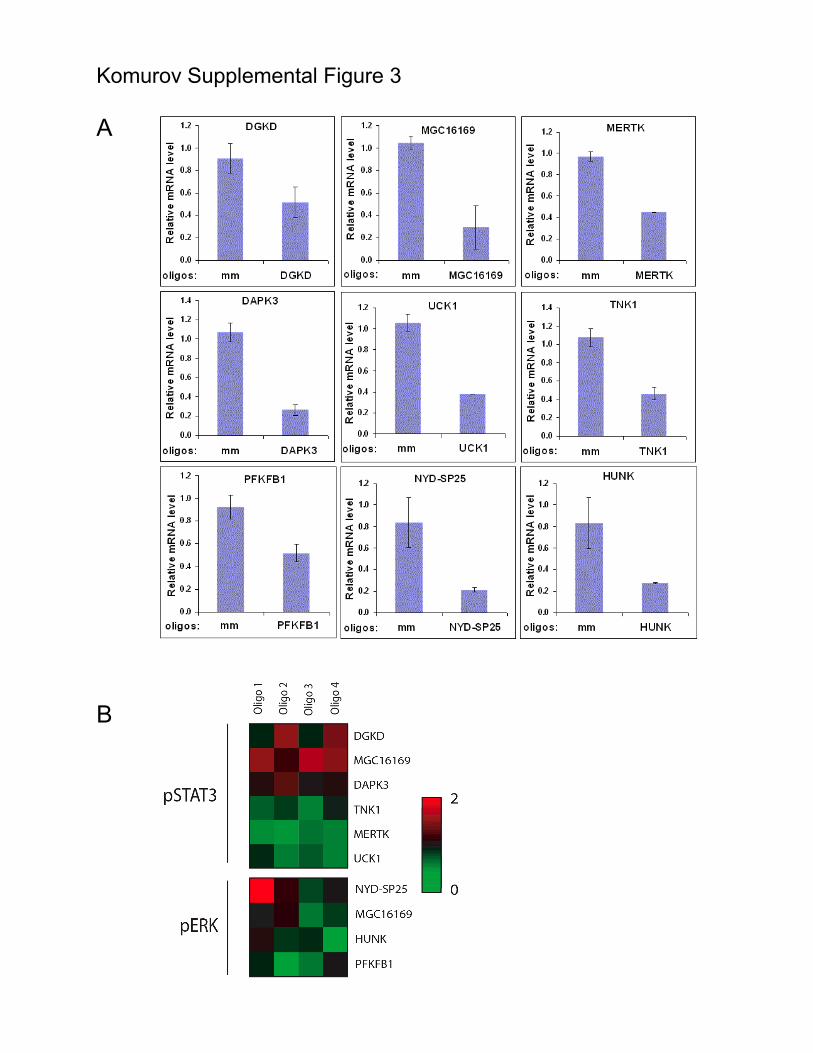
geted gene products are required for EGF signal propagation(ERK1/2: HUNK, PFKFB1, CSNK2A2, MGC16169; STAT3:CSNK2A2, UCK1, MERTK, TNK1; Fig. 2E). In the case ofSTAT3 activation, many of the siRNA pools which enhancedEGF responsiveness resulted in continued EGF-dependentaccumulation of p-STAT3 over time, suggesting the targetedgene products are involved in signal desensitization or termi-nation (PTPRR,DGKD,NYD-SP25,MGC16169; Fig. 2E). Eighttargets, selected as representing novel components of each ofthe major phenotypic groups (DGKD, MGC16169, MERTK,DAPK3, UCK1, TNK1, PFKFB1, NYD-SP25), were furthertested for target-specific knockdown by quantitative PCRand phenotypic reproducibility with multiple independentsiRNA oligos. All targets were expressed in A431 cells andsignificantly depleted by cognate siRNAs (supplementalFig. 3A). In addition, appropriate phenotypes were recoveredwith two or more independent siRNA oligonucleonucleoti-des for seven of eight of the targets (supplemental Fig. 3B)suggesting the majority of the targets represent biologicallymeaningful relationships.Given the central contribution of EGF receptor family acti-
vation to initiation and progression of neoplastic disease (24,25), we compared the screen-generated functional data set torecent cancer genome-resequencing efforts (14, 16, 17, 26).Annotation of the 52 candidate EGFR signal modulatorsrevealed 31 that had been identified as somatic mutations intumor tissues or tumor-derived cell lines (supplemental Table1). In addition to returning expected relationships with knownoncogenes, such as CSF1R (27), in several cases, the direction ofimpact on EGFR signaling upon target depletion infers novelfunctional relationships between identified somatic mutationsand tumorigenic signaling. For example, EPHA3 is frequentlymutated in lung and colorectal cancers (14, 26). Whereas iden-
tified mutations are broadly distributed across the gene, somelikely alter composition of a predicted “molecular brake” in thekinase domain by analogy with structural studies of otherreceptor tyrosine kinases (26, 28) andmay result in constitutivekinase activity. Consistent with a predicted promitogenic rolein cancers, EPHA3 depletion impaired EGF-dependent STAT3activation. By contrast, EPHA7 expression is frequently sup-pressed by promoter hypermethylation in cancers (29, 30). Theelevated STAT3 activation observed upon EPHA7 depletion(Fig. 2B) is consistent with tumor suppressor activity. Similarly,DAPK3 (aka ZIP kinase) depletion resulted in elevated STAT3activation. Though only a fewmutations have been observed todate, this locus is frequently lost in gastric cancer (31). This,together with the inhibitory consequences of DAPK3 expres-sion on EGFR, predicts that theDAPK3mutations identified bythe cancer genome sequencing project likely impair DAPK3protein function (supplemental Table 1).
Maintenance of ERK1/2 activation, primarily driven by acti-vating mutations in BRAF or N-Ras, is an obligate componentsupporting survival of many melanoma cell lines and is thus ahigh priority therapeutic target (32). We therefore comparedthe consequences of kinome depletion on EGF-inducedERK1/2 activation with consequences onMnt-1melanoma cellsurvival employing a data set derived from a recent genome-wide siRNA screen (33). A similar analysis was performed witha data set fromH1155, a tumor line resistant to ERK1/2 inhibi-tion (34). Remarkably, those targets selectively required forEGF-induced ERK1/2 activation in A431 cells were signifi-cantly enriched among single-gene lethals in Mnt-1 cells (Fig.2D (Wilcoxon rank sum test, p � 0.003) and supplementalTable 1). This suggests a significantly more complex targetspace may be available for pharmacological abrogation ofERK1/2 activation than previously anticipated.
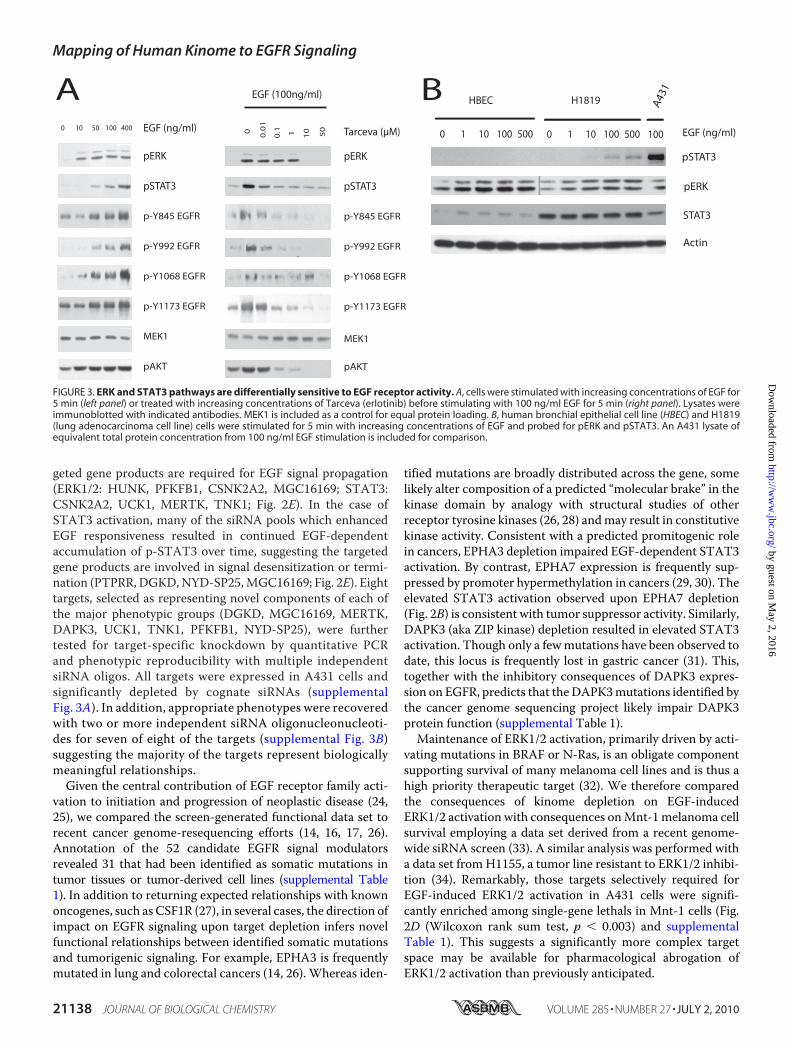
FIGURE 3. ERK and STAT3 pathways are differentially sensitive to EGF receptor activity. A, cells were stimulated with increasing concentrations of EGF for5 min (left panel) or treated with increasing concentrations of Tarceva (erlotinib) before stimulating with 100 ng/ml EGF for 5 min (right panel). Lysates wereimmunoblotted with indicated antibodies. MEK1 is included as a control for equal protein loading. B, human bronchial epithelial cell line (HBEC) and H1819(lung adenocarcinoma cell line) cells were stimulated for 5 min with increasing concentrations of EGF and probed for pERK and pSTAT3. An A431 lysate ofequivalent total protein concentration from 100 ng/ml EGF stimulation is included for comparison.
Mapping of Human Kinome to EGFR Signaling
21138 JOURNAL OF BIOLOGICAL CHEMISTRY VOLUME 285 • NUMBER 27 • JULY 2, 2010
by guest on May 2, 2016
http://ww
w.jbc.org/
Dow
nloaded from
As is readily evident in the heat map display of screen hits(Fig. 2B), we recovered twice as many targets modulatingSTAT3 activation as compared with ERK1/2 activation. Inaddition, ERK1/2 activation appeared relatively resistant toreduction of EGFR concentrations (Fig. 2A). This is unlikely tobe an artifact of antibody sensitivity as both p-ERK andp-STAT3 selective antibodies had similar dynamic range(supplemental Fig. 1) and suggests that the ERK activation net-
work may be more robust than STAT3 against perturbation ofEGFR signaling dynamics in these cells. In fact, ERK1/2 wasmaximally active upon exposure to 10 ng/ml EGF, whereasp-STAT3 was first detectable in response to 50 ng/ml EGF andcontinued to accumulate in response to 400 ng/ml EGF (Fig.3A). Moreover, there was at least a 100-fold difference in thesensitivity of these two pathways to the small molecule EGFRkinase inhibitor erlotinib (Fig. 3B). Taken together, these obser-
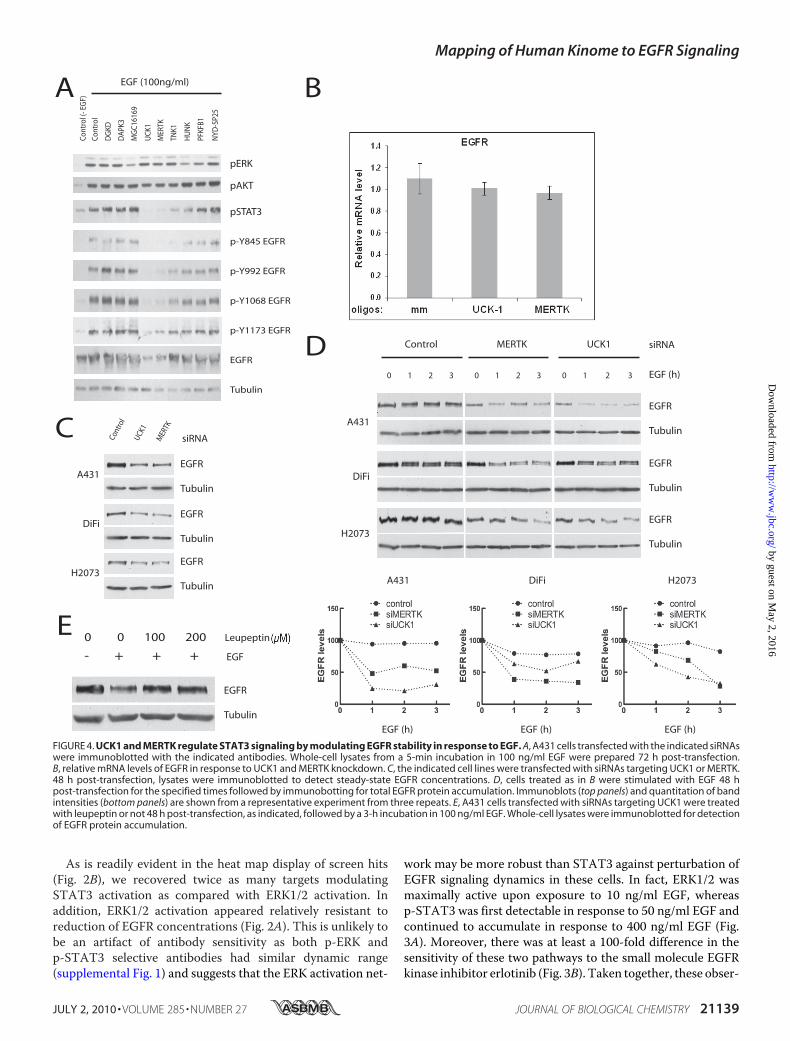
FIGURE 4. UCK1 and MERTK regulate STAT3 signaling by modulating EGFR stability in response to EGF. A, A431 cells transfected with the indicated siRNAswere immunoblotted with the indicated antibodies. Whole-cell lysates from a 5-min incubation in 100 ng/ml EGF were prepared 72 h post-transfection.B, relative mRNA levels of EGFR in response to UCK1 and MERTK knockdown. C, the indicated cell lines were transfected with siRNAs targeting UCK1 or MERTK.48 h post-transfection, lysates were immunoblotted to detect steady-state EGFR concentrations. D, cells treated as in B were stimulated with EGF 48 hpost-transfection for the specified times followed by immunobotting for total EGFR protein accumulation. Immunoblots (top panels) and quantitation of bandintensities (bottom panels) are shown from a representative experiment from three repeats. E, A431 cells transfected with siRNAs targeting UCK1 were treatedwith leupeptin or not 48 h post-transfection, as indicated, followed by a 3-h incubation in 100 ng/ml EGF. Whole-cell lysates were immunoblotted for detectionof EGFR protein accumulation.
Mapping of Human Kinome to EGFR Signaling
JULY 2, 2010 • VOLUME 285 • NUMBER 27 JOURNAL OF BIOLOGICAL CHEMISTRY 21139
by guest on May 2, 2016
http://ww
w.jbc.org/
Dow
nloaded from
vations suggest that minimal numbers of activated EGFRs arerequired to maximally engage ERK1/2 signaling and that thesereceptors are far from limiting in A431 cells. In contrast,STAT3 responds in a fashion more concordant with the abso-lute concentration of activating phosphorylation events onEGFR receptors (Fig. 3A). A similar differential sensitivity ofERK1/2 and STAT3 to EGF receptor-dependent signaling wasobserved in a nonsmall cell lung cancer derived cell line, H1819,
known to have high relative EGFR expression. Surprisingly,unlike ERK1/2, STAT3 activationwas undetectable in responseto EGF stimulation of nontumorigenic telomerase-immortal-ized airway epithelial cells with a “normal” complement ofEGFR (Fig. 3B).To examine activity at the level of the EGF receptor, a panel
of EGFR tyrosine phosphorylation site-specific antibodies wereused to monitor EGF responsiveness upon target depletion as
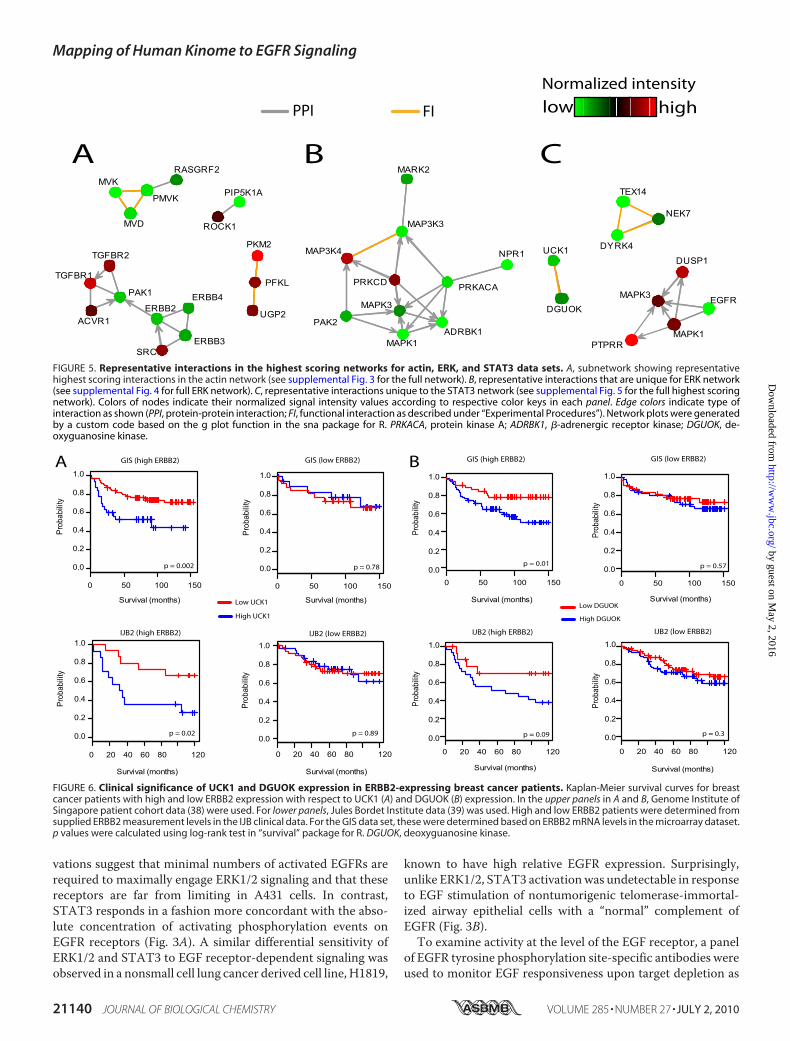
FIGURE 5. Representative interactions in the highest scoring networks for actin, ERK, and STAT3 data sets. A, subnetwork showing representativehighest scoring interactions in the actin network (see supplemental Fig. 3 for the full network). B, representative interactions that are unique for ERK network(see supplemental Fig. 4 for full ERK network). C, representative interactions unique to the STAT3 network (see supplemental Fig. 5 for the full highest scoringnetwork). Colors of nodes indicate their normalized signal intensity values according to respective color keys in each panel. Edge colors indicate type ofinteraction as shown (PPI, protein-protein interaction; FI, functional interaction as described under “Experimental Procedures”). Network plots were generatedby a custom code based on the g plot function in the sna package for R. PRKACA, protein kinase A; ADRBK1, �-adrenergic receptor kinase; DGUOK, de-oxyguanosine kinase.
FIGURE 6. Clinical significance of UCK1 and DGUOK expression in ERBB2-expressing breast cancer patients. Kaplan-Meier survival curves for breastcancer patients with high and low ERBB2 expression with respect to UCK1 (A) and DGUOK (B) expression. In the upper panels in A and B, Genome Institute ofSingapore patient cohort data (38) were used. For lower panels, Jules Bordet Institute data (39) was used. High and low ERBB2 patients were determined fromsupplied ERBB2 measurement levels in the IJB clinical data. For the GIS data set, these were determined based on ERBB2 mRNA levels in the microarray dataset.p values were calculated using log-rank test in “survival” package for R. DGUOK, deoxyguanosine kinase.
Mapping of Human Kinome to EGFR Signaling
21140 JOURNAL OF BIOLOGICAL CHEMISTRY VOLUME 285 • NUMBER 27 • JULY 2, 2010
by guest on May 2, 2016
http://ww
w.jbc.org/
Dow
nloaded from
compared with controls. Whereas TNK1 depletion selectivelyimpaired phosphorylation of Tyr845, a canonical Src family site,the most striking observation was a significant reduction inEGFR protein accumulation upon depletion of UCK1 orMERTK (Fig. 4A). This reduction was not associated withreduced accumulation of EGFR mRNA (Fig. 4B) and was reca-pitulated in two other tumor-derived cell lines known to over-express EGFR (35) (Fig. 4C). At least one mechanism contrib-uting to reduced EGFR concentrations in all three cell lines isenhanced EGF-dependent EGFR internalization and degra-dation (Fig. 4D). The enhanced signal-dependent EGFRturnover was reversible by leupeptin-mediated inhibition oflysosomal hydrolase activity. This relationship suggests thatUCK1 andMERTKmay actively participate in modulation ofEGFR trafficking and/or deflection of EGF-dependent signaldesensitization.As a tool to aid extrapolation of this screen data set to other
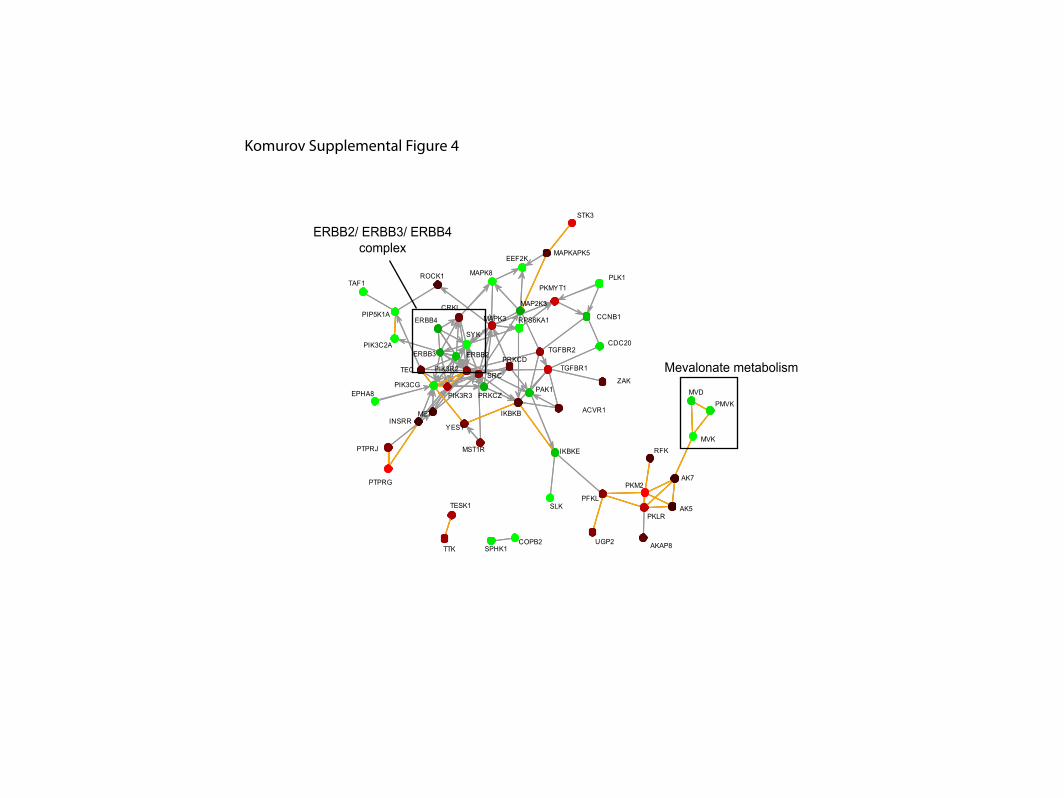
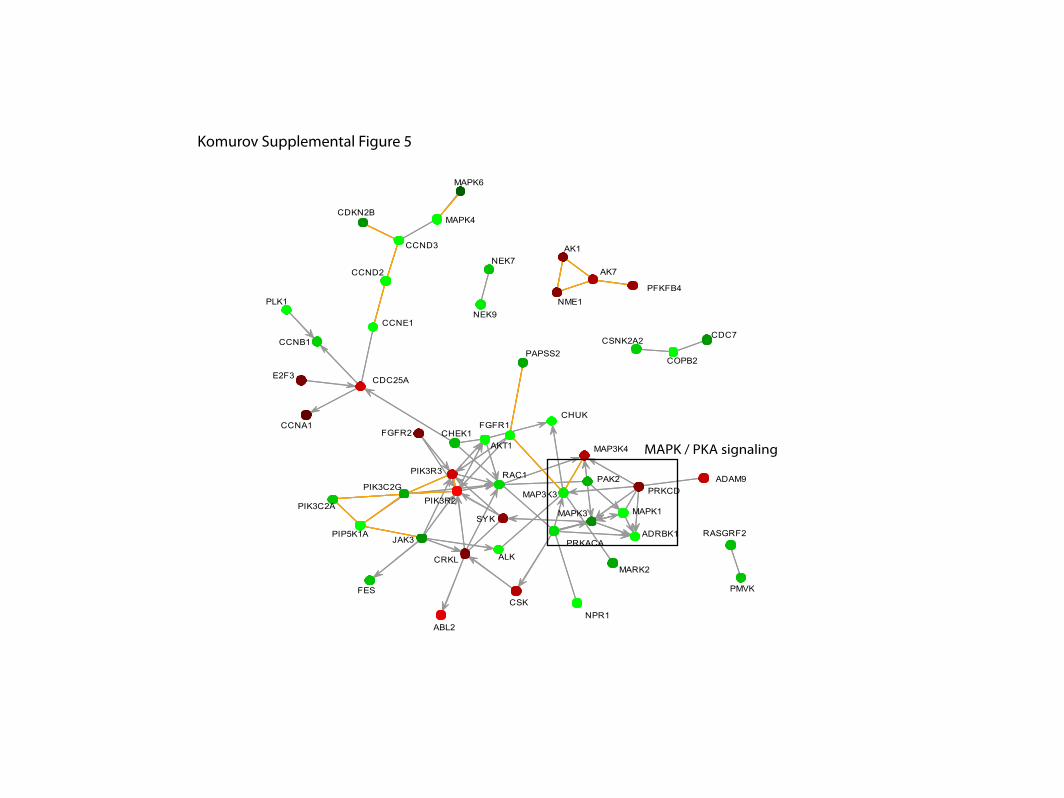
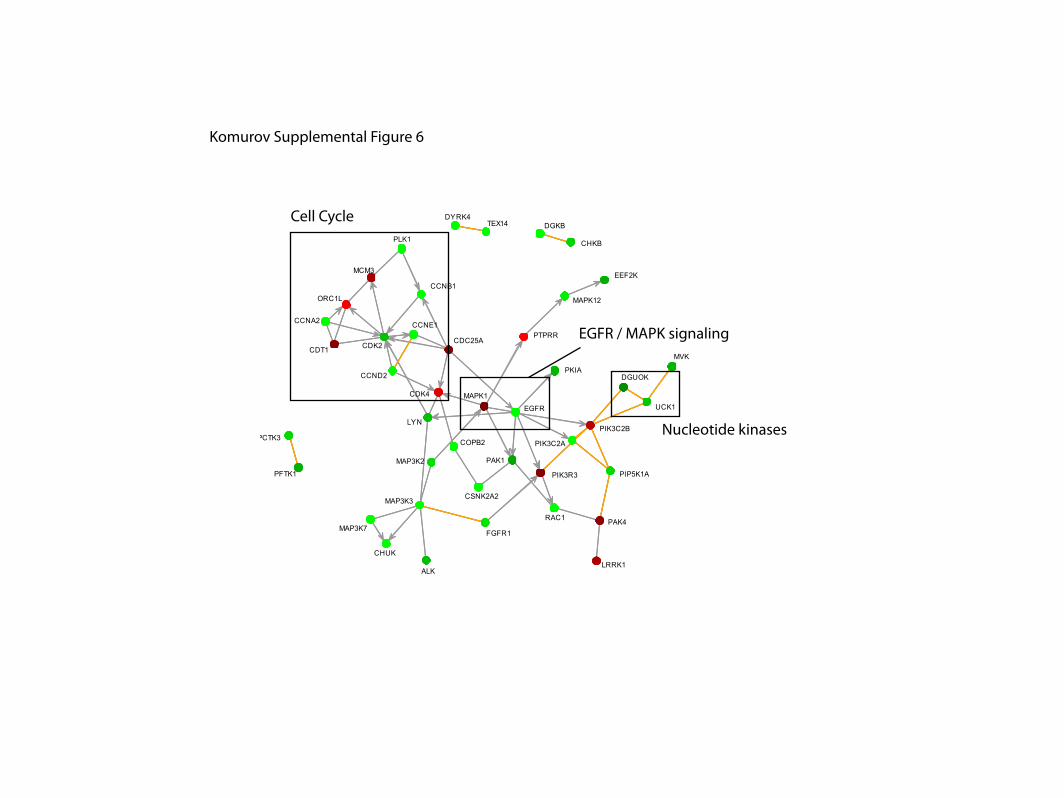
system-level analyses and to help infer potential mechanisticrelationships for future testing in appropriate experimentalmodels, we next mapped the siRNA targets modulating EGFRsignaling onto the human protein interaction network. Weconstructed a current “state-of-the-field” network of humanprotein-protein interactions and functional relations frompub-licly available databases (see “Experimental Procedures”) con-taining close to 250,000 interactions among 14,503 unique geneproducts. To definewhich sub-networks are over- or underrep-resented within each data set, we performed a random walk-based network assembly (NetWalk algorithm)4 using actin,p-STAT3, and p-ERK1/2 abundance values to segregate thehighest scoring networks (see supplemental Figs. 4–6). Signif-icant subnetworks unique to each data set are shown in Fig. 5.As examples, the low actin network is enriched for mevalonatepathway components (phospho-mevalonate kinase, meval-onate kinase, andmevalonate decarboxylase) (Fig. 5A), indicat-ing their importance in the cell growth and/or survival of A431cells. The ERK network is mostly centered aroundMAPKs (seesupplemental Fig. 5) but also contains PRKACA (protein kinaseA) and ADRBK1 (�-adrenergic receptor kinase) (Fig. 5B),implicating the PKA signaling in the regulation of EGF-inducedMAPK signaling. The STAT3 network returned an additionalnucleotide kinase, DGUOK (deoxyguanosine kinase), thedepletion of which caused a similar phenotype to that of UCK1in the primary screen, potentially indicating a role for nucleo-tide metabolism in the regulation of EGFR signaling.To query the disease relevance of the identified nucleotide
kinase/EGFR signaling relationships, we examined the correla-tion of UCK1 and DGUOK expression with clinical outcomesin breast cancer patients. ERBB2, amember of the EGFR family,is frequently overexpressed in breast cancers and correlateswith poor outcome (36). To assess relevance of UCK1 andDGUOK expression in cancers with potentially increased EGFsignaling, we divided patient samples into high and low ERBB2groups based on their ERBB2 mRNA levels. As shown in Fig. 6,high UCK1 or DGUOK expression correlates with poor out-come in breast cancer patients with high but not low ERBB2
expression in two independent cohorts. Together with the cell-based loss-of-function assays, this observation suggests thatnucleotide kinases UCK1 and DGUOK may have importantroles in sustaining aberrant EGF signaling in vivo.Focused investigation of the EGFR signaling network in nor-
mal and diseased cells and tissues has generated an extensivegalaxy of interconnected molecular pathways (37). However,parsing those components that represent appropriately fragilepressure points for intervention requires the following: 1) thatfunctional network mapping is inclusive of most key compo-nents supporting signal acquisition and transmission and 2)that these functional networks can be decoded to isolate obli-gate components within distinct regulatory contexts. Here, wehave taken a large scale, unbiased approach toward capture ofgene products required for mitogen-induced EGFR activationand function. This has generated a rich data set containingnovelmolecular relationships specifying both commonanddis-crete EGF-dependent signaling events. Although higher reso-lution mechanistic elaboration of these relationships is indi-cated, the diversity of those uncovered suggests application ofthis discovery platform across the human genome is a practicaland effective means of generating accurate and coherentmolecular maps of cell autonomous signaling architecture.
Acknowledgments—We thank Prem Gurnani and Johanne Pastor foradvice during the RPPA analyses and Ju-Seog Lee for providing theclinical data.
REFERENCES1. Johnson, S. A., and Hunter, T. (2005) Nat. Methods 2, 17–252. Dhanasekaran, D. N., and Johnson, G. L. (2007) Oncogene 26, 3097–30993. Raman, M., and Cobb, M. H. (2003) Curr. Biol. 13, R886–8884. Liotta, L. A., Espina, V., Mehta, A. I., Calvert, V., Rosenblatt, K., Geho, D.,
Munson, P. J., Young, L., Wulfkuhle, J., and Petricoin, E. F., 3rd. (2003)Cancer Cell 3, 317–325
5. Elbashir, S. M., Harborth, J., Lendeckel, W., Yalcin, A., Weber, K., andTuschl, T. (2001) Nature 411, 494–498
6. Mishra,G. R., Suresh,M., Kumaran, K., Kannabiran,N., Suresh, S., Bala, P.,Shivakumar, K., Anuradha, N., Reddy, R., Raghavan, T. M., Menon, S.,Hanumanthu, G., Gupta, M., Upendran, S., Gupta, S., Mahesh, M., Jacob,B., Mathew, P., Chatterjee, P., Arun, K. S., Sharma, S., Chandrika, K. N.,Deshpande, N., Palvankar, K., Raghavnath, R., Krishnakanth, R., Karathia,H., Rekha, B., Nayak, R., Vishnupriya, G., Kumar, H. G., Nagini, M., Ku-mar, G. S., Jose, R., Deepthi, P., Mohan, S. S., Gandhi, T. K., Harsha, H. C.,Deshpande, K. S., Sarker, M., Prasad, T. S., and Pandey, A. (2006) NucleicAcids Res. 34, D411–414
7. Maglott, D., Ostell, J., Pruitt, K. D., and Tatusova, T. (2007) Nucleic AcidsRes. 35, D26–31
8. Bader, G. D., Donaldson, I., Wolting, C., Ouellette, B. F., Pawson, T., andHogue, C. W. (2001) Nucleic Acids Res. 29, 242–245
9. Kerrien, S., Alam-Faruque, Y., Aranda, B., Bancarz, I., Bridge, A., Derow,C., Dimmer, E., Feuermann, M., Friedrichsen, A., Huntley, R., Kohler, C.,Khadake, J., Leroy, C., Liban, A., Lieftink, C., Montecchi-Palazzi, L., Or-chard, S., Risse, J., Robbe, K., Roechert, B., Thorneycroft, D., Zhang, Y.,Apweiler, R., and Hermjakob, H. (2007) Nucleic Acids Res. 35, D561–565
10. Kanehisa, M., and Goto, S. (2000) Nucleic Acids Res. 28, 27–3011. Griffith, O. L., Montgomery, S. B., Bernier, B., Chu, B., Kasaian, K., Aerts,
S., Mahony, S., Sleumer, M. C., Bilenky, M., Haeussler, M., Griffith, M.,Gallo, S. M., Giardine, B., Hooghe, B., Van Loo, P., Blanco, E., Ticoll, A.,Lithwick, S., Portales-Casamar, E., Donaldson, I. J., Robertson, G., Wade-lius, C., De Bleser, P., Vlieghe, D., Halfon, M. S., Wasserman, W., Hardi-son, R., Bergman, C. M., and Jones, S. J. (2008) Nucleic Acids Res. 36,4 K. Komurov, M. A. White, and P. T. Ram, manuscript submitted.
Mapping of Human Kinome to EGFR Signaling
JULY 2, 2010 • VOLUME 285 • NUMBER 27 JOURNAL OF BIOLOGICAL CHEMISTRY 21141
by guest on May 2, 2016
http://ww
w.jbc.org/
Dow
nloaded from
D107–11312. Ashburner, M., Ball, C. A., Blake, J. A., Botstein, D., Butler, H., Cherry,
J.M., Davis, A. P., Dolinski, K., Dwight, S. S., Eppig, J. T., Harris,M.A., Hill,D. P., Issel-Tarver, L., Kasarskis, A., Lewis, S., Matese, J. C., Richardson,J. E., Ringwald, M., Rubin, G. M., and Sherlock, G. (2000) Nat. Genet. 25,25–29
13. Bamford, S., Dawson, E., Forbes, S., Clements, J., Pettett, R., Dogan, A.,Flanagan, A., Teague, J., Futreal, P. A., Stratton, M. R., and Wooster, R.(2004) Br. J. Cancer 91, 355–358
14. Sjoblom, T., Jones, S., Wood, L. D., Parsons, D. W., Lin, J., Barber, T. D.,Mandelker, D., Leary, R. J., Ptak, J., Silliman, N., Szabo, S., Buckhaults, P.,Farrell, C.,Meeh, P.,Markowitz, S. D.,Willis, J., Dawson, D.,Willson, J. K.,Gazdar, A. F., Hartigan, J., Wu, L., Liu, C., Parmigiani, G., Park, B. H.,Bachman, K. E., Papadopoulos, N., Vogelstein, B., Kinzler, K. W., andVelculescu, V. E. (2006) Science 314, 268–274
15. Weir, B. A., Woo, M. S., Getz, G., Perner, S., Ding, L., Beroukhim, R., Lin,W. M., Province, M. A., Kraja, A., Johnson, L. A., Shah, K., Sato, M.,Thomas, R. K., Barletta, J. A., Borecki, I. B., Broderick, S., Chang, A. C.,Chiang, D. Y., Chirieac, L. R., Cho, J., Fujii, Y., Gazdar, A. F., Giordano, T.,Greulich, H., Hanna, M., Johnson, B. E., Kris, M. G., Lash, A., Lin, L.,Lindeman,N.,Mardis, E. R.,McPherson, J. D.,Minna, J. D.,Morgan,M. B.,Nadel, M., Orringer, M. B., Osborne, J. R., Ozenberger, B., Ramos, A. H.,Robinson, J., Roth, J. A., Rusch, V., Sasaki, H., Shepherd, F., Sougnez, C.,Spitz, M. R., Tsao, M. S., Twomey, D., Verhaak, R. G., Weinstock, G. M.,Wheeler, D. A., Winckler, W., Yoshizawa, A., Yu, S., Zakowski, M. F.,Zhang, Q., Beer, D. G., Wistuba, II, Watson, M. A., Garraway, L. A., Lada-nyi, M., Travis, W. D., Pao, W., Rubin, M. A., Gabriel, S. B., Gibbs, R. A.,Varmus, H. E., Wilson, R. K., Lander, E. S., and Meyerson, M. (2007)Nature 450, 893–898
16. Wood, L.D., Parsons, D.W., Jones, S., Lin, J., Sjoblom,T., Leary, R. J., Shen,D., Boca, S. M., Barber, T., Ptak, J., Silliman, N., Szabo, S., Dezso, Z.,Ustyanksky, V., Nikolskaya, T., Nikolsky, Y., Karchin, R., Wilson, P. A.,Kaminker, J. S., Zhang, Z., Croshaw, R., Willis, J., Dawson, D., Shipitsin,M., Willson, J. K., Sukumar, S., Polyak, K., Park, B. H., Pethiyagoda, C. L.,Pant, P. V., Ballinger, D. G., Sparks, A. B., Hartigan, J., Smith, D. R., Suh, E.,Papadopoulos, N., Buckhaults, P., Markowitz, S. D., Parmigiani, G., Kin-zler, K. W., Velculescu, V. E., and Vogelstein, B. (2007) Science 318,1108–1113
17. Jones, S., Zhang, X., Parsons, D. W., Lin, J. C., Leary, R. J., Angenendt, P.,Mankoo, P., Carter, H., Kamiyama, H., Jimeno, A., Hong, S.M., Fu, B., Lin,M. T., Calhoun, E. S., Kamiyama, M.,Walter, K., Nikolskaya, T., Nikolsky,Y., Hartigan, J., Smith, D. R., Hidalgo, M., Leach, S. D., Klein, A. P., Jaffee,E. M., Goggins, M., Maitra, A., Iacobuzio-Donahue, C., Eshleman, J. R.,Kern, S. E., Hruban, R. H., Karchin, R., Papadopoulos, N., Parmigiani, G.,Vogelstein, B., Velculescu, V. E., and Kinzler, K. W. (2008) Science 321,1801–1806
18. Parsons, D. W., Jones, S., Zhang, X., Lin, J. C., Leary, R. J., Angenendt, P.,Mankoo, P., Carter, H., Siu, I. M., Gallia, G. L., Olivi, A., McLendon, R.,Rasheed, B. A., Keir, S., Nikolskaya, T., Nikolsky, Y., Busam,D.A., Tekleab,H., Diaz, L. A., Jr., Hartigan, J., Smith, D. R., Strausberg, R. L., Marie, S. K.,Shinjo, S. M., Yan, H., Riggins, G. J., Bigner, D. D., Karchin, R., Papado-poulos, N., Parmigiani, G., Vogelstein, B., Velculescu, V. E., and Kinzler,K. W. (2008) Science 321, 1807–1812
19. Lovasz, L. (1993) Bolyai Society Mathematical Studies 2, 1–4620. Geho, D., Lahar, N., Gurnani, P., Huebschman, M., Herrmann, P., Espina,
V., Shi, A., Wulfkuhle, J., Garner, H., Petricoin, E., 3rd, Liotta, L. A., andRosenblatt, K. P. (2005) Bioconjug. Chem. 16, 559–566
21. Geho, D. H., Killian, J. K., Nandi, A., Pastor, J., Gurnani, P., and Rosenblatt,K. P. (2007)Methods Mol. Biol. 374, 229–237
22. Kuijl, C., Savage, N. D.,Marsman,M., Tuin, A.W., Janssen, L., Egan, D. A.,Ketema,M., van denNieuwendijk, R., van den Eeden, S. J., Geluk, A., Poot,A., van derMarel, G., Beijersbergen, R. L., Overkleeft, H., Ottenhoff, T. H.,and Neefjes, J. (2007) Nature 450, 725–730
23. Swanton, C., Marani, M., Pardo, O., Warne, P. H., Kelly, G., Sahai, E.,Elustondo, F., Chang, J., Temple, J., Ahmed, A. A., Brenton, J. D., Down-ward, J., and Nicke, B. (2007) Cancer Cell 11, 498–512
24. Herbst, R. S., Fukuoka, M., and Baselga, J. (2004) Nat. Rev. Cancer 4,956–965
25. Sharma, S. V., Bell, D. W., Settleman, J., and Haber, D. A. (2007)Nat. Rev.Cancer 7, 169–181
26. Ding, L., Getz, G., Wheeler, D. A., Mardis, E. R., McLellan, M. D., Cibul-skis, K., Sougnez, C., Greulich, H., Muzny, D. M., Morgan, M. B., Fulton,L., Fulton, R. S., Zhang, Q., Wendl, M. C., Lawrence, M. S., Larson, D. E.,Chen, K., Dooling, D. J., Sabo, A., Hawes, A. C., Shen, H., Jhangiani, S. N.,Lewis, L. R., Hall, O., Zhu, Y., Mathew, T., Ren, Y., Yao, J., Scherer, S. E.,Clerc, K., Metcalf, G. A., Ng, B., Milosavljevic, A., Gonzalez-Garay, M. L.,Osborne, J. R., Meyer, R., Shi, X., Tang, Y., Koboldt, D. C., Lin, L., Abbott,R., Miner, T. L., Pohl, C., Fewell, G., Haipek, C., Schmidt, H., Dunford-Shore, B. H., Kraja, A., Crosby, S. D., Sawyer, C. S., Vickery, T., Sander, S.,Robinson, J.,Winckler,W., Baldwin, J., Chirieac, L. R., Dutt, A., Fennell, T.,Hanna,M., Johnson, B. E., Onofrio, R. C., Thomas, R. K., Tonon, G.,Weir,B. A., Zhao, X., Ziaugra, L., Zody, M. C., Giordano, T., Orringer, M. B.,Roth, J. A., Spitz, M. R., Wistuba, II, Ozenberger, B., Good, P. J., Chang,A. C., Beer, D. G., Watson, M. A., Ladanyi, M., Broderick, S., Yoshizawa,A., Travis, W. D., Pao, W., Province, M. A., Weinstock, G. M., Varmus,H. E., Gabriel, S. B., Lander, E. S., Gibbs, R. A., Meyerson, M., andWilson,R. K. (2008) Nature 455, 1069–1075
27. Hiraga, T., Ninomiya, T., Hosoya, A., Takahashi, M., and Nakamura, H.(2009) J. Bone Miner. Metab. 27, 149–157
28. Chen, H., Ma, J., Li, W., Eliseenkova, A. V., Xu, C., Neubert, T. A., Miller,W. T., and Mohammadi, M. (2007)Mol. Cell 27, 717–730
29. Guan, M., Xu, C., Zhang, F., and Ye, C. (2009) Int. J. Cancer 124, 88–9430. Wang, J., Kataoka, H., Suzuki, M., Sato, N., Nakamura, R., Tao, H., Ma-
ruyama, K., Isogaki, J., Kanaoka, S., Ihara, M., Tanaka, M., Kanamori, M.,Nakamura, T., Shinmura, K., and Sugimura, H. (2005) Oncogene 24,5637–5647
31. Bi, J., Lau, S. H., Hu, L., Rao, H. L., Liu, H. B., Zhan,W. H., Chen, G., Wen,J. M., Wang, Q., Li, B., and Guan, X. Y. (2009) Int. J. Cancer 124,1587–1593
32. Tuveson, D. A., Weber, B. L., and Herlyn, M. (2003) Cancer Cell 4, 95–9833. Ganesan, A. K., Ho, H., Bodemann, B., Petersen, S., Aruri, J., Koshy, S.,
Richardson, Z., Le, L. Q., Krasieva, T., Roth, M. G., Farmer, P., andWhite,M. A. (2008) PLoS Genet. 4, e1000298
34. Whitehurst, A. W., Bodemann, B. O., Cardenas, J., Ferguson, D., Girard,L., Peyton, M., Minna, J. D., Michnoff, C., Hao, W., Roth, M. G., Xie, X. J.,and White, M. A. (2007) Nature 446, 815–819
35. Wu, X., Fan, Z., Masui, H., Rosen, N., and Mendelsohn, J. (1995) J. Clin.Investig. 95, 1897–1905
36. Tagliabue, E., Balsari, A., Campiglio,M., and Pupa, S.M. (2010) Exp. Opin.Biol. Ther. 10, 711–724
37. Schlessinger, J. (2004) Science 306, 1506–150738. Miller, L. D., Smeds, J., George, J., Vega, V. B., Vergara, L., Ploner, A.,
Pawitan, Y., Hall, P., Klaar, S., Liu, E. T., and Bergh, J. (2005) Proc. Natl.Acad. Sci. U.S.A. 102, 13550–13555
39. Loi, S., Haibe-Kains, B., Desmedt, C., Lallemand, F., Tutt, A. M., Gillet, C.,Ellis, P., Harris, A., Bergh, J., Foekens, J. A., Klijn, J. G., Larsimont, D.,Buyse, M., Bontempi, G., Delorenzi, M., Piccart, M. J., and Sotiriou, C.(2007) J. Clin. Oncol. 25, 1239–1246
Mapping of Human Kinome to EGFR Signaling
21142 JOURNAL OF BIOLOGICAL CHEMISTRY VOLUME 285 • NUMBER 27 • JULY 2, 2010
by guest on May 2, 2016
http://ww
w.jbc.org/
Dow
nloaded from
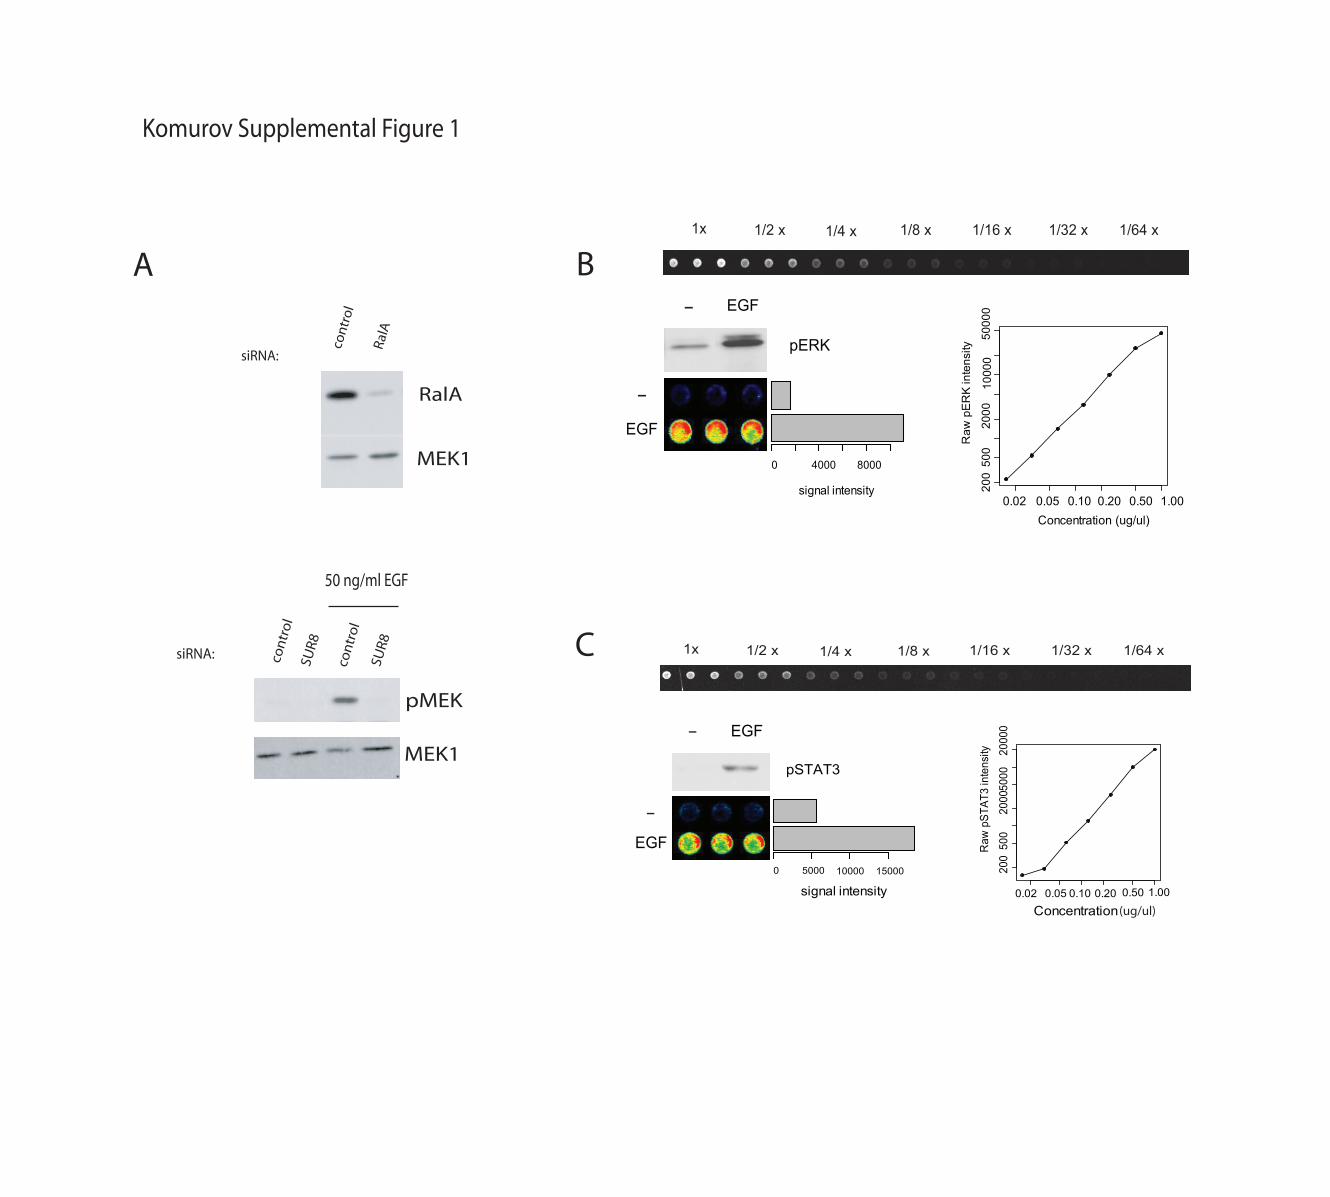
Supplemental Figure 1. Assay Development. A) A431 cells were transfected with the indicated
siRNAs. Whole cell lysates, prepared 72 hours post transfection, were immunobloted with the
indicated antibodies to monitor knockdown efficiency (top panel) and EGF responsiveness under
the conditions used for high-throughput screening (bottom panel). MEK1 is shown as a loading
control. siRNAs targeting Sur8 were used as a positive control for abrogation of EGF-induced
MEK1 activation (Rodriguez-Viciana et al, 2006). Non-targeting siRNAs were used to control
for consequences of siRNA delivery. B) Serial dilution analysis of reproducibility and linearity of
signal detection. Top panel: RPPA from a triplicate spotting of 7-point 2-fold dilution series of an
EGF-stimulated A431 sample and blotted with pERK. The false color image at the bottom left
shows pERK signal intensities in EGF stimulated and unstimulated samples. Bottom right: plot of
raw pERK intensity readings of the serially diluted sample above (averaged triplicate spots,
average coefficient of variation between spots ~6%), demonstrating a near 2 log linear range. C)
Same as in B for pSTAT3.
Supplemental Figure 2. Kinome siRNA screen plate map. Positions of control and test
wells used for al primary screen assay plates are shown.
Supplemental Figure 3. On-target/off-target analysis of representative hits. A) A431
cells were transfected with the indicated siRNAs or non-targeting siRNAs as controls
(mm). 72 hours post transfection, mRNA was isolated, and target mRNA accumulation
was measured by quantitative real-time rtPCR as previously described (20, 21). B) Each
of four independent siRNA sequences targeting the indicated genes were tested by RPPA
for consequences on EGF-induced STAT3 or ERK1/2 activation.
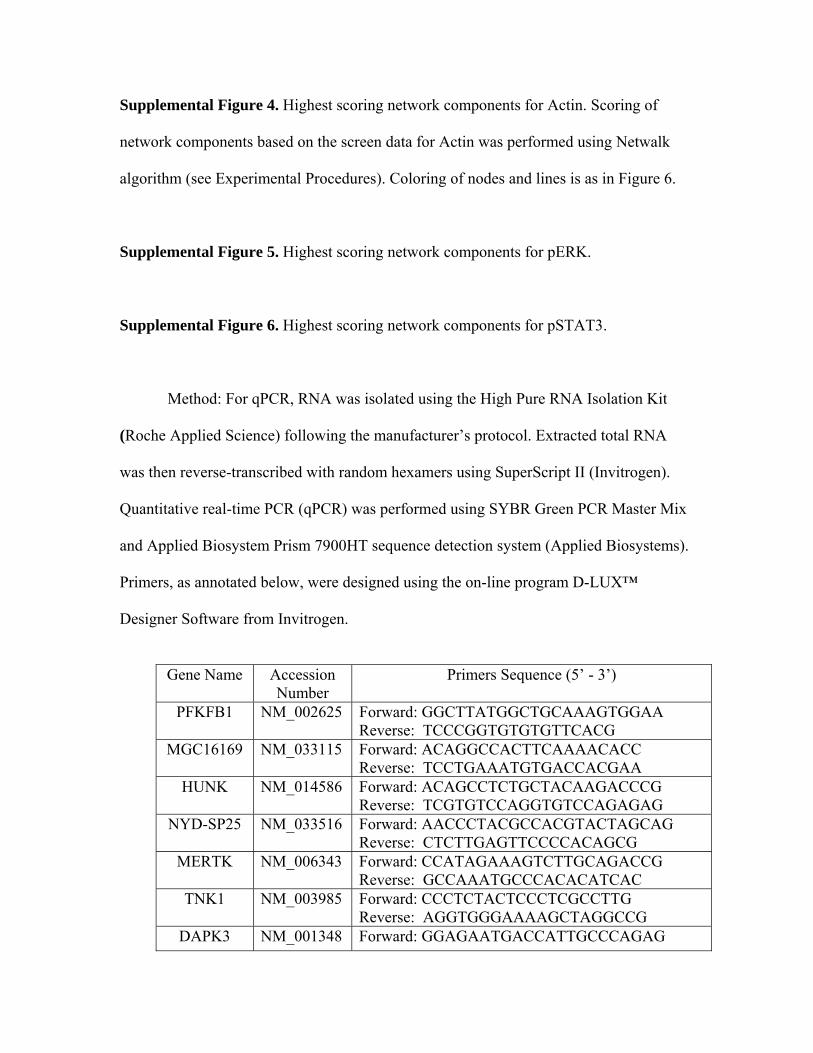
Supplemental Figure 4. Highest scoring network components for Actin. Scoring of
network components based on the screen data for Actin was performed using Netwalk
algorithm (see Experimental Procedures). Coloring of nodes and lines is as in Figure 6.
Supplemental Figure 5. Highest scoring network components for pERK.
Supplemental Figure 6. Highest scoring network components for pSTAT3.
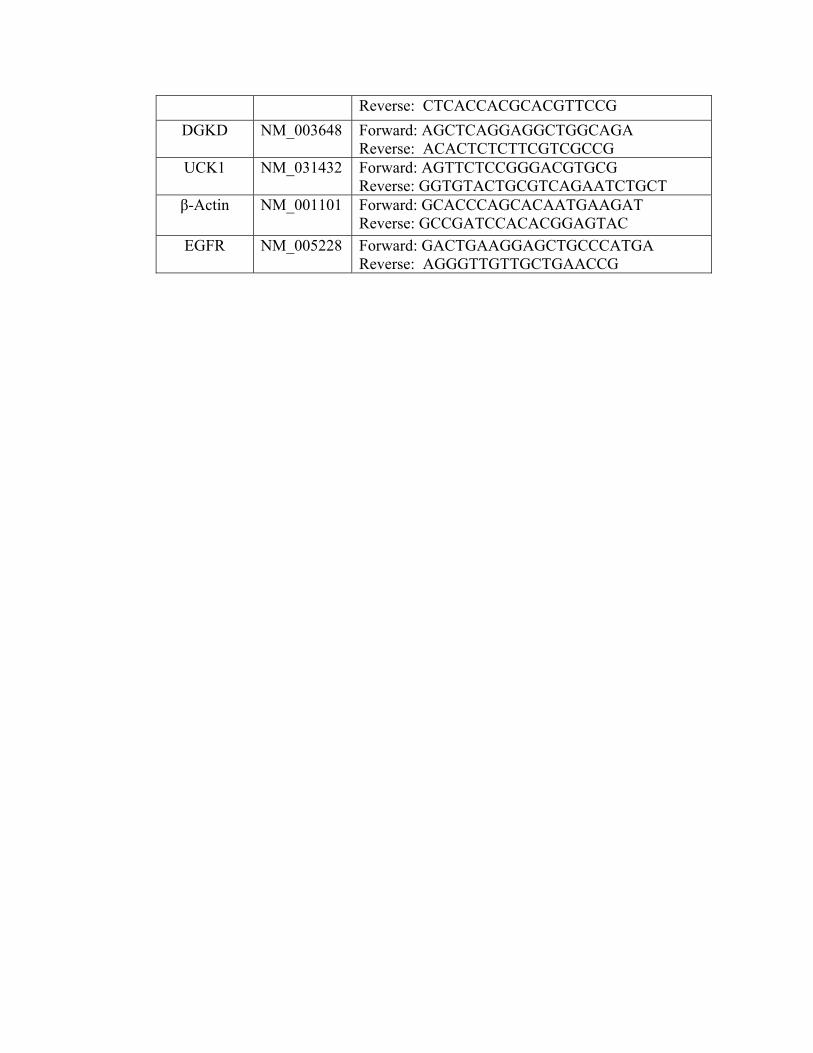
Method: For qPCR, RNA was isolated using the High Pure RNA Isolation Kit
(Roche Applied Science) following the manufacturer’s protocol. Extracted total RNA
was then reverse-transcribed with random hexamers using SuperScript II (Invitrogen).
Quantitative real-time PCR (qPCR) was performed using SYBR Green PCR Master Mix
and Applied Biosystem Prism 7900HT sequence detection system (Applied Biosystems).
Primers, as annotated below, were designed using the on-line program D-LUX™
Designer Software from Invitrogen.
Gene Name Accession
Number Primers Sequence (5’ - 3’)
PFKFB1 NM_002625 Forward: GGCTTATGGCTGCAAAGTGGAA Reverse: TCCCGGTGTGTGTTCACG
MGC16169
NM_033115
Forward: ACAGGCCACTTCAAAACACC Reverse: TCCTGAAATGTGACCACGAA
HUNK
NM_014586
Forward: ACAGCCTCTGCTACAAGACCCG Reverse: TCGTGTCCAGGTGTCCAGAGAG
NYD-SP25
NM_033516
Forward: AACCCTACGCCACGTACTAGCAG Reverse: CTCTTGAGTTCCCCACAGCG
MERTK
NM_006343
Forward: CCATAGAAAGTCTTGCAGACCG Reverse: GCCAAATGCCCACACATCAC
TNK1
NM_003985
Forward: CCCTCTACTCCCTCGCCTTG Reverse: AGGTGGGAAAAGCTAGGCCG
DAPK3 NM_001348 Forward: GGAGAATGACCATTGCCCAGAG
Reverse: CTCACCACGCACGTTCCG DGKD
NM_003648
Forward: AGCTCAGGAGGCTGGCAGA Reverse: ACACTCTCTTCGTCGCCG
UCK1
NM_031432
Forward: AGTTCTCCGGGACGTGCG Reverse: GGTGTACTGCGTCAGAATCTGCT
β-Actin
NM_001101
Forward: GCACCCAGCACAATGAAGAT Reverse: GCCGATCCACACGGAGTAC
EGFR
NM_005228
Forward: GACTGAAGGAGCTGCCCATGA Reverse: AGGGTTGTTGCTGAACCG
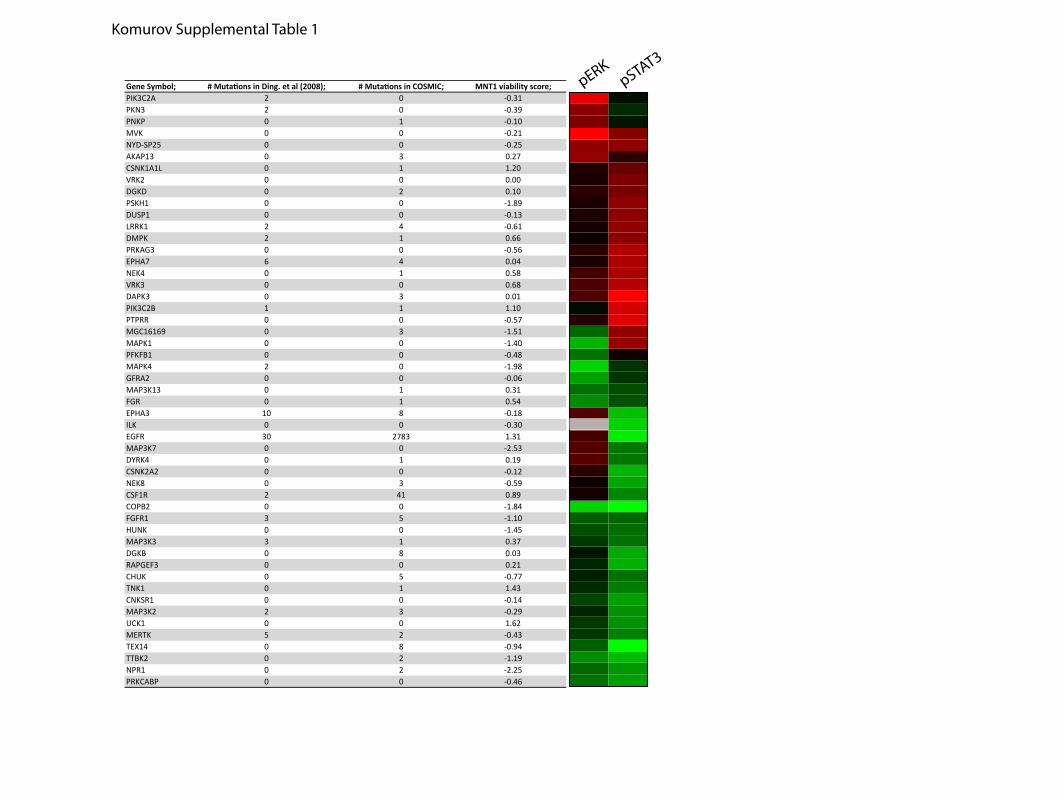
Gene Symbol; # Mutations in Ding. et al (2008); # Mutations in COSMIC; MNT1 viability score;PIK3C2A 2 0 -0.31PKN3 2 0 -0.39PNKP 0 1 -0.10MVK 0 0 -0.21NYD-SP25 0 0 -0.25AKAP13 0 3 0.27CSNK1A1L 0 1 1.20VRK2 0 0 0.00DGKD 0 2 0.10PSKH1 0 0 -1.89DUSP1 0 0 -0.13LRRK1 2 4 -0.61DMPK 2 1 0.66PRKAG3 0 0 -0.56EPHA7 6 4 0.04NEK4 0 1 0.58VRK3 0 0 0.68DAPK3 0 3 0.01PIK3C2B 1 1 1.10PTPRR 0 0 -0.57MGC16169 0 3 -1.51MAPK1 0 0 -1.40PFKFB1 0 0 -0.48MAPK4 2 0 -1.98GFRA2 0 0 -0.06MAP3K13 0 1 0.31FGR 0 1 0.54EPHA3 10 8 -0.18ILK 0 0 -0.30EGFR 30 2783 1.31MAP3K7 0 0 -2.53DYRK4 0 1 0.19CSNK2A2 0 0 -0.12NEK8 0 3 -0.59CSF1R 2 41 0.89COPB2 0 0 -1.84FGFR1 3 5 -1.10HUNK 0 0 -1.45MAP3K3 3 1 0.37DGKB 0 8 0.03RAPGEF3 0 0 0.21CHUK 0 5 -0.77TNK1 0 1 1.43CNKSR1 0 0 -0.14MAP3K2 2 3 -0.29UCK1 0 0 1.62MERTK 5 2 -0.43TEX14 0 8 -0.94TTBK2 0 2 -1.19NPR1 0 2 -2.25PRKCABP 0 0 -0.46
pERKpSTAT3
Komurov Supplemental Table 1
RalA
MEK1
siRNA:co
ntro
l
RalA
siRNA: con
tro
l
con
tro
l
pMEK
MEK1
50 ng/ml EGF
SUR8
SUR8
A1x 1/2 x 1/4 x 1/8 x 1/16 x 1/32 x 1/64 x
signal intensity
0 4000 8000
pERK
0.02 0.05 0.10 0.20 0.50 1.00
200
500
2000
1000
050
000
Concentration (ug/ul)
Raw
pE
RK
inte
nsity
-
-
B
1x 1/2 x 1/4 x 1/8 x 1/16 x 1/32 x 1/64 x
signal intensity0 5000 10000 15000
0.02 0.05 0.10 0.20 0.50 1.00
200
500
2000
5000
2000
0
Concentration
Raw
pST
AT3
inte
nsity
pSTAT3
-
-
C
EGF
EGF
EGF
EGF
Komurov Supplemental Figure 1
(ug/ul)
1 2 3 4 5 6 7 8 9 10 11 12ABCDEFGH
EGF (50 ng/ml)
Test siRNAs
Toxic siRNAs
Control siRNAs
Transfection reagent only
PLK1siTox
RISC-freeNon-targeting
GAPDH
Cells only
Plate Map
Komurov Supplemental Figure 2
A
B
Komurov Supplemental Figure 3
PKLR
PKM2
MVD
MVK
PMVK
UGP2
AK5
AK7
MAP2K3
PIK3CG
INSRR
PTPRG
TTK
IKBKB
TEC
EPHA8
MAPKAPK5
PTPRJ
SLK
IKBKE
PIP5K1A
TESK1
STK3
RFK
PIK3R2
PIK3R3
CDC20
MAPK8
RPS6KA1
SRC
PAK1
SYK
ERBB2
MAPK3
PRKCD
CRKL
TGFBR2
TGFBR1
ERBB4 CCNB1
SPHK1
ERBB3
TAF1
AKAP8
PFKL
ACVR1MET
PIK3C2A
PLK1
MST1R
ZAK
COPB2
PRKCZ
EEF2K
PKMYT1
ROCK1
YES1
Mevalonate metabolism
ERBB2/ ERBB3/ ERBB4complex
Komurov Supplemental Figure 4
MAPK3
MAPK6
PMVK
AK7
PFKFB4
CSK
FGFR1
CDKN2B
CSNK2A2
PIP5K1A
NEK7
MAP3K3PIK3C2G
PIK3R2
PIK3R3
CCND2
CCND3
E2F3
MAPK4
CCNE1
PRKACA
MAPK1
AKT1
SYK
RAC1
CDC25A
PRKCDPAK2
CRKL
CHEK1
NME1
FES
ALK
PIK3C2A
FGFR2
CDC7
PLK1
ADAM9
NPR1
RASGRF2
NEK9
COPB2
MARK2
AK1
PAPSS2
JAK3
CHUK
ADRBK1
CCNA1
MAP3K4
ABL2
CCNB1
MAPK / PKA signaling
Komurov Supplemental Figure 5
DGUOK
MVK
PIK3C2B
UCK1
FGFR1
DGKB
PFTK1
CSNK2A2
PIP5K1A
MAP3K2
DYRK4TEX14
PAK4
MAP3K3
PIK3R3
CHKB
CCND2
CDT1
ORC1L
CCNE1CCNA2
MAPK1
PAK1
LYN
CDC25ACDK2
EGFR
MAP3K7
MAPK12
CCNB1
ALK
PIK3C2A
MCM3
PLK1
COPB2PCTK3
LRRK1CHUK
CDK4
PTPRR
RAC1
PKIA
EEF2K
Nucleotide kinases
Cell Cycle
EGFR / MAPK signaling
Komurov Supplemental Figure 6
and Michael A. WhiteKakajan Komurov, David Padron, Tzuling Cheng, Michael Roth, Kevin P. Rosenblatt
Receptor SignalingComprehensive Mapping of the Human Kinome to Epidermal Growth Factor
doi: 10.1074/jbc.M110.137828 originally published online April 26, 20102010, 285:21134-21142.J. Biol. Chem.
10.1074/jbc.M110.137828Access the most updated version of this article at doi:
Alerts:
When a correction for this article is posted•
When this article is cited•
to choose from all of JBC's e-mail alertsClick here
Supplemental material:
http://www.jbc.org/content/suppl/2010/04/26/M110.137828.DC1.html
http://www.jbc.org/content/285/27/21134.full.html#ref-list-1
This article cites 39 references, 13 of which can be accessed free at
by guest on May 2, 2016
http://ww
w.jbc.org/
Dow
nloaded from