Comprehensive EndStage Renal Disease Care (CEC) Model
193
Comprehensive EndStage Renal Disease Care (CEC) Model Fifth Annual Evaluation Report Contract #: HHSM-500-2014-00033I Task Order No. HHSM-500-T0001 Prepared for: Centers for Medicare & Medicaid Services Submitted by: The Lewin Group, Inc. January 2022
-
Upload
khangminh22 -
Category
Documents
-
view
0 -
download
0
Transcript of Comprehensive EndStage Renal Disease Care (CEC) Model

Comprehensive EndStage Renal Disease Care (CEC) Model
Fifth Annual Evaluation Report
Contract #: HHSM-500-2014-00033I Task Order No. HHSM-500-T0001
Prepared for:
Centers for Medicare & Medicaid Services
Submitted by:
The Lewin Group, Inc.
January 2022

Fifth Annual Report CEC Evaluation
i
Comprehensive End-Stage Renal Disease Care (CEC) Model
Fifth Annual Evaluation Report
January 2022
The Lewin GroupAuthors:
Grecia Marrufo, Brighita Negrusa, Darin Ullman, Richard Hirth,1 Claudia Dahlerus,1 Jennifer Wiens, Ariana Ackerman, Daniel Gregory, Kelsey Bacon,
Jonathan Segal,1 Yi Li,1 Tammie Nahra,1 Amy Jiao,1 Joseph Gunden,1 Kathryn Sleeman,1 Daniel Strubler, Katherine B. McKeithen,2 and Rebecca Braun
Lewin’s address:3160 Fairview Park Dr., Suite 600, Falls Church, VA 22042
Federal Project Officer:Gregory Boyer, PhD
Division of Data, Research, and Analytic Methods (DRAM)Research and Rapid Cycle Evaluation Group (RREG),Center for Medicare & Medicaid Innovation (CMMI),
Centers for Medicare & Medicaid Services (CMS)
The statements contained in this report are solely those of the authors and do not necessarily reflect the views or policies of the Centers for Medicare & Medicaid Services. The Lewin Group assumes responsibility for the accuracy
and completeness of the information contained in this report.
1 University of Michigan, Kidney Epidemiology and Cost Center (KECC)2 Independent Contractor
Fifth Annual Report CEC Evaluation
ii
Table of Contents
GLOSSARY OF TERMS ...................................................................................................... 1
EXECUTIVE SUMMARY .................................................................................................... 4ES.1. Introduction ..............................................................................................................4ES.2. Overview of Findings ...............................................................................................6
ES.2.1. Who Participates in the CEC Model?........................................................... 8ES.2.2. What Were the Impacts of the CEC Model? .................................................. 9ES.2.3. Were There Unintended Consequences of the CEC Model? ........................ 16
ES.3. Discussion .............................................................................................................. 16
1. INTRODUCTION ......................................................................................................... 191.1. Research Questions................................................................................................. 20
1.1.1. Who Participated in the CEC Model? ........................................................ 221.1.2. What Were the Impacts of the CEC Model? ................................................ 221.1.3. Were There Unintended Consequences of the CEC Model? ........................ 24
2. WHO PARTICIPATED IN THE CEC MODEL?......................................................... 252.1. Key Findings .......................................................................................................... 272.2. Methods ................................................................................................................. 272.3. Results ................................................................................................................... 28
2.3.1. What Were the Characteristics of CEC Facilities? ..................................... 282.3.2. What Were the Characteristics of CEC Markets? ....................................... 302.3.3. What was the Extent of ESCO Owner Nephrologist Participation?.............. 33
2.4. Discussion .............................................................................................................. 36
3. WHAT WERE THE IMPACTS OF THE CEC MODEL? ........................................... 373.1. Key Findings .......................................................................................................... 373.2. Methods ................................................................................................................. 383.3. Results ................................................................................................................... 43
3.3.1. What Was the Impact of CEC on Dialysis Care? ........................................ 433.3.2. What Was the Impact of CEC on the Coordination of Care beyond
Dialysis?................................................................................................... 583.3.3. What Was the Impact of CEC on Hospitalizations and Emergency
Department Visits? .................................................................................... 673.3.4. What Was the Impact of the CEC Model on Survival?................................. 753.3.5. What Was the Impact of CEC on Medicare Payments across the
Continuum of Care? .................................................................................. 773.3.6. What Was the Impact of CEC on Medicare Beneficiary Subpopulations? .... 853.3.7. What Were the Differences in Performance Between the CEC Model and
Primary Care-Based ACO Models? ........................................................... 883.4. Discussion .............................................................................................................. 89
Fifth Annual Report CEC Evaluation
iii
4. DID THE CEC MODEL HAVE UNINTENDED CONSEQUENCES? ........................ 914.1. Key Findings .......................................................................................................... 914.2. Methods ................................................................................................................. 914.3. Results ................................................................................................................... 91
4.3.1. What Was the Impact of CEC on Medicare Part D Drug Costs? ................. 924.3.2. Was there Evidence of Adverse Selection within CEC Facilities? ................ 944.3.3. What Was the CEC Model’s Impact on Transplant Waiting List Activity?.... 94
4.4. Discussion .............................................................................................................. 95
5. DISCUSSION ................................................................................................................ 96
APPENDIX A: CEC WAIVERS .................................................................................... 100
APPENDIX B: CEC EVALUATION LOGIC MODEL ................................................ 102
APPENDIX C: SITE VISIT METHODOLOGY ........................................................... 103C.1. Facility Selection Criteria...................................................................................... 103C.2. Data Collection Procedures ................................................................................... 104C.3. Protocol Development........................................................................................... 104C.4. Analysis ............................................................................................................... 105
APPENDIX D: DIFFERENCE-IN-DIFFERENCES APPROACH ............................... 106D.1. Data and Outcome Measures ................................................................................. 107D.2. Participant Characteristics ..................................................................................... 114D.3. Comparison Group Construction ........................................................................... 117
D.3.1. Identifying CEC Facilities ....................................................................... 117D.3.2. Selecting Facilities Eligible to be Included in the Comparison Group Pool 118D.3.3. Statistical Matching Approach ................................................................. 119D.3.4. Comparison Group Changes between the Fourth Annual Report and the
Fifth Annual Report................................................................................. 127D.4. Beneficiary Alignment and Eligibility ................................................................... 127D.5. CEC and Comparison Group Populations .............................................................. 130D.6. COVID-19 Public Health Emergency Model Adjustments and Bias Mitigation
Approaches .......................................................................................................... 132D.7. DiD Regression Model and Estimated CEC Impacts .............................................. 136
APPENDIX E: POWER CALCULATION METHODOLOGY.................................... 168
APPENDIX F: BENEFICIARY FOCUS GROUP METHODOLOGY......................... 170F.1. Selection Criteria and Beneficiary Recruitment ...................................................... 170F.2. Data Collection and Analysis ..................................................................................... 170

Fifth Annual Report CEC Evaluation
iv
APPENDIX G: MORTALITY ANALYSIS ................................................................... 172G.1. Data and Outcome Measures ................................................................................. 172G.2. CEC and Comparison Group Populations .............................................................. 173G.3. Survival Models and Estimated CEC Impact.......................................................... 173
G.3.1. Estimation Results ................................................................................... 175G.4. Model Diagnostics ................................................................................................ 186
Fifth Annual Report CEC Evaluation
1
Glossary of Terms
Acronym DefinitionACH acute care hospital ACO accountable care organizationACSC Ambulatory Care Sensitive ConditionAdvanced APM Advanced Alternative Payment ModelAHRF Area Health Resource FileAHRQ Agency for Healthcare Research and QualityAR2 second annual reportAR3 third annual reportAR4 fourth annual reportAR5 fifth annual reportAV arteriovenousBETOS Berenson-Eggers Type of ServicesBMI body mass indexCBSA Core-Based Statistical AreaCCN CMS Certification NumberCCW Chronic Conditions Data WarehouseCDC Centers for Dialysis CareCEC Comprehensive End-Stage Renal Disease (ESRD) Care CHF congestive heart failureCKD chronic kidney diseaseCME Common Medicare EnvironmentCMMI Center for Medicare & Medicaid InnovationCMS Centers for Medicare & Medicaid ServicesCNU Care Navigation UnitCROWNWeb Consolidated Renal Operations in a Web-enabled NetworkCVA cerebrovascular accidentCY calendar yearDCI Dialysis Clinic, Inc.DiD difference-in-differencesDOPPS Dialysis Outcomes and Practice Patterns StudyE/M Evaluation and ManagementED emergency departmentEHR electronic health recordESCO ESRD Seamless Care OrganizationESRD end-stage renal diseaseFAI Financial Alignment InitiativeFFS fee-for-serviceHbA1c hemoglobin A1cHRQOL health-related quality of l ifeHCC Hierarchical Condition CategoryHCPCS Healthcare Common Procedure Coding SystemHR hazard ratioIAH Independence at HomeICC intra-cluster correlation coefficientsICD-9 International Classification of Disease, 9th Revision
Fifth Annual Report CEC Evaluation
2
Acronym DefinitionICD-10 International Classification of Disease, 10th RevisionICH CAHPS® In-Center Hemodialysis Consumer Assessment of Healthcare Providers and SystemsIT information technologyKCC Kidney Care ChoicesKDQOL-36 Kidney Disease Quality of LifeLASSO Least Absolute Shrinkage and Selection OperatorLDL low-density l ipoproteinLDO large dialysis organizationMA Medicare AdvantageMACRA Medicare Access and CHIP Reauthorization ActMBSF Master Beneficiary Summary FileMDS Long Term Care Minimum Data SetMIPS Merit-Based Incentive Payment SystemML machine learningMME morphine milligram equivalentNKC Northwest Kidney Centersnon-LDO non-large dialysis organizationNQF National Quality ForumONS oral nutritional supplementsOREC Original Reason for Entitlement CodeP4P Pay-for-PerformancePAC post-acute carePBPM per beneficiary per monthPCP primary care providerPH proportional hazardsPHE Public Health Emergency PPS Prospective Payment SystemPPT percentage pointsPQI Prevention Quality IndicatorPSM propensity score matchingPY performance yearPY1 performance year one (October 1, 2015 through December 31, 2016)PY2 performance year two (January 1, 2017 to December 31, 2017)PY3 performance year three (January 1, 2018 to December 31, 2018)PY4 performance year four (January 1, 2019 to December 31, 2019)
PY5 performance year five (January 1, 2020 to December 31, 2021 -12 months) or (January 1, 2020 to March 31, 2021 -15 months, signed COVID-19 extension
Q-Q quantile-quantileQIP Quality Incentive ProgramREMIS Renal Management Information SystemSE standard errorSHR standardized hospitalization ratioSMD standardized mean differenceSMR standardized mortality ratioSNF skilled nursing facilitySRR standardized readmission ratioSSP Shared Savings Program

Fifth Annual Report CEC Evaluation
3
Acronym DefinitionTIA transient ischemic attackTOC transition of careTQS Total Quality ScoreU.S. United StatesUSRDS U.S. Renal Data SystemVRDC Virtual Research Data Center

Fifth Annual Report CEC Evaluation
4
Executive SummaryES.1. Introduction
Medicare beneficiaries with end-stage renal disease (ESRD) are a medically complex group that requires significantly more resources than the general Medicare population. In 2018, less than 1% of the fee-for-service (FFS) Medicare beneficiary population had ESRD, yet they accounted for 7% of FFS Medicare payments.3 Beneficiaries with ESRD have more frequent and longer hospitalizations than other beneficiaries and their readmission rates are more than twice that of the general Medicare population.
To provide better care for Medicare beneficiaries with ESRD, the Centers for Medicare & Medicaid Services (CMS) launched the Comprehensive ESRD Care (CEC) Model in 2015 under the authority of the Center for Medicare & Medicaid Innovation (CMMI). The CEC Model is an Advanced Alternative Payment Model (Advanced APM) that creates financial incentives for dialysis facilities, nephrologists, and other Medicare providers to coordinate care for Medicare beneficiaries with ESRD. The model is designed to improve clinical and patient-centered outcomes for Medicare beneficiaries with ESRD while promoting value and reducing per-capita payments.
The CEC Model expands the reach of recent value-based payment initiatives targeting dialysis-related care such as the ESRD Prospective Payment System (ESRD PPS) and the ESRD Quality Incentive Program (ESRD QIP). Under the CEC Model, dialysis facilities, nephrologists, and other providers partner to form ESRD Seamless Care Organizations (ESCOs). ESCOs are specialty-oriented accountable care organizations (ACOs) that assume financial responsibility for the quality of care and Medicare Part A and Part B payments for their aligned beneficiaries. The ESCOs joined the model in two waves: Wave 1 joined the model on October 1, 2015, and Wave 2 ESCOs joined on January 1, 2017. Both Wave 1 and Wave 2 ESCOs could add or drop facilities annually after joining the model, which ran five consecutive performance years (PYs) from October 2015 to March 2021. This report contains results for all PYs from October 2015 to December 2020, and, in particular, includes the period from January 1, 2020, through December 31, 2020, during the COVID-19 pandemic.4
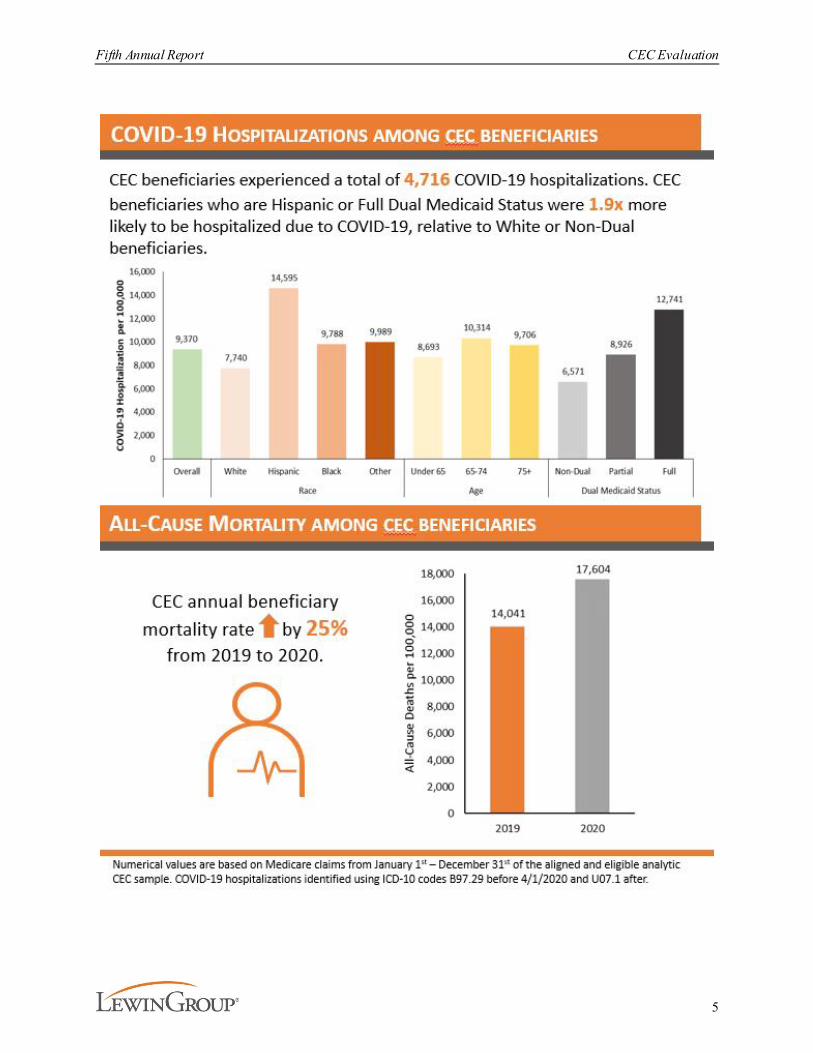
Medicare beneficiaries with ESRD were disproportionately impacted by COVID-19 in PY5 (2020). Individuals with ESRD were nearly six times more likely to be hospitalized than other Medicare beneficiaries.5 Descriptive statistics on COVID-19 incidence, hospitalizations, and overall mortality among beneficiaries aligned with the CEC Model and included in the evaluation are provided in the infographic below. In addition to an increased number of hospitalizations, in-person evaluation and management (E/M) visits decreased while telehealth visits increased in PY5 among beneficiaries aligned with the CEC Model. 3 United States Renal Data System. (2020). 2020 USRDS annual data report: Epidemiology of kidney disease in the
United States. National Institutes of Health, National Institute of Diabetes and Digestive and Kidney Diseases. https://adr.usrds.org/2020
4 The model includes an optional three-month extension through March 2021 that is not included in this evaluation due to the lack of availability of data at the time the analysis for this report was conducted. A total of 26 out of the 33 participating ESCOs extended their participation through March 2021.
5 Centers for Medicare & Medicaid Services (2021). Preliminary Medicare COVID-19 data snapshots services through 2020-12-26. https://www.cms.gov/research-statistics-data-systems/preliminary-medicare-covid-19-data-snapshot
Fifth Annual Report CEC Evaluation
5
Fifth Annual Report CEC Evaluation
6
In response to the COVID-19 pandemic, CMS made changes to the CEC Model including removing beneficiary months associated with inpatient COVID-19 hospitalizations from ESCO reconciliation calculations and providing ESCOs with the option to extend participation through March 2021. Twenty-six of the thirty-three ESCOs opted to extend their participation in the CEC Model. The evaluation, however, only includes the first 12 months of PY5. To align with CMS changes to the CEC Model and to mitigate bias due to COVID-19 we modified the evaluation impact estimation model. Specifically, COVID-19 inpatient episodes were removed from the analysis and COVID-19 related risk adjustment factors were added to the regression model. Both adjustments were implemented to account for variation in the timing and intensity of the pandemic between CEC and the comparison group. The analyses and methodologies supporting these COVID-19 impact mitigation strategies are detailed in Appendices D and G.
This fifth and final annual report (AR5), with combined findings from qualitative and quantitative analyses, addresses central evaluation research questions. Qualitative analyses from site visits with ESCOs in the first four PYs addressed ESCO partnerships, care redesign strategies, and perceived successes and challenges as well as beneficiary perceptions. Quantitative methods and analyses addressed the impact of the CEC Model on dialysis care, beneficiary experience of care and quality of life, coordination of care beyond dialysis, hospitalizations, emergency department (ED) visits, Medicare payments across the continuum of care, and patient survival. This final report provides updates to estimates for a core set of outcomes key to care or with interesting patterns and also discusses findings from previous reports to provide context to the latest findings and a more comprehensive picture of the model impacts as a whole. This report also highlights analysis of rescheduling of missed treatments, an important strategy that was consistently noted in the site visit interviews.
ES.2. Overview of Findings
Enrollment in the CEC Model was completed in two phases at or near the start of the model. A total of 13 (Wave 1) and 24 (Wave 2) ESCOs joined the CEC Model in PY1 and PY2 respectively, which brought the final number of participating ESCOs to 37. ESCOs added facilities throughout the PYs. By PY5, 33 ESCOs remained in the model, consisting of 17% of dialysis facilities in the United States (U.S.), and 13% of ESRD FFS beneficiaries were aligned to ESCOs. CEC facilities were located in 32 states and Washington, D.C.
Overall, the CEC Model showed modest but statistically significant results over the five performance years, with improvements on some quality and health care utilization measures as well as a decrease in total payments (see Exhibit ES-1 for a summary of the evaluation findings). The magnitudes of these improvements were generally larger in PY1 and PY2 than in later years and were larger in Wave 1 ESCOs than Wave 2 ESCOs. ESCO performance on several clinical and cost measures for PY5 continued to exceed that of a matched comparison group, yet these improvements were generally smaller than those seen in earlier performance years. For example, reductions in total payments were $143 per beneficiary per month (PBPM) in PY1 but decreased to $78 PBPM for all ESCOs by PY5. The CEC Model resulted in an estimated $217 million aggregate reduction in total Medicare Part A and B payments over the five PYs (October 2015 - December 2020).6 Throughout all performance years, this reduction in 6 These aggregate reductions in payments do not account for the financial reconciliation payments between ESCOs
and CMS.
Fifth Annual Report CEC Evaluation
7
payments was primarily generated through a decrease in hospitalizations and readmissions. The number of hospitalizations and the percent of beneficiaries with at least one readmission decreased 3% and 2% across the five performance years, respectively. Additionally, ESCOs reported various interventions to improve quality of dialysis care and adherence to dialysis. These interventions resulted in lower use of a catheter (the least preferred form of vascular access) for 90 days or longer, an increase in the number of outpatient dialysis sessions, and a decrease in payments and hospitalizations for ESRD-related complications (such as fluid overload or pulmonary edema). The CEC Model also showed a modest improvement in patient survival relative to the comparison group, especially among patients aligned to CEC during their first year of dialysis. Survival analysis was added to the evaluation in response to early observations of favorable trends in the Standardized Mortality Ratio (SMR) in the CEC population as well as the emergence of longer average time since start of dialysis in CEC than in the matched comparison group.
The evaluation also provided evidence that the CEC Model performed better for beneficiaries with ESRD than primary care-based ACOs during the first year of alignment. Spending and utilization outcomes improved under the CEC Model, whereas primary care-based ACOs showed no evidence of improved outcomes or reduced payments for beneficiaries with ESRD.7
7 See the fourth annual report (AR4) for further discussion of the ACO analysis and methods for PY1-PY4.

Fifth Annual Report CEC Evaluation
8
Exhibit ES-1. Summary of Evaluation Findings
Notes: È boxes indicate measures with a statistically significant decrease; Ç boxes indicate measures with a statistically significant increase. Each impact estimate is based on a differences-in-differences (DiD) analysis and reflects the difference in the regression-adjusted mean outcome for beneficiaries in CEC facilit ies in the intervention period and pre-CEC period relative to the same difference over time for beneficiaries in matched comparison facilities. Significance identified with p-values < 0.10. Impacts for all ESCOs across PY1-PY5, through December 2020, unless the measure is noted with a * which identifies statistically significant impacts for all ESCOs across PY1-PY4. We evaluated the impact of the CEC Model on the number of events per month on the following outcomes: hospitalizations, ED visits, observation stays, circulatory and infectious inpatient hospitalizations. For all other measures under this domain, we only explored the impact of the CEC Model on the odds of experiencing at least one event in a given month.
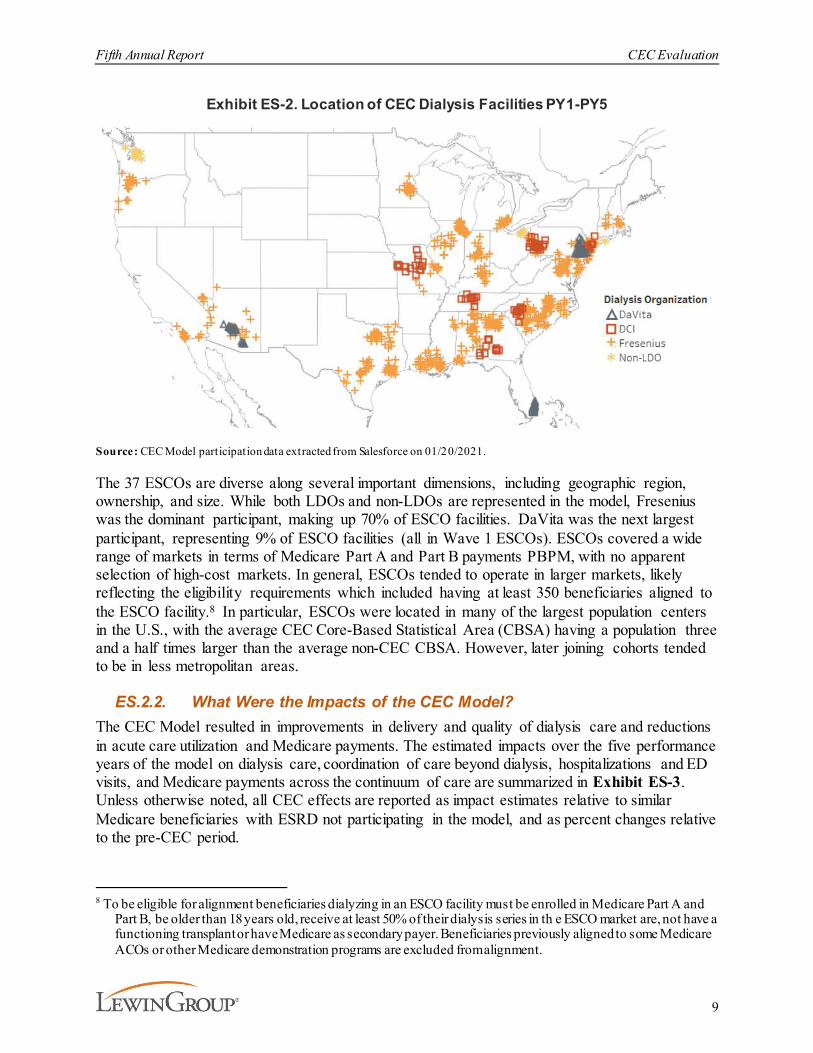
ES.2.1. Who Participates in the CEC Model?Thirty-seven ESCOs, representing three large dialysis organizations (LDOs), defined as those having 200 or more dialysis facilities (DaVita, Fresenius, and Dialysis Clinic, Inc. [DCI]), and four non-LDOs (Rogosin Institute, Atlantic Dialysis, Centers for Dialysis Care [CDC], and Northwest Kidney Centers [NKC]), participated in the CEC Model during PY1-PY5. Of these 37 ESCOs, 13 joined the CEC Model on October 1, 2015 as Wave 1 ESCOs, 24 ESCOs joined the CEC Model as Wave 2 ESCOs on January 1, 2017, and four ESCOs left the model in PY4. Collectively, these ESCOs had 1,290 dialysis facilities participate at some point during the five-year evaluation with 80 facilities added in PY5, and were spread across 32 states and Washington, D.C. The locations of participating facilities are shown in Exhibit ES-2.
Fifth Annual Report CEC Evaluation
9
Exhibit ES-2. Location of CEC Dialysis Facilities PY1-PY5
Source: CEC Model participation data extracted from Salesforce on 01/20/2021.
The 37 ESCOs are diverse along several important dimensions, including geographic region, ownership, and size. While both LDOs and non-LDOs are represented in the model, Fresenius was the dominant participant, making up 70% of ESCO facilities. DaVita was the next largest participant, representing 9% of ESCO facilities (all in Wave 1 ESCOs). ESCOs covered a wide range of markets in terms of Medicare Part A and Part B payments PBPM, with no apparent selection of high-cost markets. In general, ESCOs tended to operate in larger markets, likely reflecting the eligibility requirements which included having at least 350 beneficiaries aligned to the ESCO facility.8 In particular, ESCOs were located in many of the largest population centers in the U.S., with the average CEC Core-Based Statistical Area (CBSA) having a population three and a half times larger than the average non-CEC CBSA. However, later joining cohorts tended to be in less metropolitan areas.
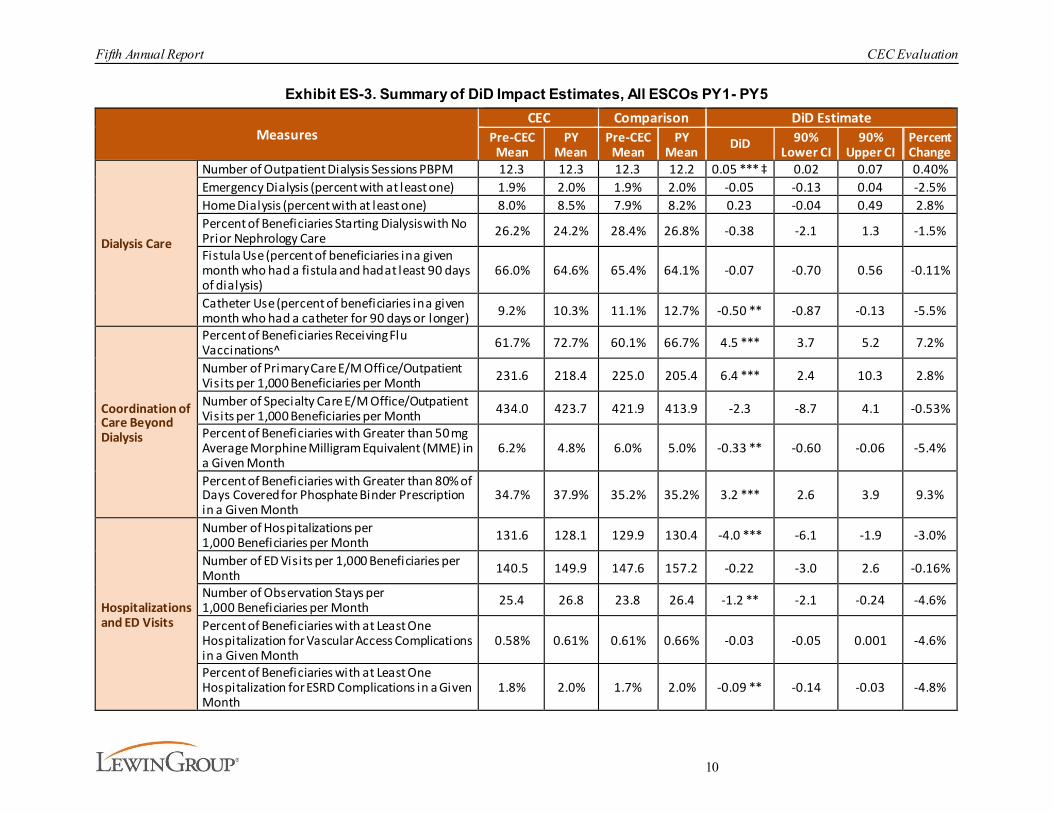
ES.2.2. What Were the Impacts of the CEC Model? The CEC Model resulted in improvements in delivery and quality of dialysis care and reductions in acute care utilization and Medicare payments. The estimated impacts over the five performance years of the model on dialysis care, coordination of care beyond dialysis, hospitalizations and ED visits, and Medicare payments across the continuum of care are summarized in Exhibit ES-3. Unless otherwise noted, all CEC effects are reported as impact estimates relative to similar Medicare beneficiaries with ESRD not participating in the model, and as percent changes relative to the pre-CEC period.
8 To be eligible for alignment beneficiaries dialyzing in an ESCO facility must be enrolled in Medicare Part A and
Part B, be older than 18 years old, receive at least 50% of their dialysis series in th e ESCO market are, not have a functioning transplant or have Medicare as secondary payer. Beneficiaries previously aligned to some Medicare ACOs or other Medicare demonstration programs are excluded from alignment.
Fifth Annual Report CEC Evaluation
10
Exhibit ES-3. Summary of DiD Impact Estimates, All ESCOs PY1- PY5
MeasuresCEC Comparison DiD Estimate
Pre-CEC Mean
PY Mean
Pre-CEC Mean
PY Mean DiD 90%
Lower CI90%
Upper CIPercent Change
Dialysis Care
Number of Outpatient Dialysis Sessions PBPM 12.3 12.3 12.3 12.2 0.05 *** ‡ 0.02 0.07 0.40%Emergency Dialysis (percent with at least one) 1.9% 2.0% 1.9% 2.0% -0.05 -0.13 0.04 -2.5%Home Dialysis (percent with at least one) 8.0% 8.5% 7.9% 8.2% 0.23 -0.04 0.49 2.8%Percent of Beneficiaries Starting Dialysis with No Prior Nephrology Care 26.2% 24.2% 28.4% 26.8% -0.38 -2.1 1.3 -1.5%
Fistula Use (percent of beneficiaries in a given month who had a fistula and had at least 90 days of dialysis)
66.0% 64.6% 65.4% 64.1% -0.07 -0.70 0.56 -0.11%
Catheter Use (percent of beneficiaries in a given month who had a catheter for 90 days or longer) 9.2% 10.3% 11.1% 12.7% -0.50 ** -0.87 -0.13 -5.5%
Coordination of Care Beyond Dialysis
Percent of Beneficiaries Receiving Flu Vaccinations^ 61.7% 72.7% 60.1% 66.7% 4.5 *** 3.7 5.2 7.2%
Number of Primary Care E/M Office/Outpatient Visits per 1,000 Beneficiaries per Month 231.6 218.4 225.0 205.4 6.4 *** 2.4 10.3 2.8%
Number of Specialty Care E/M Office/Outpatient Visits per 1,000 Beneficiaries per Month 434.0 423.7 421.9 413.9 -2.3 -8.7 4.1 -0.53%
Percent of Beneficiaries with Greater than 50 mg Average Morphine Milligram Equivalent (MME) in a Given Month
6.2% 4.8% 6.0% 5.0% -0.33 ** -0.60 -0.06 -5.4%
Percent of Beneficiaries with Greater than 80% of Days Covered for Phosphate Binder Prescription in a Given Month
34.7% 37.9% 35.2% 35.2% 3.2 *** 2.6 3.9 9.3%
Hospitalizations and ED Visits
Number of Hospitalizations per 1,000 Beneficiaries per Month 131.6 128.1 129.9 130.4 -4.0 *** -6.1 -1.9 -3.0%
Number of ED Visits per 1,000 Beneficiaries per Month 140.5 149.9 147.6 157.2 -0.22 -3.0 2.6 -0.16%
Number of Observation Stays per 1,000 Beneficiaries per Month 25.4 26.8 23.8 26.4 -1.2 ** -2.1 -0.24 -4.6%
Percent of Beneficiaries with at Least One Hospitalization for Vascular Access Complications in a Given Month
0.58% 0.61% 0.61% 0.66% -0.03 -0.05 0.001 -4.6%
Percent of Beneficiaries with at Least One Hospitalization for ESRD Complications in a Given Month
1.8% 2.0% 1.7% 2.0% -0.09 ** -0.14 -0.03 -4.8%
Fifth Annual Report CEC Evaluation
11
MeasuresCEC Comparison DiD Estimate
Pre-CEC Mean
PY Mean
Pre-CEC Mean
PY Mean DiD 90%
Lower CI90%
Upper CIPercent Change
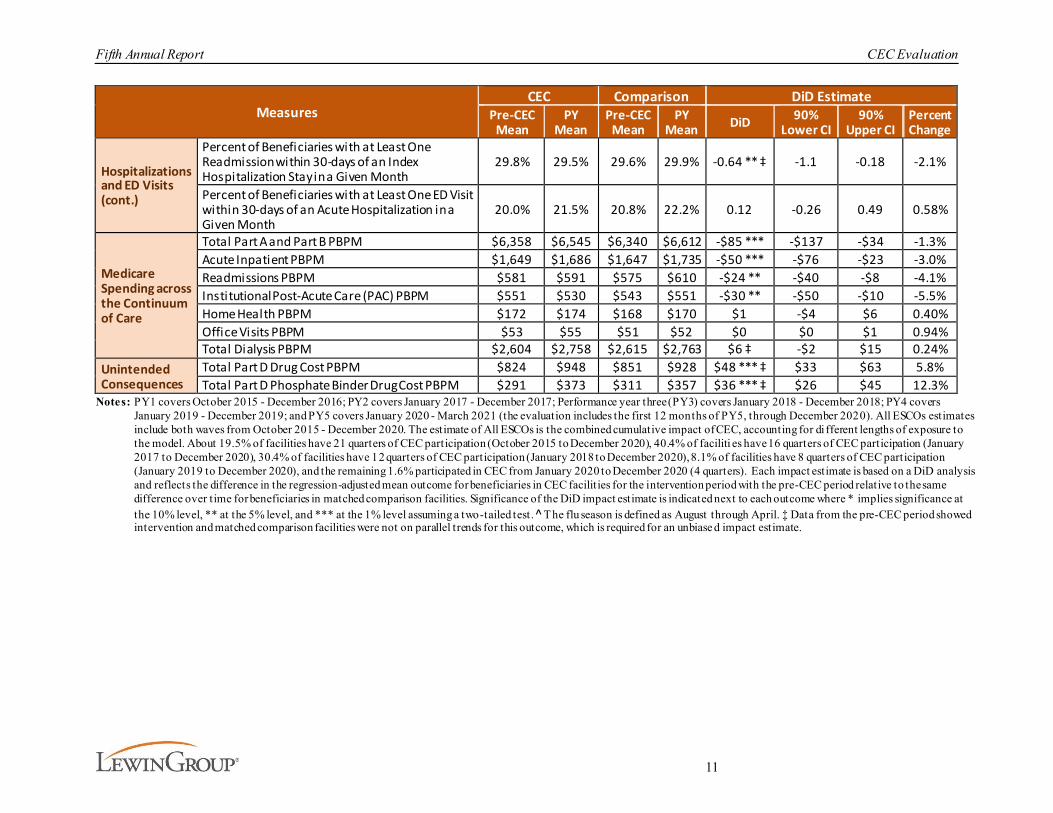
Hospitalizations and ED Visits (cont.)
Percent of Beneficiaries with at Least One Readmission within 30-days of an Index Hospitalization Stay in a Given Month
29.8% 29.5% 29.6% 29.9% -0.64 ** ‡ -1.1 -0.18 -2.1%
Percent of Beneficiaries with at Least One ED Visit within 30-days of an Acute Hospitalization in a Given Month
20.0% 21.5% 20.8% 22.2% 0.12 -0.26 0.49 0.58%
Medicare Spending across the Continuum of Care
Total Part A and Part B PBPM $6,358 $6,545 $6,340 $6,612 -$85 *** -$137 -$34 -1.3%Acute Inpatient PBPM $1,649 $1,686 $1,647 $1,735 -$50 *** -$76 -$23 -3.0%Readmissions PBPM $581 $591 $575 $610 -$24 ** -$40 -$8 -4.1%Institutional Post-Acute Care (PAC) PBPM $551 $530 $543 $551 -$30 ** -$50 -$10 -5.5%Home Health PBPM $172 $174 $168 $170 $1 -$4 $6 0.40%Office Visits PBPM $53 $55 $51 $52 $0 $0 $1 0.94%Total Dialysis PBPM $2,604 $2,758 $2,615 $2,763 $6 ‡ -$2 $15 0.24%
Unintended Consequences
Total Part D Drug Cost PBPM $824 $948 $851 $928 $48 *** ‡ $33 $63 5.8%Total Part D Phosphate Binder Drug Cost PBPM $291 $373 $311 $357 $36 *** ‡ $26 $45 12.3%
Notes: PY1 covers October 2015 - December 2016; PY2 covers January 2017 - December 2017; Performance year three (PY3) covers January 2018 - December 2018; PY4 covers January 2019 - December 2019; and PY5 covers January 2020 - March 2021 (the evaluation includes the first 12 months of PY5, through December 2020). All ESCOs estimates include both waves from October 2015 - December 2020. The estimate of All ESCOs is the combined cumulative impact of CEC, accounting for di fferent lengths of exposure to the model. About 19.5% of facilities have 21 quarters of CEC participation (October 2015 to December 2020), 40.4% of faciliti es have 16 quarters of CEC participation (January 2017 to December 2020), 30.4% of facilities have 12 quarters of CEC participation (January 2018 to December 2020), 8.1% of facilities have 8 quarters of CEC participation (January 2019 to December 2020), and the remaining 1.6% participated in CEC from January 2020 to December 2020 (4 quarters). Each impact estimate is based on a DiD analysis and reflects the difference in the regression-adjusted mean outcome for beneficiaries in CEC facilit ies for the intervention period with the pre-CEC period relative to the same difference over time for beneficiaries in matched comparison facilities. Significance of the DiD impact estimate is indicated next to each outcome where * implies significance at the 10% level, ** at the 5% level, and *** at the 1% level assuming a two-tailed test. ̂ The flu season is defined as August through April. ‡ Data from the pre-CEC period showed intervention and matched comparison facilities were not on parallel trends for this outcome, which is required for an unbiase d impact estimate.
Fifth Annual Report CEC Evaluation
12
Dialysis care. We expected the CEC Model to incent better vascular access practices and improve adherence to dialysis, which could, in turn, reduce hospitalization rates. Vascular access-related bacteremia can require hospitalization, and the successful creation of arteriovenous (AV) fistulas and AV grafts can reduce the risk of infection from long-term catheters. ESCO site visit participants reported leveraging partnerships with vascular surgeons to increase the rate of fistula placements and improve fistula maintenance. Consistent with expectations, the use of catheters for more than 90 days showed a statistically significant decrease of over 6%.9 Because there was no statistically significant impact on fistula use over the five years, it appears that the reduction in catheter use was mainly accompanied by an increase in the use of AV grafts. There was also a small increase in total outpatient dialysis sessions and a small, although not statistically significant, decline in emergency dialysis sessions, which are signs that ESCOs’ reported increased efforts to promote dialysis adherence had some success.
An analysis undertaken in the fourth annual report (AR4) complemented these analyses by explicitly identifying each patient’s “normal” dialysis schedule to identify the delivery of on-time dialysis, missed treatments, and rescheduled treatments in a more granular fashion. CEC resulted in small but statistically significant improvements in the likelihood that dialysis treatments were delivered as scheduled or were rescheduled if missed.10
There was no evidence of changes in patient-reported quality of dialysis care or health-related quality of life (HRQOL) at CEC dialysis facilities in PY1-PY4. 11 We did not expect to see changes in these measures since dialysis facilities already have financial incentives to score highly on some of these outcomes through the ESRD QIP, and these results confirm the CEC Model has not resulted in lower dialysis care quality.
Findings from beneficiary focus groups were similar across PY1-PY4.12 Most beneficiaries were unaware or only minimally aware of the CEC Model. While participants were generally not aware of being in an ESCO, some beneficiaries were broadly aware of at least some of its activities, particularly the care coordinator role. Beneficiaries had mostly positive impressions of the care received and were generally satisfied with their interactions with facility staff, although in later years some expressed concerns about staff turnover.
Coordination of care beyond dialysis. Because ESCOs are accountable for all of a beneficiary’s Medicare Parts A and B payments, providers have the incentive to invest in preventive services and chronic disease management activities beyond their standard dialysis care. Site visit participants emphasized medication reconciliation and coordination of dialysis as well as primary, specialty, and behavioral health care. ESCOs may also have an incentive to offer beneficiaries with ESRD education about hospice and end-of-life care, for instance, through their partnerships
9 There are three types of vascular access for hemodialysis: fistulas, grafts, and catheters.10 See AR4 for further discussion of the missed treatments analysis and methods.11 See AR4 for discussion of In-Center Hemodialysis Consumer Assessment of Healthcare Providers (ICH CAHPS®),
measures of dialysis facility care, analysis and methods. These data were not collected in PY5 due to the focus on core measures and consistent results in prior years. See the third annual report (AR3) for discussion of Kidney Disease Quality of Life (KDQOL-36), measures of HRQOL, analysis and methods. These data were not collected in PY4 or PY5 for the comparison group because CMS discontinued collection from beneficiaries aligned with CEC.
12 See AR3 and AR4 for further discussion of focus groups with Wave 1 and Wave 2 beneficiaries, respectively.
Fifth Annual Report CEC Evaluation
13
with palliative care organizations. We found that CEC beneficiaries experienced a statistically significant increase in preventive health care services, such as hemoglobin A1c (HbA1c) testing, low-density lipoprotein (LDL) cholesterol testing, and dilated eye exams in PY1-PY4.13 We also found continued improvement in flu vaccination rates through PY5. CEC reduced the likelihood of a beneficiary with ESRD overusing opioid prescriptions by 5% and improved adherence to phosphate binder use by 9%. CEC beneficiaries also had more primary care E/M office visits, but specialty care E/M office visits did not change significantly. CEC had no statistically significant impact on hospice use during the first four years of the evaluation.14
Hospitalizations and emergency department visits. By introducing incentives for reducing the total cost of care, the CEC Model was expected to reduce high-cost events such as acute hospitalization admissions, readmissions, and ED use. Site visit participants emphasized strategies to divert patients from the ED to prevent hospitalizations and improve continuity of care following hospitalizations to prevent readmissions. CEC beneficiaries experienced statistically significant reductions in hospitalizations. Specifically, CEC reduced the number of hospital visits by 3% in the five years of the model. There were significant reductions in circulatory and infectious hospitalizations as well as hospitalization associated with ESRD complications. CEC beneficiaries were also 2% less likely to be readmitted and 5% less likely to have an observation stay, both changes were significant. The number of ED visits decreased under the CEC Model, but this decline was not statistically significant.
Mortality. AR3 and AR4 included survival analyses to study the impact of the CEC Model on mortality. These analyses were motivated by observations of favorable trends in the SMR in the CEC population as well as the emergence of longer average time since the start of dialysis in CEC than in the matched comparison group. The latter could have occurred if mortality was lower in the CEC group. In this report, we updated these analyses by including data from PY5. As Medicare beneficiaries with ESRD were disproportionately impacted by COVID-19 in PY5, with case rates approximately three times as high as those for non-ESRD beneficiaries, our analysis provided significant updates by seeking to adjust for the impact of the pandemic on patients’ survival and eliminate its confounding effect on the evaluation of the CEC Model. The update was also important because it allowed for three years of follow-up time and prior analyses only allowed one year of follow-up time for patients aligned to Wave 2 ESCOs. Overall, the CEC Model continued to be significantly, but modestly, associated with better patient survival. The association was stronger among patients aligned to the CEC Model during their first year of dialysis. There were no statistically significant differences in survival between waves.
Medicare payments across the continuum of care. ESCOs were able to reduce costs mainly through a reduction in payments for hospitalizations, although the overall impact on payments was modest. Average total Medicare Part A and Part B standardized payments, our measure of overall Medicare payments, increased from the pre-CEC period to PY5 for both the CEC and comparison group beneficiaries. However, the increase in PBPM payments was greater for the comparison group, resulting in a 1% relative reduction ($85) for CEC beneficiaries. These cumulative impacts
13 See AR4 for further discussion of HbA1c testing, LDL cholesterol testing, and dilated eye exam measures in PY1-
PY4. These measures were not assessed in PY5 due to consistent results in the prior years.14 See AR4 for further discussion of hospice analysis and methods for PY1-PY4.

Fifth Annual Report CEC Evaluation
14
on PBPM payments are somewhat smaller than the estimated impacts through PY2 (2%, $114) and PY3 (2%, $93), but larger than the estimated impact through PY4 (1%, $80), reported previously.15 Medicare PBPM payment declines for CEC beneficiaries relative to the comparison group were driven by lower payments for hospitalization ($50) and readmissions ($24), with partially offsetting increases in payments for dialysis ($6, not statistically significant).
Waves 1 and 2 also experienced different results in PBPM payments as shown in Exhibit ES-4. The decline in payments was driven by Wave 1 ESCOs. While the average reduction in PBPM payments for all ESCOs was $85, estimates were smaller and not statistically significant for Wave 2 ESCOs ($55 versus $143 for Wave 1 ESCOs, in their first performance years). The reduction in PBPM payments for Wave 2 ESCOs was $54 in their second performance year, compared with $182 for Wave 1 ESCOs. Wave 2 ESCO reductions in PBPM payments were consistently much lower than Wave 1 and not statistically significant. Notably, Wave 1 ESCOs continued to reduce PBPM payments during their fifth performance year (by $112).
The characteristics of each joining cohort varied by year, resulting in a diverse set of participating facilities, which may contribute to the smaller decline in Medicare payments in Wave 2 ESCOs and the improvement in PY4-PY5 performance over PY3 for Wave 1 ESCOs. Throughout the model, ESCOs in both waves added smaller facilities, which were relatively high-cost compared to their market average. However, Wave 1 ESCO facilities had higher average Medicare payments and standardized readmission ratios (SRRs) prior to joining than non-CEC facilities, but those joining Wave 2 ESCOs had lower payments and SRRs prior to joining than non-CEC facilities. This suggests that the facilities in Wave 2 ESCOs may have had less room to improve on their pre-CEC performance. Wave 2 facilities were located in markets which were less populated, and lower income, which may have contributed to their lower performance relative to Wave 1 facilities due to lack of resources and access to care.
Additionally, Wave 1 and Wave 2 had different “lead-in” periods. Delays in the start date for Wave 1 may have allowed greater preparation time and may have contributed to differences in outcomes across the two waves. Wave 1 ESCOs may contain more motivated participants that were willing to be early adopters, while at least some Wave 2 nephrologist participants may have been motivated more strongly by gaining exemption from Merit-Based Incentive Payment System (MIPS) requirements and the payment bonus associated with participating in an Advanced APM than by enthusiasm for the model. Wave 2 also did not experience the same magnitude of improvement in its second performance year relative to its first that was seen in Wave 1’s second performance year.
15 See the second annual report (AR2), AR3, and AR4 for prior results.

Fifth Annual Report CEC Evaluation
15
Exhibit ES-4. Impact of CEC on Total Part A and Part B M edicare Payments PBPM
Notes: PY1 covers October 2015 - December 2016; PY2 covers January 2017 - December 2017; PY3 covers January 2018 - December 2018; PY4 covers January 2019 - December 2019; and PY5 covers January 2020 - March 2021 (the evaluation includes the first 12 months of PY5, through December 2020). All ESCOs estimates include both waves from October 2015 - December 2020. T he estimate of All ESCOs is the combined cumulative impact of CEC, accounting for different lengths of exposure to the model. About 19.5% of facilities have 21 quart ers of CEC participation (October 2015 to December 2020), 40.4% of facilit ies have 16 quarters of CEC participation (January 2017 to December 2020), 30.4% of facilit ies have 12 quarters of CEC participation (January 2018 to December 2020), 8.1% of facilit ies have 8 quarters of CEC participation (January 2019 to December 2020), and the remaining 1.6% participated in CEC from January 2020 to December 2020 (4 quarters). Each impact estimate is based on a DiD analysis and reflects the difference in the regression-adjusted mean outcome for beneficiaries in CEC facilit ies for the intervention period with the pre-CEC period relative to the same difference over time for beneficiaries in matched comparison facilities. Significance of the DiD impact estimate is indica ted next to each outcome bar plot where * implies significance at the 10% level, ** at the 5% level, and *** at the 1% level assuming a two-tailed test. See Exhibits D-33 – D-35.
CEC and primary care-based ACO models. We found key differences in performance between the CEC Model and the primary care-based ACO models, relative to a FFS comparison group, for four of the six outcomes that we evaluated through PY4. Specifically, Medicare payments, hospitalizations, and readmissions significantly decreased and fistula use increased among FFS beneficiaries with ESRD who became aligned to CEC during the first year after alignment. Conversely, FFS beneficiaries with ESRD who were newly aligned to a primary care-based ACO experienced no statistically significant impacts.16
This report also includes subgroup analyses to explore whether the CEC Model had differential effects on spending, utilization, and quality by race, sex, reason for Medicare eligibility, 16 See AR4 for further discussion of the ACO analysis and methods for PY1-PY4.
Fifth Annual Report CEC Evaluation
16
socioeconomic status (proxied by dual Medicare-Medicaid status), and time on dialysis (more or less than 6 months). In general, there was little evidence that the model impacts were worse for potentially disadvantaged groups, and for some measures the outcomes may even have been better.
ES.2.3. Were There Unintended Consequences of the CEC Model?While the CEC Model was intended to create incentives for more efficient and/or higher quality care, it is also important to monitor for potential unintended consequences. We examined if the model inadvertently shifted payments to parts of the Medicare program for which the ESCOs are not accountable (Part D prescription drug benefit), resulted in the implicit or explicit selection of more favorable patients, or reduced transplant waitlist participation. Our analyses found that total Medicare Part D drug costs had increased slightly starting in PY3 under the CEC Model. However, the increase is not considered an adverse unintended consequence of the CEC Model. The increase in Part D spending appears to reflect both an increase in adherence to phosphate binders under the CEC Model, a desired outcome, and a relative increase in use of higher-cost formulations by CEC beneficiaries. Analysis in AR4 showed there was no evidence of adverse patient selection under the CEC Model. Finally, there was no evidence that participation in CEC impacted transplant waiting list participation. As noted earlier, mortality had originally been monitored as a potential adverse effect arising from incentives to skimp on care. During the first years of the model, evidence emerged of lower mortality for those aligned to the CEC Model. This has been confirmed in survival analyses in this and recent annual reports.
ES.3. Discussion
The CEC Model experience showed promising results, with lower payments, improvements in some utilization measures, and no obvious indicators of unintended or adverse consequences. In general, the addition of PY5 data confirmed earlier findings. A challenge in the last year of this evaluation was the occurrence of the COVID-19 pandemic. In consultation with CMMI, several approaches to adjust for the pandemic were explored. The overarching intention of these adjustments was to try to remove the impact of COVID-19 on the evaluation results to maintain the original goal of determining if the CEC Model improved value in standard conditions. Ultimately, several adjustments were made to the CEC evaluation in PY5 including removal of inpatient COVID-19 hospitalization events.
Part A and B Medicare PBPM payments declined by $85 on average across the five performance years. Relative to the average payments in the pre-CEC period ($6,358), this represents a decrease in payments of 1.3%. The payment reductions were most evident in Medicare Part A with significant reductions in acute inpatient hospitalizations and readmissions. Reductions in utilization paralleled the payment reductions, with significant declines in hospitalizations and readmissions. The number of dialysis treatments increased, which could be a consequence of fewer missed treatments or scheduling extra dialysis treatments (e.g., to manage fluid overload). Hospitalizations and payments for dialysis-related complications declined. Significant reductions in catheter use were also observed, suggesting overall improvements in the quality of dialysis care, along with improvements in preventive services.
Utilization and payment results reinforce the qualitative findings from ESCO site visits. Improving coordination of care across settings was cited as a key objective by the ESCOs, backed by new

Fifth Annual Report CEC Evaluation
17
investments in areas such as care coordination staff and information technology (IT) to facilitate enhanced communication across providers. Reducing hospitalizations and readmissions was a particular area of emphasis. Similarly, the observed increase in the number of dialysis treatments may reflect a decrease in missed outpatient treatments, either directly or indirectly (due to less time in hospital), which was another key emphasis cited by the ESCOs and supported by quantitative analyses showing an increase in the likelihood of receiving dialysis as scheduled and having missed treatments re-scheduled under the CEC Model relative to the comparison group. It could also reflect extra treatments provided to remove more fluid to avoid an ED visit. Many ESCOs sought to improve communications with local EDs to divert beneficiaries with conditions such as fluid overload from the inpatient setting. Attempts to increase communication with the ED were sometimes coupled with having extra dialysis chairs available and extended hours to facilitate rescheduled or extra treatments. Overall, many of the care redesign strategies were enhancements or more formal extensions of processes in existence before the implementation of the CEC Model. Most of the changes in structure and operations reported by Wave 2 ESCOs in PY4 relative to PY2 were refinements of activities rather than major restructuring. Many ESCOs reported that building partnerships with hospice and palliative care providers was important, but it was an area where their efforts continued to lag behind other initiatives. More generally, ESCO representatives identified varied levels of engagement of non-participating providers as a challenge that may have limited the reductions in payments that were achieved.
An analysis of mortality showed that the CEC Model was associated with better survival, similar to the findings reported in AR4. Although the magnitude of the effect was modest, it appeared to be stronger for beneficiaries aligned earlier in their course of dialysis. Other measured model effects, such as the increase in dialysis treatments and declines in hospitalizations overall and specifically due to dialysis complications, are potential mechanisms that might underlie improved survival.
The CEC experience can inform efforts to develop specialty-oriented ACOs focusing on clinical populations with other chronic conditions such as diabetes, HIV, congestive heart failure (CHF), or chronic kidney disease (CKD). The dialysis-dependent ESRD population may be a particularly appropriate population for the development of a specialty-oriented ACO, such as the CEC Model because the dialysis schedule inherently creates frequent and regular interaction between patients and the entities (dialysis facilities and nephrologists) that are at risk for the cost of care. Hemodialysis patients visit the dialysis unit three times weekly and see the nephrologist three to four times monthly. Home dialysis patients have less frequent (typically monthly), but still regular, contact. Frequent and regular contact with the ACO’s at-risk entities may provide opportunities to monitor patient condition and intervene to improve outcomes. For example, ESCO site visit participants commonly reported that the ESCO would reach out to the patient to determine the cause of a missed treatment and attempt to reschedule it to reduce the risk of adverse outcomes. In addition, ESCOs emphasized the importance of having multiple providers reiterate and reinforce patient education messages to help patients remember and adopt the guidance provided. Such opportunities to intervene are inherently more sporadic and variable across patients in the context of both primary care-based ACOs and hypothetical specialty-oriented ACOs that could be developed for other conditions. Therefore, positive outcomes for the CEC Model might not be directly generalizable to populations with other chronic illnesses, such as diabetes, HIV, or CHF. Nonetheless, the CEC experience could still provide lessons about the potential benefits of specialty providers increasing their responsibilities in an ACO context,
Fifth Annual Report CEC Evaluation
18
whether that ACO is entirely comprised of a population with a particular chronic condition or only represents a defined subpopulation within a primary care-based ACO.
There are several limitations to the findings in this report. First, because CEC is a voluntary model, the ESCOs may not be representative of the population of Medicare dialysis providers in some practice settings, limiting our ability to generalize the results presented here to all Medicare dialysis providers or all FFS ESRD dialysis beneficiaries. Specifically, ESCOs reflect common characteristics of metropolitan communities. While the addition of new participants in PY2-PY5 increased the representation of markets participating in the model, there are some providers with very low representation in our sample (e.g., those in rural communities). Another limitation is that, although the analysis employed matching methods to select an appropriate comparison group to infer counterfactual outcomes for the ESCOs, the characteristics we selected for matching and the specificity of the data may not adequately account for all differences between CEC and comparison facilities and their beneficiaries. There may also be unobservable characteristics, such as motivation to participate in an Advanced APM which we cannot sufficiently control for with secondary data.
The final evaluation report completes the evaluation of the model.
Fifth Annual Report CEC Evaluation
19
1. IntroductionThe Centers for Medicare & Medicaid Services (CMS) launched the Comprehensive End-Stage Renal Disease (ESRD) Care (CEC) Model in 2015 under the authority of the Center for Medicare & Medicaid Innovation (CMMI). The CEC Model is designed to improve clinical and patient-centered outcomes for Medicare beneficiaries with ESRD while promoting value and reducing per capita payments. Under the CEC Model, dialysis facilities, nephrologists, and other providers can partner to form ESRD Seamless Care Organizations (ESCOs). ESCOs act as specialty-oriented accountable care organizations (ACOs), which assume responsibility for the complete care and costs of their aligned Medicare fee-for-service (FFS) beneficiaries with ESRD. The CEC Model promotes comprehensive and coordinated care and improved access to services. The CEC Model expands the reach of recent value-based payment initiatives targeting dialysis-related care such as the ESRD Prospective Payment System (PPS) and the ESRD Quality Incentive Program (QIP).17
The Lewin Group, Inc. (Lewin), along with its partners, the University of Michigan’s Kidney Epidemiology and Cost Center, General Dynamics Information Technology, and ICF are under contract to CMS to evaluate the five performance years (PYs) of the CEC Model. The goal of the evaluation is to assess the impact of the CEC Model on the quality of care and health outcomes of its beneficiaries with ESRD, as well as their utilization of inpatient/outpatient services and Medicare payments.
This report is the fifth and final annual report (AR5). It covers the 37 ESCOs that ever participated during the five PYs of the model from October 1, 2015 through March 31, 2020.18 Of these 37 ESCOs, 13 (Wave 1) joined at the start of performance year one (PY1) on October 1, 2015 and 24 (Wave 2) joined the CEC Model on January 1, 2017, at the start of performance year two (PY2). A total of 33 ESCOs remained in the model in PY5 of which 26 ESCOs opted to extend their participation three months through March 31, 2021. Several Wave 1 and 2 ESCOs added facilities in performance year three (PY3) and performance year 4 (PY4), while only 80 facilities joined in performance year five (PY5).19 Overall, the number of CEC facilities increased from 216 in PY1, to 685 in PY2, 1,066 in PY3, 1,210 in PY4, and 1,290 through PY5.
This is the first annual report to overlap with the COVID-19 Public Health Emergency (PHE). A challenge in the last year of this evaluation was the occurrence of the COVID-19 pandemic. In consultation with CMMI, several approaches to adjust for the pandemic were explored. The overarching intention of these adjustments was to try to remove the impact of COVID-19 on the evaluation results. In PY5, there were four financial methodology adjustments implemented to the CEC Model as a result of the COVID-19 PHE: a reduction in 2020 downside risk, capping ESCOs’ gross savings upside potential at 5%, removal of COVID-19 inpatient episodes, and removing the 2020 financial guarantee requirement.20 In addition, the model added an optional extension through March 31, 2021 and the quality measure reporting process was extended to May
17 See the CEC Model website for additional information on the CEC Model.18 Although the model ends in March 2021, the evaluation includes the first 12 months of PY5, due to the lack of
availability of data at the time the analysis for this report was conducted.19 For more information, please see Appendix D. 20 Centers for Medicare & Medicaid Services. (2020, June 3). CMS Innovation Center Models COVID-19 Related
Adjustments. https://www.cms.gov/files/document/covid-innovation-model-flexibilities.pdf
Fifth Annual Report CEC Evaluation
20
4, 2020. To account for financial methodology changes, identical methods were applied to the fifth annual report impact analysis to adjust for variations in COVID-19 inpatient episodes. Among Medicare beneficiaries, individuals with ESRD had six times more COVID-19 hospitalizations than other beneficiaries.21 In regard to the impact COVID-19 had on the CEC evaluation, beneficiaries aligned to ESCO facilities and included in AR5 analysis experienced 4,716 COVID-19 hospitalizations during the 2020 PHE. Additionally, COVID-19 impacted regions of the country at different times and with various levels of intensity. The potential broad impact of COVID-19 could not only impact the timing and quality of care dialysis patients received due to altered scheduled dialysis sessions and delayed transitions from catheter vascular access but also related aspects of care such as transportation. As a result, modifications were made to the AR5 impact analysis to mitigate bias due to variations in COVID-19 experiences among our analytic sample, see Appendix D. While the modifications imposed capture sources of bias due to COVID-19, impact estimates in PY5 may not only be a reflection of the CEC Model but also responses by providers to alter care due to the COVID-19 PHE.
1.1. Research Questions
This fifth annual report is organized to address several core research questions as detailed below. 22 We generated these research questions based on the conceptual framework, or logic model, of the CEC Model shown in Exhibit 1.
21 Centers for Medicare & Medicaid Services (2021). Preliminary Medicare COVID-19 data snapshots services through
2020-12-26. https://www.cms.gov/research-statistics-data-systems/preliminary-medicare-covid-19-data-snapshot 22 Formative evaluation research questions focus on characteristics of participants, entry decisions, investments by
participants, care redesign approaches, implementation challenges, scalability and sustainability, and stories of success. Summative evaluation research questions assess impact in better care, better health, payments and utilization, and unintended consequences.

Fifth Annual Report CEC Evaluation
21
Exhibit 1. CEC Evaluation Logic Model (Abbreviated Version)
Fifth Annual Report CEC Evaluation
22
The conceptual framework that describes our understanding of the resources ESCOs bring to the CEC Model, the design features and incentives that are put in place under the CEC Model, the actions and behaviors that participants may take, and the outcomes that may be achieved are provided in Exhibit 1 (above) and Appendix B.
1.1.1. Who Participated in the CEC Model? To provide context for the CEC Model, we describe Wave 1 and Wave 2 ESCO participants and the markets they serve and compared them to non-CEC participants and markets. We developed market profiles using data from the Provider of Service, Dialysis Facility Compare, Area Health Resource Files (AHRFs), and other secondary data. We also compared CEC-aligned beneficiaries to non-CEC beneficiaries to understand differences in demographic, clinical, and utilization characteristics that may influence the impact of the CEC Model on outcomes.
1.1.2. What Were the Impacts of the CEC Model?We evaluated the impact of the CEC Model on dialysis care, coordination of non-dialysis care, inpatient and outpatient utilization outcomes such as hospitalizations, readmission, and emergency department (ED) visits, and the rate of Medicare per beneficiary per month (PBPM) payments across the continuum of care during the first five PYs of the model, which included the COVID-19 PHE in 2020. In addition, we examined ESCO structural changes, including use of model waivers, and care redesign strategies for reducing costs, improving quality, and coordinating care, using data from site visits with ESCOs in PY1-PY4.23
First, we explored indicators related to the delivery of dialysis care, which involved assessing the model’s impact on pre-dialysis care, dialysis treatment modality, use of emergency dialysis treatments, and patients’ experience with dialysis care. Multiple evidence-based clinical metrics were used to assess the model’s impact on the care delivered by dialysis facilities and nephrologists (e.g., establishment of permanent vascular access, number of outpatient dialysis sessions, or percent of beneficiaries with unscheduled emergency dialysis sessions). To assess the extent ESCOs focused on improving pre-dialysis care, we investigated the impact of the model on the percent of beneficiaries who received nephrology care before the start of dialysis. In addition to these quantitative analyses of care practices and quality metrics, extensive site visits were conducted with Wave 1 ESCOs in PY1 and PY3 and selected Wave 2 ESCOs in PY2 and PY4. This report synthesizes the qualitative findings across waves and years. These site visits allowed us to learn about specific care redesign efforts and investments made by ESCOs which may correlate with the observed quantitative findings. These site visits explored factors such as partnerships with vascular access surgeons and interventions to address transportation barriers or reschedule missed treatments that may underlie the empirical findings. Based on findings from the early site visits, we conducted analysis, that was not in the original logic model, of the likelihood of receiving dialysis treatments as scheduled and rescheduling treatments that were missed in PY1-PY4, which is highlighted in this report.
Additionally, we included three patient reported components to assess dialysis care. We used the In-Center Hemodialysis Consumer Assessment of Healthcare Providers (ICH CAHPS®) survey to assess the impact of the CEC Model on beneficiaries’ self-reported experiences with dialysis care
23 See Appendix A for a description of the model waivers.
Fifth Annual Report CEC Evaluation
23
and to capture potential unintended consequences of the model in PY1-PY4. We also used data from the Kidney Disease Quality of Life (KDQOL-36™) survey to assess the impact of the CEC Model on beneficiaries’ self-reported measures of health-related quality of life (HRQOL) in PY1-PY3. The KDQOL-36™ instrument is designed to collect data on perceived burden of kidney disease, kidney disease symptoms or problems, and effects of kidney disease on quality of life and function. We analyzed physical and mental composite scores in each of these domains. The KDQOL-36™ survey was administered to both CEC beneficiaries and a matched comparison group of beneficiaries. We assessed beneficiaries’ perceptions of the CEC Model during focus groups with those who received services at selected Wave 1 and 2 ESCO dialysis facilities during PY1-PY4. We examined their level of awareness of the CEC Model and their impressions of their care, as well as whether they noticed changes in the quality of their care since the start of the CEC Model.
Second, we looked at measures associated with the coordination of care beyond dialysis, such as appropriate preventive health care, disease management, and end-of-life care. These measures included flu vaccinations and diabetes-related testing (e.g., hemoglobin A1c [HbA1c] tests and diabetic eye exams), phosphate binder adherence for disease management, and hospice use for end-of-life care (given the high mortality rate in the ESRD population and the fact that several ESCOs originally aimed to focus on hospice referrals and access to palliative care resources). Since many ESRD patients are prescribed multiple medications for management of symptoms and comorbid (co-occurring) conditions, we included measures to examine medication reconciliation to assess opioid overutilization and any changes in use of contraindicated medications. We also included measures that evaluated the potential impact of the CEC Model on the quality of care associated with diseases that often accompany ESRD (e.g., diabetes, congestive heart failure [CHF]). The site visits assessed factors such as partnerships with hospice agencies and medication reconciliation practices that could be related to these quantitative outcomes.
Third, we examined changes in utilization of distinct inpatient and outpatient services received by beneficiaries with ESRD related to hospitalizations, readmissions, ED visits, and outpatient visits with other providers. Given that reducing inpatient utilization has been identified as an area for needed improvement in ESRD care and was the primary focus of most ESCOs, we were especially interested in this outcome and any changes over the PYs. Because patients with ESRD often have comorbid conditions and CEC is intended to help providers focus on the continuum of care, we also looked at cause-specific hospital admissions related to diabetes, CHF, and infections. The site visits addressed the strategies employed by ESCOs to address use of care beyond the dialysis facility, including hiring care coordination staff, building relationships with local hospitals, and investing in data-sharing with hospitals and their EDs.
Fourth, an analysis of survival, comparing CEC beneficiaries to those in the matched comparison group, was estimated.
Finally, because ESCOs are expected to redesign care and adopt cost-saving strategies, this fifth annual report examines changes in the costs of care, using Medicare standardized payments for
Fifth Annual Report CEC Evaluation
24
total Part A and Part B services and payments by type of services.24 We also conducted additional analysis that targeted payments for claims specifically associated with hospitalizations for ESRD complications, as well as institutional post-acute care (PAC) costs. All analyses accounted for the case-mix of beneficiaries by matching on key demographic, clinical, and utilization characteristics. In addition to the overall analysis which included all aligned ESRD beneficiaries, we also evaluated the impact of the model on subgroups of Medicare beneficiaries with ESRD varying in their demographic characteristics (e.g., race, sex), basis of Medicare eligibility, dual Medicaid status, and their time on dialysis, which provided insights to the subpopulations that may be influencing the overall payment results.
We evaluated whether ESCOs in the CEC Model were better able to provide care for Medicare beneficiaries with ESRD than primary care-based ACOs by exploring whether beneficiaries with ESRD who became aligned to CEC had better outcomes than those who became aligned to a primary care-based ACO. The results illustrate the performance of each of the care models relative to a baseline period before beneficiaries are aligned to a model in PY1-PY4.25
1.1.3. Were There Unintended Consequences of the CEC Model?ESCOs may employ multiple approaches to reduce their costs of care under the CEC Model. Strategies to deliver care more efficiently or coordinate care across providers may improve quality of care and health outcomes while reducing costs. However, strategies such as stinting on care, postponing care, changing referral patterns and transplant strategies, or substituting inferior or inappropriate services could result in worse quality of care and quality of life for beneficiaries. Still other strategies could reduce the cost of care for CEC beneficiaries while increasing costs to other payers, including Medicare Part D.
To assess whether the CEC Model had unintended consequences for CEC beneficiaries, we examined the impact of the CEC Model on Part D drug costs and waitlisting for transplants. Lastly, we also used Medicare claims data to assess referral patterns for dialysis to explore whether nephrologists were selectively referring healthier patients to ESCO facilities.
24 These amounts combine the Medicare payments with the patient coinsurance and copayment amounts. Then, these
amounts are standardized to remove the effects of wage differences and for teaching status and other policy adjustments.
25 See AR4 for further discussion of the ACO analysis and methods for PY1-PY4.
Fifth Annual Report CEC Evaluation
25
2. Who Participated in the CEC Model?Thirty-three of the 37 ESCOs that ever participated in CEC remained in the model in PY5. Remaining ESCOs expanded each year, increasing the number of facilities and owner nephrologists, as well as expanding regional representation, which allowed ESCOs to reach more patients. No new ESCOs were allowed to join the model after PY2, and four ESCOs (three Dialysis Clinic, Inc. [DCI] and one Fresenius) terminated participation in the model during PY4.26
In PY5, the 33 participating ESCOs included 1,290 facilities (representing 17% of dialysis facilities in the United States [U.S.]). In addition, 13% of the ESRD FFS Medicare population was aligned to an ESCO in 2020. ESCOs added 80 facilities and expanded into one new Medicare Core-Based Statistical Area (CBSA) in PY5. There was limited facility attrition. Across the model years, 122 facilities terminated participation in the model, 71 of which were associated with the four ESCOs that terminated in PY4.
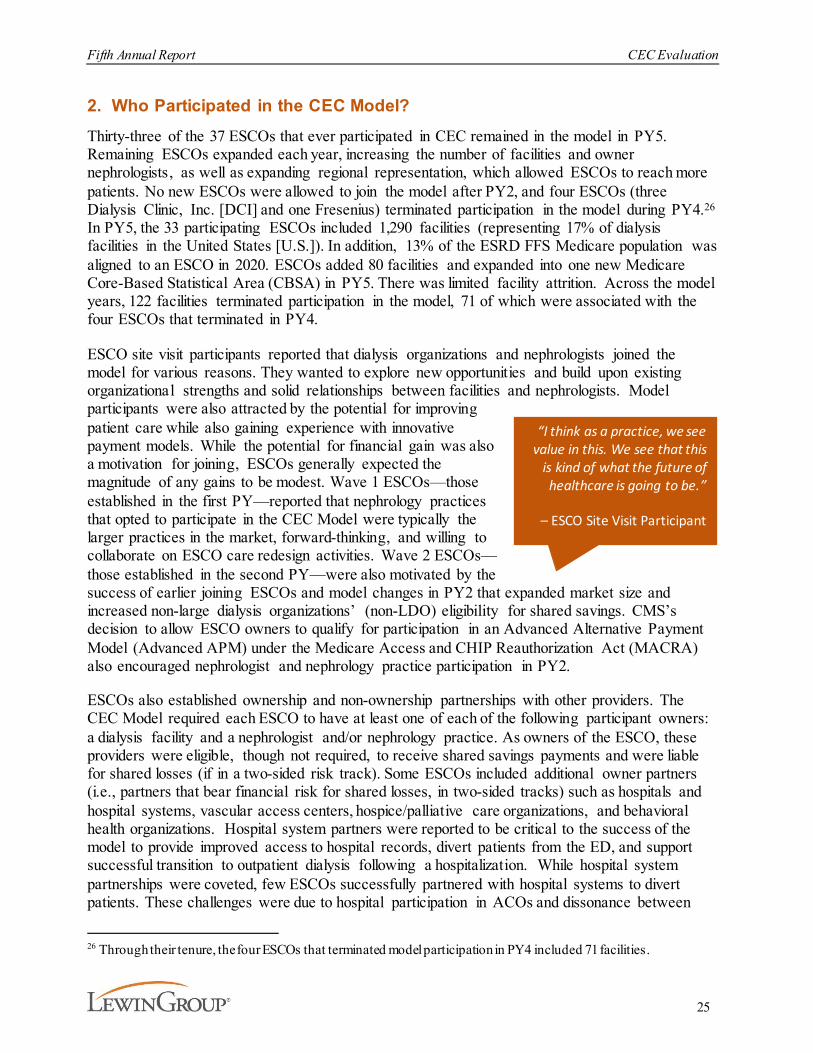
ESCO site visit participants reported that dialysis organizations and nephrologists joined the model for various reasons. They wanted to explore new opportunities and build upon existing organizational strengths and solid relationships between facilities and nephrologists. Model participants were also attracted by the potential for improving patient care while also gaining experience with innovative payment models. While the potential for financial gain was also a motivation for joining, ESCOs generally expected the magnitude of any gains to be modest. Wave 1 ESCOs—those established in the first PY—reported that nephrology practices that opted to participate in the CEC Model were typically the larger practices in the market, forward-thinking, and willing to collaborate on ESCO care redesign activities. Wave 2 ESCOs—those established in the second PY—were also motivated by the success of earlier joining ESCOs and model changes in PY2 that expanded market size and increased non-large dialysis organizations’ (non-LDO) eligibility for shared savings. CMS’s decision to allow ESCO owners to qualify for participation in an Advanced Alternative Payment Model (Advanced APM) under the Medicare Access and CHIP Reauthorization Act (MACRA) also encouraged nephrologist and nephrology practice participation in PY2.
ESCOs also established ownership and non-ownership partnerships with other providers. The CEC Model required each ESCO to have at least one of each of the following participant owners: a dialysis facility and a nephrologist and/or nephrology practice. As owners of the ESCO, these providers were eligible, though not required, to receive shared savings payments and were liable for shared losses (if in a two-sided risk track). Some ESCOs included additional owner partners (i.e., partners that bear financial risk for shared losses, in two-sided tracks) such as hospitals and hospital systems, vascular access centers, hospice/palliative care organizations, and behavioral health organizations. Hospital system partners were reported to be critical to the success of the model to provide improved access to hospital records, divert patients from the ED, and support successful transition to outpatient dialysis following a hospitalization. While hospital system partnerships were coveted, few ESCOs successfully partnered with hospital systems to divert patients. These challenges were due to hospital participation in ACOs and dissonance between
26 Through their tenure, the four ESCOs that terminated model participation in PY4 included 71 facilities.
“I think as a practice, we see value in this. We see that this
is kind of what the future of healthcare is going to be.”
– ESCO Site Visit Participant

Fifth Annual Report CEC Evaluation
26
hospital and ESCO goals, namely that hospitals are incentivized to admit patients rather than divert them. Some site visit participants also suggested that teaching hospitals also value providing experience with ESRD patients to their students making them more reluctant to divert patients to ESRD facilities for dialysis. ESCOs that were not able to create formal partnerships still reported improved relationships, communication, and record-sharing with hospitals as a result of the model. ESCOs partnered with local vascular surgeons to coordinate fistula creation and maintenance as well as provide patients and families with education about fistula use. One ESCO had a highly integrated vascular surgeon partnership, in which vascular surgery staff participated in care coordination meetings and documented directly in the ESCO’s electronic health record (EHR). ESCOs partnered with hospice and palliative care organizations to acquire competencies they otherwise lacked and improve referral processes for patients. Lastly, 16 ESCOs include behavioral health provider owners and others have non-owner partnerships.27 Behavioral health partners educated facility staff about depression screening, referrals, de-escalation strategies, and chairside counseling during dialysis.
Many partnerships were less formal, non-ownership relationships. Non-owner partners included a broad set of stakeholders including additional nephrologists, vascular surgeons, hospitals, home health agencies, information technology (IT) service providers, food assistance programs, consumer advocates, and other community partners. On average, non-LDOs partnered with a more diverse set of organizations and had more partnerships compared to the large dialysis organizations (LDOs). This may be because the non-LDOs were exclusively local nonprofit organizations that had existing community partnerships and continued outreach to form new partnerships.
Nephrologists joined the CEC Model each year, increasing the count of owner nephrologists seven-fold from 247 in the first quarter of PY1 to 1,875 in the final quarter of PY5. Additional nephrologists were more motivated to join the model beginning in PY2 due to the reduction in reporting requirements for CEC Model participants authorized under MACRA and the payment bonus 27 Salesforce data accessed January 20, 2021.
"Not having to do MACRA or MIPS was a huge thing and you got the 5% Medicare [bonus]."
"It’s not even so much the MACRA bonus, it’s just the not getting a pay cut because none of the metrics for MIPS are
really applicable at all to a nephrology practice…You end up doing a bunch of meaningless work to try to keep your
money the same that doesn’t positively impact outcomes."
– ESCO Site Visit Participant
ESCO Example: Food Bank PartnerIn prior years, ESCOs mentioned challenges with patient adherence to nutrition guidelines.
However, for the first time in in PY4, Wave 2 participants emphasized food insecurity as a challenge for beneficiaries who are lower income. They suggested that many beneficiaries are protein
malnourished and do not get enough fresh produce, as well as that some beneficiaries shared that meals were a benefit of receiving care in the hospital. Food assistance programs are available in many areas, but ESCOs described limitations. One Wave 2 ESCO suggested that food insecurity is
increasing and, in response, started a pilot program with a food bank in PY4. The food bank comes to the facility twice a month to provide food to beneficiaries.
Fifth Annual Report CEC Evaluation
27
associated with participating in Advanced APMs. The growth in the number of owner nephrologists expanded the opportunity for beneficiaries to be treated by a nephrologist who operated under the CEC Model care incentives.
2.1. Key Findings
2.2. Methods
We constructed a dialysis facility dataset, based on data from CMS, that included facility-level characteristics from the 2015 Dialysis Facility Compare database and a summary of 2012-2014 Medicare claims, as well as market-level characteristics from 2014 based on the AHRFs and the Census American Community Survey. These years were chosen to reflect conditions just before the start of the CEC Model. We aggregated county-level characteristics to the CBSA level28 by weighting individual county observations by population. CEC markets were defined as those CBSAs that had at least one CEC facility, while non-CEC CBSAs were those without CEC facilities. In addition, we conducted site visits with ESCO representatives from all participating dialysis organizations during their first and third years of participation in the model. In total, we visited 120 facilities throughout the model and conducted 331 facility and corporate interviews. See Appendix C for a discussion of site visit selection criteria, data collection procedures, protocol development, and analysis methods.
28 CBSAs are Metropolitan CBSAs, with each CBSA Division separated, and based on the Office of Management and
Budget CBSA definition.
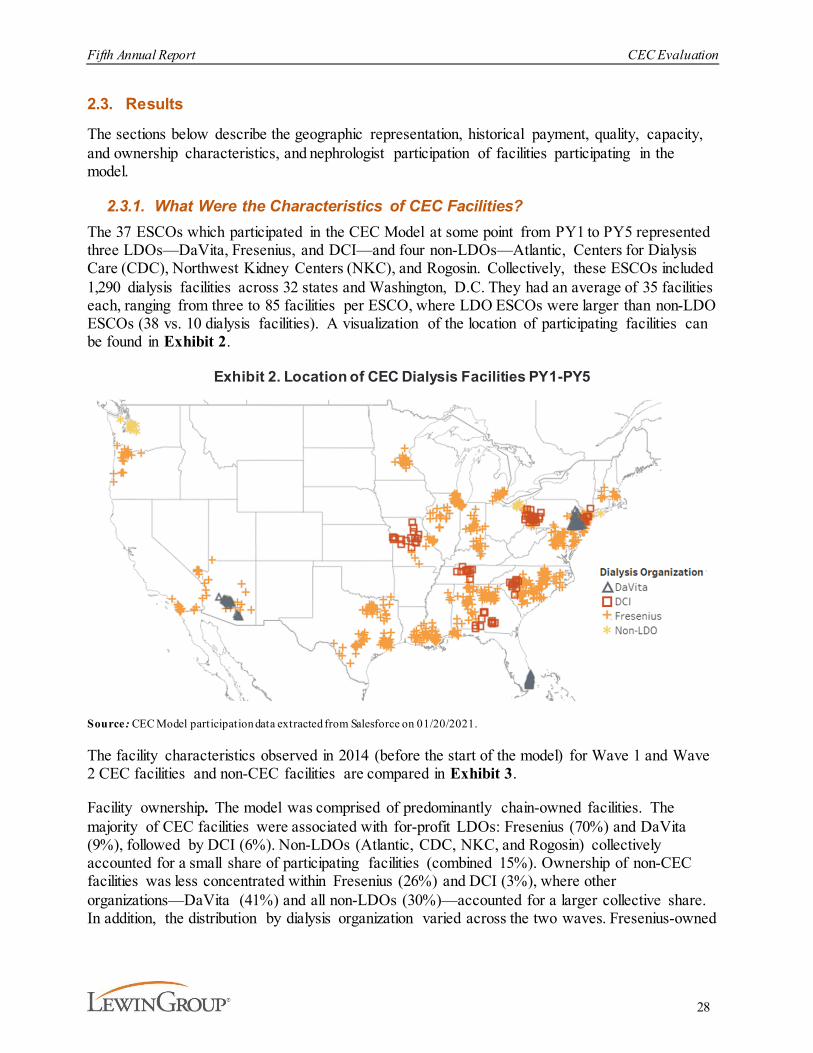
Fifth Annual Report CEC Evaluation
28
2.3. Results
The sections below describe the geographic representation, historical payment, quality, capacity, and ownership characteristics, and nephrologist participation of facilities participating in the model.
2.3.1. What Were the Characteristics of CEC Facilities? The 37 ESCOs which participated in the CEC Model at some point from PY1 to PY5 represented three LDOs—DaVita, Fresenius, and DCI—and four non-LDOs—Atlantic, Centers for Dialysis Care (CDC), Northwest Kidney Centers (NKC), and Rogosin. Collectively, these ESCOs included 1,290 dialysis facilities across 32 states and Washington, D.C. They had an average of 35 facilities each, ranging from three to 85 facilities per ESCO, where LDO ESCOs were larger than non-LDO ESCOs (38 vs. 10 dialysis facilities). A visualization of the location of participating facilities can be found in Exhibit 2.
Exhibit 2. Location of CEC Dialysis Facilities PY1-PY5
Source : CEC Model participation data extracted from Salesforce on 01/20/2021.
The facility characteristics observed in 2014 (before the start of the model) for Wave 1 and Wave 2 CEC facilities and non-CEC facilities are compared in Exhibit 3.
Facility ownership. The model was comprised of predominantly chain-owned facilities. The majority of CEC facilities were associated with for-profit LDOs: Fresenius (70%) and DaVita (9%), followed by DCI (6%). Non-LDOs (Atlantic, CDC, NKC, and Rogosin) collectively accounted for a small share of participating facilities (combined 15%). Ownership of non-CEC facilities was less concentrated within Fresenius (26%) and DCI (3%), where other organizations—DaVita (41%) and all non-LDOs (30%)—accounted for a larger collective share. In addition, the distribution by dialysis organization varied across the two waves. Fresenius-owned
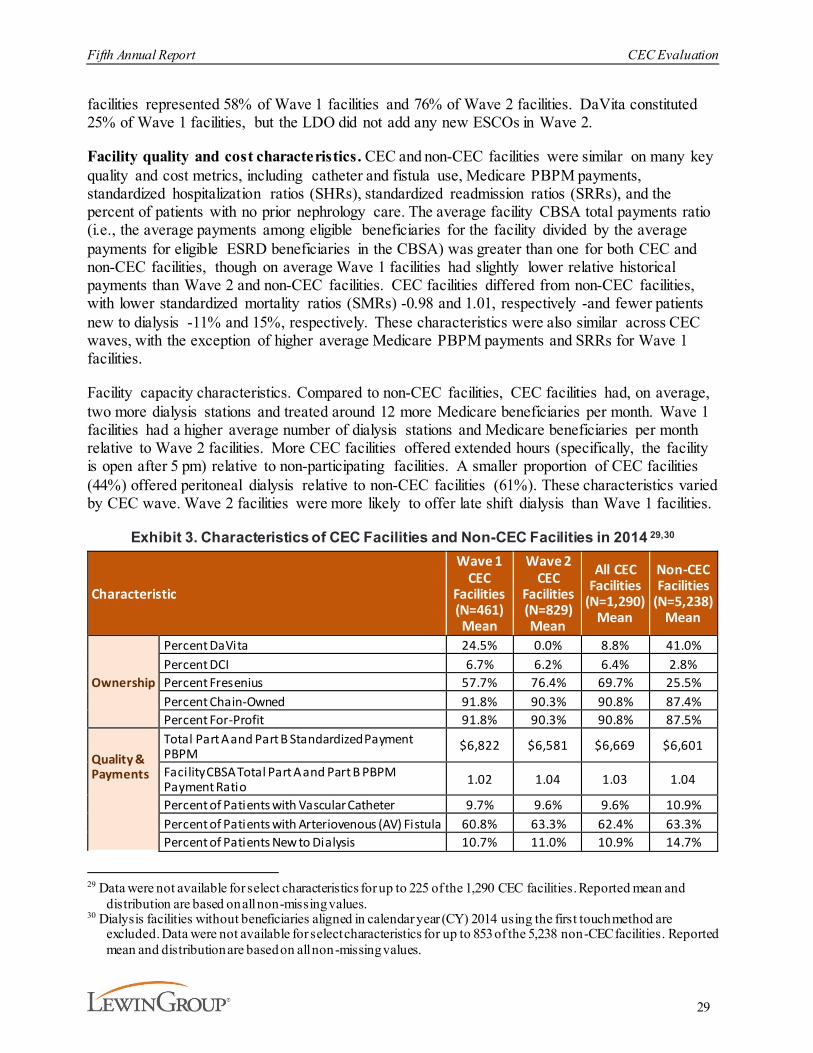
Fifth Annual Report CEC Evaluation
29
facilities represented 58% of Wave 1 facilities and 76% of Wave 2 facilities. DaVita constituted 25% of Wave 1 facilities, but the LDO did not add any new ESCOs in Wave 2.
Facility quality and cost characteristics. CEC and non-CEC facilities were similar on many key quality and cost metrics, including catheter and fistula use, Medicare PBPM payments, standardized hospitalization ratios (SHRs), standardized readmission ratios (SRRs), and the percent of patients with no prior nephrology care. The average facility CBSA total payments ratio (i.e., the average payments among eligible beneficiaries for the facility divided by the average payments for eligible ESRD beneficiaries in the CBSA) was greater than one for both CEC and non-CEC facilities, though on average Wave 1 facilities had slightly lower relative historical payments than Wave 2 and non-CEC facilities. CEC facilities differed from non-CEC facilities, with lower standardized mortality ratios (SMRs) -0.98 and 1.01, respectively -and fewer patients new to dialysis -11% and 15%, respectively. These characteristics were also similar across CEC waves, with the exception of higher average Medicare PBPM payments and SRRs for Wave 1 facilities.
Facility capacity characteristics. Compared to non-CEC facilities, CEC facilities had, on average, two more dialysis stations and treated around 12 more Medicare beneficiaries per month. Wave 1 facilities had a higher average number of dialysis stations and Medicare beneficiaries per month relative to Wave 2 facilities. More CEC facilities offered extended hours (specifically, the facility is open after 5 pm) relative to non-participating facilities. A smaller proportion of CEC facilities (44%) offered peritoneal dialysis relative to non-CEC facilities (61%). These characteristics varied by CEC wave. Wave 2 facilities were more likely to offer late shift dialysis than Wave 1 facilities.
Exhibit 3. Characteristics of CEC Facilities and Non-CEC Facilities in 2014 29,30
Characteristic
Wave 1 CEC
Facilities (N=461) Mean
Wave 2 CEC
Facilities (N=829) Mean
All CEC Facilities
(N=1,290) Mean
Non-CEC Facilities
(N=5,238) Mean
Ownership
Percent DaVita 24.5% 0.0% 8.8% 41.0%Percent DCI 6.7% 6.2% 6.4% 2.8%Percent Fresenius 57.7% 76.4% 69.7% 25.5%Percent Chain-Owned 91.8% 90.3% 90.8% 87.4%Percent For-Profit 91.8% 90.3% 90.8% 87.5%
Quality & Payments
Total Part A and Part B Standardized Payment PBPM $6,822 $6,581 $6,669 $6,601
Facility CBSA Total Part A and Part B PBPM Payment Ratio 1.02 1.04 1.03 1.04
Percent of Patients with Vascular Catheter 9.7% 9.6% 9.6% 10.9%Percent of Patients with Arteriovenous (AV) Fistula 60.8% 63.3% 62.4% 63.3%Percent of Patients New to Dialysis 10.7% 11.0% 10.9% 14.7%
29 Data were not available for select characteristics for up to 225 of the 1,290 CEC facilities. Reported mean and
distribution are based on all non-missing values.30 Dialysis facilities without beneficiaries aligned in calendar year (CY) 2014 using the first touch method are
excluded. Data were not available for select characteristics for up to 853 of the 5,238 non-CEC facilities. Reported mean and distribution are based on all non-missing values.
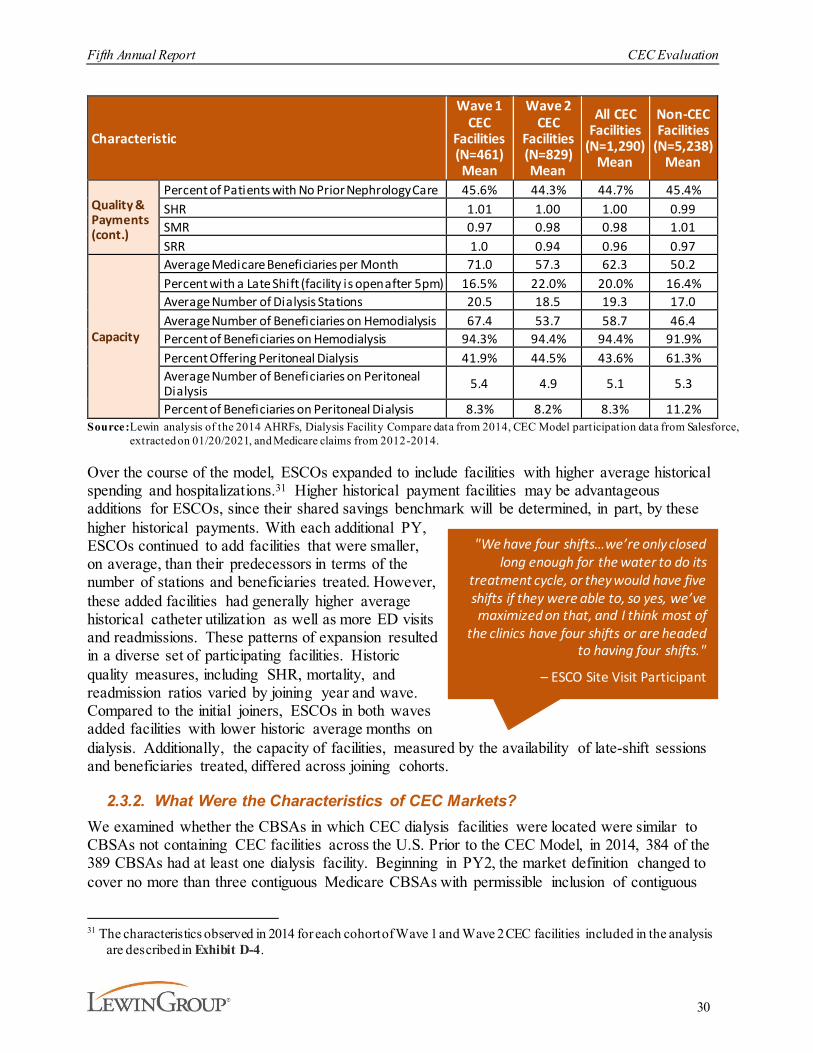
Fifth Annual Report CEC Evaluation
30
Characteristic
Wave 1 CEC
Facilities (N=461) Mean
Wave 2 CEC
Facilities (N=829) Mean
All CEC Facilities
(N=1,290) Mean
Non-CEC Facilities
(N=5,238) Mean
Quality & Payments (cont.)
Percent of Patients with No Prior Nephrology Care 45.6% 44.3% 44.7% 45.4%SHR 1.01 1.00 1.00 0.99SMR 0.97 0.98 0.98 1.01SRR 1.0 0.94 0.96 0.97
Capacity
Average Medicare Beneficiaries per Month 71.0 57.3 62.3 50.2Percent with a Late Shift (facility is open after 5pm) 16.5% 22.0% 20.0% 16.4%Average Number of Dialysis Stations 20.5 18.5 19.3 17.0Average Number of Beneficiaries on Hemodialysis 67.4 53.7 58.7 46.4Percent of Beneficiaries on Hemodialysis 94.3% 94.4% 94.4% 91.9%Percent Offering Peritoneal Dialysis 41.9% 44.5% 43.6% 61.3%Average Number of Beneficiaries on Peritoneal Dialysis 5.4 4.9 5.1 5.3
Percent of Beneficiaries on Peritoneal Dialysis 8.3% 8.2% 8.3% 11.2%Source:Lewin analysis of the 2014 AHRFs, Dialysis Facility Compare data from 2014, CEC Model participation data from Salesforce,
extracted on 01/20/2021, and Medicare claims from 2012-2014.
Over the course of the model, ESCOs expanded to include facilities with higher average historical spending and hospitalizations.31 Higher historical payment facilities may be advantageous additions for ESCOs, since their shared savings benchmark will be determined, in part, by these higher historical payments. With each additional PY, ESCOs continued to add facilities that were smaller, on average, than their predecessors in terms of the number of stations and beneficiaries treated. However, these added facilities had generally higher average historical catheter utilization as well as more ED visits and readmissions. These patterns of expansion resulted in a diverse set of participating facilities. Historic quality measures, including SHR, mortality, and readmission ratios varied by joining year and wave. Compared to the initial joiners, ESCOs in both waves added facilities with lower historic average months on dialysis. Additionally, the capacity of facilities, measured by the availability of late-shift sessions and beneficiaries treated, differed across joining cohorts.
2.3.2. What Were the Characteristics of CEC Markets? We examined whether the CBSAs in which CEC dialysis facilities were located were similar to CBSAs not containing CEC facilities across the U.S. Prior to the CEC Model, in 2014, 384 of the 389 CBSAs had at least one dialysis facility. Beginning in PY2, the market definition changed to cover no more than three contiguous Medicare CBSAs with permissible inclusion of contiguous
31 The characteristics observed in 2014 for each cohort of Wave 1 and Wave 2 CEC facilities included in the analysis
are described in Exhibit D-4.
"We have four shifts…we’re only closed long enough for the water to do its
treatment cycle, or they would have five shifts if they were able to, so yes, we’ve maximized on that, and I think most of
the clinics have four shifts or are headed to having four shifts."
– ESCO Site Visit Participant

Fifth Annual Report CEC Evaluation
31
rural counties not included in the Medicare CBSA, instead of two. This allowed ESCOs to increase their presence across CBSAs and extend into rural areas. CEC facilities were located in 92 CBSAs, as illustrated by the map in Exhibit 4.
Exhibit 4. CBSAs with CEC Facilities by Joining Year
Source: Dialysis Facility Compare data from 2014 and CEC Model participation data extracted from Salesforce on 01/20/2021. Each CBSA is assigned to a joining year based on the most frequent joining year among all CEC facilit ies in the CBSA (e.g., if a CBSA contained 6 facilit ies, 5 of which joined in PY1 and 1 that joined in PY4, the CBSA would be shaded in the lightest yellow tone to signify PY1).
Markets with CEC facilities (CEC CBSAs) differed from those without CEC facilities (non-CEC CBSAs) in some dimensions, including population size, median income, race and ethnicity, and healthcare supply indicators. The market characteristics of CBSAs with and without CEC facilities are compared in Exhibit 5. CEC CBSAs included many of the largest population centers in the U.S., where the average CEC CBSA had a population more than three-and-a-half times larger than the average non-CEC CBSA. Compared to non-CEC CBSAs, markets where ESCOs chose to participate had beneficiaries with ESRD who had higher total Medicare Part A and Part B standardized payments. CEC CBSAs also had a higher median income as well as a higher proportion of Black and Hispanic residents. CEC CBSAs tended to have a higher rate of specialists per 10,000 residents but lower access to skilled nursing facility (SNF) beds per 10,000 residents, relative to non-CEC CBSAs. CEC CBSAs also had fewer dialysis facilities per 10,000 residents, even though these CBSAs had a similar prevalence of ESRD.
Within CEC markets, CBSAs with Wave 1 facilities had, on average, a larger population, fewer SNF beds, more Hispanic patients, and a lower rate of specialists per 10,000 residents than those with Wave 2 facilities. Wave 1 CBSAs also had beneficiaries with ESRD who had higher total Medicare Part A and Part B standardized payments. While both Wave 1 and Wave 2 CBSAs had fewer dialysis facilities as a fraction of the population than non-CEC CBSAs, the average number

Fifth Annual Report CEC Evaluation
32
of dialysis facilities per 10,000 residents for Wave 1 CBSAs was much lower, despite having a slightly higher prevalence of ESRD.
Exhibit 5. Characteristics of Markets with and without CEC Facilities in 2014
Characteristic
Wave 1 CEC CBSAs
(N=30)
Wave 2 CEC CBSAs
(N=65)
All CEC CBSAs (N=92)
All Non-CEC CBSAs
(N=292) Mean Mean Mean Mean
Average Total Medicare Part A and Part B Payments $6,561 $6,336 $6,397 $6,188Dialysis Facilities per 10,000 0.34 0.40 0.39 0.45Hospitals with Kidney Transplant Services per 10,000 0.01 0.01 0.01 0.005Primary Care Providers (PCPs) per 10,000 7.3 7.8 7.6 7.4Specialists per 10,000 9.5 11.4 10.7 8.1SNF Beds Per 10,000 45.3 52.5 50.3 57.0CBSA Population 2,227,304 1,415,772 1,525,699 421,622Median Household Income $53,604 $52,715 $52,713 $48,641Percent 65 & Older 13.4% 13.4% 13.4% 14.5%Percent Black 15.6% 15.7% 15.9% 9.1%Percent Hispanic 20.8% 11.9% 14.5% 11.3%Percent White 55.5% 65.4% 62.5% 72.8%Percent Dual Eligible 2.8% 2.7% 2.8% 3.0%Percent ESRD 0.14% 0.14% 0.14% 0.13%Percent of ESRD with Medicare & Medicaid 51.0% 48.5% 49.3% 48.7%Percent with No High School Diploma 15.8% 14.2% 14.7% 14.1%
Source:Lewin analysis of the 2014 AHRFs; Dialysis Facility Compare data from 2014; CEC Model participation data from Salesforce, extracted on 01/20/2021; and Medicare claims from 2012-2014.
Other than adding relatively high-cost facilities compared to their market average, the market characteristics by cohort in Exhibit 6 show that the cohorts of joining facilities for each wave did not follow a set pattern over time. Later joining cohorts tended to be in less metropolitan areas, but the average population for each joining cohort varied greatly from year to year. In addition, PY3 joiners had the lowest median income levels for their wave, where facilities that joined before and after had, on average, higher median incomes and generally lower rates of persons-in-poverty (with the exception of Wave 2 PY4 joiners), resulting in a wide variety of participant facilities by the end of the performance period. Medicare Advantage (MA) market penetration was fairly stable across Wave 2 cohorts, but significantly lower on average for facilities in the Wave 1 PY2-PY4 joining cohorts.

Fifth Annual Report CEC Evaluation
33
Exhibit 6. Market Characteristics by Cohort
CharacteristicWave 1 Wave 2
PY1 Joiner
(N=206)
PY2 Joiner (N=79)
PY3 Joiner (N=68)
PY4 Joiner (N=27)
PY5 Joiner (N=3)
PY2 Joiner
(N=347)
PY3 Joiner
(N=252)
PY4 Joiner (N=58)
PY5 Joiner (N=14)
Facility/CBSA Average Total Medicare A and B Payment Ratio
0.99 0.98 1.05 1.05 1.09 1.01 1.02 1.05 1.16
Median Household Income
$56,007 $55,734 $49,844 $56,716 $60,517 $56,071 $52,775 $53,341 $61,153
MA Penetration 27.2% 21.7% 20.9% 23.9% 27.2% 29.7% 29.0% 27.2% 29.2%Percent Below Poverty Level 14.7% 16.2% 19.6% 15.6% 11.6% 14.9% 15.9% 17.6% 14.3%
Percent Metropolitan32 97.1% 92.4% 73.5% 81.5% 66.7% 90.5% 84.1% 63.8% 85.7%
Percent Urban33 2.9% 7.6% 26.5% 18.5% 33.3% 9.5% 15.9% 34.5% 14.3%Population (thousands) 1,709 2,260 747 1,090 421 867 897 542 1,455
Note: Reported means and distributions are based on CEC facilit ies included in the analytic sample. Although 80 facilit ies joined the CEC Model for PY5, only 17—three from Wave 1 ESCOs and 14 from Wave 2 ESCOs—meet the necessary criteria to be included in our analysis (e.g., many did not exist during the baseline period and therefore were excluded). See Appendix D for a description of the analytic sample.
Source:Lewin analysis of the 2014 AHRFs; Dialysis Facility Compare data from 2014; CEC Model participation data from Salesforce, extracted on 01/20/2021; and Medicare claims from 2012-2014.
2.3.3. What was the Extent of ESCO Owner Nephrologist Participation?Each ESCO must have at least one dialysis facility and nephrologist and/or nephrology practice.34
All ESCO participant owners in two-sided risk tracks are liable for shared losses and may, but are not required to, receive shared savings payments.35 Owner nephrologists (in two-sides risk tracks) are risk-bearing participants in the model, and therefore have different incentives than nephrologists who are not owners in the ESCO. ESCO site visit participants indicated that having nephrologists as ESCO owners helped align the physicians and dialysis staff in a shared goal to improve efficiency and quality while decreasing costs. The overall level of physician engagement was viewed as one of the factors driving the success of an ESCO, although physician engagement was not uniform across all sites within a given ESCO or between different ESCOs. A non-LDO reported that it had few nephrologist owners due to a heavy concentration of ACOs in their regions.
32 Based on the 2013 Rural/Urban Continuum Codes, a facility is considered metropolitan if they are located in a
metropolitan county and is considered a non-metropolitan facility otherwise. Non-metropolitan includes urban and rural counties, where the majority of CEC facilities are located in urban counties.
33 Ibid34 Centers for Medicare & Medicaid Services, Center for Medicare & Medicaid Innovation. (2016, May 18).
Comprehensive ESRD Care (CEC) Model, request for applications. https://innovation.cms.gov/files/x/cec-py2-rfa.pdf
35 Non-LDOs also had the option of participating in a one-sided risk track where they would be able to receive shared savings payments but would not be liable for payment of shared losses.
Fifth Annual Report CEC Evaluation
34
In PY4, Wave 2 site visit participants reported that some nephrology group owners reduced their liability for shared losses (e.g., from 20-25% in PY1 to 5% in subsequent years). A wide level of physician ESCO ownership was reported by respondents ranging from 2% up to 30%. In general, nephrology groups affiliated with Fresenius tended to have higher ownership percentages than physician groups affiliated with other LDO or non-LDO ESCOs. Rationales for reducing ownership interest varied. Some ESCOs indicated that nephrologists had overestimated their ability to control the cost of care, specifically the costs of hospitalizations and overuse of medications (e.g., calcimimetics).
Nephrologist frustration with the changes announced in the model operations after the CEC Model began, the inability to get accurate beneficiary alignment data, and overall lack of clear and timely communication also contributed to reductions in ownership and participation. However, the CEC Model was still preferred to participating in the Merit-Based Incentive Payment System (MIPS).
ESCOs raised concerns regarding transparency and predictability of the model’s financial methodology and challenges in continuing to exceed benchmarks that become stricter over time. They felt that the lack of transparency in the financial methodology makes it difficult for them to gauge whether they would have any savings or losses. In addition, one non-LDO changed from a two-sided risk model to a one-sided model in PY4. With lower levels of physician ownership and risk, their level of engagement could also decrease, which may jeopardize the incremental gains achieved by the model.
If ESCOs expand by adding facilities without proportionally adding owner nephrologists, the higher proportion of non-owner nephrologists coupled with less care redesign could prove less effective for beneficiaries at later joining facilities. We analyzed the extent to which a facility’s ratio of patients receiving treatment by an owner nephrologist was consistent across joining cohorts. To determine the reach of the owner nephrologist in their ESCO’s facility, we created a facility-level measure of the percent of aligned beneficiaries who are treated by an owner nephrologist at least once within a PY.36 The mean of owner nephrologist reach by PY and cohort is shown in Exhibit 7.
36 The measure presented is based on the beneficiary receiving care from an owner nephrologist (i.e., outpatient dialysis -
related management services by a participating CEC nephrologist receiving a monthly capitation payment) at least once in a year. We developed another measure to describe the percent of beneficiaries who received at least half of their treatments from owner nephrologists. The conclusions using both measures are the same.
"It took us almost two years to get in the first numbers, so we're not expecting really quick decisions or outcomes. That’s been a great frustration to us [nephrologists], too.
The hard part is you make decisions now and you don’t get a straight answer about what your outcome is, if the decisions that
you made actually worked. So you’re basically working blind for years at a time and then find out that that didn’t work.”
– ESCO Site Visit Participant
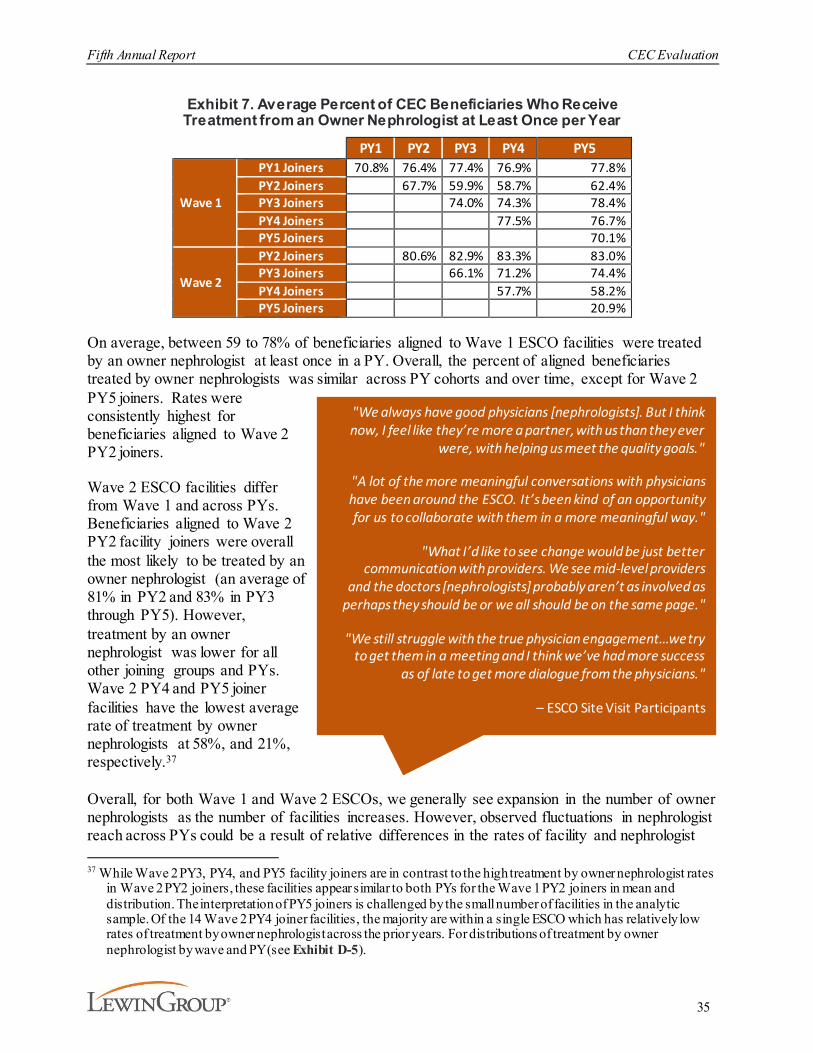
Fifth Annual Report CEC Evaluation
35
Exhibit 7. Average Percent of CEC Beneficiaries Who Receive Treatment from an Owner Nephrologist at Least Once per Year
PY1 PY2 PY3 PY4 PY5
Wave 1
PY1 Joiners 70.8% 76.4% 77.4% 76.9% 77.8%PY2 Joiners 67.7% 59.9% 58.7% 62.4%PY3 Joiners 74.0% 74.3% 78.4%PY4 Joiners 77.5% 76.7%PY5 Joiners 70.1%
Wave 2
PY2 Joiners 80.6% 82.9% 83.3% 83.0%PY3 Joiners 66.1% 71.2% 74.4%PY4 Joiners 57.7% 58.2%PY5 Joiners 20.9%
On average, between 59 to 78% of beneficiaries aligned to Wave 1 ESCO facilities were treated by an owner nephrologist at least once in a PY. Overall, the percent of aligned beneficiaries treated by owner nephrologists was similar across PY cohorts and over time, except for Wave 2 PY5 joiners. Rates were consistently highest for beneficiaries aligned to Wave 2 PY2 joiners.
Wave 2 ESCO facilities differ from Wave 1 and across PYs. Beneficiaries aligned to Wave 2 PY2 facility joiners were overall the most likely to be treated by an owner nephrologist (an average of 81% in PY2 and 83% in PY3 through PY5). However, treatment by an owner nephrologist was lower for all other joining groups and PYs. Wave 2 PY4 and PY5 joiner facilities have the lowest average rate of treatment by owner nephrologists at 58%, and 21%, respectively.37
Overall, for both Wave 1 and Wave 2 ESCOs, we generally see expansion in the number of owner nephrologists as the number of facilities increases. However, observed fluctuations in nephrologist reach across PYs could be a result of relative differences in the rates of facility and nephrologist 37 While Wave 2 PY3, PY4, and PY5 facility joiners are in contrast to the high treatment by owner nephrologist rates
in Wave 2 PY2 joiners, these facilities appear similar to both PYs for the Wave 1 PY2 joiners in mean and distribution. The interpretation of PY5 joiners is challenged by the small number of facilities in the analytic sample. Of the 14 Wave 2 PY4 joiner facilities, the majority are within a single ESCO which has relatively low rates of treatment by owner nephrologist across the prior years. For distributions of treatment by owner nephrologist by wave and PY (see Exhibit D-5).
"We always have good physicians [nephrologists]. But I think now, I feel like they’re more a partner, with us than they ever
were, with helping us meet the quality goals."
"A lot of the more meaningful conversations with physicians have been around the ESCO. It’s been kind of an opportunity for us to collaborate with them in a more meaningful way."
"What I’d like to see change would be just better communication with providers. We see mid-level providers
and the doctors [nephrologists] probably aren’t as involved as perhaps they should be or we all should be on the same page."
"We still struggle with the true physician engagement…we try to get them in a meeting and I think we’ve had more success
as of late to get more dialogue from the physicians."
– ESCO Site Visit Participants
Fifth Annual Report CEC Evaluation
36
expansion. Finally, some ESCOs did not follow this general pattern, which may have contributed to the lower rates of treatment by owner nephrologists in later joining Wave 2 ESCO facilities.
2.4. Discussion
After four ESCOs terminated participation during PY4, remaining ESCOs enrolled 80 facilities in PY5 to the CEC Model for a total of 1,290 dialysis facilities. CEC facilities accounted for 17% of outpatient dialysis facilities nationally and accounted for a diverse group of participants. Fresenius, an LDO, dominated participation in the model in Wave 2. Wave 1 and Wave 2 facilities had similar characteristics, although the relative share of facilities under each LDO varied from Wave 1 to Wave 2.
Participating facilities were different than non-participating facilities in that they tended to be somewhat larger in terms of number of dialysis stations and number of Medicare beneficiaries treated, but they were similar on other key standardized outcome-related measures. As ESCOs expanded, the facilities that joined generally had higher historical costs, readmissions, and hospitalizations as well as higher catheter utilization relative to their predecessors. This expansion pattern may have proved advantageous for ESCOs if during their performance period they could rectify the inefficiencies which led to higher historical payments and therefore higher shared savings benchmarks.
The CBSAs represented by Wave 1 and Wave 2 facilities differed slightly in terms of population, income, percent of Hispanic beneficiaries, and access to SNFs with no distinct pattern across joining years. The markets served by ESCOs tended to be larger than those without an ESCO. Each additional cohort of facilities differed on market characteristics from the prior cohorts, resulting in a wide geographic and demographic array of participants.
As these ESCOs expanded, so did their presence of owner nephrologists, which led to a relatively stable rate of treatment by owner nephrologists across joining facilities for Wave 1 ESCOs. However, treatment by owner nephrologists decreased for Wave 2 ESCOs. Although each cohort differed in the percent of beneficiaries treated by an owner nephrologist, the rate stayed relatively stable, or often increased within cohort over the PYs. While the number of nephrologists who participated in CEC facilities grew over time, Wave 2 ESCOs reported that many nephrologists were attracted to the model based on the MIPS reporting exemption that became available in PY2 and some nephrology groups decreased their liability for shared risk.

Fifth Annual Report CEC Evaluation
37
3. What Were the Impacts of the CEC Model?This section synthesizes findings of the impact of the CEC Model on dialysis care, coordination of care beyond dialysis, hospitalizations, ED visits, mortality, Medicare payments, and beneficiary sub-populations over all model PYs from October 2015 through December 2020.38 Differences in performance between the CEC Model and primary care-based ACO models are also presented in this section.
3.1. Key Findings
38 The model includes an optional three-month extension through March 2021 that is not included in this evaluation
due to the lack of availability of data at the time the analysis for this report was conducted.
Fifth Annual Report CEC Evaluation
38
3.2. Methods
Our evaluation used a difference-in-differences (DiD) approach to estimate impacts of the CEC Model on key outcomes depicted in Exhibit 8 relative to the comparison group.39 DiD is a statistical method that quantifies the impact of the model by comparing changes in risk-adjusted outcomes for CEC beneficiaries before and after implementation of the CEC Model to changes in outcomes for similar beneficiaries in the comparison group, before and after CEC implementation. This approach controls for beneficiary-, market-, and facility-level differences between the CEC and comparison populations. It also minimizes biases from time-invariant differences between the CEC and comparison populations and controls for secular trends. The comparison group consisted of beneficiaries from non-participating dialysis facilities matched to CEC facilities based on key market and facility characteristics as well as the sociodemographic and clinical composition of beneficiaries served.
The DiD analysis used Medicare Part A and Part B enrollment and claims data from January 2014 to December 2020 in combination with other program, provider, and market data sources. We estimated a DiD model that produced wave- and PY-specific effects for the original 13 ESCOs (Wave 1) and the additional 24 ESCOs (Wave 2). We used these by-wave and by-PY estimates to assess the cumulative impact of the CEC Model for all 37 ESCOs that ever participated in the model.
We divided the period of analysis into pre-CEC, transition, and post-CEC periods for each of the waves of ESCO facilities. The pre-CEC period for facilities that joined CEC in October 2015 ran from January 2014 through March 2015 and was followed by a six-month transition period from April 2015 through September 2015 to account for the delayed start of the model. The pre-CEC period for facilities that joined CEC in January 2017 ran from January 2014 through June 2016 and was followed by a six-month transition period from July 2016 through December 2016. The pre-CEC period for facilities that joined CEC in January 2018 ran from January 2014 through June 2017 and was followed by a six-month transition period from July 2017 through December 2017. The pre-CEC period for facilities that joined CEC in January 2019 ran from January 2014 through June 2018 and was followed by a six-month transition period from July 2018 through December 2018. The pre-CEC period for facilities that joined CEC in January 2020 ran from January 2014 through June 2019 and was followed by a six-month transition period from July 2019 through December 2019. The last intervention quarter for all waves concluded in December 2020. Wave 1 represents 48.5% and Wave 2 represents 51.5% of the CEC beneficiary months in the intervention period analytic sample. The DiD methodology, including data sources, outcomes definitions, methods for identifying comparison populations and any applied exclusion criteria, and statistical models, is described in Appendix D. The evaluation’s statistical power to detect impacts are discussed in Appendix E.
The COVID-19 pandemic overlapped with the final year of the CEC Model. To accommodate changes in utilization due to COVID-19 that may have impacted ESCOs and the comparison 39 Due to the summative nature of this report, fewer DiD outcomes were analyzed and reported for PY5 than in
previous reports. This final report provides updates to estimates for a core set of outcomes key to care or with interesting patterns and also discusses findings from previous reports to provide context to the latest findings and a more comprehensive picture of the model impacts as a whole.

Fifth Annual Report CEC Evaluation
39
group differently, the evaluation impact estimate methods were adjusted in PY5. We made two adjustments. First, COVID-19 inpatient episodes were removed from the analytic sample. COVID-19 inpatient episodes start the month the beneficiary is admitted for a COVID-19 diagnosis and end at the end of the month following the month of discharge.40 This change mitigates bias from differential prevalence of COVID-19 hospitalization between CEC and comparison group. A total of 7,922 COVID-19 episodes (14,084 beneficiary-months) were removed from the analytic sample (4,716 CEC and 3,206 comparison). The data removed was approximately 2% of the beneficiary months in 2020. Additionally, we added risk-adjusters to capture variations in the timing and intensity of COVID-19 based on the location of CEC and comparison dialysis facilities. These controls mitigate bias from non-symmetric COVID-19 exposure that spills over into ESRD care and the broader healthcare system. Details on AR5 model adjustments and COVID-19 bias mitigation approaches are in Appendix D.
DiD impact estimates are reported as the absolute change in the value of the outcome measure among CEC beneficiaries, relative to the comparison group, and also in terms of the relative percent change of the outcome measures, compared to the pre-CEC period. We report the statistical significance of all results. We present estimates for all ESCOs and each wave, cumulatively and by PY. Detailed results, pre-CEC and post-CEC descriptive statistics, and sample sizes are located in Exhibits D-24 – D-35. The CEC Model focused on improving quality of care and health outcomes in addition to reducing unnecessary healthcare utilization and payments through the coordination of care. ESCOs were encouraged to implement beneficiary-centered care redesign approaches that promoted comprehensive and coordinated care delivery and improved access to services. During each ESCO’s first year of operation, we collected information about ESCO care redesign strategies and early model investments. In their third year of operation, we asked ESCOs how their care redesign strategies had evolved. All ESCOs continued to refine their care redesign strategies as the model matured.
Survival. The primary statistical framework used the Cox proportional hazards (PH) model. The survival time for each patient was measured as the time lag between when a patient was aligned to the CEC Model comparison group and death or censoring, whichever came first. Differing from prior years’ models, for AR5 we included an indicator for COVID-19 diagnosis in PY5. As infected patients tested positive at various time points in 2020, we set the COVID-19 diagnosis indicator as a time-varying indicator, taking ‘0’ before the date of first COVID-19 diagnosis and ‘1’ afterward. In this way, the model assesses the impact of COVID-19 on survival in an unbiased manner.41
We estimated several survival models to understand the relationship between alignment to the CEC Model and survival, our main endpoint. We also fit various models which compared different subpopulations. We began with a model which included the overall population associated
40 To test for robustness of the length of inpatient episode, we extended the length of the COVID-19 inpatient episode
up to four months after the discharge date of the COVID-19 hospitalization. Impact estimates were highly stable and nearly identical to the results found using the COVID-19 inpatient episode definition defined in Exhibit D-19.
41 A second method tested censored patients’ time-at-risk after COVID-19 diagnosis, thereby removing subsequent time-at-risk. Although these two methods had similar results, because the second method eliminated patients’ records after COVID-19 diagnosis, it may compromise the precision of the estimates and is not included in these findings.

Fifth Annual Report CEC Evaluation
40
with the CEC Model. That is, we compared survival in the entire CEC-aligned population (all waves and cohorts) to the entire matched comparison population (i.e., all prevalent beneficiaries).
Next, we fit a model that limited patients’ follow-up period to the first three years after alignment, so that beneficiaries aligned to early joining and later joining waves could contribute to the analysis more proportionally. For example, beneficiaries aligned to Wave 1 PY1 joiners contributed much of the observed patient experience beyond three years of follow-up in the most general model. We considered this sampling approach to test the hypothesis that any impact of the CEC Model on survival would be stronger among those patients who were aligned early in their course of dialysis. This hypothesis was based on the following reasons. First, the CEC Model impact on survival might be stronger for patients in their first year of dialysis (i.e., incident patients) since this is a clinically unstable time during which interventions might be more impactful. Second, unlike more experienced dialysis patients, new patients were less likely to have already developed care referral networks and mechanisms to cope with dialysis-related issues such as transportation, and therefore might be more likely to benefit from CEC interventions.
Finally, to examine whether the impact of the CEC Model on survival differed by wave, we focused on the beneficiaries in Wave 1 PY1 and Wave 2 PY2 joiner facilities. These beneficiaries represented the large majority of each wave. We excluded the later joiners because they had fewer beneficiaries and shorter follow-up than early joiners in Waves 1 and 2, which may limit statistical power to detect differences between cohorts.
Each of the models is adjusted for observable variables that may impact survival, including patient demographics, body mass index (BMI), receipt of pre-ESRD nephrology care (a proxy for having good preparation for dialysis), comorbidities present at onset of ESRD (reported on CMS Form 2728), and a time-varying COVID-19 indicator. Detailed methods and results of the survival model which employs the COVID-19 time-varying indicator appear in Appendix G, with summary information presented in this report.
Site visits. We conducted site visits with ESCO representatives from all participating dialysis organizations during their first and third years of participation in the model. In total, we visited 120 facilities throughout the model and conducted 331 facility and corporate interviews. See Appendix C for a discussion of site visit selection criteria, data collection procedures, protocol development, and analysis methods.
Beneficiary experience. We gathered information from focus groups and beneficiary surveys to evaluate beneficiary experience under CEC. Beneficiary focus groups including 107 beneficiaries over the first four model years were used to address beneficiary perceptions of care. We used the KDQOL-36™ beneficiary survey to quantify the impact of CEC on health-related quality of life and the ICH CAHPS® beneficiary survey to evaluate beneficiary satisfaction with dialysis care. See Appendix F for a discussion of focus group beneficiary selection criteria, recruitment, and data collection and analysis methods. Detailed discussion of the KDQOL-36™ survey and survey administration as well as methods for selecting beneficiaries in the comparison group and estimating regression models are provided in AR3. Detailed discussion of the ICH CAHPS® survey and methods for selecting beneficiaries in the comparison group and estimating regression models are provided in AR4.
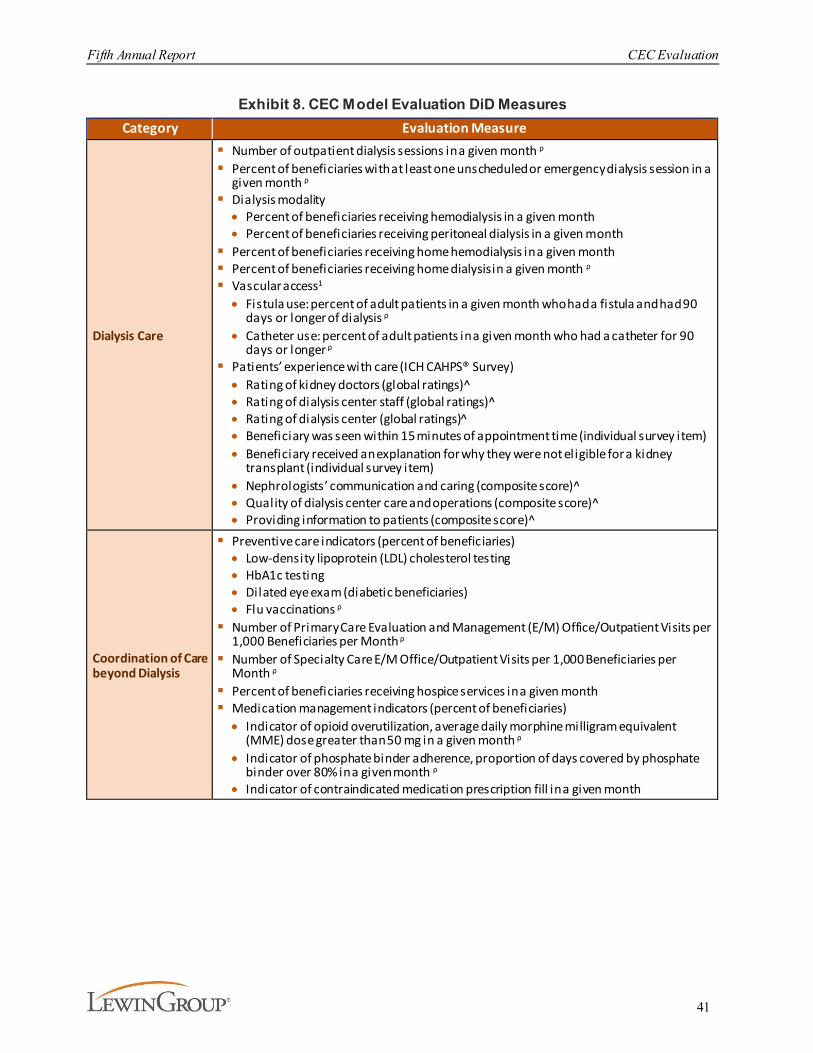
Fifth Annual Report CEC Evaluation
41
Exhibit 8. CEC Model Evaluation DiD MeasuresCategory Evaluation Measure
Dialysis Care
§ Number of outpatient dialysis sessions in a given month ρ
§ Percent of beneficiaries with at least one unscheduled or emergency dialysis session in a given month ρ
§ Dialysis modality· Percent of beneficiaries receiving hemodialysis in a given month· Percent of beneficiaries receiving peritoneal dialysis in a given month
§ Percent of beneficiaries receiving home hemodialysis in a given month§ Percent of beneficiaries receiving home dialysis in a given month ρ
§ Vascular access1
· Fistula use: percent of adult patients in a given month who had a fistula and had 90 days or longer of dialysis ρ
· Catheter use: percent of adult patients in a given month who had a catheter for 90 days or longer ρ
§ Patients’ experience with care (ICH CAHPS® Survey)· Rating of kidney doctors (global ratings)^· Rating of dialysis center staff (global ratings)^· Rating of dialysis center (global ratings)̂· Beneficiary was seen within 15 minutes of appointment time (individual survey item)· Beneficiary received an explanation for why they were not eligible for a kidney
transplant (individual survey item)· Nephrologists’ communication and caring (composite score)^· Quality of dialysis center care and operations (composite score)^· Providing information to patients (composite score)^
Coordination of Care beyond Dialysis
§ Preventive care indicators (percent of beneficiaries)· Low-density lipoprotein (LDL) cholesterol testing · HbA1c testing· Dilated eye exam (diabetic beneficiaries)· Flu vaccinations ρ
§ Number of Primary Care Evaluation and Management (E/M) Office/Outpatient Visits per 1,000 Beneficiaries per Month ρ
§ Number of Specialty Care E/M Office/Outpatient Visits per 1,000 Beneficiaries per Month ρ
§ Percent of beneficiaries receiving hospice services in a given month§ Medication management indicators (percent of beneficiaries)· Indicator of opioid overutilization, average daily morphine milligram equivalent
(MME) dose greater than 50 mg in a given month ρ
· Indicator of phosphate binder adherence, proportion of days covered by phosphate binder over 80% in a given month ρ
· Indicator of contraindicated medication prescription fill in a given month

Fifth Annual Report CEC Evaluation
42
Category Evaluation Measure
Hospitalizations and ED Visits
§ Number of Hospitalizations per 1,000 beneficiaries per month ρ§ Number of ED visits per 1,000 beneficiaries per month ρ§ Number of Observation Stays per 1,000 Beneficiaries per Month ρ
§ Inpatient Hospitalizations· Number of Endocrine/Metabolic Hospitalizations per 1,000 Beneficiaries per Month· Number of Circulatory-related Hospitalizations per 1,000 Beneficiaries per Month· Number of Infection-related Hospitalizations per 1,000 Beneficiaries per Month
§ Percent of beneficiaries with at least one hospitalization for vascular access complications in a given month ρ
§ Percent of beneficiaries with at least one hospitalization for ESRD complications (i.e., volume depletion, hyperpotassemia, fluid overload, heart failure, and pulmonary edema) in a given month ρ
§ Infections· Percent of beneficiaries with at least one hospitalization for a Venous Catheter
Bloodstream Infection in a given month· Percent of Beneficiaries with at least one hospitalization for Peritonitis in a given
month· Percent of beneficiaries with at least one hospitalization for a Percent of Sepsis
Infections in a given month§ Percent of beneficiaries with at least one admission for Ambulatory Care Sensitive
Conditions (ACSC) in a given month· Admissions for diabetes short-term and or long-term complications (National Quality
Forum (NQF) #0272 or NQF#0274)· Admissions for (CHF (NQF#0277)
§ Percent of beneficiaries with at least one readmission in a given month ρ
§ Percent of beneficiaries with at least one ED visit within 30-days of an acute hospitalization in a given month ρ
Medicare Payments across the Continuum of Care
§ Average Part A and Part B Medicare payments PBPM ρ§ Average payments PBPM for the following services: inpatient ρ, readmissions ρ,
institutional PAC ρ, home health ρ, hospice, outpatient, office visits ρ, total Part B, dialysis care ρ, hospitalizations for ESRD complications, and Part B drug42
Unintended Consequences
§ Total Part D Drug Cost PBPM ρ
§ Total Part D Phosphate Binder Drug Cost PBPM ρ
Notes: Medicare payments were standardized to remove the effects of Medicare’s geographic wage, teaching and other payment adjustments. (^) Denotes measures included in the CEC Total Quality Score (T QS). (ρ) Denotes measures evaluated through PY5. All other measures are evaluated through PY4.
Analytic sample. The final sample consisted of 151,892 CEC beneficiaries (61,211 in Wave 1 and 90,681 in Wave 2), and 136,716 comparison beneficiaries. The analytic sample included all the eligible and aligned monthly beneficiary observations between January 2014 and December 2020. Across ESCO waves and the comparison group, beneficiaries were similar in terms of demographic and clinical characteristics. Both CEC and comparison beneficiaries were around 44% female, averaged 63 years in age, and had been on dialysis for an average of 40 months. More than 92% of beneficiaries in all three groups used hemodialysis. Compared to Wave 1, Wave 2 CEC facilities had larger proportions of White (48% and 42%) and had slightly fewer Black beneficiaries (40% and 42%) (see Exhibit D-15). The composition of the CEC analytic
42 Medicare Part A and B payment categories include all beneficiary months and are not conditioned to whether a
beneficiary received that specific service, hence payments can be zero in a given beneficiary month.
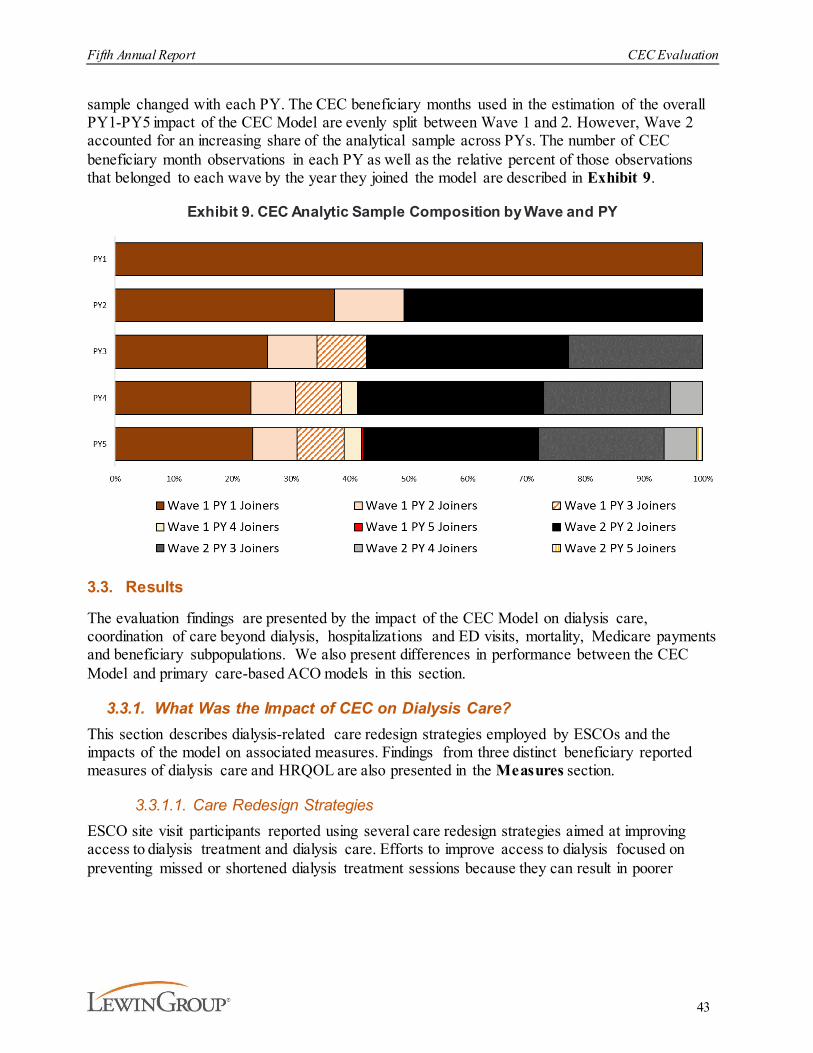
Fifth Annual Report CEC Evaluation
43
sample changed with each PY. The CEC beneficiary months used in the estimation of the overall PY1-PY5 impact of the CEC Model are evenly split between Wave 1 and 2. However, Wave 2 accounted for an increasing share of the analytical sample across PYs. The number of CEC beneficiary month observations in each PY as well as the relative percent of those observations that belonged to each wave by the year they joined the model are described in Exhibit 9.
Exhibit 9. CEC Analytic Sample Composition by Wave and PY
3.3. Results
The evaluation findings are presented by the impact of the CEC Model on dialysis care, coordination of care beyond dialysis, hospitalizations and ED visits, mortality, Medicare payments and beneficiary subpopulations. We also present differences in performance between the CEC Model and primary care-based ACO models in this section.
3.3.1. What Was the Impact of CEC on Dialysis Care?This section describes dialysis-related care redesign strategies employed by ESCOs and the impacts of the model on associated measures. Findings from three distinct beneficiary reported measures of dialysis care and HRQOL are also presented in the Measures section.
3.3.1.1. Care Redesign StrategiesESCO site visit participants reported using several care redesign strategies aimed at improving access to dialysis treatment and dialysis care. Efforts to improve access to dialysis focused on preventing missed or shortened dialysis treatment sessions because they can result in poorer
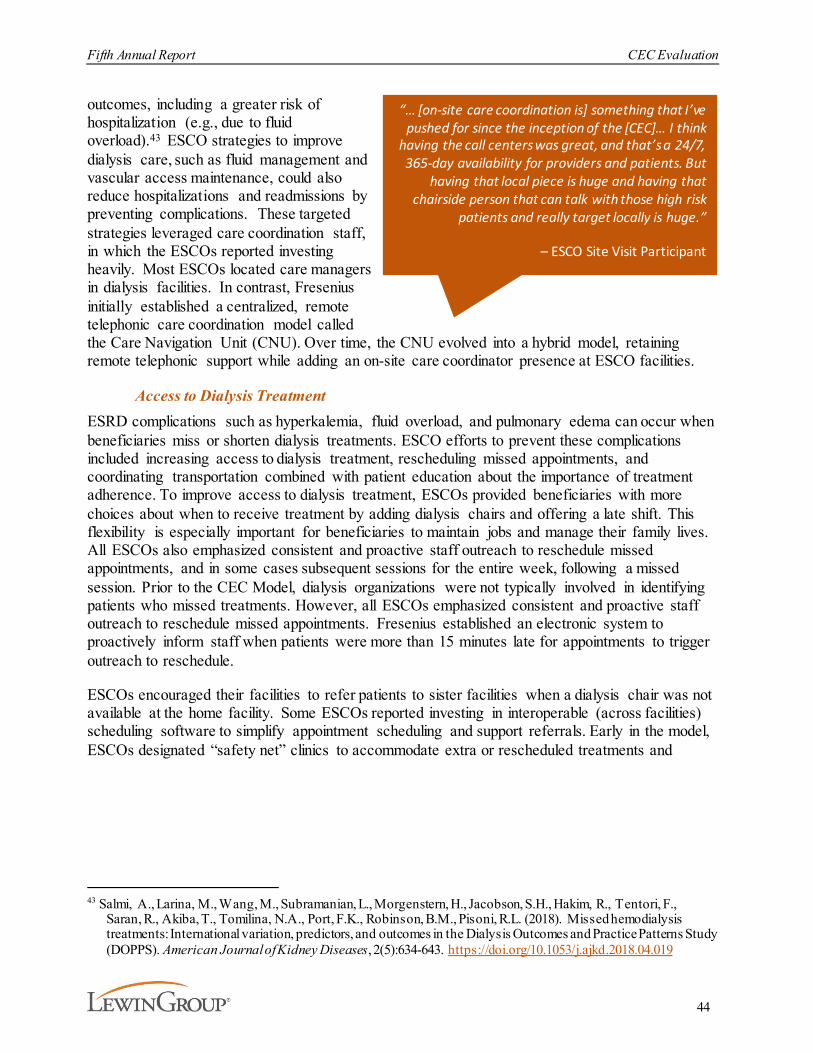
Fifth Annual Report CEC Evaluation
44
outcomes, including a greater risk of hospitalization (e.g., due to fluid overload).43 ESCO strategies to improve dialysis care, such as fluid management and vascular access maintenance, could also reduce hospitalizations and readmissions by preventing complications. These targeted strategies leveraged care coordination staff, in which the ESCOs reported investing heavily. Most ESCOs located care managers in dialysis facilities. In contrast, Fresenius initially established a centralized, remote telephonic care coordination model called the Care Navigation Unit (CNU). Over time, the CNU evolved into a hybrid model, retaining remote telephonic support while adding an on-site care coordinator presence at ESCO facilities.
Access to Dialysis TreatmentESRD complications such as hyperkalemia, fluid overload, and pulmonary edema can occur when beneficiaries miss or shorten dialysis treatments. ESCO efforts to prevent these complications included increasing access to dialysis treatment, rescheduling missed appointments, and coordinating transportation combined with patient education about the importance of treatment adherence. To improve access to dialysis treatment, ESCOs provided beneficiaries with more choices about when to receive treatment by adding dialysis chairs and offering a late shift. This flexibility is especially important for beneficiaries to maintain jobs and manage their family lives. All ESCOs also emphasized consistent and proactive staff outreach to reschedule missed appointments, and in some cases subsequent sessions for the entire week, following a missed session. Prior to the CEC Model, dialysis organizations were not typically involved in identifying patients who missed treatments. However, all ESCOs emphasized consistent and proactive staff outreach to reschedule missed appointments. Fresenius established an electronic system to proactively inform staff when patients were more than 15 minutes late for appointments to trigger outreach to reschedule.
ESCOs encouraged their facilities to refer patients to sister facilities when a dialysis chair was not available at the home facility. Some ESCOs reported investing in interoperable (across facilities) scheduling software to simplify appointment scheduling and support referrals. Early in the model, ESCOs designated “safety net” clinics to accommodate extra or rescheduled treatments and
43 Salmi, A., Larina, M., Wang, M., Subramanian, L., Morgenstern, H., Jacobson, S.H., Hakim, R., Tentori, F.,
Saran, R., Akiba, T., Tomilina, N.A., Port, F.K., Robinson, B.M., Pisoni, R.L. (2018). Missed hemodialysis treatments: International variation, predictors, and outcomes in the Dialysis Outcomes and Practice Patterns Study (DOPPS). American Journal of Kidney Diseases, 2(5):634-643. https://doi.org/10.1053/j.ajkd.2018.04.019
“… [on-site care coordination is] something that I’ve pushed for since the inception of the [CEC]… I think
having the call centers was great, and that’s a 24/7, 365-day availability for providers and patients. But
having that local piece is huge and having that chairside person that can talk with those high risk
patients and really target locally is huge.”
– ESCO Site Visit Participant
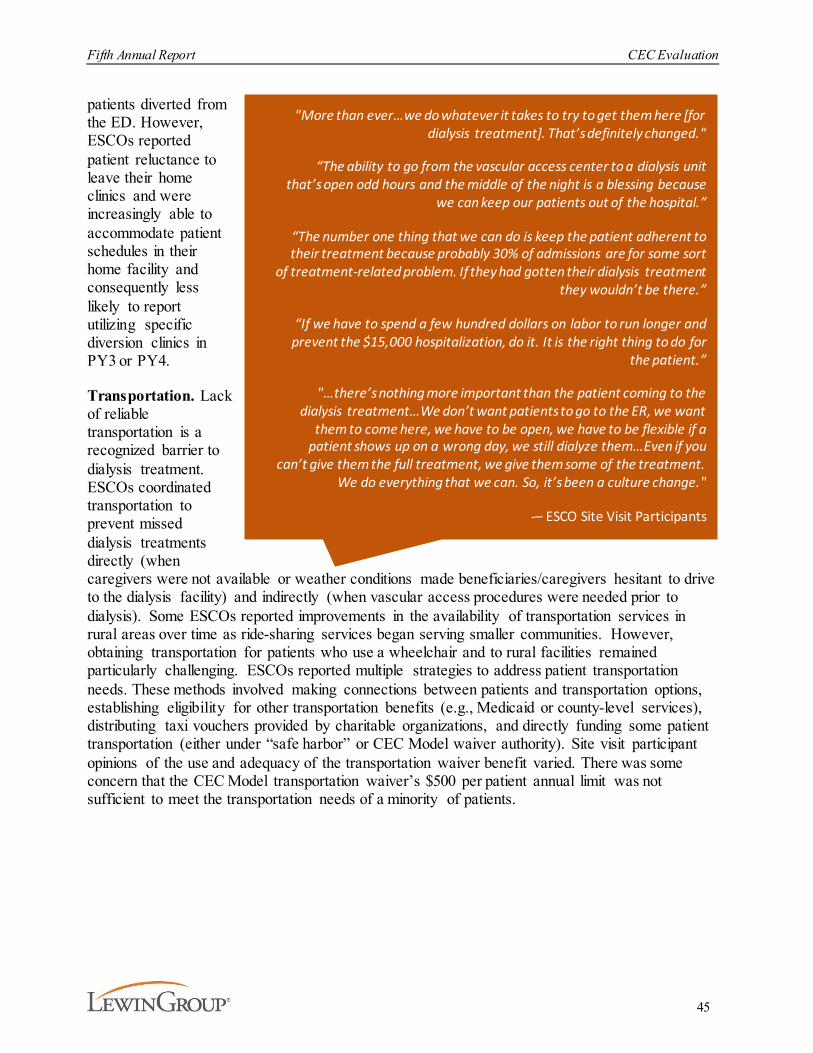
Fifth Annual Report CEC Evaluation
45
patients diverted from the ED. However, ESCOs reported patient reluctance to leave their home clinics and were increasingly able to accommodate patient schedules in their home facility and consequently less likely to report utilizing specific diversion clinics in PY3 or PY4.
Transportation. Lack of reliable transportation is a recognized barrier to dialysis treatment. ESCOs coordinated transportation to prevent missed dialysis treatments directly (when caregivers were not available or weather conditions made beneficiaries/caregivers hesitant to drive to the dialysis facility) and indirectly (when vascular access procedures were needed prior to dialysis). Some ESCOs reported improvements in the availability of transportation services in rural areas over time as ride-sharing services began serving smaller communities. However, obtaining transportation for patients who use a wheelchair and to rural facilities remained particularly challenging. ESCOs reported multiple strategies to address patient transportation needs. These methods involved making connections between patients and transportation options, establishing eligibility for other transportation benefits (e.g., Medicaid or county-level services), distributing taxi vouchers provided by charitable organizations, and directly funding some patient transportation (either under “safe harbor” or CEC Model waiver authority). Site visit participant opinions of the use and adequacy of the transportation waiver benefit varied. There was some concern that the CEC Model transportation waiver’s $500 per patient annual limit was not sufficient to meet the transportation needs of a minority of patients.
"More than ever…we do whatever it takes to try to get them here [for dialysis treatment]. That’s definitely changed."
“The ability to go from the vascular access center to a dialysis unit that’s open odd hours and the middle of the night is a blessing because
we can keep our patients out of the hospital.”
“The number one thing that we can do is keep the patient adherent to their treatment because probably 30% of admissions are for some sort
of treatment-related problem. If they had gotten their dialysis treatment they wouldn’t be there.”
“If we have to spend a few hundred dollars on labor to run longer and prevent the $15,000 hospitalization, do it. It is the right thing to do for
the patient.”
"…there’s nothing more important than the patient coming to the dialysis treatment…We don’t want patients to go to the ER, we want
them to come here, we have to be open, we have to be flexible if a patient shows up on a wrong day, we still dialyze them…Even if you
can’t give them the full treatment, we give them some of the treatment. We do everything that we can. So, it’s been a culture change."
-– ESCO Site Visit Participants
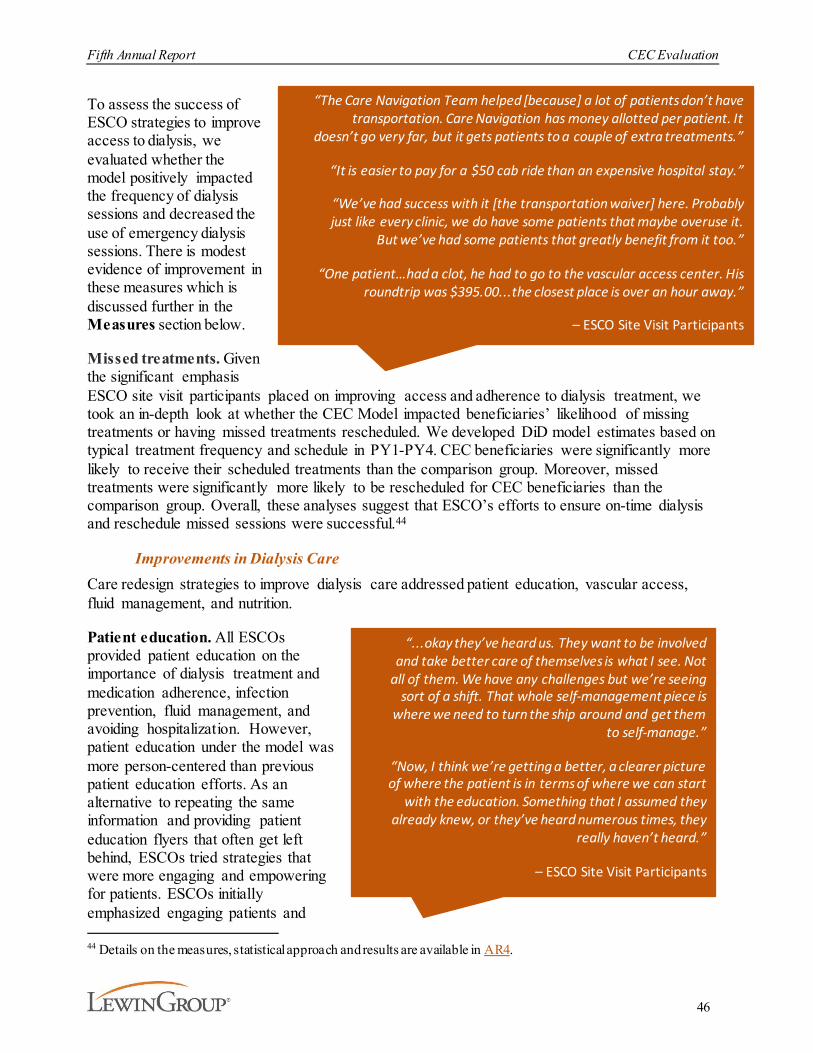
Fifth Annual Report CEC Evaluation
46
To assess the success of ESCO strategies to improve access to dialysis, we evaluated whether the model positively impacted the frequency of dialysis sessions and decreased the use of emergency dialysis sessions. There is modest evidence of improvement in these measures which is discussed further in the Measures section below.
Missed treatments. Given the significant emphasis ESCO site visit participants placed on improving access and adherence to dialysis treatment, we took an in-depth look at whether the CEC Model impacted beneficiaries’ likelihood of missing treatments or having missed treatments rescheduled. We developed DiD model estimates based on typical treatment frequency and schedule in PY1-PY4. CEC beneficiaries were significantly more likely to receive their scheduled treatments than the comparison group. Moreover, missed treatments were significantly more likely to be rescheduled for CEC beneficiaries than the comparison group. Overall, these analyses suggest that ESCO’s efforts to ensure on-time dialysis and reschedule missed sessions were successful.44
Improvements in Dialysis CareCare redesign strategies to improve dialysis care addressed patient education, vascular access, fluid management, and nutrition.
Patient education. All ESCOs provided patient education on the importance of dialysis treatment and medication adherence, infection prevention, fluid management, and avoiding hospitalization. However, patient education under the model was more person-centered than previous patient education efforts. As an alternative to repeating the same information and providing patient education flyers that often get left behind, ESCOs tried strategies that were more engaging and empowering for patients. ESCOs initially emphasized engaging patients and 44 Details on the measures, statistical approach and results are available in AR4.
“The Care Navigation Team helped [because] a lot of patients don’t have transportation. Care Navigation has money allotted per patient. It
doesn’t go very far, but it gets patients to a couple of extra treatments.”
“It is easier to pay for a $50 cab ride than an expensive hospital stay.”
“We’ve had success with it [the transportation waiver] here. Probably just like every clinic, we do have some patients that maybe overuse it.
But we’ve had some patients that greatly benefit from it too.”
“One patient…had a clot, he had to go to the vascular access center. His roundtrip was $395.00...the closest place is over an hour away.”
– ESCO Site Visit Participants
“...okay they’ve heard us. They want to be involved and take better care of themselves is what I see. Not
all of them. We have any challenges but we’re seeing sort of a shift. That whole self-management piece is
where we need to turn the ship around and get them to self-manage.”
“Now, I think we’re getting a better, a clearer picture of where the patient is in terms of where we can start
with the education. Something that I assumed they already knew, or they’ve heard numerous times, they
really haven’t heard.”
– ESCO Site Visit Participants
Fifth Annual Report CEC Evaluation
47
caregivers as early as possible. In the later years of the model, ESCOs highlighted the importance of having multiple providers (staff and nephrologists) reinforce the educational messages to help patients remember and follow the agreed upon treatment plan. Some ESCOs also established patient advisory groups as a forum for patient and staff representatives to collaboratively address opportunities for improving care within the dialysis facilities. One non-LDO hired non-clinician individuals with personal or family dialysis experience as “patient navigators” to talk with patients, listen to their concerns, and relay concerns to appropriate facility staff.
Vascular access. Because infections and infection-related hospitalizations often occur in chronic dialysis patients with tunneled catheters for vascular access, ESCOs focused additional resources on successful creation of AV fistulas, which is the most preferred access type, and AV grafts which have lower risk of infections and other complications compared to long term catheters. To promote use of AV grafts and fistulas over catheters and expedite vascular access maintenance, ESCOs established partnerships with vascular surgeons and dedicated vascular access coordinators who functioned as schedulers and communication liaisons between the ESCO nephrologists and the vascular surgeon and provided patient education on infection prevention and fistula maintenance. ESCOs also coordinated transportation to vascular surgeon appointments. Site visit participants also reported that nephrologists increasingly based referrals to vascular surgeons on better beneficiary outcomes over proximity, creating a completely new referral pattern for many nephrologists.
To assess the extent to which ESCOs focused on improving vascular access, we investigated the impact of the model on the percent of beneficiaries who used catheters and fistulas. There was a decline in the percent of beneficiaries who used catheters as their vascular access and no change in fistula use, which is discussed further in the Measures section below.
Fluid management. ESCOs reported more closely monitoring clinical indicators (e.g., albumin, blood pressure, and weight) early in the model and emphasized more proactively managing fluid levels in PY3 and PY4. In addition to patient education and providing extra dialysis treatments to
ESCO Example: Patient Education· Investing in a button-maker to make buttons for staff to wear on their lab coats. Messages like,
"Did you take your binders?" and "Make sure you are washing your hands" were changed monthly
· Providing a stethoscope following catheter removal so patients could listen to their fistula and identify when it doesn’t sound the way it should
“When new admissions come in, we…tell them we’re a non-catheter clinic…if [education] starts from the beginning and
you have the attention of the caregivers, it’s going to make a huge difference.”
“Our doctors are taking a hardline approach with our [vascular] surgeons…if it’s not best for the patient and they’re
not doing what we need them to do [or] we can’t get our patients in timely, then we’re going to…go to a different
doctor. I think the ESCO has driven that.”
– ESCO Site Visit Participants
Fifth Annual Report CEC Evaluation
48
manage fluid overload and prevent hospitalization, ESCOs reported setting goals for patients and facilities, developing monitoring dashboards, and improving processes.
Nutrition. For beneficiaries with ESRD, following a nutrition plan that limits potassium and phosphorus while optimizing protein intake can be extremely challenging, yet failure to do so can be associated with long-term complications. ESCOs consistently mentioned challenges with patient adherence to nutrition guidelines. Some ESCOs provided patients with oral nutritional supplements (ONS). The CEC Model included a waiver allowing ESCOs to provide beneficiaries with ONS when needed to maintain serum albumin levels, subject to cost restrictions. Initially, Fresenius Wave 1 ESCOs and one non-LDO provided ONS for aligned beneficiaries meeting the waiver albumin level under the CEC Model waiver authority. Others declined use of the waiver because they were providing equivalent nutritional services and they disliked what they perceived to be administrative burdens of the waiver. By PY3, Fresenius discontinued use due to lack of evidence that it changed outcomes, concerns about whether patients took the supplements and the overall cost, and the existence of other supplement options.
In PY4, Wave 2 ESCO site visit participants acknowledged food insecurity as a challenge for beneficiaries with lower incomes. ESCOs described cultural, transportation, and eligibility-related limitations to available resources and suggested that some patients preferred receiving treatment at hospitals because it provided access to meals. One Wave 2 ESCO suggested that food insecurity is increasing. In response, the ESCO started a pilot program with a food bank in PY4. The food bank provided food to beneficiaries at the facility twice a month.
3.3.1.2. MeasuresWe investigated how the CEC Model impacted the delivery and quality of dialysis-related care provided by dialysis facilities and nephrologists, the focal points of care within an ESCO. To assess care delivery and quality, we used available evidence-based clinical metrics to capture dialysis treatment adherence, vascular access, and beneficiaries’ experience with dialysis care. We highlighted these measures in the logic model as dialysis best practices under the sections for new behaviors and investments/drivers of change, as well as outputs and, ultimately, patient outcomes (see Appendix B).
At present, there is an established Pay-for-Performance (P4P) program, the ESRD QIP, which provides financial incentives for all dialysis facilities, regardless of CEC participation, to improve many of these measures. Likewise, public quality reporting through Dialysis Facility Compare also applies to all facilities and may provide indirect incentives (e.g., through influencing patient choice of facility) to maintain or improve quality. Therefore, we did not anticipate that the CEC Model would result in dramatic changes in these measures, with the possible exception of a shift in vascular access initiation or adherence to dialysis, as improvements in those metrics could result in savings in other areas (e.g., procedures, hospitalizations). Moreover, efforts to improve vascular access and dialysis adherence were often noted at the ESCO site visits.
“Since the ESCO has been implemented, we have so much more reporting tools. Like we have a fluid
management dashboard, so we can go in there daily if need be and look to see. Okay, where can we intervene and offer an extra treatment to this patient who is consistently leaving two kilos up to
keep them out of the hospital?”
– ESCO Site Visit Participant
Fifth Annual Report CEC Evaluation
49
Overall, our analyses revealed that dialysis treatment adherence and vascular access practices improved for CEC beneficiaries, but there was no evidence of any change in modality or in their experience with care. CEC beneficiaries in Wave 1 ESCOs had stronger results, likely due to greater motivation by Wave 1 ESCOs to participate in the model. Despite the dwindling gap in tenure between Wave 1 and Wave 2, Wave 2 did not perform as well as Wave 1.
Dialysis Treatment Adherence and Modality
ESCOs reported improvement in patient adherence to dialysis treatment (including fewer patients ending their dialysis sessions early) and attributed the improvement to the care redesign strategies implemented under the CEC Model. However, the success of these strategies may be offset by an emerging treatment protocol. One Wave 2 ESCO participant reported successfully providing twice weekly dialysis to new patients with reasonable residual renal function for the first six months to a year of treatment. Most hemodialysis patients in the U.S. receive treatments three times per week, regardless of whether or not they have residual kidney function, which is in contrast to peritoneal dialysis where residual kidney function is included in the overall dialysis prescription. In fact, data from the DOPPS practice monitor indicate that <3% of patients currently receive twice weekly hemodialysis.45 Similarly, 5 % of CEC and comparison beneficiaries receive just two dialysis sessions per week. However, in the past few years, observational studies have provided some evidence that, when starting renal replacement therapy, twice weekly hemodialysis may provide similar survival benefit, prolonged residual kidney function, and perhaps greater quality of life among patients with residual kidney function than conventional thrice weekly treatments. This outcome was seen particularly in patients with fewer co-occurring health conditions.46 This strategy received increased attention during the COVID-19 PHE as a way of both potentially limiting transmission within dialysis facilities as well as addressing facility staffing shortages. While adherence to a twice per week treatment regimen may initially be easier, challenges can arise when transitioning to thrice weekly dialysis if patients do not accept the need for incremental dialysis, and adherence can potentially decline.
To assess the success of these strategies, we evaluated whether the model positively impacted the frequency of dialysis sessions and decreased the use of emergency dialysis sessions. There is modest evidence that supports improvement in these measures across PY1-PY5. Overall, outpatient dialysis sessions increased by 0.4%, (p<0.01), which translates into an increase of 49 outpatient sessions per 1,000 beneficiaries per month among CEC beneficiaries.47 This change reflected both an increase in
45 Arbor Research Collaborative for Health. (2021). US DOPPS practice monitor. http://www.dopps.org/DPM 46 Mathew, A., Obi, Y., Rhee, C.M., Chen, J.L., Shah, G., Lau, W.L., Kovesdy, C.P., Mehrotra, R. Kalantar-Zadeh, K.
(2016). Treatment frequency and mortality among incident hemodialysis patients in the United States comparing incremental with standard and more frequent dialysis. Kidney International, 90: 1071–1079.Obi, Y., Eriguchi, R., Ou, S.M., Rhee, C.M., Kalantar-Zadeh, K. (2015). What is known and unknown about twice-weekly hemodialysis. Blood Purification, 40: 298–305. https://doi.org/10.1016/j.kint.2016.05.028 Obi, Y., Streja, E., Rhee, C.M., Ravel, V., Amin, A.N., Cupisti, A., Chen, J., Mathew, A., Kovesdy, C.P., Mehrotra, R., Kalantar-Zadeh, K. (2016). Incremental hemodialysis, residual kidney function, and mortality risk in incident dialysis patients: A cohort study. American Journal of Kidney Diseases, 68: 256–265. https://doi.org/10.1053/j.ajkd.2016.01.008
47 DiD values are estimated at the PBPM level and transformed post estimation to per 1,000 beneficiaries per month values. Since the per 1,000 beneficiaries per month values are linear transformations of the PBPM DiD estimates, the percent change values are identical for bo th levels.
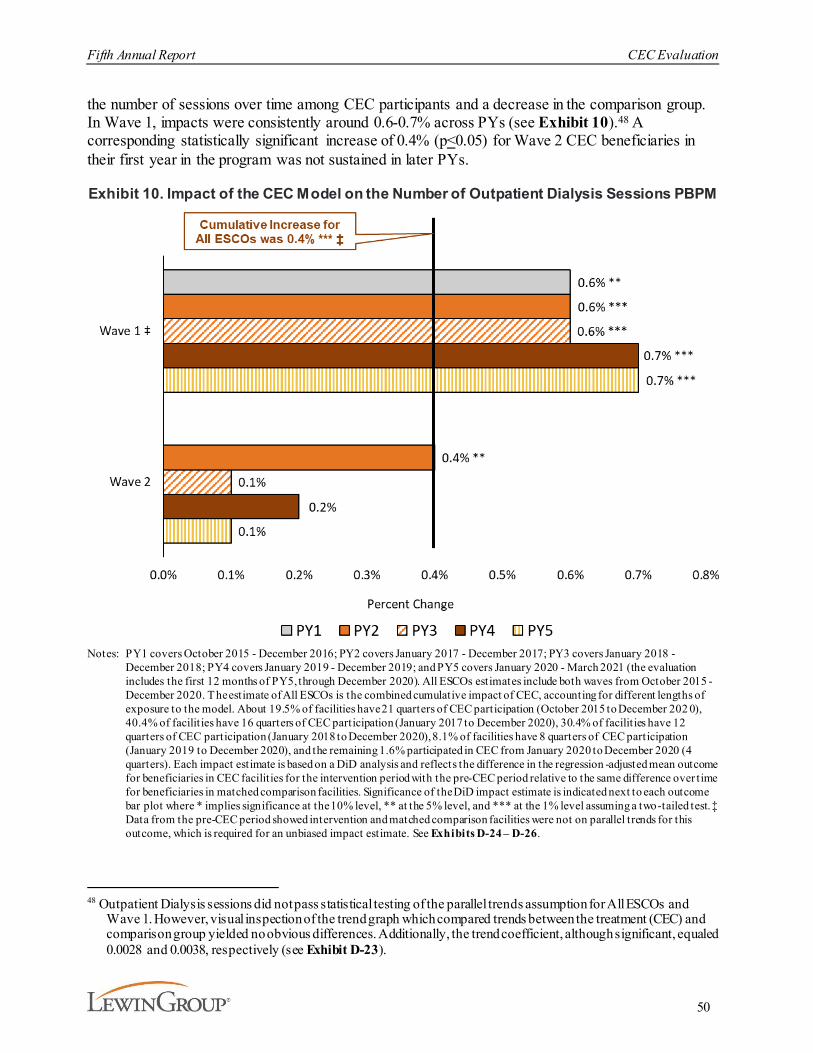
Fifth Annual Report CEC Evaluation
50
the number of sessions over time among CEC participants and a decrease in the comparison group. In Wave 1, impacts were consistently around 0.6-0.7% across PYs (see Exhibit 10).48 A corresponding statistically significant increase of 0.4% (p<0.05) for Wave 2 CEC beneficiaries in their first year in the program was not sustained in later PYs.
Exhibit 10. Impact of the CEC Model on the Number of Outpatient Dialysis Sessions PBPM
Notes: PY1 covers October 2015 - December 2016; PY2 covers January 2017 - December 2017; PY3 covers January 2018 - December 2018; PY4 covers January 2019 - December 2019; and PY5 covers January 2020 - March 2021 (the evaluation includes the first 12 months of PY5, through December 2020). All ESCOs estimates include both waves from October 2015 - December 2020. The estimate of All ESCOs is the combined cumulative impact of CEC, accounting for different lengths of exposure to the model. About 19.5% of facilities have 21 quarters of CEC participation (October 2015 to December 202 0), 40.4% of facilit ies have 16 quarters of CEC participation (January 2017 to December 2020), 30.4% of facilit ies have 12 quarters of CEC participation (January 2018 to December 2020), 8.1% of facilities have 8 quarters of CEC participation (January 2019 to December 2020), and the remaining 1.6% participated in CEC from January 2020 to December 2020 (4 quarters). Each impact estimate is based on a DiD analysis and reflects the difference in the regression -adjusted mean outcome for beneficiaries in CEC facilit ies for the intervention period with the pre-CEC period relative to the same difference over time for beneficiaries in matched comparison facilities. Significance of the DiD impact estimate is indicated next to each outcome bar plot where * implies significance at the 10% level, ** at the 5% level, and *** at the 1% level assuming a two-tailed test. ‡ Data from the pre-CEC period showed intervention and matched comparison facilities were not on parallel trends for this outcome, which is required for an unbiased impact estimate. See Exhibits D-24 – D-26.
48 Outpatient Dialysis sessions did not pass statistical testing of the parallel trends assumption for All ESCOs and
Wave 1. However, visual inspection of the trend graph which compared trends between the treatment (CEC) and comparison group yielded no obvious differences. Additionally, the trend coefficient, although significant, equaled 0.0028 and 0.0038, respectively (see Exhibit D-23).

Fifth Annual Report CEC Evaluation
51
Overall, the results are consistent with the expectation that the CEC Model would create incentives to avoid or reschedule missed treatments in the outpatient setting and with the efforts reported by Wave 1 ESCOs. The number of dialysis sessions increased for CEC beneficiaries but decreased for the comparison group from the pre-CEC to the intervention period.
In aggregate, the total number of outpatient dialysis sessions increased by about 13,000, 25,000, 21,000, 29,000, and 21,000 relative to the comparison group in PY1, PY2, PY3, PY4, and PY5 respectively (see Exhibit 11).49 The increases in the aggregate number of dialysis sessions are compounded by the growth in the number of CEC beneficiaries over time.
Exhibit 11. Impact of the CEC Model on the Aggregate Number of Outpatient Dialysis Sessions
Notes: Significance of the DiD impact estimate is indicated next to each outcome bar plot where * implies significance at the 10% level, ** at the 5% level, and *** at the 1% level assuming a two-tailed test. Aggregate estimates are based on the estimated total number of aligned intervention member months for the 1,054 CEC facilit ies participating in the CEC Model. ‡ Data from the pre-CEC period showed intervention and matched comparison facilities were not on parallel trends for this outcome, which is required for an unbiased impact estimate.
49 Aggregate estimates are based on the number of aligned performance period CEC member months and the PBPM
DiD estimate for each outcome. For example, aggregate PY1 increased number of dialysis sessions equals 192,844 member months multiplied by 0.0679 PBPM dialysis sessions, which equals approximately 13,112 more estimated dialysis sessions in PY1.

Fifth Annual Report CEC Evaluation
52
Emergency dialysis sessions (i.e., dialysis sessions that are unscheduled and occur in a non-dialysis facility setting) declined by 3% relative to the pre-CEC period, but this change was not statistically significant (see Exhibit 12). However, an overall decline is expected as the increase in outpatient sessions should lead to a reduced need for emergency dialysis sessions. A shift from emergency to outpatient sessions would also be consistent with ESCOs’ emphasis on strategies to improve patient adherence, as described above. The CEC Model also increased the coordination of and payment for transportation to ESRD-related appointments, a significant barrier to access to dialysis care, which may have contributed to the decline in use of emergency dialysis sessions for Wave 2 ESCOs. Although emergency dialysis sessions declined in for both Wave 1 and Wave 2 ESCOs in PY1 and PY2, only the Wave 2 PY2 result was statistically significant.
Exhibit 12. Impact of the CEC Model on the Likelihood of Receiving Emergency Dialysis in a Given Month
Notes: PY1 covers October 2015 - December 2016; PY2 covers January 2017 - December 2017; PY3 covers January 2018 - December 2018; PY4 covers January 2019 - December 2019; and PY5 covers January 2020 - March 2021 (the evaluation includes the first 12 months of PY5, through December 2020). All ESCOs estimates include both waves from October 2015 - December 2020. T he estimate of All ESCOs is the combined cumulative impact of CEC, accounting for different lengths of exposure to the model. About 19.5% of facilities have 21 quarters of CEC participation (October 2015 to December 2020), 40.4% of facilit ies have 16 quarters of CEC participation (January 2017 to December 2020), 30.4% of facilit ies have 12 quarters of CEC participation (January 2018 to December 2020), 8.1% of facilit ies have 8 quarters of CEC participation (January 2019 to December 2020), and the remaining 1.6% participated in CEC from January 2020 to December 2020 (4 quarters). Each impact estimate is based on a DiD analysis and reflects the difference in the regression -adjusted mean outcome for beneficiaries in CEC facilit ies for the intervention period with the pre-CEC period relative to the same difference
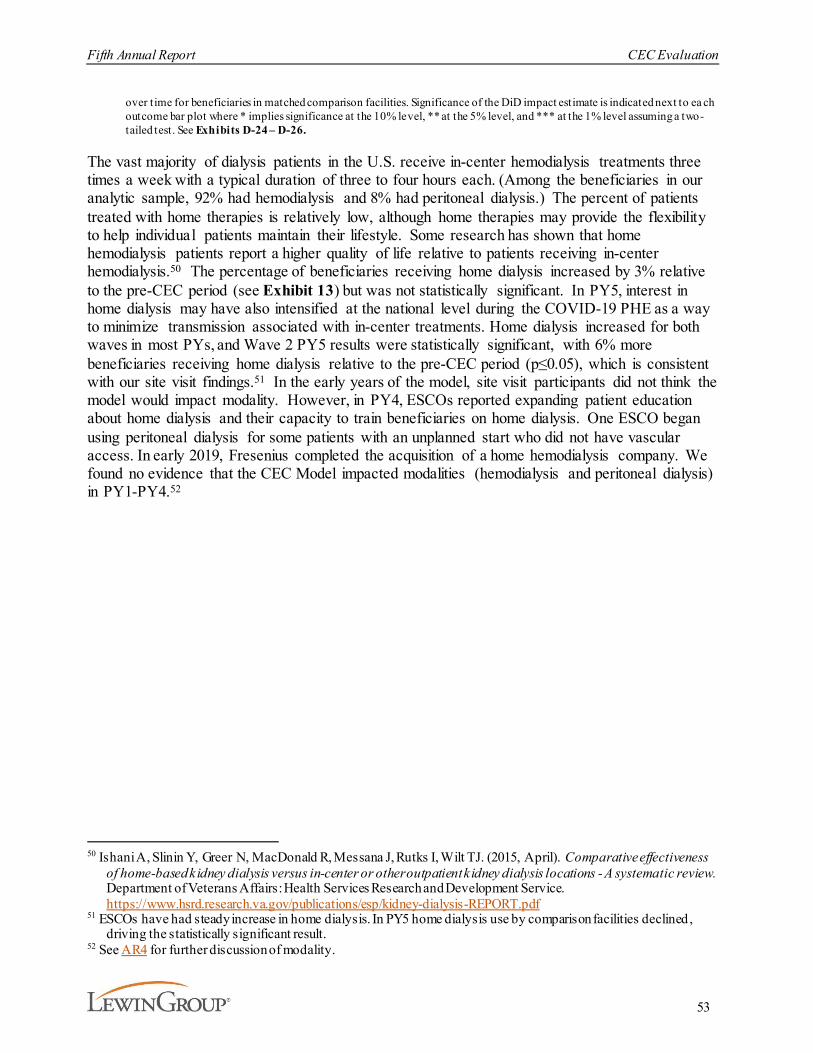
Fifth Annual Report CEC Evaluation
53
over time for beneficiaries in matched comparison facilities. Significance of the DiD impact estimate is indicated next to ea ch outcome bar plot where * implies significance at the 10% level, ** at the 5% level, and *** at the 1% level assuming a two-tailed test. See Exhibits D-24 – D-26.
The vast majority of dialysis patients in the U.S. receive in-center hemodialysis treatments three times a week with a typical duration of three to four hours each. (Among the beneficiaries in our analytic sample, 92% had hemodialysis and 8% had peritoneal dialysis.) The percent of patients treated with home therapies is relatively low, although home therapies may provide the flexibility to help individual patients maintain their lifestyle. Some research has shown that home hemodialysis patients report a higher quality of life relative to patients receiving in-center hemodialysis.50 The percentage of beneficiaries receiving home dialysis increased by 3% relative to the pre-CEC period (see Exhibit 13) but was not statistically significant. In PY5, interest in home dialysis may have also intensified at the national level during the COVID-19 PHE as a way to minimize transmission associated with in-center treatments. Home dialysis increased for both waves in most PYs, and Wave 2 PY5 results were statistically significant, with 6% more beneficiaries receiving home dialysis relative to the pre-CEC period (p≤0.05), which is consistent with our site visit findings.51 In the early years of the model, site visit participants did not think the model would impact modality. However, in PY4, ESCOs reported expanding patient education about home dialysis and their capacity to train beneficiaries on home dialysis. One ESCO began using peritoneal dialysis for some patients with an unplanned start who did not have vascular access. In early 2019, Fresenius completed the acquisition of a home hemodialysis company. We found no evidence that the CEC Model impacted modalities (hemodialysis and peritoneal dialysis) in PY1-PY4.52
50 Ishani A, Slinin Y, Greer N, MacDonald R, Messana J, Rutks I, Wilt TJ. (2015, April). Comparative effectiveness
of home-based kidney dialysis versus in-center or other outpatient kidney dialysis locations - A systematic review. Department of Veterans Affairs: Health Services Research and Development Service. https://www.hsrd.research.va.gov/publications/esp/kidney-dialysis-REPORT.pdf
51 ESCOs have had steady increase in home dialysis. In PY5 home dialysis use by comparison facilities declined, driving the statistically significant result.
52 See AR4 for further discussion of modality.
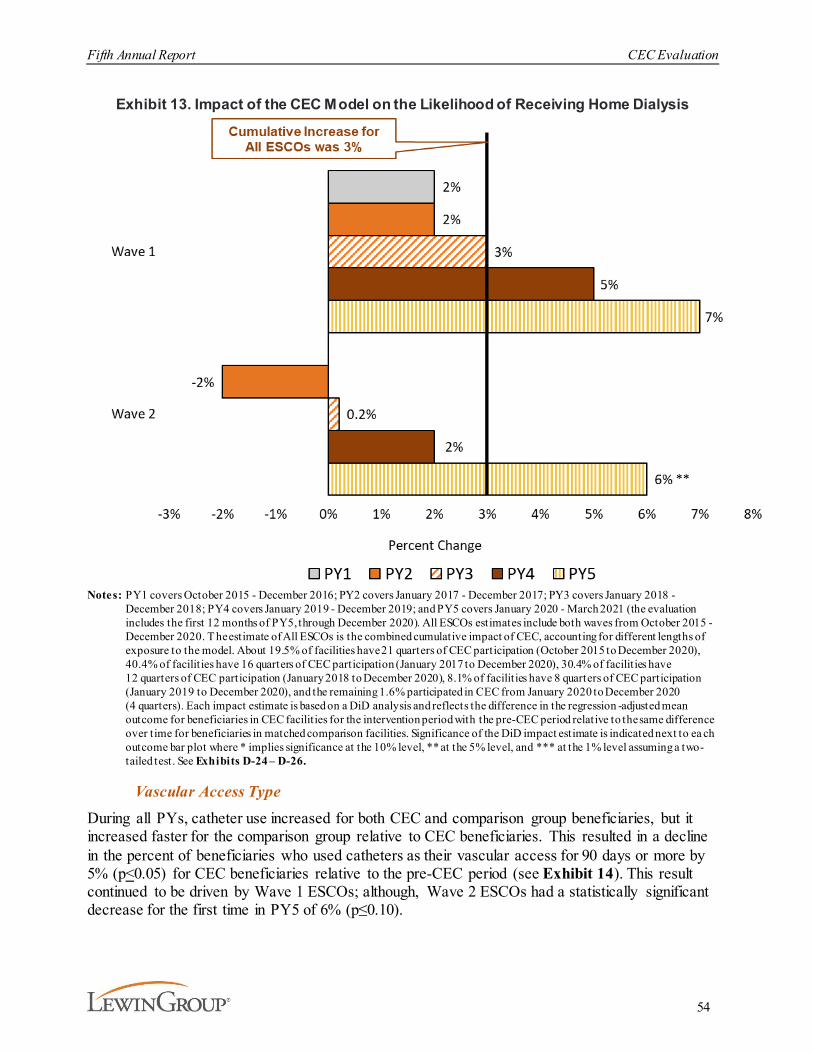
Fifth Annual Report CEC Evaluation
54
Exhibit 13. Impact of the CEC Model on the Likelihood of Receiving Home Dialysis
Notes: PY1 covers October 2015 - December 2016; PY2 covers January 2017 - December 2017; PY3 covers January 2018 - December 2018; PY4 covers January 2019 - December 2019; and PY5 covers January 2020 - March 2021 (the evaluation includes the first 12 months of PY5, through December 2020). All ESCOs estimates include both waves from October 2015 - December 2020. T he estimate of All ESCOs is the combined cumulative impact of CEC, accounting for different lengths of exposure to the model. About 19.5% of facilities have 21 quarters of CEC participation (October 2015 to December 2020), 40.4% of facilit ies have 16 quarters of CEC participation (January 2017 to December 2020), 30.4% of facilit ies have 12 quarters of CEC participation (January 2018 to December 2020), 8.1% of facilit ies have 8 quarters of CEC participation (January 2019 to December 2020), and the remaining 1.6% participated in CEC from January 2020 to December 2020 (4 quarters). Each impact estimate is based on a DiD analysis and reflects the difference in the regression -adjusted mean outcome for beneficiaries in CEC facilit ies for the intervention period with the pre-CEC period relative to the same difference over time for beneficiaries in matched comparison facilities. Significance of the DiD impact estimate is indicated next to ea ch outcome bar plot where * implies significance at the 10% level, ** at the 5% level, and *** at the 1% level assuming a two-tailed test. See Exhibits D-24 – D-26.
Vascular Access Type
During all PYs, catheter use increased for both CEC and comparison group beneficiaries, but it increased faster for the comparison group relative to CEC beneficiaries. This resulted in a decline in the percent of beneficiaries who used catheters as their vascular access for 90 days or more by 5% (p<0.05) for CEC beneficiaries relative to the pre-CEC period (see Exhibit 14). This result continued to be driven by Wave 1 ESCOs; although, Wave 2 ESCOs had a statistically significant decrease for the first time in PY5 of 6% (p≤0.10).
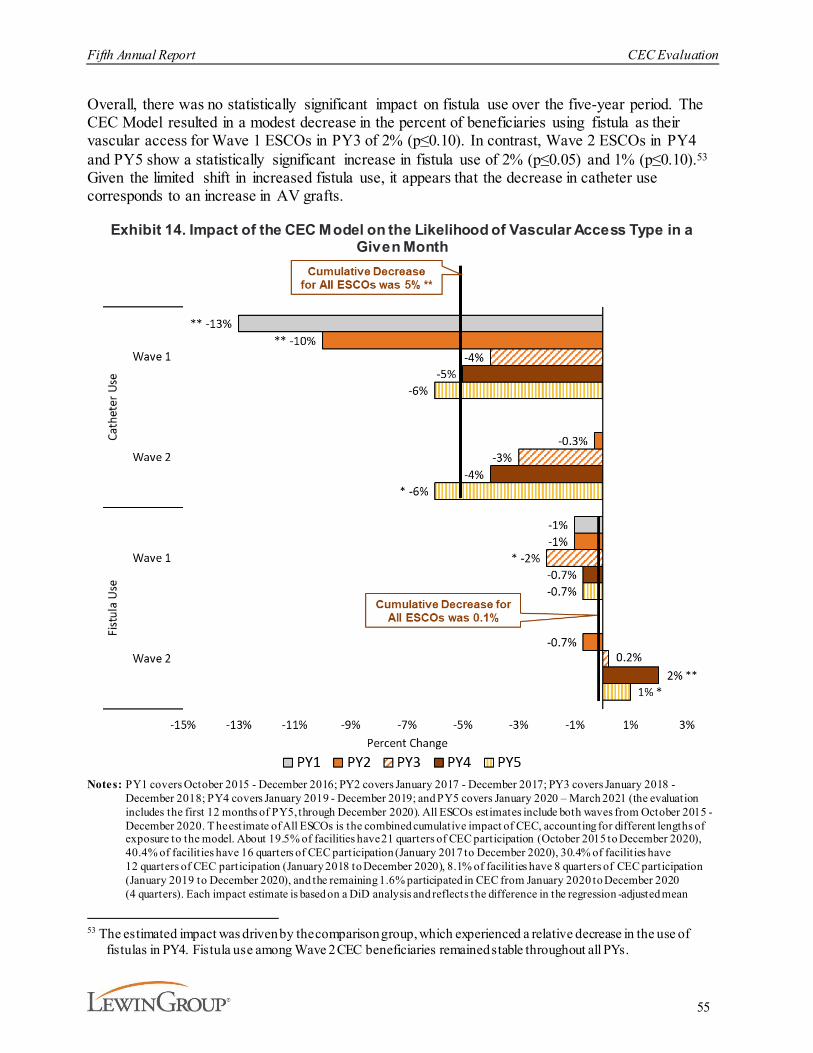
Fifth Annual Report CEC Evaluation
55
Overall, there was no statistically significant impact on fistula use over the five-year period. The CEC Model resulted in a modest decrease in the percent of beneficiaries using fistula as their vascular access for Wave 1 ESCOs in PY3 of 2% (p≤0.10). In contrast, Wave 2 ESCOs in PY4 and PY5 show a statistically significant increase in fistula use of 2% (p≤0.05) and 1% (p≤0.10).53
Given the limited shift in increased fistula use, it appears that the decrease in catheter use corresponds to an increase in AV grafts.
Exhibit 14. Impact of the CEC Model on the Likelihood of Vascular Access Type in a Given Month
Notes: PY1 covers October 2015 - December 2016; PY2 covers January 2017 - December 2017; PY3 covers January 2018 - December 2018; PY4 covers January 2019 - December 2019; and PY5 covers January 2020 – March 2021 (the evaluation includes the first 12 months of PY5, through December 2020). All ESCOs estimates include both waves from October 2015 - December 2020. T he estimate of All ESCOs is the combined cumulative impact of CEC, accounting for different lengths of exposure to the model. About 19.5% of facilities have 21 quarters of CEC participation (October 2015 to December 2020), 40.4% of facilit ies have 16 quarters of CEC participation (January 2017 to December 2020), 30.4% of facilit ies have 12 quarters of CEC participation (January 2018 to December 2020), 8.1% of facilit ies have 8 quarters of CEC participation (January 2019 to December 2020), and the remaining 1.6% participated in CEC from January 2020 to December 2020 (4 quarters). Each impact estimate is based on a DiD analysis and reflects the difference in the regression -adjusted mean
53 The estimated impact was driven by the comparison group, which experienced a relative decrease in the use of
fistulas in PY4. Fistula use among Wave 2 CEC beneficiaries remained stable throughout all PYs.
Fifth Annual Report CEC Evaluation
56
outcome for beneficiaries in CEC facilit ies for the intervention period with the pre-CEC period relative to the same difference over time for beneficiaries in matched comparison facilities. Significance of the DiD impact estimate is indicated next to ea ch outcome bar plot where * implies significance at the 10% level, ** at the 5% level, and *** at the 1% level assuming a two-tailed test. See D-24 – D-26.
Beneficiary ExperienceESCO strategies to deliver care more efficiently or coordinate care across providers may improve quality of care and health outcomes while reducing costs. However, strategies such as stinting on care, postponing care, changing referral patterns and transplant strategies, or substituting inferior or inappropriate services could result in worse quality of care and quality of life for beneficiaries. To inform our understanding of CEC beneficiaries' experience and capture potential unintended consequences of the model, we included three patient-reported components in the evaluation: KDQOL-36™ survey measures, ICH CAHPS survey measures, and beneficiary focus groups. The findings were generally consistent across the components. Both KDQOL-36™ and ICH CAHPS® survey results showed little impact on HRQOL and satisfaction with care, respectively, for CEC beneficiaries relative to the comparison group. Similarly, beneficiary focus group participants had mostly positive impressions of the care received and were generally satisfied with their interactions with facility staff.
Health-related quality of life. We monitored KDQOL-36™ measures through PY3 to ensure there were no unintended adverse consequences of the CEC Model incentive to achieve cost savings after the measure was removed from the model TQS.54 Overall, the differences in KDQOL-36™ composite scores between the CEC and comparison groups were small in magnitude, yet increasingly robust as the model grew across the PYs and did not suggest clinically meaningful associations between model participation and beneficiaries' quality of life. Although there were statistically significant differences in KDQOL-36™ between participants in the CEC Model and the comparison group for three of the composite scores, none of the estimates were deemed clinically meaningful.55 There were no statistically significant results for burden of kidney disease and the mental component summary composite scores. The greatest improvements were in PY3 for effects of kidney disease and physical component summary. CEC beneficiaries were slightly less likely to be bothered by their symptoms of kidney disease (4%) and report limitations due to their physical health (3%) than the comparison group.56
Satisfaction with dialysis care. CEC shared savings/losses depend on an ESCO’s total quality score (TQS). The TQS included six measures derived from the ICH CAHPS® survey. We monitored performance on these ICH CAHPS® measures and two additional survey items (that
54 CMS terminated collection of the KDQOL for CEC beneficiaries after PY3, therefore we did not field the survey
for the comparison group after PY3.55 There is no single accepted absolute target in determining a clinically meaningful change (increase or decrease) in
quality of life scores. However, multiple clinical trials reported statistically significant and implied meaningful results in varying ranges (e.g., <1 to about 5 points), pre/post intervention. Therefore, as a rule of thumb, we consider that a 5-point difference is reasonably clinically meaningful. See Hays and Cooley on the limits of applying an absolute threshold for determining clinically meaningful differences in HRQOL scores (The Concept of Clinically Meaningful Difference in Health-Related Quality of-Life Research: How Meaningful is it? Pharmacoeconomics 2000 Nov; 18 (5): 419-423).
56 Detailed discussion of the KDQOL-36™ survey and survey administration as well as methods for selecting beneficiaries in the comparison group and estimating regression models are provided in AR3.

Fifth Annual Report CEC Evaluation
57
are included in Dialysis Facility Compare) in the first four PYs. We did not anticipate reduced quality given the inclusion of ICH CAHPS® measures in the TQS as well as in the ESRD QIP and Dialysis Facility Compare that applies to all dialysis facilities.
The eight ICH CAHPS® measures evaluated included three global ratings measures (Nephrologist, Dialysis Center Staff, and Dialysis Center), two individual survey items (Seen within 15 Minutes and Explained Transplant Ineligibility), and three composite score measures (Nephrologists’ Communication and Caring, Quality of Dialysis Center Care and Operations, and Providing Information to Patients). As expected, we found no clinically meaningful change in beneficiaries’ experience of care. The CEC Model did not have statistically significant impacts on the percent of beneficiaries who reported the highest level of satisfaction with hemodialysis care across the ICH CAHPS® measures examined relative to the comparison group.57
Beneficiary experience of CEC. We conducted 17 focus groups in PY1-PY4 with over 100 beneficiaries aligned to ESCOs to determine if they noticed changes in the delivery and quality of their care and to assess their perceptions of their care since their facility joined the CEC Model.58 These focus groups provided contextual information about the quality of care and beneficiary experience, complementing what we learned from quantitative data analyses. No focus groups were conducted with patients at non-CEC facilities, so these findings should not be interpreted as reflective of differences between CEC participants and non-participants.
Participants had limited awareness of the model, however, some exhibited knowledge of model design features (e.g., transportation assistance, care coordination). The more experienced dialysis patients regularly commented that they thought the types of interventions implemented under the CEC Model would be most valuable to newer patients. Beneficiary perceptions of care delivery varied by facility and length of time on chronic dialysis. Participants were generally pleased with the assistance staff provided to reschedule appointments and coordinate non-dialysis care, including making referrals and appointments, assisting with medication management, and arranging transportation. However, most participants indicated there were no notable changes in
57 Detailed discussion of the ICH CAHPS® survey and methods for selecting beneficiaries in the comparison group
and estimating regression models are provided in AR4. 58 Detailed discussion of the focus group methods and findings for Wave 1 ESCOs are provided in AR3 and for Wave
2 ESCOs are provided in AR4.
“I saw [the ESCO letter and thought] they must want information to know what they could get rid
of, what they could trim, to save money, and that’s why they were asking us about our care.”
“My nurse actually gave me her cell phone number, and she was like, ‘if you have any
questions with anything, you can just call me,’ and I might call her for like the simplest things, but
she’ll help me. That part of this whole experience for me has been very excellent.”
“[The ESCO is] a good idea because sometimes you need changes in your medication...Or there’s
something that you're going through that you may need your doctor to know. They can do you the
favor of contacting the doctor and saying listen, your patient has been going through this. So, it is a
good idea.”
– CEC Beneficiaries

Fifth Annual Report CEC Evaluation
58
the accessibility of their nephrologist or in the way their nephrologist communicated with them. In PY3 and PY4, beneficiaries described that staff turnover and the introduction of new, inexperienced technicians negatively affected the delivery of dialysis treatment. Participants that had the most favorable response to the ESCO were generally patients with a higher comorbidity burden and patients in need of support services (e.g., transportation, help with medications, scheduling appointments).
3.3.2. What Was the Impact of CEC on the Coordination of Care beyond Dialysis?
This section describes care redesign strategies employed by ESCOs and the impacts of the model on associated measures related to coordination of care beyond dialysis. An analysis of use of telehealth services during the COVID-19 PHE is also included in the Measures section.
3.3.2.1. Care Redesign StrategiesESCOs described delivering more holistic care since the start of the model, shifting from providing dialysis to treating the whole patient. ESCO site visit participants reported using several care redesign strategies aimed at improving coordination of non-dialysis care including stratifying patients by risk, emphasizing primary and specialty care, addressing palliative care needs, and conducting medication reconciliation. Several ESCOs noted that the model brought about an increased focus on efforts that had been in place before the CEC Model, resulting in more consistency and greater follow-up to ensure completion.
Risk stratification. All ESCOs identified patients who were most at risk of adverse outcomes and prioritized care management of these patients. Site visit participants acknowledged the importance of staff knowledge of beneficiary circumstances and life events to identify time-sensitive risk factors (e.g., the recent loss of a spouse) not associated with utilization data upon which risk reports are typically based. Over time, some ESCOs expanded the parameters to include patients that were considered likely to become high-risk and could benefit from intervention. ESCOs prioritized care coordination for higher-risk beneficiaries and often discussed their cases during interdisciplinary care team meetings. The team typically included social workers, nephrologists, clinic managers, charge nurses, and dieticians. DaVita respondents suggested that these preventive efforts contributed to decreases in hospitalizations, which led DaVita to expand use of interdisciplinary teams to all of their facilities nationwide. Most ESCOs reported that nephrologist participation in interdisciplinary team meetings was helpful, but noted their participation was intermittent in some cases.
Primary and specialty care. The model’s emphasis on quality metrics and the associated accountability for the total cost of health care for the patient created an incentive for facilities to provide preventive care and coordinate with primary and specialty care providers, including behavioral health.
“[Flagging a patient as high-risk] prompts more attention on monitoring and, if need be, informing
the physician and talking with the staff that are not part of the ESCO process [about] what we need to be
looking at for this patient.”
– ESCO Site Visit Participant

Fifth Annual Report CEC Evaluation
59
Nearly all ESCOs provided preventive care, such as diabetic foot and eye exams, flu vaccinations, tobacco screenings and referrals to cessation services, fall risk assessments, and depression screening. These efforts had been in place before the CEC Model, but the model and its inclusion of these screenings/prevention activities in the CEC Quality Measure Set heightened awareness of their importance.59 The inclusion of a transplant waiting list measure in PY3 may also have improved attention to the annual screenings (e.g., colonoscopies and dental exams) needed to remain active on the transplant waiting list.60 However, site visit participants reported that some nephrologists were less interested in providing more primary care than others. Some ESCOs continued to monitor preventive care metrics that were no longer required by the model. Additionally, lack of provider access and transportation continued to challenge the coordination of non-dialysis care, especially in non-metropolitan areas. This may have especially been the case for facilities that joined the model in PY3 and PY4, who were increasingly less metropolitan relative to prior joiners.
In addition to providing preventive care, ESCOs also coordinated with primary and specialty care providers and arranged durable medical equipment. ESCOs made referrals to primary and specialty care providers as well as scheduled transportation to appointments and followed up to ensure patients attended appointments and obtain records. Wave 2 ESCOs also described a shift to more proactively helping patients establish PCPs, making referrals to PCPs, and encouraging patients to attend PCP appointments.
Interviewees at nearly all ESCOs reported that ESRD patients frequently suffered from mental health conditions such as anxiety and depression. Many staff described the availability of mental health providers in their community as grossly inadequate, especially for patients also enrolled in Medicaid and for patients in rural areas. ESCO representatives attempted to arrange patient appointments with mental health resources in the community.
59 The measure set is available at: https://innovation.cms.gov/files/x/cec-2019qualmeasureset.pdf 60 The PY3 (2018) CEC Quality Measure Set is available at:
https://innovation.cms.gov/Files/x/cec2018qualmeasureset.pdf
Nephrologist Role as PCP Under the CEC ModelTo overcome barriers to timely receipt of primary care, nephrologists and dialysis staff increasingly and more consistently provided primary care during dialysis treatment. When a beneficiary came in with a
cough, for example, the nephrologist listened to the patient’s lungs and diagnosed pneumonia. The nephrologist then prescribed an antibiotic right away, preventing a delay in treatment as well as reducing the time and cost associated with the alternative referral to a primary care physician.
“The care coordinator] did everything […One patient had] many health problems, just a list, and he needed everyone
involved, all cardiologists, the endocrinologist, like every single doctor. So I felt like it was really helpful because we
were really focusing on every area of his issues, not just nephrology. It was a combination of everything.”
“I've had incidents where patients needed an urgent appointment with a specialist, and [there was] a 2-3 month
waiting period. I’ll call the office manager and [describe] what’s going on. I can fax over test results so the specialist can make
an educated decision on [whether] this is an urgent case.”
– ESCO Site Visit Participant
Fifth Annual Report CEC Evaluation
60
Staff members also reported working directly with patients to help them identify and address psychosocial needs during dialysis.
Prior to the COVID-19 PHE, a few providers tried to leverage the model telehealth waiver for behavioral health. They were unsuccessful primarily due to lack of provider interest, and only one was still planning to implement the telehealth waiver for behavioral health in 2020. Given the rise in use of telehealth in response to COVID-19, the use of telehealth for E/M office visits in 2020 is discussed further in the Measures section below.
To assess the extent to which ESCOs focused on primary and specialty care, we investigated the impact of the model on the percent of beneficiaries who received LDL tests, HbA1c tests, eye exams, and flu vaccinations as well as use of office visits. There was an increase in all four preventive care measures. The model also increased primary care E/M office visits, but not specialty E/M office visits. These measures and impacts are discussed further in the Measures section below.
Medication reconciliation. Focus on medication management was widespread since the beginning of the model. ESCOs enhanced existing medication management practices, including physician consulting on high-risk cases and updating EHRs to improve medication documentation. ESCOs also emphasized medication reconciliation to prevent complications during transitions and subsequently reduce hospitalizations. Initially, pharmacists conducted ESCO medication reconciliation. However, reports from multiple dialysis organizations of the use of pharmacists declined over time, as medication reconciliation by nurses and nephrologists was more commonly mentioned.
To assess the extent to which ESCOs managed medications, we evaluated the impact of the model on reducing overuse of opioids and use of contraindicated medications as well as improving phosphate binder adherence. There was a decline in overuse of opioids and an increase in phosphate binder adherence which is discussed further in the Measures section below.
“We have a pharmacist who reviews medications on every ESCO patient quarterly and after every transition of care. Medications have been checked [in the past], but not as thoroughly, and the
more we do it, the more we realize patients come out of the hospital and their medication lists are different because of a hospital
formulary, and they're taking double the same medications.”
“We have trouble in this clinic doing the medication reconciliation for various reasons. Not getting the records, the patients not
understanding what they’re taking. You go through the list and they say, yeah, yeah, yeah, I’m taking it and the next day, they tell you
they’re not taking it. So, we’re never quite sure if the list is correct. Bringing the meds in, we’ve started doing that. […] Some of them
do, some of them don’t.”
– ESCO Site Visit Participants
“We have a program [for] patients with psychosocial needs that are preventing them from being adherent to their treatments. The
social worker works with them intensively to do some cognitive behavioral counseling…often
patients don’t have the transportation or they don’t want to go to another appointment,
although that’s what they need.”
– ESCO Site Visit Participant
Fifth Annual Report CEC Evaluation
61
Palliative care. In early interviews, ESCOs reported that some staff and nephrologists were uncomfortable discussing end-of-life care and hospice services with beneficiaries and expressed a desire for more training and resources in these areas. Modest change was noted in more recent interviews, as ESCOs described some limited discussion between staff, patients, and caregivers about palliative care and hospice. These discussions typically involved staff providing referrals to external services for advance care planning or hospice care, although one non-LDO provided palliative care directly. However, some patients were not interested in transferring to hospice care. Because dialysis is a life-sustaining service, beneficiaries without a life-threatening illness (other than ESRD) would generally have to decide to stop dialysis care to receive hospice care. Without dialysis care, there is a very limited period during which to establish and receive hospice care. There was little indication that the CEC Model affected hospice use. The impact on hospice use during the first four PYs was positive but not statistically significant.61
3.3.2.2. MeasuresWe evaluated whether the CEC Model increased flu immunizations as a preventative health measure. We also examined care correlated with chronic disease management, such as E/M office visits and medication management. We found some evidence that overall the CEC Model improved coordination of care beyond dialysis.
Preventive Care
Overall, the CEC Model increased flu vaccination rates, as shown in Exhibit 15. Flu vaccination is also a quality measure included in shared savings calculations in PY1-PY5. Increases in flu vaccinations were statistically significant for both waves in the second flu season (noted as PY2 in Exhibit 15).
In prior reports, we assessed testing for LDL cholesterol control, HbA1c, and dilated eye exams for beneficiaries with ESRD who were also diabetic. These preventive care measures are important because of the high rate of diabetes and heart disease in the ESRD population (among the beneficiaries in our analytic sample, 77% had diabetes and 74% had CHF). In addition, dilated eye exams for diabetic beneficiaries is one of the quality measures that determine ESCOs total quality performance for shared savings calculations in PY1-PY362. Our results showed that in PY1-PY4, CEC beneficiaries were more likely to receive LDL tests (5%), HbA1c tests (2%), eye exams (3%). These findings were primarily driven by Wave 1 ESCOs, with sustained impacts over time.63
61 See AR4 for further discussion of the impact on the likelihood of receiving hospice services in a given month.62 See https://innovation.cms.gov/initiatives/comprehensive-esrd-care/ for the full CEC quality performance set.63 See AR4 for further discussion of diabetic preventive care measures.
“When we asked [care coordinators] who was comfortable having conversations [regarding
end-of-life care], about a third of them said they were comfortable, but when we asked how
many of them could think of a patient in their dialysis clinic who would benefit from having this conversation; everyone raised their hand - so we
know there’s a need [for more training].”
– ESCO Site Visit Participant

Fifth Annual Report CEC Evaluation
62
Exhibit 15. Impact of the CEC Model on the Likelihood of Receiving Flu Vaccinations in a Given Year
Notes: The flu season is defined as August through April (i.e., PY1 represents Aug 2016 – April 2017; PY2 defined as Aug 2017 – April 2018; PY3 defined as Aug 2018 – April 2019; and PY4 defined as Aug 2019 – April 2020). Based on the data used for this analysis, a full flu season for PY5 joining Wave 1 facilit ies and Wave 2 ESCOs was not available. As a result , the flu estimate only represents Wave 1 PY1 joiners and Wave 1 and Wave 2 PY2 /PY3/PY4 joiners. Each impact estimate is based on a DiD analysis and reflects the difference in the regression -adjusted mean outcome for beneficiaries in CEC facilit ies for the intervention period with the pre-CEC period relative to the same difference over time for beneficiaries in matched comparison facilities. Each impact estimate is based on a DiD analysis and reflects the difference in the regression-adjusted mean outcome for beneficiaries in CEC facilit ies for the intervention period with the pre-CEC period relative to the same difference over time for beneficiaries in matched comparison facilities. Significance of the DiD impact estimate is indicated next to each outcome bar plot where * implies significance at the 10% level, ** at the 5% level, and *** at the 1% level assuming a two-tailed test . See Exhibits D-27 – D-29.
Evaluation and Management Office Visits
Overall, the average number of primary care E/M visits in a given month declined, but this decrease was greater for the comparison group, resulting in a relative increase of 3% (p<0.01) for ESCO facilities under the CEC Model relative to the pre-CEC period, as shown in Exhibit 16.64
Wave 1 ESCOs showed modest statistically significant increases in PY2 and PY5. In contrast, Wave 2 ESCOs had stronger and more consistent increases in primary care visits. Although some ESCOs reported supporting referrals to specialists, there was no indication that CEC affected specialty care E/M utilization. Overall, these results demonstrate ESCOs’ efforts in identifying
64 The E/M measures used in AR3-AR5 differ from the versions used in AR2. The AR2 E/M measures were refined to
include additional criteria for greater precision in later reports. See more detail in Exhibit D-3.
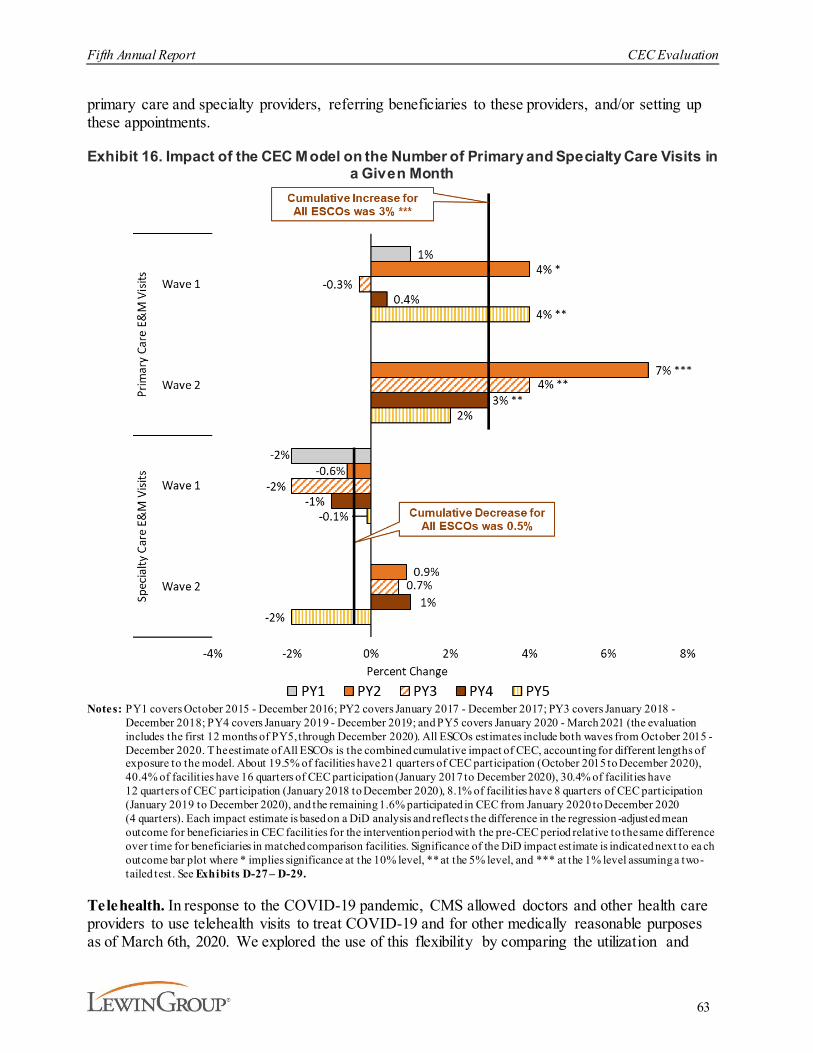
Fifth Annual Report CEC Evaluation
63
primary care and specialty providers, referring beneficiaries to these providers, and/or setting up these appointments.
Exhibit 16. Impact of the CEC Model on the Number of Primary and Specialty Care Visits in a Given Month
Notes: PY1 covers October 2015 - December 2016; PY2 covers January 2017 - December 2017; PY3 covers January 2018 - December 2018; PY4 covers January 2019 - December 2019; and PY5 covers January 2020 - March 2021 (the evaluation includes the first 12 months of PY5, through December 2020). All ESCOs estimates include both waves from October 2015 - December 2020. T he estimate of All ESCOs is the combined cumulative impact of CEC, accounting for different lengths of exposure to the model. About 19.5% of facilities have 21 quarters of CEC participation (October 2015 to December 2020), 40.4% of facilit ies have 16 quarters of CEC participation (January 2017 to December 2020), 30.4% of facilit ies have 12 quarters of CEC participation (January 2018 to December 2020), 8.1% of facilit ies have 8 quarters of CEC participation (January 2019 to December 2020), and the remaining 1.6% participated in CEC from January 2020 to December 2020 (4 quarters). Each impact estimate is based on a DiD analysis and reflects the difference in the regression -adjusted mean outcome for beneficiaries in CEC facilit ies for the intervention period with the pre-CEC period relative to the same difference over time for beneficiaries in matched comparison facilities. Significance of the DiD impact estimate is indicated next to ea ch outcome bar plot where * implies significance at the 10% level, ** at the 5% level, and *** at the 1% level assuming a two-tailed test . See Exhibits D-27 – D-29.
Telehealth. In response to the COVID-19 pandemic, CMS allowed doctors and other health care providers to use telehealth visits to treat COVID-19 and for other medically reasonable purposes as of March 6th, 2020. We explored the use of this flexibility by comparing the utilization and
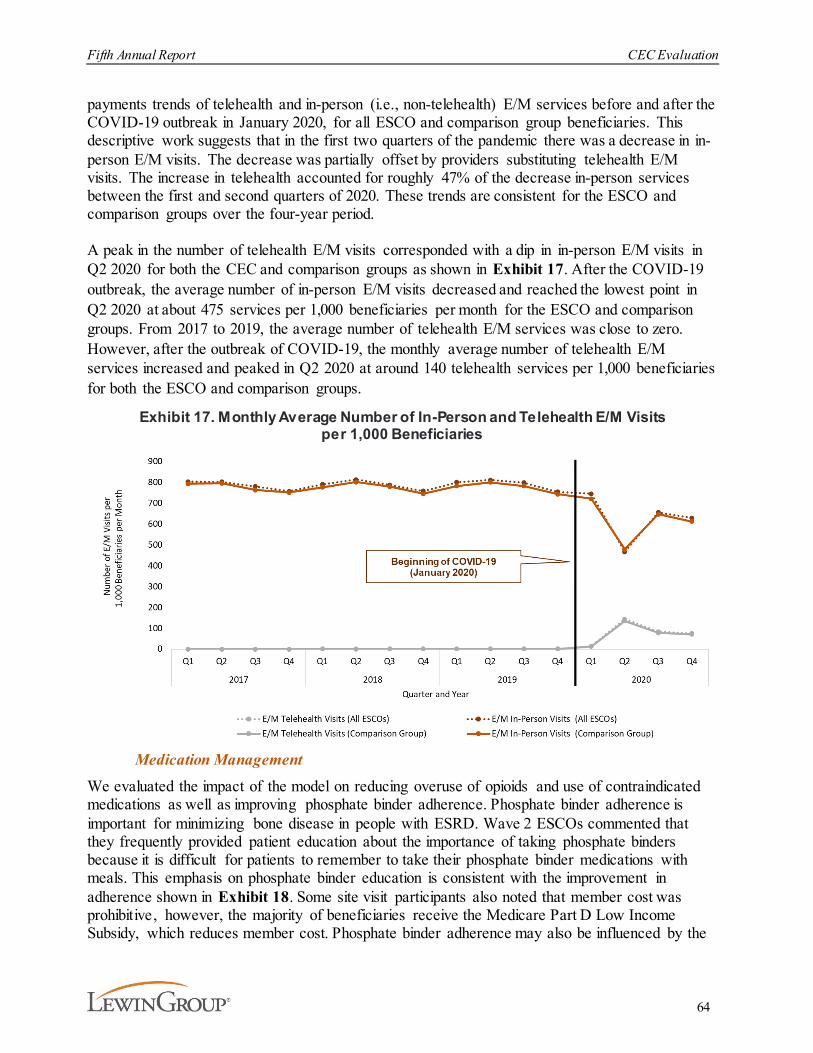
Fifth Annual Report CEC Evaluation
64
payments trends of telehealth and in-person (i.e., non-telehealth) E/M services before and after the COVID-19 outbreak in January 2020, for all ESCO and comparison group beneficiaries. This descriptive work suggests that in the first two quarters of the pandemic there was a decrease in in-person E/M visits. The decrease was partially offset by providers substituting telehealth E/M visits. The increase in telehealth accounted for roughly 47% of the decrease in-person services between the first and second quarters of 2020. These trends are consistent for the ESCO and comparison groups over the four-year period.
A peak in the number of telehealth E/M visits corresponded with a dip in in-person E/M visits in Q2 2020 for both the CEC and comparison groups as shown in Exhibit 17. After the COVID-19 outbreak, the average number of in-person E/M visits decreased and reached the lowest point in Q2 2020 at about 475 services per 1,000 beneficiaries per month for the ESCO and comparison groups. From 2017 to 2019, the average number of telehealth E/M services was close to zero. However, after the outbreak of COVID-19, the monthly average number of telehealth E/M services increased and peaked in Q2 2020 at around 140 telehealth services per 1,000 beneficiaries for both the ESCO and comparison groups.
Exhibit 17. Monthly Average Number of In-Person and Telehealth E/M Visits per 1,000 Beneficiaries
Medication Management
We evaluated the impact of the model on reducing overuse of opioids and use of contraindicated medications as well as improving phosphate binder adherence. Phosphate binder adherence is important for minimizing bone disease in people with ESRD. Wave 2 ESCOs commented that they frequently provided patient education about the importance of taking phosphate binders because it is difficult for patients to remember to take their phosphate binder medications with meals. This emphasis on phosphate binder education is consistent with the improvement in adherence shown in Exhibit 18. Some site visit participants also noted that member cost was prohibitive, however, the majority of beneficiaries receive the Medicare Part D Low Income Subsidy, which reduces member cost. Phosphate binder adherence may also be influenced by the

Fifth Annual Report CEC Evaluation
65
emergence of new formulations with better phosphate binding efficacy. Given that patients on dialysis take 19 pills per day on average, and about half are from phosphate binders, more potent medications have the potential to improve quality of life by lowering pill burden.65 Analysis of these three measures was restricted to beneficiary months where the beneficiary with ESRD had Medicare Part D coverage for prescription drugs, which accounted for approximately 84% of the sample. The CEC Model had a statistically significant, favorable impact on opioid overuse and phosphate binder adherence (see Exhibits 18 and 19). We measured opioid overuse as the percent of beneficiaries who had an average daily MME greater than 50 milligrams. Overuse declined by 5% (p<0.05) relative to the pre-CEC period, although this improvement decreased over time and was concentrated in Wave 1.
Exhibit 18. Impact of the CEC Model on the Likelihood of Overusing Opioids
Notes: PY1 covers October 2015 - December 2016; PY2 covers January 2017 - December 2017; PY3 covers January 2018 - December 2018; PY4 covers January 2019 - December 2019; and PY5 covers January 2020 - March 2021 (the evaluation includes the first 12 months of PY5, through December 2020). All ESCOs estimates include both waves from October 2015 - December 2020. T he estimate of All ESCOs is the combined cumulative impact of CEC, accounting for different lengths of exposure to the model. About 19.5% of facilities have 21 quarters of CEC participation (October 2015 to December 2020), 40.4% of facilit ies have 16 quarters of CEC participation (January 2017 to December 2020), 30.4% of fac ilit ies have 12 quarters of CEC participation (January 2018 to December 2020), 8.1% of facilities have 8 quarters of CEC participation
65 Chiu, Y.W., Teitelbaum, I., Misra, M., De Leon, E.M., Adzize T., Mehrotra, R. (2009). Pill burden, adherence,
hyperphosphatemia, and quality of life in maintenance dialysis patients. Clinical Journal of the American Society of Nephrology, 4:1089–1096. https://doi.org/10.2215/CJN.00290109

Fifth Annual Report CEC Evaluation
66
(January 2019 to December 2020), and the remaining 1.6% participated in CEC from January 2020 to December 2020 (4 quarters). Each impact estimate is based on a DiD analysis and reflects the difference in the regression -adjusted mean outcome for beneficiaries in CEC facilit ies for the intervention period with the pre-CEC period relative to the same difference over time for beneficiaries in matched comparison facilities. Significance of the DiD impact estimate is indicated next to each outcome bar plot where * implies significance at the 10% level, ** at the 5% level, and *** at the 1% level assuming a two-tailed test See Exhibits D-27 – D-29.
One of the most consistent findings in the evaluation is improved phosphate binder adherence. Both Wave 1 and Wave 2 CEC beneficiaries showed improved adherence to phosphate binders, with impacts increasing over time.66 Overall, the rates of phosphate binder adherence increased by 9% (p<0.01) relative to the pre-CEC period. Phosphate binder adherence improved over time for both waves with Wave 2 adherence rates reaching 17% (p<0.01) by PY5. These improvements are consistent with reports from the site visits of patient education and reminders regarding the importance of these medications.
Exhibit 19. Impact of the CEC Model on Likelihood of Adhering to Phosphate Binder Medication in a Given Month
Notes: PY1 covers October 2015 - December 2016; PY2 covers January 2017 - December 2017; PY3 covers January 2018 - December 2018; PY4 covers January 2019 - December 2019; and PY5 covers January 2020 – March 2021 (the evaluation includes the first 12 months of PY5, through December 2020). All ESCOs estimates include both waves from October 2015 - December 2020. T he estimate of All ESCOs is the combined cumulative impact of CEC, accounting for different lengths of exposure to the model. About 19.5% of facilities have 21 quarters of CEC participation (October 2015 to December 2020),
66 Adherence was defined for beneficiaries who received at least two p hosphate binder prescription in a given year and
was calculated as the proportion of days covered by phosphate binder over 80% in a given month .
Fifth Annual Report CEC Evaluation
67
40.4% of facilit ies have 16 quarters of CEC participation (January 2017 to December 2020), 30.4% of facilit ies have 12 quarters of CEC participation (January 2018 to December 2020), 8.1% of facilities have 8 quarters of CEC pa rticipation (January 2019 to December 2020), and the remaining 1.6% participated in CEC from January 2020 to December 2020 (4 quarters). Each impact estimate is based on a DiD analysis and reflects the difference in the regression -adjusted mean outcome for beneficiaries in CEC facilit ies for the intervention period with the pre-CEC period relative to the same difference over time for beneficiaries in matched comparison facilities. Significance of the DiD impact estimate is indicated next to ea ch outcome bar plot where * implies significance at the 10% level, ** at the 5% level, and *** at the 1% level assuming a two-tailed test See Exhibits D-27 – D-29.
3.3.3. What Was the Impact of CEC on Hospitalizations and Emergency Department Visits?
This section describes care redesign strategies employed by ESCOs and the impacts of the model on associated measures related to hospitalizations and ED visits.
3.3.3.1. Care Redesign StrategiesBecause CEC is a shared savings model, it created an incentive to encourage better coordination across the continuum of care and prevent complications that can lead to expensive hospitalizations and ED visits. Hospital admissions and readmissions are a major burden for patients with ESRD, who, on average, were admitted to the hospital nearly twice a year in 2017.67 Furthermore, inpatient treatment for beneficiaries with ESRD accounted for about 29% of their total Medicare expenditures.68 The expanded access to dialysis care, improvements in dialysis care, and coordination of non-dialysis care discussed previously had an indirect impact on hospitalizations. ESCOs also employed additional targeted strategies to reduce hospitalizations, ED visits, and readmissions. These strategies included patient education and care coordination efforts that emphasized ED diversion to reduce hospitalizations, the transition from hospital care to prevent readmissions, and medication reconciliation to avoid complications that could result in admissions to a hospital. In addition, patient education addressed that hospitals are not an ideal place for respite and that outpatient care is safer than hospital care.
Emergency department diversion. To divert patients from the ED, ESCOs reported expanding their patient education efforts in the later years of the model. Topics added to promote diversion included: the symptoms that warrant a hospitalization and why it is important to avoid hospitalization; the availability of urgent care clinics to avoid ED visits and hospitalizations; and successful transition back to dialysis care following a hospitalization. Facility staff also encouraged patients to “call us first” before going to the ED. In addition, 67 United States Renal Data System. (2019). 2019 USRDS annual data report: epidemiology of kidney disease in the
United States. National Institutes of Health: National Institute of Diabetes and Digestive and Kidney Diseases. https://www.usrds.org/annual-data-report/
68 Ibid
“One of the things that we’ve done is educating our patients that if you’re feeling a certain way,
call us, because we may be able to treat you quicker than running to the ER.”
“My first discussion with the ER physicians is about the patient’s condition. If it looks like the patient just
missed dialysis, there’s a 50% chance the patient may avoid admission. If I’m in the hospital, I would go to the
ER, assess the patient myself, and if I feel comfortable then I can try to convince the ER physician, ‘Let us see if
you can send him back to the clinic.”
– ESCO Site Visit Participants

Fifth Annual Report CEC Evaluation
68
ESCOs coordinated with hospitals to redirect patients from the E D, if adequate treatment could be provided by the dialysis facility, and thereby avoid an admission. However, ESCOs relied on notifications from ED staff or electronic notification systems to identify when patients presented in the ED with varied success. For example, Fresenius’ telephonic care coordination staff supported patient diversion from the ED and by PY3 this activity was expanded to all beneficiaries regardless of whether they were aligned to the ESCO.
Transitions of care. Transitions of care, especially post-hospitalization, were a key focus for ESCOs throughout the model. ESCO nephrologists and facility staff coordinated with hospitals to improve receipt of timely, accurate discharge summary information with varied success and emphasized the importance of relationships with hospital discharge planners. However, staff at most dialysis facilities did not receive real-time notifications of patients’ hospital admission or discharge which delayed the initiation of follow-up. IT investments, including notification alert systems, access to hospital health records or state health information exchange systems (if available), and direct communication and relationships with hospital case managers helped facilitate information sharing. One ESCO developed an automated tool (based on patient registration data from an affiliated hospital system) to inform nephrologists when their patients were admitted to or discharged from local hospitals. ESCOs also conducted dry-weight assessments, medication reconciliation, and coordinated with home health care providers to support a more stable transition back to outpatient dialysis and avoid preventable readmissions due to complications. Other changes at individual facilities included adding nurse practitioners to expedite the hospital follow-up process.
Some Fresenius ESCOs leveraged the model performance-based payments to participating providers waiver to provide a financial incentive for more timely medication reconciliation following hospital discharge for nephrologists. Nephrologists with less than a 20% stake in the ESCO risk-sharing with CMS could bill the ESCO for completion of a Transition of Care (TOC) form within 30 days of a hospital discharge. Medication reconciliation and a complete discharge summary were documented on a TOC form to better understand why patients were hospitalized and to prevent future hospitalizations and complications. Several non-nephrologist respondents stated that medication reconciliation was performed more quickly as a result. Few other ESCOs reported using the model P4P waiver.
To assess the extent to which ESCOs prevented hospitalizations, we investigated the impact of the model on hospitalizations, observation stays, and ED visits as well as readmissions and ED visits in the 30 days following hospitalization. We also explored hospitalizations for vascular access and ESRD-related complications. Hospitalizations (including those for related complications),
“One of the biggest loopholes we see is when the patient gets discharged is the medication list. There’s a discordance between what the
patient was on and what the patient is discharged with. The ESCO reviews have really helped to improve the continuity of care from
home to the dialysis unit and hospital.”
– ESCO Site Visit Participant
Fifth Annual Report CEC Evaluation
69
observation stays, and readmissions declined, which is discussed further in the Measures section below.
3.3.3.2. MeasuresWe explored key measures with relevance to the CEC Model related to inpatient hospitalizations, ED visits, and hospital observation as well as hospitalizations for vascular access or ESRD-related complications and hospital readmissions or ED visits within 30 days of an acute hospitalization.
Overall Hospitalizations, Observation Stays, and ED Visits
ED visits are an expensive and often preventable alternative to timely ambulatory care. Observation stays are defined as a hospital stay with an expected length of stay of less than two midnights during which the beneficiary receives medical services. When looking at hospitalizations, it is important to include observation stays to get a complete picture. Because the cost of an observation stay is lower than the per-night cost of an inpatient hospitalization, there may be an incentive to shift from inpatient admissions to observation stays.
The CEC Model continued to reduce the number of hospitalizations and observation stays, while it had no statistically significant impact on the number of ED visits (see Exhibit 20). All COVID-19 hospitalizations were removed from the impact analysis.69 Over the course of the first five years of the model, the number of hospitalizations had a 3% (p<0.01) decline relative to the pre-CEC period. This impact translates into a decrease of four hospitalizations per 1,000 CEC beneficiaries per month. This result was driven by Wave 1 ESCOs, which experienced reductions in PBPM hospitalizations (3% to 6%, (p<0.1)) over the life of the model, compared to their pre-CEC period. The number of observation stays decreased only for Wave 2 ESCOs which experienced a 11% (p<0.01) reduction in observation stays in PY2, a 7% (p<0.05) reduction in PY3, and a 5% (p<0.10) reduction in PY4 and in PY5, when compared to their pre-CEC period. While there were trends toward fewer ED visits, especially for Wave 1 beneficiaries, there was no significant change in the number of ED visits.70
69 Removal of COVID-19 inpatient episodes from the analytic sample impacts the average level of inpatient related
measures in PY5. This is because a proportion of beneficiaries who experienced a COVID-19 hospitalization would have likely utilized inpatient care (i.e., been hospitalized) even in the absence of the pandemic due to existing health conditions.
70 The distribution of the number of occurrences (e.g., number of ED visits PBPM) may have high variance due to outlier observations, which can increase standard error (SE) estimates and make it more difficult to identify statistical significance.
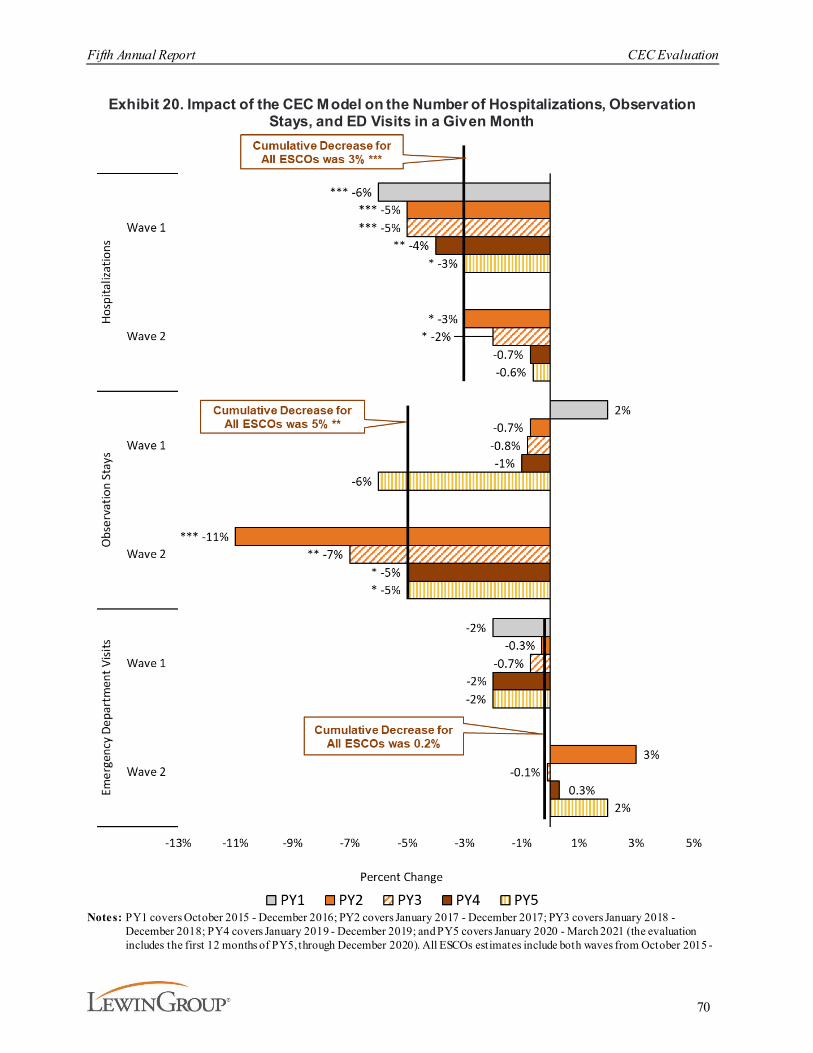
Fifth Annual Report CEC Evaluation
70
Exhibit 20. Impact of the CEC Model on the Number of Hospitalizations, Observation Stays, and ED Visits in a Given Month
Notes: PY1 covers October 2015 - December 2016; PY2 covers January 2017 - December 2017; PY3 covers January 2018 - December 2018; PY4 covers January 2019 - December 2019; and PY5 covers January 2020 - March 2021 (the evaluation includes the first 12 months of PY5, through December 2020). All ESCOs estimates include both waves from October 2015 -
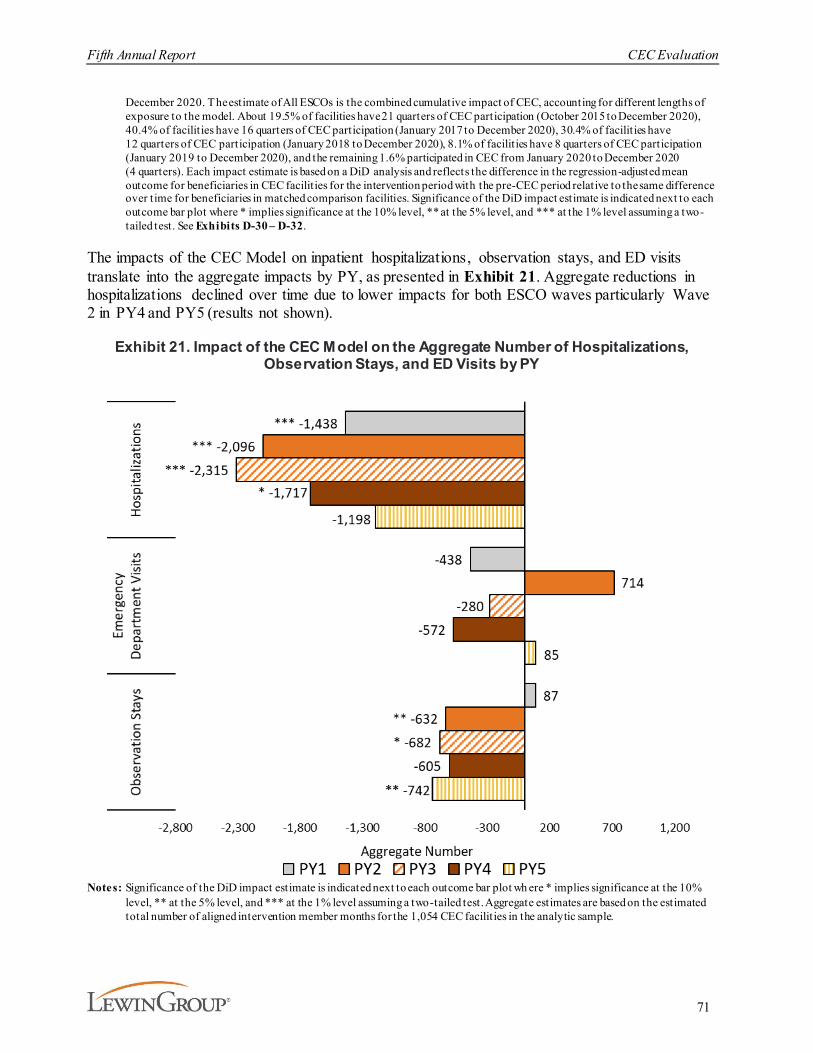
Fifth Annual Report CEC Evaluation
71
December 2020. The estimate of All ESCOs is the combined cumulative impact of CEC, accounting for different lengths of exposure to the model. About 19.5% of facilities have 21 quarters of CEC participation (October 2015 to December 2020), 40.4% of facilit ies have 16 quarters of CEC participation (January 2017 to December 2020), 30.4% of facilit ies have 12 quarters of CEC participation (January 2018 to December 2020), 8.1% of facilit ies have 8 quarters of CEC participation (January 2019 to December 2020), and the remaining 1.6% participated in CEC from January 2020 to December 2020 (4 quarters). Each impact estimate is based on a DiD analysis and reflects the difference in the regression-adjusted mean outcome for beneficiaries in CEC facilit ies for the intervention period with the pre-CEC period relative to the same difference over time for beneficiaries in matched comparison facilities. Significance of the DiD impact estimate is indicated next to each outcome bar plot where * implies significance at the 10% level, ** at the 5% level, and *** at the 1% level assuming a two-tailed test. See Exhibits D-30 – D-32.
The impacts of the CEC Model on inpatient hospitalizations, observation stays, and ED visits translate into the aggregate impacts by PY, as presented in Exhibit 21. Aggregate reductions in hospitalizations declined over time due to lower impacts for both ESCO waves particularly Wave 2 in PY4 and PY5 (results not shown).
Exhibit 21. Impact of the CEC Model on the Aggregate Number of Hospitalizations, Observation Stays, and ED Visits by PY
Notes: Significance of the DiD impact estimate is indicated next to each outcome bar plot wh ere * implies significance at the 10% level, ** at the 5% level, and *** at the 1% level assuming a two-tailed test. Aggregate estimates are based on the estimated total number of aligned intervention member months for the 1,054 CEC facilit ies in the analytic sample.

Fifth Annual Report CEC Evaluation
72
Hospitalizations for Vascular Access and ESRD Complications
The results for hospitalizations for vascular access complications and ESRD complications are presented in Exhibit 22. ESCOs reduced catheter use, which is prone to infections and is the least preferred form of vascular access (see Section 3.3.1.1). Despite this decrease in catheter use, we did not find a significant corresponding reduction in hospitalizations for vascular access complications over the life of the model.
ESRD complications such as hyperkalemia, fluid overload, and pulmonary edema occur when beneficiaries miss or shorten dialysis treatments or poorly manage their diet. ESCOs’ efforts to prevent these complications included increased access to dialysis treatment, rescheduling missed treatments, and education of patients about the importance of treatment adherence. As expected, CEC beneficiaries were 5% (p<0.05) less likely to experience a hospitalization for ESRD complications in a given month, relative to the pre-CEC period. This result was due primarily to Wave 1 ESCOs where the impact decreased over time and was no longer statistically significant in PY5.
Exhibit 22. Impact of the CEC Model on the Likelihood of Hospitalizations for Vascular Access or ESRD Complications in a Given Month
Notes: PY1 covers October 2015 - December 2016; PY2 covers January 2017 - December 2017; PY3 covers January 2018 - December 2018; PY4 covers January 2019 - December 2019; and PY5 covers January 2020 – March 2021 (the evaluation includes the first 12 months of PY5, through December 2020). All ESCOs estimates include both waves from October 2015 -
Fifth Annual Report CEC Evaluation
73
December 2020. The estimate of All ESCOs is the combined cumulative impact of CEC, accounting for different lengths of exposure to the model. About 19.5% of facilities have 21 quarters of CEC participation (October 2015 to December 2020), 40.4% of facilit ies have 16 quarters of CEC participation (January 2017 to December 2020), 30.4% of facilit ies have 12 quarters of CEC participation (January 2018 to December 2020), 8.1% of facilities have 8 quarters of CEC participation (January 2019 to December 2020), and the remaining 1.6% participated in CEC from January 2020 to December 2020 (4 quarters). Each impact estimate is based on a DiD analysis and reflects the difference in the regression-adjusted mean outcome for beneficiaries in CEC facilit ies for the intervention period with the pre-CEC period relative to the same difference over time for beneficiaries in matched comparison facilities. Significance of the DiD impact estimate is indicated next to each outcome bar plot where * implies significance at the 10% level, ** at the 5% level, and *** at the 1% level assuming a two-tailed test. See Exhibits D-30 – D-32.
Hospitalizations for Ambulatory Care Sensitive Conditions. We expected the model to impact measures of hospitalizations for these two Ambulatory Care Sensitive Conditions (ACSC) because of the high prevalence in the ESRD population. ESCOs also reported addressing primary care needs during dialysis treatment and coordinating care beyond dialysis needs. In prior reports, we also examined hospitalizations for two ACSCs prevalent among ESRD beneficiaries - diabetes and CHF. While there was no statistically significant change in hospitalizations for diabetes complications, there was a decrease in hospitalizations for CHF of 9% (p<0.01) relative to the pre-CEC period in PY1-PY4.71
Readmissions and ED Visit within 30 days of an Acute Hospitalization
ESCOs increased attention to continuity of care for patients who were hospitalized to reduce readmission and prevent ED visits in the 30 days following hospitalizations. This heightened focus included intense care coordination and interdisciplinary team discussions of each hospitalization and strategies to prevent a readmission or similar hospitalizations, post-discharge medication reconciliation, and helping patients attend follow-up appointments with their PCPs and specialists. Through post-discharge medication reconciliation, ESCOs attempted to address discrepancies between the list of medications with which a beneficiary was discharged and the medications they were taking prior to hospitalization, though challenges remained in obtaining the information from hospitals and assuring timely reconciliations.
Overall, 30-day PBPM readmissions declined by 2% (p<0.05) and was primarily driven by Wave 1 ESCOs and Wave 2 ESCOs that joined in PY2. Neither wave experienced statistically significant impacts on readmission in PY4 or PY5 of the CEC Model. There was no impact on ED visits within 30 days of an acute hospitalization (see Exhibit 23).
71 See AR4 for further discussion of the likelihood of impact on hospitalizations for ACSCs.
“We really need hospitals to communicate more with us, especially around discharge. If they let
us know that a patient’s getting discharged soon, we can make sure that everything is in
place for their return [to the facility].”
“If we are looking at your hospitalization, we are more interested to know what happened in the
hospital and how do we keep you from going back in and what steps are we, together, going
to take to prevent the next hospitalization.”
– ESCO Site Visit Participants

Fifth Annual Report CEC Evaluation
74
Exhibit 23. Impact of the CEC Model on the Likelihood of Readmissions or ED Visits within 30 days of an Acute Hospitalization in a Given M onth
Notes: PY1 covers October 2015 - December 2016; PY2 covers January 2017 - December 2017; PY3 covers January 2018 - December 2018; PY4 covers January 2019 - December 2019; and PY5 covers January 2020 - March 2021 (the evaluation includes the first 12 months of PY5, through December 2020). All ESCOs estimates include both waves from October 2015 - December 2020. T he estimate of All ESCOs is the combined cumulative impact of CEC, accounting for different lengths of exposure to the model. About 19.5% of facilities have 21 quarters of CEC part icipation (October 2015 to December 2020), 40.4% of facilit ies have 16 quarters of CEC participation (January 2017 to December 2020), 30.4% of facilit ies have 12 quarters of CEC participation (January 2018 to December 2020), 8.1% of facilit ies have 8 quart ers of CEC participation (January 2019 to December 2020), and the remaining 1.6% participated in CEC from January 2020 to December 2020 (4 quarters). Each impact estimate is based on a DiD analysis and reflects the difference in the regression -adjusted mean outcome for beneficiaries in CEC facilit ies for the intervention period with the pre-CEC period relative to the same difference over time for beneficiaries in matched comparison facilities. Readmission and ED Visit within 30 days of an Acute Hospitalization drop the last quarter of intervention data to account for a lag in claims to prevent an underestimation due to a lack of claims maturity. Significance of the DiD impact estimate is indicated next to each outcome bar plot where * implies significance at the 10% level, ** at the 5% level, and *** at the 1% level assuming a two-tailed test. ‡ Data from the pre-CEC period showed intervention and matched comparison facilities were not on parallel trends for this outcome, which is required for an unbiased impact estimate. See Exhibits D-30 – D-32.

Fifth Annual Report CEC Evaluation
75
In prior annual reports we examined standardized measures for hospitalizations, 30-day readmissions, and mortality. These outcomes had similar event rates for the CEC and the comparison group, adjusted for case mix. Notably, we found greater SMR improvements in the CEC than in the comparison group in PY1-PY4.72
3.3.4. What Was the Impact of the CEC Model on Survival?In the logic model underlying this evaluation, higher mortality was considered a potential unintended consequence of the CEC Model. This reflected the possibility that providers would respond to incentives to achieve shared savings by stinting on care. Therefore, the evaluation design proposed monitoring mortality, initially through the SMR, to ensure that mortality was not worse in CEC than in the comparison group. Based on early findings of greater SMR improvements in CEC than in the comparison group and the emergence of longer average time on dialysis in CEC than in the comparison group, which could reflect lower mortality in the CEC group, we introduced a more formal analysis of mortality in AR3, which was updated in AR4. Further adjusting for patient-level risk factors, we conducted multivariate survival analyses to test formally whether CEC impacted mortality. In the previous reports, we found a modest but statistically significant survival benefit for CEC beneficiaries.
The analysis in this report includes an additional year of data, a larger sample size, and longer follow-up (for early aligned beneficiaries). The analyses estimate the impact of both shorter-term exposure to CEC (one year) and longer-term exposure (three years) in two analytic samples (i.e., prevalent and incident patients). Prevalent patients are all beneficiaries aligned to CEC or the comparison group regardless of how long they had been on dialysis before alignment. Incident patients are a subset of beneficiaries who were aligned during their first year of dialysis. In the beneficiary focus groups conducted in the initial years of the evaluation, beneficiaries stated that the value of CEC interventions such as enhanced care coordination could be larger for patients new to dialysis than for those who already had substantial time on dialysis and established care and referral patterns prior to the initiation of the CEC Model. Therefore, we hypothesized that the CEC Model’s impact on survival would be larger for incident patients. For the first time, the data available for AR5 allow a full three years of follow-up for incident patients aligned during the first year of Wave 2 operations (2017).
Medicare beneficiaries with ESRD were disproportionately impacted by COVID-19 in PY5, with case rates approximately three times as high as those for beneficiaries without ESRD and even larger disparities in hospitalization rates.73 Therefore, our AR5 survival analysis also seeks to adjust for the impact of the pandemic on patients’ survival and eliminate its confounding effect on the comparison between CEC and comparison groups, which remains our main focus. The primary method of addressing the impact of COVID-19 on the estimates was to identify a COVID-19 diagnosis based on Medicare claims and add a time-varying adjuster starting at the first observed diagnosis. Several other methods of addressing COVID-19 were employed as sensitivity analyses and did not yield results meaningfully different than the primary approach. The alternative approaches included censoring at COVID-19 death (that is, the event of interest is time to non-COVID-19 death) and censoring at COVID-19 diagnosis. The primary approach was
72 See AR4 for further discussion of the standardized measures results as well as the limitations of these measures. 73 Centers for Medicare & Medicaid Services (2021). Preliminary Medicare COVID-19 data snapshots services through
2020-12-26. https://www.cms.gov/research-statistics-data-systems/preliminary-medicare-covid-19-data-snapshot
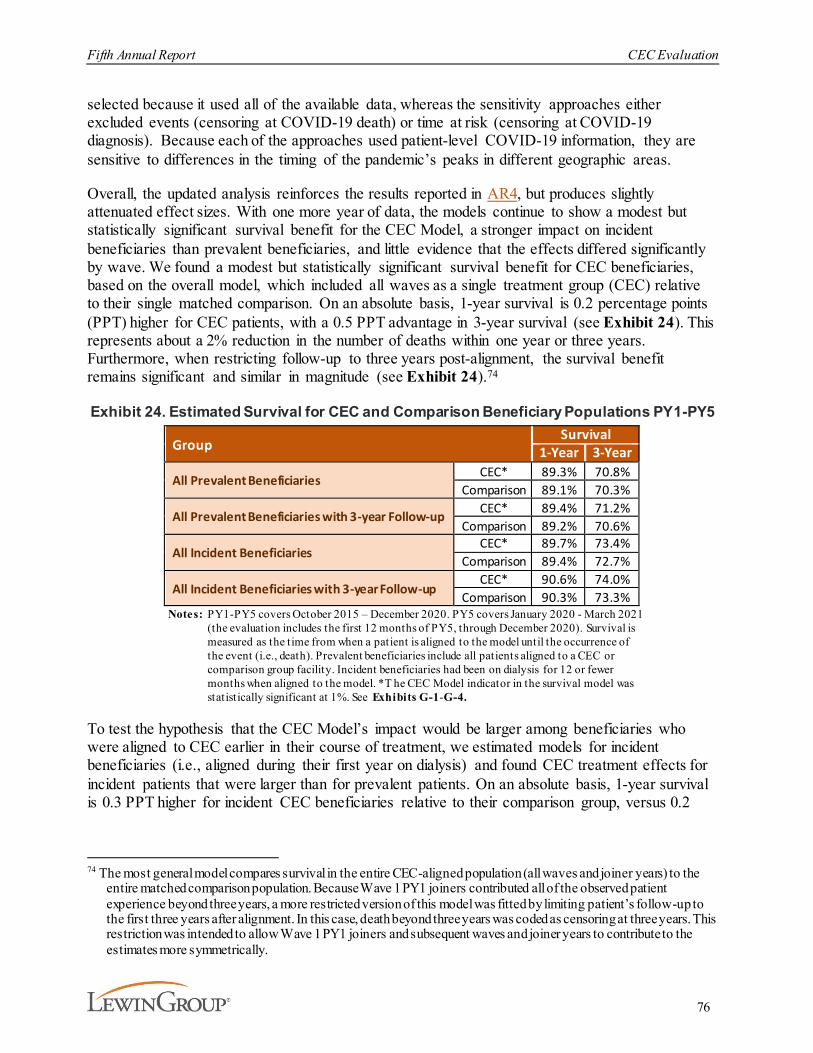
Fifth Annual Report CEC Evaluation
76
selected because it used all of the available data, whereas the sensitivity approaches either excluded events (censoring at COVID-19 death) or time at risk (censoring at COVID-19 diagnosis). Because each of the approaches used patient-level COVID-19 information, they are sensitive to differences in the timing of the pandemic’s peaks in different geographic areas.
Overall, the updated analysis reinforces the results reported in AR4, but produces slightly attenuated effect sizes. With one more year of data, the models continue to show a modest but statistically significant survival benefit for the CEC Model, a stronger impact on incident beneficiaries than prevalent beneficiaries, and little evidence that the effects differed significantly by wave. We found a modest but statistically significant survival benefit for CEC beneficiaries, based on the overall model, which included all waves as a single treatment group (CEC) relative to their single matched comparison. On an absolute basis, 1-year survival is 0.2 percentage points (PPT) higher for CEC patients, with a 0.5 PPT advantage in 3-year survival (see Exhibit 24). This represents about a 2% reduction in the number of deaths within one year or three years. Furthermore, when restricting follow-up to three years post-alignment, the survival benefit remains significant and similar in magnitude (see Exhibit 24).74
Exhibit 24. Estimated Survival for CEC and Comparison Beneficiary Populations PY1-PY5
GroupSurvival
1-Year 3-Year
All Prevalent Beneficiaries CEC* 89.3% 70.8%Comparison 89.1% 70.3%
All Prevalent Beneficiaries with 3-year Follow-up CEC* 89.4% 71.2%Comparison 89.2% 70.6%
All Incident BeneficiariesCEC* 89.7% 73.4%
Comparison 89.4% 72.7%
All Incident Beneficiaries with 3-year Follow-upCEC* 90.6% 74.0%
Comparison 90.3% 73.3%Notes: PY1-PY5 covers October 2015 – December 2020. PY5 covers January 2020 - March 2021
(the evaluation includes the first 12 months of PY5, through December 2020). Survival is measured as the time from when a patient is aligned to the model until the occurrence of the event (i.e., death). Prevalent beneficiaries include all patients aligned to a CEC or comparison group facility. Incident beneficiaries had been on dialysis for 12 or fewer months when aligned to the model. *T he CEC Model indicator in the survival model was statistically significant at 1%. See Exhibits G-1-G-4.
To test the hypothesis that the CEC Model’s impact would be larger among beneficiaries who were aligned to CEC earlier in their course of treatment, we estimated models for incident beneficiaries (i.e., aligned during their first year on dialysis) and found CEC treatment effects for incident patients that were larger than for prevalent patients. On an absolute basis, 1-year survival is 0.3 PPT higher for incident CEC beneficiaries relative to their comparison group, versus 0.2
74 The most general model compares survival in the entire CEC-aligned population (all waves and joiner years) to the
entire matched comparison population. Because Wave 1 PY1 joiners contributed all of the observed patient experience beyond three years, a more restricted version of this model was fitted by limiting patient’s follow-up to the first three years after alignment. In this case, death beyond three years was coded as censoring at three years. This restriction was intended to allow Wave 1 PY1 joiners and subsequent waves and joiner years to contribute to the estimates more symmetrically.

Fifth Annual Report CEC Evaluation
77
PPT for prevalent beneficiaries (see Exhibit 24). Three-year survival for incident beneficiaries on an absolute basis is 0.7 PPT greater for CEC beneficiaries relative to their comparison group.
Finally, we examined whether the effects on survival differed by wave (see Exhibits G-5 through G-13). For incident beneficiaries, results indicate that wave does not provide additional information when assessing survival differences for CEC and the comparison group (see Exhibits G-3 and G-9). For the prevalent model, the importance of wave on mortality is not as clear (see Exhibit G-5). Here, the wave indicator is significant while the alignment and interaction wave-alignment are not, all with similar coefficient magnitudes. For the Wave 2 PY2 joiners, survival differs for CEC versus comparison (HR=0.97, p=0.02); there is no significant difference for Wave 1 PY1 joiners (see Exhibit G-6). When restricting to three years of follow-up for the prevalent and incident beneficiaries, the results remained similar to those from the unrestricted model (see Exhibits G-7 and G-9).
Most of the included control variables had statistically significant associations with survival in the expected directions, and these associations were similar across the alternative model specifications (see Exhibits G-1 through G-11). In all the models (see Exhibits G-1 through G-11), a COVID-19 diagnosis was significantly associated with a much higher mortality rate in both CEC and control groups, justifying the inclusion of the COVID status in models. In addition, comorbid conditions at the onset of ESRD were all significantly associated with higher mortality rates. Other strong predictors of mortality rates included Black race and BMI.
3.3.5. What Was the Impact of CEC on Medicare Payments across the Continuum of Care?
The impacts of the CEC Model on Medicare payments across the continuum of care are consistent with the changes in utilization described above. Medicare payments for outpatient dialysis sessions increased slightly, while Medicare payments for hospitalizations and readmissions went down. In general, Wave 1 ESCOs continue to have more significant and consistent impacts on payments compared to Wave 2 ESCOs. Impacts on payment increased in PY2 but declined afterwards. In aggregate, these changes combined to reduce Medicare Part A and B payments.
Overall, the total Medicare Part A and Part B standardized payments, a measure of overall Medicare payments, increased for both CEC beneficiaries and the matched comparison group beneficiaries, but increased faster for the comparison group relative to CEC (see Exhibit 25). This resulted in a statistically significant relative reduction in PBPM payments of $85 (p<0.01) for CEC beneficiaries across PY1-PY5.75 This relative reduction represents about 1.3% of the average PBPM Medicare Part A and Part B payments for CEC beneficiaries in the pre-CEC period of $6,358.
75 The sensitivity approach was applied to impact estimates of Medicare total Part A and Part B Payments to test the
robustness of this key outcome measure. Impact estimates of each approach are nearly identical (see Exhibit D-36).
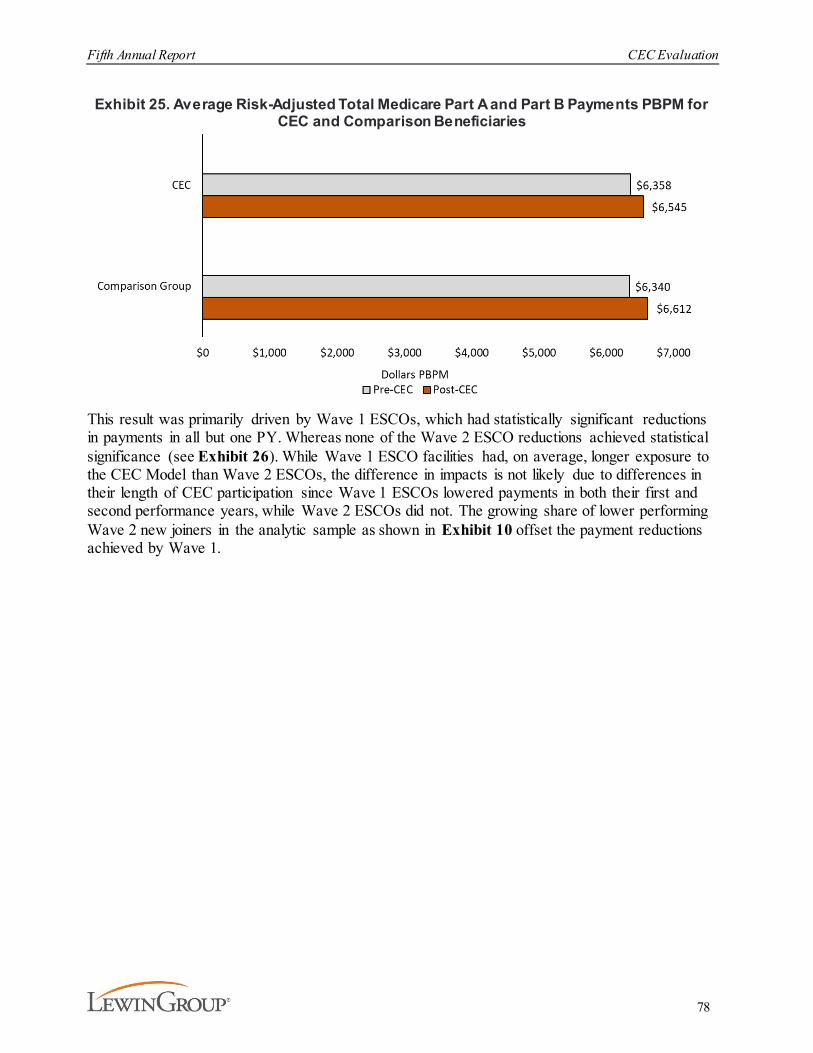
Fifth Annual Report CEC Evaluation
78
Exhibit 25. Average Risk-Adjusted Total Medicare Part A and Part B Payments PBPM for CEC and Comparison Beneficiaries
This result was primarily driven by Wave 1 ESCOs, which had statistically significant reductions in payments in all but one PY. Whereas none of the Wave 2 ESCO reductions achieved statistical significance (see Exhibit 26). While Wave 1 ESCO facilities had, on average, longer exposure to the CEC Model than Wave 2 ESCOs, the difference in impacts is not likely due to differences in their length of CEC participation since Wave 1 ESCOs lowered payments in both their first and second performance years, while Wave 2 ESCOs did not. The growing share of lower performing Wave 2 new joiners in the analytic sample as shown in Exhibit 10 offset the payment reductions achieved by Wave 1.
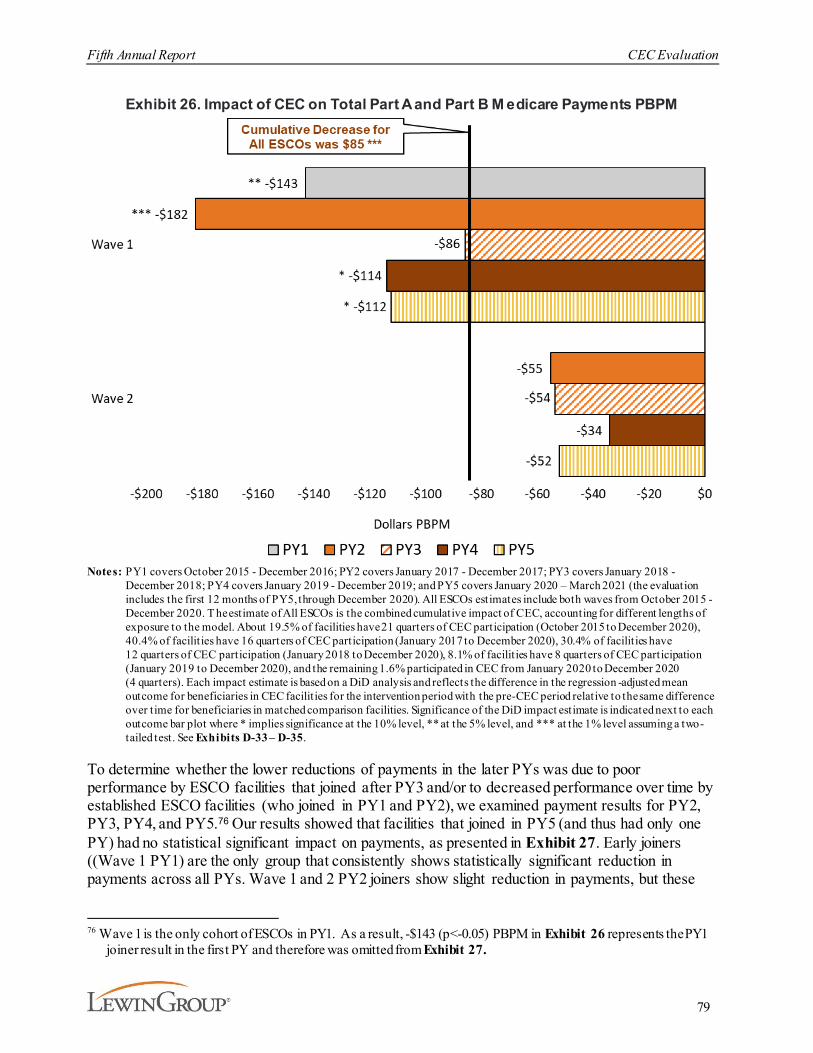
Fifth Annual Report CEC Evaluation
79
Exhibit 26. Impact of CEC on Total Part A and Part B M edicare Payments PBPM
Notes: PY1 covers October 2015 - December 2016; PY2 covers January 2017 - December 2017; PY3 covers January 2018 - December 2018; PY4 covers January 2019 - December 2019; and PY5 covers January 2020 – March 2021 (the evaluation includes the first 12 months of PY5, through December 2020). All ESCOs estimates include both waves from October 2015 - December 2020. T he estimate of All ESCOs is the combined cumulative impact of CEC, accounting for different lengths of exposure to the model. About 19.5% of facilities have 21 quarters of CEC participation (October 2015 to December 2020), 40.4% of facilit ies have 16 quarters of CEC participation (January 2017 to December 2020), 30.4% of facilit ies have 12 quarters of CEC participation (January 2018 to December 2020), 8.1% of facilit ies have 8 quarters of CEC participation (January 2019 to December 2020), and the remaining 1.6% participated in CEC from January 2020 to December 2020 (4 quarters). Each impact estimate is based on a DiD analysis and reflects the difference in the regression -adjusted mean outcome for beneficiaries in CEC facilit ies for the intervention period with the pre-CEC period relative to the same difference over time for beneficiaries in matched comparison facilities. Significance of the DiD impact estimate is indicated next to each outcome bar plot where * implies significance at the 10% level, ** at the 5% level, and *** at the 1% level assuming a two-tailed test. See Exhibits D-33 – D-35.
To determine whether the lower reductions of payments in the later PYs was due to poor performance by ESCO facilities that joined after PY3 and/or to decreased performance over time by established ESCO facilities (who joined in PY1 and PY2), we examined payment results for PY2, PY3, PY4, and PY5.76 Our results showed that facilities that joined in PY5 (and thus had only one PY) had no statistical significant impact on payments, as presented in Exhibit 27. Early joiners ((Wave 1 PY1) are the only group that consistently shows statistically significant reduction in payments across all PYs. Wave 1 and 2 PY2 joiners show slight reduction in payments, but these
76 Wave 1 is the only cohort of ESCOs in PY1. As a result, -$143 (p<-0.05) PBPM in Exhibit 26 represents the PY1
joiner result in the first PY and therefore was omitted from Exhibit 27.
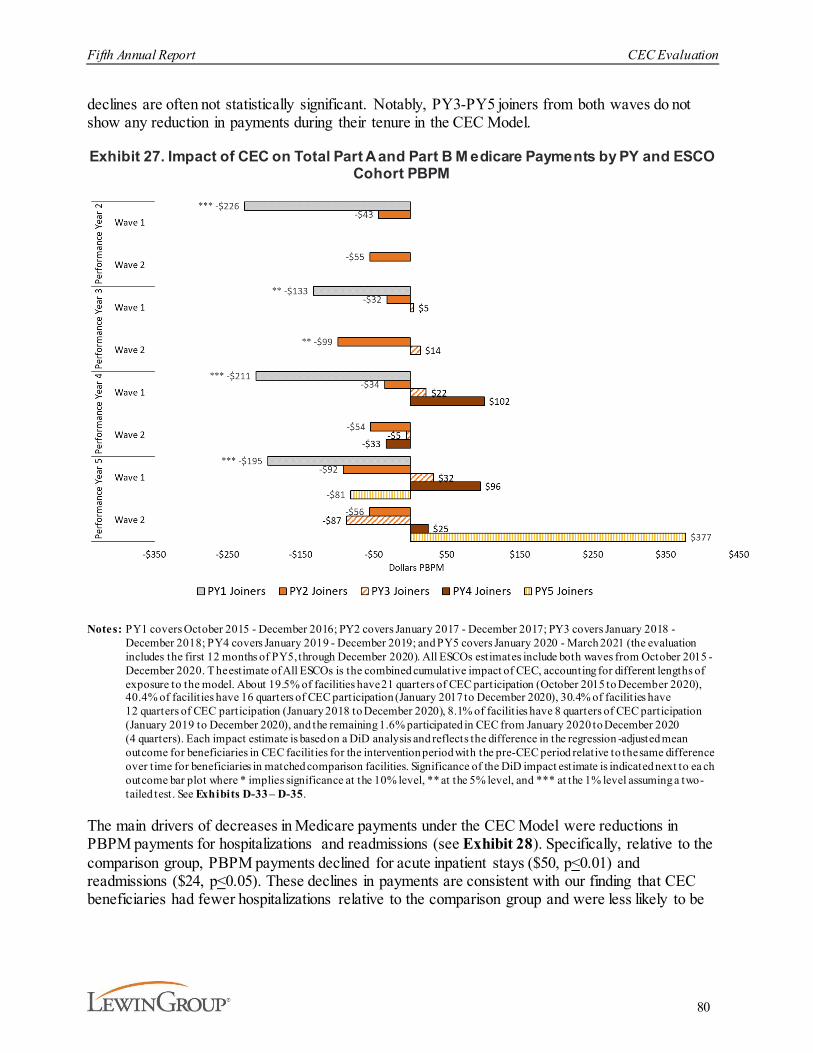
Fifth Annual Report CEC Evaluation
80
declines are often not statistically significant. Notably, PY3-PY5 joiners from both waves do not show any reduction in payments during their tenure in the CEC Model.
Exhibit 27. Impact of CEC on Total Part A and Part B M edicare Payments by PY and ESCO Cohort PBPM
Notes: PY1 covers October 2015 - December 2016; PY2 covers January 2017 - December 2017; PY3 covers January 2018 - December 2018; PY4 covers January 2019 - December 2019; and PY5 covers January 2020 - March 2021 (the evaluation includes the first 12 months of PY5, through December 2020). All ESCOs estimates include both waves from October 2015 - December 2020. T he estimate of All ESCOs is the combined cumulative impact of CEC, accounting for different lengths of exposure to the model. About 19.5% of facilities have 21 quarters of CEC participation (October 2015 to December 2020), 40.4% of facilit ies have 16 quarters of CEC participation (January 2017 to December 2020), 30.4% of facilit ies have 12 quarters of CEC participation (January 2018 to December 2020), 8.1% of facilit ies have 8 quarters of CEC participation (January 2019 to December 2020), and the remaining 1.6% participated in CEC from January 2020 to December 2020 (4 quarters). Each impact estimate is based on a DiD analysis and reflects the difference in the regression -adjusted mean outcome for beneficiaries in CEC facilit ies for the intervention period with the pre-CEC period relative to the same difference over time for beneficiaries in matched comparison facilities. Significance of the DiD impact estimate is indicated next to ea ch outcome bar plot where * implies significance at the 10% level, ** at the 5% level, and *** at the 1% level assuming a two-tailed test. See Exhibits D-33 – D-35.
The main drivers of decreases in Medicare payments under the CEC Model were reductions in PBPM payments for hospitalizations and readmissions (see Exhibit 28). Specifically, relative to the comparison group, PBPM payments declined for acute inpatient stays ($50, p<0.01) and readmissions ($24, p<0.05). These declines in payments are consistent with our finding that CEC beneficiaries had fewer hospitalizations relative to the comparison group and were less likely to be

Fifth Annual Report CEC Evaluation
81
readmitted (see Exhibits 20 and 23). Payments for institutional PAC also declined ($30, p<0.05 ).77
This corresponds with the reductions in hospitalization as institutional PAC stays often follow acute hospitalizations. Wave 1 ESCOs consistently achieved larger reductions in acute inpatient and readmissions payments compared to Wave 2 ESCOs. Overall, their payment reductions were greater in PY2 relative to PY1, but lower in PY3 through PY5. Both Wave 1 and Wave 2 reduced institutional PAC payments significantly in PY5, where reductions in previous PYs were generally smaller and often not statistically significant. The impact on payments for home health services for all ESCOs, which are often provided to safely transition patients home after an acute or post-acute institutional stay, was small and not statistically significant.
77 Institutional PAC includes payments from inpatient rehabilitation facilities, SNFs, and long -term care hospitals.
Individual analysis of these payments groups identified that payment reductions in institutional PAC was primarily driven by long-term care hospital Medicare payment reductions.
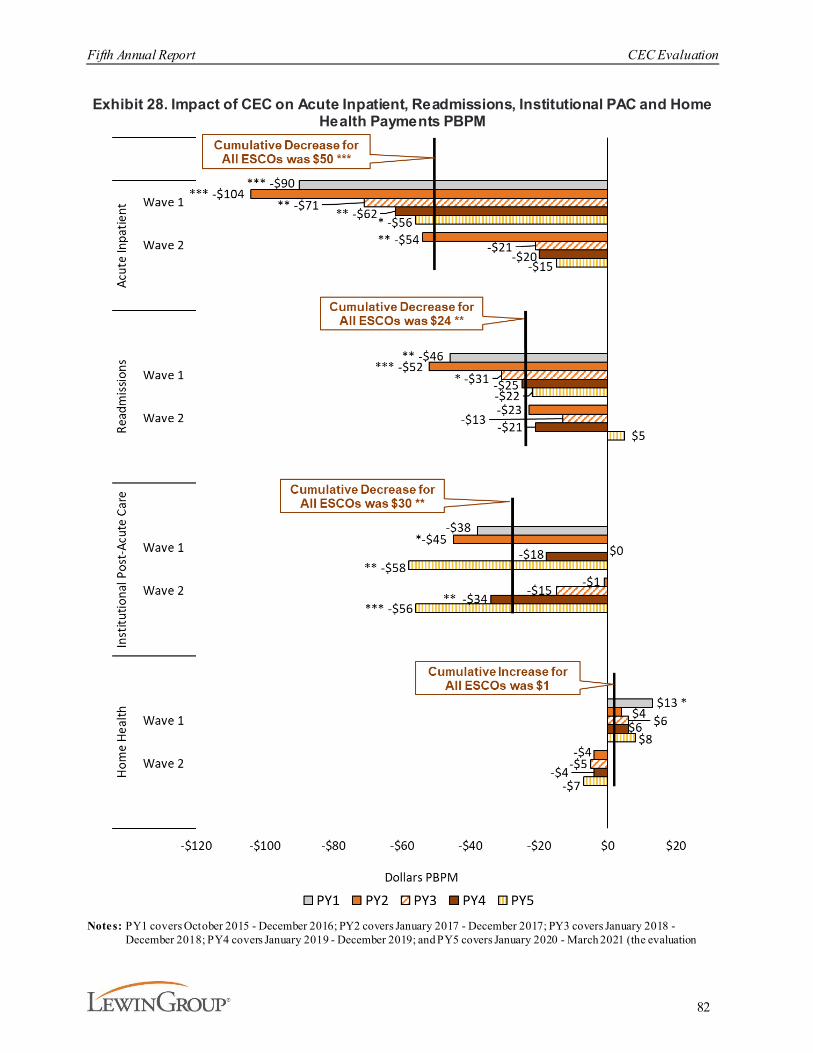
Fifth Annual Report CEC Evaluation
82
Exhibit 28. Impact of CEC on Acute Inpatient, Readmissions, Institutional PAC and Home Health Payments PBPM
Notes: PY1 covers October 2015 - December 2016; PY2 covers January 2017 - December 2017; PY3 covers January 2018 - December 2018; PY4 covers January 2019 - December 2019; and PY5 covers January 2020 - March 2021 (the evaluation

Fifth Annual Report CEC Evaluation
83
includes the first 12 months of PY5, through December 2020). All ESCOs estimates include both waves from October 2015 - December 2020. T he estimate of All ESCOs is the combined cumulative impact of CEC, accounting for different lengths of exposure to the model. About 19.5% of facilities have 21 quarters of CEC participation (October 2015 to December 2020), 40.4% of facilit ies have 16 quarters of CEC participation (January 2017 to December 2020), 30.4% of facilit ies have 12 quarters of CEC participation (January 2018 to December 2020), 8.1% of facilit ies have 8 quarters of CEC participation (January 2019 to December 2020), and the remaining 1.6% participated in CEC from January 2020 to December 2020 (4 quarters). Each impact estimate is based on a DiD analysis and reflects the difference in the regression-adjusted mean outcome for beneficiaries in CEC facilit ies for the intervention period with the pre-CEC period relative to the same difference over time for beneficiaries in matched comparison facilities. Significance of the DiD impact estimate is indicated next to each outcome bar plot where * implies significance at the 10% level, ** at the 5% level, and *** at the 1% level assuming a two-tailed test . Readmission are included in the overall acute inpatient payments and we exclude the last quarter of intervention data to account for a lag in claims to prevent underestimation. See Exhibits D-33 – D-35.
There were also statistically significant impacts in payments for certain Part B services (see Exhibit 29). Driven by Wave 1, all ESCOs’ total dialysis PBPM payments increased by $6 (not statistically significant), relative to the comparison group.78 Given that the bundled payment rate per session is fixed (aside from case-mix adjustments), this increase is consistent with the increase in the number of outpatient treatments (see Exhibit 10). Although, we observe an increased number of primary-care outpatient office visits for CEC beneficiaries (see Exhibit 16), the CEC Model did not lead to overall statistically significant changes in PBPM payments for office visits.
78 Since dialysis payments did not pass statistical testing of the parallel trends assumption for the pooled sample that
include all ESCOs as well as for both waves separately, we also inspected the trends graph which compared trends between the CEC beneficiaries and the comparison group and observed no evident differences. Additionally, the coefficient on the difference in trends in the pre-CEC period, although significant, equaled: $1.04 (all ESCOs), $1.21 (Wave 1), and $0.92 (Wave 2) (see Exhibit D-23).
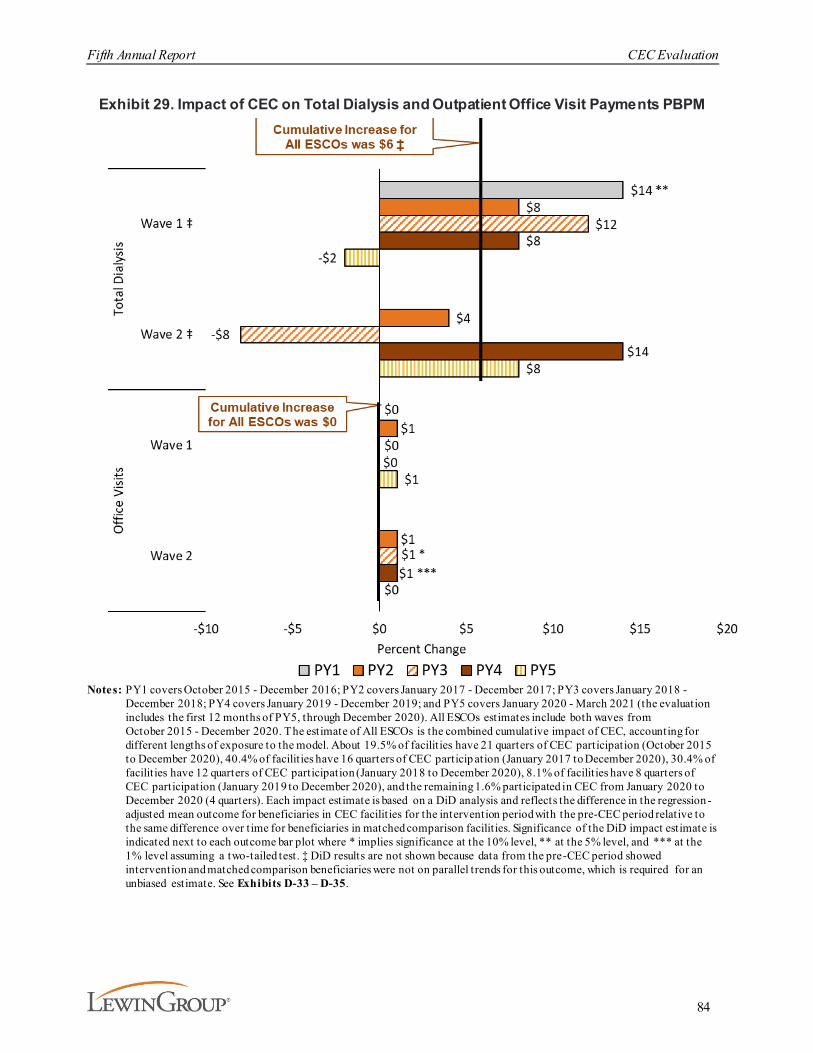
Fifth Annual Report CEC Evaluation
84
Exhibit 29. Impact of CEC on Total Dialysis and Outpatient Office Visit Payments PBPM
Notes: PY1 covers October 2015 - December 2016; PY2 covers January 2017 - December 2017; PY3 covers January 2018 - December 2018; PY4 covers January 2019 - December 2019; and PY5 covers January 2020 - March 2021 (the evaluation includes the first 12 months of PY5, through December 2020). All ESCOs estimates include both waves from October 2015 - December 2020. The estimate of All ESCOs is the combined cumulative impact of CEC, accounting for different lengths of exposure to the model. About 19.5% of facilit ies have 21 quarters of CEC participation (October 2015 to December 2020), 40.4% of facilit ies have 16 quarters of CEC particip ation (January 2017 to December 2020), 30.4% of facilit ies have 12 quarters of CEC participation (January 2018 to December 2020), 8.1% of facilit ies have 8 quarters of CEC participation (January 2019 to December 2020), and the remaining 1.6% participated in CEC from January 2020 to December 2020 (4 quarters). Each impact estimate is based on a DiD analysis and reflects the difference in the regression -adjusted mean outcome for beneficiaries in CEC facilit ies for the intervention period with the pre-CEC period relative to the same difference over time for beneficiaries in matched comparison facilit ies. Significance of the DiD impact estimate is indicated next to each outcome bar plot where * implies significance at the 10% level, ** at the 5% level, and *** at the 1% level assuming a two-tailed test. ‡ DiD results are not shown because data from the pre-CEC period showed intervention and matched comparison beneficiaries were not on parallel trends for this outcome, which is required for an unbiased estimate. See Exhibits D-33 – D-35.

Fifth Annual Report CEC Evaluation
85
The impact of the CEC Model on total Part A and Part B payments without accounting for financial reconciliation payments between ESCOs and CMS, translates into an aggregate change in payments of approximately -$217 million (90% CI, -$350 to -$84 million, p<0.01):
§ -$29 million in PY1 (90% CI, -$51 to -$7 million, p<0.05),
§ -$49 million in PY2 (90% CI, -$77 to -$21 million, p<0.01),
§ -$43 million in PY3 (90% CI, -$83 to -$4 million, p<0.10),§ -$45 million in PY4 (90% CI, -$87 to -$4 million, p<0.10), and
§ -$50 million in PY5 (90% CI, -$94 to -$6 million, p<0.10).79
A key contributor to the decline in total payments was an aggregate change in payments for acute inpatient services (-$124 million) (see Exhibit 30).
Exhibit 30. Aggregate Estimates of Changes in Medicare Payments by Service Setting
Notes: Significance of the DiD impact estimate is indicated next to each outcome bar plot where * implies significance at the 10% level, ** at the 5% level, and *** at the 1% level assuming a two-tailed test. Reductions in spending are based on the estimated total number of intervention member months for the 1,290 CEC facilit ies participating in the CEC Model. DiD impact estimates are adjusted to non-standardized values using the average ratio total standardized and non-standardized payments. Readmission and hospitalizations for ESRD complications expenditures are included in the overall acute inpatient spending. ‡ Data from the baseline period showed intervention and matched comparison facilities were not on parallel trends for this outcome, which is required for an unbiased impact estimate.
3.3.6. What Was the Impact of CEC on Medicare Beneficiary Subpopulations?We investigated the extent to which the CEC Model had a differential impact on subgroups of Medicare beneficiaries with ESRD varying in their demographic characteristics (e.g., race, sex), basis of Medicare eligibility, dual Medicaid status, and their time on dialysis (six months or less versus more than six months). To this end, we estimated stratified DiD models with the specification described in Appendix D. While the subgroup analyses were exploratory and have important limitations, the decomposition provides insights to the subpopulations that may be influencing the respective DiD results. The results are reported in Exhibits 31 and 32.
The stratified results are often consistent with those observed for total Part A and Part B Medicare payments, hospitalizations, readmissions, ED visits, catheter use, and fistula use in the full CEC
79 Financial reconciliation payments were not available at the time the analysis was produced for this report.
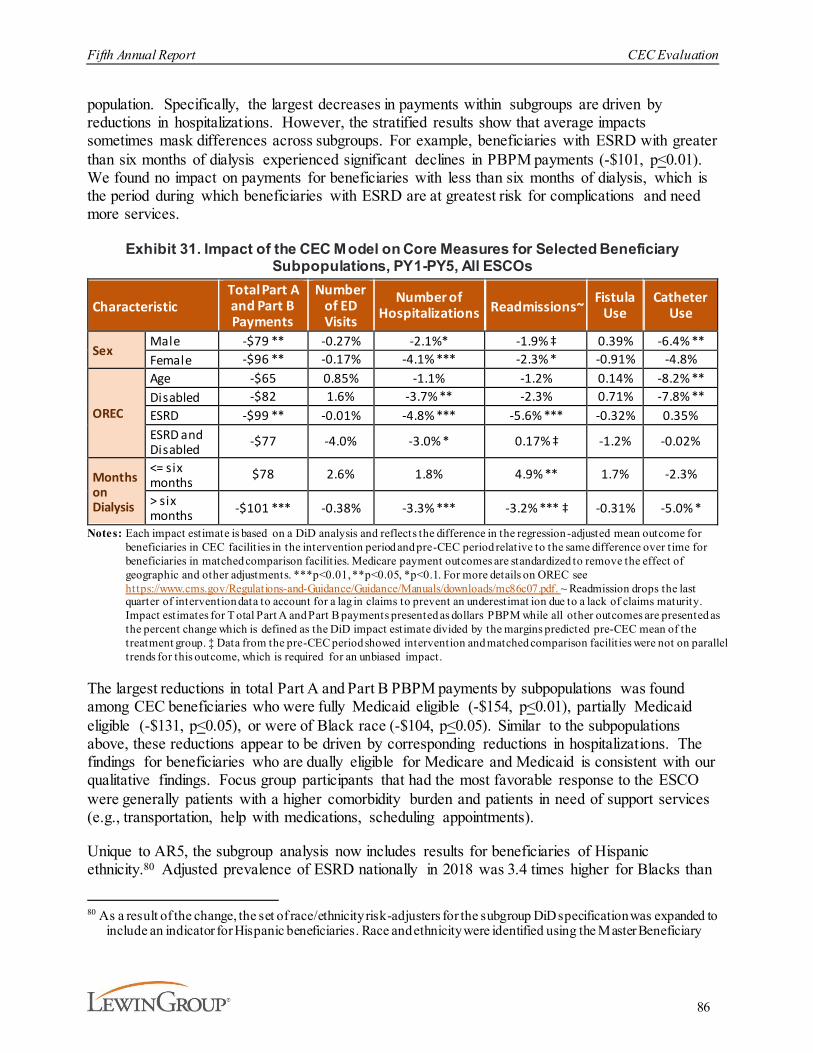
Fifth Annual Report CEC Evaluation
86
population. Specifically, the largest decreases in payments within subgroups are driven by reductions in hospitalizations. However, the stratified results show that average impacts sometimes mask differences across subgroups. For example, beneficiaries with ESRD with greater than six months of dialysis experienced significant declines in PBPM payments (-$101, p<0.01). We found no impact on payments for beneficiaries with less than six months of dialysis, which is the period during which beneficiaries with ESRD are at greatest risk for complications and need more services.
Exhibit 31. Impact of the CEC Model on Core Measures for Selected Beneficiary Subpopulations, PY1-PY5, All ESCOs
CharacteristicTotal Part A and Part B Payments
Number of ED Visits
Number of Hospitalizations Readmissions~
Fistula Use
Catheter Use
SexMale -$79 ** -0.27% -2.1%* -1.9% ‡ 0.39% -6.4% **Female -$96 ** -0.17% -4.1% *** -2.3% * -0.91% -4.8%
OREC
Age -$65 0.85% -1.1% -1.2% 0.14% -8.2% **Disabled -$82 1.6% -3.7% ** -2.3% 0.71% -7.8% **ESRD -$99 ** -0.01% -4.8% *** -5.6% *** -0.32% 0.35%ESRD and Disabled -$77 -4.0% -3.0% * 0.17% ‡ -1.2% -0.02%
Months on Dialysis
<= six months $78 2.6% 1.8% 4.9% ** 1.7% -2.3%
> six months -$101 *** -0.38% -3.3% *** -3.2% *** ‡ -0.31% -5.0% *
Notes: Each impact estimate is based on a DiD analysis and reflects the difference in the regression -adjusted mean outcome for beneficiaries in CEC facilit ies in the intervention period and pre-CEC period relative to the same difference over time for beneficiaries in matched comparison facilit ies. Medicare payment outcomes are standardized to remove the effect of geographic and other adjustments. ***p<0.01, **p<0.05, *p<0.1. For more details on OREC see https://www.cms.gov/Regulations-and-Guidance/Guidance/Manuals/downloads/mc86c07.pdf. ~ Readmission drops the last quarter of intervention data to account for a lag in claims to prevent an underestimat ion due to a lack of claims maturity. Impact estimates for T otal Part A and Part B payments presented as dollars PBPM while all other outcomes are presented as the percent change which is defined as the DiD impact estimate divided by the margins predicted pre-CEC mean of the treatment group. ‡ Data from the pre-CEC period showed intervention and matched comparison facilit ies were not on parallel trends for this outcome, which is required for an unbiased impact.
The largest reductions in total Part A and Part B PBPM payments by subpopulations was found among CEC beneficiaries who were fully Medicaid eligible (-$154, p<0.01), partially Medicaid eligible (-$131, p<0.05), or were of Black race (-$104, p<0.05). Similar to the subpopulations above, these reductions appear to be driven by corresponding reductions in hospitalizations. The findings for beneficiaries who are dually eligible for Medicare and Medicaid is consistent with our qualitative findings. Focus group participants that had the most favorable response to the ESCO were generally patients with a higher comorbidity burden and patients in need of support services (e.g., transportation, help with medications, scheduling appointments).
Unique to AR5, the subgroup analysis now includes results for beneficiaries of Hispanic ethnicity.80 Adjusted prevalence of ESRD nationally in 2018 was 3.4 times higher for Blacks than
80 As a result of the change, the set of race/ethnicity risk-adjusters for the subgroup DiD specification was expanded to
include an indicator for Hispanic beneficiaries. Race and ethnicity were identified using the Master Beneficiary

Fifth Annual Report CEC Evaluation
87
Whites and 1.5 times higher for individuals of Hispanic ethnicity than for individuals who are not Hispanic.81 Beneficiaries who are Hispanic experienced the largest relative reduction in hospitalizations (8.8%, p<0.05). However, among CEC beneficiaries who are Hispanic, significant reductions in hospitalizations do not appear to be driving payment reductions overall.
There are several important limitations to be considered when interpreting the results from the subgroup analysis. First, the overall model comparison group was selected at the facility level by matching on a set of facility and market characteristics and for the subgroup analysis it was later stratified to beneficiaries of each subgroup of interest. Moreover, we did not include the Hispanic population as part of the match criteria, and as a result the subgroup sample is not representative of all CEC facilities.82 Similarly, the relative representation of ESCO waves in the main analysis may not hold for each subgroup. In the overall All ESCO main impact estimate, Wave 2 observations represent 51.5 percent of the intervention data. However, in the Hispanic subgroup, Wave 2 is underrepresented relative to the overall analysis, accounting for just 42.6 percent of the intervention data. Finally, stratifying the data into subgroups decreases the number of observations for a given impact estimate potentially leading to a loss of precision and increased standard errors.83
Despite the important limitations to decomposing by subpopulations, these findings suggest that the model did not have undesirable impacts for disadvantaged subpopulations and may reflect improvements in some outcomes.
Summary File (MBSF). A notable limitation of this variable is that it under identifies beneficiaries of Hispanic ethnicity as the other sub-population groups (i.e., White, Black, and Other) also include beneficiaries of Hispanic ethnicity.
81 United States Renal Data System. (2020). 2020 USRDS annual data report: Epidemiology of kidney disease in the United States. National Institutes of Health, National Institute of Diabetes and Digestive and Kidney Diseases . https://adr.usrds.org/2020
82 Only 790 of the 1054 CEC facilities included in the overall analysis are include in the Hispanic sub-sample83 Specifically, for a given subgroup each ESCO facility matched pair may not be maintained after the strat ification
was imposed.
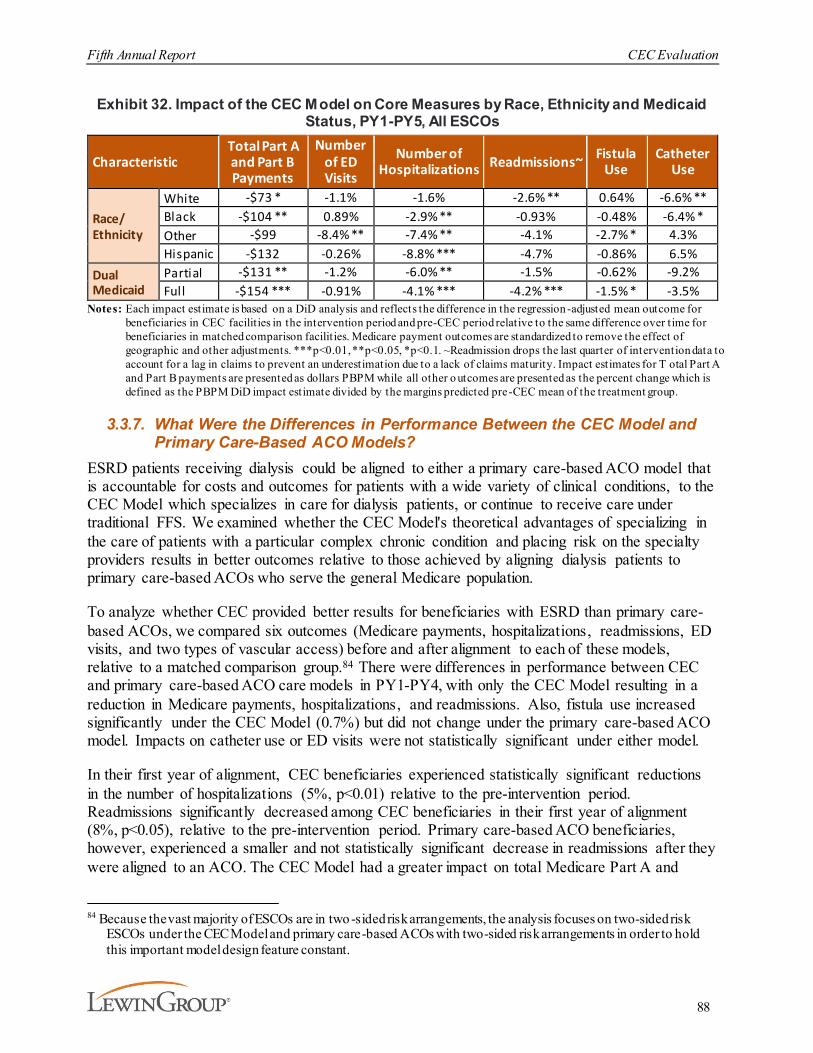
Fifth Annual Report CEC Evaluation
88
Exhibit 32. Impact of the CEC Model on Core Measures by Race, Ethnicity and Medicaid Status, PY1-PY5, All ESCOs
CharacteristicTotal Part Aand Part B Payments
Number of ED Visits
Number of Hospitalizations Readmissions~ Fistula
UseCatheter
Use
Race/Ethnicity
White -$73 * -1.1% -1.6% -2.6% ** 0.64% -6.6% **Black -$104 ** 0.89% -2.9% ** -0.93% -0.48% -6.4% *Other -$99 -8.4% ** -7.4% ** -4.1% -2.7% * 4.3%Hispanic -$132 -0.26% -8.8% *** -4.7% -0.86% 6.5%
Dual Medicaid
Partial -$131 ** -1.2% -6.0% ** -1.5% -0.62% -9.2%Full -$154 *** -0.91% -4.1% *** -4.2% *** -1.5% * -3.5%
Notes: Each impact estimate is based on a DiD analysis and reflects the difference in the regression -adjusted mean outcome for beneficiaries in CEC facilit ies in the intervention period and pre-CEC period relative to the same difference over time for beneficiaries in matched comparison facilit ies. Medicare payment outcomes are standardized to remove the effect of geographic and other adjustments. ***p<0.01, **p<0.05, *p<0.1. ~Readmission drops the last quarter of intervention data to account for a lag in claims to prevent an underestimation due to a lack of claims maturity. Impact estimates for T otal Part A and Part B payments are presented as dollars PBPM while all other o utcomes are presented as the percent change which is defined as the PBPM DiD impact estimate divided by the margins predicted pre-CEC mean of the treatment group.
3.3.7. What Were the Differences in Performance Between the CEC Model and Primary Care-Based ACO Models?
ESRD patients receiving dialysis could be aligned to either a primary care-based ACO model that is accountable for costs and outcomes for patients with a wide variety of clinical conditions, to the CEC Model which specializes in care for dialysis patients, or continue to receive care under traditional FFS. We examined whether the CEC Model's theoretical advantages of specializing in the care of patients with a particular complex chronic condition and placing risk on the specialty providers results in better outcomes relative to those achieved by aligning dialysis patients to primary care-based ACOs who serve the general Medicare population.
To analyze whether CEC provided better results for beneficiaries with ESRD than primary care-based ACOs, we compared six outcomes (Medicare payments, hospitalizations, readmissions, ED visits, and two types of vascular access) before and after alignment to each of these models, relative to a matched comparison group.84 There were differences in performance between CEC and primary care-based ACO care models in PY1-PY4, with only the CEC Model resulting in a reduction in Medicare payments, hospitalizations, and readmissions. Also, fistula use increased significantly under the CEC Model (0.7%) but did not change under the primary care-based ACO model. Impacts on catheter use or ED visits were not statistically significant under either model.
In their first year of alignment, CEC beneficiaries experienced statistically significant reductions in the number of hospitalizations (5%, p<0.01) relative to the pre-intervention period. Readmissions significantly decreased among CEC beneficiaries in their first year of alignment (8%, p<0.05), relative to the pre-intervention period. Primary care-based ACO beneficiaries, however, experienced a smaller and not statistically significant decrease in readmissions after they were aligned to an ACO. The CEC Model had a greater impact on total Medicare Part A and
84 Because the vast majority of ESCOs are in two-sided risk arrangements, the analysis focuses on two-sided risk
ESCOs under the CEC Model and primary care-based ACOs with two-sided risk arrangements in order to hold this important model design feature constant.
Fifth Annual Report CEC Evaluation
89
Part B payments than the primary care-based ACO models. Relative to a matched comparison group, Medicare payments decreased by $126 PBPM (2%, p<0.01) in the first year of alignment for beneficiaries with ESRD who were aligned to CEC. The reduction in payments observed in newly aligned CEC beneficiaries was driven by a reduction in the number of hospitalizations and readmissions.85
3.4. Discussion
This final evaluation report of the CEC Model explored a variety of measures that covered several domains of performance (e.g., dialysis care, coordination beyond dialysis, acute care and ED utilization). Considering the statistical significance and magnitudes of the effects average over the entire five PYs, adding PY5 to the analysis generally maintained the overall conclusions of earlier analyses. For example, the average PBPM payment reduction reported rose slightly from $80 in AR4 (based on analyses of PY1-PY4 data) to $85 in this final five-year evaluation. Similarly, many of the differences between waves were sustained in the final analysis. Where differences emerged between waves, Wave 1 ESCOs continued to achieve better results than Wave 2 ESCOs on most measures. Nonetheless, some specific measures showed notable trends across PYs overall or by wave. Over the five PYs, the model generated approximately $217 million aggregate reduction in Medicare payments before accounting for financial reconciliation payments between ESCOs and CMS. Overall, the experience under the CEC Model continues to suggest improvements in delivery and quality of dialysis care and reductions in acute care utilization and Medicare payments.
Several metrics showed consistent or rising trends in the performance of the CEC Model relative to the comparison group. The increase in outpatient dialysis sessions PBPM was maintained by Wave 1 ESCOs and remained small and not statistically significant for Wave 2 ESCOs. The impact on vascular access converged over time between waves as the large decrease in catheter use observed in Wave 1 during the early PYs moderated while the null effect initially seen in Wave 2 grew over time. By PY5, both waves showed a 6% reduction in catheter use relative to the comparison group. Gains in flu vaccination rates were maintained, and the stronger effects on phosphate binder adherence seen in PY4 were maintained in PY5.
However, the CEC Model’s lower hospitalization rates waned over time, and in PY4 and PY5 were only significant for Wave 1 ESCOs. Similarly, the effects on readmissions were not maintained in PY5 and the decreases in hospitalizations for vascular access or other ESRD complications were smaller in PY5 than in earlier years and were not statistically significant. Given these findings, it may be surprising that overall in PBPM spending were about the same ($85) when including data from PY1-PY5 as they were in AR4 which included PY1-PY4 ($80). However, the smaller inpatient savings were largely offset by greater savings in institutional PAC.
One measure for which the impact of the model rose substantially in the last two years of the evaluation period was the likelihood of receiving home dialysis. This measure increased in PY4 for both waves relative to the comparison group but did not attain statistical significance. It increased further in PY5 and was significant for Wave 2. This change could reflect enhanced
85 See AR4 for further discussion of the ACO analysis and methods for PY1-PY4.
Fifth Annual Report CEC Evaluation
90
awareness of new payment models announced in 2019. These new models strongly emphasize increasing use of home dialysis and it is possibly that CEC participants are more cognizant of these models or will be more likely to participate in them than facilities in the comparison group. Site visits during PY4 also indicated more emphasis on modality selection than in earlier site visits. It could also reflect the desire to avoid in-center dialysis during the COVID-19 pandemic, but as noted the trend began prior to the pandemic and it is not clear that the desire to avoid in-center dialysis during the pandemic would be stronger among CEC participants relative to the comparison group.
The survival analyses updated with PY5 data continued to suggest that there is a survival benefit associated with the CEC Model. That benefit is modest overall but is larger for those beneficiaries aligned during their first year of dialysis. However, the magnitude of the differences between the CEC and comparison groups declined modestly after adding PY5 data, though they remained statistically significant.
Finally, modifications to AR5 estimation methods were implemented to mitigate bias due to COVID-19. In general, these modifications did not substantially change the results, and different methods of adjustment yielded similar outcomes. One specific area where we tried to estimate the effects of the pandemic on care was the use of telehealth. Almost half of the reduction seen in face-to-face visits was offset by increased telehealth use. This finding was nearly identical in the CEC and comparison groups, so there is no evidence that the CEC group was differentially associated with the shift in visit type.
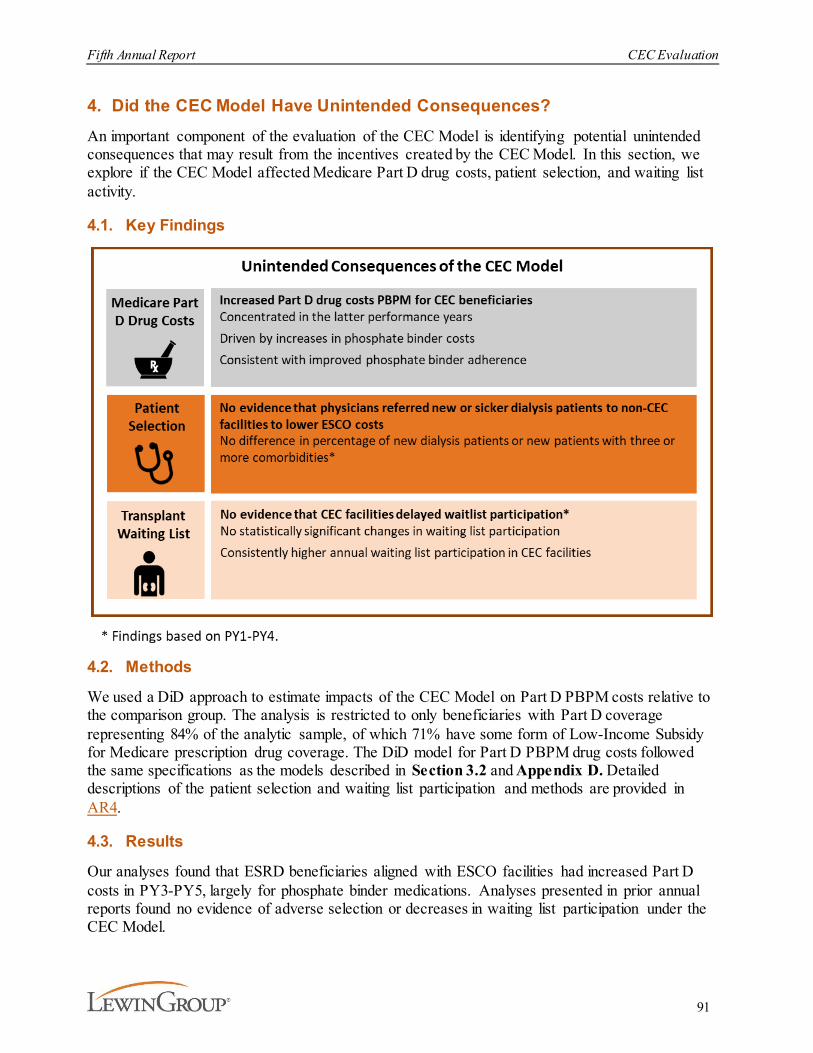
Fifth Annual Report CEC Evaluation
91
4. Did the CEC Model Have Unintended Consequences? An important component of the evaluation of the CEC Model is identifying potential unintended consequences that may result from the incentives created by the CEC Model. In this section, we explore if the CEC Model affected Medicare Part D drug costs, patient selection, and waiting list activity.
4.1. Key Findings
4.2. Methods
We used a DiD approach to estimate impacts of the CEC Model on Part D PBPM costs relative to the comparison group. The analysis is restricted to only beneficiaries with Part D coverage representing 84% of the analytic sample, of which 71% have some form of Low-Income Subsidy for Medicare prescription drug coverage. The DiD model for Part D PBPM drug costs followed the same specifications as the models described in Section 3.2 and Appendix D. Detailed descriptions of the patient selection and waiting list participation and methods are provided in AR4.
4.3. Results
Our analyses found that ESRD beneficiaries aligned with ESCO facilities had increased Part D costs in PY3-PY5, largely for phosphate binder medications. Analyses presented in prior annual reports found no evidence of adverse selection or decreases in waiting list participation under the CEC Model.
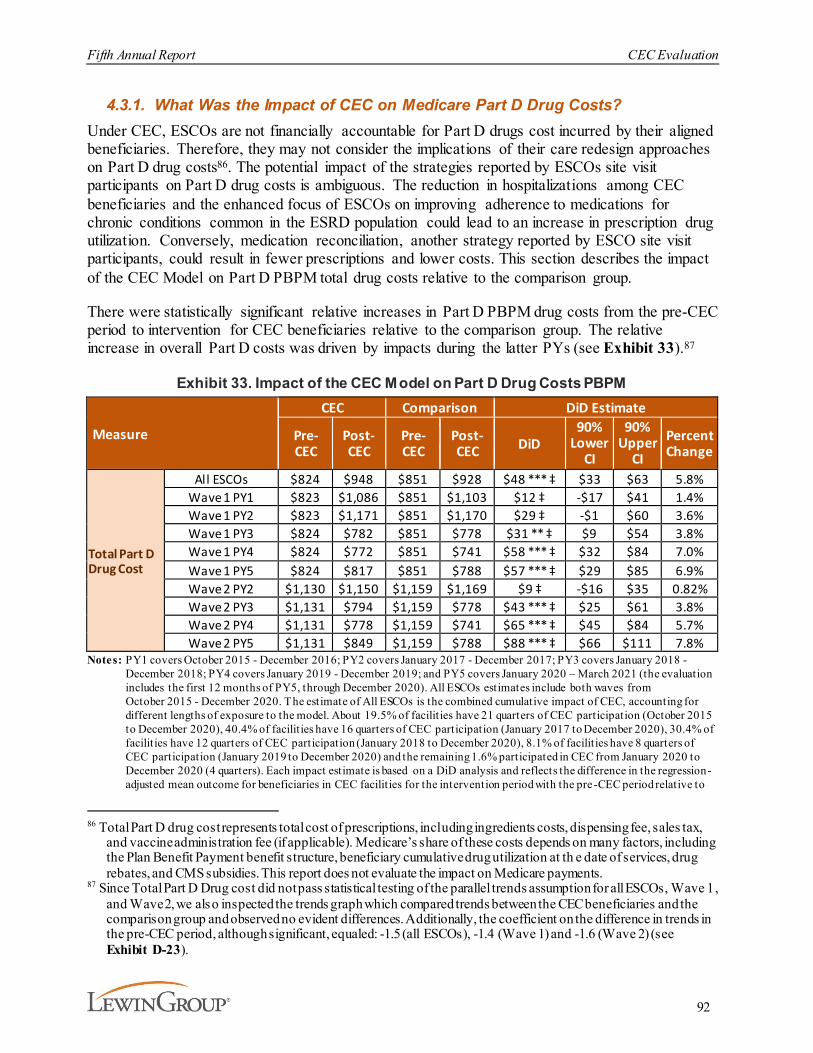
Fifth Annual Report CEC Evaluation
92
4.3.1. What Was the Impact of CEC on Medicare Part D Drug Costs?Under CEC, ESCOs are not financially accountable for Part D drugs cost incurred by their aligned beneficiaries. Therefore, they may not consider the implications of their care redesign approaches on Part D drug costs86. The potential impact of the strategies reported by ESCOs site visit participants on Part D drug costs is ambiguous. The reduction in hospitalizations among CEC beneficiaries and the enhanced focus of ESCOs on improving adherence to medications for chronic conditions common in the ESRD population could lead to an increase in prescription drug utilization. Conversely, medication reconciliation, another strategy reported by ESCO site visit participants, could result in fewer prescriptions and lower costs. This section describes the impact of the CEC Model on Part D PBPM total drug costs relative to the comparison group.
There were statistically significant relative increases in Part D PBPM drug costs from the pre-CEC period to intervention for CEC beneficiaries relative to the comparison group. The relative increase in overall Part D costs was driven by impacts during the latter PYs (see Exhibit 33).87
Exhibit 33. Impact of the CEC Model on Part D Drug Costs PBPM
Measure
CEC Comparison DiD Estimate
Pre- CEC
Post-CEC
Pre- CEC
Post-CEC DiD
90% Lower
CI
90% Upper
CIPercent Change
Total Part D Drug Cost
All ESCOs $824 $948 $851 $928 $48 *** ‡ $33 $63 5.8%Wave 1 PY1 $823 $1,086 $851 $1,103 $12 ‡ -$17 $41 1.4%Wave 1 PY2 $823 $1,171 $851 $1,170 $29 ‡ -$1 $60 3.6%Wave 1 PY3 $824 $782 $851 $778 $31 ** ‡ $9 $54 3.8%Wave 1 PY4 $824 $772 $851 $741 $58 *** ‡ $32 $84 7.0%Wave 1 PY5 $824 $817 $851 $788 $57 *** ‡ $29 $85 6.9%Wave 2 PY2 $1,130 $1,150 $1,159 $1,169 $9 ‡ -$16 $35 0.82%Wave 2 PY3 $1,131 $794 $1,159 $778 $43 *** ‡ $25 $61 3.8%Wave 2 PY4 $1,131 $778 $1,159 $741 $65 *** ‡ $45 $84 5.7%Wave 2 PY5 $1,131 $849 $1,159 $788 $88 *** ‡ $66 $111 7.8%
Notes: PY1 covers October 2015 - December 2016; PY2 covers January 2017 - December 2017; PY3 covers January 2018 - December 2018; PY4 covers January 2019 - December 2019; and PY5 covers January 2020 – March 2021 (the evaluation includes the first 12 months of PY5, through December 2020). All ESCOs estimates include both waves from October 2015 - December 2020. The estimate of All ESCOs is the combined cumulative impact of CEC, accounting for different lengths of exposure to the model. About 19.5% of facilit ies have 21 quarters of CEC participation (October 2015 to December 2020), 40.4% of facilit ies have 16 quarters of CEC participation (January 2017 to December 2020), 30.4% of facilit ies have 12 quarters of CEC participation (January 2018 to December 2020), 8.1% of facilit ies have 8 quarters of CEC participation (January 2019 to December 2020) and the remaining 1.6% participated in CEC from January 2020 to December 2020 (4 quarters). Each impact estimate is based on a DiD analysis and reflects the difference in the regression-adjusted mean outcome for beneficiaries in CEC facilit ies for the intervention period with the pre -CEC period relative to
86 Total Part D drug cost represents total cost of prescriptions, including ingredients costs, dispensing fee, sales tax,
and vaccine administration fee (if applicable). Medicare’s share of these costs depends on many factors, including the Plan Benefit Payment benefit structure, beneficiary cumulative drug utilization at th e date of services, drug rebates, and CMS subsidies. This report does not evaluate the impact on Medicare payments.
87 Since Total Part D Drug cost did not pass statistical testing of the parallel trends assumption for all ESCOs, Wave 1, and Wave 2, we also inspected the trends graph which compared trends between the CEC beneficiaries and the comparison group and observed no evident differences. Additionally, the coefficient on the difference in trends in the pre-CEC period, although significant, equaled: -1.5 (all ESCOs), -1.4 (Wave 1) and -1.6 (Wave 2) (see Exhibit D-23).
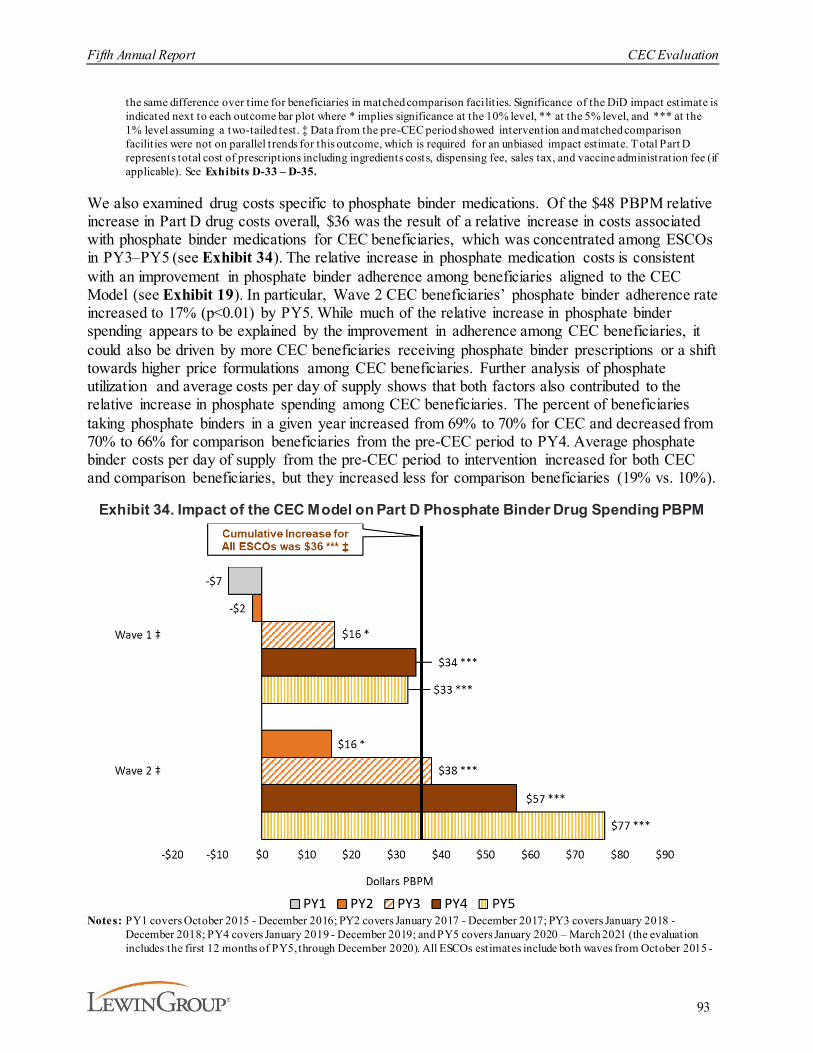
Fifth Annual Report CEC Evaluation
93
the same difference over time for beneficiaries in matched comparison facilit ies. Significance of the DiD impact estimate is indicated next to each outcome bar plot where * implies significance at the 10% level, ** at the 5% level, and *** at the 1% level assuming a two-tailed test. ‡ Data from the pre-CEC period showed intervention and matched comparison facilit ies were not on parallel trends for this outcome, which is required for an unbiased impact estimate. T otal Part D represents total cost of prescriptions including ingredients costs, dispensing fee, sales tax, and vaccine administration fee (if applicable). See Exhibits D-33 – D-35.
We also examined drug costs specific to phosphate binder medications. Of the $48 PBPM relative increase in Part D drug costs overall, $36 was the result of a relative increase in costs associated with phosphate binder medications for CEC beneficiaries, which was concentrated among ESCOs in PY3–PY5 (see Exhibit 34). The relative increase in phosphate medication costs is consistent with an improvement in phosphate binder adherence among beneficiaries aligned to the CEC Model (see Exhibit 19). In particular, Wave 2 CEC beneficiaries’ phosphate binder adherence rate increased to 17% (p<0.01) by PY5. While much of the relative increase in phosphate binder spending appears to be explained by the improvement in adherence among CEC beneficiaries, it could also be driven by more CEC beneficiaries receiving phosphate binder prescriptions or a shift towards higher price formulations among CEC beneficiaries. Further analysis of phosphate utilization and average costs per day of supply shows that both factors also contributed to the relative increase in phosphate spending among CEC beneficiaries. The percent of beneficiaries taking phosphate binders in a given year increased from 69% to 70% for CEC and decreased from 70% to 66% for comparison beneficiaries from the pre-CEC period to PY4. Average phosphate binder costs per day of supply from the pre-CEC period to intervention increased for both CEC and comparison beneficiaries, but they increased less for comparison beneficiaries (19% vs. 10%).
Exhibit 34. Impact of the CEC Model on Part D Phosphate Binder Drug Spending PBPM
Notes: PY1 covers October 2015 - December 2016; PY2 covers January 2017 - December 2017; PY3 covers January 2018 - December 2018; PY4 covers January 2019 - December 2019; and PY5 covers January 2020 – March 2021 (the evaluation includes the first 12 months of PY5, through December 2020). All ESCOs estimates include both waves from October 2015 -
Fifth Annual Report CEC Evaluation
94
December 2020. The estimate of All ESCOs is the combined cumulative impact of CEC, accounting for different lengths of exposure to the model. About 19.5% of facilities have 21 quarters of CEC participation (October 2015 to December 2020), 40.4% of facilit ies have 16 quarters of CEC participation (January 2017 to December 2020), 30.4% of facilit ies have 12 quarters of CEC participation (January 2018 to December 2020), 8.1% of facilit ies have 8 quarters of CEC participation (January 2019 to December 2020) and the remaining 1.6% participated in CEC from January 2020 to December 2020 (4 quarters). Each impact estimate is based on a DiD analysis and reflects the difference in the regression -adjusted mean outcome for beneficiaries in CEC facilit ies for the intervention period with the pre-CEC period relative to the same difference over time for beneficiaries in matched comparison facilities. Significance of the DiD impact estimate is indicated next to ea ch outcome bar plot where * implies significance at the 10% level, ** at the 5% level, and *** at the 1% level assuming a two-tailed test. ‡ Data from the pre-CEC period showed intervention and matched comparison facilities were not on parallel trends for this outcome, which is required for an unbiased impact estimate. See Exhibits D-33 – D-35.
4.3.2. Was there Evidence of Adverse Selection within CEC Facilities?The CEC Model may incentivize CEC nephrologists to refer sicker patients to non-CEC facilities while keeping healthier patients at CEC facilities. The model, however, is designed to limit the ways in which CEC nephrologists may cherry-pick patients. The “first touch” approach of the program limits physicians’ ability to steer existing patients away from the ESCO. Under the “first touch” approach, eligible CEC beneficiaries are prospectively aligned to an ESCO after their first visit to a dialysis facility participating in an ESCO, rather than retrospectively aligned to the provider delivering the plurality of the beneficiary’s services as in other ACO programs. Furthermore, once patients’ dialysis schedules are established at their chosen facility, it takes a significant amount of effort to get patients to switch facilities.88 Selection might occur if nephrologists decide to steer patients that are new to dialysis to certain types of facilities depending on their expected risk.
We investigated whether there was evidence that new dialysis patients in CEC facilities were healthier compared to new dialysis patients in matched comparison facilities and the total number of new dialysis patients. As described in prior annual reports, we found no statistically significant difference between CEC and comparison in the number of patients new to dialysis nor the number of patients with at least three comorbidities in PY1-PY4.89
4.3.3. What Was the CEC Model’s Impact on Transplant Waiting List Activity?Dialysis providers have the role of initiating the process for waitlisting for a transplant either directly (by referring the patient for a transplant evaluation) or indirectly (by educating the patient about the option of transplantation). Patients that are on the waiting list have gone through an evaluation of their suitability for transplant and thus are considered relatively healthier. The removal of beneficiaries from the CEC Model if they receive a transplant may create the adverse incentive to decrease referrals. We cannot directly observe referrals or patient education processes, but a decline in the rate of waitlisting could indicate that CEC providers are delaying transplant referrals with the intent of extending the time that relatively healthier patients are aligned to ESCOs. Doing so may improve the ESCOs’ overall performance and increase the chance of meeting requirements to qualify for shared savings under the model. We explored the potential
88 On average, 77% of the ESRD beneficiaries in the analytical sample used a single facility for all their dialysis
services in a year.89 For a full discussion of sample, methods, and find ings, see AR4.

Fifth Annual Report CEC Evaluation
95
unintended consequences of the CEC Model on referral of patients for transplant evaluation for waitlisting during the first four PYs.
As described in prior annual reports, we did not find evidence that CEC facilities delayed waitlist referrals.90 Annual waiting list participation was consistently higher in the CEC facilities than non-CEC facilities across the model PYs. However, both groups experienced declining participation across model PYs consistent with national trends. The overall impact on waiting list participation from the pre-CEC period to intervention for CEC beneficiaries relative to the comparison group in PY1-PY4 was positive (2%), although not statistically significant. The direction of the impact and the lack of statistical significance suggest that the CEC Model did not negatively impact waiting list participation during the first four PYs.
4.4. Discussion
In a shared savings model such as CEC that encourages lower payments, it is important to monitor potential unintended consequences that may negatively affect beneficiary care. Our analysis did not yield conclusive evidence of the unintended consequences of adverse selection. There were statistically significant differences in the change in Medicare Part D drug costs from the pre-CEC period to intervention between the CEC and comparison groups, driven by increases during the latter PYs. However, the increase in Part D drug costs was largely caused by an increase in utilization of phosphate binder drugs. Site visit participants emphasized patient education on the importance of taking phosphate binders and improved phosphate binder adherence was observed in the data. Therefore, this spending increase may reflect appropriate and desired changes in practice rather than an adverse practice of substitution from Part A and B services to Part D services, for which the ESCOs are not accountable.
Transplant waiting list activity has been declining more slowly among beneficiaries aligned with the CEC Model than for the comparison group, however the difference in trend was not statistically significant. The declines among all groups are potentially related to a change in federal transplant policy to base waiting list priority on start date of dialysis rather than the first date of placement on the waiting list. This potentially reduces the urgency of early referral to the waiting list.
90 See AR4 for further discussion of transplant waiting list analysis and methods.
Fifth Annual Report CEC Evaluation
96
5. DiscussionThe CEC Model is designed to create incentives for dialysis facilities and nephrologists to coordinate care for Medicare beneficiaries with ESRD across settings by making the ESCO accountable for the total cost of care of their aligned beneficiaries. The time period covered by this fifth and final annual report starts with the Wave 1 ESCOs that began operations in October 2015 and the Wave 2 ESCOs that began operations in January 2017. Although four of the 37 ESCOs dropped out of the model during the fourth PY, the total number of facilities participating continued to rise as the remaining ESCOs added new facilities, including the 80 facilities added in PY5. With the cumulative experience extended through PY5, this final report helps to confirm implications and conclusions from earlier analyses, which has implications for model sustainability, and differences between early and later adopters, which has implications for model generalizability. For instance, the success of early adopters (i.e., Wave 1 PY1), may be related to stronger motivations to join prior to MACRA and longer lead-in periods. Although the CEC Model is not directly continuing, these implications may inform subsequent models.
Nationally, 17% of dialysis facilities in the U.S. participated in the model by the end of PY5, and 13% of ESRD FFS beneficiaries were aligned to ESCOs. Participating facilities tended to be somewhat larger than non-participating facilities, and the markets served by ESCOs tended to be larger than those without an ESCO. However, the proportion of non-metropolitan facilities among those joining the model more recently was higher than among early joiners and was more similar to the national average.
CEC participating providers often cited alignment with CEC quality and cost outcomes as a motivation for participating. CEC attained an Advanced APM status under MACRA in 2017, which motivated nephrologists’ participation in the model in Wave 2 and may have ultimately contributed to differences in performance across waves. The growth in the number of participating facilities in Wave 2 outpaced the number of new owner nephrologists in Wave 2, so that beneficiary treatment by an owner nephrologist went down by the end of PY5. ESCO site visit participants viewed nephrologist engagement as one of the factors driving ESCO success, although engagement was not uniform. This may be due in part to the alignment of beneficiaries to ESCO facilities rather than treating nephrologists, who can be owners or non-owners.
With Wave 2 outcomes generally of smaller magnitude compared to Wave 1, it is not surprising that by PY4 some nephrology practices reported that they reduced their level of ownership interest in the ESCO and one non-LDO shifted to a one-sided risk arrangement.
The CEC Model experience showed promising results, with lower payments, improvements in some utilization measures, and no obvious indicators of unintended or adverse consequences. A challenge in the last year of this evaluation was the occurrence of the COVID-19 pandemic. Adjustments were made to try to remove the impact of COVID-19 on the evaluation results, particularly for hospitalization, in order to maintain the original goal of determining if the CEC Model improved value in managing ESRD. These outcomes, particularly those related to payment or utilization, were mostly driven by Wave 1 ESCOs. Declines of 1.3% were observed for total Part A and Part B Medicare payments, somewhat lower than reductions achieved in the earlier years of the model. However, the similar overall savings in this final report ($85 PBPM) vs. AR4 ($80 PBPM) suggested that the attainment of savings had stabilized rather than continuing to
Fifth Annual Report CEC Evaluation
97
decline. Payment reductions were most evident in Medicare Part A, with significant reductions in acute inpatient, readmissions, and institutional PAC. Reductions in utilization paralleled the payment reductions, with significant declines in hospitalizations and readmissions. Utilization reductions were also consistent with ESCOs’ reported efforts to avoid hospitalizations through risk stratification, care coordination, and improved adherence to dialysis treatments. ESCOs specifically described strategies to decrease missed dialysis treatments by improving communications with the ED and adding extended hours and standby dialysis slots (available chairs) to divert patients from the inpatient setting for conditions that could be addressed through dialysis. The number of dialysis treatments increased as did the likelihood that treatments were delivered as scheduled and that missed treatments were rescheduled, while payments and hospitalizations for ESRD complications declined, which provides further evidence of fewer missed treatments and potentially the scheduling of extra dialysis treatments (e.g., to address fluid overload). ESCOs also improved the quality of dialysis care, as seen in reductions in long-term catheter use, and improved some aspects of care beyond dialysis, as demonstrated in higher rates of use of preventive health services.
With the full five years of program data available, this final report adds new subgroup analyses to explore whether the CEC Model had differential effects on spending, utilization, and quality by race, sex, reason for Medicare eligibility, socioeconomic status (proxied by Medicaid status), and time on dialysis (more or less than 6 months). Although the subgroup results were often similar to the overall average effects, there were some measures with potentially meaningful differences between groups. In general, there was little evidence that the model impacts were worse for potentially disadvantaged groups, and for some measures the outcomes may even have been better.
This pattern of results is qualitatively similar to those reported in prior annual reports. Wave 1 ESCOs generally had improved performance in PY1 and PY2 with decreased Medicare Part A and B PBPM payments of $143-$182, relative to PY4 and PY5 where payments were only reduced by $112-$114. In contrast, Wave 2 ESCOs continued to have generally weaker results than Wave 1, reinforcing the conclusion drawn in AR4 that the overall impact of the CEC Model was driven by Wave 1 ESCOs. Finally, ESCOs in both waves continued to add dialysis facilities even in PY5. When comparing results between facilities that joined their ESCO in different years, it was clear that adding new facilities pulled down overall performance. As ESCOs expanded, the added facilities were less likely to be located within metropolitan areas, had fewer dialysis stations and were less likely to offer a late shift. Beneficiaries in these facilities may experience greater barriers to accessing all types of medical care which may hinder the ability of later joining facilities to reduce Medicare payments. These findings suggest that only the original facilities in the Wave 1 ESCOs were able to sustain reductions in payments.
As noted in prior reports, the conclusion that most results were driven by Wave 1 ESCOs may reflect several factors. Facility characteristics differed by wave. Facilities in Wave 1 ESCOs had higher Medicare payments and higher SHR and readmission rates prior to joining than non-CEC facilities. Conversely, those joining in Wave 2 had lower payments and lower SHR and readmission rates prior to joining than non-CEC facilities, and therefore might have had less room to improve on their pre-CEC performance. Additionally, nephrologists in Wave 1 ESCOs may have been more strongly motivated to join the CEC Model since they joined before it was deemed
Fifth Annual Report CEC Evaluation
98
an Advanced APM under MACRA. Finally, because of delays with the initial model start, Wave 1 ESCOs may have had more lead time to develop their strategies and capabilities.
The survival analyses, updated with an additional year of follow-up, continued to suggest that there is a survival benefit associated with the CEC Model. That benefit is modest overall and was slightly attenuated in the updated analyses but is larger for those patients aligned during their first year of dialysis. This finding suggests that the model may be more effective when it is able to affect the patient’s care at the crucial time near the transition to dialysis. When an ESCO starts, its aligned beneficiaries are likely to reflect its prevalent dialysis population, including many patients who have been on dialysis for multiple years and already have established patterns of care. In patient focus groups conducted throughout this evaluation, such “experienced” patients have often commented that the ESCO’s interventions, such as care coordination, could be particularly valuable to newer patients. As the model matured, a greater percentage of its beneficiaries would be likely to have been aligned near the onset of dialysis. We found little conclusive evidence that the effects on mortality differed significantly by wave. These findings were similar in magnitude to those reported in AR4. Other measured model effects, such as the increase in dialysis treatments and declines in hospitalizations overall and due to dialysis complications are potential mechanisms that might influence lower mortality.
Given the incentives for efficiency that are central to shared-savings models like the CEC Model and the vulnerable population served by CEC, it is important to monitor for unintended consequences. We found no evidence of adverse outcomes such as increased mortality, diversion of sicker patients away from the ESCO, or reduced transplant waitlist participation for CEC beneficiaries. Site visit participants reported that medication management continued to be a care redesign strategy and we found improvements in phosphate binder adherence and a corresponding increase in Part D costs.
This report also reflects the qualitative findings from site visits to Wave 1 and Wave 2 ESCOs that occurred during the first four program years. Overall, ESCOs refined the structures and care redesign strategies over time, emphasizing care coordination, the use of inter-disciplinary teams and increasing communication. Medication management continued to be a focus, especially post-discharge. Several ESCOs reported new informal partnerships with vascular surgeons and home health agencies in the later years. ESCOs continued to raise concerns regarding transparency and predictability of the model’s financial methodology and challenges in continuing to exceed benchmarks that become stricter over time. Along with the expected end of the Advanced APM waiver in 2024, participants considered these factors to be barriers to the scalability and sustainability of the model, although, a generalizability analysis was not conducted.
In 2022, the Kidney Care Choices (KCC) model will build on the CEC Model’s structure by adding incentives for health care providers to manage the care for Medicare beneficiaries with chronic kidney disease (CKD) stages 4 and 5 to delay the onset of dialysis and to incentivize use of home dialysis and pre-emptive kidney transplantation. By including beneficiaries with CKD stages 4 and 5, this model can both expand the potential impact by including more patients than were eligible for the CEC Model, and lower costs further if dialysis initiation can be delayed. Enhanced uptake of home dialysis could further augment cost savings relative to in-center hemodialysis. Financial incentives for kidney transplantation may help increase the number of patients waitlisted but may require nephrologists to take a lead in care coordination for

Fifth Annual Report CEC Evaluation
99
participating beneficiaries. Ultimately, based on the experience of CEC Wave 1 facilities and owner nephrologists, the KCC model presents achievable goals for motivated participants who want to champion patient care.
Findings presented in this report have several limitations. Because the 37 ESCOs may not be representative of the population of Medicare providers in some practice settings, our ability to generalize the results presented here are limited. However, the addition of new participants in PY2-PY5 increased the representation of markets participating in CEC, particularly those in non-metropolitan areas. Also, although the analysis employs matching methods to select an appropriate comparison group to infer counterfactual outcomes for the ESCOs, the characteristics we selected for matching and the specificity of the data may not adequately account for all differences between CEC and comparison facilities and their beneficiaries. Further, as new facilities and markets are added to ESCOs and other ACO programs continue to evolve, the construction of appropriate comparison groups becomes even more challenging (e.g., a facility that might have been in an earlier comparison group is now in the model). Additionally, the analyses in this report are risk-adjusted to account for differences in provider and market characteristics, as well as patient mix that is measurable with claims data. As with all regression models, it is possible that we did not control for all characteristics that may affect the outcomes such as the motivation to participate in a voluntary payment model.
This fifth evaluation report completes the evaluation of the model.
Fifth Annual Report – Appendices CEC Evaluation
100
Appendix A: CEC WaiversSection 1115A(d)(l) of the Social Security Act authorizes the Secretary of Health and Human Services to waive certain specified fraud and abuse laws as may be necessary solely for purposes of carrying out the testing by CMMI of certain innovative payment and service delivery models.91 Waivers in the CEC Model included:
¡ Patient engagement incentive. Patient engagement incentive waivers allow ESCOs to provide in-kind items or services to CEC beneficiaries when related to their medical care. These waivers include technology, ONS, and non-emergency transportation.
· Technology: Technology may be provided if the beneficiary does not possess or own similar technology and if the technology is considered “medically necessary” in that it will either (1) improve beneficiary-provider communication, health monitoring, or telehealth services, or (2) improve beneficiary adherence to medications, their plan of care, or their management of chronic conditions and diseases.
· ONS: ONS may be provided free or discounted to beneficiaries only when their serum albumin level falls below the designated target level.
· Non-emergency transportation: Non-emergency transportation can be provided for beneficiaries to access medically necessary care if they meet certain pre-set requirements.
¡ Performance-based payments to participant physicians (P4P). ESCOs can provide incentives to participant providers for conducting certain medically necessary procedures or providing care that leads to better outcomes for CEC beneficiaries. These payments are based on performance-based metrics and are conditional to accurate reporting on such metrics.
¡ Health information technology. Participating providers and facilities may receive a health IT waiver, but its usage must not be based upon referrals or other business generated between the participant and other parties. ESCOs must provide a consistent rationale for providing health IT based on a participant’s overall use, quality reporting standards and other performance-based metrics, and care coordination activities.
¡ Care coordination arrangements. Care coordination arrangement waivers include ESCO clinical support services (i.e., case managers, care coordinators, and clinical training), and other items or services to improve care coordination (i.e., administrative, quality management, and data services necessary to the delivery, documentation, and assessment of care coordination services).
¡ Remuneration furnished by the company/organization to the ESCO. Remuneration by the dialysis organization (DaVita, Fresenius, DCI, Rogosin, Atlantic, CDC, NKC) for ESCO support (including clinical support services, location and rounding accommodations, and other items or services to improve care coordination), ESCO health
91 Centers for Medicare & Medicaid Services. (2021, July 01). Fraud and abuse waivers for select CMS models and
programs. https://www.cms.gov/medicare/physician-self-referral/fraud-and-abuse-waivers
Fifth Annual Report – Appendices CEC Evaluation
101
IT, and patient engagement incentives can be provided to the ESCO as a whole, but not to individuals, participants, or entities.
¡ Telehealth waiver. A waiver of the originating site requirement for services provided via telehealth became effective October 1, 2018. This benefit enhancement allowed beneficiaries to receive qualified telehealth services in non-rural locations and locations not specified by statute, such as homes and dialysis facilities.92
Site visit participants reported reduced use of waivers of the course of the model. The transportation waiver was the most widely used, however, use decreased over time as facility staff began to favor providing transportation under SafeHarbor authority, rather than under the ESCO waiver.93 Additionally, some facilities found that the $500 per patient annual limit was not sufficient to meet the needs of patients who needed transportation assistance the most, and that the amount was too much for patients who needed transportation provided infrequently. Similarly, use of the nutrition waiver decreased over time, with some organizations never utilizing the waiver because they were already providing equivalent nutritional services and disliked the administrative burden, and Fresenius discontinuing by PY3 due to lack of evidence that the waiver changed outcomes and existence of other supplement options. The telehealth waiver was not widely used; some ESCOs had plans to leverage the waiver in PY3 for behavioral health but found there was little buy-in from behavioral health providers. Finally, the P4P waiver was used by Fresenius to promote improved transitions of care.
92 Centers for Medicare & Medicaid Services. (2018, June 27.) Medicare learning network. Comprehensive ESRD
Care (CEC) model telehealth – Implementation. https://www.cms.gov/Outreach-and-Education/Medicare-Learning-Network-MLN/MLNmattersArticles/downloads/MM10314.pdf
93 Department of Health and Human Services. (2017, December 7). Medicare and state health care programs:Fraud and abuse; Revisions to the Safe Harbors under the Anti-Kickback Statute and civil monetary penaltyrules regarding beneficiary inducements. Federal Register. Vol. 81, No. 235.https://www.gpo.gov/fdsys/pkg/FR-2016-12-07/pdf/2016-28297.pdf
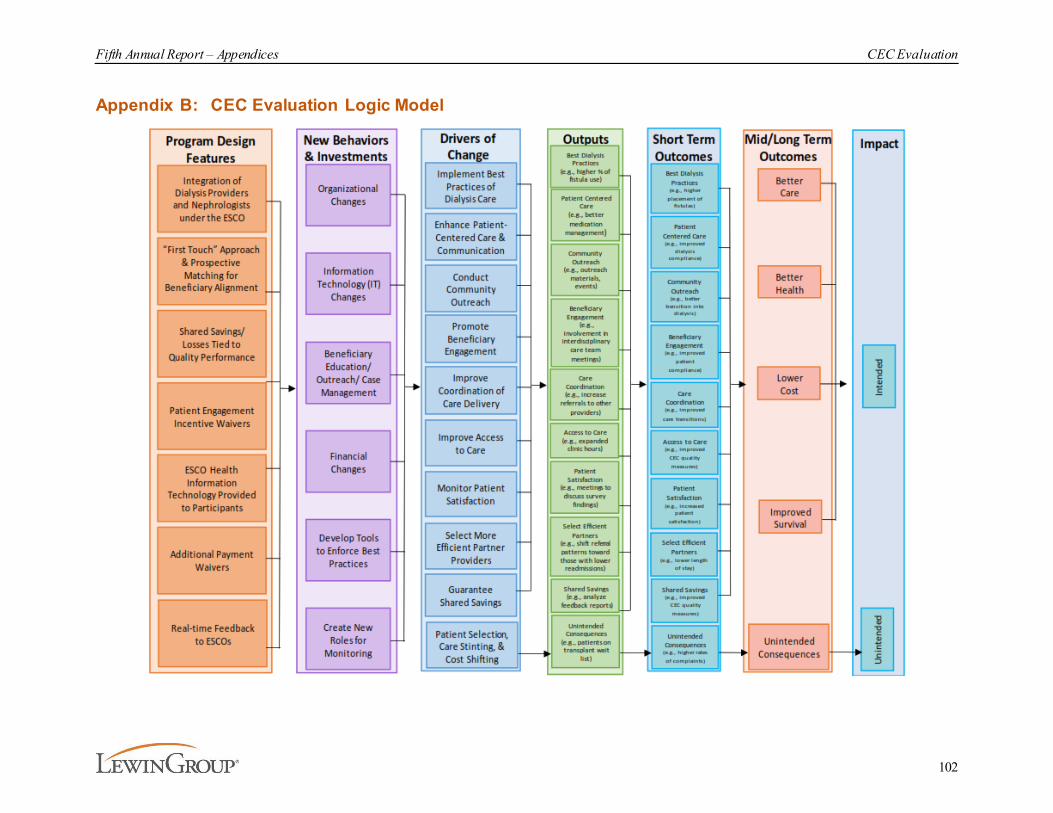
Fifth Annual Report – Appendices CEC Evaluation
102
Appendix B: CEC Evaluation Logic Model

Fifth Annual Report – Appendices CEC Evaluation
103
Appendix C: Site Visit MethodologyWe conducted evaluation site visits with both Wave 1 and Wave 2 ESCOs throughout the model, from 2016-2019. We visited ESCOs from all participating dialysis organizations during their first (initial site visit) and third years (follow-up site visit) in the model to learn about initial implementation and goals and subsequent changes and impacts of the model. Wave 1 ESCOs were visited in PY1 and PY3 and Wave 2 ESCOs were visited in PY2 and PY4. The site visit locations by year are shown in Exhibit C-1. In total, we visited 120 facilities and conducted 331 interviews.
Exhibit C-1. Site Visit Location and Schedule
Initial and follow-up site visits were conducted with all Wave 1 ESCOs and a sample of Wave 2 ESCOs based on geographic representation around the country. Follow-up site visits included ESCOs that received initial site visits and some that had not. Each ESCO site visit included interviews with dialysis facility and corporate representatives. In addition, we conducted phone calls and a survey of corporate and ESCO leaders before the site visits to aid in protocol development and scheduling. We also conducted one site visit at the Fresenius telephone-based CNU in 2018.
C.1. Facility Selection Criteria
We sampled two to four dialysis facilities from each selected ESCO. Facility selection was based on a variety of metrics. In the first round of interviews, facility selection was based on baseline facility characteristics including average Medicare payments PBPM, patient volume, and quality of patient care according to publicly reported standardized measures (e.g., SMR, SRR). In addition to these metrics, selection for follow-up visits also included criteria related to change over time, including change in total payments and quality metrics between baseline and the second year of participation, as well as facility and beneficiary characteristics. In the first round of site visits, facility selection focused on sampling facilities that exhibited 'typical'
Fifth Annual Report – Appendices CEC Evaluation
104
characteristics, while selection in follow-up site visits aimed to sample facilities that both increased and decreased Medicare costs over time.
C.2. Data Collection Procedures
ESCOs and dialysis organizations were asked to identify staff members involved in the facility operations, implementation of ESCO-related programs, the coordination of care within and beyond the dialysis facility, and ESCO co-owner physicians engaged in ESCO implementation and delivery of direct patient care to participate in interviews.94 ESCO dialysis facility visits included 45- to 75-minute interview sessions with physician leaders, facility operations staff, and case managers. Corporate site visits included 90-minute interview sessions with executive leaders and data, quality, and financial management staff. The visit with Fresenius's CNU in 2018 included 90-minute interviews with representatives from leadership and operations staff and case management staff. All interviews were audio-recorded and transcribed.
C.3. Protocol Development
We developed separate interview protocols for each round of interviews, initial and follow-up, and each type of respondent, as shown in Exhibit C-2. Separate protocols were used so that questions were framed appropriately for each interviewee type, to improve consistency in question delivery, and to facilitate comparison of interview findings across sites. The initial interviews focused on model implementation and goals, and follow-up interviews focused on changes since model implementation, impacts of the model, and respondents' thoughts on sustainability and scalability. Additionally, questions were added and removed over time based on model changes, qualitative and quantitative findings from previous years, and input from CMS. Protocols were approved by CMS before conducting the site visits.
94 Coordination of care activities included, but were not limited to, scheduling dialysis treatments, scheduling outpatient physician visits, arranging transportation, delivering patient education, conducting post-hospitalization follow-up, and other related services.
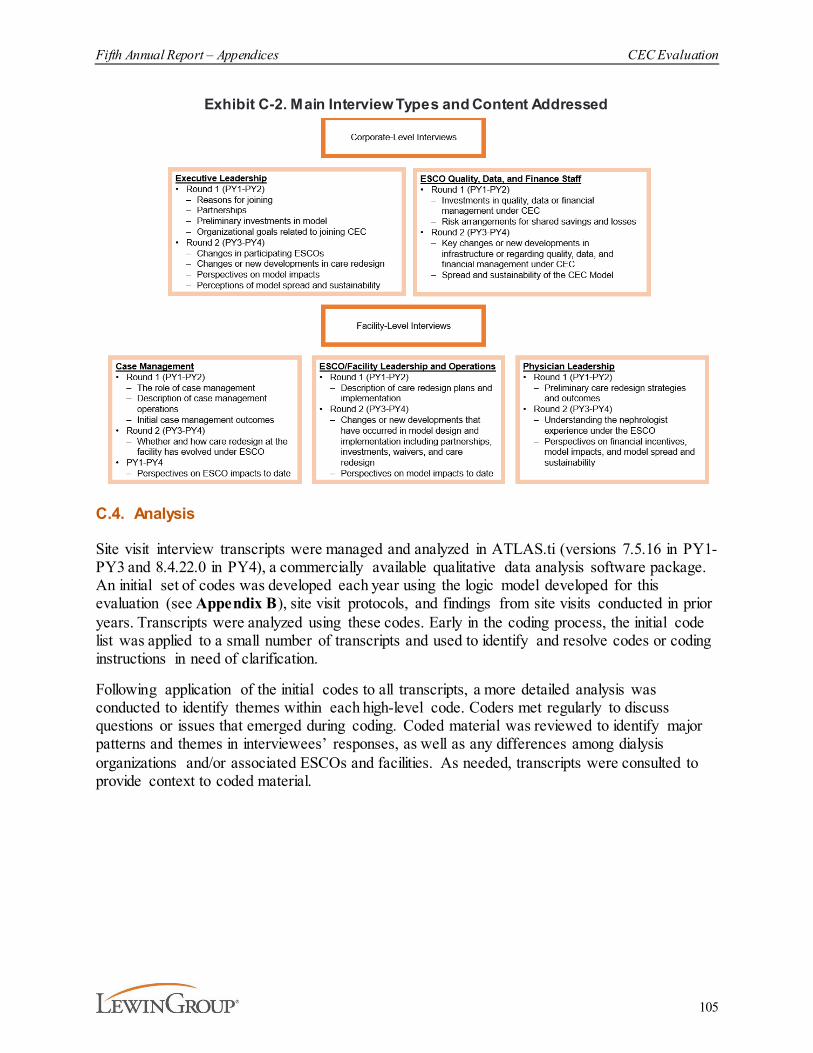
Fifth Annual Report – Appendices CEC Evaluation
105
Exhibit C-2. Main Interview Types and Content Addressed
C.4. Analysis
Site visit interview transcripts were managed and analyzed in ATLAS.ti (versions 7.5.16 in PY1-PY3 and 8.4.22.0 in PY4), a commercially available qualitative data analysis software package. An initial set of codes was developed each year using the logic model developed for this evaluation (see Appendix B), site visit protocols, and findings from site visits conducted in prior years. Transcripts were analyzed using these codes. Early in the coding process, the initial code list was applied to a small number of transcripts and used to identify and resolve codes or coding instructions in need of clarification.
Following application of the initial codes to all transcripts, a more detailed analysis was conducted to identify themes within each high-level code. Coders met regularly to discuss questions or issues that emerged during coding. Coded material was reviewed to identify major patterns and themes in interviewees’ responses, as well as any differences among dialysis organizations and/or associated ESCOs and facilities. As needed, transcripts were consulted to provide context to coded material.
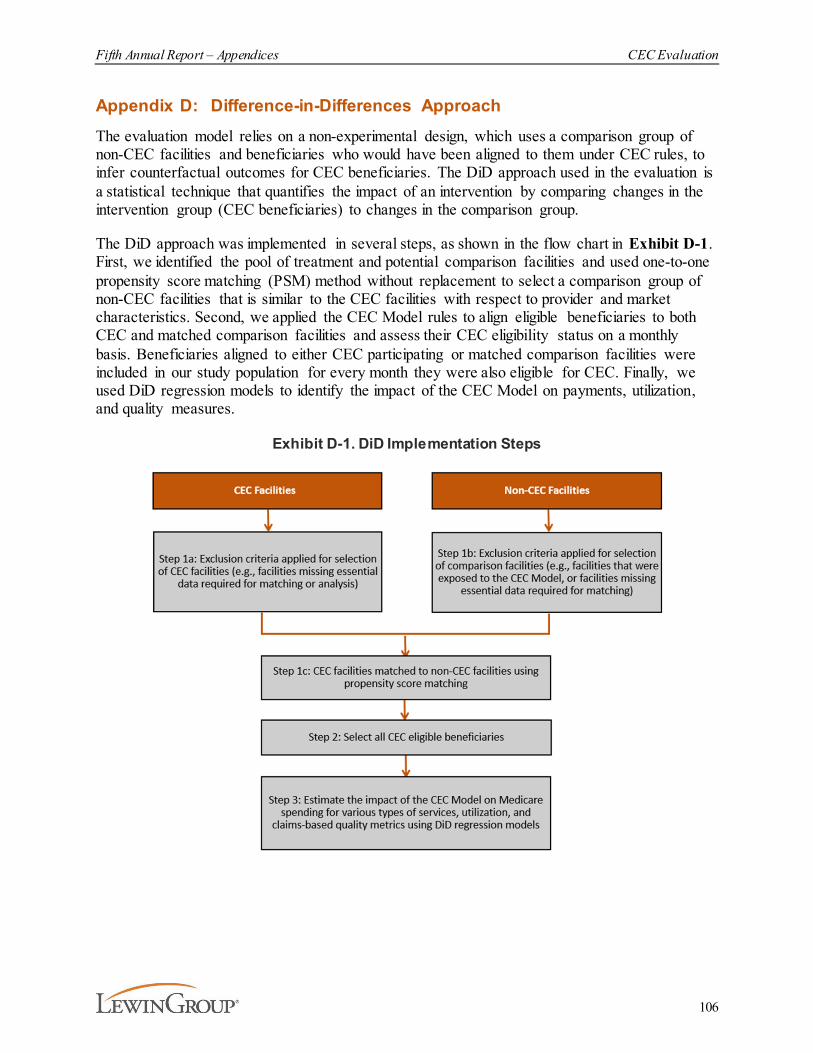
Fifth Annual Report – Appendices CEC Evaluation
106
Appendix D: Difference-in-Differences ApproachThe evaluation model relies on a non-experimental design, which uses a comparison group of non-CEC facilities and beneficiaries who would have been aligned to them under CEC rules, to infer counterfactual outcomes for CEC beneficiaries. The DiD approach used in the evaluation is a statistical technique that quantifies the impact of an intervention by comparing changes in the intervention group (CEC beneficiaries) to changes in the comparison group.
The DiD approach was implemented in several steps, as shown in the flow chart in Exhibit D-1. First, we identified the pool of treatment and potential comparison facilities and used one-to-one propensity score matching (PSM) method without replacement to select a comparison group of non-CEC facilities that is similar to the CEC facilities with respect to provider and market characteristics. Second, we applied the CEC Model rules to align eligible beneficiaries to both CEC and matched comparison facilities and assess their CEC eligibility status on a monthly basis. Beneficiaries aligned to either CEC participating or matched comparison facilities were included in our study population for every month they were also eligible for CEC. Finally, we used DiD regression models to identify the impact of the CEC Model on payments, utilization, and quality measures.
Exhibit D-1. DiD Implementation Steps
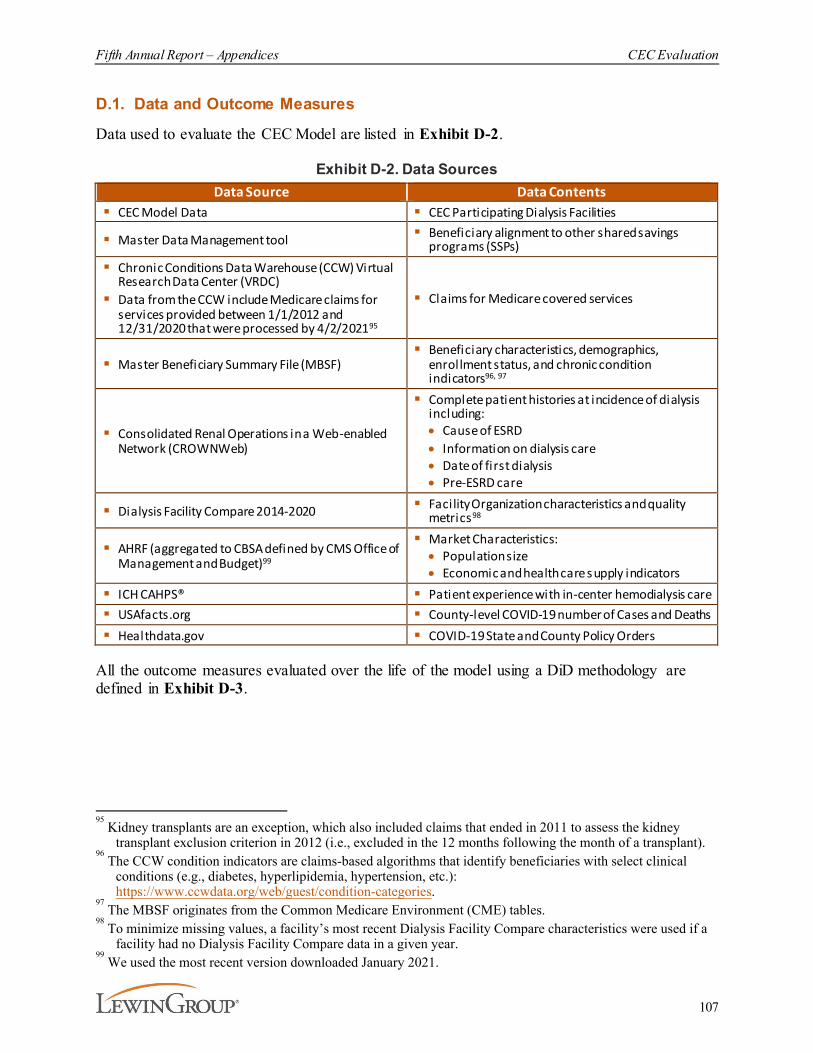
Fifth Annual Report – Appendices CEC Evaluation
107
D.1. Data and Outcome Measures
Data used to evaluate the CEC Model are listed in Exhibit D-2.
Exhibit D-2. Data SourcesData Source Data Contents
§ CEC Model Data § CEC Participating Dialysis Facilities
§ Master Data Management tool § Beneficiary alignment to other shared savingsprograms (SSPs)
§ Chronic Conditions Data Warehouse (CCW) VirtualResearch Data Center (VRDC)
§ Data from the CCW include Medicare claims forservices provided between 1/1/2012 and12/31/2020 that were processed by 4/2/202195
§ Claims for Medicare covered services
§ Master Beneficiary Summary File (MBSF)§ Beneficiary characteristics, demographics,
enrollment status, and chronic condition indicators96, 97
§ Consolidated Renal Operations in a Web-enabledNetwork (CROWNWeb)
§ Complete patient histories at incidence of dialysisincluding:· Cause of ESRD· Information on dialysis care· Date of first dialysis· Pre-ESRD care
§ Dialysis Facility Compare 2014-2020 § Facility Organization characteristics and qualitymetrics98
§ AHRF (aggregated to CBSA defined by CMS Office ofManagement and Budget)99
§ Market Characteristics:· Population size· Economic and health care supply indicators
§ ICH CAHPS® § Patient experience with in-center hemodialysis care§ USAfacts.org § County-level COVID-19 number of Cases and Deaths§ Healthdata.gov § COVID-19 State and County Policy Orders
All the outcome measures evaluated over the life of the model using a DiD methodology are defined in Exhibit D-3.
95 Kidney transplants are an exception, which also included claims that ended in 2011 to assess the kidney
transplant exclusion criterion in 2012 (i.e., excluded in the 12 months following the month of a transplant).96
The CCW condition indicators are claims-based algorithms that identify beneficiaries with select clinical conditions (e.g., diabetes, hyperlipidemia, hypertension, etc.): https://www.ccwdata.org/web/guest/condition-categories.
97 The MBSF originates from the Common Medicare Environment (CME) tables.
98 To minimize missing values, a facility’s most recent Dialysis Facility Compare characteristics were used if a
facility had no Dialysis Facility Compare data in a given year.99
We used the most recent version downloaded January 2021.

Fifth Annual Report – Appendices CEC Evaluation
108
Exhibit D-3. DiD Measure Outcomes and DefinitionsOutcome Definition of the Outcomes
Admissions for CHF
Monthly beneficiary flag indicating ACH admission(s) with a principal diagnosis for CHF. ACH admissions are defined by Part A claims with claim type 60 or 61 and the 3rd digit of the CMS Certification Number (CCN) was 0, or the 3rd/4th digit of the CCN was 13. This measure follows the Agency for Healthcare Research and Quality (AHRQ) specifications for Prevention Quality Indicator (PQI) 08. International Classification of Disease, 10th Revision (ICD-10) codes are based on PQI 08 v7.0 AHRQ specifications, and International Classification of Disease, 9th Revision (ICD-9) codes are based on v6.0 AHRQ specifications. This measure is restricted to beneficiaries who were identified with CHF and at least 18 years old. CHF was defined using the CCW CHF_END variable having a value of 1 or 3 (i .e., satisfied claims criteria to identify condition by the end of the CY. Admissions are assigned to the month on the claim thru date. See https://www.qualityindicators.ahrq.gov/Downloads/Modules/PQI/V70/TechSpecs/PQI_08_Heart_Failure_Admission_Rate.pdf
Admissions for Diabetes Complications
Monthly beneficiary flag indicating ACH admission(s) with a principal diagnosis for short-term or long-term diabetes complications. ACH admissions are defined by Part A claims with claim type 60 or 61 and the 3rd digit of the CCN was 0, or the 3rd/4th digit of the CCN was 13. This measure follows the AHRQ specifications for PQI 03 and PQI 01. ICD-10 codes are based on PQI 03 and PQI 01 v7.0 AHRQ specifications, and ICD-9 codes are based on v6.0 AHRQ specifications. This measure is restricted to beneficiaries who were identified with diabetes and at least 18 years old. Diabetes was defined using the CCW DIAB_END variable having a value of 1 or 3 (i.e., satisfied claims criteria to identify condition by the end of the CY). Admissions are assigned to the month on the claim thru date. See https://www.qualityindicators.ahrq.gov/Downloads/Modules/PQI/V70/TechSpecs/PQI_01_Diabetes_Short-term_Complications_Admission_Rate.pdf https://www.qualityindicators.ahrq.gov/Downloads/Modules/PQI/V70/TechSpecs/PQI_03_Diabetes_Long-term_Complications_Admission_Rate.pdf
AV Fistula Use ρMonthly beneficiary flag indicating a beneficiary used an AV fistula for vascular access. This outcome is restricted beneficiaries who had been 90 days or longer on dialysis and requires hemodialysis to be the most recent dialysis modality in the month.
Catheter Use ρMonthly beneficiary flag indicating a beneficiary had used catheter for 90 days or longer. This outcome is restricted to only hemodialysis beneficiaries with at least 90 days of hemodialysis.
Contraindicated Medications
Monthly beneficiary flag indicating a beneficiary was prescribed a medication that is contraindicated in patients with ESRD. The list of contraindicated medications includes: Narcotic Analgesics and Narcotic Antagonists (Meperidine, Propoxyphene), Antihypertensive and Cardiovascular Agents (Nitroprusside, Acetazolamide, Amiloride, Indapamide, Chlorothiazide, Chlorthalidone, Ethacrinic acid, Hydrochlorthiazide, Hydroflumethiazide, Polythiazide, Spironolactone, Thiazides, Triamterene, Mecamylamine, Phenoxybenzamine), Antimicrobial Agents (Methenamine mandelate, Nitrofurantoin, Nalidixic acid, Intravenous Itraconazole, Trimetrexate, Abacavir/Lamivudine, Cidofovir, Emtricitabine/Tenofovir, Lamivudine/Zidovudine, Ribavirin, Tenofovir, Valgancyclovir), Antineoplastic Agents (Carmustine, Topotecan), Medications for Arthritis and Gout (Penicillamine), Hypoglycemic Agents (Chlorpropamide, Gliclazide, Metformin), Hypolipidemic Agents (Bezafibrate, Clofibrate), Neuromuscular Agents (Gallamine, Pancuronium, Tubocurarine) Sedatives, Hypnotics and Other Drugs Used in Psychiatry (Ehtchlorvynol), and Miscellaneous Drugs (Acetohydroxamic acid, Cisapride, Clodronate, Desferoxamine, Anistreplase, Sulfinpyrazone, Tranexamic acid, Methsuximide, Quinine sulfate). This list was provided by nephrologists at the University of Michigan, who based their analysis on Drug Dosing in Renal Failure, Brier Michael E. and Aronoff, George R., eds., 5th Ed., American College of Physicians, 2007.
Dialysis Payments ρMonthly standardized payments for dialysis services included under Medicare Part B. Includes claim type 40 and bill type 72X (Part B Institutional dialysis) and claim types 71, 72 and first two digits of Berenson-Eggers Type of Services (BETOS)=P9 (Part B non-institutional dialysis).
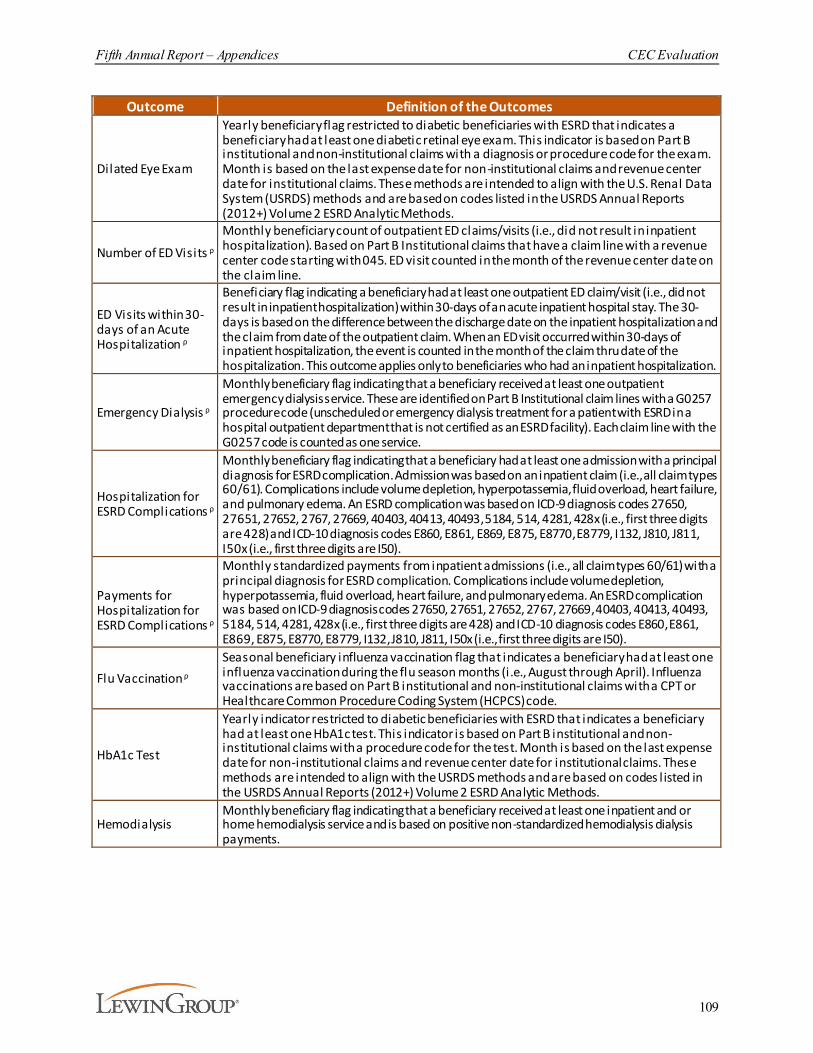
Fifth Annual Report – Appendices CEC Evaluation
109
Outcome Definition of the Outcomes
Dilated Eye Exam
Yearly beneficiary flag restricted to diabetic beneficiaries with ESRD that indicates a beneficiary had at least one diabetic retinal eye exam. This indicator is based on Part B institutional and non-institutional claims with a diagnosis or procedure code for the exam. Month is based on the last expense date for non-institutional claims and revenue center date for institutional claims. These methods are intended to align with the U.S. Renal Data System (USRDS) methods and are based on codes listed in the USRDS Annual Reports (2012+) Volume 2 ESRD Analytic Methods.
Number of ED Visits ρMonthly beneficiary count of outpatient ED claims/visits (i.e., did not result in inpatient hospitalization). Based on Part B Institutional claims that have a claim line with a revenue center code starting with 045. ED visit counted in the month of the revenue center date on the claim line.
ED Visits within 30-days of an Acute Hospitalization ρ
Beneficiary flag indicating a beneficiary had at least one outpatient ED claim/visit (i.e., did not result in inpatient hospitalization) within 30-days of an acute inpatient hospital stay. The 30-days is based on the difference between the discharge date on the inpatient hospitalization and the claim from date of the outpatient claim. When an ED visit occurred within 30-days of inpatient hospitalization, the event is counted in the month of the claim thru date of the hospitalization. This outcome applies only to beneficiaries who had an inpatient hospitalization.
Emergency Dialysis ρ
Monthly beneficiary flag indicating that a beneficiary received at least one outpatient emergency dialysis service. These are identified on Part B Institutional claim lines with a G0257 procedure code (unscheduled or emergency dialysis treatment for a patient with ESRD in a hospital outpatient department that is not certified as an ESRD facility). Each claim line with the G0257 code is counted as one service.
Hospitalization for ESRD Complications ρ
Monthly beneficiary flag indicating that a beneficiary had at least one admission with a principal diagnosis for ESRD complication. Admission was based on an inpatient claim (i.e., all claim types 60/61). Complications include volume depletion, hyperpotassemia, fluid overload, heart failure, and pulmonary edema. An ESRD complication was based on ICD-9 diagnosis codes 27650, 27651, 27652, 2767, 27669, 40403, 40413, 40493, 5184, 514, 4281, 428x (i.e., first three digits are 428) and ICD-10 diagnosis codes E860, E861, E869, E875, E8770, E8779, I132, J810, J811, I50x (i.e., first three digits are I50).
Payments for Hospitalization for ESRD Complications ρ
Monthly standardized payments from inpatient admissions (i.e., all claim types 60/61) with a principal diagnosis for ESRD complication. Complications include volume depletion, hyperpotassemia, fluid overload, heart failure, and pulmonary edema. An ESRD complication was based on ICD-9 diagnosis codes 27650, 27651, 27652, 2767, 27669, 40403, 40413, 40493, 5184, 514, 4281, 428x (i.e., first three digits are 428) and ICD-10 diagnosis codes E860, E861, E869, E875, E8770, E8779, I132, J810, J811, I50x (i.e., first three digits are I50).
Flu Vaccination ρSeasonal beneficiary influenza vaccination flag that indicates a beneficiary had at least one influenza vaccination during the flu season months (i.e., August through April). Influenza vaccinations are based on Part B institutional and non-institutional claims with a CPT or Healthcare Common Procedure Coding System (HCPCS) code.
HbA1c Test
Yearly indicator restricted to diabetic beneficiaries with ESRD that indicates a beneficiary had at least one HbA1c test. This indicator is based on Part B institutional and non-institutional claims with a procedure code for the test. Month is based on the last expense date for non-institutional claims and revenue center date for institutional claims. These methods are intended to align with the USRDS methods and are based on codes l isted in the USRDS Annual Reports (2012+) Volume 2 ESRD Analytic Methods.
HemodialysisMonthly beneficiary flag indicating that a beneficiary received at least one inpatient and or home hemodialysis service and is based on positive non-standardized hemodialysis dialysis payments.
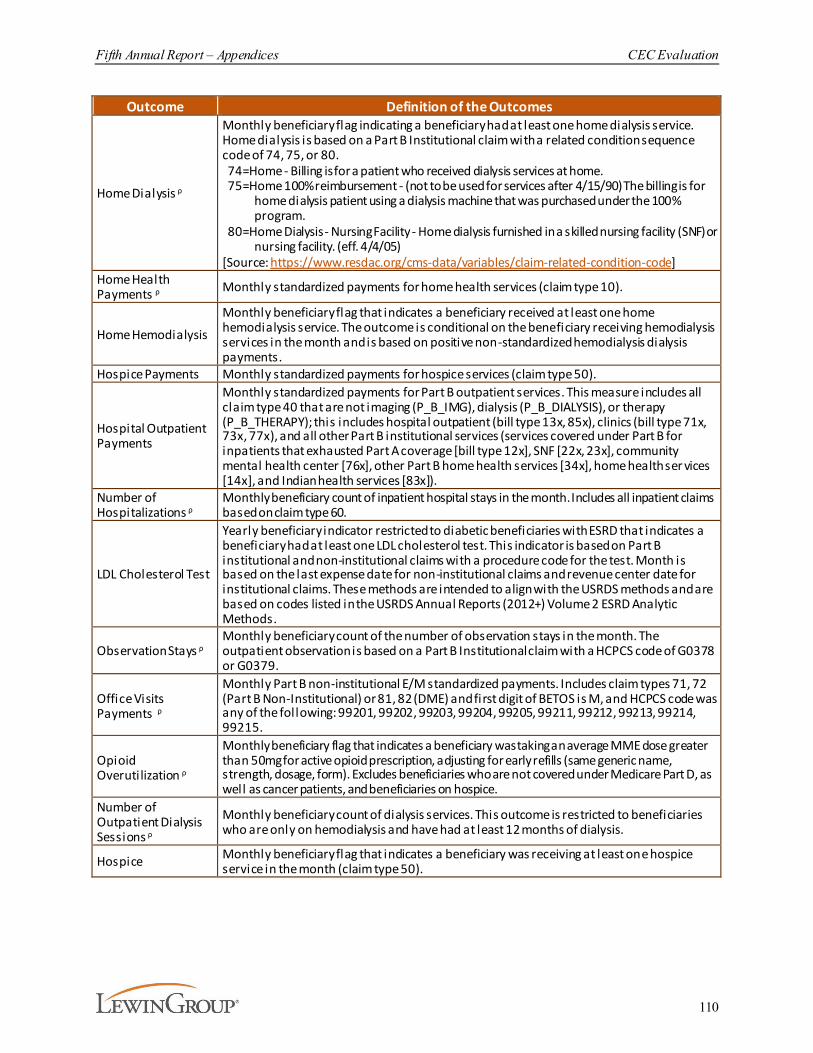
Fifth Annual Report – Appendices CEC Evaluation
110
Outcome Definition of the Outcomes
Home Dialysis ρ
Monthly beneficiary flag indicating a beneficiary had at least one home dialysis service. Home dialysis is based on a Part B Institutional claim with a related condition sequence code of 74, 75, or 80. 74=Home - Billing is for a patient who received dialysis services at home. 75=Home 100% reimbursement - (not to be used for services after 4/15/90) The billing is for
home dialysis patient using a dialysis machine that was purchased under the 100% program.
80=Home Dialysis - Nursing Facility - Home dialysis furnished in a skilled nursing facility (SNF) or nursing facility. (eff. 4/4/05)
[Source: https://www.resdac.org/cms-data/variables/claim-related-condition-code] Home Health Payments ρ Monthly standardized payments for home health services (claim type 10).
Home Hemodialysis
Monthly beneficiary flag that indicates a beneficiary received at least one home hemodialysis service. The outcome is conditional on the beneficiary receiving hemodialysis services in the month and is based on positive non-standardized hemodialysis dialysis payments.
Hospice Payments Monthly standardized payments for hospice services (claim type 50).
Hospital Outpatient Payments
Monthly standardized payments for Part B outpatient services. This measure includes all claim type 40 that are not imaging (P_B_IMG), dialysis (P_B_DIALYSIS), or therapy (P_B_THERAPY); this includes hospital outpatient (bill type 13x, 85x), clinics (bill type 71x, 73x, 77x), and all other Part B institutional services (services covered under Part B for inpatients that exhausted Part A coverage [bill type 12x], SNF [22x, 23x], community mental health center [76x], other Part B home health services [34x], home health ser vices [14x], and Indian health services [83x]).
Number of Hospitalizations ρ
Monthly beneficiary count of inpatient hospital stays in the month. Includes all inpatient claims based on claim type 60.
LDL Cholesterol Test
Yearly beneficiary indicator restricted to diabetic beneficiaries with ESRD that indicates a beneficiary had at least one LDL cholesterol test. This indicator is based on Part B institutional and non-institutional claims with a procedure code for the test. Month is based on the last expense date for non-institutional claims and revenue center date for institutional claims. These methods are intended to align with the USRDS methods and are based on codes listed in the USRDS Annual Reports (2012+) Volume 2 ESRD Analytic Methods.
Observation Stays ρMonthly beneficiary count of the number of observation stays in the month. The outpatient observation is based on a Part B Institutional claim with a HCPCS code of G0378 or G0379.
Office Visits Payments ρ
Monthly Part B non-institutional E/M standardized payments. Includes claim types 71, 72 (Part B Non-Institutional) or 81, 82 (DME) and first digit of BETOS is M, and HCPCS code was any of the following: 99201, 99202, 99203, 99204, 99205, 99211, 99212, 99213, 99214, 99215.
Opioid Overutilization ρ
Monthly beneficiary flag that indicates a beneficiary was taking an average MME dose greater than 50mg for active opioid prescription, adjusting for early refills (same generic name, strength, dosage, form). Excludes beneficiaries who are not covered under Medicare Part D, as well as cancer patients, and beneficiaries on hospice.
Number of Outpatient Dialysis Sessions ρ
Monthly beneficiary count of dialysis services. This outcome is restricted to beneficiaries who are only on hemodialysis and have had at least 12 months of dialysis.
Hospice Monthly beneficiary flag that indicates a beneficiary was receiving at least one hospice service in the month (claim type 50).
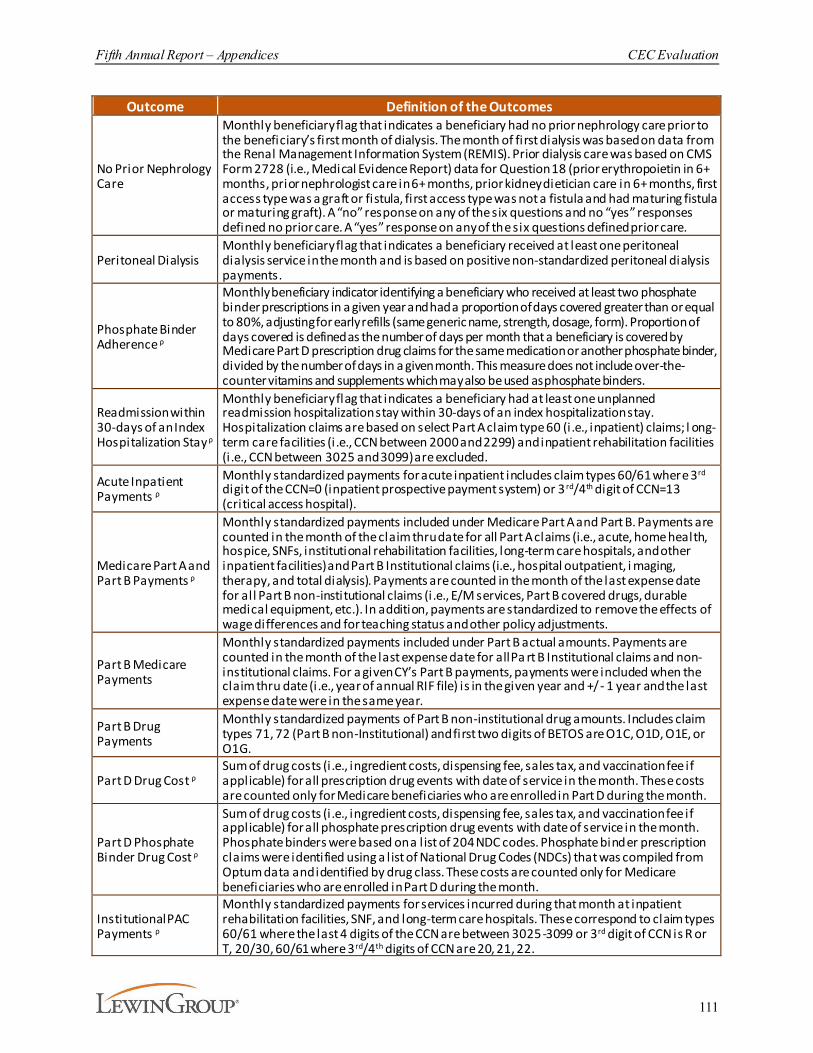
Fifth Annual Report – Appendices CEC Evaluation
111
Outcome Definition of the Outcomes
No Prior Nephrology Care
Monthly beneficiary flag that indicates a beneficiary had no prior nephrology care prior to the beneficiary’s first month of dialysis. The month of first dialysis was based on data from the Renal Management Information System (REMIS). Prior dialysis care was based on CMS Form 2728 (i.e., Medical Evidence Report) data for Question 18 (prior erythropoietin in 6+ months, prior nephrologist care in 6+ months, prior kidney dietician care in 6+ months, first access type was a graft or fistula, first access type was not a fistula and had maturing fistula or maturing graft). A “no” response on any of the six questions and no “yes” responses defined no prior care. A “yes” response on any of the six questions defined prior care.
Peritoneal DialysisMonthly beneficiary flag that indicates a beneficiary received at least one peritoneal dialysis service in the month and is based on positive non-standardized peritoneal dialysis payments.
Phosphate Binder Adherence ρ
Monthly beneficiary indicator identifying a beneficiary who received at least two phosphate binder prescriptions in a given year and had a proportion of days covered greater than or equal to 80%, adjusting for early refills (same generic name, strength, dosage, form). Proportion of days covered is defined as the number of days per month that a beneficiary is covered by Medicare Part D prescription drug claims for the same medication or another phosphate binder, divided by the number of days in a given month. This measure does not include over-the-counter vitamins and supplements which may also be used as phosphate binders.
Readmission within 30-days of an Index Hospitalization Stay ρ
Monthly beneficiary flag that indicates a beneficiary had at least one unplanned readmission hospitalization stay within 30-days of an index hospitalization stay. Hospitalization claims are based on select Part A claim type 60 (i.e., inpatient) claims; l ong-term care facilities (i .e., CCN between 2000 and 2299) and inpatient rehabilitation facilities (i .e., CCN between 3025 and 3099) are excluded.
Acute Inpatient Payments ρ
Monthly standardized payments for acute inpatient includes claim types 60/61 where 3rd digit of the CCN=0 (inpatient prospective payment system) or 3 rd/4th digit of CCN=13 (critical access hospital).
Medicare Part A and Part B Payments ρ
Monthly standardized payments included under Medicare Part A and Part B. Payments are counted in the month of the claim thru date for all Part A claims (i.e., acute, home health, hospice, SNFs, institutional rehabilitation facilities, long-term care hospitals, and other inpatient facilities) and Part B Institutional claims (i.e., hospital outpatient, i maging, therapy, and total dialysis). Payments are counted in the month of the last expense date for all Part B non-institutional claims (i.e., E/M services, Part B covered drugs, durable medical equipment, etc.). In addition, payments are standardized to remove the effects of wage differences and for teaching status and other policy adjustments.
Part B Medicare Payments
Monthly standardized payments included under Part B actual amounts. Payments are counted in the month of the last expense date for all Pa rt B Institutional claims and non-institutional claims. For a given CY’s Part B payments, payments were included when the claim thru date (i.e., year of annual RIF file) is in the given year and +/- 1 year and the last expense date were in the same year.
Part B Drug Payments
Monthly standardized payments of Part B non-institutional drug amounts. Includes claim types 71, 72 (Part B non-Institutional) and first two digits of BETOS are O1C, O1D, O1E, or O1G.
Part D Drug Cost ρSum of drug costs (i .e., ingredient costs, dispensing fee, sales tax, and vaccination fee if applicable) for all prescription drug events with date of service in the month. These costs are counted only for Medicare beneficiaries who are enrolled in Part D during the month.
Part D Phosphate Binder Drug Cost ρ
Sum of drug costs (i .e., ingredient costs, dispensing fee, sales tax, and vaccination fee if applicable) for all phosphate prescription drug events with date of service in the month. Phosphate binders were based on a l ist of 204 NDC codes. Phosphate binder prescription claims were identified using a l ist of National Drug Codes (NDCs) that was compiled from Optum data and identified by drug class. These costs are counted only for Medicare beneficiaries who are enrolled in Part D during the month.
Institutional PAC Payments ρ
Monthly standardized payments for services incurred during that month at inpatient rehabilitation facilities, SNF, and long-term care hospitals. These correspond to claim types 60/61 where the last 4 digits of the CCN are between 3025-3099 or 3rd digit of CCN is R or T, 20/30, 60/61 where 3rd/4th digits of CCN are 20, 21, 22.
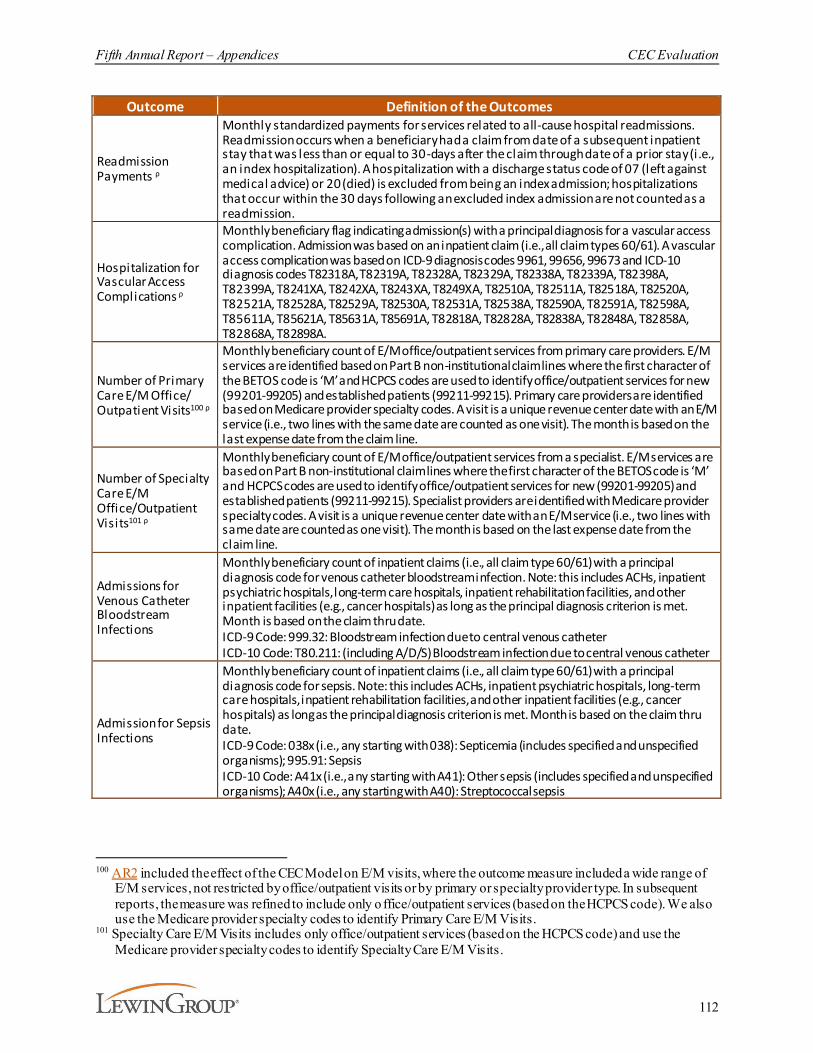
Fifth Annual Report – Appendices CEC Evaluation
112
Outcome Definition of the Outcomes
Readmission Payments ρ
Monthly standardized payments for services related to all-cause hospital readmissions. Readmission occurs when a beneficiary had a claim from date of a subsequent inpatient stay that was less than or equal to 30-days after the claim through date of a prior stay (i.e., an index hospitalization). A hospitalization with a discharge status code of 07 (left against medical advice) or 20 (died) is excluded from being an index admission; hospitalizations that occur within the 30 days following an excluded index admission are not counted as a readmission.
Hospitalization for Vascular Access Complications ρ
Monthly beneficiary flag indicating admission(s) with a principal diagnosis for a vascular access complication. Admission was based on an inpatient claim (i.e., all claim types 60/61). A vascular access complication was based on ICD-9 diagnosis codes 9961, 99656, 99673 and ICD-10 diagnosis codes T82318A, T82319A, T82328A, T82329A, T82338A, T82339A, T82398A, T82399A, T8241XA, T8242XA, T8243XA, T8249XA, T82510A, T82511A, T82518A, T82520A, T82521A, T82528A, T82529A, T82530A, T82531A, T82538A, T82590A, T82591A, T82598A, T85611A, T85621A, T85631A, T85691A, T82818A, T82828A, T82838A, T82848A, T82858A, T82868A, T82898A.
Number of Primary Care E/M Office/ Outpatient Visits100 ρ
Monthly beneficiary count of E/M office/outpatient services from primary care providers. E/M services are identified based on Part B non-institutional claim lines where the first character of the BETOS code is ‘M’ and HCPCS codes are used to identify office/outpatient services for new (99201-99205) and established patients (99211-99215). Primary care providers are identified based on Medicare provider specialty codes. A visit is a unique revenue center date with an E/M service (i.e., two lines with the same date are counted as one visit). The month is based on the last expense date from the claim line.
Number of Specialty Care E/M Office/Outpatient Visits101 ρ
Monthly beneficiary count of E/M office/outpatient services from a specialist. E/M services are based on Part B non-institutional claim lines where the first character of the BETOS code is ‘M’ and HCPCS codes are used to identify office/outpatient services for new (99201-99205) and established patients (99211-99215). Specialist providers are identified with Medicare provider specialty codes. A visit is a unique revenue center date with an E/M service (i.e., two lines with same date are counted as one visit). The month is based on the last expense date from the claim line.
Admissions for Venous Catheter Bloodstream Infections
Monthly beneficiary count of inpatient claims (i.e., all claim type 60/61) with a principal diagnosis code for venous catheter bloodstream infection. Note: this includes ACHs, inpatient psychiatric hospitals, long-term care hospitals, inpatient rehabilitation facilities, and other inpatient facilities (e.g., cancer hospitals) as long as the principal diagnosis criterion is met. Month is based on the claim thru date.ICD-9 Code: 999.32: Bloodstream infection due to central venous catheterICD-10 Code: T80.211: (including A/D/S) Bloodstream infection due to central venous catheter
Admission for Sepsis Infections
Monthly beneficiary count of inpatient claims (i.e., all claim type 60/61) with a principal diagnosis code for sepsis. Note: this includes ACHs, inpatient psychiatric hospitals, long-term care hospitals, inpatient rehabilitation facilities, and other inpatient facilities (e.g., cancer hospitals) as long as the principal diagnosis criterion is met. Month is based on the claim thru date.ICD-9 Code: 038x (i.e., any starting with 038): Septicemia (includes specified and unspecified organisms); 995.91: SepsisICD-10 Code: A41x (i.e., any starting with A41): Other sepsis (includes specified and unspecified organisms); A40x (i.e., any starting with A40): Streptococcal sepsis
100 AR2 included the effect of the CEC Model on E/M visits, where the outcome measure included a wide range of
E/M services, not restricted by office/outpatient visits or by primary or specialty provider type. In subsequent reports, the measure was refined to include only o ffice/outpatient services (based on the HCPCS code). We also use the Medicare provider specialty codes to identify Primary Care E/M Visits.
101 Specialty Care E/M Visits includes only office/outpatient services (based on the HCPCS code) and use the Medicare provider specialty codes to identify Specialty Care E/M Visits.
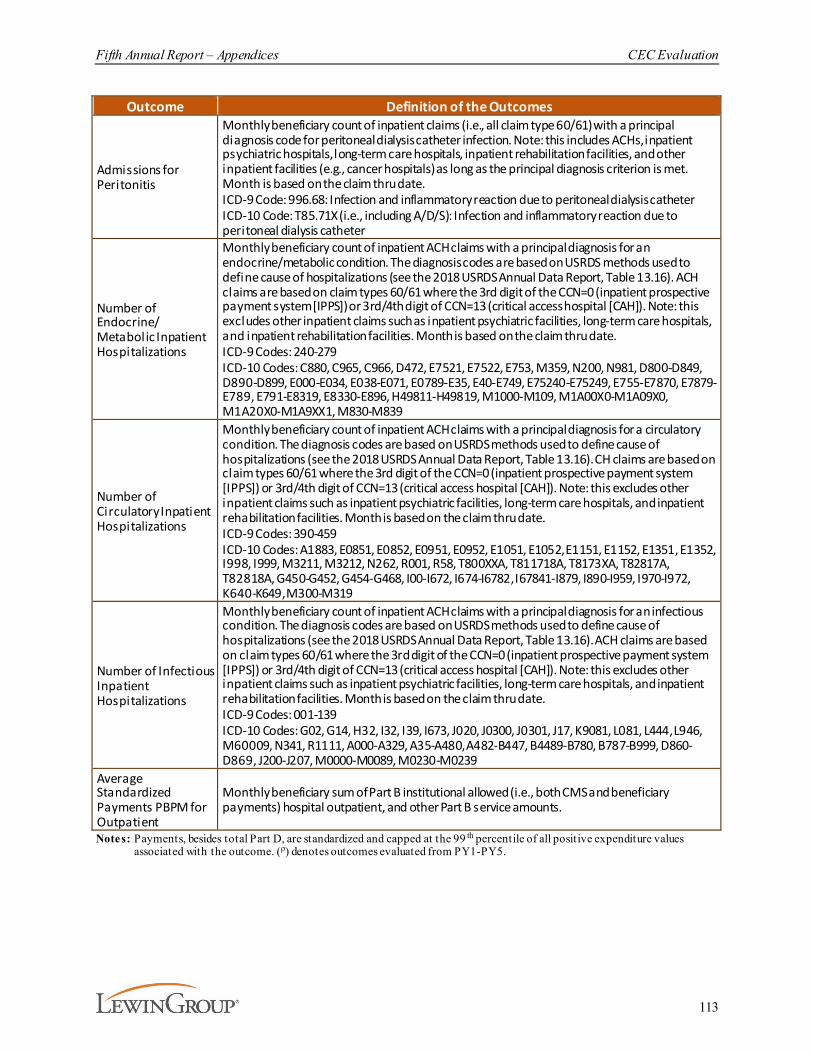
Fifth Annual Report – Appendices CEC Evaluation
113
Outcome Definition of the Outcomes
Admissions for Peritonitis
Monthly beneficiary count of inpatient claims (i.e., all claim type 60/61) with a principal diagnosis code for peritoneal dialysis catheter infection. Note: this includes ACHs, inpatient psychiatric hospitals, long-term care hospitals, inpatient rehabilitation facilities, and other inpatient facilities (e.g., cancer hospitals) as long as the principal diagnosis criterion is met. Month is based on the claim thru date.ICD-9 Code: 996.68: Infection and inflammatory reaction due to peritoneal dialysis catheterICD-10 Code: T85.71X (i.e., including A/D/S): Infection and inflammatory reaction due to peritoneal dialysis catheter
Number of Endocrine/ Metabolic Inpatient Hospitalizations
Monthly beneficiary count of inpatient ACH claims with a principal diagnosis for an endocrine/metabolic condition. The diagnosis codes are based on USRDS methods used to define cause of hospitalizations (see the 2018 USRDS Annual Data Report, Table 13.16). ACH claims are based on claim types 60/61 where the 3rd digit of the CCN=0 (inpatient prospective payment system [IPPS]) or 3rd/4th digit of CCN=13 (critical access hospital [CAH]). Note: this excludes other inpatient claims such as inpatient psychiatric facilities, long-term care hospitals, and inpatient rehabilitation facilities. Month is based on the claim thru date.ICD-9 Codes: 240-279ICD-10 Codes: C880, C965, C966, D472, E7521, E7522, E753, M359, N200, N981, D800-D849, D890-D899, E000-E034, E038-E071, E0789-E35, E40-E749, E75240-E75249, E755-E7870, E7879-E789, E791-E8319, E8330-E896, H49811-H49819, M1000-M109, M1A00X0-M1A09X0, M1A20X0-M1A9XX1, M830-M839
Number of Circulatory Inpatient Hospitalizations
Monthly beneficiary count of inpatient ACH claims with a principal diagnosis for a circulatory condition. The diagnosis codes are based on USRDS methods used to define cause of hospitalizations (see the 2018 USRDS Annual Data Report, Table 13.16). CH claims are based on claim types 60/61 where the 3rd digit of the CCN=0 (inpatient prospective payment system [IPPS]) or 3rd/4th digit of CCN=13 (critical access hospital [CAH]). Note: this excludes other inpatient claims such as inpatient psychiatric facilities, long-term care hospitals, and inpatient rehabilitation facilities. Month is based on the claim thru date.ICD-9 Codes: 390-459ICD-10 Codes: A1883, E0851, E0852, E0951, E0952, E1051, E1052, E1151, E1152, E1351, E1352, I998, I999, M3211, M3212, N262, R001, R58, T800XXA, T811718A, T8173XA, T82817A, T82818A, G450-G452, G454-G468, I00-I672, I674-I6782, I67841-I879, I890-I959, I970-I972, K640-K649, M300-M319
Number of Infectious Inpatient Hospitalizations
Monthly beneficiary count of inpatient ACH claims with a principal diagnosis for an infectious condition. The diagnosis codes are based on USRDS methods used to define cause of hospitalizations (see the 2018 USRDS Annual Data Report, Table 13.16). ACH claims are based on claim types 60/61 where the 3rd digit of the CCN=0 (inpatient prospective payment system [IPPS]) or 3rd/4th digit of CCN=13 (critical access hospital [CAH]). Note: this excludes other inpatient claims such as inpatient psychiatric facilities, long-term care hospitals, and inpatient rehabilitation facilities. Month is based on the claim thru date.ICD-9 Codes: 001-139ICD-10 Codes: G02, G14, H32, I32, I39, I673, J020, J0300, J0301, J17, K9081, L081, L444, L946, M60009, N341, R1111, A000-A329, A35-A480, A482-B447, B4489-B780, B787-B999, D860-D869, J200-J207, M0000-M0089, M0230-M0239
Average Standardized Payments PBPM for Outpatient
Monthly beneficiary sum of Part B institutional allowed (i.e., both CMS and beneficiary payments) hospital outpatient, and other Part B service amounts.
Notes: Payments, besides total Part D, are standardized and capped at the 99 th percentile of all positive expenditure values associated with the outcome. (ρ) denotes outcomes evaluated from PY1-PY5.
Fifth Annual Report – Appendices CEC Evaluation
114
D.2. Participant Characteristics
The characteristics of the facilities in our analytic sample are presented in Exhibit D-4. The set of participating facilities is varied in terms of historic characteristics. Throughout the course of the model, ESCOs expanded to include smaller facilities with higher average historical spending and hospitalizations. Additionally, these facilities varied in terms of the population served, as measured by average Hierarchical Condition Category (HCC) score, percent dual-status, no prior nephrology care, SHR, SRR, and SMR.

Fifth Annual Report – Appendices CEC Evaluation
115
Exhibit D-4. CEC and Comparison Population Average Characteristics
Characteristic
Wave 1 Wave 2PY1
Joiner (N=206)
PY2 Joiner (N=79)
PY3 Joiner (N=68)
PY4 Joiner (N=27)
PY5 Joiner (N=3)
PY2 Joiner
(N=347)
PY3 Joiner
(N=252)
PY4 Joiner (N=58)
PY5 Joiner (N=14)
Ownership Percent For Profit Facilities 87.9% 96.2% 97.1% 92.6% 100.0% 89.6% 93.3% 96.6% 35.7%
Quality & Cost
Average Total Part A and B Payments PBPM (2012-2014) $6,602 $6,635 $7,111 $7,226 $8,195 $6,392 $6,564 $6,616 $6,795
Average HCC Score102 (2014) 1.05 1.08 1.07 1.10 1.20 1.07 1.07 1.07 1.09Average Months on Dialysis (2014) 63.2 60.6 60.8 61.3 49.5 63.0 61.7 59.7 61.7Percent of Beneficiaries with an ED Visit in a Given Month (2014) 10.9% 10.4% 11.9% 12.1% 10.1% 11.2% 12.5% 13.4% 13.5%
Percent of Beneficiaries with a Hospitalization in a Given Month (2014) 11.5% 12.0% 12.5% 12.6% 14.3% 11.6% 12.2% 12.3% 13.1%
Percent of Beneficiaries with a Readmission in a Given Month (2014) 28.6% 28.1% 30.8% 29.1% 30.5% 28.2% 29.1% 27.9% 33.7%
Percent of Beneficiaries with a Catheter 9.3% 10.7% 9.2% 11.5% 13.7% 9.6% 9.4% 11.3% 10.4%Percent of Beneficiaries with Dual Medicare-Medicaid Status (2014) 47.0% 51.0% 51.0% 49.9% 41.0% 45.0% 47.9% 50.7% 45.4%
Percent of Beneficiaries with No Prior Nephrology Care 44.7% 52.8% 43.9% 45.0% 51.2% 43.3% 46.2% 43.9% 38.2%
SHR (2012-2014) 1.02 1.04 0.96 0.95 0.98 0.96 1.05 0.99 1.05SMR (2012-2014) 0.96 0.90 1.04 1.03 0.90 0.95 1.01 1.03 1.08SRR (2012-2014) 1.00 0.99 1.03 0.94 1.02 0.93 0.96 0.93 1.02
Capacity
Average Beneficiary Count 63.6 51.3 56.4 50.5 49.4 50.7 43.3 49.0 29.6Percent with a Late Shift 18.9% 20.3% 11.8% 7.4% 66.7% 26.5% 18.3% 19.0% 64.3%Number of Dialysis Stations 22.1 19.8 20.9 21.2 18.3 19.6 18.7 19.1 17.5Percent Hemodialysis 96.0% 95.9% 97.3% 97.9% 94.8% 95.8% 95.9% 95.8% 97.7%
Notes: Reported means and distributions are based on CEC facilit ies included in the analytic sample.Source:Lewin analysis of the 2014 Area Health Resource Files; Dialysis Facility Compare data from 2014; CEC Model participation data from Salesforce, extracted on
01/20/2021; and Medicare claims from 2012-2014.
102 We calculated the average HCC score at the facility-level for the CEC group using V21, an ESRD-specific version, of CMS HCC risk score model.
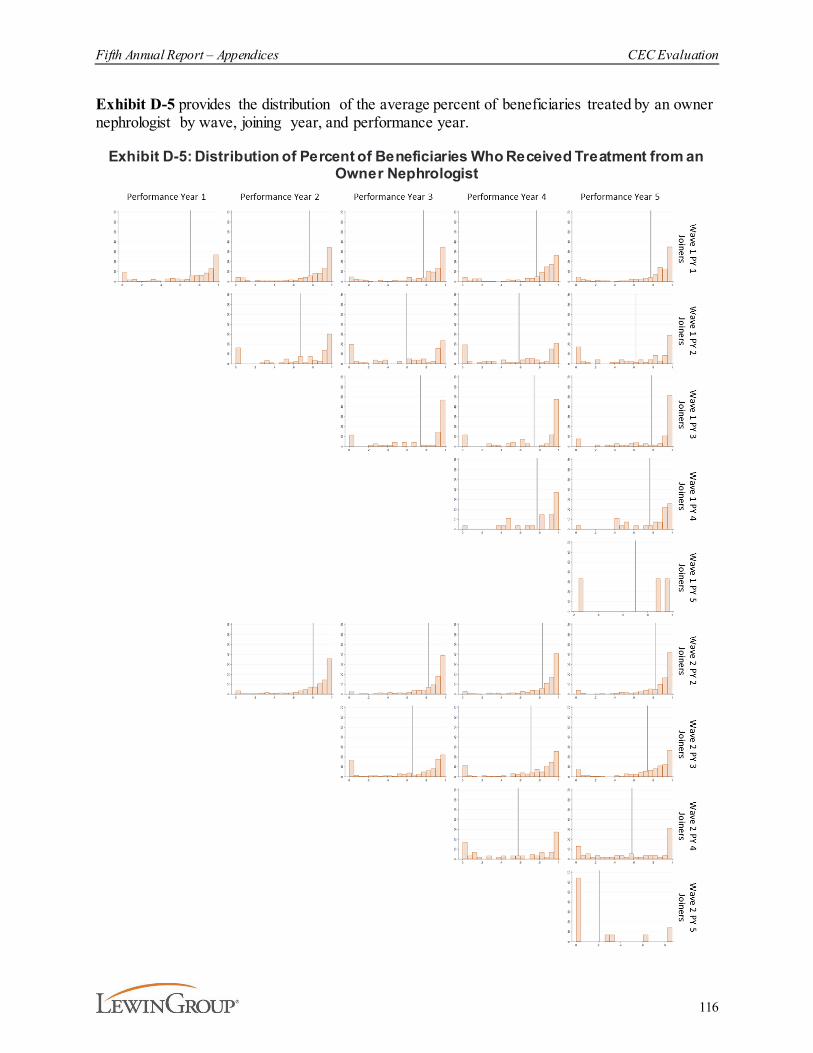
Fifth Annual Report – Appendices CEC Evaluation
116
Exhibit D-5 provides the distribution of the average percent of beneficiaries treated by an owner nephrologist by wave, joining year, and performance year.
Exhibit D-5: Distribution of Percent of Beneficiaries Who Received Treatment from an Owner Nephrologist
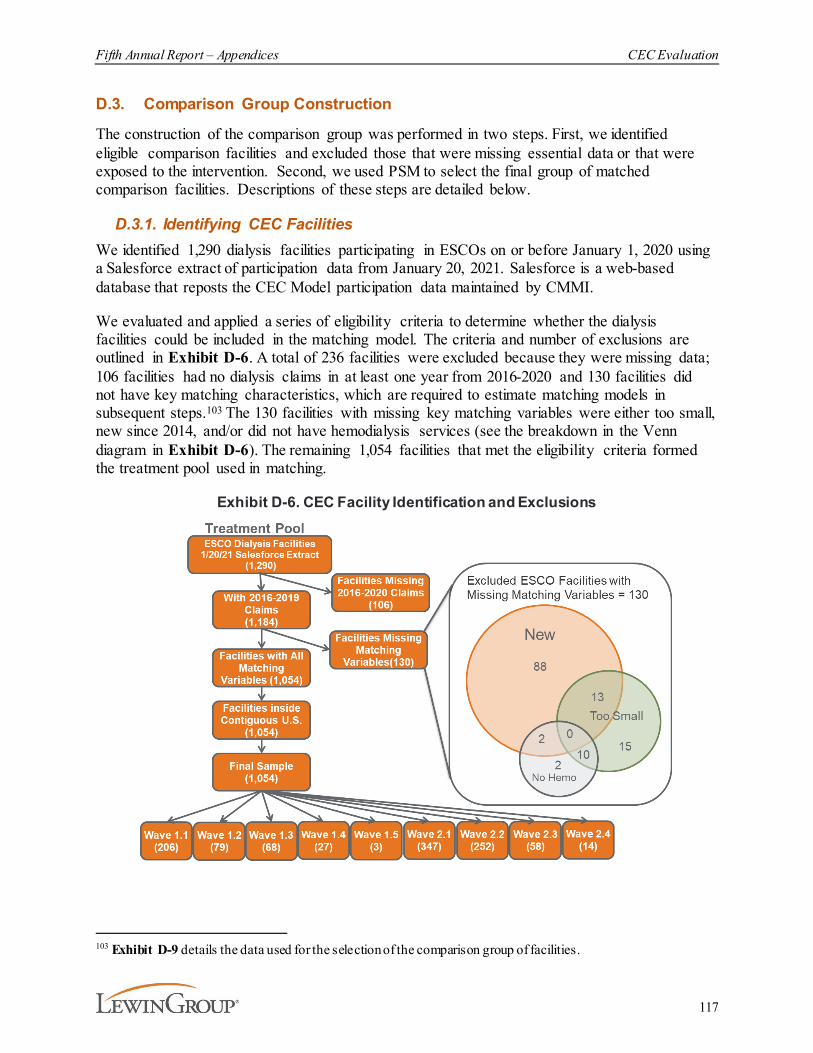
Fifth Annual Report – Appendices CEC Evaluation
117
D.3. Comparison Group Construction
The construction of the comparison group was performed in two steps. First, we identified eligible comparison facilities and excluded those that were missing essential data or that were exposed to the intervention. Second, we used PSM to select the final group of matched comparison facilities. Descriptions of these steps are detailed below.
D.3.1. Identifying CEC FacilitiesWe identified 1,290 dialysis facilities participating in ESCOs on or before January 1, 2020 using a Salesforce extract of participation data from January 20, 2021. Salesforce is a web-based database that reposts the CEC Model participation data maintained by CMMI.
We evaluated and applied a series of eligibility criteria to determine whether the dialysis facilities could be included in the matching model. The criteria and number of exclusions are outlined in Exhibit D-6. A total of 236 facilities were excluded because they were missing data; 106 facilities had no dialysis claims in at least one year from 2016-2020 and 130 facilities did not have key matching characteristics, which are required to estimate matching models in subsequent steps.103 The 130 facilities with missing key matching variables were either too small, new since 2014, and/or did not have hemodialysis services (see the breakdown in the Venn diagram in Exhibit D-6). The remaining 1,054 facilities that met the eligibility criteria formed the treatment pool used in matching.
Exhibit D-6. CEC Facility Identification and Exclusions
103 Exhibit D-9 details the data used for the selection of the comparison group of facilities.

Fifth Annual Report – Appendices CEC Evaluation
118
CEC facility exclusions were not associated with a single organization and were generally proportional to the number of CEC facilities within each organization (see Exhibit D-7). The 236 unmatched facilities were comparable to the 1,054 matched facilities included in the analysis (i.e., there were no meaningful differences in the market and facility-level characteristics for which data was available).
Exhibit D-7. Excluded Facilities by OrganizationOrganization Number of CEC Facilities Number of Excluded CEC FacilitiesDaVita 123 19DCI 87 11Fresenius 1,040 202CDC 7 0Atlantic 12 1NKC 18 3Rogosin 3 0
Total 1,290 236
D.3.2. Selecting Facilities Eligible to be Included in the Comparison Group PoolThe preliminary comparison pool consisted of 6,887 dialysis facilities after removal of the 1,290 dialysis facilities participating in CEC on or before January 1, 2020. We applied the same series of eligibility criteria to ensure the comparison facilities could be included in the matching model and would have had limited exposure to the CEC Model. The criteria and number of exclusions are outlined in Exhibit D-8.
Exhibit D-8. Comparison Facility Identification and Exclusions
Fifth Annual Report – Appendices CEC Evaluation
119
Several potential comparison facilities (N=1,679) were excluded from matching because they did not have claims in CY 2016-2020. Claims were not observed either because the facility changed ownership and CCN (the unit at which facilities are identified and associated with claims), the facility was no longer providing care to Medicare patients, or the facility was new to Medicare in 2017 or later.
Because ESCO facilities were not observed in Alaska, Hawaii, Puerto Rico, or U.S. Territories, 83 potential facilities in these areas were identified and excluded from the comparison pool. We examined the remaining potential comparison facilities for missing data relevant to the analysis and excluded 960 facilities that were missing important facility characteristics used in the matching process.104 The missing data were mainly for facilities without claims in 2014, facilities without hemodialysis, or other facilities that did not regularly perform dialysis (see the Venn diagram in Exhibit D-8).
To limit selection bias, we excluded dialysis facilities from the comparison group pool if an ESCO from their organization was operating in the same CBSA.105 This exclusion did not reduce the facilities that could potentially be included in the comparison group for AR5. The final comparison pool included 4,165 dialysis facilities.
D.3.3. Statistical Matching ApproachThe next step in developing the comparison group involved implementing matching methods to identify the set of facilities in the comparison pool that were representative of CEC facilities and their beneficiaries. For most CEC facilities that joined in PY1, PY2, PY3, and PY4, we kept the same matched comparison group facility as detailed in AR4. We preserved the matches for 1,025 out of the 1,037 CEC facilities included in the AR4 sample. However, we were unable to preserve the matches for 12 CEC facilities because their match did not have 2020 claims. We used PSM to match these five PY1 joiners, two PY2 joiners, four PY3 joiners, one PY4 joiner, and the 17 PY5 joiners.
We selected provider and market characteristics that were associated with CEC participation, and we then used matching methods to identify comparison facilities that had similar values in those characteristics. The data used to construct the characteristics for the selection of the comparison group of facilities are shown in Exhibit D-9.
104 Twenty facilities had an error code in the Dialysis Facility Compare data that indicates missing data for an
undisclosed or unknown reason. These facilities were excluded from the comparison pool and are included in the N=960.
105 Medicare CBSAs are Metropolitan CBSAs, with each CBSA Division separated, from the CMS Office of Management and Budget CBSA definition.
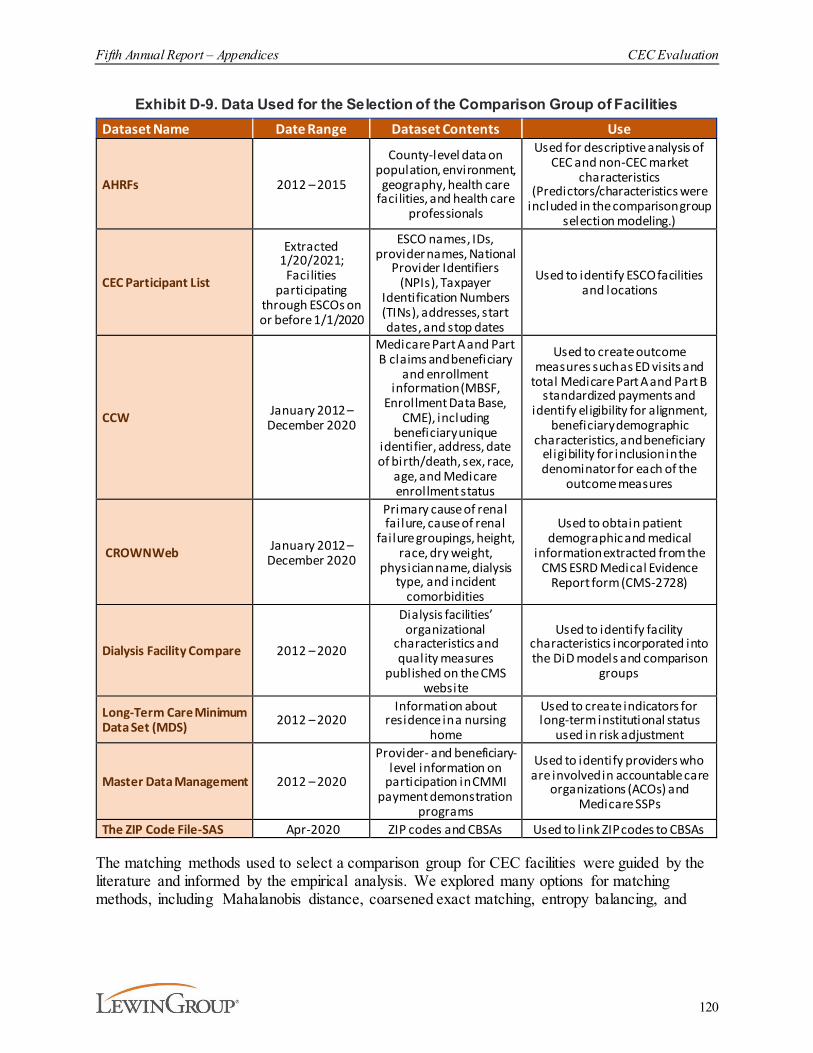
Fifth Annual Report – Appendices CEC Evaluation
120
Exhibit D-9. Data Used for the Selection of the Comparison Group of FacilitiesDataset Name Date Range Dataset Contents Use
AHRFs 2012 – 2015
County-level data on population, environment,
geography, health care facilities, and health care
professionals
Used for descriptive analysis of CEC and non-CEC market
characteristics (Predictors/characteristics were
included in the comparison group selection modeling.)
CEC Participant List
Extracted 1/20/2021;
Facilities participating
through ESCOs on or before 1/1/2020
ESCO names, IDs, provider names, National
Provider Identifiers (NPIs), Taxpayer
Identification Numbers (TINs), addresses, start dates, and stop dates
Used to identify ESCO facilities and locations
CCW January 2012 – December 2020
Medicare Part A and Part B claims and beneficiary
and enrollment information (MBSF,
Enrollment Data Base, CME), including
beneficiary unique identifier, address, date of birth/death, sex, race,
age, and Medicare enrollment status
Used to create outcome measures such as ED visits and
total Medicare Part A and Part B standardized payments and
identify eligibility for alignment, beneficiary demographic
characteristics, and beneficiary eligibility for inclusion in the denominator for each of the
outcome measures
CROWNWeb January 2012 – December 2020
Primary cause of renal failure, cause of renal
failure groupings, height, race, dry weight,
physician name, dialysis type, and incident
comorbidities
Used to obtain patient demographic and medical
information extracted from the CMS ESRD Medical Evidence
Report form (CMS-2728)
Dialysis Facility Compare 2012 – 2020
Dialysis facilities’ organizational
characteristics and quality measures
published on the CMS website
Used to identify facility characteristics incorporated into the DiD models and comparison
groups
Long-Term Care Minimum Data Set (MDS) 2012 – 2020
Information about residence in a nursing
home
Used to create indicators for long-term institutional status
used in risk adjustment
Master Data Management 2012 – 2020
Provider- and beneficiary-level information on
participation in CMMI payment demonstration
programs
Used to identify providers who are involved in accountable care
organizations (ACOs) and Medicare SSPs
The ZIP Code File-SAS Apr-2020 ZIP codes and CBSAs Used to l ink ZIP codes to CBSAs
The matching methods used to select a comparison group for CEC facilities were guided by the literature and informed by the empirical analysis. We explored many options for matching methods, including Mahalanobis distance, coarsened exact matching, entropy balancing, and
Fifth Annual Report – Appendices CEC Evaluation
121
PSM.106 Ultimately, we selected the PSM approach because it performed best according to multiple balance diagnostics. In the remainder of this section, each methodological consideration for PSM is discussed, including a description of the estimated model.
Matching method. The goal of matching both market- and facility-level characteristics led to the inclusion of many covariates in the matching model. The literature indicates that, when matching on many covariates, PSM leads to better balance than other matching techniques.107,108 In our testing, we also determined that a carefully selected PSM would yield strong diagnostic values. With these considerations and a series of model testing, we decided to proceed with PSM.
Propensity scores, defined as the probability of receiving treatment, conditional on a set of characteristics, are estimated using a logistic model. For the evaluation of the CEC Model, the key characteristics of interest in the logistic model were defined at the facility and market levels. For AR5, we continued to use the same propensity score model used in AR4. Using the coefficients from the logistic regression model, the propensity score for each facility was then constructed as the log odds of the predicted probability of participating in CEC. Each CEC participant facility was matched to a single facility in the comparison group that was the closest in terms of propensity score and not yet matched to another CEC participant facility.
Pooled vs. stratified models. The sizes of the treatment and comparison pools that enter the model are important determinants of the success of PSM. Stratifying models by organization yielded smaller treatment and control pools and generated weaker overall matches. However, given different practice patterns and cultures across organizations, it was necessary to use organization/organization type as a matching variable. This approach resulted in the construction of a pooled dataset for matching models that combined facilities across organization type and ownership (i.e., DaVita, Fresenius, and DCI).
In PY5, additional dialysis facilities joined the model through existing ESCOs: Wave 1 PY5 joiners (N=3) and Wave 2 PY5 joiners (N=14). To avoid a rare-event model, given the small number of new facilities and prior joiners which needed a new pairing (N=12), we estimated a single propensity score model that included all CEC facilities, matched comparison facilities retained from AR4, and potential comparison facilities for PY5 joiners.109 We then retained AR4 matches where possible and used the propensity scores to match the remaining treatment and potential comparison units. This model ignores unique selection bias apparent in each cohort but provides a more straightforward approach to estimating the overall impact of CEC.
Caliper selection. For distance matching models, calipers can be applied to limit the absolute distance in propensity scores between matches (i.e., if a neighbor is outside of the caliper, it is
106 Gu, X.S., Rosenbaum, P.R. (1993). Comparison of multivariate matching methods: Structures, distances, and
algorithms. Journal of Computational and Graphical Statistics, 2(4):405-420.107 Ibid108 Stuart, E.A. (2010). Matching methods for causal inference: A review and a look forward. Statistical science: a
review journal of the Institute of Mathematical Statistics, 25(1), 1-21.109 In prior comparison group construction, the PSM sample was limited to exclude retained matches from the prior
performance year’s report. This adjustment was necessary for AR5 given the low number of new joiners and facilities needing a new match.

Fifth Annual Report – Appendices CEC Evaluation
122
not considered a good match). There is no consensus regarding a standard caliper and many caliper widths have been used in literature.110 For propensity score modeling, many studies use a caliper that is proportional to the standard deviation of the predicted propensity score. After the propensity score model estimation, all newly matched participants could be matched to a unique neighbor that was closer than 0.08 standard deviations of the estimated propensity score.
Diagnostic tests. The final step in selecting the comparison group involved using the results from PSM to conduct a series of diagnostic tests for the matched comparison samples to assess whether facilities were similar on observed covariates. Diagnostics included defining the range of common support for the propensity score and for each covariate, evaluating standardized mean differences (SMDs) for all covariates, and examining covariate distributions in quantile-quantile (Q-Q) plots. Results of the diagnostic tests between the CEC facilities and comparison group are shown below in exhibits D-10 through D-12.
The PSM model we estimated achieved a lower average SMD than the average SMD before matching. The selected comparison group had mean values that were more similar to the CEC facilities than the entire group of non-CEC facilities and had tighter variation of characteristics. The average SMD was considerably smaller after matching, decreasing by 0.09 (see Exhibit D-10).
Exhibit D-10. Average SMD Before and After MatchingAverage SMD Before Matching Average SMD After Matching
0.19 0.10
The SMDs for characteristics used in matching are displayed in Exhibit D-11. They are generally small, although 12 matching characteristics are above 0.10. Focusing on these, the absolute mean differences are small.111 For example, the percent of the population over 65 years of age is 0.13 for the matched comparison group and 0.13 for the matched CEC facilities, but the SMD is -0.24.
110 Austin, P.C. (2011). An introduction to propensity score methods for reducing the effects of confounding in
observational studies. Multivariate Behavioral Research, 46(3), 399-424.111 Austin, P.C (2009) Balance diagnostics for comparing the distribution of baseline covariates between treatment
groups in propensity-score matched samples. Statistics in Medicine, 28(25), 3083-3107.
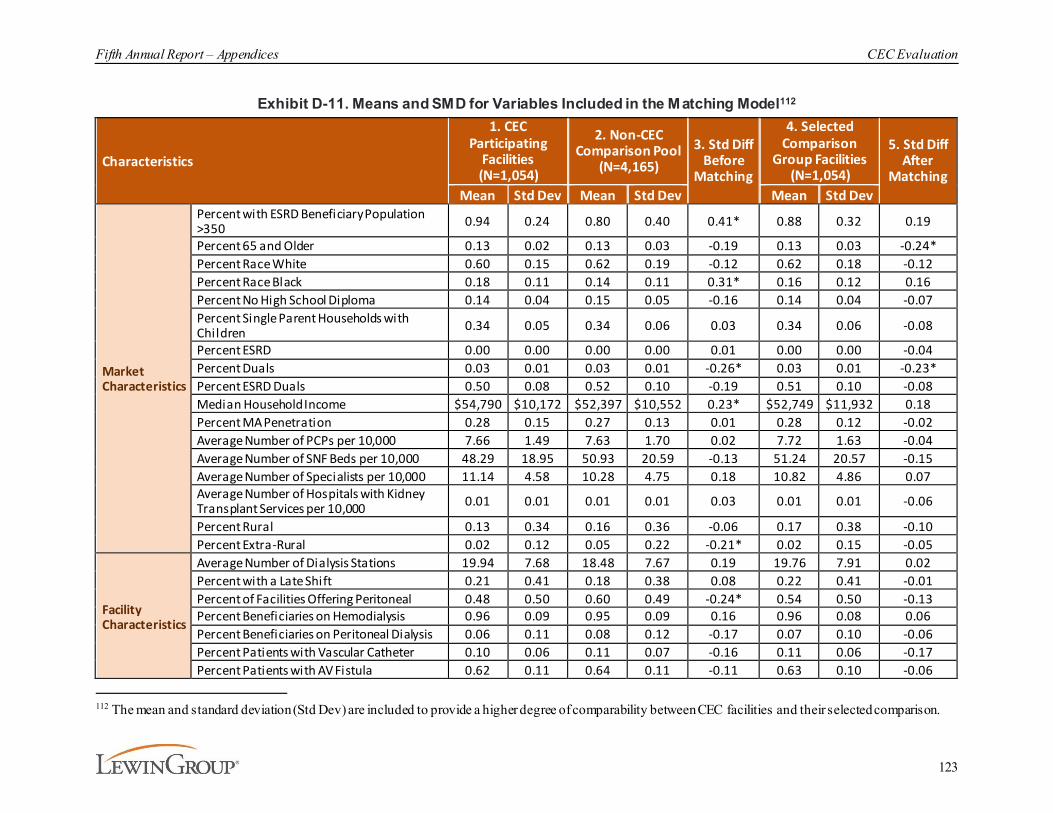
Fifth Annual Report – Appendices CEC Evaluation
123
Exhibit D-11. Means and SMD for Variables Included in the Matching Model112
Characteristics
1. CEC Participating
Facilities (N=1,054)
2. Non-CEC Comparison Pool
(N=4,165)3. Std Diff
Before Matching
4. Selected Comparison
Group Facilities (N=1,054)
5. Std Diff After
MatchingMean Std Dev Mean Std Dev Mean Std Dev
Market Characteristics
Percent with ESRD Beneficiary Population >350 0.94 0.24 0.80 0.40 0.41* 0.88 0.32 0.19
Percent 65 and Older 0.13 0.02 0.13 0.03 -0.19 0.13 0.03 -0.24*Percent Race White 0.60 0.15 0.62 0.19 -0.12 0.62 0.18 -0.12Percent Race Black 0.18 0.11 0.14 0.11 0.31* 0.16 0.12 0.16Percent No High School Diploma 0.14 0.04 0.15 0.05 -0.16 0.14 0.04 -0.07Percent Single Parent Households with Children 0.34 0.05 0.34 0.06 0.03 0.34 0.06 -0.08
Percent ESRD 0.00 0.00 0.00 0.00 0.01 0.00 0.00 -0.04Percent Duals 0.03 0.01 0.03 0.01 -0.26* 0.03 0.01 -0.23*Percent ESRD Duals 0.50 0.08 0.52 0.10 -0.19 0.51 0.10 -0.08Median Household Income $54,790 $10,172 $52,397 $10,552 0.23* $52,749 $11,932 0.18Percent MA Penetration 0.28 0.15 0.27 0.13 0.01 0.28 0.12 -0.02Average Number of PCPs per 10,000 7.66 1.49 7.63 1.70 0.02 7.72 1.63 -0.04Average Number of SNF Beds per 10,000 48.29 18.95 50.93 20.59 -0.13 51.24 20.57 -0.15Average Number of Specialists per 10,000 11.14 4.58 10.28 4.75 0.18 10.82 4.86 0.07Average Number of Hospitals with Kidney Transplant Services per 10,000 0.01 0.01 0.01 0.01 0.03 0.01 0.01 -0.06
Percent Rural 0.13 0.34 0.16 0.36 -0.06 0.17 0.38 -0.10Percent Extra-Rural 0.02 0.12 0.05 0.22 -0.21* 0.02 0.15 -0.05
Facility Characteristics
Average Number of Dialysis Stations 19.94 7.68 18.48 7.67 0.19 19.76 7.91 0.02Percent with a Late Shift 0.21 0.41 0.18 0.38 0.08 0.22 0.41 -0.01Percent of Facilities Offering Peritoneal 0.48 0.50 0.60 0.49 -0.24* 0.54 0.50 -0.13Percent Beneficiaries on Hemodialysis 0.96 0.09 0.95 0.09 0.16 0.96 0.08 0.06Percent Beneficiaries on Peritoneal Dialysis 0.06 0.11 0.08 0.12 -0.17 0.07 0.10 -0.06Percent Patients with Vascular Catheter 0.10 0.06 0.11 0.07 -0.16 0.11 0.06 -0.17Percent Patients with AV Fistula 0.62 0.11 0.64 0.11 -0.11 0.63 0.10 -0.06
112 The mean and standard deviation (Std Dev) are included to provide a higher degree of comparability between CEC facilities and their selected comparison.
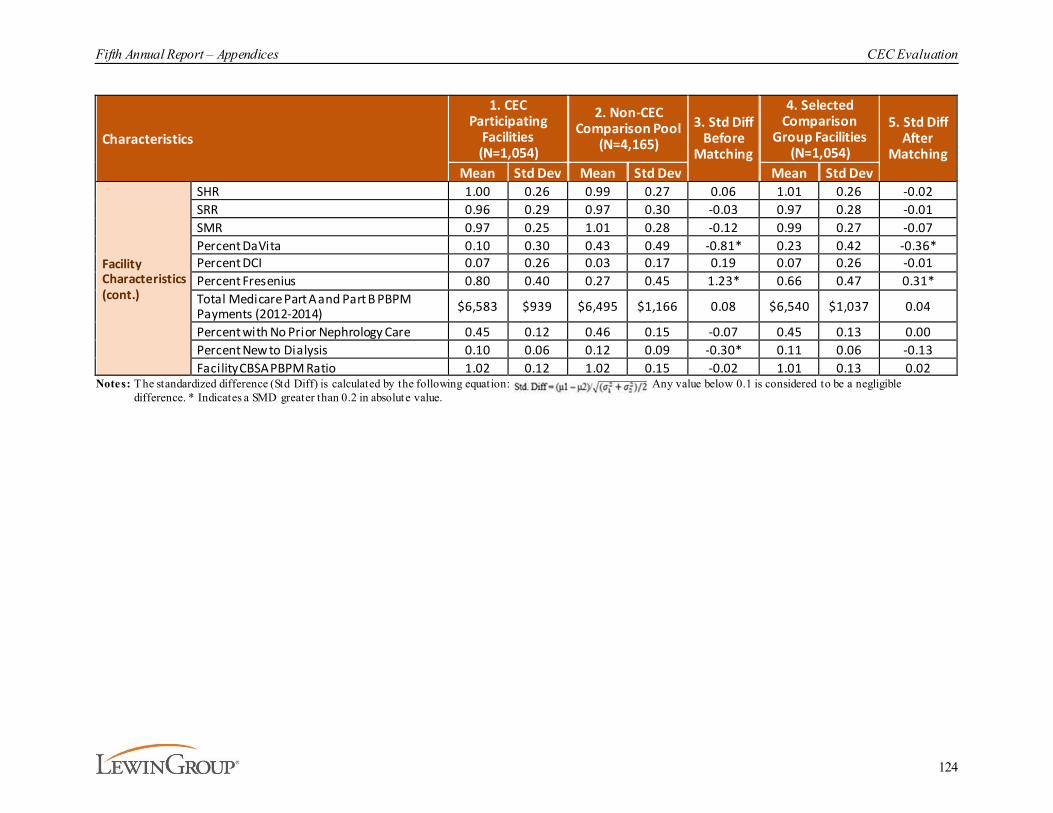
Fifth Annual Report – Appendices CEC Evaluation
124
Characteristics
1. CEC Participating
Facilities (N=1,054)
2. Non-CEC Comparison Pool
(N=4,165)3. Std Diff
Before Matching
4. Selected Comparison
Group Facilities (N=1,054)
5. Std Diff After
MatchingMean Std Dev Mean Std Dev Mean Std Dev
Facility Characteristics(cont.)
SHR 1.00 0.26 0.99 0.27 0.06 1.01 0.26 -0.02SRR 0.96 0.29 0.97 0.30 -0.03 0.97 0.28 -0.01SMR 0.97 0.25 1.01 0.28 -0.12 0.99 0.27 -0.07Percent DaVita 0.10 0.30 0.43 0.49 -0.81* 0.23 0.42 -0.36*Percent DCI 0.07 0.26 0.03 0.17 0.19 0.07 0.26 -0.01Percent Fresenius 0.80 0.40 0.27 0.45 1.23* 0.66 0.47 0.31*Total Medicare Part A and Part B PBPM Payments (2012-2014) $6,583 $939 $6,495 $1,166 0.08 $6,540 $1,037 0.04
Percent with No Prior Nephrology Care 0.45 0.12 0.46 0.15 -0.07 0.45 0.13 0.00Percent New to Dialysis 0.10 0.06 0.12 0.09 -0.30* 0.11 0.06 -0.13Facility CBSA PBPM Ratio 1.02 0.12 1.02 0.15 -0.02 1.01 0.13 0.02
Notes: The standardized difference (Std Diff) is calculated by the following equation: . Any value below 0.1 is considered to be a negligible difference. * Indicates a SMD greater than 0.2 in absolute value.
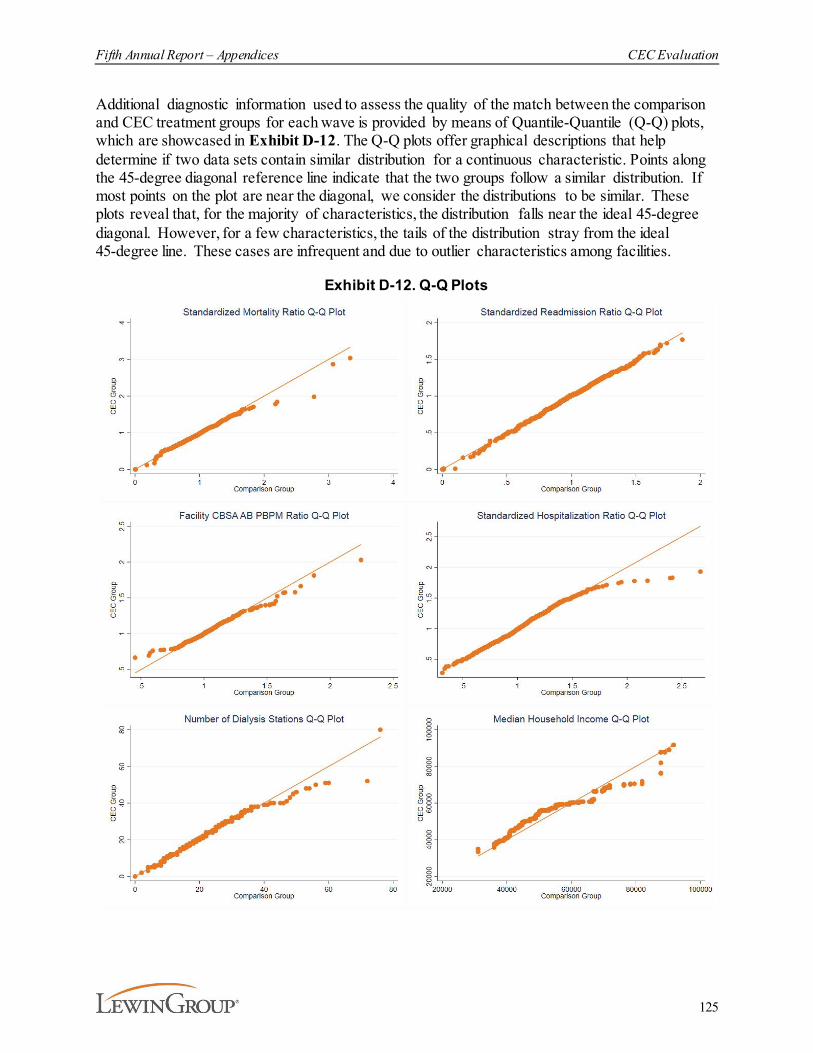
Fifth Annual Report – Appendices CEC Evaluation
125
Additional diagnostic information used to assess the quality of the match between the comparison and CEC treatment groups for each wave is provided by means of Quantile-Quantile (Q-Q) plots, which are showcased in Exhibit D-12. The Q-Q plots offer graphical descriptions that help determine if two data sets contain similar distribution for a continuous characteristic. Points along the 45-degree diagonal reference line indicate that the two groups follow a similar distribution. If most points on the plot are near the diagonal, we consider the distributions to be similar. These plots reveal that, for the majority of characteristics, the distribution falls near the ideal 45-degree diagonal. However, for a few characteristics, the tails of the distribution stray from the ideal 45-degree line. These cases are infrequent and due to outlier characteristics among facilities.
Exhibit D-12. Q-Q Plots
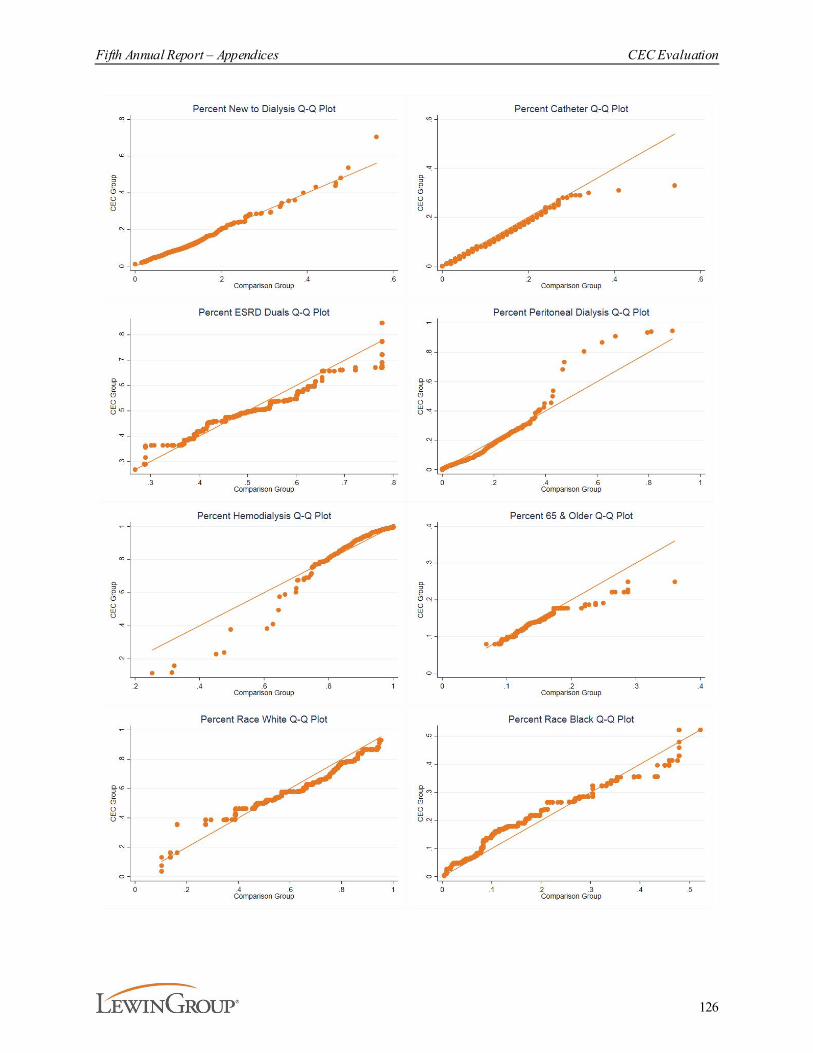
Fifth Annual Report – Appendices CEC Evaluation
126

Fifth Annual Report – Appendices CEC Evaluation
127
D.3.4. Comparison Group Changes between the Fourth Annual Report and the Fifth Annual Report
The comparison group described in AR5 changed from the comparison group used in AR4 to accommodate the growth in CEC facilities over time. The number of CEC facilities that had participated in the model was 216 in PY1, 685 by PY2, 1,066 by PY3, 1,210 by PY4, and 1,290 by PY5. For most CEC facilities that joined in PY1, PY2, PY3, or PY4 we kept the same matched comparison group in AR5. Matches for 1,025 out of 1,037 CEC facilities included in AR4 were preserved. However, we were unable to preserve the matched comparison facilities without 2020 claims (N=12). We used the PSM model described above to match these 12 facilities and the 17 PY5 joiners.
D.4. Beneficiary Alignment and Eligibility
To identify comparison beneficiaries for inclusion in this analysis, we simulated alignment based on the CEC Model rules. We started by applying the CEC Model eligibility criteria (see Exhibit D-13) to construct monthly eligibility indicators, which required data from the CME, the Master Data Management database, and the CCW. Then we combined the monthly eligibility indicators with ESRD dialysis facility (Type of Bill 72X) claims to align eligible beneficiaries to ESCOs and comparison group facilities using a two-step approach.
Step one . Each month starting in January 2012, CEC eligible beneficiaries were aligned to an ESCO if the “first touch” dialysis service belonged to an ESCO and the beneficiary satisfied the eligibility criteria in that month. The first touch dialysis service is defined as the earliest dialysis service based on the claim thru date provided on the dialysis facility claims.
Fifth Annual Report – Appendices CEC Evaluation
128
Beneficiaries were prospectively aligned through December 2020.113 Beneficiaries could subsequently become unaligned in the second step of the alignment process (reconciliation) if they no longer meet the criteria to be aligned. The first step was repeated every month through December 2020 to align new beneficiaries who had their first touch dialysis after January 2012; each monthly alignment was run among beneficiaries not currently aligned. Beneficiaries were also aligned to a comparison group facility if the first touch provider was in a facility in the matched comparison group.114
Step two. We simulated the CEC Model reconciliation process by which beneficiaries were de-aligned from their ESCO due to death, kidney transplant,115 the 50% CBSA rule, a second CBSA rule (effective in PY3 and onward), alignment to another SSP, and/or no longer receiving treatment at an ESCO (see Exhibit D-14).116 We applied annual de-alignments after each CY using claims processed through April 2, 2020. Beneficiaries who were de-aligned could be realigned to any ESCO or facility in the comparison group at a later time if they met the eligibility criteria at the time of first touch.
The CEC Model rules were updated to exclude COVID-19 inpatient episodes, which start the month the beneficiary is admitted for a COVID-19 diagnosis and end at the end of the month after the discharge date, in PY5.117 For the AR5 analysis, COVID-19 inpatient episodes are removed from the CEC and comparison group of the DiD analytic sample to mitigate bias from differential prevalence of COVID-19 hospitalization between CEC and the comparison group, and for consistency with the CEC Model financial methodology. A sensitivity approach, which keeps COVID-19 inpatient episodes in the data for both the ESCO and comparison group, was also implemented for impact estimates of total Medicare Part A and Part B Payments.
113 We simulate alignment of beneficiaries prior to the start of the CEC Model. This provides information on
beneficiaries who would have been aligned—based on identical methods—during this earlier period and allows us to assess changes in ESCOs from before and after CEC implementation.
114 It was possible for the first step to result in an ESCO alignment and comparison facility alignment at the same time. We subsequently applied rules to prevent such overlaps. To main tain ESCO prioritization, an ESCO alignment was retained and the comparison facility alignment was disregarded in any month a beneficiary was aligned to an ESCO. In addition, to minimize any potential contamination effect from ESCOs, any comparison facility alignment was disregarded in any month or within 12 months after a beneficiary was treated or aligned to an ESCO facility.
115 In annual reports prior to AR4, we identified kidney transplants based on two MS-DRG codes: 008, i.e., simultaneous kidney and pancreas transplant and 652, i.e., kidney transplant. For AR4 and AR5, we added ICD-9 and ICD-10 procedure codes to identify kidney transplants throughout the study period. The ICD-10 procedure codes used to identify transplants were 0TY00Z0-0TY00Z2, and 0TY10Z0 -0TY10Z2. For transplants before October 1, 2015, when ICD-10 procedure codes were first implemented, the ICD-9 procedure code 55.69 was used instead.
116 The simulated reconciliation was applied to CYs 2012 through 2020. We apply the simulated reconciliation to these previous years to ensure consistency with the program methods (e.g., remove a beneficiary from alignment if they received less than 50% of their dialysis services in the aligned facility’s market in that year).
117 See https://www.cms.gov/files/document/covid-innovation-model-flexibilities.pdf for CMS defined model modifications.
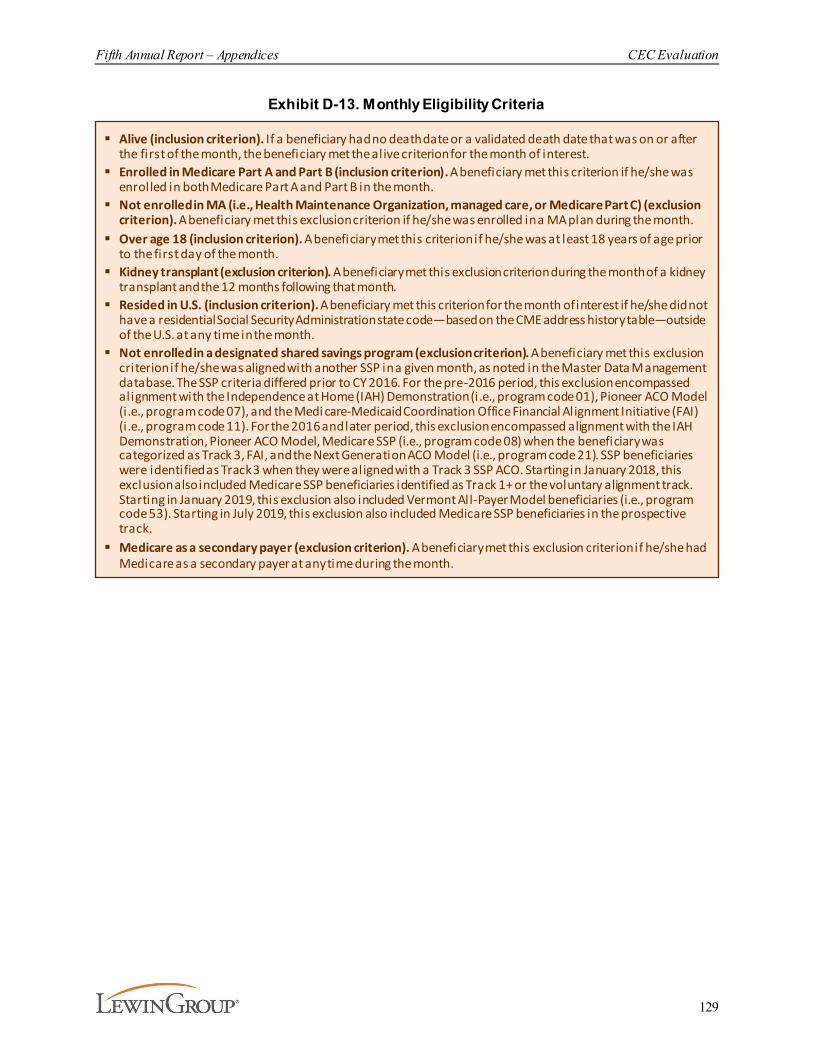
Fifth Annual Report – Appendices CEC Evaluation
129
Exhibit D-13. Monthly Eligibility Criteria
§ Alive (inclusion criterion). If a beneficiary had no death date or a validated death date that was on or after the first of the month, the beneficiary met the alive criterion for the month of interest.
§ Enrolled in Medicare Part A and Part B (inclusion criterion). A beneficiary met this criterion if he/she was enrolled in both Medicare Part A and Part B in the month.
§ Not enrolled in MA (i.e., Health Maintenance Organization, managed care, or Medicare Part C) (exclusion criterion). A beneficiary met this exclusion criterion if he/she was enrolled in a MA plan during the month.
§ Over age 18 (inclusion criterion). A beneficiary met this criterion if he/she was at least 18 years of age prior to the first day of the month.
§ Kidney transplant (exclusion criterion). A beneficiary met this exclusion criterion during the month of a kidney transplant and the 12 months following that month.
§ Resided in U.S. (inclusion criterion). A beneficiary met this criterion for the month of interest if he/she did not have a residential Social Security Administration state code—based on the CME address history table—outside of the U.S. at any time in the month.
§ Not enrolled in a designated shared savings program (exclusion criterion). A beneficiary met this exclusion criterion if he/she was aligned with another SSP in a given month, as noted in the Master Data Management database. The SSP criteria differed prior to CY 2016. For the pre-2016 period, this exclusion encompassed alignment with the Independence at Home (IAH) Demonstration (i.e., program code 01), Pioneer ACO Model (i .e., program code 07), and the Medi care-Medicaid Coordination Office Financial Alignment Initiative (FAI) (i .e., program code 11). For the 2016 and later period, this exclusion encompassed alignment with the IAH Demonstration, Pioneer ACO Model, Medicare SSP (i.e., program code 08) when the beneficiary was categorized as Track 3, FAI, and the Next Generation ACO Model (i.e., program code 21). SSP beneficiaries were identified as Track 3 when they were aligned with a Track 3 SSP ACO. Starting in January 2018, this exclusion also included Medicare SSP beneficiaries identified as Track 1+ or the voluntary alignment track. Starting in January 2019, this exclusion also included Vermont All-Payer Model beneficiaries (i.e., program code 53). Starting in July 2019, this exclusion also included Medicare SSP beneficiaries in the prospective track.
§ Medicare as a secondary payer (exclusion criterion). A beneficiary met this exclusion criterion if he/she had Medicare as a secondary payer at any time during the month.
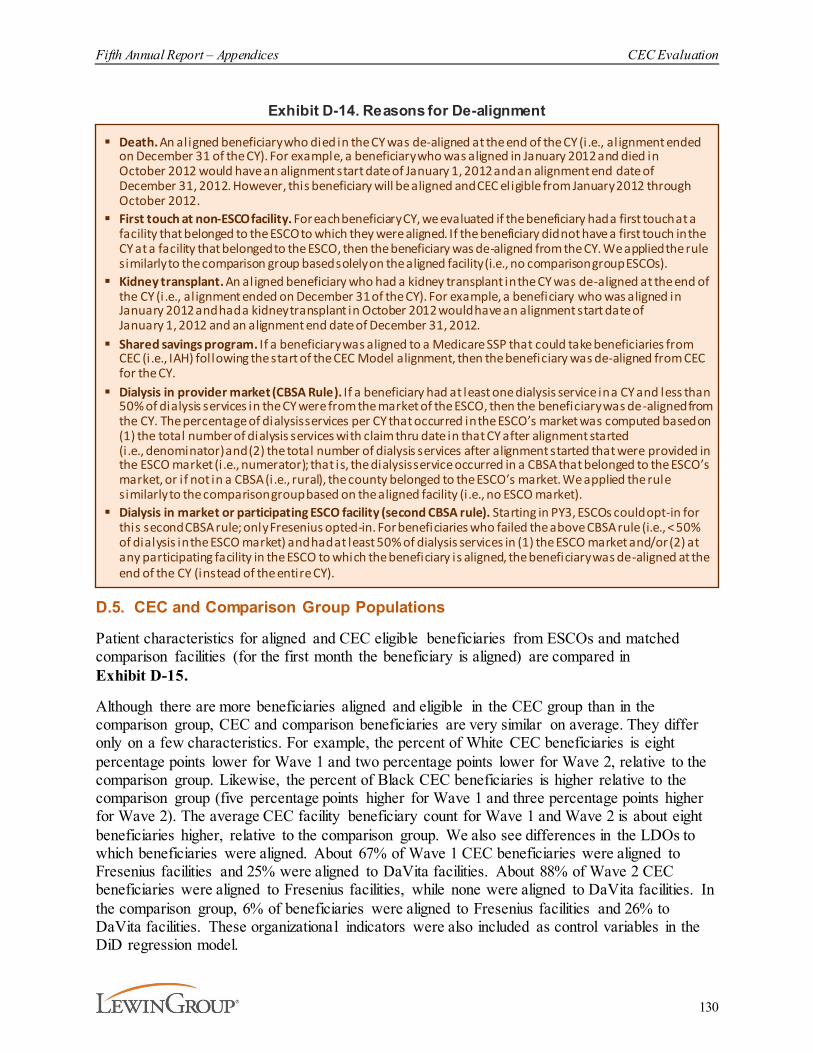
Fifth Annual Report – Appendices CEC Evaluation
130
Exhibit D-14. Reasons for De-alignment
D.5. CEC and Comparison Group Populations
Patient characteristics for aligned and CEC eligible beneficiaries from ESCOs and matched comparison facilities (for the first month the beneficiary is aligned) are compared in Exhibit D-15.
Although there are more beneficiaries aligned and eligible in the CEC group than in the comparison group, CEC and comparison beneficiaries are very similar on average. They differ only on a few characteristics. For example, the percent of White CEC beneficiaries is eight percentage points lower for Wave 1 and two percentage points lower for Wave 2, relative to the comparison group. Likewise, the percent of Black CEC beneficiaries is higher relative to the comparison group (five percentage points higher for Wave 1 and three percentage points higher for Wave 2). The average CEC facility beneficiary count for Wave 1 and Wave 2 is about eight beneficiaries higher, relative to the comparison group. We also see differences in the LDOs to which beneficiaries were aligned. About 67% of Wave 1 CEC beneficiaries were aligned to Fresenius facilities and 25% were aligned to DaVita facilities. About 88% of Wave 2 CEC beneficiaries were aligned to Fresenius facilities, while none were aligned to DaVita facilities. In the comparison group, 6% of beneficiaries were aligned to Fresenius facilities and 26% to DaVita facilities. These organizational indicators were also included as control variables in the DiD regression model.
§ Death. An aligned beneficiary who died in the CY was de-aligned at the end of the CY (i.e., alignment ended on December 31 of the CY). For example, a beneficiary who was aligned in January 2012 and died in October 2012 would have an alignment start date of January 1, 2012 and an alignment end date of December 31, 2012. However, this beneficiary will be aligned and CEC eligible from January 2012 through October 2012.
§ First touch at non-ESCO facility. For each beneficiary CY, we evaluated if the beneficiary had a first touch at a facility that belonged to the ESCO to which they were aligned. If the beneficiary did not have a first touch in the CY at a facility that belonged to the ESCO, then the beneficiary was de-aligned from the CY. We applied the rule similarly to the comparison group based solely on the aligned facility (i.e., no comparison group ESCOs).
§ Kidney transplant. An aligned beneficiary who had a kidney transplant in the CY was de-aligned at the end of the CY (i.e., alignment ended on December 31 of the CY). For example, a beneficiary who was aligned in January 2012 and had a kidney transplant in October 2012 would have an alignment start date of January 1, 2012 and an alignment end date of December 31, 2012.
§ Shared savings program. If a beneficiary was aligned to a Medicare SSP that could take beneficiaries from CEC (i.e., IAH) following the start of the CEC Model alignment, then the beneficiary was de-aligned from CEC for the CY.
§ Dialysis in provider market (CBSA Rule). If a beneficiary had at least one dialysis service in a CY and less than 50% of dialysis services in the CY were from the market of the ESCO, then the beneficiary was de-aligned from the CY. The percentage of dialysis services per CY that occurred in the ESCO’s market was computed based on (1) the total number of dialysis services with claim thru date in that CY after alignment started (i.e., denominator) and (2) the total number of dialysis services after alignment started that were provided in the ESCO market (i .e., numerator); that is, the dialysis service occurred in a CBSA that belonged to the ESCO’s market, or if not in a CBSA (i.e., rural), the county belonged to the ESCO’s market. We applied the rule similarly to the comparison group based on the aligned facility (i .e., no ESCO market).
§ Dialysis in market or participating ESCO facility (second CBSA rule). Starting in PY3, ESCOs could opt-in for this second CBSA rule; only Fresenius opted-in. For beneficiaries who failed the above CBSA rule (i.e., < 50% of dialysis in the ESCO market) and had at least 50% of dialysis services in (1) the ESCO market and/or (2) at any participating facility in the ESCO to which the beneficiary is aligned, the beneficiary was de-aligned at the end of the CY (instead of the entire CY).

Fifth Annual Report – Appendices CEC Evaluation
131
Exhibit D-15. CEC and Comparison Population Average Characteristics
CharacteristicsWave 1 CEC Wave 2 CEC Comparison (N=61,211) (N=90,681) (N=136,716)
Beneficiary Characteristics
Age 63.4 63.2 63.5Female 43.2% 44.1% 44.4%BMI (kg/m2) 29.7 30.1 30.0White 42.4% 48.0% 50.1%Black 41.3% 39.4% 36.7%Other 16.3% 12.6% 13.2%Aged into Medicare 35.1% 34.3% 35.0%Disabled into Medicare 23.1% 23.2% 23.0%ESRD into Medicare 25.1% 25.7% 24.8%Disabled & ESRD into Medicare 16.7% 16.8% 17.2%Full Dual Eligibility 38.0% 34.0% 36.0%Partial Dual Eligibility 7.5% 10.0% 10.1%ESRD Cause: Diabetes 44.6% 45.0% 45.6%ESRD Cause: Hypertension 33.0% 30.8% 30.5%ESRD Cause: Other 19.6% 21.2% 20.8%ESRD Cause: Unknown 2.9% 3.0% 3.0%Months on Dialysis 40.8 39.9 39.2Hemodialysis 93.1% 92.6% 91.9%Peritoneal Dialysis 7.4% 7.6% 8.2%Both Hemodialysis/Peritoneal Dialysis 0.92% 0.87% 0.55%Other Dialysis 0.69% 0.51% 0.75%
Facility Characteristics
Beneficiary Count 118.1 118.9 110.5Percent with a Late Shift 22.1% 33.1% 27.0%Percent For-Profit 91.6% 90.5% 92.6%CDC 0% 2.1% 0%Percent DaVita 24.6% 0% 25.7%Percent DCI 6.2% 4.8% 6.2%Percent Fresenius 67.2% 87.1% 64.0%Percent Atlantic 0% 2.7% 0%Percent NKC 0% 3.3% 0%Percent Other 0% 0% 4.2%Precent Rogosin 2.0% 0% 0%
Market Characteristics
Median Household Income $61,205 $61,128 $58,915 MA Penetration 30.2 32.4 32.0Dual Per 10,000 303.0 295.7 324.5PCPs Per 10,000 7.8 7.8 7.9
Notes: Characteristics based on beneficiaries’ first month aligned. A complete list of beneficiary -, facility-, and market-level control variables included in the DID Model is provided in Exhibit D-22.
Fifth Annual Report – Appendices CEC Evaluation
132
D.6. COVID-19 Public Health Emergency Model Adjustments and Bias Mitigation Approaches
Four adjustments were made to the financial methodology of the CEC Model as a result of the COVID-19 PHE: a reduction in 2020 downside risk, capping ESCOs’ gross savings upside potential at 5%, removal of COVID-19 inpatient episodes, and removing the 2020 financial guarantee requirement.118
To account for the removal of COVID-19 inpatient episodes from the shared savings/losses calculation, identical methods were applied to both the CEC and comparison group. Since exclusions are based on factors readily observable in claims (e.g., diagnosis codes), COVID-19 inpatient episode exclusions can easily be applied to both groups. Specifically, COVID-19 inpatient episodes were identified using ICD-10 codes B97.29, from January 27, 2020 through March 31, 2020 and U07.1 from April 1, 2020 and forward. COVID-19 inpatient episodes started the month the beneficiary was admitted for a COVID-19 diagnosis and ended at the end of the month after the discharge date.
From an evaluation perspective, removal of COVID-19 inpatient episodes may not fully account for the differential impacts CEC and comparison group beneficiaries experienced due to the PHE. While the removal of COVID-19 inpatient episodes mitigates differences in COVID-19 prevalence and COVID-19 related costs between CEC and comparison group beneficiaries, it does not address COVID-19 wide impacts at the provider and market level. COVID-19 impacted regions of the country at different times and with various levels of intensity. The potential broad impact of COVID-19 could not only impact the timing and quality of care dialysis patients received due to altered scheduled dialysis sessions and delayed transitions from catheter vascular access but also related aspects of care such as transportation. Additionally, changes in spending could result in biased estimated impacts of the CEC Model in PY5 (2020 pandemic year) if they are not symmetric for the CEC and comparison group. One way to account for this ramification would be to include additional risk-adjusters that capture the timing and intensity of COVID-19 based on regional differences and the location of CEC and comparison dialysis facilities.
To illustrate differences in COVID-19 burden and timing in counties where Wave 1, Wave 2, and comparison facilities are located, we show county-level trends of the seven day moving average of the COVID-19 infection and death rates per 100,000 county residents in Exhibits D-16 and D-17. In both exhibits we can see that in the first six months of 2020 Wave 1 CEC facilities were located in counties that had higher infection and death rates than the counties Wave 2 and comparison facilities were located. For example, in May 2020, the average Wave 1 beneficiary lived in a county with an infection rate of 15 and death rate of seven per 100,000 county residents, whereas Wave 2 and the comparison group had a lower infection rate of 10 and death rate of four per 100,000 county residents. In later months of 2020, all groups experienced similar infection and death rates, however, the rates in counties where comparison facilities were located were generally slightly higher.
118 Ibid
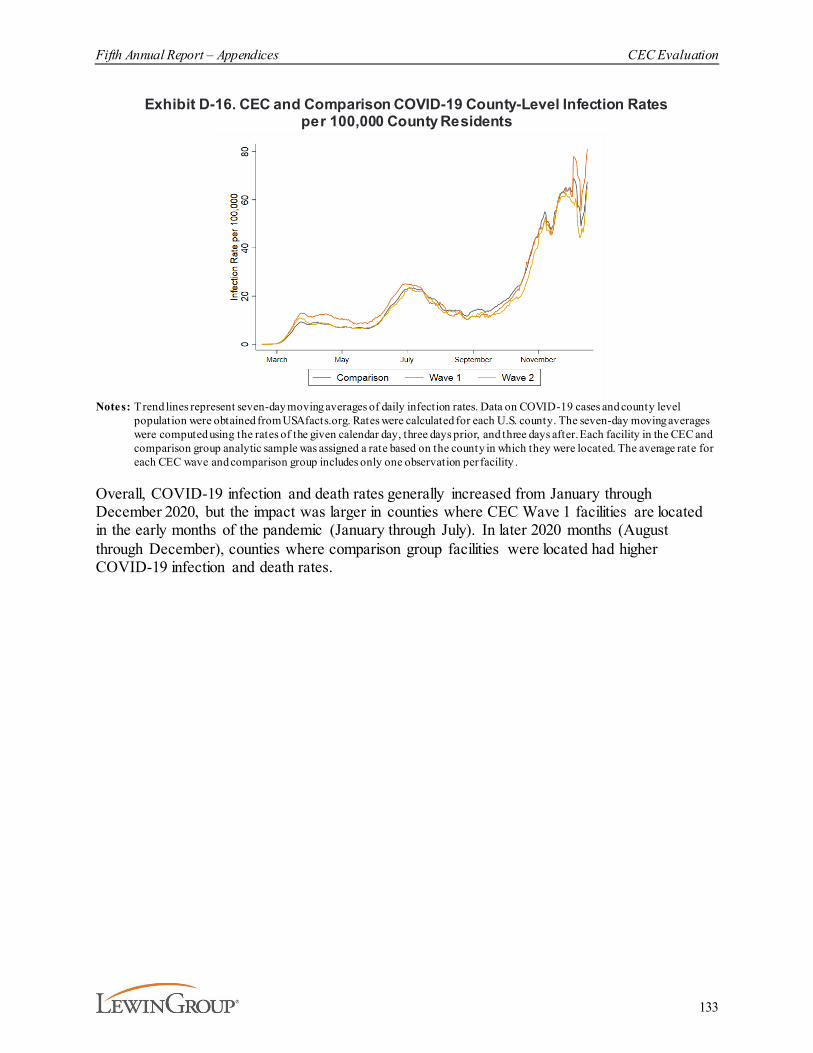
Fifth Annual Report – Appendices CEC Evaluation
133
Exhibit D-16. CEC and Comparison COVID-19 County-Level Infection Rates per 100,000 County Residents
Notes: T rend lines represent seven-day moving averages of daily infection rates. Data on COVID-19 cases and county level
population were obtained from USAfacts.org. Rates were calculated for each U.S. county. The seven-day moving averages were computed using the rates of the given calendar day, three days prior, and three days after. Each facility in the CEC and comparison group analytic sample was assigned a rate based on the county in which they were located. The average rate for each CEC wave and comparison group includes only one observation per facility .
Overall, COVID-19 infection and death rates generally increased from January through December 2020, but the impact was larger in counties where CEC Wave 1 facilities are located in the early months of the pandemic (January through July). In later 2020 months (August through December), counties where comparison group facilities were located had higher COVID-19 infection and death rates.
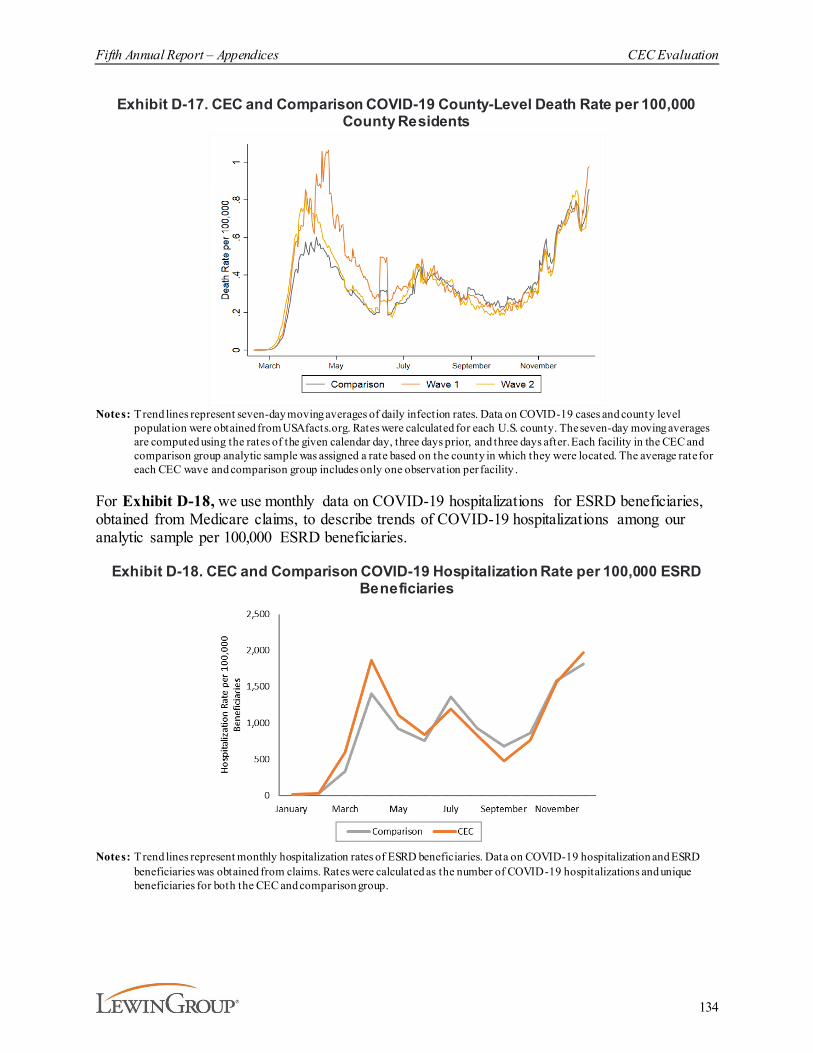
Fifth Annual Report – Appendices CEC Evaluation
134
Exhibit D-17. CEC and Comparison COVID-19 County-Level Death Rate per 100,000 County Residents
Notes: T rend lines represent seven-day moving averages of daily infection rates. Data on COVID-19 cases and county level population were obtained from USAfacts.org. Rates were calculated for each U.S. county. The seven-day moving averages are computed using the rates of the given calendar day, three days prior, and three days after. Each facility in the CEC and comparison group analytic sample was assigned a rate based on the county in which they were located. The average rate for each CEC wave and comparison group includes only one observation per facility .
For Exhibit D-18, we use monthly data on COVID-19 hospitalizations for ESRD beneficiaries, obtained from Medicare claims, to describe trends of COVID-19 hospitalizations among our analytic sample per 100,000 ESRD beneficiaries.
Exhibit D-18. CEC and Comparison COVID-19 Hospitalization Rate per 100,000 ESRD Beneficiaries
Notes: T rend lines represent monthly hospitalization rates of ESRD beneficiaries. Data on COVID-19 hospitalization and ESRD beneficiaries was obtained from claims. Rates were calculated as the number of COVID-19 hospitalizations and unique beneficiaries for both the CEC and comparison group.
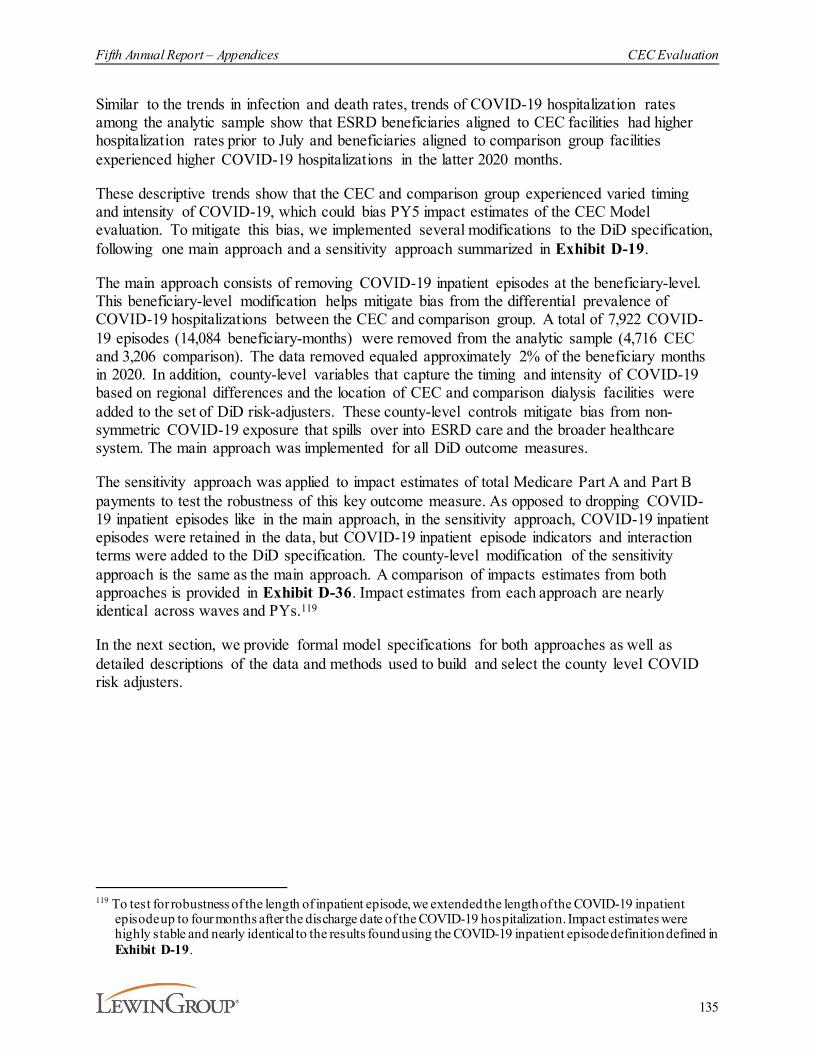
Fifth Annual Report – Appendices CEC Evaluation
135
Similar to the trends in infection and death rates, trends of COVID-19 hospitalization rates among the analytic sample show that ESRD beneficiaries aligned to CEC facilities had higher hospitalization rates prior to July and beneficiaries aligned to comparison group facilities experienced higher COVID-19 hospitalizations in the latter 2020 months.
These descriptive trends show that the CEC and comparison group experienced varied timing and intensity of COVID-19, which could bias PY5 impact estimates of the CEC Model evaluation. To mitigate this bias, we implemented several modifications to the DiD specification, following one main approach and a sensitivity approach summarized in Exhibit D-19.
The main approach consists of removing COVID-19 inpatient episodes at the beneficiary-level. This beneficiary-level modification helps mitigate bias from the differential prevalence of COVID-19 hospitalizations between the CEC and comparison group. A total of 7,922 COVID-19 episodes (14,084 beneficiary-months) were removed from the analytic sample (4,716 CEC and 3,206 comparison). The data removed equaled approximately 2% of the beneficiary months in 2020. In addition, county-level variables that capture the timing and intensity of COVID-19 based on regional differences and the location of CEC and comparison dialysis facilities were added to the set of DiD risk-adjusters. These county-level controls mitigate bias from non-symmetric COVID-19 exposure that spills over into ESRD care and the broader healthcare system. The main approach was implemented for all DiD outcome measures.
The sensitivity approach was applied to impact estimates of total Medicare Part A and Part B payments to test the robustness of this key outcome measure. As opposed to dropping COVID-19 inpatient episodes like in the main approach, in the sensitivity approach, COVID-19 inpatient episodes were retained in the data, but COVID-19 inpatient episode indicators and interaction terms were added to the DiD specification. The county-level modification of the sensitivity approach is the same as the main approach. A comparison of impacts estimates from both approaches is provided in Exhibit D-36. Impact estimates from each approach are nearly identical across waves and PYs.119
In the next section, we provide formal model specifications for both approaches as well as detailed descriptions of the data and methods used to build and select the county level COVID risk adjusters.
119 To test for robustness of the length of inpatient episode, we extended the length of the COVID-19 inpatient
episode up to four months after the discharge date of the COVID-19 hospitalization. Impact estimates were highly stable and nearly identical to the results found using the COVID-19 inpatient episode definition defined in Exhibit D-19.
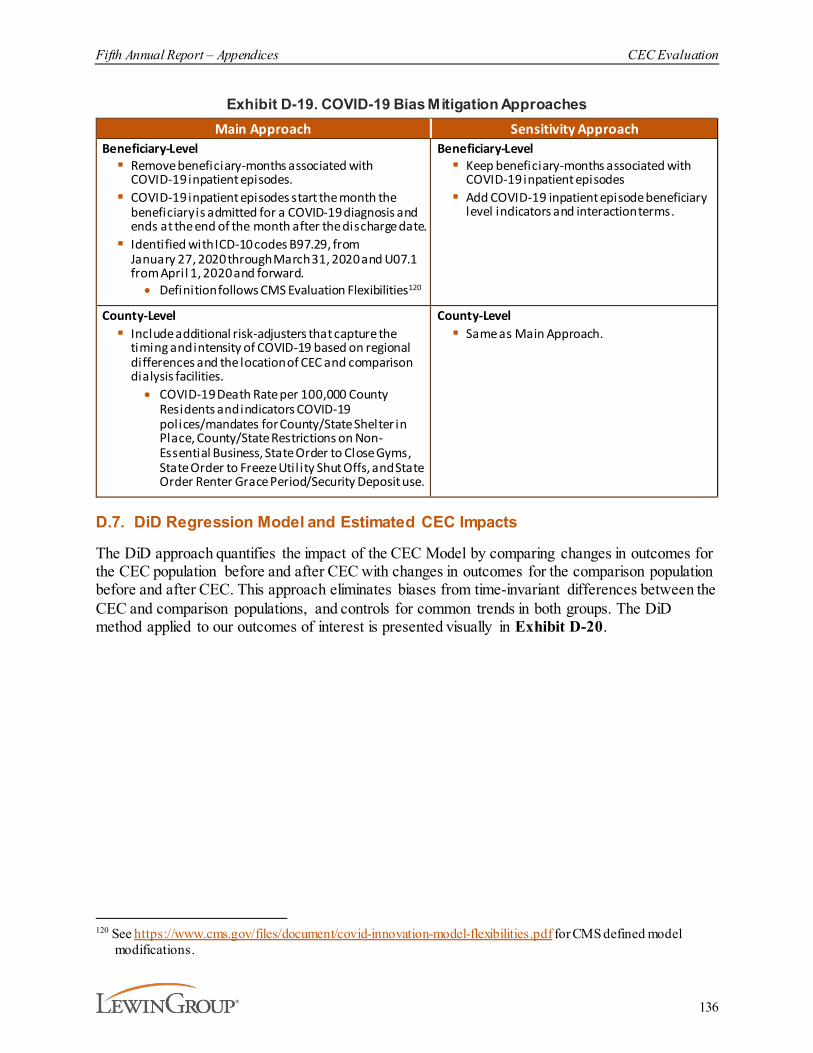
Fifth Annual Report – Appendices CEC Evaluation
136
Exhibit D-19. COVID-19 Bias Mitigation ApproachesMain Approach Sensitivity Approach
Beneficiary-Level§ Remove beneficiary-months associated with
COVID-19 inpatient episodes.§ COVID-19 inpatient episodes start the month the
beneficiary is admitted for a COVID-19 diagnosis and ends at the end of the month after the discharge date.
§ Identified with ICD-10 codes B97.29, from January 27, 2020 through March 31, 2020 and U07.1 from April 1, 2020 and forward.· Definition follows CMS Evaluation Flexibilities120
Beneficiary-Level§ Keep beneficiary-months associated with
COVID-19 inpatient episodes§ Add COVID-19 inpatient episode beneficiary
level indicators and interaction terms.
County-Level § Include additional risk-adjusters that capture the
timing and intensity of COVID-19 based on regional differences and the location of CEC and comparison dialysis facilities.· COVID-19 Death Rate per 100,000 County
Residents and indicators COVID-19 polices/mandates for County/State Shelter in Place, County/State Restrictions on Non-Essential Business, State Order to Close Gyms, State Order to Freeze Util ity Shut Offs, and State Order Renter Grace Period/Security Deposit use.
County-Level§ Same as Main Approach.
D.7. DiD Regression Model and Estimated CEC Impacts
The DiD approach quantifies the impact of the CEC Model by comparing changes in outcomes for the CEC population before and after CEC with changes in outcomes for the comparison population before and after CEC. This approach eliminates biases from time-invariant differences between the CEC and comparison populations, and controls for common trends in both groups. The DiD method applied to our outcomes of interest is presented visually in Exhibit D-20.
120 See https://www.cms.gov/files/document/covid-innovation-model-flexibilities.pdf for CMS defined model
modifications.
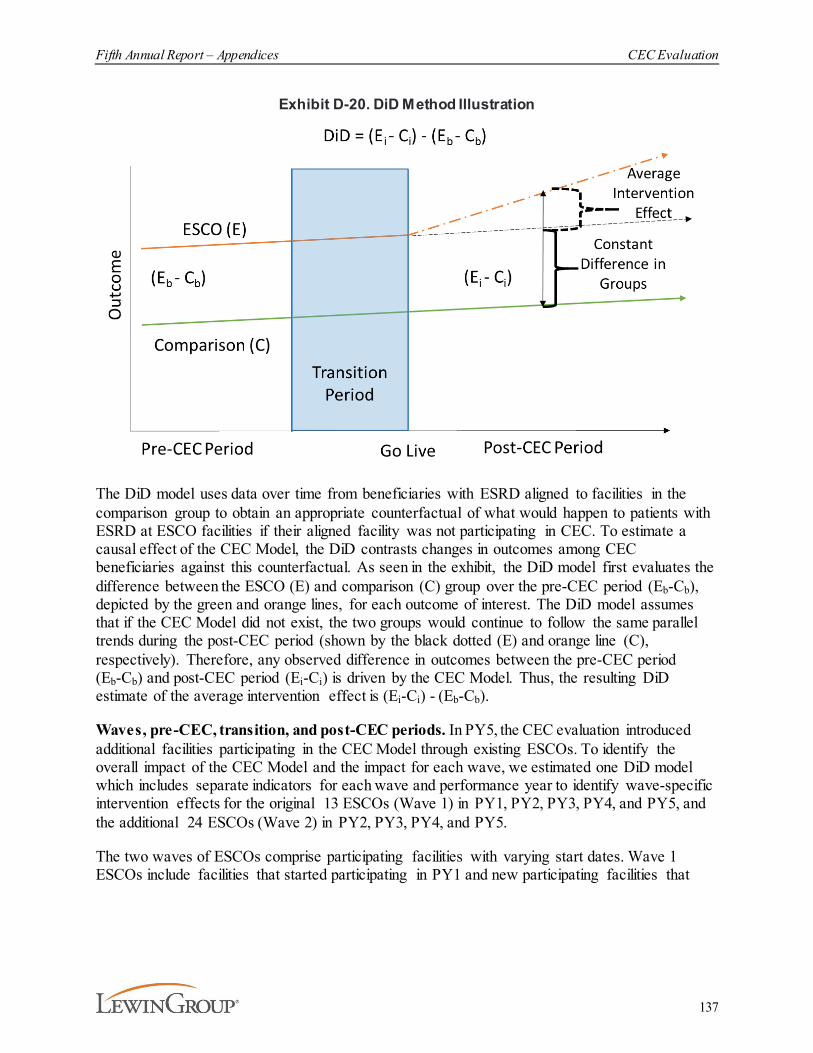
Fifth Annual Report – Appendices CEC Evaluation
137
Exhibit D-20. DiD Method Illustration
The DiD model uses data over time from beneficiaries with ESRD aligned to facilities in the comparison group to obtain an appropriate counterfactual of what would happen to patients with ESRD at ESCO facilities if their aligned facility was not participating in CEC. To estimate a causal effect of the CEC Model, the DiD contrasts changes in outcomes among CEC beneficiaries against this counterfactual. As seen in the exhibit, the DiD model first evaluates the difference between the ESCO (E) and comparison (C) group over the pre-CEC period (Eb-Cb), depicted by the green and orange lines, for each outcome of interest. The DiD model assumes that if the CEC Model did not exist, the two groups would continue to follow the same parallel trends during the post-CEC period (shown by the black dotted (E) and orange line (C), respectively). Therefore, any observed difference in outcomes between the pre-CEC period (Eb-Cb) and post-CEC period (Ei-Ci) is driven by the CEC Model. Thus, the resulting DiD estimate of the average intervention effect is (Ei-Ci) - (Eb-Cb).
Waves, pre-CEC, transition, and post-CEC periods. In PY5, the CEC evaluation introduced additional facilities participating in the CEC Model through existing ESCOs. To identify the overall impact of the CEC Model and the impact for each wave, we estimated one DiD model which includes separate indicators for each wave and performance year to identify wave-specific intervention effects for the original 13 ESCOs (Wave 1) in PY1, PY2, PY3, PY4, and PY5, and the additional 24 ESCOs (Wave 2) in PY2, PY3, PY4, and PY5.
The two waves of ESCOs comprise participating facilities with varying start dates. Wave 1 ESCOs include facilities that started participating in PY1 and new participating facilities that
Fifth Annual Report – Appendices CEC Evaluation
138
were added in PY2, PY3, PY4, or PY5.121 Wave 2 ESCOs include facilities that started participating in new ESCOs in PY2 and new participating facilities that were added in PY3, PY4, or PY5. Participating facilities are designated pre-CEC, transition, and post-CEC periods depending on their start date. The periods of analysis for all groups are described in Exhibit D-21. Specifically, Q1 2014 represents the first calendar quarter of the pre-CEC period, i.e., January 2014 for all participating facilities. The pre-CEC period ends in March 2015 for participating facilities starting in PY1 and in June 2016, 2017, 2018, 2019 and 2020 for participating facilities starting in PY2, PY3, PY4, or PY5. For participating facilities starting in PY1, the transition period takes into consideration the delayed start of the CEC Model, which was originally scheduled for April 2015. The transition period for participating facilities starting in PY2, PY3, PY4, or PY5 includes months from the application deadline (July 2016, 2017, 2018, 2019 or 2020) to the start of PY2, PY3, PY4, or PY5. The transition periods are represented by the two quarters for each group. Finally, the areas labeled post-CEC represent the intervention periods for each group.
121 In PY5, Wave 1 and 2 ESCOs added 23 and 57 facilities, respectively. Of the PY5 joiners, three Wave 1 and 14
Wave 2 facilities were included in the matched analytic sample for the impact analysis . Additionally, 147 facilities terminated their participation in the CEC Model after December 2015; 129 of these 147 facilities were in the analytic sample. Twenty-three of these facilities rejoined or will rejoin by PY5. Site visit participants in PY3 and PY4 reported removing facilities from ESCOs due to facility closures, lack of commitment by facility providers, and resource shortages. Facilities that stopped participating in the CEC Model remain in the analysis, with their matched pair, as long as the CEC facility has aligned and eligible beneficiaries in a given month after their participation drop date. For all months after the drop date that the CEC facility has no observations, its matched comparison facility was manually excluded (N=80). New beneficiaries could not be aligned to facilities that left the model, but existing beneficiaries remain aligned as long as they had a first touch at a participating facility in the ESCO. One ESCO facility closed in December 2017; this facility and its match were removed from the analytic sample for PY3 and PY4.
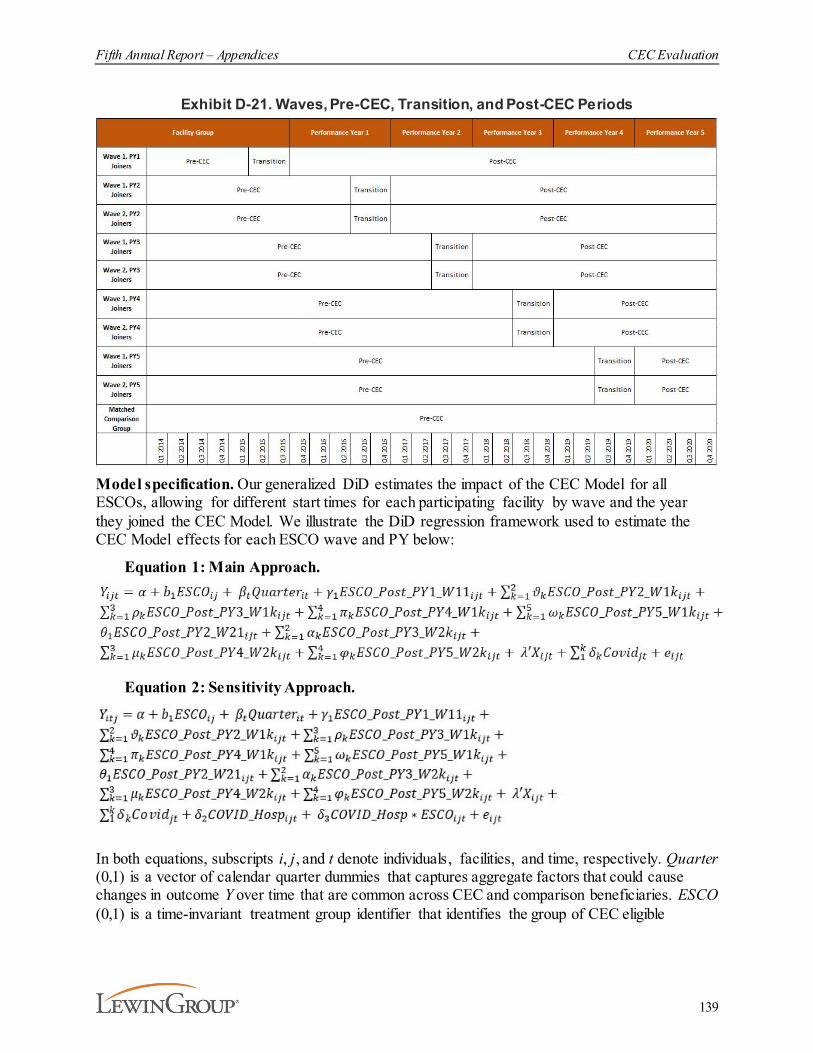
Fifth Annual Report – Appendices CEC Evaluation
139
Exhibit D-21. Waves, Pre-CEC, Transition, and Post-CEC Periods
Model specification. Our generalized DiD estimates the impact of the CEC Model for all ESCOs, allowing for different start times for each participating facility by wave and the year they joined the CEC Model. We illustrate the DiD regression framework used to estimate the CEC Model effects for each ESCO wave and PY below:
Equation 1: Main Approach.
Equation 2: Sensitivity Approach.
In both equations, subscripts i, j, and t denote individuals, facilities, and time, respectively. Quarter (0,1) is a vector of calendar quarter dummies that captures aggregate factors that could cause changes in outcome Y over time that are common across CEC and comparison beneficiaries. ESCO (0,1) is a time-invariant treatment group identifier that identifies the group of CEC eligible
Fifth Annual Report – Appendices CEC Evaluation
140
beneficiaries aligned at an ESCO in a given month.122 The post-treatment indicators, represented by ESCO_Post_PY1_W11, ESCO_Post_PY2_W1k, ESCO_Post_PY3_W1k, ESCO_Post_PY4_W1k, ESCO_Post_PY5_W1k separate CEC beneficiaries by wave (k=1,2), joining year, and by PY. For example, ESCO_Post_PY1_W11 (0,1) is indexed to i, j, and t, takes the value ‘0’ for beneficiaries in the pre-CEC and transition period, and switches to ‘1’ for CEC beneficiaries aligned to a Wave 1 PY1 joining facility when their aligned facility starts participating in PY1. ESCO_Post_PY1_W11 is always ‘0’ for the comparison group. 123
Weighted averages of the post-treatment indicators are calculated to generate overall and specific PY impact estimates for All ESCOs, Wave 1, and Wave 2.
The DiD design control for time-varying changes that are common to all beneficiaries and that occur during the implementation of the CEC Model, as well as time-invariant unmeasured differences between beneficiaries not otherwise captured by the model. The variables we specified in the DiD models to control for time-invariant and time-varying differences in patients, markets, and facilities that are outside the control of ESCOs, are detailed in Exhibit D-22. Market and facility variables are representative of the facility to which the beneficiary was assigned based on first-touch assignment. The regression model includes only beneficiary health conditions that are not likely to be affected by the CEC Model (i.e., cancer, reason for ESRD) since their inclusion would bias estimates of the impact the CEC Model had on ESRD care.
COVID-19 related controls were added to the DiD specification for the AR5 impact analysis and were assigned to CEC and comparison group facilities based on geographical location. The COVID-19 covariates adjust impact estimates in PY5 for differences in COVID-19 exposure among the CEC and comparison group that impacted the broader healthcare system. The COVID-19 variables were selected via a Least Absolute Shrinkage and Selection Operator (LASSO) machine learning (ML) algorithm. Specifically, a Rigorous Adaptive LASSO model was estimated using analytic sample data from the 2020 pandemic year.124 The Rigorous LASSO model was chosen because this model selection approach places a high priority on controlling for overfitting and minimizes the impact on prior performance year estimates. A total of 29 COVID-19 related variables were included in the ML LASSO model including county-level COVID-19 rates, as well as state and county policies related to the PHE. Of the 29 COVID-19 variables, six were selected to be included in the DiD specification based on the strength of the covariates' ability to predict Medicare payments in 2020 (see Exhibit D-19). Equation 2 also includes an indicator for COVID-19 inpatient episodes (Covid_Hosp). This covariate adjusts the impact estimate for the average cost of inpatient COVID hospitalization across the entire analytic sample. Additionally, equation 2 includes an interaction term of the COVID-19 episode and treatment indicator (Covid_Hosp*ESCO). This term adjusts the impact estimate for the
122 Rather than using the list of aligned beneficiaries produced by the implementation contractor, we simulate
alignment using the program rules described above. This allows us to align beneficiaries during the pre-CEC period and apply the same methods for CEC and comparison beneficiaries.
123 The DiD regression frameworks also include an indicator that identifies the treatment transition period observations. This indicator controls the transition period effect on outcomes and effectively exclude this time period from the DiD estimate. For brevity, the indicator was omitted from the equations.
124 Ahrens A, Hansen CB, Schaffer ME. Lassopack: Model selection and prediction with regularized regression in Stata. The Stata Journal. 2020;20(1):176-235.

Fifth Annual Report – Appendices CEC Evaluation
141
differential impact of the average cost of a COVID-19 inpatient episode in ESCO and comparison facilities.125 Furthermore, we estimated stratified DiD models similar to the specification described by equation 1, but observations were restricted to our stratified samples of interest. Specifically, we investigated the extent to which the CEC Model had a differential impact on subgroups of Medicare beneficiaries with ESRD varying in their socio-demographic characteristics and their time on dialysis.
Exhibit D-22. Control Variables Included in the DiD M odelBeneficiary-Level Facility-Level Market-Level
Original Reason for Entitlement Code (OREC): Age, Disabled, ESRD, ESRD and Disabled
Reason for ESRD: Hypertension, diabetes, or other
Female
Age
BMI at ESRD incidence
Months on dialysis
Cancer indicator (annual)
Type of dialysis indicator: Hemodialysis, peritoneal dialysis, other (monthly)
Race indicators: White, Black, Other
Medicaid status indicators: None, full, or partial (monthly)
COVID-19 episode indicator*
COVID-19 episode and Treatment interaction indicators*
Cohort facility indicators for the matched set of Wave 1 PY1, Wave 1 PY2, Wave 1 PY3, Wave 1 PY4, Wave 1 PY5, Wave 2 PY2, Wave 2 PY3, Wave 2 PY4, and Wave 2 PY5 joiners.
LDO Facilities indicators: Fresenius, DCI, and DaVita
Non-LDO indicator
Facility beneficiary count (annual)
Profit: For profit, not for profit
Late shift indicator (facility offers dialysis after 5PM)
Rural Urban indicators (Metro, Urban, Rural)
County COVID-19 Death Rate per 100,000
County/State Shelter in Place indicator
County/State Restrictions on Non-Essential Business indicator
State Order to Close Gyms indicator
State Order to Freeze Utility Shut Offs indicator
State Order Renter Grace Period/Security Deposit use indicator
CBSA median household income (annual)
CBSA Dual enrollees (Medicaid & Medicare) per 100,000 population in CBSA (annual)
CBSA MA penetration (annual)
CBSA geographic rate of PCPs per 10,000 population (annual)
Region indicators
Percent of ACO beneficiaries in a market
Notes: * Only included in equation 2: sensitivity approach impact estimate specification.
Computation of standard error. In general, estimated SEs of the DiD estimate are calculated using two-way clusters at beneficiary and service facility levels.126,127 Two-way clusters account 125 The additional covariates that were added to equation 2 were necessary given that COVID-19 inpatient episodes
were not removed from the data for the sensitivity approach. See variables marked with * in Exhibit D-19. 126 Cameron, A., Gelbach, J.B., Miller, D.L. (2012). Robust inference with multiway clustering. Journal of Business
& Economic Statistics, 29(2):238-49.127 Two-part expenditure models apply one-way cluster methods. Standard errors for these models are clustered by
service facility.
Fifth Annual Report – Appendices CEC Evaluation
142
for intra-cluster correlation among beneficiaries receiving services from the same facility (service facility cluster) and correlation across observations from the same beneficiary across time (beneficiary cluster).
Parallel trends tests. A pivotal assumption of the DiD model is that the ESCO and comparison groups have the same trend in outcomes prior to the intervention (see Exhibit D-20 for the illustration of the parallel trends assumption during the pre-CEC period). Formally, the parallel trends tests involved assessing the significance of the coefficient corresponding to the time and treatment dummy interaction term at p<0.05, using data prior to the start of the CEC Model. If the outcome trends between treatment and comparison group are the same prior to the start of the CEC Model, then the interaction coefficient should be near zero and not statistically significant (i.e., the difference in trends is not significantly different between the two groups in the pre-CEC period). Similar to equations 1 and 2, the parallel trend test for each DiD estimate includes a full set of patient, facility, and market risk adjusters that are included in the DiD specification. We test trends over the common period where all treatment and matched comparison groups are within the pre-CEC period (i.e., the first five quarters of data January 2014 through March 2015).128 We conducted parallel trends tests for every outcome and every group of CEC facilities evaluated in this report (i.e., All ESCOs, Wave 1 ESCOs, and Wave 2 ESCOs). DiD estimates that failed parallel trend tests are identified in Exhibits D-24 through D-36 with the symbol ‡. Five outcomes measures are presented and discussed in the report despite failing parallel trends tests. We present the pre-CEC trend graphs in Exhibit D-23. All five measures have visually parallel trends between the ESCO and comparison groups.
128 Trend tests for the overall all ESCO DiD result compare trends of the pooled treatment and comparison groups,
whereas trend test for the wave-specific DiD estimate compare each wave-specific treatment group (Wave 1 and Wave 2) relative to the trends of the pooled comparison group.
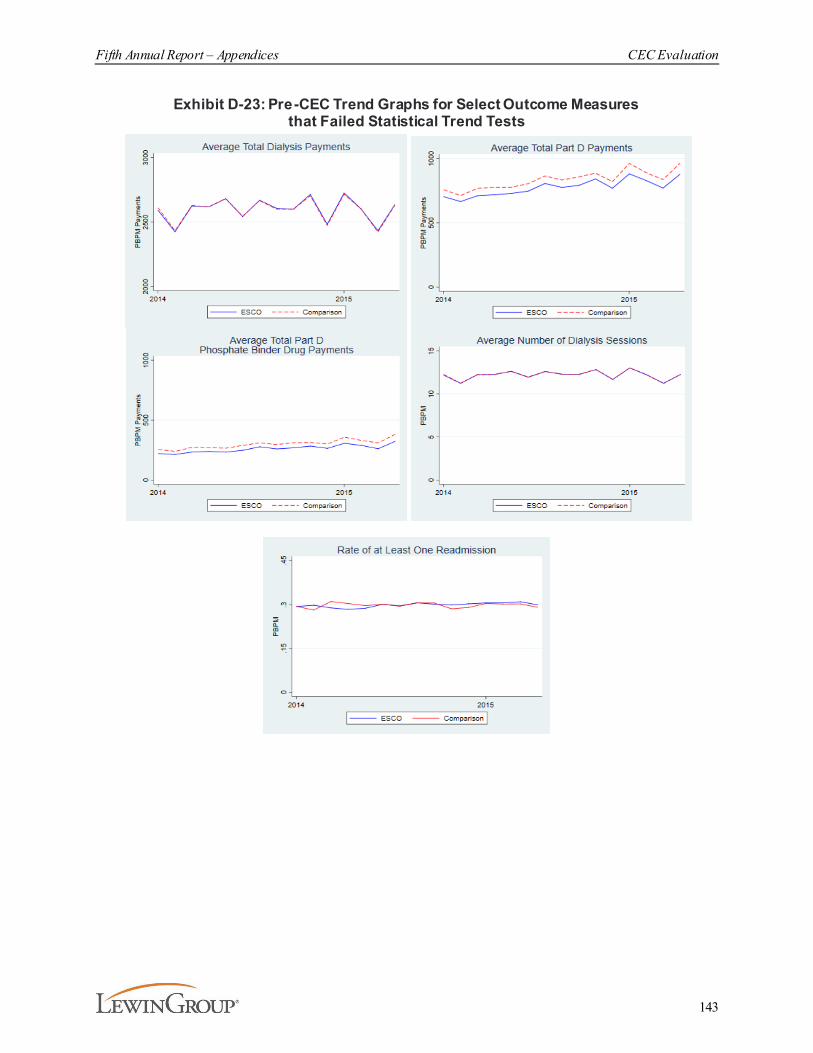
Fifth Annual Report – Appendices CEC Evaluation
143
Exhibit D-23: Pre-CEC Trend Graphs for Select Outcome Measures that Failed Statistical Trend Tests
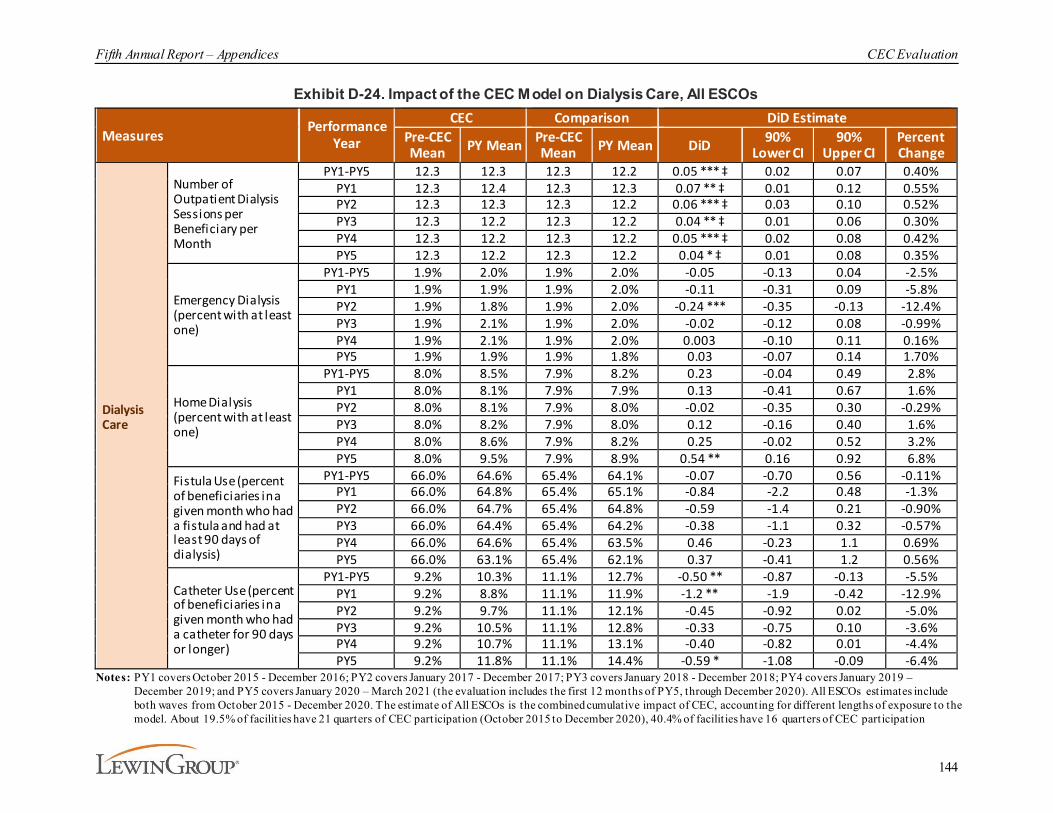
Fifth Annual Report – Appendices CEC Evaluation
144
Exhibit D-24. Impact of the CEC Model on Dialysis Care, All ESCOs
MeasuresPerformance
Year
CEC Comparison DiD EstimatePre-CEC Mean PY Mean Pre-CEC
Mean PY Mean DiD 90% Lower CI
90% Upper CI
Percent Change
Dialysis Care
Number of Outpatient Dialysis Sessions per Beneficiary per Month
PY1-PY5 12.3 12.3 12.3 12.2 0.05 *** ‡ 0.02 0.07 0.40%PY1 12.3 12.4 12.3 12.3 0.07 ** ‡ 0.01 0.12 0.55%PY2 12.3 12.3 12.3 12.2 0.06 *** ‡ 0.03 0.10 0.52%PY3 12.3 12.2 12.3 12.2 0.04 ** ‡ 0.01 0.06 0.30%PY4 12.3 12.2 12.3 12.2 0.05 *** ‡ 0.02 0.08 0.42%PY5 12.3 12.2 12.3 12.2 0.04 * ‡ 0.01 0.08 0.35%
Emergency Dialysis (percent with at least one)
PY1-PY5 1.9% 2.0% 1.9% 2.0% -0.05 -0.13 0.04 -2.5%PY1 1.9% 1.9% 1.9% 2.0% -0.11 -0.31 0.09 -5.8%PY2 1.9% 1.8% 1.9% 2.0% -0.24 *** -0.35 -0.13 -12.4%PY3 1.9% 2.1% 1.9% 2.0% -0.02 -0.12 0.08 -0.99%PY4 1.9% 2.1% 1.9% 2.0% 0.003 -0.10 0.11 0.16%PY5 1.9% 1.9% 1.9% 1.8% 0.03 -0.07 0.14 1.70%
Home Dialysis (percent with at least one)
PY1-PY5 8.0% 8.5% 7.9% 8.2% 0.23 -0.04 0.49 2.8%PY1 8.0% 8.1% 7.9% 7.9% 0.13 -0.41 0.67 1.6%PY2 8.0% 8.1% 7.9% 8.0% -0.02 -0.35 0.30 -0.29%PY3 8.0% 8.2% 7.9% 8.0% 0.12 -0.16 0.40 1.6%PY4 8.0% 8.6% 7.9% 8.2% 0.25 -0.02 0.52 3.2%PY5 8.0% 9.5% 7.9% 8.9% 0.54 ** 0.16 0.92 6.8%
Fistula Use (percent of beneficiaries in a given month who had a fistula and had at least 90 days of dialysis)
PY1-PY5 66.0% 64.6% 65.4% 64.1% -0.07 -0.70 0.56 -0.11%PY1 66.0% 64.8% 65.4% 65.1% -0.84 -2.2 0.48 -1.3%PY2 66.0% 64.7% 65.4% 64.8% -0.59 -1.4 0.21 -0.90%PY3 66.0% 64.4% 65.4% 64.2% -0.38 -1.1 0.32 -0.57%PY4 66.0% 64.6% 65.4% 63.5% 0.46 -0.23 1.1 0.69%PY5 66.0% 63.1% 65.4% 62.1% 0.37 -0.41 1.2 0.56%
Catheter Use (percent of beneficiaries in a given month who had a catheter for 90 days or longer)
PY1-PY5 9.2% 10.3% 11.1% 12.7% -0.50 ** -0.87 -0.13 -5.5%PY1 9.2% 8.8% 11.1% 11.9% -1.2 ** -1.9 -0.42 -12.9%PY2 9.2% 9.7% 11.1% 12.1% -0.45 -0.92 0.02 -5.0%PY3 9.2% 10.5% 11.1% 12.8% -0.33 -0.75 0.10 -3.6%PY4 9.2% 10.7% 11.1% 13.1% -0.40 -0.82 0.01 -4.4%PY5 9.2% 11.8% 11.1% 14.4% -0.59 * -1.08 -0.09 -6.4%
Notes: PY1 covers October 2015 - December 2016; PY2 covers January 2017 - December 2017; PY3 covers January 2018 - December 2018; PY4 covers January 2019 – December 2019; and PY5 covers January 2020 – March 2021 (the evaluation includes the first 12 months of PY5, through December 2020). All ESCOs estimates include both waves from October 2015 - December 2020. The estimate of All ESCOs is the combined cumulative impact of CEC, accounting for different lengths of exposure to the model. About 19.5% of facilit ies have 21 quarters of CEC participation (October 2015 to December 2020), 40.4% of facilit ies have 16 quarters of CEC participation
Fifth Annual Report – Appendices CEC Evaluation
145
(January 2017 to December 2020), 30.4% of facilit ies have 12 quarters of CEC participation (January 2018 to December 2020), 8.1% of facilit ies have 8 quarters of CEC participation (January 2019 to December 2020), and the remaining 1.6% participated in CEC from January 2020 to December 2020 (4 quarters). Each impact estimate is based on a DiD analysis and reflects the difference in the regression-adjusted mean outcome for beneficiaries in CEC facilit ies in the intervention period and pre-CEC period relative to the same difference over time for beneficiaries in matched comparison facilit ies. Significance of the DiD impact estimate is indicated next to each outcome where * implies significance at the 10% level, ** at the 5% level, and *** at the 1% level assuming a two-tailed test. ‡ Data from the pre-CEC period showed intervention and matched comparison facilit ies were not on parallel trends for this outcome, which is required for an unbiased impact estimate.
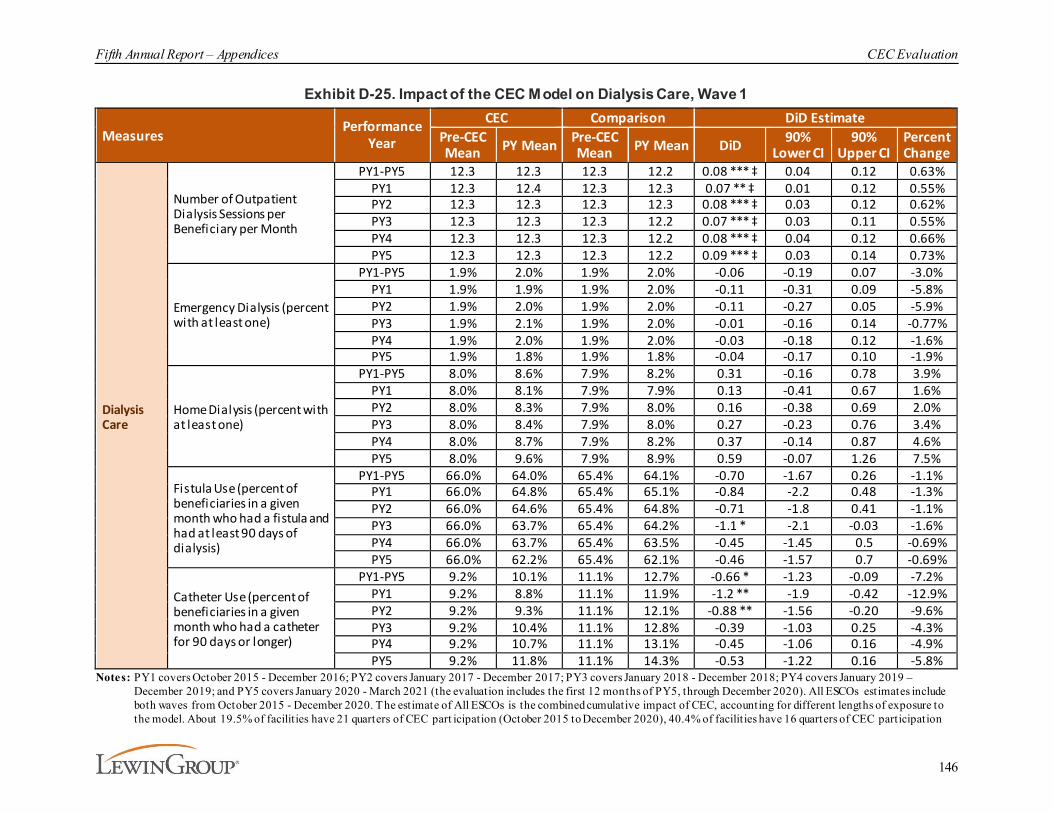
Fifth Annual Report – Appendices CEC Evaluation
146
Exhibit D-25. Impact of the CEC Model on Dialysis Care, Wave 1
MeasuresPerformance
Year
CEC Comparison DiD EstimatePre-CEC Mean PY Mean Pre-CEC
Mean PY Mean DiD 90% Lower CI
90% Upper CI
Percent Change
Dialysis Care
Number of Outpatient Dialysis Sessions per Beneficiary per Month
PY1-PY5 12.3 12.3 12.3 12.2 0.08 *** ‡ 0.04 0.12 0.63%PY1 12.3 12.4 12.3 12.3 0.07 ** ‡ 0.01 0.12 0.55%PY2 12.3 12.3 12.3 12.3 0.08 *** ‡ 0.03 0.12 0.62%PY3 12.3 12.3 12.3 12.2 0.07 *** ‡ 0.03 0.11 0.55%PY4 12.3 12.3 12.3 12.2 0.08 *** ‡ 0.04 0.12 0.66%PY5 12.3 12.3 12.3 12.2 0.09 *** ‡ 0.03 0.14 0.73%
Emergency Dialysis (percent with at least one)
PY1-PY5 1.9% 2.0% 1.9% 2.0% -0.06 -0.19 0.07 -3.0%PY1 1.9% 1.9% 1.9% 2.0% -0.11 -0.31 0.09 -5.8%PY2 1.9% 2.0% 1.9% 2.0% -0.11 -0.27 0.05 -5.9%PY3 1.9% 2.1% 1.9% 2.0% -0.01 -0.16 0.14 -0.77%PY4 1.9% 2.0% 1.9% 2.0% -0.03 -0.18 0.12 -1.6%PY5 1.9% 1.8% 1.9% 1.8% -0.04 -0.17 0.10 -1.9%
Home Dialysis (percent with at least one)
PY1-PY5 8.0% 8.6% 7.9% 8.2% 0.31 -0.16 0.78 3.9%PY1 8.0% 8.1% 7.9% 7.9% 0.13 -0.41 0.67 1.6%PY2 8.0% 8.3% 7.9% 8.0% 0.16 -0.38 0.69 2.0%PY3 8.0% 8.4% 7.9% 8.0% 0.27 -0.23 0.76 3.4%PY4 8.0% 8.7% 7.9% 8.2% 0.37 -0.14 0.87 4.6%PY5 8.0% 9.6% 7.9% 8.9% 0.59 -0.07 1.26 7.5%
Fistula Use (percent of beneficiaries in a given month who had a fistula and had at least 90 days of dialysis)
PY1-PY5 66.0% 64.0% 65.4% 64.1% -0.70 -1.67 0.26 -1.1%PY1 66.0% 64.8% 65.4% 65.1% -0.84 -2.2 0.48 -1.3%PY2 66.0% 64.6% 65.4% 64.8% -0.71 -1.8 0.41 -1.1%PY3 66.0% 63.7% 65.4% 64.2% -1.1 * -2.1 -0.03 -1.6%PY4 66.0% 63.7% 65.4% 63.5% -0.45 -1.45 0.5 -0.69%PY5 66.0% 62.2% 65.4% 62.1% -0.46 -1.57 0.7 -0.69%
Catheter Use (percent of beneficiaries in a given month who had a catheter for 90 days or longer)
PY1-PY5 9.2% 10.1% 11.1% 12.7% -0.66 * -1.23 -0.09 -7.2%PY1 9.2% 8.8% 11.1% 11.9% -1.2 ** -1.9 -0.42 -12.9%PY2 9.2% 9.3% 11.1% 12.1% -0.88 ** -1.56 -0.20 -9.6%PY3 9.2% 10.4% 11.1% 12.8% -0.39 -1.03 0.25 -4.3%PY4 9.2% 10.7% 11.1% 13.1% -0.45 -1.06 0.16 -4.9%PY5 9.2% 11.8% 11.1% 14.3% -0.53 -1.22 0.16 -5.8%
Notes: PY1 covers October 2015 - December 2016; PY2 covers January 2017 - December 2017; PY3 covers January 2018 - December 2018; PY4 covers January 2019 – December 2019; and PY5 covers January 2020 - March 2021 (the evaluation includes the first 12 months of PY5, through December 2020). All ESCOs estimates include both waves from October 2015 - December 2020. The estimate of All ESCOs is the combined cumulative impact of CEC, accounting for different lengths of exposure to the model. About 19.5% of facilit ies have 21 quarters of CEC part icipation (October 2015 to December 2020), 40.4% of facilit ies have 16 quarters of CEC participation

Fifth Annual Report – Appendices CEC Evaluation
147
(January 2017 to December 2020), 30.4% of facilit ies have 12 quarters of CEC participation (January 2018 to December 2020), 8 .1% of facilit ies have 8 quart ers of CEC participation (January 2019 to December 2020), and the remaining 1.6% participated in CEC from January 2020 to December 2020 (4 quarters). Each impact estimate is based on a DiD analysis and reflects the difference in the regression -adjusted mean outcome for beneficiaries in CEC facilit ies in the intervention period and pre-CEC period relative to the same difference over time for beneficiaries in matched comparison facilit ies. Significance of the DiD impact estimate is indicated next to each outcome where * implies significance at the 10% level, ** at the 5% level, and *** at the 1% level assuming a two-tailed test. ‡ Data from the pre-CEC period showed intervention and matched comparison facilit ies were not on parallel trends for this outcome, wh ich is required for an unbiased impact estimate.
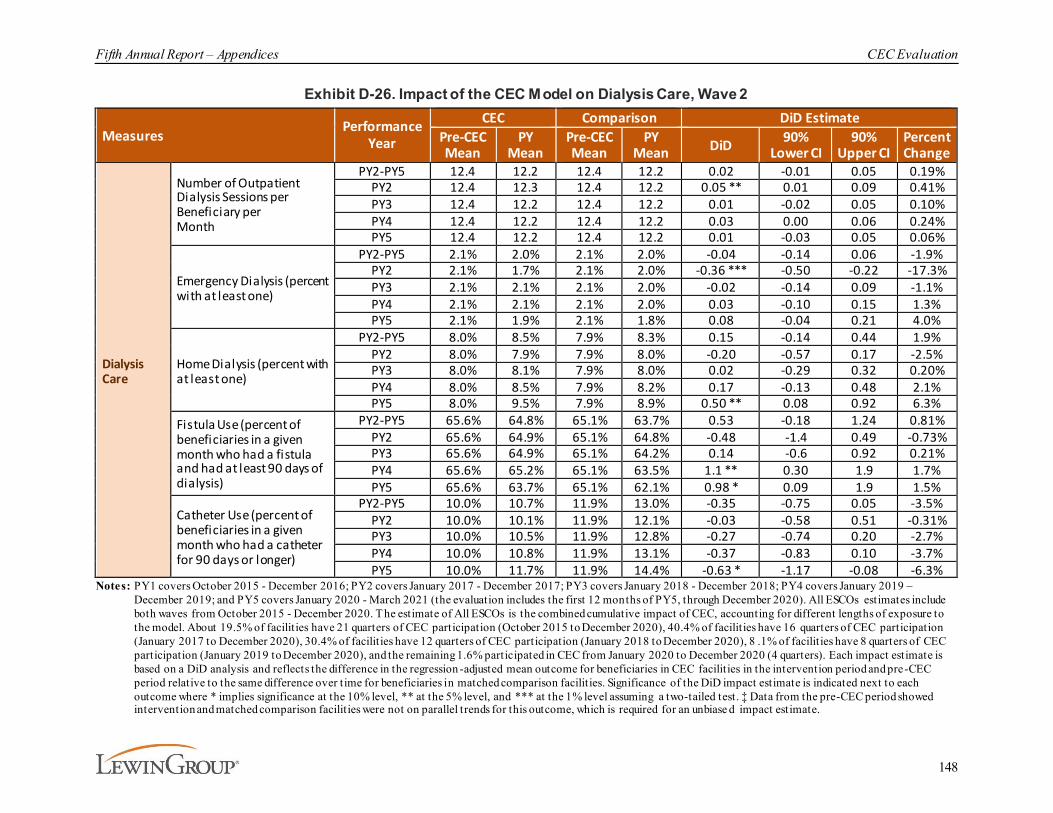
Fifth Annual Report – Appendices CEC Evaluation
148
Exhibit D-26. Impact of the CEC Model on Dialysis Care, Wave 2
MeasuresPerformance
Year
CEC Comparison DiD EstimatePre-CEC Mean
PY Mean
Pre-CEC Mean
PY Mean DiD 90%
Lower CI90%
Upper CIPercent Change
Dialysis Care
Number of Outpatient Dialysis Sessions per Beneficiary per Month
PY2-PY5 12.4 12.2 12.4 12.2 0.02 -0.01 0.05 0.19%PY2 12.4 12.3 12.4 12.2 0.05 ** 0.01 0.09 0.41%PY3 12.4 12.2 12.4 12.2 0.01 -0.02 0.05 0.10%PY4 12.4 12.2 12.4 12.2 0.03 0.00 0.06 0.24%PY5 12.4 12.2 12.4 12.2 0.01 -0.03 0.05 0.06%
Emergency Dialysis (percent with at least one)
PY2-PY5 2.1% 2.0% 2.1% 2.0% -0.04 -0.14 0.06 -1.9%PY2 2.1% 1.7% 2.1% 2.0% -0.36 *** -0.50 -0.22 -17.3%PY3 2.1% 2.1% 2.1% 2.0% -0.02 -0.14 0.09 -1.1%PY4 2.1% 2.1% 2.1% 2.0% 0.03 -0.10 0.15 1.3%PY5 2.1% 1.9% 2.1% 1.8% 0.08 -0.04 0.21 4.0%
Home Dialysis (percent with at least one)
PY2-PY5 8.0% 8.5% 7.9% 8.3% 0.15 -0.14 0.44 1.9%PY2 8.0% 7.9% 7.9% 8.0% -0.20 -0.57 0.17 -2.5%PY3 8.0% 8.1% 7.9% 8.0% 0.02 -0.29 0.32 0.20%PY4 8.0% 8.5% 7.9% 8.2% 0.17 -0.13 0.48 2.1%PY5 8.0% 9.5% 7.9% 8.9% 0.50 ** 0.08 0.92 6.3%
Fistula Use (percent of beneficiaries in a given month who had a fistula and had at least 90 days of dialysis)
PY2-PY5 65.6% 64.8% 65.1% 63.7% 0.53 -0.18 1.24 0.81%PY2 65.6% 64.9% 65.1% 64.8% -0.48 -1.4 0.49 -0.73%PY3 65.6% 64.9% 65.1% 64.2% 0.14 -0.6 0.92 0.21%PY4 65.6% 65.2% 65.1% 63.5% 1.1 ** 0.30 1.9 1.7%PY5 65.6% 63.7% 65.1% 62.1% 0.98 * 0.09 1.9 1.5%
Catheter Use (percent of beneficiaries in a given month who had a catheter for 90 days or longer)
PY2-PY5 10.0% 10.7% 11.9% 13.0% -0.35 -0.75 0.05 -3.5%PY2 10.0% 10.1% 11.9% 12.1% -0.03 -0.58 0.51 -0.31%PY3 10.0% 10.5% 11.9% 12.8% -0.27 -0.74 0.20 -2.7%PY4 10.0% 10.8% 11.9% 13.1% -0.37 -0.83 0.10 -3.7%PY5 10.0% 11.7% 11.9% 14.4% -0.63 * -1.17 -0.08 -6.3%
Notes: PY1 covers October 2015 - December 2016; PY2 covers January 2017 - December 2017; PY3 covers January 2018 - December 2018; PY4 covers January 2019 – December 2019; and PY5 covers January 2020 - March 2021 (the evaluation includes the first 12 months of PY5, through December 2020). All ESCOs estimates include both waves from October 2015 - December 2020. The estimate of All ESCOs is the combined cumulative impact of CEC, accounting for different lengths of exposure to the model. About 19.5% of facilit ies have 21 quarters of CEC participation (October 2015 to December 2020), 40.4% of facilit ies have 16 quarters of CEC participation (January 2017 to December 2020), 30.4% of facilit ies have 12 quarters of CEC participation (January 2018 to December 2020), 8 .1% of facilit ies have 8 quarters of CEC participation (January 2019 to December 2020), and the remaining 1.6% participated in CEC from January 2020 to December 2020 (4 quarters). Each impact estimate is based on a DiD analysis and reflects the difference in the regression -adjusted mean outcome for beneficiaries in CEC facilit ies in the intervention period and pre-CEC period relative to the same difference over time for beneficiaries in matched comparison facilit ies. Significance of the DiD impact estimate is indicated next to each outcome where * implies significance at the 10% level, ** at the 5% level, and *** at the 1% level assuming a two-tailed test. ‡ Data from the pre-CEC period showed intervention and matched comparison facilit ies were not on parallel trends for this outcome, which is required for an unbiase d impact estimate.
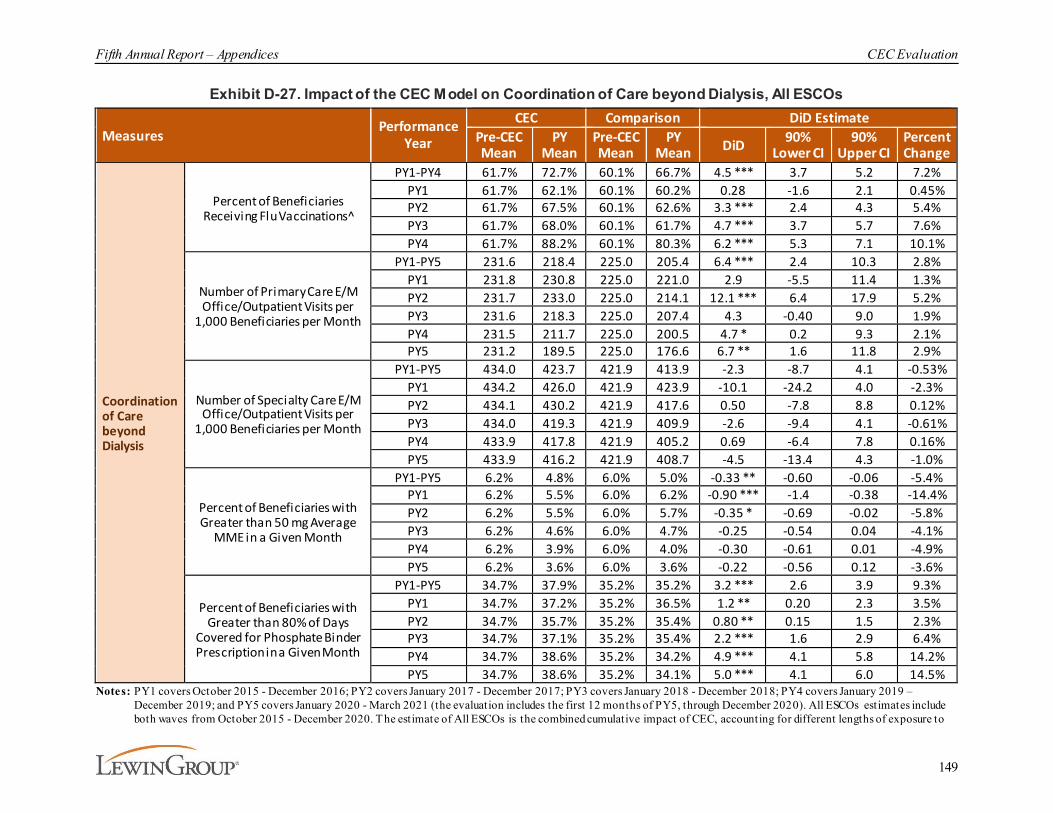
Fifth Annual Report – Appendices CEC Evaluation
149
Exhibit D-27. Impact of the CEC Model on Coordination of Care beyond Dialysis, All ESCOs
MeasuresPerformance
Year
CEC Comparison DiD EstimatePre-CEC Mean
PY Mean
Pre-CEC Mean
PY Mean DiD 90%
Lower CI90%
Upper CIPercent Change
Coordination of Care beyond Dialysis
Percent of Beneficiaries Receiving Flu Vaccinations^
PY1-PY4 61.7% 72.7% 60.1% 66.7% 4.5 *** 3.7 5.2 7.2%PY1 61.7% 62.1% 60.1% 60.2% 0.28 -1.6 2.1 0.45%PY2 61.7% 67.5% 60.1% 62.6% 3.3 *** 2.4 4.3 5.4%PY3 61.7% 68.0% 60.1% 61.7% 4.7 *** 3.7 5.7 7.6%PY4 61.7% 88.2% 60.1% 80.3% 6.2 *** 5.3 7.1 10.1%
Number of Primary Care E/M Office/Outpatient Visits per
1,000 Beneficiaries per Month
PY1-PY5 231.6 218.4 225.0 205.4 6.4 *** 2.4 10.3 2.8%PY1 231.8 230.8 225.0 221.0 2.9 -5.5 11.4 1.3%PY2 231.7 233.0 225.0 214.1 12.1 *** 6.4 17.9 5.2%PY3 231.6 218.3 225.0 207.4 4.3 -0.40 9.0 1.9%PY4 231.5 211.7 225.0 200.5 4.7 * 0.2 9.3 2.1%PY5 231.2 189.5 225.0 176.6 6.7 ** 1.6 11.8 2.9%
Number of Specialty Care E/M Office/Outpatient Visits per
1,000 Beneficiaries per Month
PY1-PY5 434.0 423.7 421.9 413.9 -2.3 -8.7 4.1 -0.53%PY1 434.2 426.0 421.9 423.9 -10.1 -24.2 4.0 -2.3%PY2 434.1 430.2 421.9 417.6 0.50 -7.8 8.8 0.12%PY3 434.0 419.3 421.9 409.9 -2.6 -9.4 4.1 -0.61%PY4 433.9 417.8 421.9 405.2 0.69 -6.4 7.8 0.16%PY5 433.9 416.2 421.9 408.7 -4.5 -13.4 4.3 -1.0%
Percent of Beneficiaries with Greater than 50 mg Average
MME in a Given Month
PY1-PY5 6.2% 4.8% 6.0% 5.0% -0.33 ** -0.60 -0.06 -5.4%PY1 6.2% 5.5% 6.0% 6.2% -0.90 *** -1.4 -0.38 -14.4%PY2 6.2% 5.5% 6.0% 5.7% -0.35 * -0.69 -0.02 -5.8%PY3 6.2% 4.6% 6.0% 4.7% -0.25 -0.54 0.04 -4.1%PY4 6.2% 3.9% 6.0% 4.0% -0.30 -0.61 0.01 -4.9%PY5 6.2% 3.6% 6.0% 3.6% -0.22 -0.56 0.12 -3.6%
Percent of Beneficiaries with Greater than 80% of Days
Covered for Phosphate Binder Prescription in a Given Month
PY1-PY5 34.7% 37.9% 35.2% 35.2% 3.2 *** 2.6 3.9 9.3%PY1 34.7% 37.2% 35.2% 36.5% 1.2 ** 0.20 2.3 3.5%PY2 34.7% 35.7% 35.2% 35.4% 0.80 ** 0.15 1.5 2.3%PY3 34.7% 37.1% 35.2% 35.4% 2.2 *** 1.6 2.9 6.4%PY4 34.7% 38.6% 35.2% 34.2% 4.9 *** 4.1 5.8 14.2%PY5 34.7% 38.6% 35.2% 34.1% 5.0 *** 4.1 6.0 14.5%
Notes: PY1 covers October 2015 - December 2016; PY2 covers January 2017 - December 2017; PY3 covers January 2018 - December 2018; PY4 covers January 2019 – December 2019; and PY5 covers January 2020 - March 2021 (the evaluation includes the first 12 months of PY5, through December 2020). All ESCOs estimates include both waves from October 2015 - December 2020. The estimate of All ESCOs is the combined cumulative impact of CEC, accounting for different lengths of exposure to

Fifth Annual Report – Appendices CEC Evaluation
150
the model. About 19.5% of facilit ies have 21 quarters of CEC participation (October 2015 to December 2020), 40.4% of facilit ies have 16 quarters of CEC participation (January 2017 to December 2020), 30.4% of facilit ies have 12 quarters of CEC participation (January 2018 to December 2020), 8 .1% of facilit ies have 8 quarters of CEC participation (January 2019 to December 2020), and the remaining 1.6% participated in CEC from January 2020 to December 2020 (4 quarters). Each impact estimate is based on a DiD analysis and reflects the difference in the regression -adjusted mean outcome for beneficiaries in CEC facilit ies in the intervention period and pre-CEC period relative to the same difference over time for beneficiaries in matched comparison facilit ies. Significance of the DiD impact estimate is indicated next to each outcome where * implies significance at the 10% level, ** at the 5% level, and *** at the 1% level assuming a two-tailed test. ‡ Data from the pre-CEC period showed intervention and matched comparison facilit ies were not on parallel trends for this outcome, which is required for an unbiased impact estimate. ̂ Includes Wave 1 PY1, PY2, PY3, PY4 Wave 2 PY2, PY3, and PY4 joiners only.

Fifth Annual Report – Appendices CEC Evaluation
151
Exhibit D-28. Impact of the CEC Model on Coordination of Care beyond Dialysis, Wave 1
MeasuresPerformance
Year
CEC Comparison DiD EstimatePre-CEC Mean
PY Mean
Pre-CEC Mean
PY Mean DiD 90%
Lower CI90%
Upper CIPercent Change
Coordination of Care beyond Dialysis
Percent of Beneficiaries Receiving Flu Vaccinations^
PY1-PY4 61.7% 71.8% 60.1% 66.0% 4.3 *** 3.3 5.3 6.9%PY1 61.7% 62.1% 60.1% 60.2% 0.28 -1.6 2.1 0.45%PY2 61.7% 68.2% 60.1% 62.6% 4.0 *** 2.8 5.2 6.5%PY3 61.7% 68.7% 60.1% 61.7% 5.5 *** 4.3 6.7 8.9%PY4 61.7% 87.8% 60.1% 80.3% 5.8 *** 4.7 6.9 9.4%
Number of Primary Care E/M Office/Outpatient Visits per 1,000 Beneficiaries per Month
PY1-PY5 231.6 216.7 225.0 205.8 4.3 -1.7 10.3 1.9%PY1 231.8 230.8 225.0 221.0 2.9 -5.5 11.4 1.3%PY2 231.7 229.2 225.0 213.9 8.6 * 1.0 16.3 3.7%PY3 231.6 213.3 225.0 207.4 -0.71 -7.36 5.9 -0.31%PY4 231.5 208.0 225.0 200.5 1.0 -5.4 7.4 0.44%PY5 231.2 192.8 225.0 176.6 10.0 ** 2.0 18.0 4.3%
Number of Specialty Care E/M Office/Outpatient Visits per 1,000 Beneficiaries per Month
PY1-PY5 434.0 420.1 421.9 414.0 -5.9 -16.2 4.3 -1.4%PY1 434.2 426.0 421.9 423.9 -10.1 -24.2 4.0 -2.3%PY2 434.1 426.5 421.9 417.2 -2.8 -15.0 9.4 -0.64%PY3 434.0 412.0 421.9 409.9 -9.9 -20.6 0.8 -2.3%PY4 433.9 411.0 421.9 405.2 -6.1 -16.7 4.4 -1.4%PY5 433.9 420.4 421.9 408.7 -0.29 -12.4 11.8 -0.07%
Percent of Beneficiaries with Greater than 50 mg Average MME in a Given Month
PY1-PY5 6.2% 4.6% 6.0% 5.0% -0.57 *** -0.93 -0.21 -9.3%PY1 6.2% 5.5% 6.0% 6.2% -0.89 *** -1.4 -0.38 -14.4%PY2 6.2% 5.1% 6.0% 5.6% -0.73 *** -1.17 -0.29 -11.9%PY3 6.2% 4.4% 6.0% 4.7% -0.42 * -0.82 -0.03 -6.9%PY4 6.2% 3.7% 6.0% 4.0% -0.46 * -0.87 -0.06 -7.5%PY5 6.2% 3.4% 6.0% 3.6% -0.43 -0.87 0.00 -7.0%
Percent of Beneficiaries with Greater than 80% of Days Covered for Phosphate Binder Prescription in a Given Month
PY1-PY5 34.7% 37.2% 35.2% 35.3% 2.5 *** 1.6 3.3 7.1%PY1 34.7% 37.2% 35.2% 36.5% 1.2 ** 0.20 2.3 3.5%PY2 34.7% 36.2% 35.2% 35.4% 1.3 ** 0.39 2.2 3.8%PY3 34.7% 37.1% 35.2% 35.4% 2.2 *** 1.2 3.1 6.3%PY4 34.7% 37.5% 35.2% 34.2% 3.8 *** 2.7 5.0 11.0%PY5 34.7% 37.0% 35.2% 34.1% 3.4 *** 2.2 4.7 9.9%
Notes: PY1 covers October 2015 - December 2016; PY2 covers January 2017 - December 2017; PY3 covers January 2018 - December 2018; PY4 covers January 2019 – December 2019; and PY5 covers January 2020 - March 2021 (the evaluation includes the first 12 months of PY5, through December 2020). All ESCOs estimates include both waves from October 2015 - December 2020. The estimate of All ESCOs is the combined cumulative impact of CEC, accounting for different lengths of exposure to the model. About 19.5% of facilit ies have 21 quarters of CEC participation (October 201 5 to December 2020), 40.4% of facilit ies have 16 quarters of CEC participation (January 2017 to December 2020), 30.4% of facilit ies have 12 quarters of CEC participation (January 2018 to December 2020), 8 .1% of facilit ies have 8 quarters of CEC

Fifth Annual Report – Appendices CEC Evaluation
152
participation (January 2019 to December 2020), and the remaining 1.6% participated in CEC from January 2020 to December 2020 (4 quarters). Each impact estimate is based on a DiD analysis and reflects the difference in the regression -adjusted mean outcome for beneficiaries in CEC facilit ies in the intervention period and pre-CEC period relative to the same difference over time for beneficiaries in matched comparison facilit ies. Significance of the DiD impact estimate is indicated next to each outcome where * implies significance at the 10% level, ** at the 5% level, and *** at the 1% level assuming a two-tailed test. ‡ Data from the pre-CEC period showed intervention and matched comparison facilit ies were not on parallel trends for this outcome, which is required for an unbiased impact estimate. ̂ Includes Wave 1 PY1, PY2, PY3, PY4 Wave 2 PY2, PY3, and PY4 joiners only.

Fifth Annual Report – Appendices CEC Evaluation
153
Exhibit D-29. Impact of the CEC Model on Coordination of Care beyond Dialysis, Wave 2
Measures Performance Year
CEC Comparison DiD EstimatePre-CEC Mean
PY Mean
Pre-CEC Mean
PY Mean DiD 90%
Lower CI90%
Upper CIPercent Change
Coordination of Care beyond Dialysis
Percent of Beneficiaries Receiving Flu Vaccinations^
PY2-PY4 61.7% 74.4% 60.1% 68.1% 4.7 *** 3.8 5.6 7.6%PY2 61.7% 66.9% 60.1% 62.6% 2.6 *** 1.4 3.9 4.3%PY3 61.7% 67.4% 60.1% 61.7% 4.2 *** 2.9 5.4 6.7%PY4 61.7% 88.4% 60.1% 80.3% 6.5 *** 5.5 7.5 10.5%
Number of Primary Care E/M Office/Outpatient Visits per 1,000 Beneficiaries per Month
PY2-PY5 222.4 215.0 216.1 200.5 8.1 *** 3.6 12.7 3.7%PY2 222.6 236.4 216.1 214.3 15.6 *** 8.3 22.8 7.0%PY3 222.5 222.1 216.1 207.5 8.1 ** 2.40 13.9 3.7%PY4 222.4 214.4 216.1 200.6 7.4 ** 1.8 13.0 3.3%PY5 222.0 187.1 216.1 176.8 4.31 -1.1 9.7 1.9%
Number of Specialty Care E/M Office/Outpatient Visits per 1,000 Beneficiaries per Month
PY2-PY5 430.6 423.6 418.6 410.5 1.1 -6.1 8.3 0.26%PY2 430.7 433.4 418.6 417.6 3.7 -6.7 14.2 0.86%PY3 430.6 424.8 418.6 410.0 2.9 -4.9 10.6 0.66%PY4 430.5 422.7 418.6 405.2 5.6 -2.8 13.9 1.3%PY5 430.6 413.1 418.6 408.7 -7.6 -17.7 2.5 -1.8%
Percent of Beneficiaries with Greater than 50 mg Average MME in a Given Month
PY2-PY5 6.2% 4.6% 6.0% 4.5% -0.10 -0.40 0.20 -1.6%PY2 6.2% 5.8% 6.0% 5.7% 0.02 -0.37 0.41 0.36%PY3 6.2% 4.7% 6.0% 4.7% -0.12 -0.45 0.21 -1.9%PY4 6.2% 4.0% 6.0% 4.0% -0.18 -0.52 0.15 -3.0%PY5 6.2% 3.7% 6.0% 3.6% -0.07 -0.43 0.30 -1.1%
Percent of Beneficiaries with Greater than 80% of Days Covered for Phosphate Binder Prescription in a Given Month
PY2-PY5 36.2% 38.2% 36.8% 34.8% 4.0 *** 3.2 4.7 10.9%PY2 36.2% 35.2% 36.8% 35.4% 0.27 -0.47 1.0 0.76%PY3 36.2% 37.2% 36.8% 35.4% 2.3 *** 1.5 3.0 6.2%PY4 36.2% 39.4% 36.8% 34.2% 5.7 *** 4.8 6.6 15.8%PY5 36.2% 39.8% 36.8% 34.1% 6.2 *** 5.2 7.3 17.2%
Notes: PY1 covers October 2015 - December 2016; PY2 covers January 2017 - December 2017; PY3 covers January 2018 - December 2018; PY4 covers January 2019 – December 2019; and PY5 covers January 2020 - March 2021 (the evaluation includes the first 12 months of PY5, through December 2020). All ESCOs estimates include both waves from October 2015 - December 2020. The estimate of All ESCOs is the combined cumulative impact of CEC, accounting for different lengths of exposure to the model. About 19.5% of facilit ies have 21 quarters of CEC participation (October 2015 to December 2020), 40.4% of facilit ies have 16 quarters of CEC participation (January 2017 to December 2020), 30.4% of facilit ies have 12 quarters of CEC participation (January 2018 to December 2020), 8 .1% of facilit ies have 8 quarters of CEC participation (January 2019 to December 2020), and the remaining 1.6% participated in CEC from January 2020 to December 2020 (4 quarters). Each impact estimate is based on a DiD analysis and reflects the difference in the regression-adjusted mean outcome for beneficiaries in CEC facilit ies in the intervention period and pre-CEC period relative to the same difference over time for beneficiaries in matched comparison facilit ies. Significance of the DiD impact estimate is indicated next to each outcome where * implies significance at the 10% level, ** at the 5% level, and *** at the 1% level assuming a two-tailed test. ‡ Data from the pre-CEC period showed intervention and matched comparison facilit ies were not on parallel trends for this outcome, which is required for an unbiased impact estimate. ̂ Includes Wave 1 PY1, PY2, PY3, PY4 Wave 2 PY2, PY3, and PY4 joiners only.
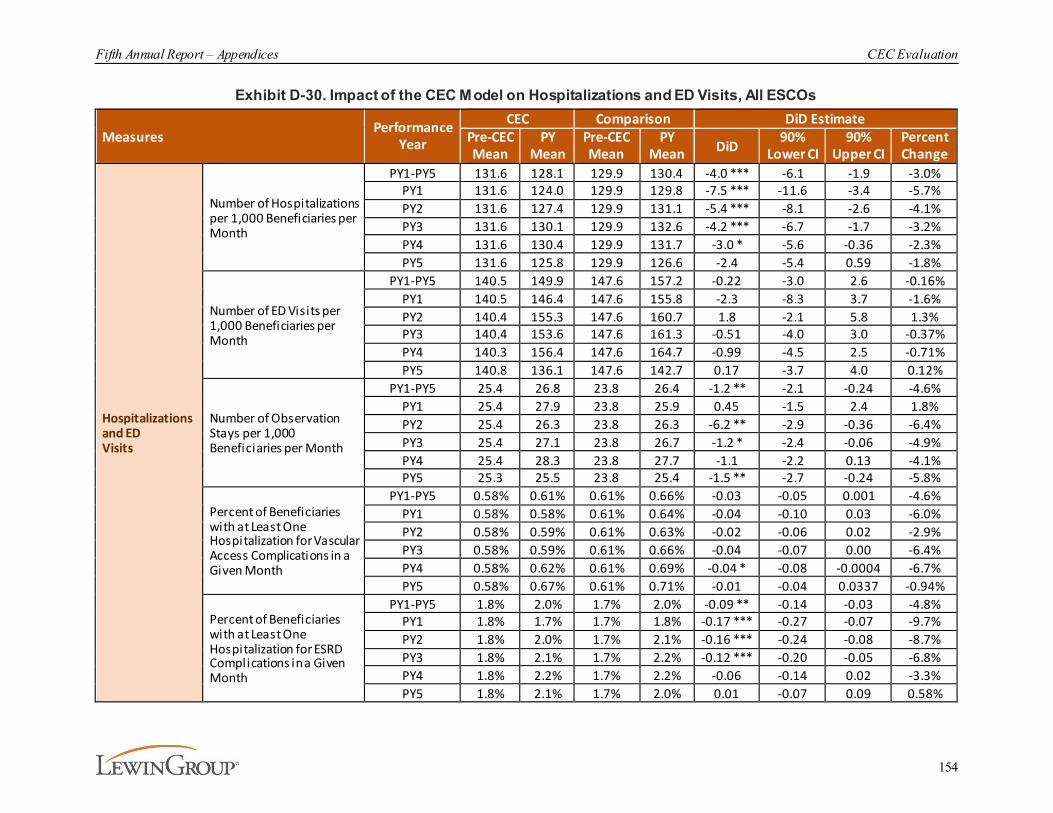
Fifth Annual Report – Appendices CEC Evaluation
154
Exhibit D-30. Impact of the CEC Model on Hospitalizations and ED Visits, All ESCOs
MeasuresPerformance
Year
CEC Comparison DiD EstimatePre-CEC Mean
PY Mean
Pre-CEC Mean
PY Mean DiD
90% Lower CI
90% Upper CI
Percent Change
Hospitalizations and ED Visits
Number of Hospitalizations per 1,000 Beneficiaries per Month
PY1-PY5 131.6 128.1 129.9 130.4 -4.0 *** -6.1 -1.9 -3.0%PY1 131.6 124.0 129.9 129.8 -7.5 *** -11.6 -3.4 -5.7%PY2 131.6 127.4 129.9 131.1 -5.4 *** -8.1 -2.6 -4.1%PY3 131.6 130.1 129.9 132.6 -4.2 *** -6.7 -1.7 -3.2%PY4 131.6 130.4 129.9 131.7 -3.0 * -5.6 -0.36 -2.3%PY5 131.6 125.8 129.9 126.6 -2.4 -5.4 0.59 -1.8%
Number of ED Visits per 1,000 Beneficiaries per Month
PY1-PY5 140.5 149.9 147.6 157.2 -0.22 -3.0 2.6 -0.16%PY1 140.5 146.4 147.6 155.8 -2.3 -8.3 3.7 -1.6%PY2 140.4 155.3 147.6 160.7 1.8 -2.1 5.8 1.3%PY3 140.4 153.6 147.6 161.3 -0.51 -4.0 3.0 -0.37%PY4 140.3 156.4 147.6 164.7 -0.99 -4.5 2.5 -0.71%PY5 140.8 136.1 147.6 142.7 0.17 -3.7 4.0 0.12%
Number of Observation Stays per 1,000 Beneficiaries per Month
PY1-PY5 25.4 26.8 23.8 26.4 -1.2 ** -2.1 -0.24 -4.6%PY1 25.4 27.9 23.8 25.9 0.45 -1.5 2.4 1.8%PY2 25.4 26.3 23.8 26.3 -6.2 ** -2.9 -0.36 -6.4%PY3 25.4 27.1 23.8 26.7 -1.2 * -2.4 -0.06 -4.9%PY4 25.4 28.3 23.8 27.7 -1.1 -2.2 0.13 -4.1%PY5 25.3 25.5 23.8 25.4 -1.5 ** -2.7 -0.24 -5.8%
Percent of Beneficiaries with at Least One Hospitalization for Vascular Access Complications in a Given Month
PY1-PY5 0.58% 0.61% 0.61% 0.66% -0.03 -0.05 0.001 -4.6%PY1 0.58% 0.58% 0.61% 0.64% -0.04 -0.10 0.03 -6.0%PY2 0.58% 0.59% 0.61% 0.63% -0.02 -0.06 0.02 -2.9%PY3 0.58% 0.59% 0.61% 0.66% -0.04 -0.07 0.00 -6.4%PY4 0.58% 0.62% 0.61% 0.69% -0.04 * -0.08 -0.0004 -6.7%PY5 0.58% 0.67% 0.61% 0.71% -0.01 -0.04 0.0337 -0.94%
Percent of Beneficiaries with at Least One Hospitalization for ESRD Complications in a Given Month
PY1-PY5 1.8% 2.0% 1.7% 2.0% -0.09 ** -0.14 -0.03 -4.8%PY1 1.8% 1.7% 1.7% 1.8% -0.17 *** -0.27 -0.07 -9.7%PY2 1.8% 2.0% 1.7% 2.1% -0.16 *** -0.24 -0.08 -8.7%PY3 1.8% 2.1% 1.7% 2.2% -0.12 *** -0.20 -0.05 -6.8%PY4 1.8% 2.2% 1.7% 2.2% -0.06 -0.14 0.02 -3.3%PY5 1.8% 2.1% 1.7% 2.0% 0.01 -0.07 0.09 0.58%

Fifth Annual Report – Appendices CEC Evaluation
155
Measures Performance Year
CEC Comparison DiD EstimatePre-CEC Mean
PY Mean
Pre-CEC Mean
PY Mean DiD 90%
Lower CI90%
Upper CIPercent Change
Hospitalizations and ED Visits (cont.)
Percent of Beneficiaries with at Least One Readmission within 30-days of an IndexHospitalization Stay in a Given Month~
PY1-PY5 29.8% 29.5% 29.6% 29.9% -0.64 ** ‡ -1.1 -0.18 -2.1%PY1 29.8% 28.7% 29.6% 29.4% -0.97 * ‡ -1.8 -0.09 -3.2%PY2 29.8% 29.1% 29.6% 30.0% -1.1 *** ‡ -1.8 -0.46 -3.8%PY3 29.8% 29.5% 29.6% 30.2% -0.90 ** ‡ -1.5 -0.27 -3.0%PY4 29.8% 29.9% 29.6% 30.0% -0.40 ‡ -1.0 0.24 -1.3%PY5 29.8% 30.7% 29.6% 30.3% 0.16 ‡ -0.6 0.97 0.55%
Percent of Beneficiaries with at Least One ED Visit within 30-days of an Acute Hospitalization in a Given Month
PY1-PY5 20.0% 21.5% 20.8% 22.2% 0.12 -0.26 0.49 0.58%PY1 20.0% 21.0% 20.8% 21.7% 0.04 -0.71 0.78 0.18%PY2 20.0% 21.7% 20.8% 22.3% 0.19 -0.37 0.74 0.92%PY3 20.0% 21.8% 20.8% 22.6% -0.05 -0.57 0.48 -0.23%PY4 20.0% 22.2% 20.8% 23.0% -0.01 -0.55 0.53 -0.06%PY5 20.0% 20.9% 20.8% 21.2% 0.49 -0.12 1.11 2.5%
Notes: PY1 covers October 2015 - December 2016; PY2 covers January 2017 - December 2017; PY3 covers January 2018 - December 2018; PY4 covers January 2019 – December 2019; and PY5 covers January 2020 - March 2021 (the evaluation includes the first 12 months of PY5, through December 2020). All ESCOs estimates include both waves from October 2015 - December 2020. The estimate of All ESCOs is the combined cumulative impact of CEC, accounting for different lengths of exposure to the model. About 19.5% of facilit ies have 21 quarters of CEC participation (October 2015 to December 2020), 40.4% of facilit ies have 16 qu arters of CEC participation (January 2017 to December 2020), 30.4% of facilit ies have 12 quarters of CEC participation (January 201 8 to December 2020), 8.1% of facilit ies have 8 quarters of CEC participation (January 2019 to December 2020), and the remaining 1.6% participated in CEC from January 2020 to December 2020 (4 quarters). Each impact estimate is based on a DiD analysis and reflects the difference in the regression-adjusted mean outcome for beneficiaries in CEC facilit ies in the intervention period and pre-CEC period relative to the same difference over time for beneficiaries in matched comparison facilit ies. Significance of the DiD impact estimate is indicated next to each outcome where * implies significance at the 10% level, ** at the 5% level, and *** at the 1% level assuming a two-tailed test. ~ Readmission drops the last quarter of intervention data to account for a lag in claims to prevent an underestimation due to a lack of claims maturity. ‡ Data from the pre -CEC period showed intervention and matched comparison facilit ies were not on parallel trends for this outcome, which is required for an unbiased impact estimate.
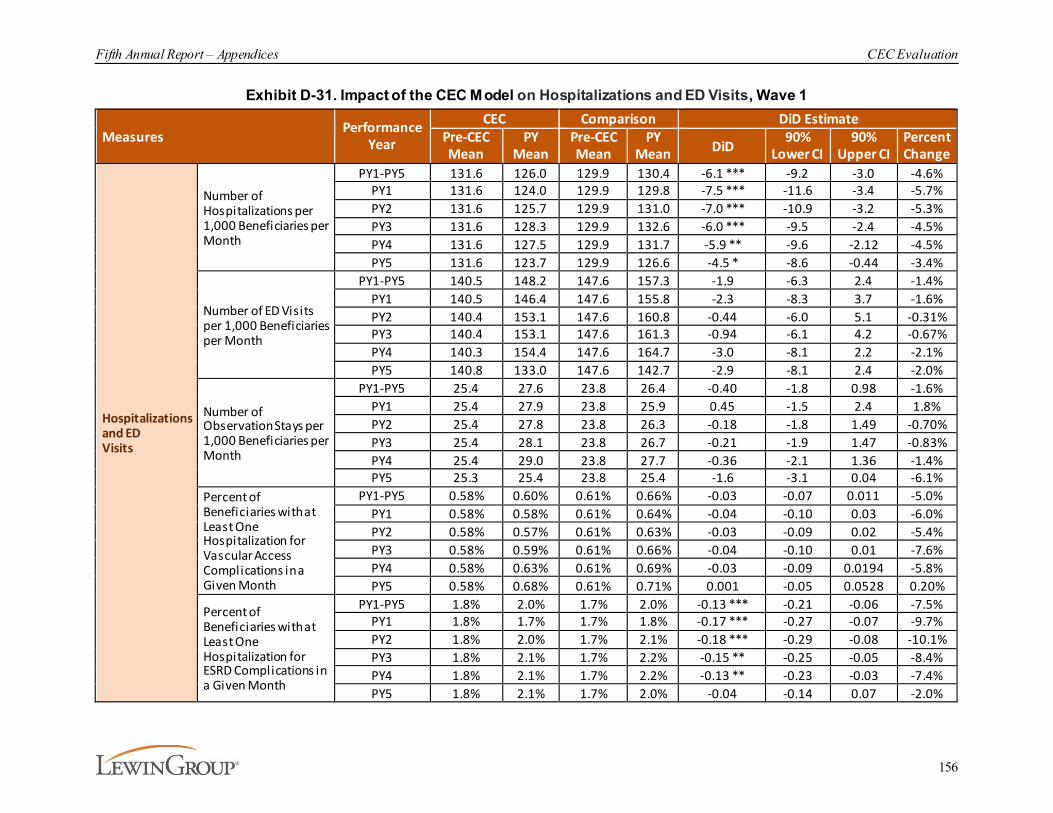
Fifth Annual Report – Appendices CEC Evaluation
156
Exhibit D-31. Impact of the CEC Model on Hospitalizations and ED Visits, Wave 1
MeasuresPerformance
Year
CEC Comparison DiD EstimatePre-CEC Mean
PY Mean
Pre-CEC Mean
PY Mean DiD
90% Lower CI
90% Upper CI
Percent Change
Hospitalizations and ED Visits
Number of Hospitalizations per 1,000 Beneficiaries per Month
PY1-PY5 131.6 126.0 129.9 130.4 -6.1 *** -9.2 -3.0 -4.6%PY1 131.6 124.0 129.9 129.8 -7.5 *** -11.6 -3.4 -5.7%PY2 131.6 125.7 129.9 131.0 -7.0 *** -10.9 -3.2 -5.3%PY3 131.6 128.3 129.9 132.6 -6.0 *** -9.5 -2.4 -4.5%PY4 131.6 127.5 129.9 131.7 -5.9 ** -9.6 -2.12 -4.5%PY5 131.6 123.7 129.9 126.6 -4.5 * -8.6 -0.44 -3.4%
Number of ED Visits per 1,000 Beneficiaries per Month
PY1-PY5 140.5 148.2 147.6 157.3 -1.9 -6.3 2.4 -1.4%PY1 140.5 146.4 147.6 155.8 -2.3 -8.3 3.7 -1.6%PY2 140.4 153.1 147.6 160.8 -0.44 -6.0 5.1 -0.31%PY3 140.4 153.1 147.6 161.3 -0.94 -6.1 4.2 -0.67%PY4 140.3 154.4 147.6 164.7 -3.0 -8.1 2.2 -2.1%PY5 140.8 133.0 147.6 142.7 -2.9 -8.1 2.4 -2.0%
Number of Observation Stays per 1,000 Beneficiaries per Month
PY1-PY5 25.4 27.6 23.8 26.4 -0.40 -1.8 0.98 -1.6%PY1 25.4 27.9 23.8 25.9 0.45 -1.5 2.4 1.8%PY2 25.4 27.8 23.8 26.3 -0.18 -1.8 1.49 -0.70%PY3 25.4 28.1 23.8 26.7 -0.21 -1.9 1.47 -0.83%PY4 25.4 29.0 23.8 27.7 -0.36 -2.1 1.36 -1.4%PY5 25.3 25.4 23.8 25.4 -1.6 -3.1 0.04 -6.1%
Percent of Beneficiaries with at Least One Hospitalization for Vascular Access Complications in a Given Month
PY1-PY5 0.58% 0.60% 0.61% 0.66% -0.03 -0.07 0.011 -5.0%PY1 0.58% 0.58% 0.61% 0.64% -0.04 -0.10 0.03 -6.0%PY2 0.58% 0.57% 0.61% 0.63% -0.03 -0.09 0.02 -5.4%PY3 0.58% 0.59% 0.61% 0.66% -0.04 -0.10 0.01 -7.6%PY4 0.58% 0.63% 0.61% 0.69% -0.03 -0.09 0.0194 -5.8%PY5 0.58% 0.68% 0.61% 0.71% 0.001 -0.05 0.0528 0.20%
Percent of Beneficiaries with at Least One Hospitalization for ESRD Complications in a Given Month
PY1-PY5 1.8% 2.0% 1.7% 2.0% -0.13 *** -0.21 -0.06 -7.5%PY1 1.8% 1.7% 1.7% 1.8% -0.17 *** -0.27 -0.07 -9.7%PY2 1.8% 2.0% 1.7% 2.1% -0.18 *** -0.29 -0.08 -10.1%PY3 1.8% 2.1% 1.7% 2.2% -0.15 ** -0.25 -0.05 -8.4%PY4 1.8% 2.1% 1.7% 2.2% -0.13 ** -0.23 -0.03 -7.4%PY5 1.8% 2.1% 1.7% 2.0% -0.04 -0.14 0.07 -2.0%
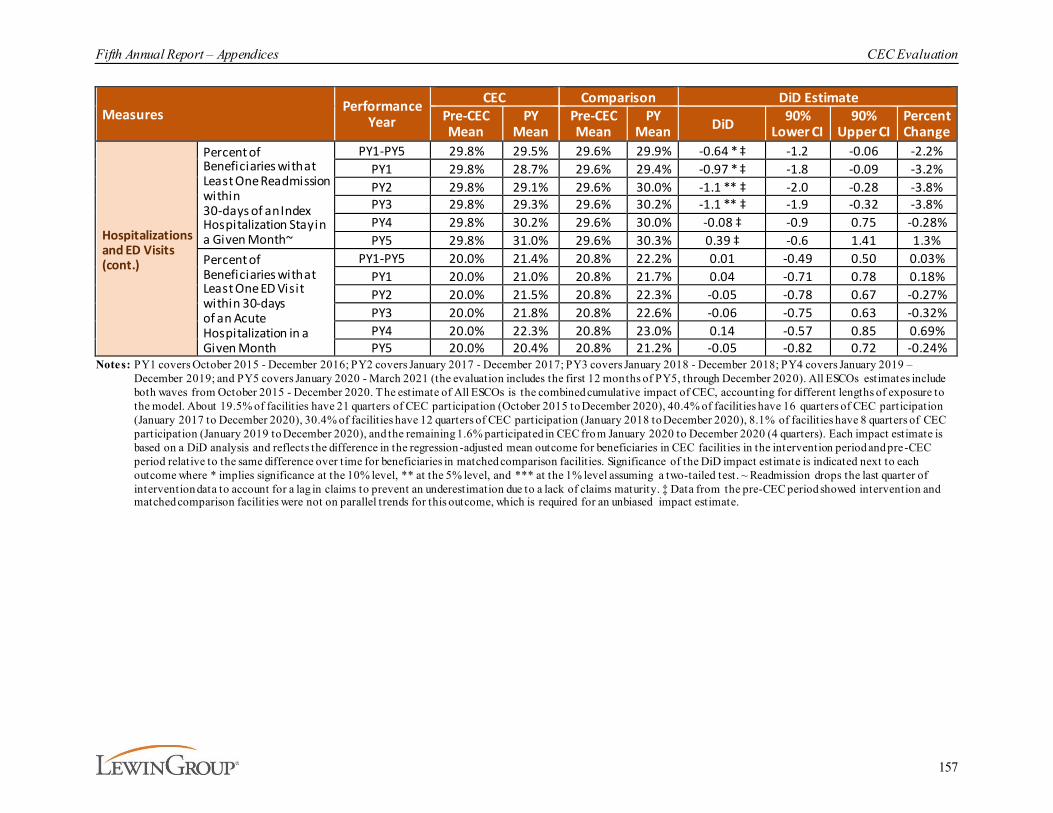
Fifth Annual Report – Appendices CEC Evaluation
157
Measures Performance Year
CEC Comparison DiD EstimatePre-CEC Mean
PY Mean
Pre-CEC Mean
PY Mean DiD 90%
Lower CI90%
Upper CIPercent Change
Hospitalizations and ED Visits (cont.)
Percent of Beneficiaries with at Least One Readmission within 30-days of an Index Hospitalization Stay in a Given Month~
PY1-PY5 29.8% 29.5% 29.6% 29.9% -0.64 * ‡ -1.2 -0.06 -2.2%PY1 29.8% 28.7% 29.6% 29.4% -0.97 * ‡ -1.8 -0.09 -3.2%PY2 29.8% 29.1% 29.6% 30.0% -1.1 ** ‡ -2.0 -0.28 -3.8%PY3 29.8% 29.3% 29.6% 30.2% -1.1 ** ‡ -1.9 -0.32 -3.8%PY4 29.8% 30.2% 29.6% 30.0% -0.08 ‡ -0.9 0.75 -0.28%PY5 29.8% 31.0% 29.6% 30.3% 0.39 ‡ -0.6 1.41 1.3%
Percent of Beneficiaries with at Least One ED Visit within 30-days of an Acute Hospitalization in a Given Month
PY1-PY5 20.0% 21.4% 20.8% 22.2% 0.01 -0.49 0.50 0.03%PY1 20.0% 21.0% 20.8% 21.7% 0.04 -0.71 0.78 0.18%PY2 20.0% 21.5% 20.8% 22.3% -0.05 -0.78 0.67 -0.27%PY3 20.0% 21.8% 20.8% 22.6% -0.06 -0.75 0.63 -0.32%PY4 20.0% 22.3% 20.8% 23.0% 0.14 -0.57 0.85 0.69%PY5 20.0% 20.4% 20.8% 21.2% -0.05 -0.82 0.72 -0.24%
Notes: PY1 covers October 2015 - December 2016; PY2 covers January 2017 - December 2017; PY3 covers January 2018 - December 2018; PY4 covers January 2019 – December 2019; and PY5 covers January 2020 - March 2021 (the evaluation includes the first 12 months of PY5, through December 2020). All ESCOs estimates include both waves from October 2015 - December 2020. The estimate of All ESCOs is the combined cumulative impact of CEC, accounting for different lengths of exposure to the model. About 19.5% of facilit ies have 21 quarters of CEC participation (October 2015 to December 2020), 40.4% of facilit ies have 16 quarters of CEC participation (January 2017 to December 2020), 30.4% of facilit ies have 12 quarters of CEC participation (January 2018 to December 2020), 8.1% of facilit ies have 8 quarters of CEC participation (January 2019 to December 2020), and the remaining 1.6% participated in CEC from January 2020 to December 2020 (4 quarters). Each impact estimate is based on a DiD analysis and reflects the difference in the regression -adjusted mean outcome for beneficiaries in CEC facilit ies in the intervention period and pre-CEC period relative to the same difference over time for beneficiaries in matched comparison facilit ies. Significance of the DiD impact estimate is indicated next to each outcome where * implies significance at the 10% level, ** at the 5% level, and *** at the 1% level assuming a two-tailed test. ~ Readmission drops the last quarter of intervention data to account for a lag in claims to prevent an underestimation due to a lack of claims maturity. ‡ Data from the pre-CEC period showed intervention and matched comparison facilit ies were not on parallel trends for this outcome, which is required for an unbiased impact estimate.

Fifth Annual Report – Appendices CEC Evaluation
158
Exhibit D-32. Impact of the CEC Model on Hospitalizations and ED Visits, Wave 2
MeasuresPerformance
Year
CEC Comparison DiD EstimatePre-CEC Mean
PY Mean
Pre-CEC Mean
PY Mean DiD
90% Lower CI
90% Upper CI
Percent Change
Hospitalizations and ED Visits
Number of Hospitalizations per 1,000 Beneficiaries per Month
PY2-PY5 131.1 130.4 129.5 130.7 -1.9 -4.2 0.4 -1.5%PY2 131.1 129.0 129.5 131.1 -3.7 * -7.0 -0.4 -2.8%PY3 131.2 131.4 129.5 132.6 -2.9 * -5.8 -0.1 -2.2%PY4 131.1 132.5 129.5 131.7 -0.90 -3.8 1.99 -0.69%PY5 131.1 127.4 129.5 126.6 -0.84 -4.1 2.46 -0.64%
Number of ED Visits per 1,000 Beneficiaries per Month
PY2-PY5 150.1 152.1 157.4 158.0 1.4 -1.8 4.6 0.95%PY2 150.0 157.5 157.4 160.9 4.1 -1.0 9.1 2.7%PY3 150.0 153.9 157.4 161.5 -0.20 -4.2 3.8 -0.13%PY4 149.9 157.8 157.4 164.9 0.40 -3.6 4.4 0.27%PY5 150.4 138.3 157.4 142.9 2.4 -1.9 6.8 1.6%
Number of Observation Stays per 1,000 Beneficiaries per Month
PY2-PY5 28.0 26.3 26.3 26.5 -1.9 *** -3.0 -0.81 -6.7%PY2 28.0 25.0 26.3 26.2 -2.9 *** -4.5 -1.38 -10.5%PY3 28.0 26.3 26.3 26.6 -2.0 ** -3.4 -0.62 -7.1%PY4 28.0 27.8 26.3 27.6 -1.5 * -2.9 -0.19 -5.5%PY5 27.9 25.5 26.3 25.3 -1.4 * -2.9 -0.01 -5.1%
Percent of Beneficiaries with at Least One Hospitalization for Vascular Access Complications in a Given Month
PY2-PY5 0.64% 0.62% 0.67% 0.67% -0.02 -0.06 0.008 -3.8%PY2 0.64% 0.60% 0.67% 0.63% -0.003 -0.06 0.05 -0.49%PY3 0.64% 0.60% 0.67% 0.66% -0.03 -0.07 0.01 -5.0%PY4 0.64% 0.62% 0.67% 0.69% -0.04 -0.09 0.0008 -6.6%PY5 0.64% 0.67% 0.67% 0.71% -0.01 -0.05 0.0343 -1.6%
Percent of Beneficiaries with at Least One Hospitalization for ESRD Complications in a Given Month
PY2-PY5 1.9% 2.2% 1.8% 2.1% -0.04 -0.11 0.03 -2.2%PY2 1.9% 2.0% 1.8% 2.1% -0.13 ** -0.23 -0.03 -6.9%PY3 1.9% 2.2% 1.8% 2.2% -0.10 * -0.19 -0.01 -5.4%PY4 1.9% 2.2% 1.8% 2.2% -0.01 -0.10 0.08 -0.44%PY5 1.9% 2.2% 1.8% 2.0% 0.04 -0.05 0.14 2.4%
Percent of Beneficiaries with at Least One Readmission within 30-days of an Index Hospitalization Stay in a Given Month~
PY2-PY5 29.6% 29.7% 29.3% 30.1% -0.63 ** ‡ -1.2 -0.11 -2.1%PY2 29.6% 29.1% 29.3% 30.0% -1.1 ** ‡ -1.9 -0.29 -3.8%PY3 29.6% 29.7% 29.3% 30.2% -0.73 * ‡ -1.5 0.00 -2.5%PY4 29.6% 29.6% 29.3% 30.0% -0.62 ‡ -1.3 0.10 -2.1%PY5 29.6% 30.6% 29.3% 30.3% 0.001 ‡ -0.9 0.91 0.004%
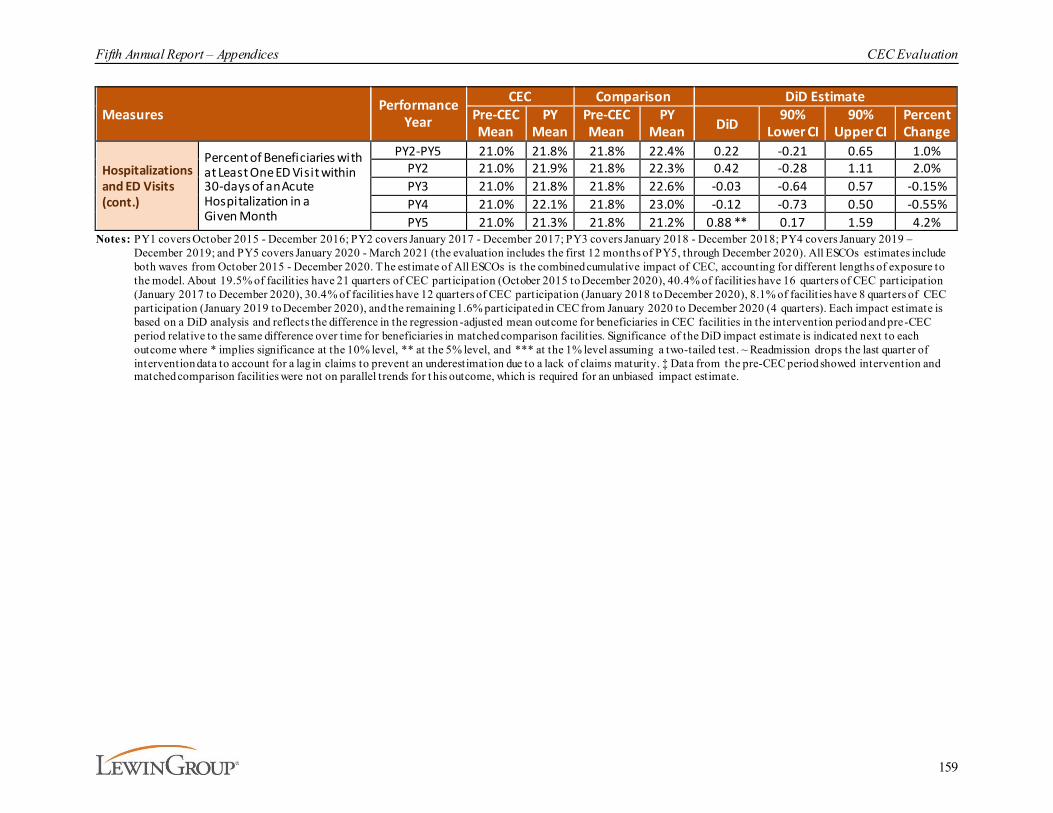
Fifth Annual Report – Appendices CEC Evaluation
159
MeasuresPerformance
Year
CEC Comparison DiD EstimatePre-CEC Mean
PY Mean
Pre-CEC Mean
PY Mean DiD
90% Lower CI
90% Upper CI
Percent Change
Hospitalizations and ED Visits (cont.)
Percent of Beneficiaries with at Least One ED Visit within 30-days of an Acute Hospitalization in a Given Month
PY2-PY5 21.0% 21.8% 21.8% 22.4% 0.22 -0.21 0.65 1.0%PY2 21.0% 21.9% 21.8% 22.3% 0.42 -0.28 1.11 2.0%PY3 21.0% 21.8% 21.8% 22.6% -0.03 -0.64 0.57 -0.15%PY4 21.0% 22.1% 21.8% 23.0% -0.12 -0.73 0.50 -0.55%PY5 21.0% 21.3% 21.8% 21.2% 0.88 ** 0.17 1.59 4.2%
Notes: PY1 covers October 2015 - December 2016; PY2 covers January 2017 - December 2017; PY3 covers January 2018 - December 2018; PY4 covers January 2019 – December 2019; and PY5 covers January 2020 - March 2021 (the evaluation includes the first 12 months of PY5, through December 2020). All ESCOs estimates include both waves from October 2015 - December 2020. The estimate of All ESCOs is the combined cumulative impact of CEC, accounting for different lengths of exposure to the model. About 19.5% of facilit ies have 21 quarters of CEC participation (October 2015 to December 2020), 40.4% of facilit ies have 16 quarters of CEC participation (January 2017 to December 2020), 30.4% of facilit ies have 12 quarters of CEC participation (January 2018 to December 2020), 8.1% of facilit ies have 8 quarters of CEC participation (January 2019 to December 2020), and the remaining 1.6% participated in CEC from January 2020 to December 2020 (4 quarters). Each impact estimate is based on a DiD analysis and reflects the difference in the regression -adjusted mean outcome for beneficiaries in CEC facilit ies in the intervention period and pre-CEC period relative to the same difference over time for beneficiaries in matched comparison facilit ies. Significance of the DiD impact estimate is indicated next to each outcome where * implies significance at the 10% level, ** at the 5% level, and *** at the 1% level assuming a two-tailed test. ~ Readmission drops the last quarter of intervention data to account for a lag in claims to prevent an underestimation due to a lack of claims maturity. ‡ Data from the pre-CEC period showed intervention and matched comparison facilit ies were not on parallel trends for t his outcome, which is required for an unbiased impact estimate.

Fifth Annual Report – Appendices CEC Evaluation
160
Exhibit D-33. Impact of the CEC Model on Medicare Payments across the Continuum of Care, All ESCOs
MeasuresPerformance
Year
CEC Comparison DiD EstimatePre-CEC Mean
PY Mean
Pre-CEC Mean
PY Mean DiD
90% Lower CI
90% Upper CI
Percent Change
Medicare Spending across the Continuum of Care
Total Part A and Part B PBPM
PY1-PY5 $6,358 $6,545 $6,340 $6,612 -$85 *** -$137 -$34 -1.3%PY1 $6,358 $6,236 $6,340 $6,360 -$143 ** -$250 -$36 -2.2%PY2 $6,358 $6,270 $6,340 $6,370 -$118 *** -$185 -$50 -1.9%PY3 $6,358 $6,672 $6,340 $6,721 -$67 * -$129 -$6 -1.1%PY4 $6,358 $6,828 $6,340 $6,877 -$67 * -$129 -$5 -1.1%PY5 $6,358 $6,794 $6,340 $6,853 -$78 * -$145 -$10 -1.2%
Acute Inpatient PBPM
PY1-PY5 $1,649 $1,686 $1,647 $1,735 -$50 *** -$76 -$23 -3.0%PY1 $1,649 $1,618 $1,647 $1,706 -$90 *** -$141 -$38 -5.4%PY2 $1,649 $1,632 $1,647 $1,709 -$79 *** -$114 -$44 -4.8%PY3 $1,649 $1,696 $1,647 $1,737 -$43 ** -$76 -$9 -2.6%PY4 $1,649 $1,729 $1,647 $1,765 -$37 * -$72 -$3 -2.3%PY5 $1,649 $1,734 $1,647 $1,765 -$32 -$73 $8 -2.0%
Readmissions PBPM~
PY1-PY5 $581 $591 $575 $610 -$24 ** -$40 -$8 -4.1%PY1 $580 $556 $575 $597 -$46 ** -$76 -$15 -7.9%PY2 $580 $569 $575 $602 -$37 *** -$59 -$15 -6.4%PY3 $581 $608 $575 $623 -$21 -$42 $1 -3.6%PY4 $581 $610 $575 $627 -$22 * -$44 $0 -3.8%PY5 $581 $603 $575 $604 -$6 -$33 $20 -1.1%
Institutional PAC PBPM
PY1-PY5 $551 $530 $543 $551 -$30 ** -$50 -$10 -5.5%PY1 $551 $526 $543 $555 -$38 -$80 $3 -7.0%PY2 $551 $528 $543 $543 -$23 -$49 $3 -4.2%PY3 $551 $538 $543 $538 -$8 -$32 $15 -1.5%PY4 $551 $539 $543 $558 -$28 * -$52 -$4 -5.0%PY5 $549 $507 $543 $557 -$57 *** -$83 -$31 -10.4%
Home Health PBPM
PY1-PY5 $172 $174 $168 $170 $1 -$4 $6 0.40%PY1 $172 $182 $168 $165 $13 * $1 $25 7.8%PY2 $172 $167 $168 $164 $0 -$7 $7 0.05%PY3 $172 $170 $168 $167 -$1 -$6 $5 -0.40%PY4 $172 $171 $168 $168 $0 -$5 $6 0.01%PY5 $172 $187 $168 $185 -$1 -$8 $6 -0.64%
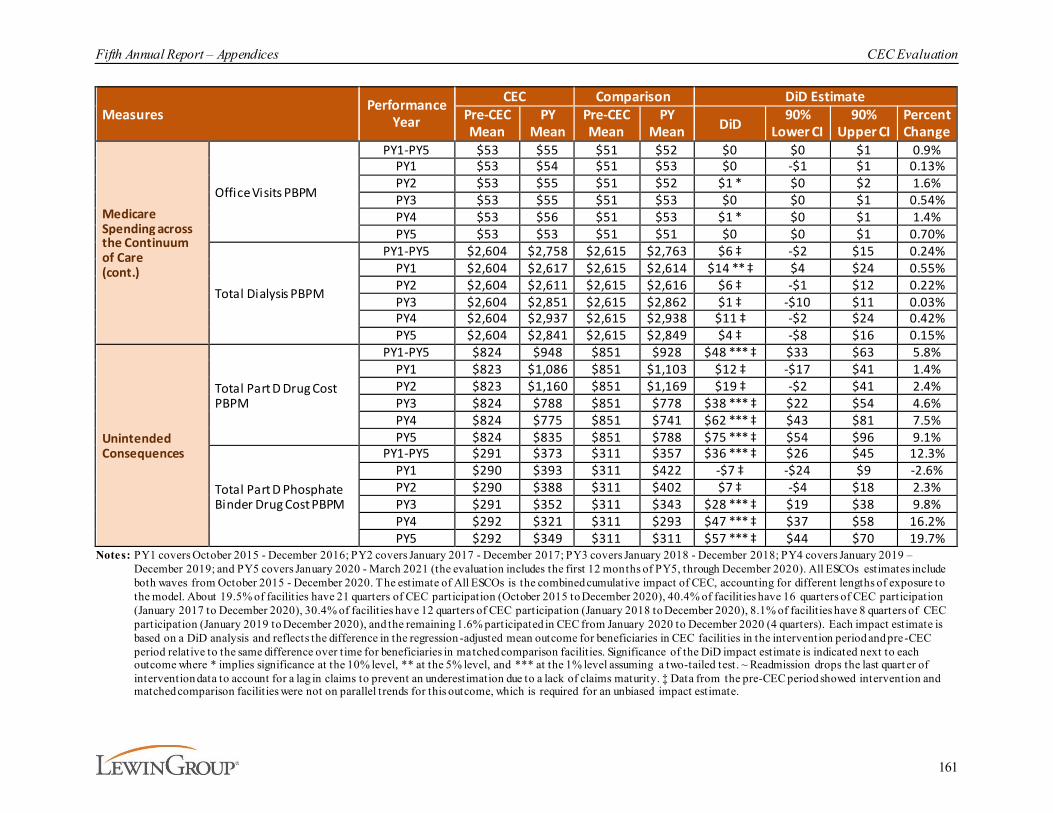
Fifth Annual Report – Appendices CEC Evaluation
161
MeasuresPerformance
Year
CEC Comparison DiD EstimatePre-CEC Mean
PY Mean
Pre-CEC Mean
PY Mean DiD
90% Lower CI
90% Upper CI
Percent Change
Medicare Spending across the Continuum of Care (cont.)
Office Visits PBPM
PY1-PY5 $53 $55 $51 $52 $0 $0 $1 0.9%PY1 $53 $54 $51 $53 $0 -$1 $1 0.13%PY2 $53 $55 $51 $52 $1 * $0 $2 1.6%PY3 $53 $55 $51 $53 $0 $0 $1 0.54%PY4 $53 $56 $51 $53 $1 * $0 $1 1.4%PY5 $53 $53 $51 $51 $0 $0 $1 0.70%
Total Dialysis PBPM
PY1-PY5 $2,604 $2,758 $2,615 $2,763 $6 ‡ -$2 $15 0.24%PY1 $2,604 $2,617 $2,615 $2,614 $14 ** ‡ $4 $24 0.55%PY2 $2,604 $2,611 $2,615 $2,616 $6 ‡ -$1 $12 0.22%PY3 $2,604 $2,851 $2,615 $2,862 $1 ‡ -$10 $11 0.03%PY4 $2,604 $2,937 $2,615 $2,938 $11 ‡ -$2 $24 0.42%PY5 $2,604 $2,841 $2,615 $2,849 $4 ‡ -$8 $16 0.15%
Unintended Consequences
Total Part D Drug Cost PBPM
PY1-PY5 $824 $948 $851 $928 $48 *** ‡ $33 $63 5.8%PY1 $823 $1,086 $851 $1,103 $12 ‡ -$17 $41 1.4%PY2 $823 $1,160 $851 $1,169 $19 ‡ -$2 $41 2.4%PY3 $824 $788 $851 $778 $38 *** ‡ $22 $54 4.6%PY4 $824 $775 $851 $741 $62 *** ‡ $43 $81 7.5%PY5 $824 $835 $851 $788 $75 *** ‡ $54 $96 9.1%
Total Part D Phosphate Binder Drug Cost PBPM
PY1-PY5 $291 $373 $311 $357 $36 *** ‡ $26 $45 12.3%PY1 $290 $393 $311 $422 -$7 ‡ -$24 $9 -2.6%PY2 $290 $388 $311 $402 $7 ‡ -$4 $18 2.3%PY3 $291 $352 $311 $343 $28 *** ‡ $19 $38 9.8%PY4 $292 $321 $311 $293 $47 *** ‡ $37 $58 16.2%PY5 $292 $349 $311 $311 $57 *** ‡ $44 $70 19.7%
Notes: PY1 covers October 2015 - December 2016; PY2 covers January 2017 - December 2017; PY3 covers January 2018 - December 2018; PY4 covers January 2019 – December 2019; and PY5 covers January 2020 - March 2021 (the evaluation includes the first 12 months of PY5, through December 2020). All ESCOs estimates include both waves from October 2015 - December 2020. The estimate of All ESCOs is the combined cumulative impact of CEC, accounting for different lengths of exposure to the model. About 19.5% of facilit ies have 21 quarters of CEC participation (October 2015 to December 2020), 40.4% of facilit ies have 16 quarters of CEC participation (January 2017 to December 2020), 30.4% of facilit ies have 12 quarters of CEC participation (January 2018 to December 2020), 8.1% of facilit ies have 8 quarters of CEC participation (January 2019 to December 2020), and the remaining 1.6% participated in CEC from January 2020 to December 2020 (4 quarters). Each impact estimate is based on a DiD analysis and reflects the difference in the regression -adjusted mean outcome for beneficiaries in CEC facilit ies in the intervention period and pre-CEC period relative to the same difference over time for beneficiaries in matched comparison facilit ies. Significance of the DiD impact estimate is indicated next to each outcome where * implies significance at the 10% level, ** at the 5% level, and *** at the 1% level assuming a two-tailed test. ~ Readmission drops the last quart er of intervention data to account for a lag in claims to prevent an underestimation due to a lack of claims maturity. ‡ Data from the pre-CEC period showed intervention and matched comparison facilit ies were not on parallel trends for this outcome, which is required for an unbiased impact estimate.
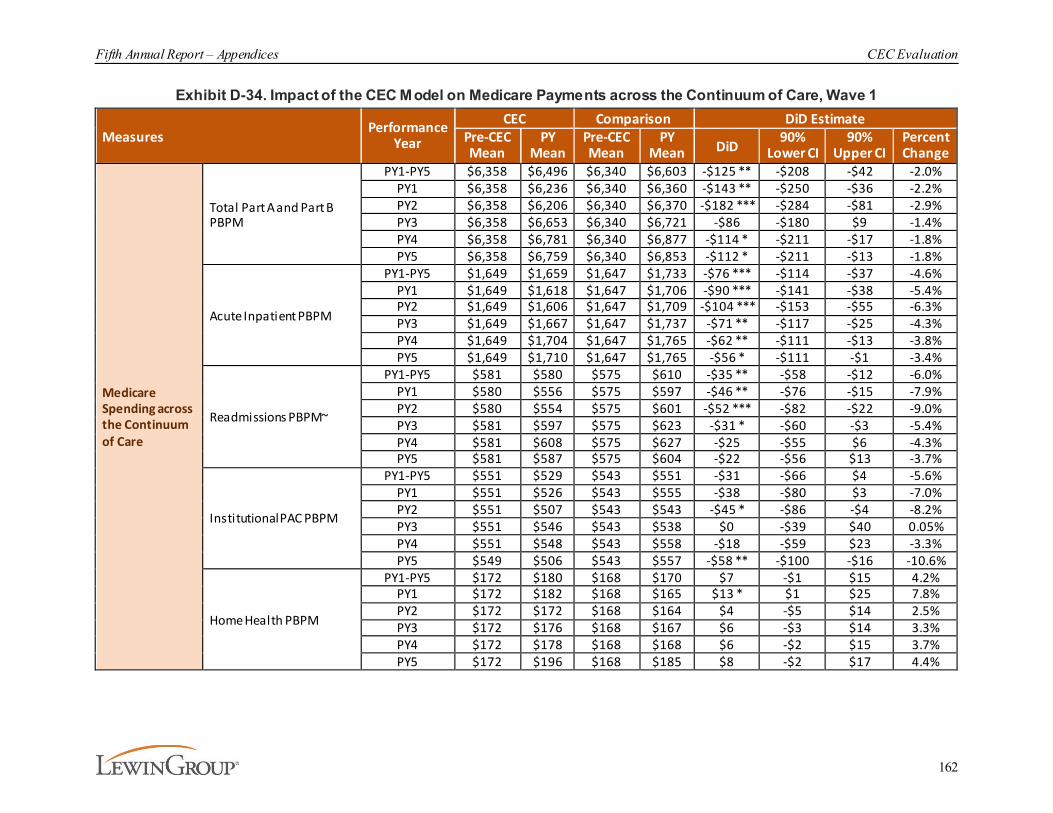
Fifth Annual Report – Appendices CEC Evaluation
162
Exhibit D-34. Impact of the CEC Model on Medicare Payments across the Continuum of Care, Wave 1
MeasuresPerformance
Year
CEC Comparison DiD EstimatePre-CEC Mean
PY Mean
Pre-CEC Mean
PY Mean DiD
90% Lower CI
90% Upper CI
Percent Change
Medicare Spending across the Continuum of Care
Total Part A and Part B PBPM
PY1-PY5 $6,358 $6,496 $6,340 $6,603 -$125 ** -$208 -$42 -2.0%PY1 $6,358 $6,236 $6,340 $6,360 -$143 ** -$250 -$36 -2.2%PY2 $6,358 $6,206 $6,340 $6,370 -$182 *** -$284 -$81 -2.9%PY3 $6,358 $6,653 $6,340 $6,721 -$86 -$180 $9 -1.4%PY4 $6,358 $6,781 $6,340 $6,877 -$114 * -$211 -$17 -1.8%PY5 $6,358 $6,759 $6,340 $6,853 -$112 * -$211 -$13 -1.8%
Acute Inpatient PBPM
PY1-PY5 $1,649 $1,659 $1,647 $1,733 -$76 *** -$114 -$37 -4.6%PY1 $1,649 $1,618 $1,647 $1,706 -$90 *** -$141 -$38 -5.4%PY2 $1,649 $1,606 $1,647 $1,709 -$104 *** -$153 -$55 -6.3%PY3 $1,649 $1,667 $1,647 $1,737 -$71 ** -$117 -$25 -4.3%PY4 $1,649 $1,704 $1,647 $1,765 -$62 ** -$111 -$13 -3.8%PY5 $1,649 $1,710 $1,647 $1,765 -$56 * -$111 -$1 -3.4%
Readmissions PBPM~
PY1-PY5 $581 $580 $575 $610 -$35 ** -$58 -$12 -6.0%PY1 $580 $556 $575 $597 -$46 ** -$76 -$15 -7.9%PY2 $580 $554 $575 $601 -$52 *** -$82 -$22 -9.0%PY3 $581 $597 $575 $623 -$31 * -$60 -$3 -5.4%PY4 $581 $608 $575 $627 -$25 -$55 $6 -4.3%PY5 $581 $587 $575 $604 -$22 -$56 $13 -3.7%
Institutional PAC PBPM
PY1-PY5 $551 $529 $543 $551 -$31 -$66 $4 -5.6%PY1 $551 $526 $543 $555 -$38 -$80 $3 -7.0%PY2 $551 $507 $543 $543 -$45 * -$86 -$4 -8.2%PY3 $551 $546 $543 $538 $0 -$39 $40 0.05%PY4 $551 $548 $543 $558 -$18 -$59 $23 -3.3%PY5 $549 $506 $543 $557 -$58 ** -$100 -$16 -10.6%
Home Health PBPM
PY1-PY5 $172 $180 $168 $170 $7 -$1 $15 4.2%PY1 $172 $182 $168 $165 $13 * $1 $25 7.8%PY2 $172 $172 $168 $164 $4 -$5 $14 2.5%PY3 $172 $176 $168 $167 $6 -$3 $14 3.3%PY4 $172 $178 $168 $168 $6 -$2 $15 3.7%PY5 $172 $196 $168 $185 $8 -$2 $17 4.4%
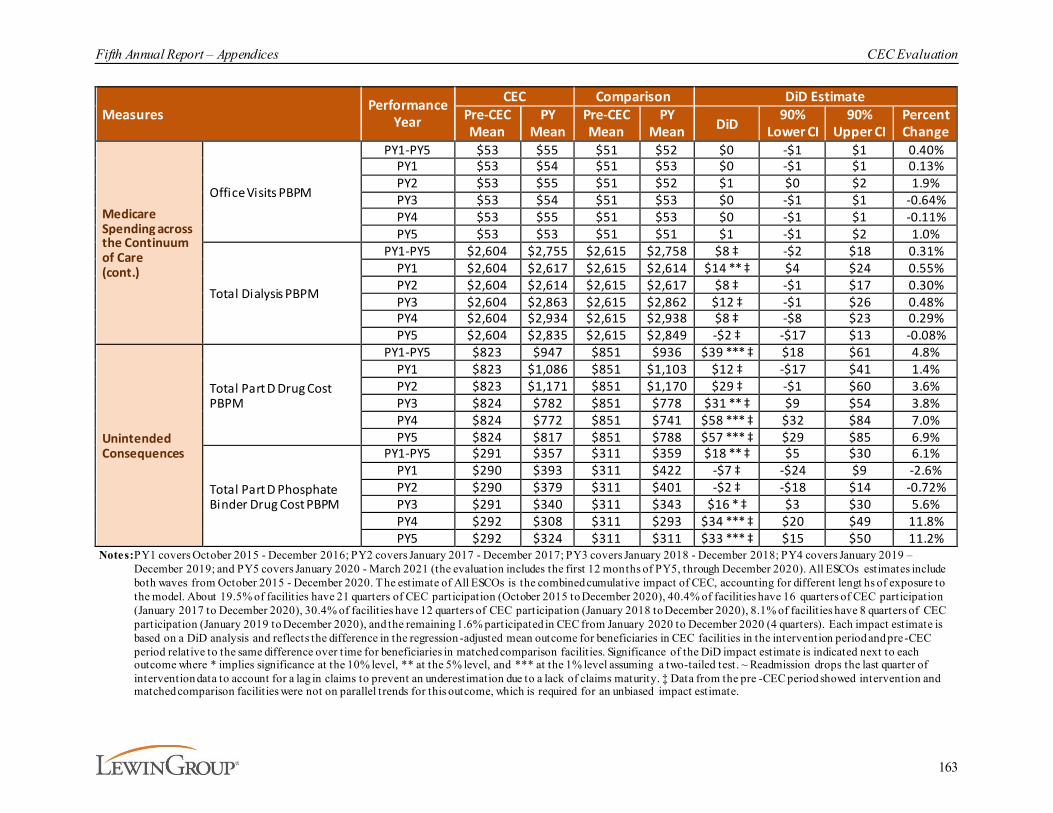
Fifth Annual Report – Appendices CEC Evaluation
163
MeasuresPerformance
Year
CEC Comparison DiD EstimatePre-CEC Mean
PY Mean
Pre-CEC Mean
PY Mean DiD
90% Lower CI
90% Upper CI
Percent Change
Medicare Spending across the Continuum of Care (cont.)
Office Visits PBPM
PY1-PY5 $53 $55 $51 $52 $0 -$1 $1 0.40%PY1 $53 $54 $51 $53 $0 -$1 $1 0.13%PY2 $53 $55 $51 $52 $1 $0 $2 1.9%PY3 $53 $54 $51 $53 $0 -$1 $1 -0.64%PY4 $53 $55 $51 $53 $0 -$1 $1 -0.11%PY5 $53 $53 $51 $51 $1 -$1 $2 1.0%
Total Dialysis PBPM
PY1-PY5 $2,604 $2,755 $2,615 $2,758 $8 ‡ -$2 $18 0.31%PY1 $2,604 $2,617 $2,615 $2,614 $14 ** ‡ $4 $24 0.55%PY2 $2,604 $2,614 $2,615 $2,617 $8 ‡ -$1 $17 0.30%PY3 $2,604 $2,863 $2,615 $2,862 $12 ‡ -$1 $26 0.48%PY4 $2,604 $2,934 $2,615 $2,938 $8 ‡ -$8 $23 0.29%PY5 $2,604 $2,835 $2,615 $2,849 -$2 ‡ -$17 $13 -0.08%
Unintended Consequences
Total Part D Drug Cost PBPM
PY1-PY5 $823 $947 $851 $936 $39 *** ‡ $18 $61 4.8%PY1 $823 $1,086 $851 $1,103 $12 ‡ -$17 $41 1.4%PY2 $823 $1,171 $851 $1,170 $29 ‡ -$1 $60 3.6%PY3 $824 $782 $851 $778 $31 ** ‡ $9 $54 3.8%PY4 $824 $772 $851 $741 $58 *** ‡ $32 $84 7.0%PY5 $824 $817 $851 $788 $57 *** ‡ $29 $85 6.9%
Total Part D Phosphate Binder Drug Cost PBPM
PY1-PY5 $291 $357 $311 $359 $18 ** ‡ $5 $30 6.1%PY1 $290 $393 $311 $422 -$7 ‡ -$24 $9 -2.6%PY2 $290 $379 $311 $401 -$2 ‡ -$18 $14 -0.72%PY3 $291 $340 $311 $343 $16 * ‡ $3 $30 5.6%PY4 $292 $308 $311 $293 $34 *** ‡ $20 $49 11.8%PY5 $292 $324 $311 $311 $33 *** ‡ $15 $50 11.2%
Notes:PY1 covers October 2015 - December 2016; PY2 covers January 2017 - December 2017; PY3 covers January 2018 - December 2018; PY4 covers January 2019 – December 2019; and PY5 covers January 2020 - March 2021 (the evaluation includes the first 12 months of PY5, through December 2020). All ESCOs estimates include both waves from October 2015 - December 2020. The estimate of All ESCOs is the combined cumulative impact of CEC, accounting for different lengt hs of exposure to the model. About 19.5% of facilit ies have 21 quarters of CEC participation (October 2015 to December 2020), 40.4% of facilit ies have 16 quarters of CEC participation (January 2017 to December 2020), 30.4% of facilit ies have 12 quarters of CEC participation (January 2018 to December 2020), 8.1% of facilit ies have 8 quarters of CEC participation (January 2019 to December 2020), and the remaining 1.6% participated in CEC from January 2020 to December 2020 (4 quarters). Each impact estimate is based on a DiD analysis and reflects the difference in the regression -adjusted mean outcome for beneficiaries in CEC facilit ies in the intervention period and pre-CEC period relative to the same difference over time for beneficiaries in matched comparison facilit ies. Significance of the DiD impact estimate is indicated next to each outcome where * implies significance at the 10% level, ** at the 5% level, and *** at the 1% level assuming a two-tailed test. ~ Readmission drops the last quarter of intervention data to account for a lag in claims to prevent an underestimation due to a lack of claims maturity. ‡ Data from the pre -CEC period showed intervention and matched comparison facilit ies were not on parallel trends for this outcome, which is required for an unbiased impact estimate.
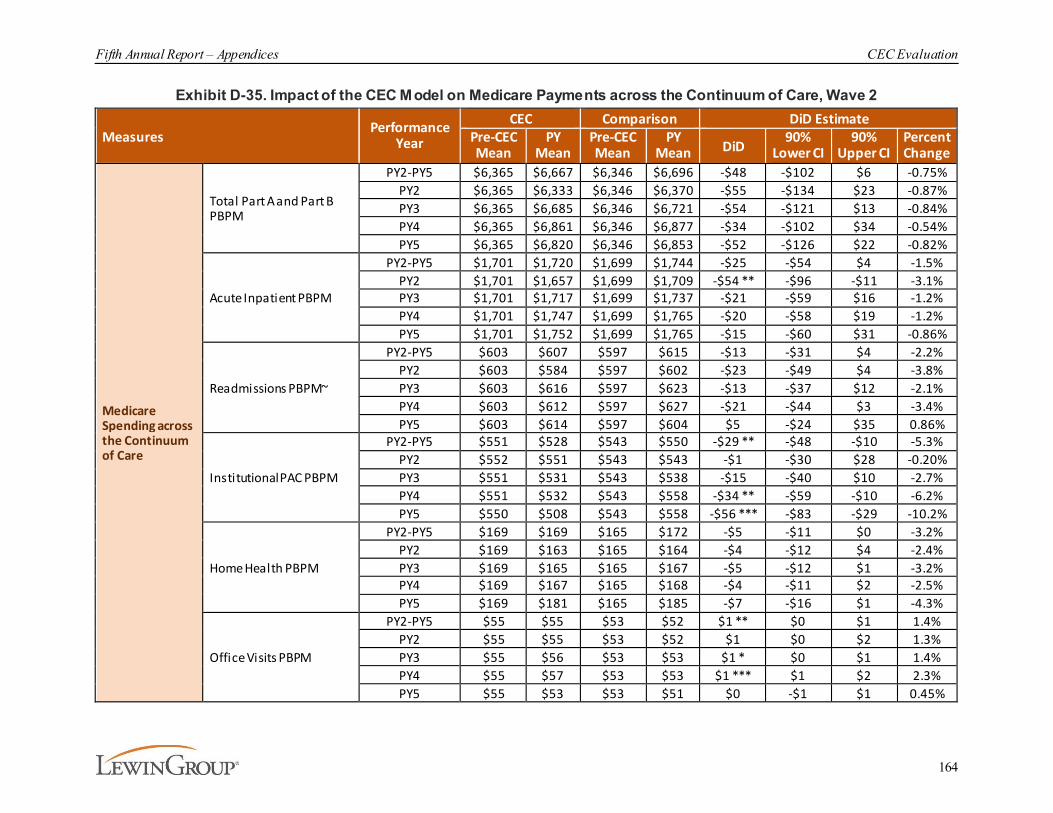
Fifth Annual Report – Appendices CEC Evaluation
164
Exhibit D-35. Impact of the CEC Model on Medicare Payments across the Continuum of Care, Wave 2
MeasuresPerformance
Year
CEC Comparison DiD EstimatePre-CEC Mean
PY Mean
Pre-CEC Mean
PY Mean DiD
90% Lower CI
90% Upper CI
Percent Change
Medicare Spending across the Continuum of Care
Total Part A and Part B PBPM
PY2-PY5 $6,365 $6,667 $6,346 $6,696 -$48 -$102 $6 -0.75%PY2 $6,365 $6,333 $6,346 $6,370 -$55 -$134 $23 -0.87%PY3 $6,365 $6,685 $6,346 $6,721 -$54 -$121 $13 -0.84%PY4 $6,365 $6,861 $6,346 $6,877 -$34 -$102 $34 -0.54%PY5 $6,365 $6,820 $6,346 $6,853 -$52 -$126 $22 -0.82%
Acute Inpatient PBPM
PY2-PY5 $1,701 $1,720 $1,699 $1,744 -$25 -$54 $4 -1.5%PY2 $1,701 $1,657 $1,699 $1,709 -$54 ** -$96 -$11 -3.1%PY3 $1,701 $1,717 $1,699 $1,737 -$21 -$59 $16 -1.2%PY4 $1,701 $1,747 $1,699 $1,765 -$20 -$58 $19 -1.2%PY5 $1,701 $1,752 $1,699 $1,765 -$15 -$60 $31 -0.86%
Readmissions PBPM~
PY2-PY5 $603 $607 $597 $615 -$13 -$31 $4 -2.2%PY2 $603 $584 $597 $602 -$23 -$49 $4 -3.8%PY3 $603 $616 $597 $623 -$13 -$37 $12 -2.1%PY4 $603 $612 $597 $627 -$21 -$44 $3 -3.4%PY5 $603 $614 $597 $604 $5 -$24 $35 0.86%
Institutional PAC PBPM
PY2-PY5 $551 $528 $543 $550 -$29 ** -$48 -$10 -5.3%PY2 $552 $551 $543 $543 -$1 -$30 $28 -0.20%PY3 $551 $531 $543 $538 -$15 -$40 $10 -2.7%PY4 $551 $532 $543 $558 -$34 ** -$59 -$10 -6.2%PY5 $550 $508 $543 $558 -$56 *** -$83 -$29 -10.2%
Home Health PBPM
PY2-PY5 $169 $169 $165 $172 -$5 -$11 $0 -3.2%PY2 $169 $163 $165 $164 -$4 -$12 $4 -2.4%PY3 $169 $165 $165 $167 -$5 -$12 $1 -3.2%PY4 $169 $167 $165 $168 -$4 -$11 $2 -2.5%PY5 $169 $181 $165 $185 -$7 -$16 $1 -4.3%
Office Visits PBPM
PY2-PY5 $55 $55 $53 $52 $1 ** $0 $1 1.4%PY2 $55 $55 $53 $52 $1 $0 $2 1.3%PY3 $55 $56 $53 $53 $1 * $0 $1 1.4%PY4 $55 $57 $53 $53 $1 *** $1 $2 2.3%PY5 $55 $53 $53 $51 $0 -$1 $1 0.45%

Fifth Annual Report – Appendices CEC Evaluation
165
MeasuresPerformance
Year
CEC Comparison DiD EstimatePre-CEC Mean
PY Mean
Pre-CEC Mean
PY Mean DiD
90% Lower CI
90% Upper CI
Percent Change
Medicare Spending across the Continuum of Care (cont.)
Total Dialysis PBPM
PY2-PY5 $2,612 $2,806 $2,623 $2,813 $5 ‡ -$6 $15 0.17%PY2 $2,612 $2,609 $2,623 $2,616 $4 ‡ -$4 $12 0.15%PY3 $2,612 $2,842 $2,623 $2,862 -$8 ‡ -$20 $4 -0.30%PY4 $2,612 $2,940 $2,623 $2,938 $14 ‡ -$2 $29 0.52%PY5 $2,612 $2,845 $2,623 $2,849 $8 ‡ -$6 $22 0.31%
Unintended Consequences
Total Part D Drug Cost PBPM
PY2-PY5 $1,131 $901 $1,159 $873 $56 *** ‡ $40 $73 5.0%PY2 $1,130 $1,150 $1,159 $1,169 $9 ‡ -$16 $35 0.82%PY3 $1,131 $794 $1,159 $778 $43 *** ‡ $25 $61 3.8%PY4 $1,131 $778 $1,159 $741 $65 *** ‡ $45 $84 5.7%PY5 $1,131 $849 $1,159 $788 $88 *** ‡ $66 $111 7.8%
Total Part D Phosphate Binder Drug Cost PBPM
PY2-PY5 $414 $369 $435 $339 $52 *** ‡ $41 $62 12.5%PY2 $413 $397 $435 $403 $16 * ‡ $2 $29 3.8%PY3 $414 $361 $435 $344 $38 *** ‡ $27 $49 9.1%PY4 $414 $331 $435 $294 $57 *** ‡ $45 $69 13.7%PY5 $414 $368 $435 $312 $77 *** ‡ $61 $92 18.5%
Notes: PY1 covers October 2015 - December 2016; PY2 covers January 2017 - December 2017; PY3 covers January 2018 - December 2018; PY4 covers January 2019 – December 2019; and PY5 covers January 2020 - March 2021 (the evaluation includes the first 12 months of PY5, through December 2020). All ESCOs estimates include both waves from October 2015 - December 2020. The estimate of All ESCOs is the combined cumulative impact of CEC, accounting for different lengths of exposure to the model. About 19.5% of facilit ies have 21 quarters of CEC participation (October 2015 to December 2020), 40.4% of facilit ies have 16 quarters of CEC participation (January 2017 to December 2020), 30.4% of facilit ies have 12 quarters of CEC participation (January 2018 to December 2020), 8.1% of facilit ies have 8 quarters of CEC participation (January 2019 to December 2020), and the remaining 1.6% participated in CEC from January 2020 to December 2020 (4 quarters). Each impact estimate is based on a DiD analysis and reflects the difference in the regression -adjusted mean outcome for beneficiaries in CEC facilit ies in the intervention period and pre-CEC period relative to the same difference over time for beneficiaries in matched comparison facilit ies. Significance of the DiD impact estimate is indicated next to each outcome where * implies significance at the 10% level, ** at the 5% level, and *** at the 1% level assuming a two-tailed test. ~ Readmission drops the last quarter of intervention data to account for a lag in claims to prevent an underestimation due to a lack of claims maturity. ‡ Data from the pre-CEC period showed intervention and matched comparison facilit ies were not on parallel trends for t his outcome, which is required for an unbiased impact estimate.
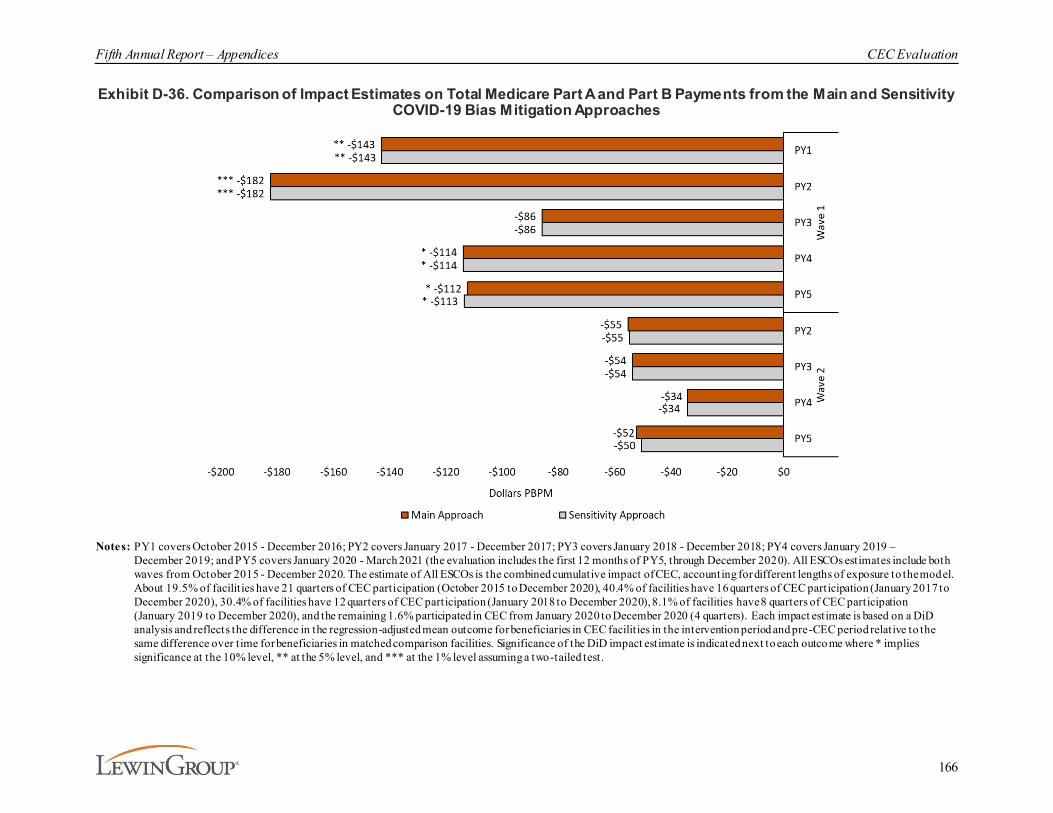
Fifth Annual Report – Appendices CEC Evaluation
166
Exhibit D-36. Comparison of Impact Estimates on Total Medicare Part A and Part B Payments from the Main and Sensitivity COVID-19 Bias Mitigation Approaches
Notes: PY1 covers October 2015 - December 2016; PY2 covers January 2017 - December 2017; PY3 covers January 2018 - December 2018; PY4 covers January 2019 – December 2019; and PY5 covers January 2020 - March 2021 (the evaluation includes the first 12 months of PY5, through December 2020). All ESCOs estimates include both waves from October 2015 - December 2020. The estimate of All ESCOs is the combined cumulative impact of CEC, accounting for different lengths of exposure to the model. About 19.5% of facilit ies have 21 quarters of CEC participation (October 2015 to December 2020), 40.4% of facilities have 16 quarters of CEC participation (January 2017 to December 2020), 30.4% of facilities have 12 quarters of CEC participation (January 2018 to December 2020), 8.1% of facilities have 8 quarters of CEC participation (January 2019 to December 2020), and the remaining 1.6% participated in CEC from January 2020 to December 2020 (4 quarters). Each impact estimate is based on a DiD analysis and reflects the difference in the regression-adjusted mean outcome for beneficiaries in CEC facilit ies in the intervention period and pre-CEC period relative to the same difference over time for beneficiaries in matched comparison facilities. Significance of the DiD impact estimate is indicated next to each outcome where * implies significance at the 10% level, ** at the 5% level, and *** at the 1% level assuming a two-tailed test.

Fifth Annual Report – Appendices CEC Evaluation
167
Historic use of preventative care varies across location and the year the facility joined the model. CEC beneficiaries aligned to facilities in metropolitan areas had similar historic rates of primary care E/M visits across cohort. The number of visits in non-metropolitan areas fluctuated across joining years. Overall, beneficiaries had a greater number of specialty care E/M visits compared to primary care. The rate of specialty care visits was greater among beneficiaries in metropolitan areas.
Exhibit D-37. Use of Preventive Care by Facility Location
Characteristic Facility Location
Wave 1 Wave 2PY1
Joiner (N=206)
PY2 Joiner (N=79)
PY3 Joiner (N=68)
PY4 Joiner (N=27)
PY5 Joiner (N=3)
PY2 Joiner
(N=347)
PY3 Joiner
(N=252)
PY4 Joiner (N=58)
PY5 Joiner (N=14)
Primary Care E/M Visits PBPM (2014)
Metropolitan 0.25 0.25 0.22 0.23 0.21 0.24 0.24 0.23 0.25Non-metropolitan 0.25 0.27 0.14 0.12 0.20 0.24 0.23 0.20 0.40
Specialty Care E/M Visits PBPM (2014)
Metropolitan 0.45 0.44 0.44 0.48 0.63 0.43 0.44 0.47 0.42Non-metropolitan 0.38 0.43 0.31 0.42 0.41 0.39 0.39 0.30 0.47
Note: Reported means and distributions are based on CEC facilit ies included in the analytic sample.

Fifth Annual Report – Appendices CEC Evaluation
168
Appendix E: Power Calculation MethodologyIn this section, we describe our power calculation methodology and our findings concerning the ability of our model to detect changes in Medicare payments. Power calculations provide essential information for researchers to determine the smallest detectable difference, with a given sample size, in the average of the outcome variable between treatment and control groups. An equally important consideration in study designs is to control the type 1 error, which is the probability of falsely rejecting the null hypothesis when it is in fact true, or, in other words, claiming treatment efficacy when in fact it does not exist. We set an acceptable level of type 1 error to be 0.1, and computed power under this specification.
To compute power, we used a STATA user command called “clsampsi,” developed by Batistatou et al. (2014).129 The authors use a formula based on a non-central F distribution as described by Moser et al. (1989).130
Here, δ denotes various effect sizes for potential predicted savings, ρt and ρc are intra-cluster correlation coefficients (ICCs), -which measure how related the clustered observations are,-for the treatment and control group, respectively. Clustered practices are standard in DiD designs.131
Furthermore, we also considered how the fit of an estimation would impact power by adjusting the
variance and ICC factors using an assumed R2 of 0.3.132 The term corresponds to the variation in the size of clusters which has been shown by Guittet et al. to heavily influence power when there is large variation.133 Additionally, refers to the average number of individuals per cluster. Finally,
, Nt, , and Nc, are the variance outcome and the total sample size for each trial arm (t: treatment, c: control), and zα is the one-tail z statistic. Combining these factors, we were able to generate two terms commonly referred to as the design effect.
We calculate values of the factors discussed above for the outcome variable ‘Medicare payments’ using the matched beneficiary data. A key component of Equation 1 is the ICC, which depends on how observations are clustered. For each group, we cluster observations by their aligned facility to identify individual beneficiary observations. Specifically, we cluster by aligned ESCO and comparison facilities identified in the matched sets, which corresponds to 2,108 clusters units. As a result, the power calculations do not take into consideration the
129 Batistatou, E., Roberts, C., Roberts, S. (2014). Sample size and power calculations for trials and quasi-
experimental studies with clustering. Stata Journal, 14(1):159-75.130 Moser, B.K., Stevens, G.R., Watts, C.L. (1989). The two-sample t test versus Satterthwaite's approximate F test.
Communications in Statistics - Theory and Methods, 18(11):3963-3975.131 Bertrand, M., Duflo, E., Mullainathan, S. (2004). How much should we trust differences-in-differences
estimates? Quarterly Journal of Economics, 119(1):249-75.132 The R2 value provides an indication of how well the covariates of regression estimate the outcome of interest .
Thus, the greater the value of R2 the lower the necessary sample size needed to reach a desired level of power. 133 Guittet, L., Ravaud, P., Giraudeau, B. (2006). Planning a cluster randomized trial with unequal cluster sizes:
Practical issues involving continuous outcomes. BMC Medical Research, 6(1):17.

Fifth Annual Report – Appendices CEC Evaluation
169
repeated nature of the data, which would only improve power if all other calculations and assumptions were maintained.
For AR5, the number of dialysis facilities and patients provides reasonable confidence that the analysis will detect modest impacts on Medicare service use and costs for all beneficiaries. Specifically, the combined PY1-PY5 estimates of power using one-tailed tests at the 10% significance level and adjustments for goodness of fit from the regression models imply that the evaluation has 80% power to detect impacts on standardized Medicare payments of 1% or more.
Fifth Annual Report – Appendices CEC Evaluation
170
Appendix F: Beneficiary Focus Group MethodologyBetween August 2016 and December 2019, we conducted focus groups with beneficiaries aligned to the CEC Model to assess the impact of the model on their experience of dialysis. Specifically, the research objectives were to:
¡ Obtain insight into beneficiaries’ care experience, including:
· Perceptions of the dialysis facility,
· Communications with dialysis facility staff,· Coordination of care for other health conditions,
· Access to care and other services offered by the dialysis facility, and
¡ Understand the awareness and impact of the CEC Model.
F.1. Selection Criteria and Beneficiary Recruitment
Beneficiary focus groups were held during ESCO sites visits with LDO and non-LDOs during the first four model years. Focus groups were held with beneficiaries aligned with Wave 1 ESCOs in PY1 and PY3 and with Wave 2 ESCOs in PY2 and PY4. In PY3, focus group locations included beneficiaries from a mix of ESCOs that had a focus group in PY1 and ESCOs that did not, and in PY4 all non-LDO ESCOs had a second focus group. Within each ESCO selected for a focus group, the location of the focus group was selected from a subset of dialysis facilities chosen for site visits. ESCO leadership determined which specific facility would host the focus group based on the availability of space to accommodate the group. Although each focus group was conducted at only one facility within an ESCO, beneficiary participants may have been from any facility within that ESCO. Over the course of the evaluation, 107 beneficiaries participated in a focus group. To facilitate recruitment, an ESCO staff member provided a list of CEC beneficiaries from the facility hosting the focus group or from a nearby CEC facility. Potential participants were mailed a letter that provided background on the focus groups and alerting them of an upcoming phone outreach. A screening questionnaire was conducted by phone to determine their eligibility for the focus group and interest in participating. An attempt was made to schedule participants who were not having dialysis on the day of the focus group. Transportation to and from the focus group location was provided if needed.
F.2. Data Collection and Analysis
Each focus group session lasted approximately 90 minutes and was moderated by an experienced independent facilitator. Lewin research team members observed the focus groups from the periphery of the room and were given an opportunity to have the facilitator ask participants additional questions or obtain specific clarifications during the last 10 minutes of the focus group. Participants were offered lunch and were given a $75 gift card for their participation at the end of the focus group.
The structure of each beneficiary focus group session is displayed in Exhibit F-1.
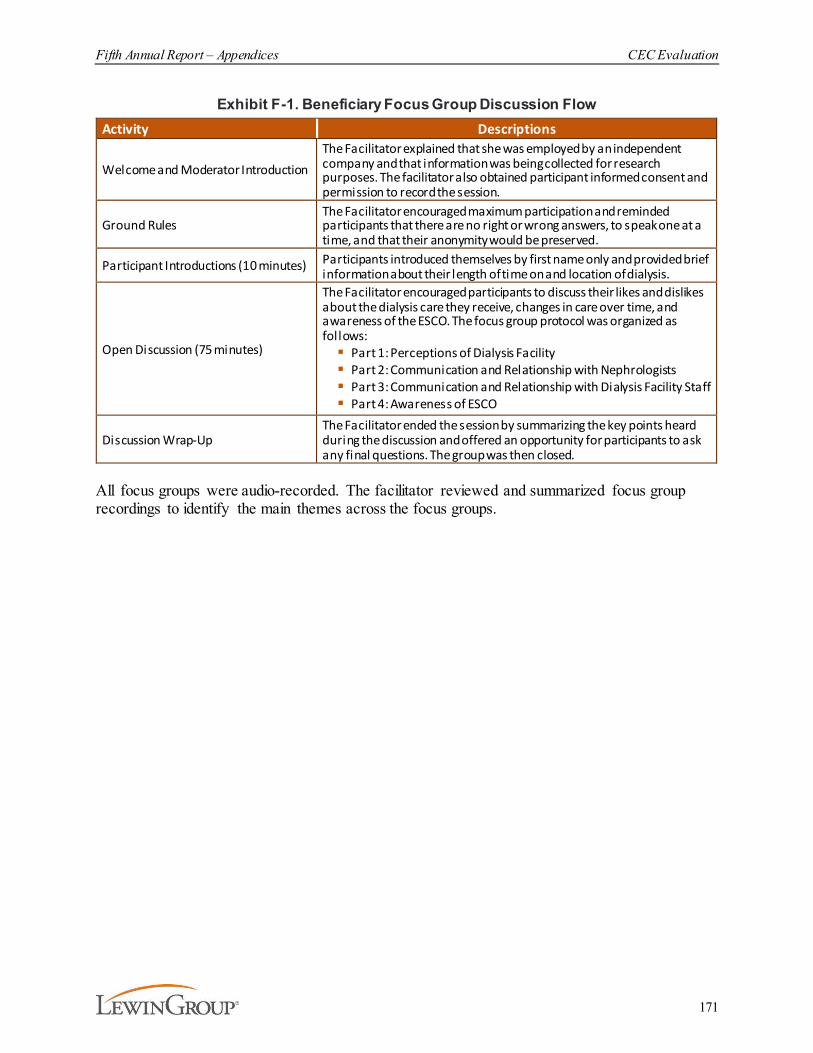
Fifth Annual Report – Appendices CEC Evaluation
171
Exhibit F-1. Beneficiary Focus Group Discussion FlowActivity Descriptions
Welcome and Moderator IntroductionThe Facilitator explained that she was employed by an independent company and that information was being collected for research purposes. The facilitator also obtained participant informed consent and permission to record the session.
Ground Rules The Facilitator encouraged maximum participation and reminded participants that there are no right or wrong answers, to speak one at a time, and that their anonymity would be preserved.
Participant Introductions (10 minutes) Participants introduced themselves by first name only and provided brief information about their length of time on and location of dialysis.
Open Discussion (75 minutes)
The Facilitator encouraged participants to discuss their likes and dislikes about the dialysis care they receive, changes in care over time, and awareness of the ESCO. The focus group protocol was organized as follows:§ Part 1: Perceptions of Dialysis Facility§ Part 2: Communication and Relationship with Nephrologists§ Part 3: Communication and Relationship with Dialysis Facility Staff§ Part 4: Awareness of ESCO
Discussion Wrap-UpThe Facilitator ended the session by summarizing the key points heard during the discussion and offered an opportunity for participants to ask any final questions. The group was then closed.
All focus groups were audio-recorded. The facilitator reviewed and summarized focus group recordings to identify the main themes across the focus groups.

Fifth Annual Report – Appendices CEC Evaluation
172
Appendix G: Mortality AnalysisThis appendix defines the methodology used to conduct the mortality analysis. Results are summarized at the end of the section.
G.1. Data and Outcome Measures
We used CMS’s CCW as main data source for this mortality analysis, specifically, we used Institutional claims data, beneficiary characteristics (e.g., demographics and enrollment), and CCW condition indicators.134 This analysis includes CCW claims from October 1, 2015 through December 31, 2020 that were processed by March 31, 2021.135 All CCW claims were final action claims and had a minimum of three months of run out.136
We also extracted patient data from CROWNWeb to complete the patient history. Data were pulled from the January 2021 quarterly file (for data through September 30, 2020) extracted from CROWNWeb.
Patient demographic and clinical information were extracted from the CMS ESRD Medical Evidence Report form (Form-2728). These data included, but were not limited to, primary cause of renal failure, cause of renal failure groupings, height, race, dry weight, physician name, dialysis type, and incident comorbidities. The Medical Evidence variables are based on CMS patient data that is current through September 30, 2020.
In 2020, a time-varying indicator was created for COVID-19 diagnoses. Beneficiaries’ COVID-19 diagnoses were identified from the following sources: physician supplier claims, all other types of Medicare claims, and CMS Form 2728. If a claim had ICD-10 codes 'B9729' and/or 'U071', “claim from” date was identified as the COVID-19 event date. For physician supplier claims, line item files were used to remove lab-only claims. We also used the “14. Primary Cause of Renal Failure” field in CMS Form 2728. Specifically, 'U07.1' and/or 'U071' were used on the CMS Form 2728 to identify COVID-19.
After obtaining COVID-19 event information from the sources above, we used the first occurrence of a COVID-19 event as the diagnosis date for that beneficiary. This date was then used to create a time-varying COVID-19 diagnosis indicator.
Date of death was extracted from the MBSFs, which include validated dates of death for each beneficiary if death occurred.
The first dialysis service date was extracted from REMIS.
134 The CCW condition indicators are claims-based algorithms that identify beneficiaries with select clinical conditions
(e.g., diabetes, hyperlipidemia, hypertension, etc.). See https://www.ccwdata.org/web/guest/condition-categories. 135 Kidney transplants are an exception, which also included claims that ended in 2011 to assess the kidney
transplant exclusion criterion in 2012 (i.e., excluded in the 12 months following the month of a transplant).136 The analytic CCW claims files are based on final action claims. We used final action claims only to avoid
internal data inconsistencies caused by use of original claims (e.g., we observed beneficiaries aligned based on original claims for whom we found no final action claims).

Fifth Annual Report – Appendices CEC Evaluation
173
The analysis sample starts with the same set of beneficiaries and analysis period (monthly data from January 2014-December 2020) as the overall DiD analysis, but did not include pre-CEC Model data (i.e., observations prior to October 1, 2015).
G.2. CEC and Comparison Group Populations
For this mortality analysis, beneficiary time-at-risk is defined as the duration of time over which the death of a beneficiary would be aligned to an ESCO or comparison group facility, thus counting as an observed event. Beneficiary time-at-risk is aligned to an ESCO or comparison group facility after he/she had ESRD for at least 90 days.137 Time-at-risk ends at the earliest occurrence of the following: one day prior to a transplant, date of death, end of alignment, or the end of the follow-up period on December 31, 2020. The time-at-risk for each beneficiary that was diagnosed with COVID-19 was separated into two periods: one for ‘before diagnosis’ (e.g., coded as COVID-19=0) and another for ‘after diagnosis’ (e.g., coded as COVID-19=0), while the time-at-risk for beneficiaries that were never diagnosed with Covid-19 was unaffected. Coding this way properly attributes time-at-risk to different COVID-19 status (i.e., before and after a COVID-19 positive diagnosis) and ensures an unbiased estimate of the impact of COVID-19 on survival.
Beneficiaries with missing model covariates were excluded from the survival models.
This survival analysis does not incorporate the monthly CEC eligibility criteria. If a beneficiary became ineligible during the follow-up period, that beneficiary was retained for this analysis to not bias the results of the survival models.
In addition to survival models examining all beneficiaries, separate survival analyses were conducted for incident beneficiaries. Incident beneficiaries were defined as those who were aligned to an ESCO or comparison group facility during their first year of dialysis.
In addition to analyses examining the full period of follow-up, survival models were run after restricting follow-up time to three years for both prevalent and incident beneficiaries.
G.3. Survival Models and Estimated CEC Impact
A frequently used statistical model for survival analysis is the Cox proportional hazards (PH) model, which evaluates the treatment (CEC participation) effect while accounting for patients’ characteristics.138 We set time ‘0’ to be the later of alignment date and 90 days after ESRD, which approximates the treatment (or control) start date. This method has been commonly used in clinical trials when comparing survival across different groups (e.g., treatment vs control). We fitted several Cox models which included different populations, detailed below. In each model, all the included patients were followed until death (event), transplant date minus one (censoring),
137 Since a patient’s follow-up in the database can be incomplete during the first 90 days of ESRD therapy, we only include a
patient’s follow-up into the measure after that patient has received chronic renal replacement therapy for at least 90 days. This minimum 90-day period also assures that most patients are eligible for Medicare, either as their primary or secondary insurer. It also excludes from analysis patients who die or recover renal function during the first 90 days of ESRD. For additional details, see https://dialysisdata.org/sites/default/files/content/ESRD_Measures/nqf/SMR%20MIF.pdf.
138 Cox, D.R. (1972), Regression models and life-tables. Journal of the Royal Statistical Society: Series B (Methodological), 34: 187-202.
Fifth Annual Report – Appendices CEC Evaluation
174
becoming unaligned (censoring), loss to follow-up (censoring), or end of study (December 31, 2020) (censoring), whichever came first. To adjust for infected patients testing positive at various time points, we set the COVID-19 diagnosis indicator as a time-varying indicator, taking ‘0’ before the date of COVID-19 positive diagnosis and ‘1’ afterward. A Cox model with time-varying covariates is fit to accommodate such defined time-varying COVID indicators. We considered various Cox models (below) for different purposes. We also performed tests of the goodness of fit and the PH assumption underlying these Cox models, and our tests confirmed the appropriateness of our models; see Section G.4.
The most general model compares survival in the entire CEC-aligned population (all waves and cohorts) to the entire matched comparison population. Because Wave 1 PY1 joiners contributed all the observed patient experience beyond three years, a more restricted version of this model was fitted by limiting patient’s follow-up to the first three years after alignment. In this case, death beyond three years is coded as censoring at three years. This restriction is intended to allow Wave 1 PY1 joiners and subsequent waves and cohorts to contribute to the estimates more symmetrically. We further considered models that only used data from patients who became aligned to the CEC or comparison group during their first year on dialysis; we call these “incident” models and call the previously described models without this restriction “prevalent” models.
A second set of models was estimated to test whether the impact of the CEC Model on survival differed by wave. To implement this test, when fitting the models, we included an interaction term between alignment and wave. In our analysis, we specifically considered the patients aligned to facilities joining in Wave 1 PY1 (starting October 1, 2015) and Wave 2 PY2 (starting January 1, 2017) and their matched comparisons. The model included an indicator for alignment (‘1’ if aligned to CEC, ‘0’ if aligned to the comparison), wave (‘1’ if aligned to either a Wave 2 PY2 joiner or its comparison, ‘0’ if aligned to either a Wave 1 PY1 joiner or its comparison), and interaction between alignment and wave. The alignment indicator estimates the effect of CEC for Wave 1 PY1 joiners, while the interaction estimates how the effect of CEC differs between Wave 2 PY2 joiners and Wave 1 PY1 joiners. That is, an interaction term close to 0 may suggest that the CEC Model effect is similar across both waves. In our analysis, we considered four permutations of populations (prevalent and incident samples, each with and without limiting patient-level follow-up to three years post alignment).
In summary, the different survival models we estimate are specified as follows:
¡ Model 1: Adjusts for ESCO alignment, year, age, vintage (prevalent model only), race, sex, diabetes as cause of ESRD, ethnicity, log of BMI at incidence, log of BMI at incidence spline at 35, pre-ESRD nephrology care, and incident comorbidities including atherosclerotic heart disease, other cardiac disease, congestive heart failure, inability to ambulate, inability to transfer, cancer, diabetes (all types including cause of ESRD), peripheral vascular disease, cerebrovascular disease, tobacco use, alcohol dependence, drug dependence, having at least one comorbidity, and time-varying COVID-19 diagnosis status.
¡ Model 2: Adjusts for the same covariates listed for Model 1 (apart from year) but also includes a wave indicator (Wave 1 PY1 joiner=0; Wave 2 PY2 joiner=1) and a wave indicator*alignment interaction term.
Fifth Annual Report – Appendices CEC Evaluation
175
¡ Models 1c, 1d, 2c, and 2d are restricted to incident beneficiaries only. Models 1b, 1d, 2b, and 2d are restricted to three years of follow-up time.
G.3.1. Estimation Results The most general model (see Exhibit G-1), which included all waves as a single treatment group (CEC) relative to their single matched comparison (control), showed a modest but statistically significant survival benefit for CEC patients. When restricting follow-up to three years’ post-alignment, the survival benefit remained significant and similar in magnitude (see Exhibit G-2). The similar hazard ratio (HR) implies that the estimate of the CEC Model’s benefits on survival for patients was not sensitive to the inclusion or exclusion of longer follow up times.
We hypothesized that the CEC Model impact would be larger among patients who were exposed to the program earlier in their course of treatment. The models for incident patients (aligned during their first year on dialysis) support this hypothesis as the CEC Model treatment effects were about 1.3 times the magnitude of those in the prevalent models. For the incident model that included all waves, the CEC indicator coefficient equaled -0.03 (p=0.04) with HR=0.97; for the prevalent model that included all waves, the CEC indicator coefficient equaled -0.02 (p=0.01) with HR=0.98 (see Exhibits G-3 and G-4).
The next set of models tested whether the effects on mortality differed by wave. The three key variables were alignment to CEC, which tests the general impact of the CEC Model on survival; the Wave 2 indicator, which accounts for any time trends in survival that affected both the CEC beneficiaries and their comparisons; and the interaction between these two variables, which tested whether the impact differs between waves. CEC effect was associated with nearly identical survival as the comparison group. We show in Exhibit G-5 that the CEC indicator coefficient (for Wave 1 PY1) equaled 0.00003, with no statistically significant difference. Similarly, Wave 2 PY2 joiners were associated with slightly better survival than for Wave 1 PY1 (HR=0.97), but again, that association was not significant (p=0.10). We compared CEC and comparison for Wave 1 PY1 and CEC and comparison for Wave 2 PY2 in Exhibit G-6. For the Wave 1 PY1 group, we again did not see a significant survival effect for CEC alignment. For the Wave 2 PY2 joiners, CEC alignment was associated with significantly better survival than the comparison group (HR=0.97; p=0.02). For the test of the null hypothesis, that effect for Wave 2 PY2 joiners was not different than zero (see Exhibit G-6). When restricting to three years of follow-up, the results remained similar to those from the unrestricted model. Overall, these models show better survival in the CEC Model, and better survival in Wave 2 than in Wave 1, but these effects are generally not statistically significant. When combined with the results of the general (non-wave-specific) models that showed modest but statistically significant survival advantages for CEC, we conclude that there is insufficient statistical power to accurately differentiate performance between waves.
Restricting the models (with wave and alignment indicator) to patients aligned during their first year on dialysis (see Exhibits G-9-G-12), the effects are again somewhat larger than in the prevalent model. In Wave 1 PY1 joiners, CEC was associated with better survival than the comparison group, but the difference was not significant (see Exhibit G-9). In Exhibit G-9, the wave indicator and interaction of the wave indicator and align both have coefficients and are not statistically significant coefficients. We show the results by CEC and the comparison group within Wave 1 PY1 and Wave 2 PY2 in Exhibit G-10. When comparing CEC and the
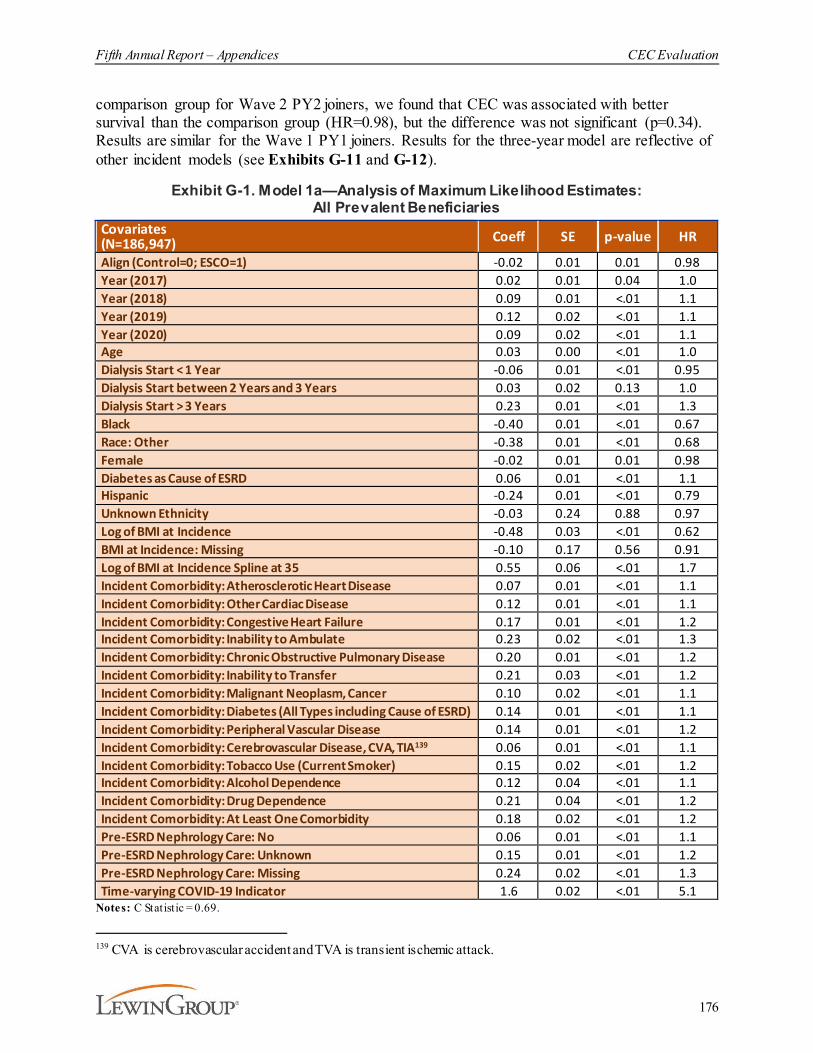
Fifth Annual Report – Appendices CEC Evaluation
176
comparison group for Wave 2 PY2 joiners, we found that CEC was associated with better survival than the comparison group (HR=0.98), but the difference was not significant (p=0.34). Results are similar for the Wave 1 PY1 joiners. Results for the three-year model are reflective of other incident models (see Exhibits G-11 and G-12).
Exhibit G-1. Model 1a—Analysis of Maximum Likelihood Estimates: All Prevalent Beneficiaries
Covariates (N=186,947) Coeff SE p-value HR
Align (Control=0; ESCO=1) -0.02 0.01 0.01 0.98Year (2017) 0.02 0.01 0.04 1.0Year (2018) 0.09 0.01 <.01 1.1Year (2019) 0.12 0.02 <.01 1.1Year (2020) 0.09 0.02 <.01 1.1Age 0.03 0.00 <.01 1.0Dialysis Start < 1 Year -0.06 0.01 <.01 0.95Dialysis Start between 2 Years and 3 Years 0.03 0.02 0.13 1.0Dialysis Start > 3 Years 0.23 0.01 <.01 1.3Black -0.40 0.01 <.01 0.67Race: Other -0.38 0.01 <.01 0.68Female -0.02 0.01 0.01 0.98Diabetes as Cause of ESRD 0.06 0.01 <.01 1.1Hispanic -0.24 0.01 <.01 0.79Unknown Ethnicity -0.03 0.24 0.88 0.97Log of BMI at Incidence -0.48 0.03 <.01 0.62BMI at Incidence: Missing -0.10 0.17 0.56 0.91Log of BMI at Incidence Spline at 35 0.55 0.06 <.01 1.7Incident Comorbidity: Atherosclerotic Heart Disease 0.07 0.01 <.01 1.1Incident Comorbidity: Other Cardiac Disease 0.12 0.01 <.01 1.1Incident Comorbidity: Congestive Heart Failure 0.17 0.01 <.01 1.2Incident Comorbidity: Inability to Ambulate 0.23 0.02 <.01 1.3Incident Comorbidity: Chronic Obstructive Pulmonary Disease 0.20 0.01 <.01 1.2Incident Comorbidity: Inability to Transfer 0.21 0.03 <.01 1.2Incident Comorbidity: Malignant Neoplasm, Cancer 0.10 0.02 <.01 1.1Incident Comorbidity: Diabetes (All Types including Cause of ESRD) 0.14 0.01 <.01 1.1Incident Comorbidity: Peripheral Vascular Disease 0.14 0.01 <.01 1.2Incident Comorbidity: Cerebrovascular Disease, CVA, TIA139 0.06 0.01 <.01 1.1Incident Comorbidity: Tobacco Use (Current Smoker) 0.15 0.02 <.01 1.2Incident Comorbidity: Alcohol Dependence 0.12 0.04 <.01 1.1Incident Comorbidity: Drug Dependence 0.21 0.04 <.01 1.2Incident Comorbidity: At Least One Comorbidity 0.18 0.02 <.01 1.2Pre-ESRD Nephrology Care: No 0.06 0.01 <.01 1.1Pre-ESRD Nephrology Care: Unknown 0.15 0.01 <.01 1.2Pre-ESRD Nephrology Care: Missing 0.24 0.02 <.01 1.3Time-varying COVID-19 Indicator 1.6 0.02 <.01 5.1
Notes: C Statistic = 0.69.
139 CVA is cerebrovascular accident and TVA is transient ischemic attack.
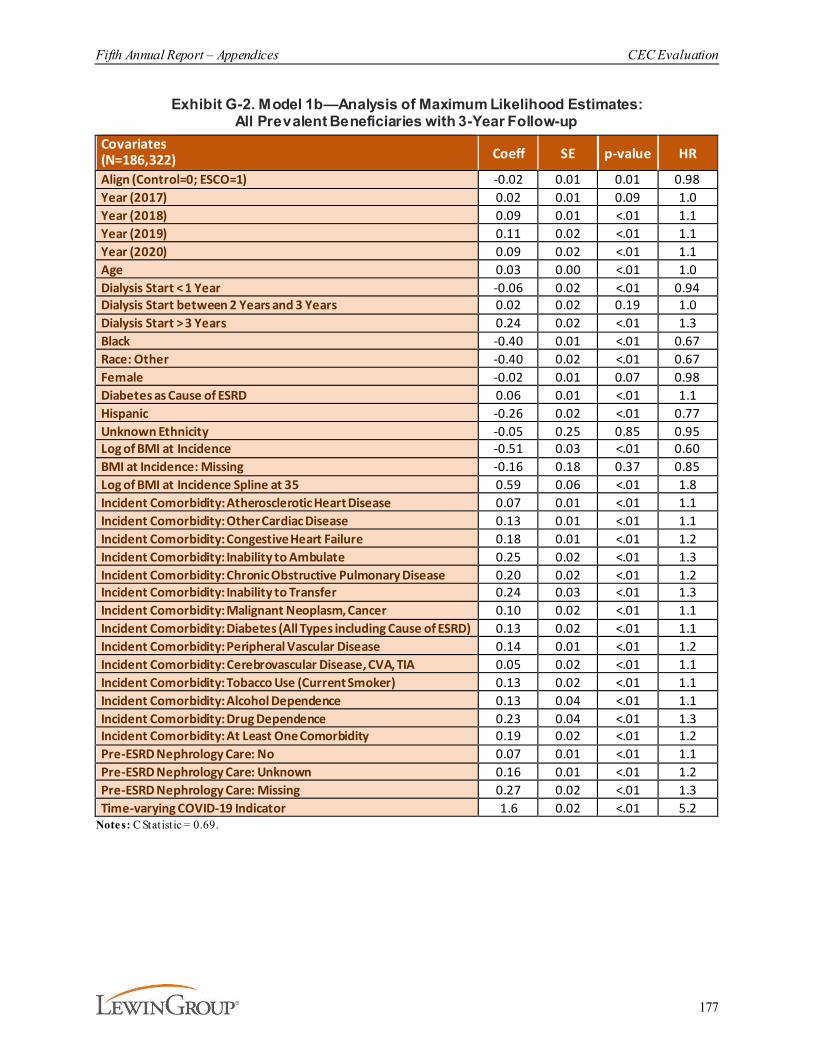
Fifth Annual Report – Appendices CEC Evaluation
177
Exhibit G-2. Model 1b—Analysis of Maximum Likelihood Estimates: All Prevalent Beneficiaries with 3-Year Follow-up
Covariates (N=186,322) Coeff SE p-value HR
Align (Control=0; ESCO=1) -0.02 0.01 0.01 0.98Year (2017) 0.02 0.01 0.09 1.0Year (2018) 0.09 0.01 <.01 1.1Year (2019) 0.11 0.02 <.01 1.1Year (2020) 0.09 0.02 <.01 1.1Age 0.03 0.00 <.01 1.0Dialysis Start < 1 Year -0.06 0.02 <.01 0.94Dialysis Start between 2 Years and 3 Years 0.02 0.02 0.19 1.0Dialysis Start > 3 Years 0.24 0.02 <.01 1.3Black -0.40 0.01 <.01 0.67Race: Other -0.40 0.02 <.01 0.67Female -0.02 0.01 0.07 0.98Diabetes as Cause of ESRD 0.06 0.01 <.01 1.1Hispanic -0.26 0.02 <.01 0.77Unknown Ethnicity -0.05 0.25 0.85 0.95Log of BMI at Incidence -0.51 0.03 <.01 0.60BMI at Incidence: Missing -0.16 0.18 0.37 0.85Log of BMI at Incidence Spline at 35 0.59 0.06 <.01 1.8Incident Comorbidity: Atherosclerotic Heart Disease 0.07 0.01 <.01 1.1Incident Comorbidity: Other Cardiac Disease 0.13 0.01 <.01 1.1Incident Comorbidity: Congestive Heart Failure 0.18 0.01 <.01 1.2Incident Comorbidity: Inability to Ambulate 0.25 0.02 <.01 1.3Incident Comorbidity: Chronic Obstructive Pulmonary Disease 0.20 0.02 <.01 1.2Incident Comorbidity: Inability to Transfer 0.24 0.03 <.01 1.3Incident Comorbidity: Malignant Neoplasm, Cancer 0.10 0.02 <.01 1.1Incident Comorbidity: Diabetes (All Types including Cause of ESRD) 0.13 0.02 <.01 1.1Incident Comorbidity: Peripheral Vascular Disease 0.14 0.01 <.01 1.2Incident Comorbidity: Cerebrovascular Disease, CVA, TIA 0.05 0.02 <.01 1.1Incident Comorbidity: Tobacco Use (Current Smoker) 0.13 0.02 <.01 1.1Incident Comorbidity: Alcohol Dependence 0.13 0.04 <.01 1.1Incident Comorbidity: Drug Dependence 0.23 0.04 <.01 1.3Incident Comorbidity: At Least One Comorbidity 0.19 0.02 <.01 1.2Pre-ESRD Nephrology Care: No 0.07 0.01 <.01 1.1Pre-ESRD Nephrology Care: Unknown 0.16 0.01 <.01 1.2Pre-ESRD Nephrology Care: Missing 0.27 0.02 <.01 1.3Time-varying COVID-19 Indicator 1.6 0.02 <.01 5.2
Notes: C Statistic = 0.69.

Fifth Annual Report – Appendices CEC Evaluation
178
Exhibit G-3. Model 1c—Analysis of Maximum Likelihood Estimates: All Incident Beneficiaries
Covariates (N=69,521) Coeff SE p-value HR
Align (Control=0; ESCO=1) -0.03 0.01 0.04 0.97Year (2017) 0.00 0.02 0.94 1.0Year (2018) 0.07 0.02 <.01 1.1Year (2019) 0.06 0.03 0.02 1.1Year (2020) 0.00 0.04 0.99 1.0Age 0.03 0.00 <.01 1.0Black -0.43 0.02 <.01 0.65Race: Other -0.43 0.03 <.01 0.65Female -0.04 0.01 0.02 0.97Diabetes as Cause of ESRD -0.01 0.02 0.57 0.99Hispanic -0.30 0.03 <.01 0.74Unknown Ethnicity 0.12 0.56 0.83 1.1Log of BMI at Incidence -0.76 0.04 <.01 0.47BMI at Incidence: Missing -0.18 0.66 0.78 0.83Log of BMI at Incidence Spline at 35 1.0 0.10 <.01 2.8Incident Comorbidity: Atherosclerotic Heart Disease 0.03 0.02 0.10 1.0Incident Comorbidity: Other Cardiac Disease 0.14 0.02 <.01 1.1Incident Comorbidity: Congestive Heart Failure 0.26 0.02 <.01 1.3Incident Comorbidity: Inability to Ambulate 0.31 0.03 <.01 1.4Incident Comorbidity: Chronic Obstructive Pulmonary Disease 0.25 0.02 <.01 1.3Incident Comorbidity: Inability to Transfer 0.36 0.04 <.01 1.4Incident Comorbidity: Malignant Neoplasm, Cancer 0.20 0.02 <.01 1.2Incident Comorbidity: Diabetes (All Types including Cause of ESRD) 0.11 0.02 <.01 1.1Incident Comorbidity: Peripheral Vascular Disease 0.18 0.02 <.01 1.2Incident Comorbidity: Cerebrovascular Disease, CVA, TIA 0.08 0.02 <.01 1.1Incident Comorbidity: Tobacco Use (Current Smoker) 0.06 0.03 0.06 1.1Incident Comorbidity: Alcohol Dependence 0.22 0.06 <.01 1.2Incident Comorbidity: Drug Dependence 0.28 0.07 <.01 1.3Incident Comorbidity: At Least One Comorbidity 0.17 0.03 <.01 1.2Pre-ESRD Nephrology Care: No 0.18 0.02 <.01 1.2Pre-ESRD Nephrology Care: Unknown 0.28 0.02 <.01 1.3Pre-ESRD Nephrology Care: Missing 2.9 1.07 0.01 17.5Time-varying COVID-19 Indicator 1.6 0.03 <.01 5.1
Notes: C Statistic = 0.71
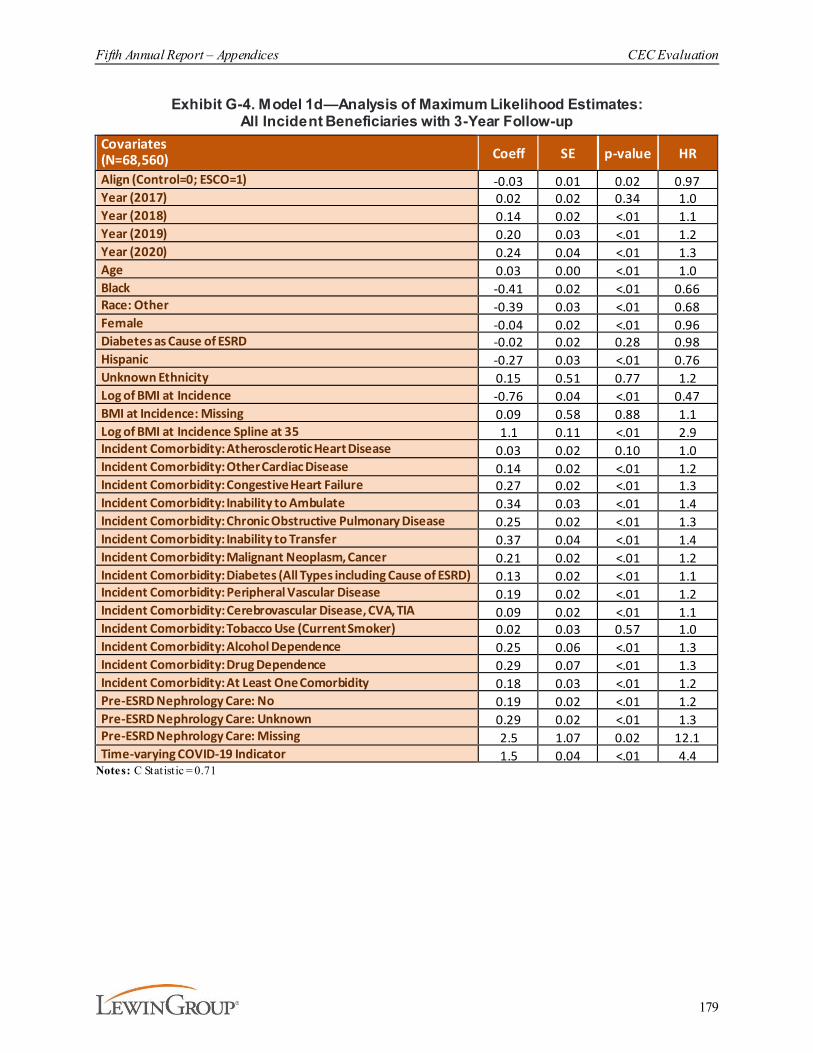
Fifth Annual Report – Appendices CEC Evaluation
179
Exhibit G-4. Model 1d—Analysis of Maximum Likelihood Estimates: All Incident Beneficiaries with 3-Year Follow-up
Covariates (N=68,560) Coeff SE p-value HR
Align (Control=0; ESCO=1) -0.03 0.01 0.02 0.97Year (2017) 0.02 0.02 0.34 1.0Year (2018) 0.14 0.02 <.01 1.1Year (2019) 0.20 0.03 <.01 1.2Year (2020) 0.24 0.04 <.01 1.3Age 0.03 0.00 <.01 1.0Black -0.41 0.02 <.01 0.66Race: Other -0.39 0.03 <.01 0.68Female -0.04 0.02 <.01 0.96Diabetes as Cause of ESRD -0.02 0.02 0.28 0.98Hispanic -0.27 0.03 <.01 0.76Unknown Ethnicity 0.15 0.51 0.77 1.2Log of BMI at Incidence -0.76 0.04 <.01 0.47BMI at Incidence: Missing 0.09 0.58 0.88 1.1Log of BMI at Incidence Spline at 35 1.1 0.11 <.01 2.9Incident Comorbidity: Atherosclerotic Heart Disease 0.03 0.02 0.10 1.0Incident Comorbidity: Other Cardiac Disease 0.14 0.02 <.01 1.2Incident Comorbidity: Congestive Heart Failure 0.27 0.02 <.01 1.3Incident Comorbidity: Inability to Ambulate 0.34 0.03 <.01 1.4Incident Comorbidity: Chronic Obstructive Pulmonary Disease 0.25 0.02 <.01 1.3Incident Comorbidity: Inability to Transfer 0.37 0.04 <.01 1.4Incident Comorbidity: Malignant Neoplasm, Cancer 0.21 0.02 <.01 1.2Incident Comorbidity: Diabetes (All Types including Cause of ESRD) 0.13 0.02 <.01 1.1Incident Comorbidity: Peripheral Vascular Disease 0.19 0.02 <.01 1.2Incident Comorbidity: Cerebrovascular Disease, CVA, TIA 0.09 0.02 <.01 1.1Incident Comorbidity: Tobacco Use (Current Smoker) 0.02 0.03 0.57 1.0Incident Comorbidity: Alcohol Dependence 0.25 0.06 <.01 1.3Incident Comorbidity: Drug Dependence 0.29 0.07 <.01 1.3Incident Comorbidity: At Least One Comorbidity 0.18 0.03 <.01 1.2Pre-ESRD Nephrology Care: No 0.19 0.02 <.01 1.2Pre-ESRD Nephrology Care: Unknown 0.29 0.02 <.01 1.3Pre-ESRD Nephrology Care: Missing 2.5 1.07 0.02 12.1Time-varying COVID-19 Indicator 1.5 0.04 <.01 4.4
Notes: C Statistic = 0.71
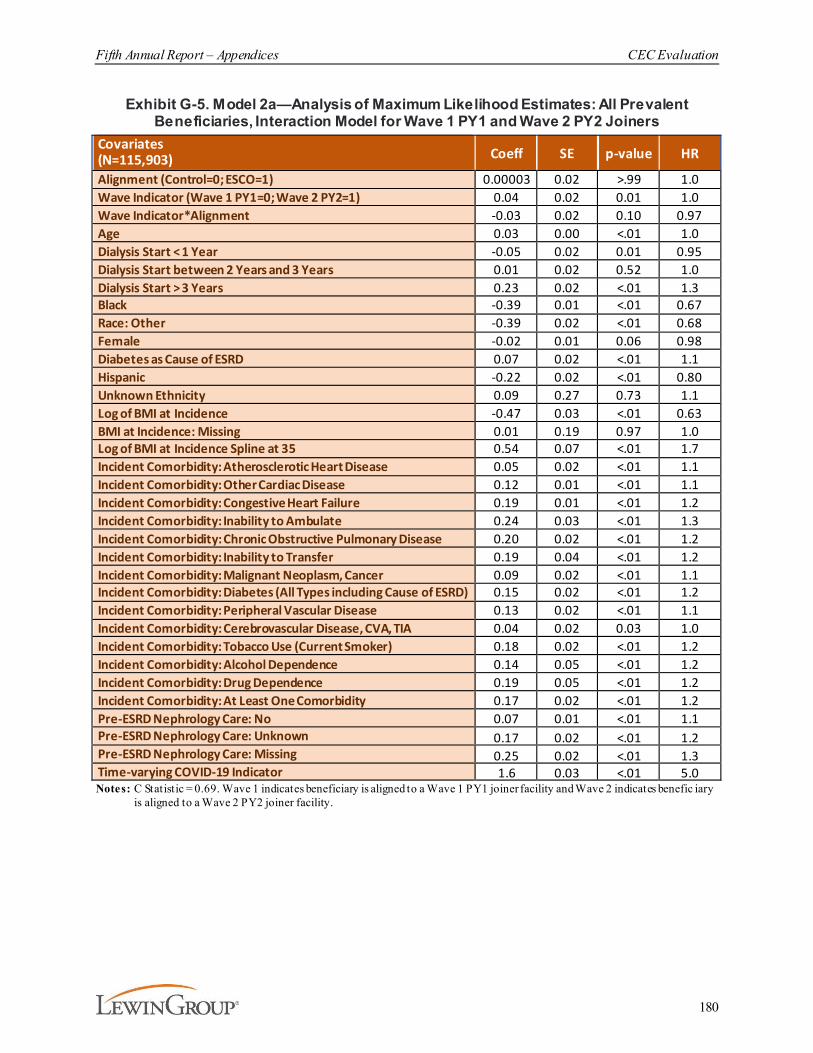
Fifth Annual Report – Appendices CEC Evaluation
180
Exhibit G-5. Model 2a—Analysis of Maximum Likelihood Estimates: All Prevalent Beneficiaries, Interaction Model for Wave 1 PY1 and Wave 2 PY2 Joiners
Covariates (N=115,903) Coeff SE p-value HR
Alignment (Control=0; ESCO=1) 0.00003 0.02 >.99 1.0Wave Indicator (Wave 1 PY1=0; Wave 2 PY2=1) 0.04 0.02 0.01 1.0Wave Indicator*Alignment -0.03 0.02 0.10 0.97Age 0.03 0.00 <.01 1.0Dialysis Start < 1 Year -0.05 0.02 0.01 0.95Dialysis Start between 2 Years and 3 Years 0.01 0.02 0.52 1.0Dialysis Start > 3 Years 0.23 0.02 <.01 1.3Black -0.39 0.01 <.01 0.67Race: Other -0.39 0.02 <.01 0.68Female -0.02 0.01 0.06 0.98Diabetes as Cause of ESRD 0.07 0.02 <.01 1.1Hispanic -0.22 0.02 <.01 0.80Unknown Ethnicity 0.09 0.27 0.73 1.1Log of BMI at Incidence -0.47 0.03 <.01 0.63BMI at Incidence: Missing 0.01 0.19 0.97 1.0Log of BMI at Incidence Spline at 35 0.54 0.07 <.01 1.7Incident Comorbidity: Atherosclerotic Heart Disease 0.05 0.02 <.01 1.1Incident Comorbidity: Other Cardiac Disease 0.12 0.01 <.01 1.1Incident Comorbidity: Congestive Heart Failure 0.19 0.01 <.01 1.2Incident Comorbidity: Inability to Ambulate 0.24 0.03 <.01 1.3Incident Comorbidity: Chronic Obstructive Pulmonary Disease 0.20 0.02 <.01 1.2Incident Comorbidity: Inability to Transfer 0.19 0.04 <.01 1.2Incident Comorbidity: Malignant Neoplasm, Cancer 0.09 0.02 <.01 1.1Incident Comorbidity: Diabetes (All Types including Cause of ESRD) 0.15 0.02 <.01 1.2Incident Comorbidity: Peripheral Vascular Disease 0.13 0.02 <.01 1.1Incident Comorbidity: Cerebrovascular Disease, CVA, TIA 0.04 0.02 0.03 1.0Incident Comorbidity: Tobacco Use (Current Smoker) 0.18 0.02 <.01 1.2Incident Comorbidity: Alcohol Dependence 0.14 0.05 <.01 1.2Incident Comorbidity: Drug Dependence 0.19 0.05 <.01 1.2Incident Comorbidity: At Least One Comorbidity 0.17 0.02 <.01 1.2Pre-ESRD Nephrology Care: No 0.07 0.01 <.01 1.1Pre-ESRD Nephrology Care: Unknown 0.17 0.02 <.01 1.2Pre-ESRD Nephrology Care: Missing 0.25 0.02 <.01 1.3Time-varying COVID-19 Indicator 1.6 0.03 <.01 5.0Notes: C Statistic = 0.69. Wave 1 indicates beneficiary is aligned to a Wave 1 PY1 joiner facility and Wave 2 indicates benefic iary
is aligned to a Wave 2 PY2 joiner facility.
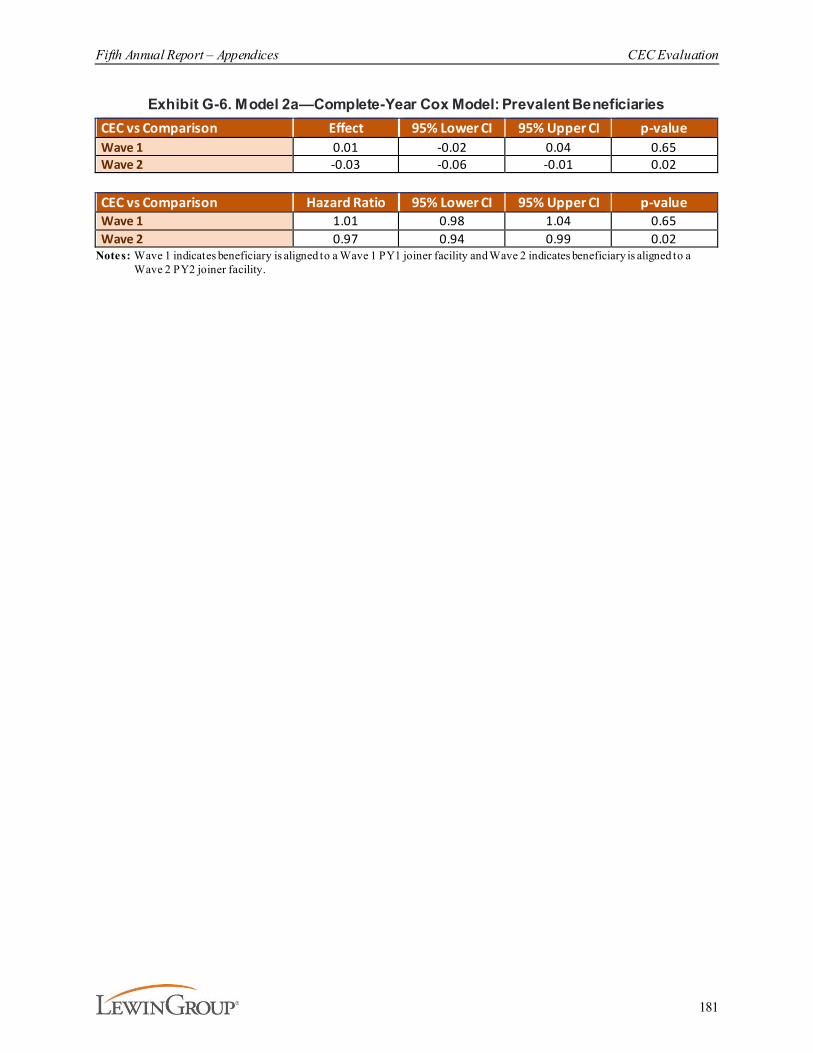
Fifth Annual Report – Appendices CEC Evaluation
181
Exhibit G-6. Model 2a—Complete-Year Cox Model: Prevalent BeneficiariesCEC vs Comparison Effect 95% Lower CI 95% Upper CI p-valueWave 1 0.01 -0.02 0.04 0.65Wave 2 -0.03 -0.06 -0.01 0.02
CEC vs Comparison Hazard Ratio 95% Lower CI 95% Upper CI p-valueWave 1 1.01 0.98 1.04 0.65Wave 2 0.97 0.94 0.99 0.02
Notes: Wave 1 indicates beneficiary is aligned to a Wave 1 PY1 joiner facility and Wave 2 indicates beneficiary is aligned to a Wave 2 PY2 joiner facility.
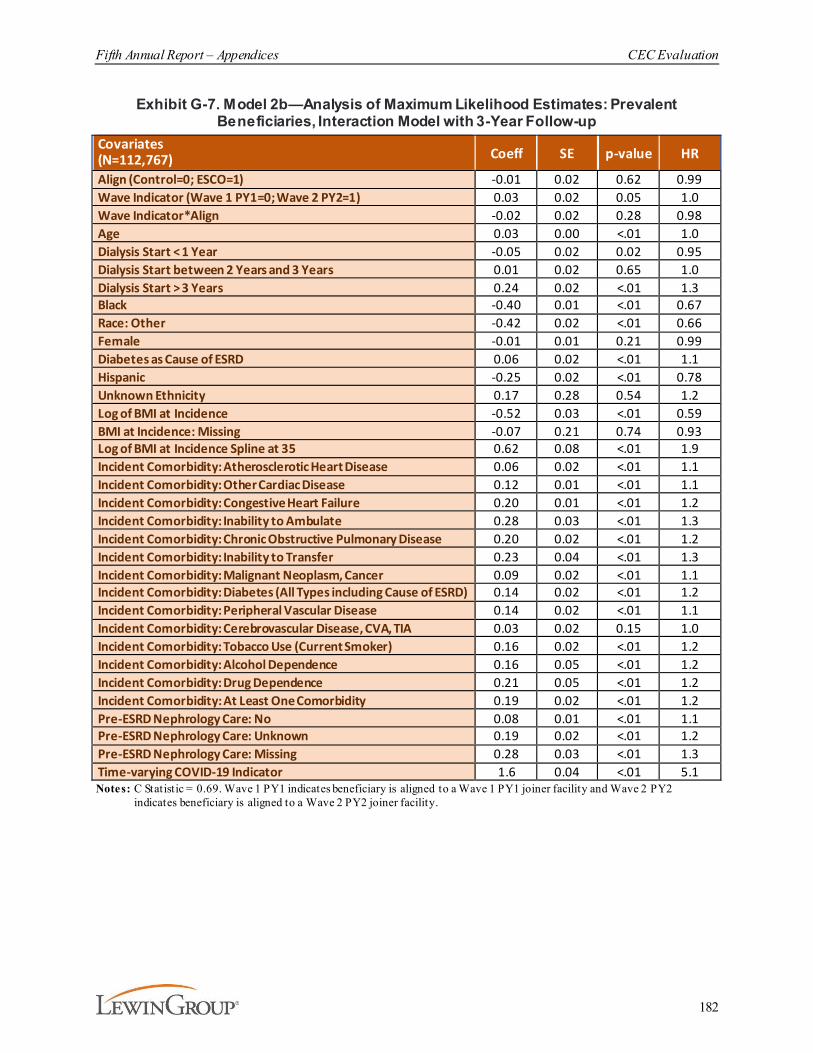
Fifth Annual Report – Appendices CEC Evaluation
182
Exhibit G-7. Model 2b—Analysis of Maximum Likelihood Estimates: Prevalent Beneficiaries, Interaction Model with 3-Year Follow-up
Covariates (N=112,767) Coeff SE p-value HR
Align (Control=0; ESCO=1) -0.01 0.02 0.62 0.99Wave Indicator (Wave 1 PY1=0; Wave 2 PY2=1) 0.03 0.02 0.05 1.0Wave Indicator*Align -0.02 0.02 0.28 0.98Age 0.03 0.00 <.01 1.0Dialysis Start < 1 Year -0.05 0.02 0.02 0.95Dialysis Start between 2 Years and 3 Years 0.01 0.02 0.65 1.0Dialysis Start > 3 Years 0.24 0.02 <.01 1.3Black -0.40 0.01 <.01 0.67Race: Other -0.42 0.02 <.01 0.66Female -0.01 0.01 0.21 0.99Diabetes as Cause of ESRD 0.06 0.02 <.01 1.1Hispanic -0.25 0.02 <.01 0.78Unknown Ethnicity 0.17 0.28 0.54 1.2Log of BMI at Incidence -0.52 0.03 <.01 0.59BMI at Incidence: Missing -0.07 0.21 0.74 0.93Log of BMI at Incidence Spline at 35 0.62 0.08 <.01 1.9Incident Comorbidity: Atherosclerotic Heart Disease 0.06 0.02 <.01 1.1Incident Comorbidity: Other Cardiac Disease 0.12 0.01 <.01 1.1Incident Comorbidity: Congestive Heart Failure 0.20 0.01 <.01 1.2Incident Comorbidity: Inability to Ambulate 0.28 0.03 <.01 1.3Incident Comorbidity: Chronic Obstructive Pulmonary Disease 0.20 0.02 <.01 1.2Incident Comorbidity: Inability to Transfer 0.23 0.04 <.01 1.3Incident Comorbidity: Malignant Neoplasm, Cancer 0.09 0.02 <.01 1.1Incident Comorbidity: Diabetes (All Types including Cause of ESRD) 0.14 0.02 <.01 1.2Incident Comorbidity: Peripheral Vascular Disease 0.14 0.02 <.01 1.1Incident Comorbidity: Cerebrovascular Disease, CVA, TIA 0.03 0.02 0.15 1.0Incident Comorbidity: Tobacco Use (Current Smoker) 0.16 0.02 <.01 1.2Incident Comorbidity: Alcohol Dependence 0.16 0.05 <.01 1.2Incident Comorbidity: Drug Dependence 0.21 0.05 <.01 1.2Incident Comorbidity: At Least One Comorbidity 0.19 0.02 <.01 1.2Pre-ESRD Nephrology Care: No 0.08 0.01 <.01 1.1Pre-ESRD Nephrology Care: Unknown 0.19 0.02 <.01 1.2Pre-ESRD Nephrology Care: Missing 0.28 0.03 <.01 1.3Time-varying COVID-19 Indicator 1.6 0.04 <.01 5.1Notes: C Statistic = 0.69. Wave 1 PY1 indicates beneficiary is aligned to a Wave 1 PY1 joiner facility and Wave 2 PY2
indicates beneficiary is aligned to a Wave 2 PY2 joiner facility.
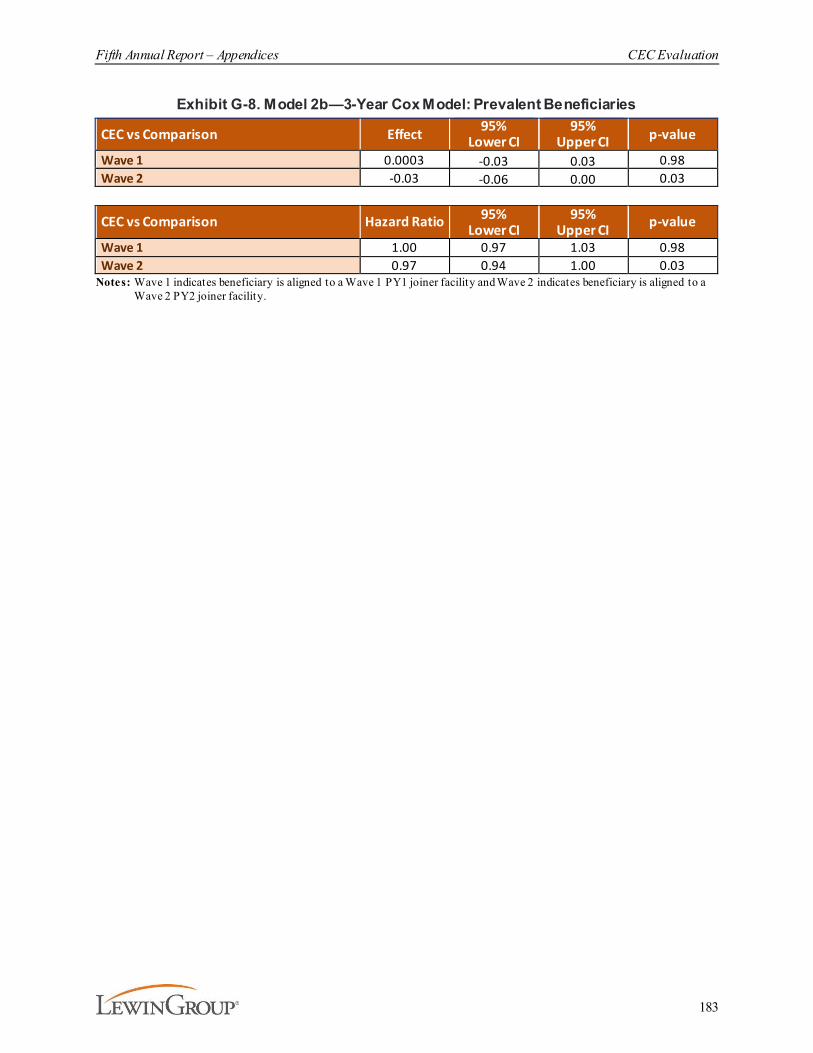
Fifth Annual Report – Appendices CEC Evaluation
183
Exhibit G-8. Model 2b—3-Year Cox Model: Prevalent Beneficiaries
CEC vs Comparison Effect 95%Lower CI
95%Upper CI p-value
Wave 1 0.0003 -0.03 0.03 0.98Wave 2 -0.03 -0.06 0.00 0.03
CEC vs Comparison Hazard Ratio 95%Lower CI
95%Upper CI p-value
Wave 1 1.00 0.97 1.03 0.98Wave 2 0.97 0.94 1.00 0.03
Notes: Wave 1 indicates beneficiary is aligned to a Wave 1 PY1 joiner facility and Wave 2 indicates beneficiary is aligned to a Wave 2 PY2 joiner facility.
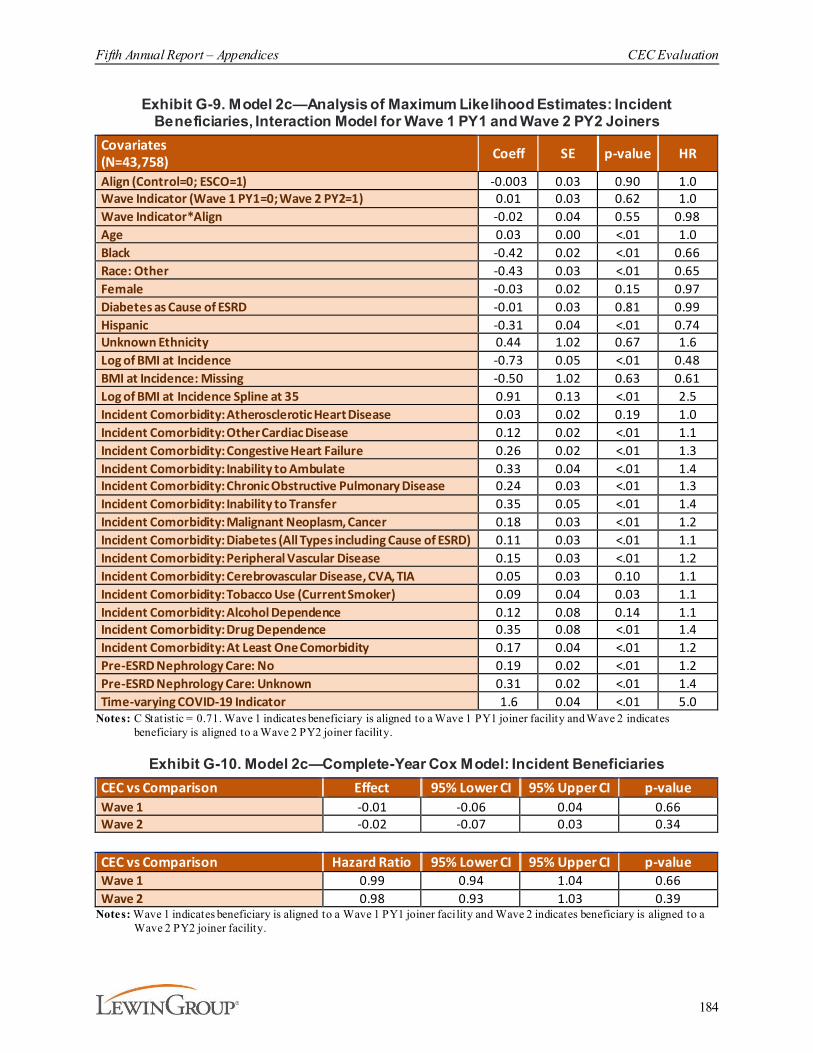
Fifth Annual Report – Appendices CEC Evaluation
184
Exhibit G-9. Model 2c—Analysis of Maximum Likelihood Estimates: Incident Beneficiaries, Interaction Model for Wave 1 PY1 and Wave 2 PY2 Joiners
Covariates(N=43,758) Coeff SE p-value HR
Align (Control=0; ESCO=1) -0.003 0.03 0.90 1.0Wave Indicator (Wave 1 PY1=0; Wave 2 PY2=1) 0.01 0.03 0.62 1.0Wave Indicator*Align -0.02 0.04 0.55 0.98Age 0.03 0.00 <.01 1.0Black -0.42 0.02 <.01 0.66Race: Other -0.43 0.03 <.01 0.65Female -0.03 0.02 0.15 0.97Diabetes as Cause of ESRD -0.01 0.03 0.81 0.99Hispanic -0.31 0.04 <.01 0.74Unknown Ethnicity 0.44 1.02 0.67 1.6Log of BMI at Incidence -0.73 0.05 <.01 0.48BMI at Incidence: Missing -0.50 1.02 0.63 0.61Log of BMI at Incidence Spline at 35 0.91 0.13 <.01 2.5Incident Comorbidity: Atherosclerotic Heart Disease 0.03 0.02 0.19 1.0Incident Comorbidity: Other Cardiac Disease 0.12 0.02 <.01 1.1Incident Comorbidity: Congestive Heart Failure 0.26 0.02 <.01 1.3Incident Comorbidity: Inability to Ambulate 0.33 0.04 <.01 1.4Incident Comorbidity: Chronic Obstructive Pulmonary Disease 0.24 0.03 <.01 1.3Incident Comorbidity: Inability to Transfer 0.35 0.05 <.01 1.4Incident Comorbidity: Malignant Neoplasm, Cancer 0.18 0.03 <.01 1.2Incident Comorbidity: Diabetes (All Types including Cause of ESRD) 0.11 0.03 <.01 1.1Incident Comorbidity: Peripheral Vascular Disease 0.15 0.03 <.01 1.2Incident Comorbidity: Cerebrovascular Disease, CVA, TIA 0.05 0.03 0.10 1.1Incident Comorbidity: Tobacco Use (Current Smoker) 0.09 0.04 0.03 1.1Incident Comorbidity: Alcohol Dependence 0.12 0.08 0.14 1.1Incident Comorbidity: Drug Dependence 0.35 0.08 <.01 1.4Incident Comorbidity: At Least One Comorbidity 0.17 0.04 <.01 1.2Pre-ESRD Nephrology Care: No 0.19 0.02 <.01 1.2Pre-ESRD Nephrology Care: Unknown 0.31 0.02 <.01 1.4Time-varying COVID-19 Indicator 1.6 0.04 <.01 5.0
Notes: C Statistic = 0.71. Wave 1 indicates beneficiary is aligned to a Wave 1 PY1 joiner facility and Wave 2 indicates beneficiary is aligned to a Wave 2 PY2 joiner facility.
Exhibit G-10. Model 2c—Complete-Year Cox Model: Incident BeneficiariesCEC vs Comparison Effect 95% Lower CI 95% Upper CI p-valueWave 1 -0.01 -0.06 0.04 0.66Wave 2 -0.02 -0.07 0.03 0.34
CEC vs Comparison Hazard Ratio 95% Lower CI 95% Upper CI p-valueWave 1 0.99 0.94 1.04 0.66Wave 2 0.98 0.93 1.03 0.39
Notes: Wave 1 indicates beneficiary is aligned to a Wave 1 PY1 joiner facility and Wave 2 indicates beneficiary is aligned to a Wave 2 PY2 joiner facility.
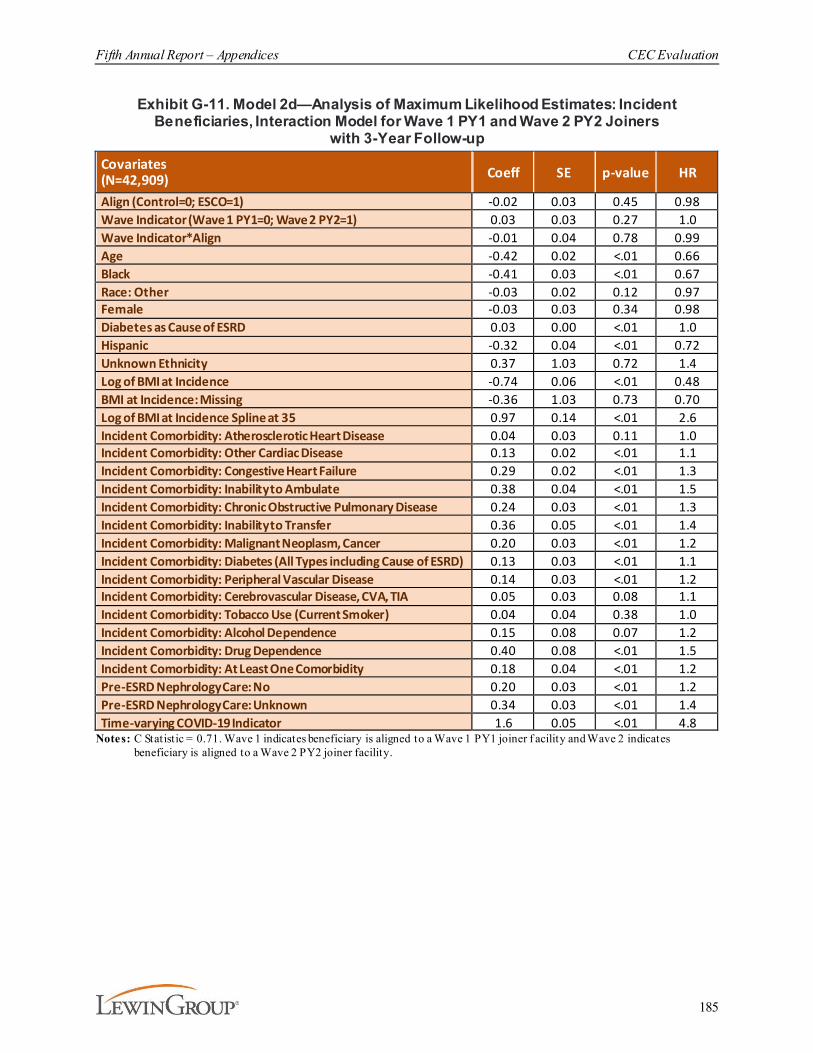
Fifth Annual Report – Appendices CEC Evaluation
185
Exhibit G-11. Model 2d—Analysis of Maximum Likelihood Estimates: Incident Beneficiaries, Interaction Model for Wave 1 PY1 and Wave 2 PY2 Joiners
with 3-Year Follow-upCovariates (N=42,909) Coeff SE p-value HR
Align (Control=0; ESCO=1) -0.02 0.03 0.45 0.98Wave Indicator (Wave 1 PY1=0; Wave 2 PY2=1) 0.03 0.03 0.27 1.0Wave Indicator*Align -0.01 0.04 0.78 0.99Age -0.42 0.02 <.01 0.66Black -0.41 0.03 <.01 0.67Race: Other -0.03 0.02 0.12 0.97Female -0.03 0.03 0.34 0.98Diabetes as Cause of ESRD 0.03 0.00 <.01 1.0Hispanic -0.32 0.04 <.01 0.72Unknown Ethnicity 0.37 1.03 0.72 1.4Log of BMI at Incidence -0.74 0.06 <.01 0.48BMI at Incidence: Missing -0.36 1.03 0.73 0.70Log of BMI at Incidence Spline at 35 0.97 0.14 <.01 2.6Incident Comorbidity: Atherosclerotic Heart Disease 0.04 0.03 0.11 1.0Incident Comorbidity: Other Cardiac Disease 0.13 0.02 <.01 1.1Incident Comorbidity: Congestive Heart Failure 0.29 0.02 <.01 1.3Incident Comorbidity: Inability to Ambulate 0.38 0.04 <.01 1.5Incident Comorbidity: Chronic Obstructive Pulmonary Disease 0.24 0.03 <.01 1.3Incident Comorbidity: Inability to Transfer 0.36 0.05 <.01 1.4Incident Comorbidity: Malignant Neoplasm, Cancer 0.20 0.03 <.01 1.2Incident Comorbidity: Diabetes (All Types including Cause of ESRD) 0.13 0.03 <.01 1.1Incident Comorbidity: Peripheral Vascular Disease 0.14 0.03 <.01 1.2Incident Comorbidity: Cerebrovascular Disease, CVA, TIA 0.05 0.03 0.08 1.1Incident Comorbidity: Tobacco Use (Current Smoker) 0.04 0.04 0.38 1.0Incident Comorbidity: Alcohol Dependence 0.15 0.08 0.07 1.2Incident Comorbidity: Drug Dependence 0.40 0.08 <.01 1.5Incident Comorbidity: At Least One Comorbidity 0.18 0.04 <.01 1.2Pre-ESRD Nephrology Care: No 0.20 0.03 <.01 1.2Pre-ESRD Nephrology Care: Unknown 0.34 0.03 <.01 1.4Time-varying COVID-19 Indicator 1.6 0.05 <.01 4.8
Notes: C Statistic = 0.71. Wave 1 indicates beneficiary is aligned to a Wave 1 PY1 joiner f acility and Wave 2 indicates beneficiary is aligned to a Wave 2 PY2 joiner facility.
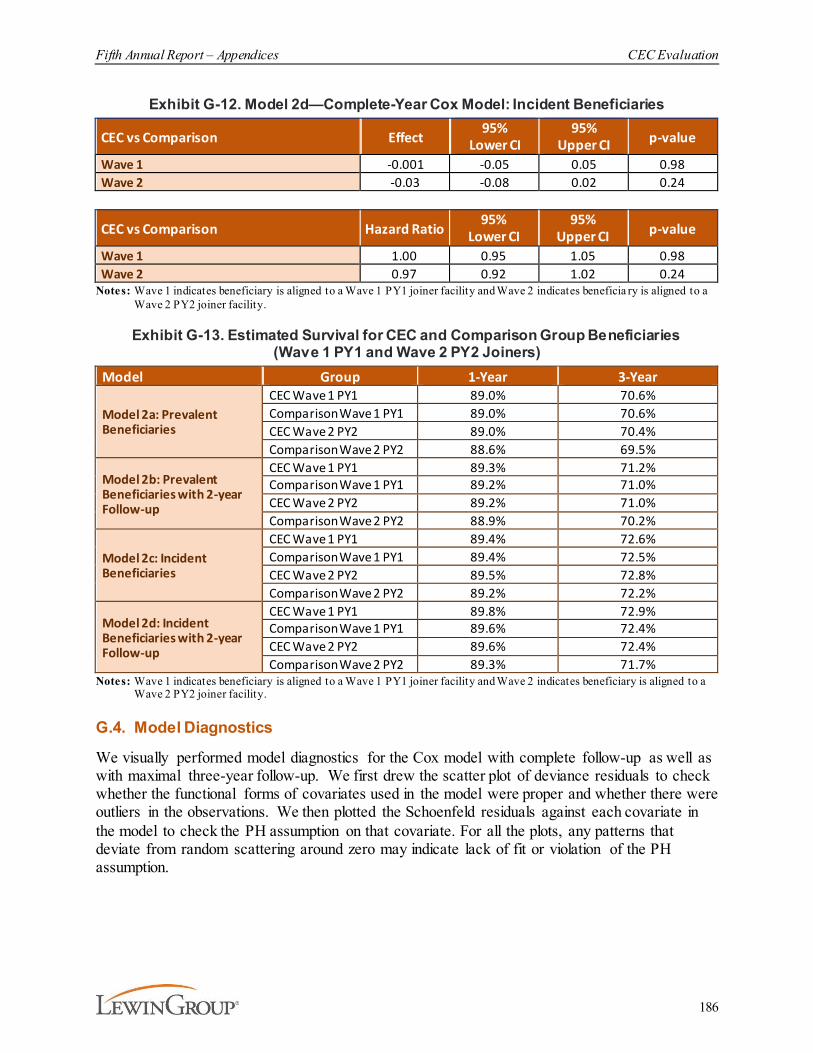
Fifth Annual Report – Appendices CEC Evaluation
186
Exhibit G-12. Model 2d—Complete-Year Cox Model: Incident Beneficiaries
CEC vs Comparison Effect95%
Lower CI95%
Upper CI p-value
Wave 1 -0.001 -0.05 0.05 0.98Wave 2 -0.03 -0.08 0.02 0.24
CEC vs Comparison Hazard Ratio95%
Lower CI95%
Upper CI p-value
Wave 1 1.00 0.95 1.05 0.98Wave 2 0.97 0.92 1.02 0.24
Notes: Wave 1 indicates beneficiary is aligned to a Wave 1 PY1 joiner facility and Wave 2 indicates beneficia ry is aligned to a Wave 2 PY2 joiner facility.
Exhibit G-13. Estimated Survival for CEC and Comparison Group Beneficiaries (Wave 1 PY1 and Wave 2 PY2 Joiners)
Model Group 1-Year 3-Year
Model 2a: Prevalent Beneficiaries
CEC Wave 1 PY1 89.0% 70.6%Comparison Wave 1 PY1 89.0% 70.6%CEC Wave 2 PY2 89.0% 70.4%Comparison Wave 2 PY2 88.6% 69.5%
Model 2b: Prevalent Beneficiaries with 2-year Follow-up
CEC Wave 1 PY1 89.3% 71.2%Comparison Wave 1 PY1 89.2% 71.0%CEC Wave 2 PY2 89.2% 71.0%Comparison Wave 2 PY2 88.9% 70.2%
Model 2c: Incident Beneficiaries
CEC Wave 1 PY1 89.4% 72.6%Comparison Wave 1 PY1 89.4% 72.5%CEC Wave 2 PY2 89.5% 72.8%Comparison Wave 2 PY2 89.2% 72.2%
Model 2d: Incident Beneficiaries with 2-year Follow-up
CEC Wave 1 PY1 89.8% 72.9%Comparison Wave 1 PY1 89.6% 72.4%CEC Wave 2 PY2 89.6% 72.4%Comparison Wave 2 PY2 89.3% 71.7%
Notes: Wave 1 indicates beneficiary is aligned to a Wave 1 PY1 joiner facility and Wave 2 indicates beneficiary is aligned to a Wave 2 PY2 joiner facility.
G.4. Model Diagnostics
We visually performed model diagnostics for the Cox model with complete follow-up as well as with maximal three-year follow-up. We first drew the scatter plot of deviance residuals to check whether the functional forms of covariates used in the model were proper and whether there were outliers in the observations. We then plotted the Schoenfeld residuals against each covariate in the model to check the PH assumption on that covariate. For all the plots, any patterns that deviate from random scattering around zero may indicate lack of fit or violation of the PH assumption.
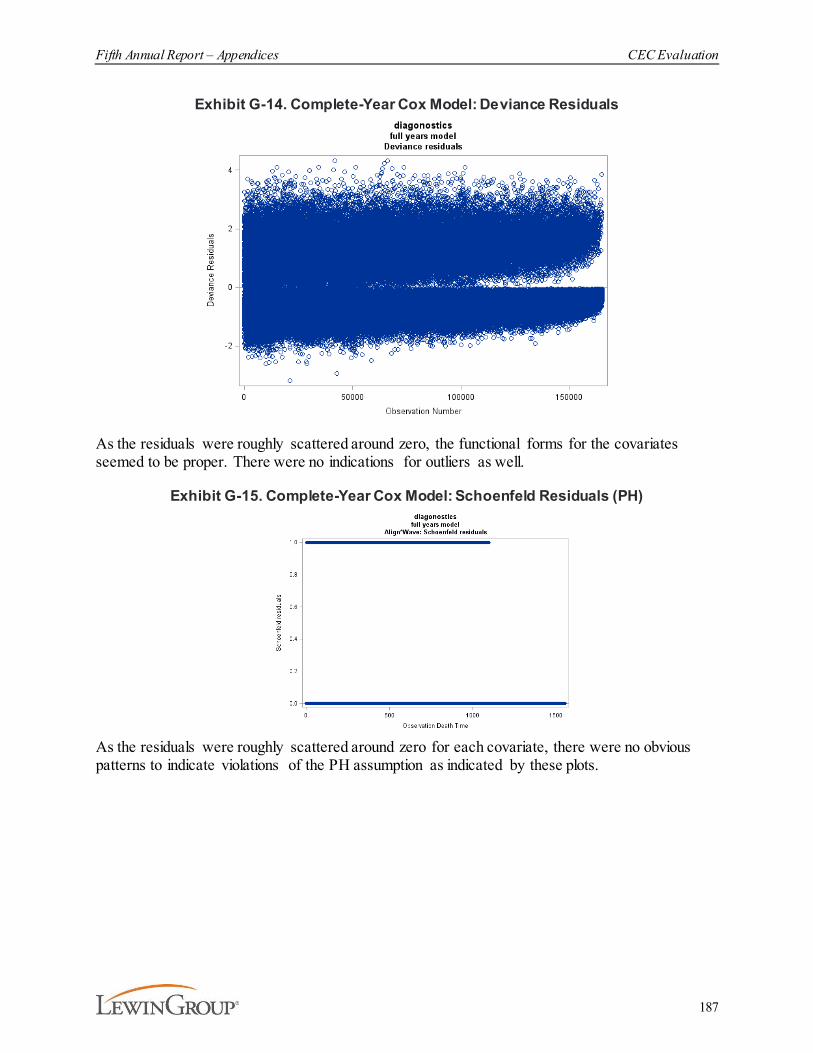
Fifth Annual Report – Appendices CEC Evaluation
187
Exhibit G-14. Complete-Year Cox Model: Deviance Residuals
As the residuals were roughly scattered around zero, the functional forms for the covariates seemed to be proper. There were no indications for outliers as well.
Exhibit G-15. Complete-Year Cox Model: Schoenfeld Residuals (PH)
As the residuals were roughly scattered around zero for each covariate, there were no obvious patterns to indicate violations of the PH assumption as indicated by these plots.

Fifth Annual Report – Appendices CEC Evaluation
188
Exhibit G-16. 2-Year Cox Model: Deviance Residuals
As the residuals were roughly scattered around zero, the functional forms for the covariates seemed to be proper. There were no indications for outliers as well.
Exhibit G-17. 2-Year Cox Model: Schoenfeld Residuals (PH)
As the residuals were roughly scattered around zero for each covariate, there were no obvious patterns to indicate violations of the PH assumption as indicated by these plots.