Complementary use of Fourier transform laser microprobe mass spectrometry and time-of-flight static...
10
RAPID COMMUNICATIONS IN MASS SPECTROMETRY Rapid Commun. Mass Spectrom. 2005; 19: 2809–2818 Published online in Wiley InterScience (www.interscience.wiley.com). DOI: 10.1002/rcm.2121 Complementary use of Fourier transform laser microprobe mass spectrometry and time-of-flight static secondary ion mass spectrometry for the study of the surface adsorption of organic dyes on silicate materials Alina-Maria Busuioc 1 *, Roel De Mondt 1 , Harri Moisio 1 , Pegie Cool 1 , Aurelia Vasile 2 , Nicolae Bilba 2 , Etienne Vansant 1 and Luc Van Vaeck 1 1 Micro- and Trace Analysis Centre (MiTAC), Department of Chemistry, University of Antwerpen (CDE), Universiteitsplein 1, 2610 Wilrijk, Belgium 2 ‘Al.I. Cuza’ University of Iasi, Department of Chemical Technologyand Materials Chemistry, B.-dul Carol I 11, RO-700506 Iasi, Romania Received 6 June 2005; Revised 27 July 2005; Accepted 27 July 2005 The adsorption of organic ionic dyes on different pore size engineered silica materials with poten- tial application for industrial wastewater treatment has been investigated using Fourier transform laser microprobe mass spectrometry (FT-LMMS) and time-of-flight secondary ion mass spectrome- try (TOF-S-SIMS). The complementary use of the two methods with different information depth allowed data on the subsurface distribution and pore penetration of the adsorbed organic com- pounds. Macroscopic methods were employed to determine the amount adsorbed on the particles and the specific external surface area. Local MS analysis allows identification of the organic dyes exclusively at the outer particle surface when the pore size is inferior to the size of the adsorbing molecule, or at the surface of the channels inside the material. Specifically, the monolayer informa- tion depth of TOF-S-SIMS causes a signal to refer essentially to the adsorbate at the outer particle surface, which is only a fraction of the total adsorption in mesoporous materials, while FT-LMMS allowed detection of the presence of adsorbates at the outer surface as well as inside the subsurface of 10 to 50 nm depending on the material under study. The observed data open perspectives for the molecular monitoring of the adsorption behaviour of different materials at the (sub) mm scale. Copyright # 2005 John Wiley & Sons, Ltd. Fifteen percent of the total world production of dyes is lost during dyeing processes and is released in textile effluents. 1 The release of these colour wastewaters in the ecosystem is a dramatic source of aesthetic pollution, eutrophication and perturbation of aquatic life. As international environmental standards are becoming more stringent, technological systems for the removal of organic pollutants such as dyes, herbicides, pesticides, etc., have been developed. Decolouri- sation of dye effluents is, today, the principal problem concerning the textile industry. Physical (adsorption), bio- logical (biodegradation 2 ) and chemical (chlorination, ozoni- sation, photodegradation 3 ) methods are the most frequently used. Among these, traditional physical techniques like adsorption on activated carbons, ultrafiltration, reverse osmosis, coagulation by chemical agents, or ion exchange by synthetic adsorbent resins, can be used efficiently. 4–7 Adsorption of dyes on the surface of various materials represents an important and intensively studied phenom- enon. The most studied systems are membrane filters, 8 polymers, 9 biological cells, 10 and inorganic sorbents. Pelekani and Snoeyink 11 investigated the competitive adsor- ption between atrazine and methylene blue on activated carbon. Khattri and Singh 12 used a bio-adsorbent for removal of synthetic dyes from wastewaters. Demirbas 13 studied the removal of Victoria blue from aqueous solutions using perlite (a glassy volcanic rock). Among the use of inorganic sorbents, silicas deserve attention because of the chemical reactivity of their surfaces, resulting from the presence of silanol groups. Of particular interest are the micro- and mesoporous silicate materials because of their high surface area (300 – 1400 m 2 /g) and tune- able pore sizes that can be tailored to suit specific require- ments, making them versatile and attractive for these applications. One of the prime aspects to be considered in the development of absorbents for practical applications is the fundamental relationship between the pore size and the size of the molecule as a determining factor for the adsorption behaviour on the specific adsorbent. This work selected a microporous absorbent (silicalite-1) and three different types of mesoporous silicate materials (MCM-41, SBA-15 and silica gel), while quartz was used as a non-porous reference material for comparative purposes. Copyright # 2005 John Wiley & Sons, Ltd. *Correspondence to: A.-M. Busuioc, Department of Chemistry, University of Antwerpen (UA), Universiteitsplein 1, B 2610 Wilrijk, Belgium. E-mail: [email protected]
-
Upload
independent -
Category
Documents
-
view
3 -
download
0
Transcript of Complementary use of Fourier transform laser microprobe mass spectrometry and time-of-flight static...
RAPID COMMUNICATIONS IN MASS SPECTROMETRY
Rapid Commun. Mass Spectrom. 2005; 19: 2809–2818
Published online in Wiley InterScience (www.interscience.wiley.com). DOI: 10.1002/rcm.2121
Complementary use of Fourier transform laser
microprobe mass spectrometry and time-of-flight static
secondary ion mass spectrometry for the study of the
surface adsorption of organic dyes on silicate materials
Alina-Maria Busuioc1*, Roel De Mondt1, Harri Moisio1, Pegie Cool1, Aurelia Vasile2,
Nicolae Bilba2, Etienne Vansant1 and Luc Van Vaeck1
1Micro- and Trace Analysis Centre (MiTAC), Department of Chemistry, University of Antwerpen (CDE), Universiteitsplein 1, 2610 Wilrijk, Belgium2‘Al.I. Cuza’ University of Iasi, Department of Chemical Technology and Materials Chemistry, B.-dul Carol I 11, RO-700506 Iasi, Romania
Received 6 June 2005; Revised 27 July 2005; Accepted 27 July 2005
The adsorption of organic ionic dyes on different pore size engineered silica materials with poten-
tial application for industrial wastewater treatment has been investigated using Fourier transform
laser microprobe mass spectrometry (FT-LMMS) and time-of-flight secondary ion mass spectrome-
try (TOF-S-SIMS). The complementary use of the two methods with different information depth
allowed data on the subsurface distribution and pore penetration of the adsorbed organic com-
pounds. Macroscopic methods were employed to determine the amount adsorbed on the particles
and the specific external surface area. Local MS analysis allows identification of the organic dyes
exclusively at the outer particle surface when the pore size is inferior to the size of the adsorbing
molecule, or at the surface of the channels inside the material. Specifically, the monolayer informa-
tion depth of TOF-S-SIMS causes a signal to refer essentially to the adsorbate at the outer particle
surface, which is only a fraction of the total adsorption in mesoporous materials, while FT-LMMS
allowed detection of the presence of adsorbates at the outer surface as well as inside the subsurface
of 10 to 50nm depending on the material under study. The observed data open perspectives for the
molecular monitoring of the adsorption behaviour of different materials at the (sub) mm scale.
Copyright # 2005 John Wiley & Sons, Ltd.
Fifteen percent of the total world production of dyes is lost
during dyeing processes and is released in textile effluents.1
The release of these colour wastewaters in the ecosystem is a
dramatic source of aesthetic pollution, eutrophication and
perturbation of aquatic life. As international environmental
standards are becoming more stringent, technological
systems for the removal of organic pollutants such as dyes,
herbicides, pesticides, etc., have been developed. Decolouri-
sation of dye effluents is, today, the principal problem
concerning the textile industry. Physical (adsorption), bio-
logical (biodegradation2) and chemical (chlorination, ozoni-
sation, photodegradation3) methods are the most frequently
used. Among these, traditional physical techniques like
adsorption on activated carbons, ultrafiltration, reverse
osmosis, coagulation by chemical agents, or ion exchange
by synthetic adsorbent resins, can be used efficiently.4–7
Adsorption of dyes on the surface of various materials
represents an important and intensively studied phenom-
enon. The most studied systems are membrane filters,8
polymers,9 biological cells,10 and inorganic sorbents.
Pelekani and Snoeyink11 investigated the competitive adsor-
ption between atrazine and methylene blue on activated
carbon. Khattri and Singh12 used a bio-adsorbent for removal
of synthetic dyes from wastewaters. Demirbas13 studied the
removal of Victoria blue from aqueous solutions using perlite
(a glassy volcanic rock).
Among the use of inorganic sorbents, silicas deserve
attention because of the chemical reactivity of their surfaces,
resulting from the presence of silanol groups. Of particular
interest are the micro- and mesoporous silicate materials
because of their high surface area (300–1400 m2/g) and tune-
able pore sizes that can be tailored to suit specific require-
ments, making them versatile and attractive for these
applications.
One of the prime aspects to be considered in the
development of absorbents for practical applications is the
fundamental relationship between the pore size and the size
of the molecule as a determining factor for the adsorption
behaviour on the specific adsorbent. This work selected a
microporous absorbent (silicalite-1) and three different types
of mesoporous silicate materials (MCM-41, SBA-15 and silica
gel), while quartz was used as a non-porous reference
material for comparative purposes.
Copyright # 2005 John Wiley & Sons, Ltd.
*Correspondence to: A.-M. Busuioc, Department of Chemistry,University of Antwerpen (UA), Universiteitsplein 1, B 2610Wilrijk, Belgium.E-mail: [email protected]
Silicalite-1, one of the most studied pure siliceous micro-
porous molecular sieves in which the pores are created by
interconnected ring-like structures, exhibits non-polar char-
acteristics such as low organophilicity, hydrophobicity, high
thermal stability (at least 7008C), good chemical stability in
acidic conditions, and high size selectivity. The structural
porosity of silicalite-1 consists of sinusoidal channels
(a-direction) with a circular cross-section (5.5� 5.1 A), which
are interconnected with straight channels (b-direction) of
elliptic cross-section (5.6� 5.4 A).
However, microporous materials have several limitations
for the adsorption of large molecules because of steric effects.
For this reason, an important line of research has focused on
the enlargement of the pore sizes into the mesoporous range
(2<d< 50 nm).14 Therefore, the discovery of the mesoporous
silica-based materials such as MCM-41 (i.e., Mobile Corp.
Composite Matter, No 41) in 199215 has expanded signifi-
cantly the possibilities for the adsorption of bulky molecules.
MCM-41 has a honeycomb structure that results from a
hexagonal packing of aligned cylindrical pores. It is an
amorphous hydroxylated silicate consisting of Si(OSi)4 and
Si(OSi)3OH species. The pore sizes can be tailored from 2 to
10 nm using different templating agents, swelling agents,
longer ageing period, or higher synthesis temperature. The
high surface area (>1000 m2 g�1), narrow pore size distribu-
tions and highly ordered structures make these materials
attractive for adsorption of various bulky molecules.
A major drawback of MCM-41 for the removal of dyes from
wastewaters is the lack of hydrothermal stability. An
alternative is the SBA-15 material (named after the Santa
Barbara laboratory that synthesised this material for the first
time) which is also a pure siliceous material with large pores
in the mesoporous range (typically 7–8 nm) and a high
surface area (usually 700–900 m2/g). Its structure consists
also of a honeycomb arrangement of one-dimensional pores.
The thickness and microporosity of the walls improve the
thermal and hydrothermal stability.
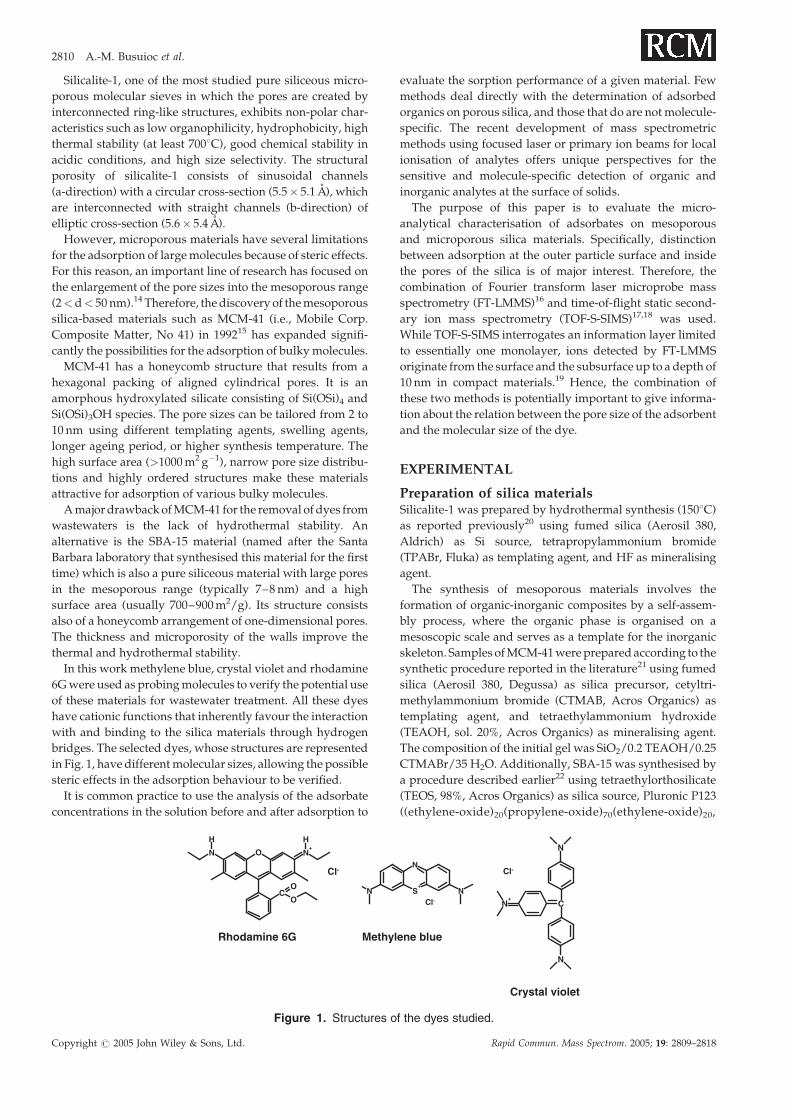
In this work methylene blue, crystal violet and rhodamine
6G were used as probing molecules to verify the potential use
of these materials for wastewater treatment. All these dyes
have cationic functions that inherently favour the interaction
with and binding to the silica materials through hydrogen
bridges. The selected dyes, whose structures are represented
in Fig. 1, have different molecular sizes, allowing the possible
steric effects in the adsorption behaviour to be verified.
It is common practice to use the analysis of the adsorbate
concentrations in the solution before and after adsorption to
evaluate the sorption performance of a given material. Few
methods deal directly with the determination of adsorbed
organics on porous silica, and those that do are not molecule-
specific. The recent development of mass spectrometric
methods using focused laser or primary ion beams for local
ionisation of analytes offers unique perspectives for the
sensitive and molecule-specific detection of organic and
inorganic analytes at the surface of solids.
The purpose of this paper is to evaluate the micro-
analytical characterisation of adsorbates on mesoporous
and microporous silica materials. Specifically, distinction
between adsorption at the outer particle surface and inside
the pores of the silica is of major interest. Therefore, the
combination of Fourier transform laser microprobe mass
spectrometry (FT-LMMS)16 and time-of-flight static second-
ary ion mass spectrometry (TOF-S-SIMS)17,18 was used.
While TOF-S-SIMS interrogates an information layer limited
to essentially one monolayer, ions detected by FT-LMMS
originate from the surface and the subsurface up to a depth of
10 nm in compact materials.19 Hence, the combination of
these two methods is potentially important to give informa-
tion about the relation between the pore size of the adsorbent
and the molecular size of the dye.
EXPERIMENTAL
Preparation of silica materialsSilicalite-1 was prepared by hydrothermal synthesis (1508C)
as reported previously20 using fumed silica (Aerosil 380,
Aldrich) as Si source, tetrapropylammonium bromide
(TPABr, Fluka) as templating agent, and HF as mineralising
agent.
The synthesis of mesoporous materials involves the
formation of organic-inorganic composites by a self-assem-
bly process, where the organic phase is organised on a
mesoscopic scale and serves as a template for the inorganic
skeleton. Samples of MCM-41 were prepared according to the
synthetic procedure reported in the literature21 using fumed
silica (Aerosil 380, Degussa) as silica precursor, cetyltri-
methylammonium bromide (CTMAB, Acros Organics) as
templating agent, and tetraethylammonium hydroxide
(TEAOH, sol. 20%, Acros Organics) as mineralising agent.
The composition of the initial gel was SiO2/0.2 TEAOH/0.25
CTMABr/35 H2O. Additionally, SBA-15 was synthesised by
a procedure described earlier22 using tetraethylorthosilicate
(TEOS, 98%, Acros Organics) as silica source, Pluronic P123
((ethylene-oxide)20(propylene-oxide)70(ethylene-oxide)20,
O N+
N
CO
O
H H
Cl-
CN+
N
N
Cl-
S+
N
NNCl-
Rhodamine 6G Methylene blue
Crystal violet
Figure 1. Structures of the dyes studied.
Copyright # 2005 John Wiley & Sons, Ltd. Rapid Commun. Mass Spectrom. 2005; 19: 2809–2818
2810 A.-M. Busuioc et al.
Aldrich) as templating agent, and HCl (37%, Aldrich) as
mineralising agent.
Characterisation of the materialPorosity and surface area were determined using a Quanta-
chrome Autosorb-1-MP automated gas adsorption system
using nitrogen as the adsorbate at liquid nitrogen tempera-
ture (77 K). All samples were outgassed under vacuum for
16 h at 2008C before measurements. The pore diameter was
obtained from the nitrogen adsorption branch using the
Barrett-Joyner-Halenda (BJH) method. The surface area was
calculated using the Brunauer-Emmett-Teller (BET) method.
Additionally, X-ray diffractograms were recorded using a
Phillips PW 1840 powder diffractometer, with Ni-filtered
CuKa radiation.
Adsorption experimentSiliceous material (100 mg) was added to 100 mL of aqueous
dye solutions with an initial concentration of 1� 10�4 M. The
suspensions were magnetically stirred for 180 min. At given
intervals, aliquots of 4 mL were taken, centrifuged for 15 min
at 3700 rpm, and then analysed by UV-VIS spectroscopy
using a Nicolet e-500 spectrophotometer. The wavelengths
used for the detection of rhodamine 6G, crystal violet and
methylene blue were 526, 590 and 665 nm, respectively.
The remaining suspension was filtrated through a Milli-
pore filter (HAWP 0.45 mm) and the filtered material was used
for surface analysis after drying in a desiccator.
Surface analysisThe S-SIMS experiments were performed using an Ion TOF
IV instrument (Cameca-Ion ToF). The liquid metal ion gun
(LMIG) was used to generate 25 keV Gaþ primary ions. The
gun was operated in the bunched mode with a final pulse
width of 800 ps, allowing nominal mass resolution (10% val-
ley) to be achieved up to m/z 1000. Mass spectra were
acquired from 100� 100mm2 areas during 150 s, resulting in
a total ion dose density below 1013 ions cm�2 on the sample,
which is generally accepted to be under the static limit. As the
impact of a primary ion destroys the molecular structures in
the sample over a given area (typically 10 nm2) around the
point of impact, detection of molecular information in S-
SIMS implies that no spot should be hit twice. The static limit
refers to the maximum allowable ion dose density, and is
determined as the ion dose that makes less than 1% of the sur-
face area inadequate for further analysis. A full discussion is
given elsewhere.17 Mass spectra were calibrated using the
signals for Hþ, Cþ, CHþ, CH2þ, CH3
þ and C3H3þ at m/z 1, 12,
13, 14, 15 and 39, respectively. Electron flooding was used
for charge compensation during the analysis of samples of
silica gel and quartz.
The quartz samples were prepared by pressing particles
into indium foil. For all other materials, pellets were made
using a common die with diameter of 10 mm and a pressure
of 9 tons. Limiting the amount of powder allows pellets with a
thickness of less than 1 mm to be made. Only a small fragment
of the pellet with a flat surface was introduced for analysis to
keep the pump-down time limited.
To account for the possible local heterogeneity, each
sample was measured on at least three different spots.
Absolute intensities at the same primary ion dose and under
identical instrumental conditions were used for quantitative
comparison of the dye concentrations at the surface.
The FT-LMMS instrument with external ion source (here
‘external’ means outside the magnet as opposed to double-
cell instruments in which the sample is ionised inside the
magnetic field) was adapted from the commercial Spectro-
spin CMS 47X Fourier transform mass spectrometer with the
ASPECT 3000 data system.23 An Infinity cell24 in a 4.7 Tesla
magnet is employed, and static electrical fields transport ions
from source to cell. Transfer optics developed in-house25
have been installed, improving the transmission by a factor of
10. Differential pumping permits maintaining about
10�8 Torr in the source and 2� 10�10 Torr in the cell. Samples
are ionised in the reflection geometry, i.e. the laser beam
impinges on the surface at an angle of 458 with the normal on
the sample, and the ions are extracted along the normal from
the same side of the sample. Ionisation is achieved with a
high-power frequency-quadrupled Nd:YAG laser (Quanta-
Ray DCR 2-10) focused to a 5 mm spot. The local power
density on the sample can be adjusted to between 107 and
1010 W cm�2. High-resolution data are collected with a
bandwidth of 2 kHz.
The use of static electrical fields for the transfer of ions
between the external source and the cell, in combination with
ion generation within a time domain of less than a ms, limits
panoramic registration in the broadband mode to given m/z
intervals. During their travel through the flight tubes of the
transport optics, ions of different m/z become separated as in
a TOF mass spectrometer. As a result, ions with low m/z
arrive sooner at the entrance of the cell than highm/z ions. The
first trap plate is grounded to allow ions to enter the cell. Once
inside the cell, ions reflect against the second trap and escape
the cell unless the trapping potential is restored on the front
plate. At that moment, ions can no longer enter the cell. As a
result, the m/z range for simultaneous trapping is limited to
the highest m/z for which the time dispersion during ion
transport is less than the time needed for one back-and-forth
movement of the ions with lowest m/z within the cell. The
Tgate parameter refers to the time between the laser pulse and
the end of the ion injection into the FT cell, and determines in
practice which m/z range can be recorded. A full description
of the influence of the TOF effect on the mass spectra and the
use of the Tgate parameter is given elsewhere.23
The m/z scale was externally calibrated using CsI or Bi2O3.
High-resolution data were used for the quantitative compar-
ison of the local dye concentrations. At least three different
spots were analysed on each sample. The data were
accumulated from 50 individual laser shots.
Small quantities of sample were ground between micro-
scope slides or using a grinding mortar. The fine particle
fraction was mounted on the sample holder by double-sided
tape.
RESULTS AND DISCUSSION
Before going into the details of quantitative assessment for
the local concentrations of dyes at the surface and in the sub-
surface, it will be profitable to address the qualitative infor-
mation obtained by the mass spectra in TOF-S-SIMS and
Surface adsorption of organic dyes on silicate materials 2811
Copyright # 2005 John Wiley & Sons, Ltd. Rapid Commun. Mass Spectrom. 2005; 19: 2809–2818
FT-LMMS with respect to the detection of structure-specific
ions and to the sensitivity. Although both methods are cap-
able of delivering signals that are characteristic of the molecu-
lar structure of the analyte under study, the use of primary
ions with an impact energy of 25 keV in S-SIMS, and the irra-
diation of the solid with photons each of which impart only a
4.6 eV to the sample, is generally assumed to give rise to fun-
damentally different mechanisms of energy deposition, exci-
tation of the solid, and desorption-ionisation (DI) of the
analytes. Furthermore, there is a fundamental difference
between the two methods in that the highly destructive pri-
mary ion beam destroys the molecular structures in the sub-
surface and hence analysis must be restricted to the ultimate
monolayer at the surface. The interaction between a single
primary ion and the sample remains confined to an area of
typically 10 nm2 at the surface and a depth of 25–50 nm
(depending on the projectile energy). At the low primary
ion currents used in S-SIMS, primary ions deposit their
energy in physically separated nanospots within the bom-
barded spot with a diameter of 100–200 nm. In contrast,
LMMS uses laser pulse irradiation, releasing low energy
photons (4.6 eV for l¼ 266 nm) during 8 ns on a spot with dia-
meter of 1–5mm. The ultra-fast relaxation of the absorbed
energy within the irradiated volume means that the processes
leading to the final desorption are more collective in nature
compared to those in S-SIMS. The collective and softer pro-
cesses in LMMS avoid the in-depth destruction of molecular
structures that is typical of S-SIMS, and imply that the
immediate subsurface can contribute to the detected ions in
LMMS. While the information depth in S-SIMS is 1 mono-
layer, experiments have shown that of FT-LMMS can be as
large as 10–50 nm.16,19 On the other hand, the inherent trans-
mission of FT-LMMS with an external ion source is lower
than that of a TOF analyser because of the unavoidable losses
during ion deceleration and injection through a small orifice
in the front plate, while the inhomogeneous stray field of the
4.7 Tesla magnet complicates ion beam focusing.25 Further-
more, the detection efficiency of ions by means of the image
currents in FTMS is also inferior to that used in ion transport
MS such as TOF-S-SIMS.16
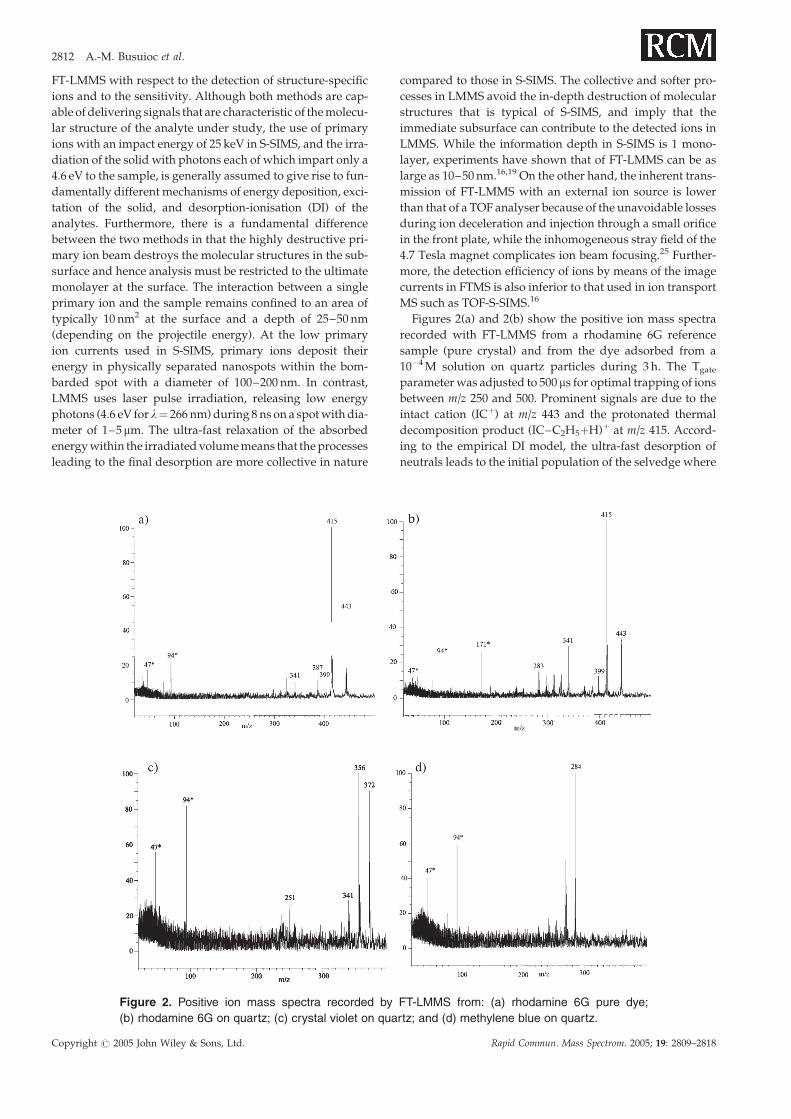
Figures 2(a) and 2(b) show the positive ion mass spectra
recorded with FT-LMMS from a rhodamine 6G reference
sample (pure crystal) and from the dye adsorbed from a
10�4 M solution on quartz particles during 3 h. The Tgate
parameter was adjusted to 500 ms for optimal trapping of ions
between m/z 250 and 500. Prominent signals are due to the
intact cation (ICþ) at m/z 443 and the protonated thermal
decomposition product (IC–C2H5þH)þ at m/z 415. Accord-
ing to the empirical DI model, the ultra-fast desorption of
neutrals leads to the initial population of the selvedge where
Figure 2. Positive ion mass spectra recorded by FT-LMMS from: (a) rhodamine 6G pure dye;
(b) rhodamine 6G on quartz; (c) crystal violet on quartz; and (d) methylene blue on quartz.
2812 A.-M. Busuioc et al.
Copyright # 2005 John Wiley & Sons, Ltd. Rapid Commun. Mass Spectrom. 2005; 19: 2809–2818

detected ions are formed by either electron ionisation or
adduct ionisation.16 The extremely rapid heating of the solid
by the laser allows a significant fraction of the thermolabiles
to be released intact but still some thermal degradation is to
be expected. The most obvious decomposition of the intact
cation is the heterolytic cleavage of the ethyl group from the
quaternised nitrogen. The resulting neutral is protonated to
form the ions at m/z 415. Scheme 1 illustrates the tentative
pathways leading to the detected ions for rhodamine 6G. The
accurate m/z determinations supporting the structural
assignments in Scheme 1 are listed in Table 1. The spectrum
in Fig. 2(b) recorded by FT-LMMS from the adsorbed dye on
quartz shows that the ions of main diagnostic interest are
detected with good signal-to-noise (S/N) ratio. Based on
measurements of the amount absorbed per g and the specific
surface area, 21.33� 10�5 g rhodamine 6G were adsorbed
per m2 (cf. Table 3). Assuming that the density of rhodamine
6G is 1 g cm�3, this corresponds to a total volume of 22.33�10�5 cm3 per m2, resulting in an average thickness of the
coating (assuming perfectly homogeneous coverage) of
about 0.22 nm, i.e. less than a monolayer. Hence, FT-LMMS
provides the unique combination of an information depth
covering the subsurface over a depth of typically 10 nm
together with a detection sensitivity sufficient to trace back
the presence of analytes in the form of a (few) monolayer(s).
There is a slight difference in the relative intensities of the
signals at m/z 415 and 443 generated from the dye on quartz,
while the fragments atm/z 341 are also substantially higher in
comparison to the results for the pure dye. Both of the relative
increases of the signal intensities at m/z 413 and 341 directly
refer to the relative abundances of the thermal decomposition
products. The presence of the dye as an ultra-thin layer on a
quartz substrate means that the energy deposition primarily
occurs in the inorganic substrate as opposed to the organic
material in the laser irradiation of a pure dye crystal. Apart
from such readily conceived effects on the relative intensities,
there is no matrix effect observed in FT-LMMS, and the mass
spectra of mixtures obtained by this method simply consist of
superpositions of the mass spectra for each individual
component.
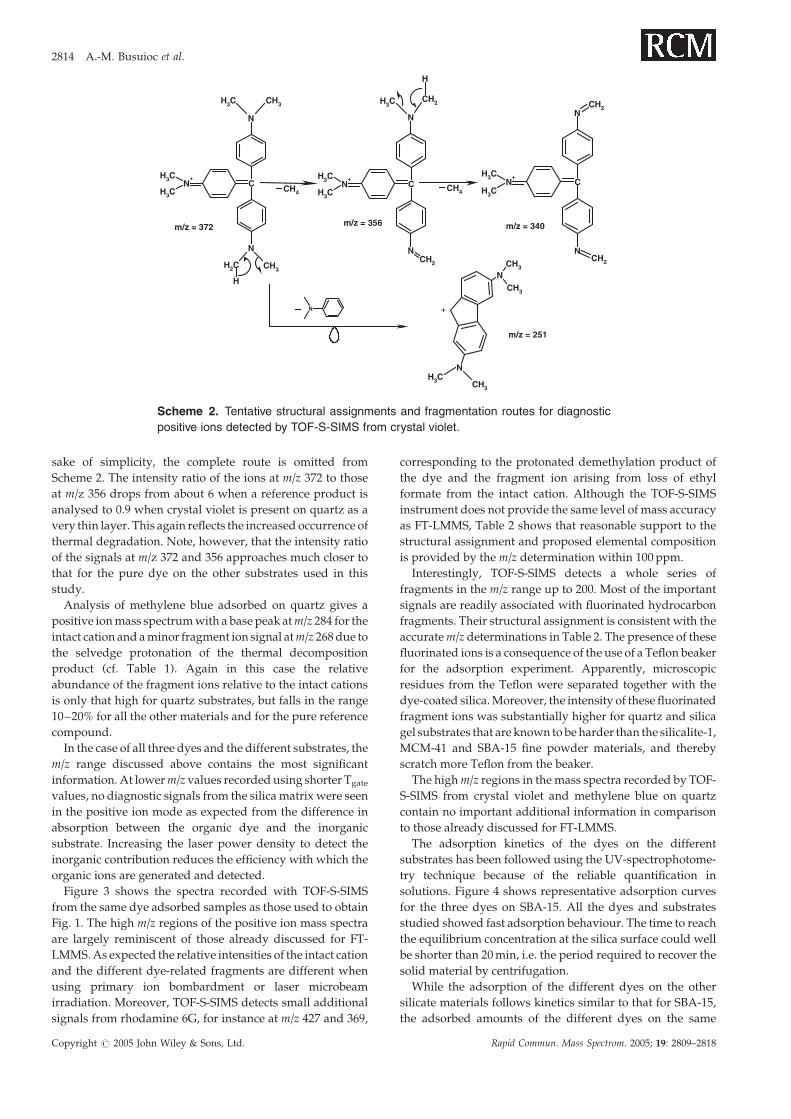
The results for crystal violet confirm the previously
observed trends. The signal at m/z 372 refers to the intact
cation. As illustrated in Scheme 2, the main fragmentation is
due to the loss of CH4 yielding the ions at m/z 356. The
formation of the ions at m/z 251 formally involves the loss of
dimethylaniline from the intact cation (cf. Table 1). For the
Table 1. Accuratem/zmeasurements for the major positive
ions in the FT-LMMS spectra from the dyes on silica
Nominalm/z
Elementalcomposition
Experimentalm/z
Theoreticalm/z
Experimentalerror
Rhodamine 6G443 C28H31N2O3 443.2329 443.2326 0.81415 C26H27N2O3 415.2016 415.2016 0.14341 C23H21N2O 341.1648 341.1644 1.36
Crystal violet372 C25H30N3 372.2434 372.2428 1.65356 C24H26N3 356.2121 356.212 0.24341 C23H22N3 340.1808 340.1807 0.34251 C17H19N2 251.1543 251.1543 0.12
Methylene blue284 C16H18N3S 284.1216 284.12159 0.12269 C15H15N3S 269.0993 269.0988 1.42
O N+
H
CH3
N
CH3
C O
H
O
H
O
CH3
N N+
CH2
CH3
CO
H
H
O
O
CH3
N N+
H
H
CH2
CO
H
HH
O N+
H
CH3
N
CH3
H
O N+
H
H
CH3
N
CH3
HN O
CH3
N+
H
H
CO
O
H
CH2CH3
CH4
HCOOCH2CH3
CH4 HCOOCH2CH3
O
427369
m/z = 443
m/z = 415 m/z = m/z =
m/z = 399 m/z = 341
+ H+
Scheme 1. Tentative structural assignments and fragmentation routes for diagnostic positive ions
detected by TOF-S-SIMS from rhodamine 6G. The formation of the ions at m/z 427 from the intact
cations at m/z 443 is discussed in the text.
Surface adsorption of organic dyes on silicate materials 2813
Copyright # 2005 John Wiley & Sons, Ltd. Rapid Commun. Mass Spectrom. 2005; 19: 2809–2818
sake of simplicity, the complete route is omitted from
Scheme 2. The intensity ratio of the ions at m/z 372 to those
at m/z 356 drops from about 6 when a reference product is
analysed to 0.9 when crystal violet is present on quartz as a
very thin layer. This again reflects the increased occurrence of
thermal degradation. Note, however, that the intensity ratio
of the signals at m/z 372 and 356 approaches much closer to
that for the pure dye on the other substrates used in this
study.
Analysis of methylene blue adsorbed on quartz gives a
positive ion mass spectrum with a base peak atm/z 284 for the
intact cation and a minor fragment ion signal atm/z 268 due to
the selvedge protonation of the thermal decomposition
product (cf. Table 1). Again in this case the relative
abundance of the fragment ions relative to the intact cations
is only that high for quartz substrates, but falls in the range
10–20% for all the other materials and for the pure reference
compound.
In the case of all three dyes and the different substrates, the
m/z range discussed above contains the most significant
information. At lowerm/z values recorded using shorter Tgate
values, no diagnostic signals from the silica matrix were seen
in the positive ion mode as expected from the difference in
absorption between the organic dye and the inorganic
substrate. Increasing the laser power density to detect the
inorganic contribution reduces the efficiency with which the
organic ions are generated and detected.
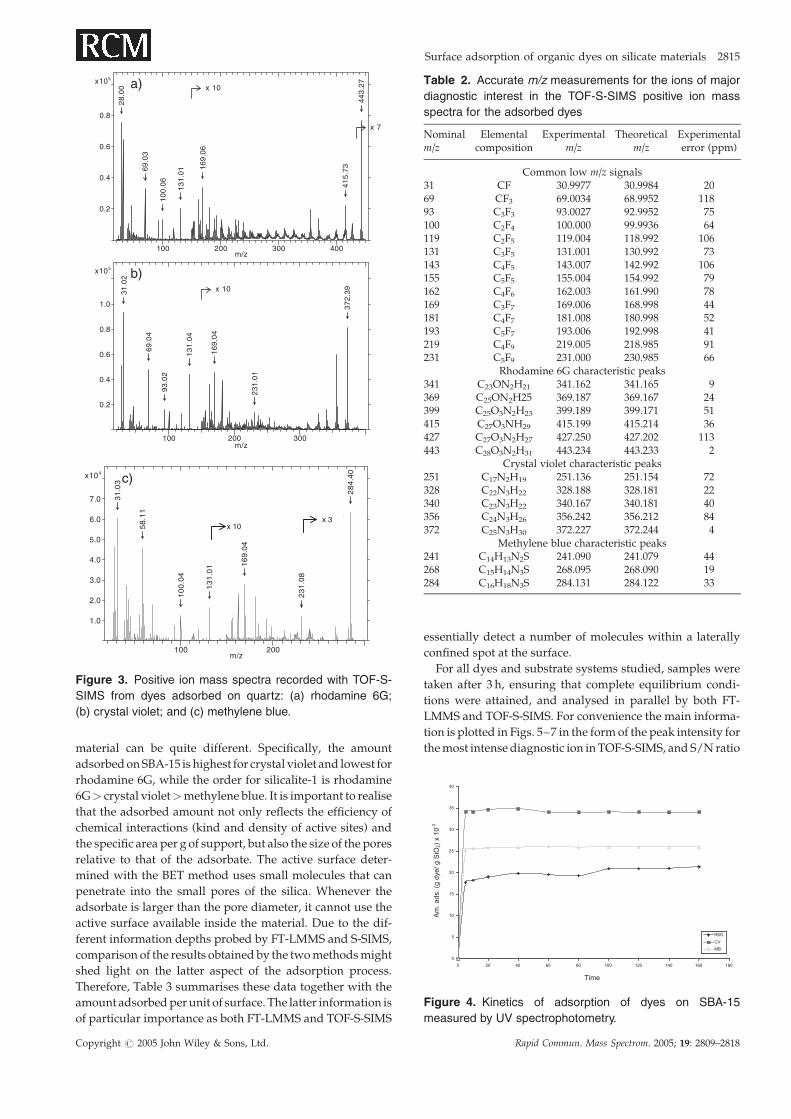
Figure 3 shows the spectra recorded with TOF-S-SIMS
from the same dye adsorbed samples as those used to obtain
Fig. 1. The high m/z regions of the positive ion mass spectra
are largely reminiscent of those already discussed for FT-
LMMS. As expected the relative intensities of the intact cation
and the different dye-related fragments are different when
using primary ion bombardment or laser microbeam
irradiation. Moreover, TOF-S-SIMS detects small additional
signals from rhodamine 6G, for instance at m/z 427 and 369,
corresponding to the protonated demethylation product of
the dye and the fragment ion arising from loss of ethyl
formate from the intact cation. Although the TOF-S-SIMS
instrument does not provide the same level of mass accuracy
as FT-LMMS, Table 2 shows that reasonable support to the
structural assignment and proposed elemental composition
is provided by the m/z determination within 100 ppm.
Interestingly, TOF-S-SIMS detects a whole series of
fragments in the m/z range up to 200. Most of the important
signals are readily associated with fluorinated hydrocarbon
fragments. Their structural assignment is consistent with the
accurate m/z determinations in Table 2. The presence of these
fluorinated ions is a consequence of the use of a Teflon beaker
for the adsorption experiment. Apparently, microscopic
residues from the Teflon were separated together with the
dye-coated silica. Moreover, the intensity of these fluorinated
fragment ions was substantially higher for quartz and silica
gel substrates that are known to be harder than the silicalite-1,
MCM-41 and SBA-15 fine powder materials, and thereby
scratch more Teflon from the beaker.
The high m/z regions in the mass spectra recorded by TOF-
S-SIMS from crystal violet and methylene blue on quartz
contain no important additional information in comparison
to those already discussed for FT-LMMS.
The adsorption kinetics of the dyes on the different
substrates has been followed using the UV-spectrophotome-
try technique because of the reliable quantification in
solutions. Figure 4 shows representative adsorption curves
for the three dyes on SBA-15. All the dyes and substrates
studied showed fast adsorption behaviour. The time to reach
the equilibrium concentration at the silica surface could well
be shorter than 20 min, i.e. the period required to recover the
solid material by centrifugation.
While the adsorption of the different dyes on the other
silicate materials follows kinetics similar to that for SBA-15,
the adsorbed amounts of the different dyes on the same
CN+
CH3
CH3
N
N
CH3CH3
CH3CH2
H
CN+
CH3
CH3
N
N
CH2CH3
CH2
H
CN+
CH3
CH3
N
NCH2
CH2
CH4CH4
N
NCH3
CH3
N
CH3
CH3
m/z = 372 m/z = 356 m/z = 340
m/z = 251
+
Scheme 2. Tentative structural assignments and fragmentation routes for diagnostic
positive ions detected by TOF-S-SIMS from crystal violet.
2814 A.-M. Busuioc et al.
Copyright # 2005 John Wiley & Sons, Ltd. Rapid Commun. Mass Spectrom. 2005; 19: 2809–2818
material can be quite different. Specifically, the amount
adsorbed on SBA-15 is highest for crystal violet and lowest for
rhodamine 6G, while the order for silicalite-1 is rhodamine
6G> crystal violet>methylene blue. It is important to realise
that the adsorbed amount not only reflects the efficiency of
chemical interactions (kind and density of active sites) and
the specific area per g of support, but also the size of the pores
relative to that of the adsorbate. The active surface deter-
mined with the BET method uses small molecules that can
penetrate into the small pores of the silica. Whenever the
adsorbate is larger than the pore diameter, it cannot use the
active surface available inside the material. Due to the dif-
ferent information depths probed by FT-LMMS and S-SIMS,
comparison of the results obtained by the two methods might
shed light on the latter aspect of the adsorption process.
Therefore, Table 3 summarises these data together with the
amount adsorbed per unit of surface. The latter information is
of particular importance as both FT-LMMS and TOF-S-SIMS
essentially detect a number of molecules within a laterally
confined spot at the surface.
For all dyes and substrate systems studied, samples were
taken after 3 h, ensuring that complete equilibrium condi-
tions were attained, and analysed in parallel by both FT-
LMMS and TOF-S-SIMS. For convenience the main informa-
tion is plotted in Figs. 5–7 in the form of the peak intensity for
the most intense diagnostic ion in TOF-S-SIMS, and S/N ratio
31
.02
69
.04
93
.02
13
1.0
4
16
9.0
4
23
1.0
1
37
2.3
9x 10
m/z100 200 300
5x10
0.2
0.4
0.6
0.8
1.0
b)
28
.00
69
.03
10
0.0
6
13
1.0
1 16
9.0
6
22
6.1
3
35
5.1
9
41
5.7
3
44
3.2
7
x 10
x 7
m/z100 200 300 400
5x10
0.2
0.4
0.6
0.8
a)
31
.03
58
.11
10
0.0
4
13
1.0
1 16
9.0
4
23
1.0
8
28
4.4
0
x 3
m/z100 200
4x10
1.0
2.0
3.0
4.0
5.0
6.0
7.0
x 3 x 10
c)
Figure 3. Positive ion mass spectra recorded with TOF-S-
SIMS from dyes adsorbed on quartz: (a) rhodamine 6G;
(b) crystal violet; and (c) methylene blue.
Table 2. Accurate m/z measurements for the ions of major
diagnostic interest in the TOF-S-SIMS positive ion mass
spectra for the adsorbed dyes
Nominalm/z
Elementalcomposition
Experimentalm/z
Theoreticalm/z
Experimentalerror (ppm)
Common low m/z signals31 CF 30.9977 30.9984 2069 CF3 69.0034 68.9952 11893 C3F3 93.0027 92.9952 75100 C2F4 100.000 99.9936 64119 C2F5 119.004 118.992 106131 C3F5 131.001 130.992 73143 C4F5 143.007 142.992 106155 C5F5 155.004 154.992 79162 C4F6 162.003 161.990 78169 C3F7 169.006 168.998 44181 C4F7 181.008 180.998 52193 C5F7 193.006 192.998 41219 C4F9 219.005 218.985 91231 C5F9 231.000 230.985 66
Rhodamine 6G characteristic peaks341 C23ON2H21 341.162 341.165 9369 C25ON2H25 369.187 369.167 24399 C25O3N2H23 399.189 399.171 51415 C27O3NH29 415.199 415.214 36427 C27O3N2H27 427.250 427.202 113443 C28O3N2H31 443.234 443.233 2
Crystal violet characteristic peaks251 C17N2H19 251.136 251.154 72328 C22N3H22 328.188 328.181 22340 C23N3H22 340.167 340.181 40356 C24N3H26 356.242 356.212 84372 C25N3H30 372.227 372.244 4
Methylene blue characteristic peaks241 C14H13N2S 241.090 241.079 44268 C15H14N3S 268.095 268.090 19284 C16H18N3S 284.131 284.122 33
0
5
10
15
20
25
30
35
40
0 20 40 60 80 100 120 140 160 180
R6G
CV
MB
Am
. a
ds.
(g d
ye
/ g
SiO
2)
x 1
0-3
Time
Figure 4. Kinetics of adsorption of dyes on SBA-15
measured by UV spectrophotometry.
Surface adsorption of organic dyes on silicate materials 2815
Copyright # 2005 John Wiley & Sons, Ltd. Rapid Commun. Mass Spectrom. 2005; 19: 2809–2818
for the same ions in FT-LMMS, while additionally the amount
adsorbed per m2 and pore size data from Table 3 are repre-
sented graphically. The ordering of the results according to
the pore size facilitates the assessment of the differences seen
in FT-LMMS and S-SIMS.
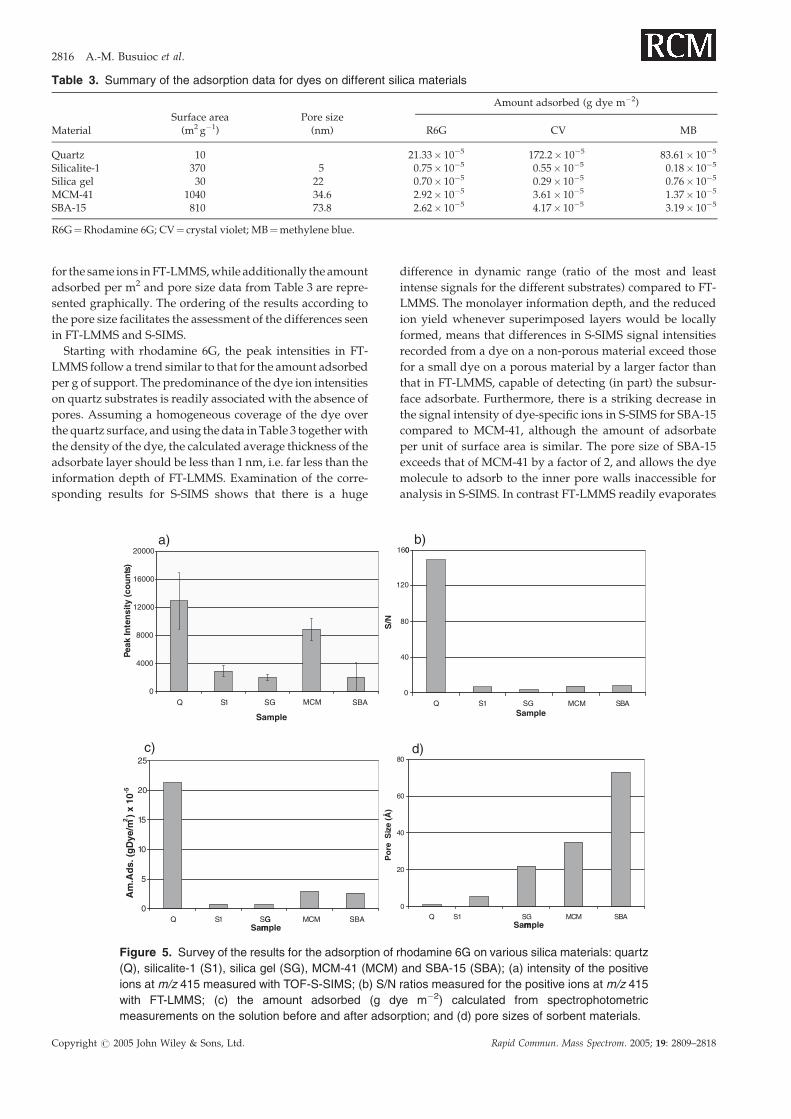
Starting with rhodamine 6G, the peak intensities in FT-
LMMS follow a trend similar to that for the amount adsorbed
per g of support. The predominance of the dye ion intensities
on quartz substrates is readily associated with the absence of
pores. Assuming a homogeneous coverage of the dye over
the quartz surface, and using the data in Table 3 together with
the density of the dye, the calculated average thickness of the
adsorbate layer should be less than 1 nm, i.e. far less than the
information depth of FT-LMMS. Examination of the corre-
sponding results for S-SIMS shows that there is a huge
difference in dynamic range (ratio of the most and least
intense signals for the different substrates) compared to FT-
LMMS. The monolayer information depth, and the reduced
ion yield whenever superimposed layers would be locally
formed, means that differences in S-SIMS signal intensities
recorded from a dye on a non-porous material exceed those
for a small dye on a porous material by a larger factor than
that in FT-LMMS, capable of detecting (in part) the subsur-
face adsorbate. Furthermore, there is a striking decrease in
the signal intensity of dye-specific ions in S-SIMS for SBA-15
compared to MCM-41, although the amount of adsorbate
per unit of surface area is similar. The pore size of SBA-15
exceeds that of MCM-41 by a factor of 2, and allows the dye
molecule to adsorb to the inner pore walls inaccessible for
analysis in S-SIMS. In contrast FT-LMMS readily evaporates
Table 3. Summary of the adsorption data for dyes on different silica materials
MaterialSurface area
(m2 g�1)Pore size
(nm)
Amount adsorbed (g dye m�2)
R6G CV MB
Quartz 10 21.33� 10�5 172.2� 10�5 83.61� 10�5
Silicalite-1 370 5 0.75� 10�5 0.55� 10�5 0.18� 10�5
Silica gel 30 22 0.70� 10�5 0.29� 10�5 0.76� 10�5
MCM-41 1040 34.6 2.92� 10�5 3.61� 10�5 1.37� 10�5
SBA-15 810 73.8 2.62� 10�5 4.17� 10�5 3.19� 10�5
R6G¼Rhodamine 6G; CV¼ crystal violet; MB¼methylene blue.
c)
0
5
10
15
20
25
Q S1 SGG MCM SBASamplem Samplem
Am
.Ad
s. (
gD
ye/m
2)
x 10
-5
a)
0
4000
8000
12000
16000
20000
Q S1 SG MCM SBA
Sample
Pea
k In
ten
sity
(co
un
ts)
b)
0
40
80
1600
Q S SG1 MCM SBASample
S/N
d)
0
20
40
60
80
Q S1 SG MCM SBA
Po
reS
ize
(Å)
120
Figure 5. Survey of the results for the adsorption of rhodamine 6G on various silica materials: quartz
(Q), silicalite-1 (S1), silica gel (SG), MCM-41 (MCM) and SBA-15 (SBA); (a) intensity of the positive
ions at m/z 415 measured with TOF-S-SIMS; (b) S/N ratios measured for the positive ions at m/z 415
with FT-LMMS; (c) the amount adsorbed (g dye m�2) calculated from spectrophotometric
measurements on the solution before and after adsorption; and (d) pore sizes of sorbent materials.
2816 A.-M. Busuioc et al.
Copyright # 2005 John Wiley & Sons, Ltd. Rapid Commun. Mass Spectrom. 2005; 19: 2809–2818
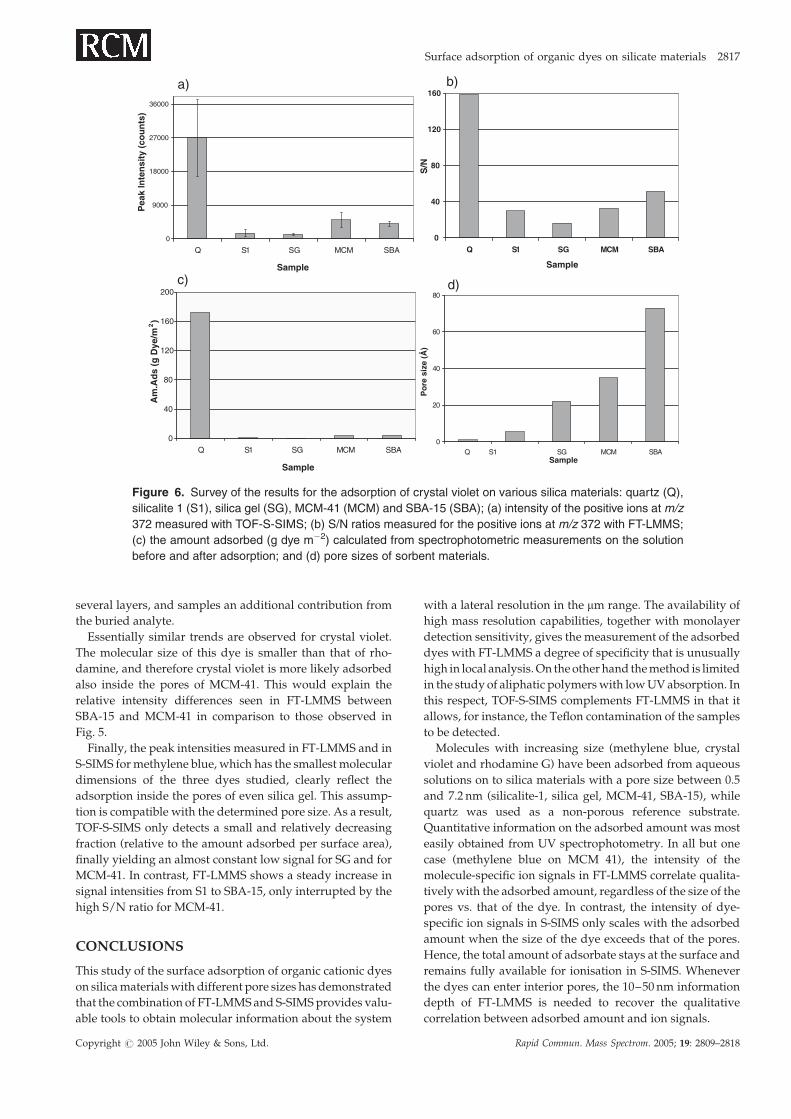
several layers, and samples an additional contribution from
the buried analyte.
Essentially similar trends are observed for crystal violet.
The molecular size of this dye is smaller than that of rho-
damine, and therefore crystal violet is more likely adsorbed
also inside the pores of MCM-41. This would explain the
relative intensity differences seen in FT-LMMS between
SBA-15 and MCM-41 in comparison to those observed in
Fig. 5.
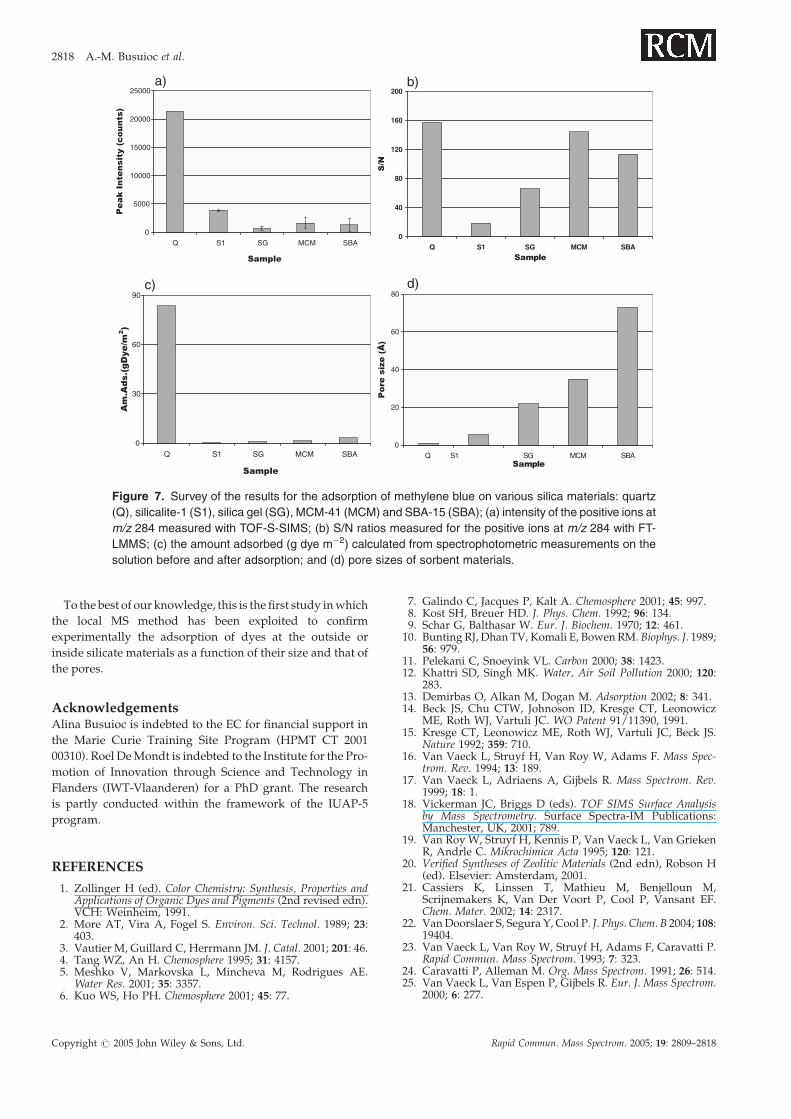
Finally, the peak intensities measured in FT-LMMS and in
S-SIMS for methylene blue, which has the smallest molecular
dimensions of the three dyes studied, clearly reflect the
adsorption inside the pores of even silica gel. This assump-
tion is compatible with the determined pore size. As a result,
TOF-S-SIMS only detects a small and relatively decreasing
fraction (relative to the amount adsorbed per surface area),
finally yielding an almost constant low signal for SG and for
MCM-41. In contrast, FT-LMMS shows a steady increase in
signal intensities from S1 to SBA-15, only interrupted by the
high S/N ratio for MCM-41.
CONCLUSIONS
This study of the surface adsorption of organic cationic dyes
on silica materials with different pore sizes has demonstrated
that the combination of FT-LMMS and S-SIMS provides valu-
able tools to obtain molecular information about the system
with a lateral resolution in the mm range. The availability of
high mass resolution capabilities, together with monolayer
detection sensitivity, gives the measurement of the adsorbed
dyes with FT-LMMS a degree of specificity that is unusually
high in local analysis. On the other hand the method is limited
in the study of aliphatic polymers with low UV absorption. In
this respect, TOF-S-SIMS complements FT-LMMS in that it
allows, for instance, the Teflon contamination of the samples
to be detected.
Molecules with increasing size (methylene blue, crystal
violet and rhodamine G) have been adsorbed from aqueous
solutions on to silica materials with a pore size between 0.5
and 7.2 nm (silicalite-1, silica gel, MCM-41, SBA-15), while
quartz was used as a non-porous reference substrate.
Quantitative information on the adsorbed amount was most
easily obtained from UV spectrophotometry. In all but one
case (methylene blue on MCM 41), the intensity of the
molecule-specific ion signals in FT-LMMS correlate qualita-
tively with the adsorbed amount, regardless of the size of the
pores vs. that of the dye. In contrast, the intensity of dye-
specific ion signals in S-SIMS only scales with the adsorbed
amount when the size of the dye exceeds that of the pores.
Hence, the total amount of adsorbate stays at the surface and
remains fully available for ionisation in S-SIMS. Whenever
the dyes can enter interior pores, the 10–50 nm information
depth of FT-LMMS is needed to recover the qualitative
correlation between adsorbed amount and ion signals.
b)
0
40
80
120
160
Q S1 SG MCM SBA
SampleSample
S/N
a)
0
9000
18000
27000
36000
Q S1 SG MCM SBA
Pea
k In
ten
sity
(co
un
ts)
c)
0
40
80
120
160
200
Q S1 SG MCM SBA
Sample
Am
.Ad
s (g
Dye
/m2)
d)
0
20
40
60
80
Q S1 SG MCM SBASample
Po
re s
ize
(Å)
Figure 6. Survey of the results for the adsorption of crystal violet on various silica materials: quartz (Q),
silicalite 1 (S1), silica gel (SG), MCM-41 (MCM) and SBA-15 (SBA); (a) intensity of the positive ions at m/z
372 measured with TOF-S-SIMS; (b) S/N ratios measured for the positive ions at m/z 372 with FT-LMMS;
(c) the amount adsorbed (g dye m�2) calculated from spectrophotometric measurements on the solution
before and after adsorption; and (d) pore sizes of sorbent materials.
Surface adsorption of organic dyes on silicate materials 2817
Copyright # 2005 John Wiley & Sons, Ltd. Rapid Commun. Mass Spectrom. 2005; 19: 2809–2818
To the best of our knowledge, this is the first study in which
the local MS method has been exploited to confirm
experimentally the adsorption of dyes at the outside or
inside silicate materials as a function of their size and that of
the pores.
AcknowledgementsAlina Busuioc is indebted to the EC for financial support in
the Marie Curie Training Site Program (HPMT CT 2001
00310). Roel De Mondt is indebted to the Institute for the Pro-
motion of Innovation through Science and Technology in
Flanders (IWT-Vlaanderen) for a PhD grant. The research
is partly conducted within the framework of the IUAP-5
program.
REFERENCES
1. Zollinger H (ed). Color Chemistry: Synthesis, Properties andApplications of Organic Dyes and Pigments (2nd revised edn).VCH: Weinheim, 1991.
2. More AT, Vira A, Fogel S. Environ. Sci. Technol. 1989; 23:403.
3. Vautier M, Guillard C, Herrmann JM. J. Catal. 2001; 201: 46.4. Tang WZ, An H. Chemosphere 1995; 31: 4157.5. Meshko V, Markovska L, Mincheva M, Rodrigues AE.
Water Res. 2001; 35: 3357.6. Kuo WS, Ho PH. Chemosphere 2001; 45: 77.
7. Galindo C, Jacques P, Kalt A. Chemosphere 2001; 45: 997.8. Kost SH, Breuer HD. J. Phys. Chem. 1992; 96: 134.9. Schar G, Balthasar W. Eur. J. Biochem. 1970; 12: 461.
10. Bunting RJ, Dhan TV, Komali E, Bowen RM. Biophys. J. 1989;56: 979.
11. Pelekani C, Snoeyink VL. Carbon 2000; 38: 1423.12. Khattri SD, Singh MK. Water, Air Soil Pollution 2000; 120:
283.13. Demirbas O, Alkan M, Dogan M. Adsorption 2002; 8: 341.14. Beck JS, Chu CTW, Johnoson ID, Kresge CT, Leonowicz
ME, Roth WJ, Vartuli JC. WO Patent 91/11390, 1991.15. Kresge CT, Leonowicz ME, Roth WJ, Vartuli JC, Beck JS.
Nature 1992; 359: 710.16. Van Vaeck L, Struyf H, Van Roy W, Adams F. Mass Spec-
trom. Rev. 1994; 13: 189.17. Van Vaeck L, Adriaens A, Gijbels R. Mass Spectrom. Rev.
1999; 18: 1.18. Vickerman JC, Briggs D (eds). TOF SIMS Surface Analysis
by Mass Spectrometry. Surface Spectra-IM Publications:Manchester, UK, 2001; 789.
19. Van Roy W, Struyf H, Kennis P, Van Vaeck L, Van GriekenR, Andrle C. Mikrochimica Acta 1995; 120: 121.
20. Verified Syntheses of Zeolitic Materials (2nd edn), Robson H(ed). Elsevier: Amsterdam, 2001.
21. Cassiers K, Linssen T, Mathieu M, Benjelloun M,Scrijnemakers K, Van Der Voort P, Cool P, Vansant EF.Chem. Mater. 2002; 14: 2317.
22. Van Doorslaer S, Segura Y, Cool P. J. Phys. Chem. B 2004; 108:19404.
23. Van Vaeck L, Van Roy W, Struyf H, Adams F, Caravatti P.Rapid Commun. Mass Spectrom. 1993; 7: 323.
24. Caravatti P, Alleman M. Org. Mass Spectrom. 1991; 26: 514.25. Van Vaeck L, Van Espen P, Gijbels R. Eur. J. Mass Spectrom.
2000; 6: 277.
a)
0
5000
10000
15000
20000
25000
Q S1 SG MCM SBA
Sample
Pe
ak
In
ten
sit
y (
co
un
ts)
b)
0
40
80
120
160
200
Q S1 SG MCM SBASample
S/N
c)
0
30
60
90
Q S1 SG MCM SBA
Sample
Am
.Ad
s.(
gD
ye
/m2)
d)
0
20
40
60
80
Q S1 SG MCM SBASample
Po
re s
ize
(Å
)
Figure 7. Survey of the results for the adsorption of methylene blue on various silica materials: quartz
(Q), silicalite-1 (S1), silica gel (SG), MCM-41 (MCM) and SBA-15 (SBA); (a) intensity of the positive ions at
m/z 284 measured with TOF-S-SIMS; (b) S/N ratios measured for the positive ions at m/z 284 with FT-
LMMS; (c) the amount adsorbed (g dye m�2) calculated from spectrophotometric measurements on the
solution before and after adsorption; and (d) pore sizes of sorbent materials.
2818 A.-M. Busuioc et al.
Copyright # 2005 John Wiley & Sons, Ltd. Rapid Commun. Mass Spectrom. 2005; 19: 2809–2818