Competition for inorganic carbon between oxygenic and anoxygenic phototrophs in a hypersaline...
19
Competition for inorganic carbon between oxygenic and anoxygenic phototrophs in a hypersaline microbial mat, Guerrero Negro, Mexico Niko Finke, 1,2 * † Tori M. Hoehler, 2 Lubos Polerecky, 3 Benjamin Buehring 4 and Bo Thamdrup 1 1 Nordic Center for Earth Evolution, Institute of Biology, University of Southern Denmark, Odense, Denmark. 2 Exobiology Branch, NASA Ames Research Center, Moffett Field, CA, USA. 3 Microsensorgroup, Max-Planck-Institute for Marine Microbiology, Bremen, Germany. 4 Marum, University of Bremen, Bremen, Germany. Summary While most oxygenic phototrophs harvest light only in the visible range (400–700 nm, VIS), anoxygenic phototrophs can harvest near infrared light (> 700 nm, NIR). To study interactions between the photosynthetic guilds we used microsensors to measure oxygen and gross oxygenic photosynthesis (gOP) in a hypersaline microbial mat under full (VIS + NIR) and VIS illumination. Under normal dis- solved inorganic carbon (DIC) concentrations (2 mM), volumetric rates of gOP were reduced up to 65% and areal rates by 16–31% at full compared with VIS illu- mination. This effect was enhanced (reduction up to 100% in volumetric, 50% in areal rates of gOP) when DIC was lowered to 1 mM, but diminished at 10 mM DIC or lowered pH. In conclusion, under full-light illu- mination anoxygenic phototrophs are able to reduce the activity of oxygenic phototrophs by efficiently competing for inorganic carbon within the highly oxy- genated layer. Anoxygenic photosynthesis, calcu- lated from the difference in gOP under full and VIS illumination, represented between 10% and 40% of the C-fixation. The DIC depletion in the euphotic zone as well as the significant C-fixation by anoxygenic phototrophs in the oxic layer influences the carbon isotopic composition of the mat, which needs to be taken into account when interpreting isotopic biosig- nals in geological records. Introduction In photosynthetic microbial mats, full geochemical cycles occur over a small scale, allowing us to study ecosystem dynamics, particularly microbial interactions and their geochemical consequences, under controlled conditions. Thus, microbial mats can serve as a model system for studying complex biogeochemical interactions on larger scales. Photosynthetic hypersaline microbial mats usually show a high photosynthetic activity but very little growth, a result typically attributed to nutrient limitation (e.g. Can- field and Des Marais, 1993; Grötzschel et al., 2002; Ludwig et al., 2006). Studies of different hypersaline microbial mats have revealed various types of limitation. In mats from a permanent hypersaline lake Chiprana, Spain, that contain unusually high concentrations of inor- ganic carbon, oxygenic photosynthesis was limited by the supply of high-quality organic nitrogen (amino acids) and phosphate (Ludwig et al., 2006), whereas mats with a lower inorganic carbon concentration showed limitation of oxygenic photosynthesis by inorganic carbon (Jensen and Revsbech, 1989; Grötzschel et al., 2002). Thus, besides light availability, net growth of photosynthetic microbial mats is controlled by the diffusion of nutrients and inorganic carbon in and out of the mat. Photosynthetic communities in microbial mats usually comprise two major groups of organisms: oxygenic and anoxygenic phototrophs. Oxygenic phototrophs, such as cyanobacteria, utilize light in the visible range (VIS, 400– 700 nm), whereas anoxygenic phototrophs, such as Chloroflexus-like bacteria and green and purple sulfur bacteria, can use near infrared light (NIR, 700–1100 nm) for photosynthesis. Some cyanobacteria, i.e. those con- taining chlorophyll d, can also use NIR light (720 nm) for oxygenic photosynthesis (Kühl et al., 2005). While oxy- genic phototrophs use H 2O as electron donor, anoxygenic phototrophs require alternative reduced substrates such as hydrogen sulfide, hydrogen or reduced organic carbon. Judging from their presence in almost all photosynthetic mats, anoxygenic phototrophs are expected to have a significant impact on the overall ecology of the mat ecosystems, including the distribution and activities of oxygenic phototrophs. However, their role and activity, and particularly their contribution to geochemical fluxes Received 23 October, 2012; accepted 24 October, 2012. *For corre- spondence. E-mail nfi[email protected]; Tel. (+1) 706 542 2034; Fax (+1) 706 542 5888. † Present address: Department of Marine Sciences, University of Georgia, Athens, GA, USA. Environmental Microbiology (2013) doi:10.1111/1462-2920.12032 © 2012 Society for Applied Microbiology and Blackwell Publishing Ltd
-
Upload
independent -
Category
Documents
-
view
0 -
download
0
Transcript of Competition for inorganic carbon between oxygenic and anoxygenic phototrophs in a hypersaline...
Competition for inorganic carbon between oxygenicand anoxygenic phototrophs in a hypersaline microbialmat, Guerrero Negro, Mexico
Niko Finke,1,2*† Tori M. Hoehler,2 Lubos Polerecky,3
Benjamin Buehring4 and Bo Thamdrup1
1Nordic Center for Earth Evolution, Institute of Biology,University of Southern Denmark, Odense, Denmark.2Exobiology Branch, NASA Ames Research Center,Moffett Field, CA, USA.3Microsensorgroup, Max-Planck-Institute for MarineMicrobiology, Bremen, Germany.4Marum, University of Bremen, Bremen, Germany.
Summary
While most oxygenic phototrophs harvest light onlyin the visible range (400–700 nm, VIS), anoxygenicphototrophs can harvest near infrared light(> 700 nm, NIR). To study interactions between thephotosynthetic guilds we used microsensors tomeasure oxygen and gross oxygenic photosynthesis(gOP) in a hypersaline microbial mat under full(VIS + NIR) and VIS illumination. Under normal dis-solved inorganic carbon (DIC) concentrations (2 mM),volumetric rates of gOP were reduced up to 65% andareal rates by 16–31% at full compared with VIS illu-mination. This effect was enhanced (reduction up to100% in volumetric, 50% in areal rates of gOP) whenDIC was lowered to 1 mM, but diminished at 10 mMDIC or lowered pH. In conclusion, under full-light illu-mination anoxygenic phototrophs are able to reducethe activity of oxygenic phototrophs by efficientlycompeting for inorganic carbon within the highly oxy-genated layer. Anoxygenic photosynthesis, calcu-lated from the difference in gOP under full and VISillumination, represented between 10% and 40% ofthe C-fixation. The DIC depletion in the euphotic zoneas well as the significant C-fixation by anoxygenicphototrophs in the oxic layer influences the carbonisotopic composition of the mat, which needs to betaken into account when interpreting isotopic biosig-nals in geological records.
Introduction
In photosynthetic microbial mats, full geochemical cyclesoccur over a small scale, allowing us to study ecosystemdynamics, particularly microbial interactions and theirgeochemical consequences, under controlled conditions.Thus, microbial mats can serve as a model system forstudying complex biogeochemical interactions on largerscales. Photosynthetic hypersaline microbial mats usuallyshow a high photosynthetic activity but very little growth, aresult typically attributed to nutrient limitation (e.g. Can-field and Des Marais, 1993; Grötzschel et al., 2002;Ludwig et al., 2006). Studies of different hypersalinemicrobial mats have revealed various types of limitation.In mats from a permanent hypersaline lake Chiprana,Spain, that contain unusually high concentrations of inor-ganic carbon, oxygenic photosynthesis was limited by thesupply of high-quality organic nitrogen (amino acids) andphosphate (Ludwig et al., 2006), whereas mats with alower inorganic carbon concentration showed limitation ofoxygenic photosynthesis by inorganic carbon (Jensenand Revsbech, 1989; Grötzschel et al., 2002). Thus,besides light availability, net growth of photosyntheticmicrobial mats is controlled by the diffusion of nutrientsand inorganic carbon in and out of the mat.
Photosynthetic communities in microbial mats usuallycomprise two major groups of organisms: oxygenic andanoxygenic phototrophs. Oxygenic phototrophs, such ascyanobacteria, utilize light in the visible range (VIS, 400–700 nm), whereas anoxygenic phototrophs, such asChloroflexus-like bacteria and green and purple sulfurbacteria, can use near infrared light (NIR, 700–1100 nm)for photosynthesis. Some cyanobacteria, i.e. those con-taining chlorophyll d, can also use NIR light (720 nm) foroxygenic photosynthesis (Kühl et al., 2005). While oxy-genic phototrophs use H2O as electron donor, anoxygenicphototrophs require alternative reduced substrates suchas hydrogen sulfide, hydrogen or reduced organic carbon.
Judging from their presence in almost all photosyntheticmats, anoxygenic phototrophs are expected to have asignificant impact on the overall ecology of the matecosystems, including the distribution and activities ofoxygenic phototrophs. However, their role and activity,and particularly their contribution to geochemical fluxes
Received 23 October, 2012; accepted 24 October, 2012. *For corre-spondence. E-mail [email protected]; Tel. (+1) 706 542 2034; Fax (+1)706 542 5888. †Present address: Department of Marine Sciences,University of Georgia, Athens, GA, USA.
bs_bs_banner
Environmental Microbiology (2013) doi:10.1111/1462-2920.12032
© 2012 Society for Applied Microbiology and Blackwell Publishing Ltd

between the mats and the environment, are not wellunderstood. In the classical scenario, anoxygenic pho-totrophic C-fixation is assumed to occur only under anoxicconditions below the zone of oxygenic photosynthesis(Decker et al., 2005; Herman and Klump, 2005; Raven,2009), based on the sensitivity of most anoxygenic auto-phototrophs towards oxygen (Berg, 2011). This view issupported by investigations on the activity of the anoxy-genic phototroph Chloroflexus in hot springs, whichshowed that in the oxic zone these bacteria performedphotoheterotrophy fed by organics from the cyanobacteriarather than actively fixing inorganic carbon (Ward et al.,1987). However, measurement of d13C of organism-specific pools of organic matter in these mats did revealC-fixation by Chloroflexus (Van Der Meer et al., 2000).Furthermore, the activity of Chloroflexus-like bacteria inthe oxic zone of a microbial mat was modulated by thespectral quality of the light, switching from aerobic hetero-trophy at VIS illumination probably to phototrophy whenNIR light was added (Polerecky et al., 2007; Bachar et al.,2008).
In addition to geochemical fluxes, the effect of the activ-ity of anoxygenic phototrophs on the isotopic signatureof microbial mats is also unclear. The different C-fixationpathways of the photosynthetic guilds influence the iso-topic composition of the formed organic carbon differently(Van Der Meer et al., 2000). Thus, both oxygenic andanoxygenic pathways of carbon fixation need to be con-sidered when interpreting geological records.
Availability of inorganic carbon is an important factorpotentially affecting C-fixation in photosynthetic microbialmats (Jensen and Revsbech, 1989; Grötzschel et al.,2002), where carbon must be supplied by diffusionthrough the mat matrix over distances of hundreds ofmicrometers or more. At the neutral or slightly alkaline pHoften found in aquatic systems, bicarbonate is the domi-nant dissolved inorganic carbon (DIC) species (Zeebeand Wolf-Gladrow, 2005). However, the principal sub-strate for C-fixation by cyanobacteria and purple andgreen sulfur bacteria is CO2 (Berg, 2011). Cyanobacteriahave developed a carbon-concentrating mechanismcoupled to carboxysomes that can utilize either CO2 orbicarbonate, creating high CO2 concentrations in thedirect vicinity of Rubisco (Badger and Price, 1994; 2003)and thereby increasing their versatility in terms of DICacquisition. Members of the Chloroflexaceae includingChloroflexus-like bacteria and Roseiflexus utilize bicarbo-nate directly, which gives them an advantage over theother anoxygenic phototrophs, especially at high pH(Zarzycki et al., 2009; Berg, 2011).
Microbial mats from the salterns from ExportadoradeSal. S.A. de C.V, Guerrero Negro, Mexico, have beenstudied for several decades (e.g. Javor and Castenholz,1981; Damelio et al., 1987; Jørgensen and Des Marais,
1988; Canfield and Des Marais, 1993). The mats frompond 4 near the dyke to pond 5 (27°41′N, 113°55′W)(Bebout et al., 2002; 2004) show very high photosyntheticactivity, and high rates of sulfate reduction have beenmeasured in the oxic surface layer (Canfield and DesMarais, 1993). The absence of isotopic fractionationduring carbon fixation in the Guerrero Negro mats indi-cates DIC limitation in the oxic layer (D. Des Marais,1995). Furthermore, molecular analysis shows thatcyanobacteria and Chloroflexi, including the anoxygenicphototroph Roseiflexus, are present in the oxic surfacelayer as well as in the deep, dark sulfidic layer (Ley et al.,2006; Dillon et al., 2009). Damelio and colleagues (1987)reported purple filaments intertwined with the cyanobac-teria in those mats, which could be the ones identified asChloroflexi by Ley and colleagues (2006) and could thusbe Roseiflexus, a purple anoxygenic phototroph contain-ing bacteriochlorophyll a (Bchl a).
In this study we used these mats to investigate ingreater detail the ecological interactions between oxy-genic and anoxygenic phototrophs. Using microsensors,we measured oxygen concentrations, rates of gross oxy-genic photosynthesis (gOP) and pH in mats illuminatedeither with light that contained both VIS and NIR wave-lengths (hereafter referred to as ‘full light’) or with lightonly in the VIS range, the latter achieved by removing theNIR wavelengths with an optical cut-off filter. These meas-urements were conducted under two scenarios. First, tostudy the effect of inorganic carbon availability, the con-centration and speciation of DIC was manipulated byadding or removing DIC in the overlying water or by alter-ing the pH. Second, to study the effect of sulfide as apotential electron donor for anoxygenic photosynthesis,measurements were compared in mats exposed to lowand high sulfide concentrations and fluxes. Differentsulfide concentrations in the mat were achieved byincubation at different sulfate concentrations, whereasincreased sulfide fluxes were generated by incubations ofthe surface layer of the mat on top of a sulfidic agar plug.To characterize the light environment and estimate thevertical distribution of the oxygenic and anoxygenic pho-totrophs inside the mat, light was measured with a scalarirradiance microprobe.
Results
Depth distribution of oxygen and rates of gOP
Under natural concentrations of DIC (2 mM) and sulfate(80 mM) in the overlying water, and illumination resem-bling natural conditions (incident photon flux of 1500 mmolphotons m-2 s-1 in the visible light (VIS) and 1030 mmolphotons m-2 s-1 in the near infrared (NIR) region; Table 1,Supplementary material S3), both oxygen concentrationsand volumetric rates of gOP were elevated in samples
2 N. Finke et al.
© 2012 Society for Applied Microbiology and Blackwell Publishing Ltd, Environmental Microbiology

exposed to VIS light compared with those under full light(VIS + NIR), with most pronounced differences in gOPoccurring in deeper parts of the mat (Fig. 1). Among rep-licate measurements, depth-integrated rates of gOPincreased by 16–31% (Table 2).
While the use of cut-off light filters constitutes the easiestmeans of distinguishing oxygenic from anoxygenic photo-synthesis, it entails two effects relative to perfect selectiveelimination of NIR wavelengths. First, the short-pass filternot only removes NIR light, but also decreases VIS irradi-ance by approximately 10%. However, the increased ratesof gOP in the treatment without NIR light strongly suggestthat light was not limiting, even under the slightly reducedVIS light levels. Second, the short-pass filter also removessome light in the UV range, raising the possibility that ourresults could derive from a relief of UV inhibition of oxy-genic photosynthesis. To test this, gOP rates and oxygenconcentrations were measured under constant illuminationin the VIS + UV range achieved with the short-pass filterwhile the NIR light was supplied by an array of light emittingdiodes (LEDs, emission range 700–870 nm). The resultsfor these incubations were very similar to those obtainedwith the NIR-filtered light (data not shown), demonstratingthat the observed decrease in gOP was due to an inhibitoryeffect of NIR light and not due to a relief from UV stress.
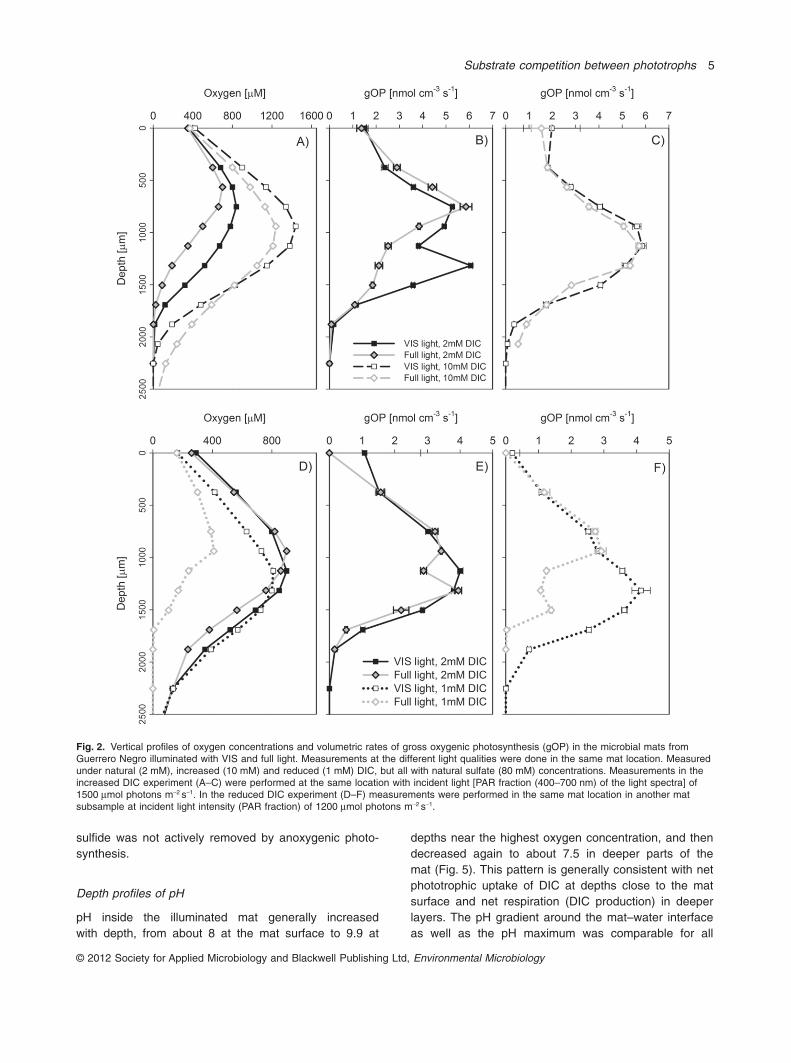
Increased DIC concentrations in the overlying waterfrom 2 mM to about 10 mM generally increased oxygenconcentrations under both VIS and full-light conditions
(Fig. 2A, Table 2). At 10 mM DIC, the concentrations werehigher under VIS compared with full light, but only atdepths < 1600 mm. At depths > 1600 mm the situation wasreversed. In contrast to 2 mM DIC, rates of gOP at 10 mMDIC were about the same under both light conditions(compare Fig. 2B and C, Table 2). The slight reduction ingOP at depths > 1600 mm under VIS light compared withfull illumination at 10 mM DIC, manifested also in theoxygen profiles, was probably due to sulfide poisoningwhen anoxygenic phototrophs were not active (seebelow). Under illumination with slightly decreased photonflux in the VIS range (1200 instead of 1500 mmol photonsm-2 s-1), there was no clear difference in the oxygen andgOP profiles for the VIS and full light treatments at 2 mMDIC (Fig. 2D and E). However, by reducing the DIC con-centration to 1 mM, both oxygen concentrations and ratesof gOP were strongly reduced under full light comparedwith VIS illumination (Fig. 2D–F, Table 2). Taken together,the inhibitory effect of NIR light observed at 2 mM DICwas enhanced at lower DIC concentrations, with arealrates of gOP under full light conditions being about 50% ofthose measured under VIS light, whereas the NIR effecton gOP was diminished at 10 mM DIC.
The concentrations of bicarbonate and CO2, the twoprimary substrates for the C-fixing enzymes, are not onlyinfluenced by the DIC concentration but also by the pH,which influences the speciation of the carbonate system.After leaving the mats in the dark overnight and subse-
Table 1. Incident light intensities provided by the artificial light sources under the different illumination scenarios, expressed as photon fluxes inthe visible (VIS) and near infrared (NIR) range.
Illumination
Photon flux (mmol photons m-2 s-1) NIR/VIS
VIS (400–700 nm) NIR (700–900)
Full light 1500 1029 0.69NIR LED 19 549 29.56VIS light 1325 20 0.02VIS light + NIR LED 1380 569 0.41Sun 1500 1055 0.70
Intensities of the natural solar radiation are shown for comparison. The artificial full light mimicked well the natural solar illumination, as indicatedby the similarity of the NIR/VIS ratios. Light emitting diodes (LEDs) were chosen to target absorption maxima of common bacteriochlorophylls.Their intensities were adjusted to match the intensities of the full artificial light at wavelengths of maximal emission (see Supplementarymaterial S3, Fig. S3). Note that the NIR/VIS ratio for the LEDs is slightly lower but comparable to that of the full artificial light.
Table 2. Photosynthetic activity of anoxygenic phototrophs relative to oxygenic phototrophs.
DIC concentration
Decrease of gOP at full lightrelative to gOP at VIS light (%)
Anoxygenic photosynthesis as a fractionof gOP under full lighta (%)
Volumetricb Depth-integrated Volumetricb Depth-integrated
1 mM 60 to 100 50 55 to 100/220 to 380 30 to 1152 mM 6 to 65 16 to 31 8 to 70/14 to 280 10/38 to 4010 mM -4 to 30c 6 -2 to 24/-10 to 95c 1/4
a. Minimum/maximum values are given depending on the metabolic pathways active (see Table 3 for details).b. Range for the depth interval between the shallowest and deepest depth where gOP was affected by light conditions.c. Negative values result from full light rates being larger than VIS light rates in the depth interval considered.
Substrate competition between phototrophs 3
© 2012 Society for Applied Microbiology and Blackwell Publishing Ltd, Environmental Microbiology
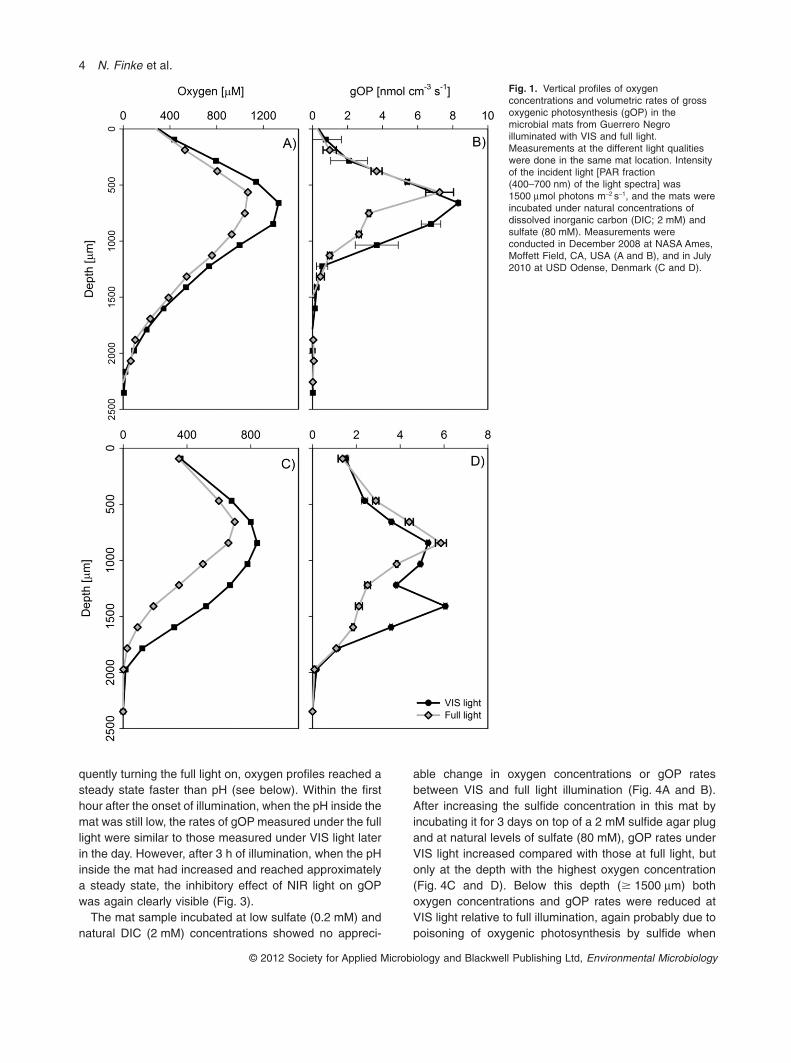
quently turning the full light on, oxygen profiles reached asteady state faster than pH (see below). Within the firsthour after the onset of illumination, when the pH inside themat was still low, the rates of gOP measured under the fulllight were similar to those measured under VIS light laterin the day. However, after 3 h of illumination, when the pHinside the mat had increased and reached approximatelya steady state, the inhibitory effect of NIR light on gOPwas again clearly visible (Fig. 3).
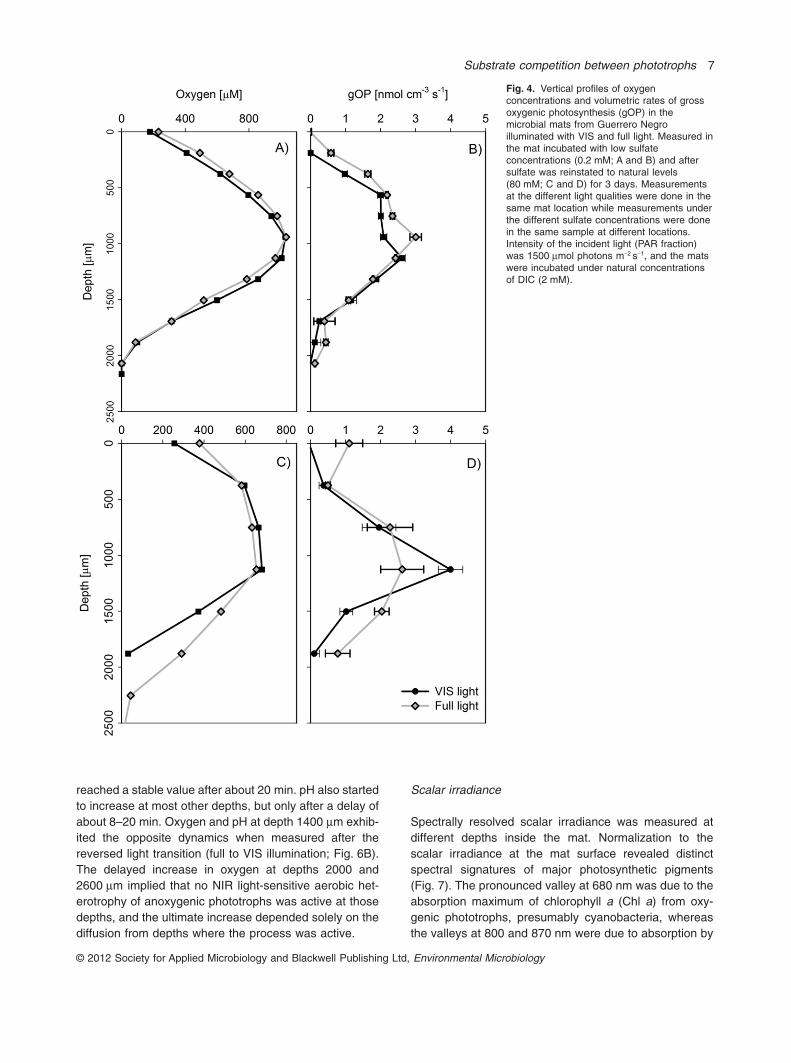
The mat sample incubated at low sulfate (0.2 mM) andnatural DIC (2 mM) concentrations showed no appreci-
able change in oxygen concentrations or gOP ratesbetween VIS and full light illumination (Fig. 4A and B).After increasing the sulfide concentration in this mat byincubating it for 3 days on top of a 2 mM sulfide agar plugand at natural levels of sulfate (80 mM), gOP rates underVIS light increased compared with those at full light, butonly at the depth with the highest oxygen concentration(Fig. 4C and D). Below this depth (� 1500 mm) bothoxygen concentrations and gOP rates were reduced atVIS light relative to full illumination, again probably due topoisoning of oxygenic photosynthesis by sulfide when
Fig. 1. Vertical profiles of oxygenconcentrations and volumetric rates of grossoxygenic photosynthesis (gOP) in themicrobial mats from Guerrero Negroilluminated with VIS and full light.Measurements at the different light qualitieswere done in the same mat location. Intensityof the incident light [PAR fraction(400–700 nm) of the light spectra] was1500 mmol photons m-2 s-1, and the mats wereincubated under natural concentrations ofdissolved inorganic carbon (DIC; 2 mM) andsulfate (80 mM). Measurements wereconducted in December 2008 at NASA Ames,Moffett Field, CA, USA (A and B), and in July2010 at USD Odense, Denmark (C and D).
4 N. Finke et al.
© 2012 Society for Applied Microbiology and Blackwell Publishing Ltd, Environmental Microbiology
sulfide was not actively removed by anoxygenic photo-synthesis.
Depth profiles of pH
pH inside the illuminated mat generally increasedwith depth, from about 8 at the mat surface to 9.9 at
depths near the highest oxygen concentration, and thendecreased again to about 7.5 in deeper parts of themat (Fig. 5). This pattern is generally consistent with netphototrophic uptake of DIC at depths close to the matsurface and net respiration (DIC production) in deeperlayers. The pH gradient around the mat–water interfaceas well as the pH maximum was comparable for all
Fig. 2. Vertical profiles of oxygen concentrations and volumetric rates of gross oxygenic photosynthesis (gOP) in the microbial mats fromGuerrero Negro illuminated with VIS and full light. Measurements at the different light qualities were done in the same mat location. Measuredunder natural (2 mM), increased (10 mM) and reduced (1 mM) DIC, but all with natural sulfate (80 mM) concentrations. Measurements in theincreased DIC experiment (A–C) were performed at the same location with incident light [PAR fraction (400–700 nm) of the light spectra] of1500 mmol photons m-2 s-1. In the reduced DIC experiment (D–F) measurements were performed in the same mat location in another matsubsample at incident light intensity (PAR fraction) of 1200 mmol photons m-2 s-1.
Substrate competition between phototrophs 5
© 2012 Society for Applied Microbiology and Blackwell Publishing Ltd, Environmental Microbiology

treatments (VIS versus full illumination, 2 mM versus10 mM DIC; Fig. 5A). At depths below the pH peak,however, pH decreased less steeply under full lightcompared with VIS illumination. When illuminated by VISlight, the pH decrease was steeper at 10 mM than at2 mM DIC, whereas this was opposite under full illumi-nation. At 1 mM DIC, pH varied with depth in a similarway; however, the differences between the profilesmeasured under the full and VIS-only illumination weremore pronounced and occurred deeper in the mat thanat 2 mM DIC (Fig. 5B). The maximum pH in the 1 mMDIC incubation was higher by about 0.2 units than in the2 mM incubation.
In the dark, pH generally decreased with depth insidethe mat, reaching a minimum at approximately the samedepth as the depth where it was maximal in the light (datanot shown). When switching from dark to light, steady-state pH values were reached more slowly than those foroxygen. For example, after 1 h of illumination oxygenconcentrations had already risen to levels similar to oreven above the levels reached after many hours of illumi-nation (Fig. 3A), whereas pH was still low and neededabout 3 h to stabilize (Fig. 3C).
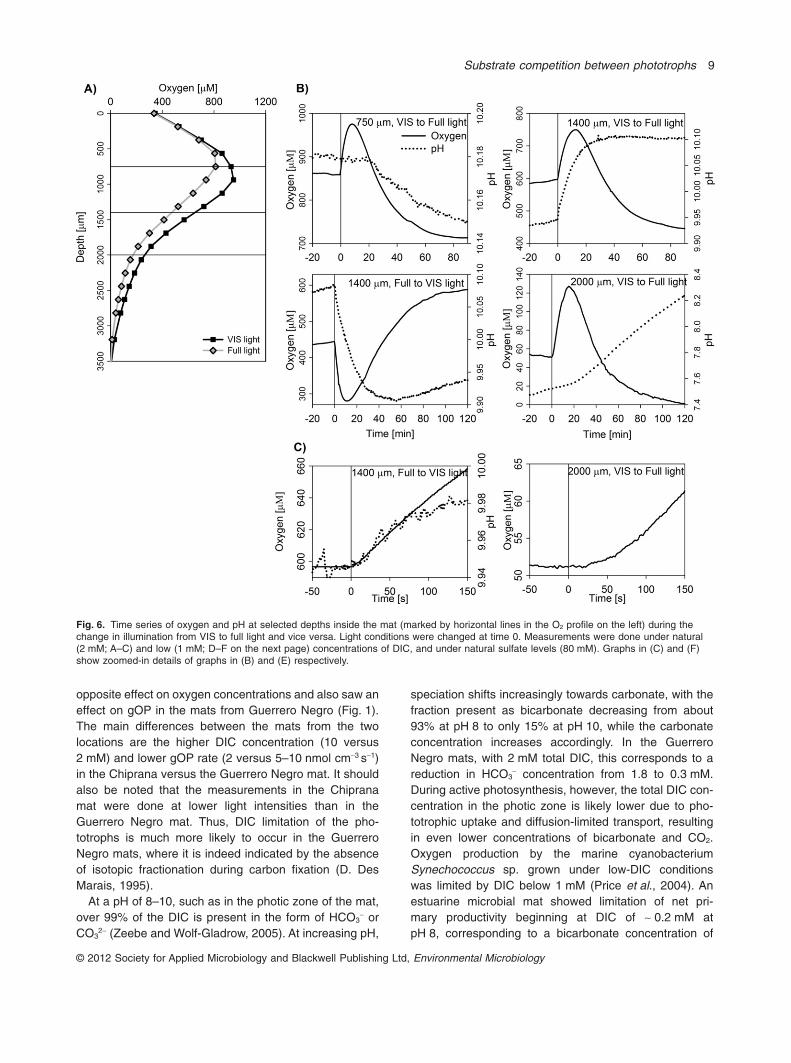
NIR light-induced dynamics of oxygen and pH
Oxygen concentrations and pH were measured atselected depths inside the mat during a transition from
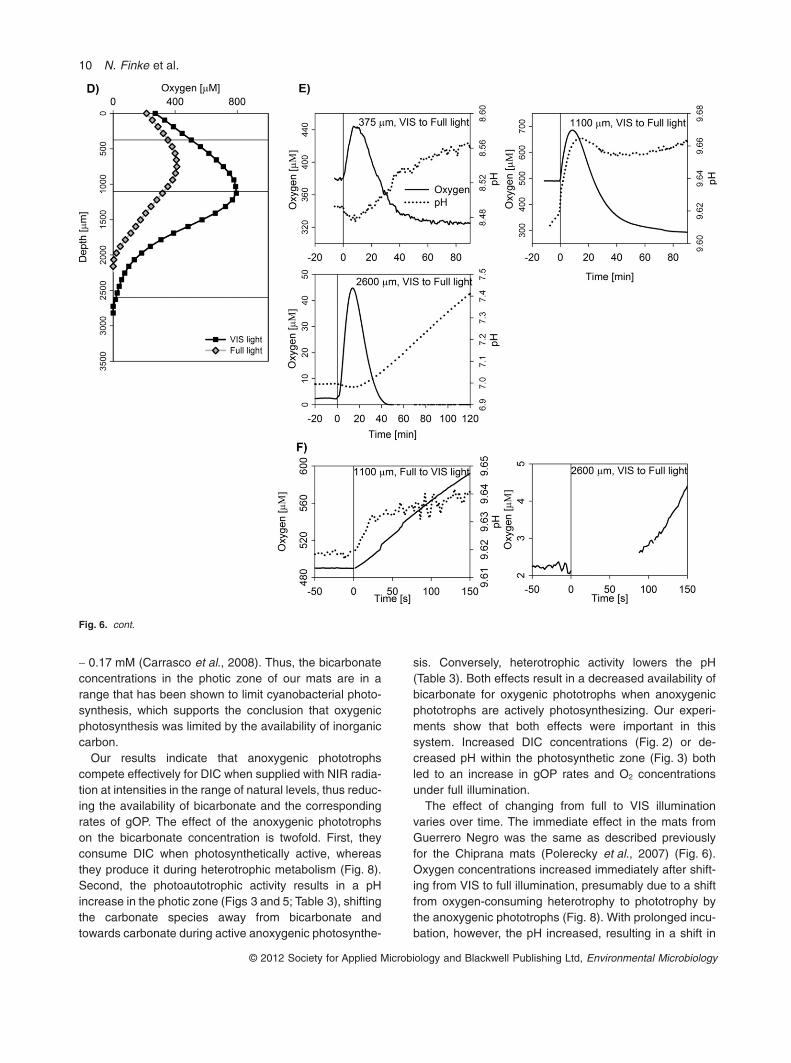
VIS to full illumination. In the 2 mM DIC treatment, thedepths corresponded to (i) the position of the pH peak,which was just above the oxygen peak (750 mm), (ii) theposition where the NIR light-induced change in oxygenand gOP was largest (1400 mm), and (iii) the maximaldepth where gOP was still detectable (2000 mm; seeFigs 2B and 6A). In the 1 mM DIC treatment, the depthscorresponded to (i) the shallowest depth where gOPwas detectable (380 mm), (ii) the position where the NIRlight-induced change in oxygen and gOP was largest(1100 mm), and (iii) the position slightly below themaximum depth of detectable gOP (2600 mm; seeFigs 2E and 6D). In these measurements, the NIR illumi-nation was controlled by light emitting diodes rather thanby using a NIR cut-off filter.
At all depths, oxygen concentrations increased rapidlyduring the initial 10–15 min after the change from VIS tofull illumination (Fig. 6). This increase was immediate atdepths of 750 and 1400 mm in the 2 mM DIC treatmentand 380 mm and 1100 mm in the 1 mM DIC treatment,whereas it was delayed at greater depths, by approxi-mately 23 s at 2000 mm in the 2 mM DIC treatmentand � 50 s at 2600 mm in the 1 mM DIC treatment(Fig. 6C and F). With prolonged incubation, oxygen con-centrations started to decrease and eventually stabilizedbelow the initial concentration after about 80–100minutes. The addition of NIR light induced an immediateincrease in pH at depths 1400 and 1100 mm, where it
Fig. 3. Vertical profiles of oxygen concentrations, volumetric rates of gross oxygenic photosynthesis (gOP) and pH in the mat 30 min after thechange in illumination from dark to full light (Full light, low pH), after 3 h of full light exposure (Full light), when oxygen and pH profiles reacheda steady state, and after additional 1.5 h at VIS light exposure (VIS light). Profiles were measured in the same mat location.
6 N. Finke et al.
© 2012 Society for Applied Microbiology and Blackwell Publishing Ltd, Environmental Microbiology
reached a stable value after about 20 min. pH also startedto increase at most other depths, but only after a delay ofabout 8–20 min. Oxygen and pH at depth 1400 mm exhib-ited the opposite dynamics when measured after thereversed light transition (full to VIS illumination; Fig. 6B).The delayed increase in oxygen at depths 2000 and2600 mm implied that no NIR light-sensitive aerobic het-erotrophy of anoxygenic phototrophs was active at thosedepths, and the ultimate increase depended solely on thediffusion from depths where the process was active.
Scalar irradiance
Spectrally resolved scalar irradiance was measured atdifferent depths inside the mat. Normalization to thescalar irradiance at the mat surface revealed distinctspectral signatures of major photosynthetic pigments(Fig. 7). The pronounced valley at 680 nm was due to theabsorption maximum of chlorophyll a (Chl a) from oxy-genic phototrophs, presumably cyanobacteria, whereasthe valleys at 800 and 870 nm were due to absorption by
Fig. 4. Vertical profiles of oxygenconcentrations and volumetric rates of grossoxygenic photosynthesis (gOP) in themicrobial mats from Guerrero Negroilluminated with VIS and full light. Measured inthe mat incubated with low sulfateconcentrations (0.2 mM; A and B) and aftersulfate was reinstated to natural levels(80 mM; C and D) for 3 days. Measurementsat the different light qualities were done in thesame mat location while measurements underthe different sulfate concentrations were donein the same sample at different locations.Intensity of the incident light (PAR fraction)was 1500 mmol photons m-2 s-1, and the matswere incubated under natural concentrationsof DIC (2 mM).
Substrate competition between phototrophs 7
© 2012 Society for Applied Microbiology and Blackwell Publishing Ltd, Environmental Microbiology

Bchl a, a pigment specific for anoxygenic phototrophs.The spectral index used to estimate the Chl a extinctioncoefficient and its spatial distribution (see Experimentalprocedures) revealed a roughly even abundance of thispigment in the upper 1100 mm of the mat and a sharpdecline below. The scalar irradiance at wavelengths in theVIS range attenuated steeply in this zone, reaching about1% of the surface level at 1300 mm depth. In contrast, asimilar index for Bchl a indicated that this pigmentco-occurred with Chl a at depths from 450 to 1300 mm,reached a maximum around the depth where Chl asharply declined, and was detectable down to 1900 mm inthe mat. The scalar irradiance in the NIR range decreasedmoderately in the top 500 mm of the mat and declinedmore steeply below 1100 mm, reaching 1% of the surfacelevel at 1900 mm depth (Fig. 7C).
Discussion
Our measurements of gOP under varying light conditionsconsistently demonstrated that the activity of oxygenicphototrophs, such as cyanobacteria, can be influencedsubstantially by the autotrophic activity of anoxygenicphototrophs in microbial mats. Both oxygen concentra-tions and rates of gOP increased when changing from fullillumination, with both oxygenic and anoxygenic pho-totrophs active, to VIS-only (< 700 nm) illumination, withonly oxygenic phototrophs active (Fig. 1). This strongly
suggests a competition between oxygenic and anoxy-genic phototrophs that is relieved when the system isdeprived of NIR wavelengths. Under reduced light levels,and thus reduced photosynthetic activity, the activity of theanoxygenic phototrophs did not influence oxygenic pho-tosynthesis (Fig. 2B). Likewise, increasing the concentra-tion of bicarbonate eliminated the effect on gOP (Fig. 2A),whereas the effect was enhanced under reduced DICconcentrations (Fig. 2B). Thus, under the high light inten-sities experienced by these mats in their natural setting,both oxygenic and anoxygenic C-fixation is taking placewithin the oxic zone of the mat, and the phototrophicguilds compete for inorganic carbon as a substrate forphotosynthesis.
Competition for inorganic carbon betweenphotosynthetic guilds
Interactions between anoxygenic Chloroflexus-like bacte-ria and oxygenic phototrophs were previously describedin a hypersaline mat from Lake Chiprana, Spain (Pol-erecky et al., 2007; Bachar et al., 2008). In that system,rates of gOP were unchanged while oxygen concentra-tions decreased under VIS-only relative to full-lightillumination. This was attributed to enhanced oxygenconsumption induced by a switch of the anoxygenicphototrophic community from phototrophy to aerobicheterotrophy (Fig. 8, lower diagram). We observed the
Fig. 5. Vertical profiles of pH in the matsilluminated with VIS and full light. Measuredunder natural (2 mM), increased (10 mM) andreduced (1 mM) DIC, but all with naturalsulfate (80 mM) concentrations.Measurements in the increased DICexperiment (A) were performed in the samelocation at incident light (PAR fraction(400–700 nm) of the light spectra) of1500 mmol photons m-2 s-1. In the reducedDIC experiment (B) measurements wereperformed in the same mat location in anothermat subsample at incident light intensity (PARfraction) of 1200 mmol photons m-2 s-1. Allmeasurements were performedsimultaneously with oxygen and gOPmeasurements presented in Fig. 2.
8 N. Finke et al.
© 2012 Society for Applied Microbiology and Blackwell Publishing Ltd, Environmental Microbiology
opposite effect on oxygen concentrations and also saw aneffect on gOP in the mats from Guerrero Negro (Fig. 1).The main differences between the mats from the twolocations are the higher DIC concentration (10 versus2 mM) and lower gOP rate (2 versus 5–10 nmol cm-3 s-1)in the Chiprana versus the Guerrero Negro mat. It shouldalso be noted that the measurements in the Chipranamat were done at lower light intensities than in theGuerrero Negro mat. Thus, DIC limitation of the pho-totrophs is much more likely to occur in the GuerreroNegro mats, where it is indeed indicated by the absenceof isotopic fractionation during carbon fixation (D. DesMarais, 1995).
At a pH of 8–10, such as in the photic zone of the mat,over 99% of the DIC is present in the form of HCO3
- orCO3
2- (Zeebe and Wolf-Gladrow, 2005). At increasing pH,
speciation shifts increasingly towards carbonate, with thefraction present as bicarbonate decreasing from about93% at pH 8 to only 15% at pH 10, while the carbonateconcentration increases accordingly. In the GuerreroNegro mats, with 2 mM total DIC, this corresponds to areduction in HCO3
- concentration from 1.8 to 0.3 mM.During active photosynthesis, however, the total DIC con-centration in the photic zone is likely lower due to pho-totrophic uptake and diffusion-limited transport, resultingin even lower concentrations of bicarbonate and CO2.Oxygen production by the marine cyanobacteriumSynechococcus sp. grown under low-DIC conditionswas limited by DIC below 1 mM (Price et al., 2004). Anestuarine microbial mat showed limitation of net pri-mary productivity beginning at DIC of ~ 0.2 mM atpH 8, corresponding to a bicarbonate concentration of
Fig. 6. Time series of oxygen and pH at selected depths inside the mat (marked by horizontal lines in the O2 profile on the left) during thechange in illumination from VIS to full light and vice versa. Light conditions were changed at time 0. Measurements were done under natural(2 mM; A–C) and low (1 mM; D–F on the next page) concentrations of DIC, and under natural sulfate levels (80 mM). Graphs in (C) and (F)show zoomed-in details of graphs in (B) and (E) respectively.
Substrate competition between phototrophs 9
© 2012 Society for Applied Microbiology and Blackwell Publishing Ltd, Environmental Microbiology
~ 0.17 mM (Carrasco et al., 2008). Thus, the bicarbonateconcentrations in the photic zone of our mats are in arange that has been shown to limit cyanobacterial photo-synthesis, which supports the conclusion that oxygenicphotosynthesis was limited by the availability of inorganiccarbon.
Our results indicate that anoxygenic phototrophscompete effectively for DIC when supplied with NIR radia-tion at intensities in the range of natural levels, thus reduc-ing the availability of bicarbonate and the correspondingrates of gOP. The effect of the anoxygenic phototrophson the bicarbonate concentration is twofold. First, theyconsume DIC when photosynthetically active, whereasthey produce it during heterotrophic metabolism (Fig. 8).Second, the photoautotrophic activity results in a pHincrease in the photic zone (Figs 3 and 5; Table 3), shiftingthe carbonate species away from bicarbonate andtowards carbonate during active anoxygenic photosynthe-
sis. Conversely, heterotrophic activity lowers the pH(Table 3). Both effects result in a decreased availability ofbicarbonate for oxygenic phototrophs when anoxygenicphototrophs are actively photosynthesizing. Our experi-ments show that both effects were important in thissystem. Increased DIC concentrations (Fig. 2) or de-creased pH within the photosynthetic zone (Fig. 3) bothled to an increase in gOP rates and O2 concentrationsunder full illumination.
The effect of changing from full to VIS illuminationvaries over time. The immediate effect in the mats fromGuerrero Negro was the same as described previouslyfor the Chiprana mats (Polerecky et al., 2007) (Fig. 6).Oxygen concentrations increased immediately after shift-ing from VIS to full illumination, presumably due to a shiftfrom oxygen-consuming heterotrophy to phototrophy bythe anoxygenic phototrophs (Fig. 8). With prolonged incu-bation, however, the pH increased, resulting in a shift in
Fig. 6. cont.
10 N. Finke et al.
© 2012 Society for Applied Microbiology and Blackwell Publishing Ltd, Environmental Microbiology
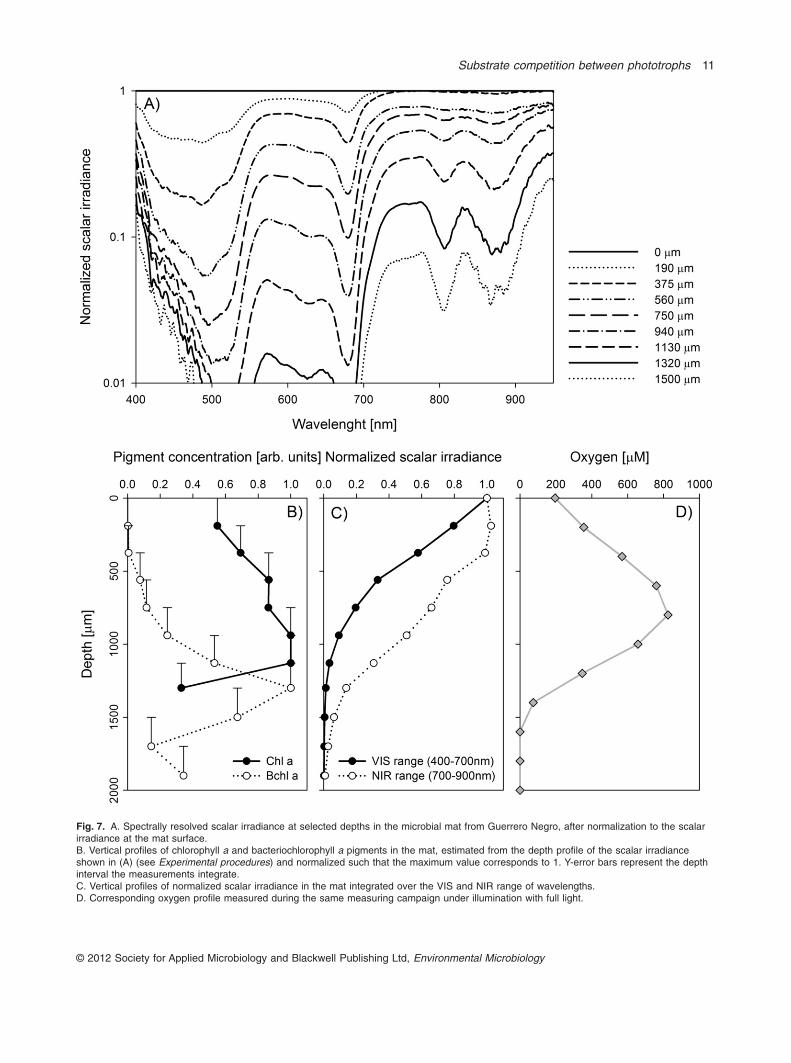
Fig. 7. A. Spectrally resolved scalar irradiance at selected depths in the microbial mat from Guerrero Negro, after normalization to the scalarirradiance at the mat surface.B. Vertical profiles of chlorophyll a and bacteriochlorophyll a pigments in the mat, estimated from the depth profile of the scalar irradianceshown in (A) (see Experimental procedures) and normalized such that the maximum value corresponds to 1. Y-error bars represent the depthinterval the measurements integrate.C. Vertical profiles of normalized scalar irradiance in the mat integrated over the VIS and NIR range of wavelengths.D. Corresponding oxygen profile measured during the same measuring campaign under illumination with full light.
Substrate competition between phototrophs 11
© 2012 Society for Applied Microbiology and Blackwell Publishing Ltd, Environmental Microbiology

inorganic carbon speciation towards carbonate limitingthe oxygenic photosynthesis resulting in decreasedoxygen concentrations.
An alternative explanation for the effect of NIR light ongOP would be O2 photoreduction by anoxygenic pho-totrophs, similar to the Mehler reaction (Mehler, 1951;
Asada, 2000), during full illumination that disappearsupon VIS illumination, as described by Zannoni and col-leagues (1978). The effect of DIC concentration ongOP would then be explained by O2 photoreduction byRubisco, which would be affected by the DIC concentra-tion as it is a competitive process caused by the low
Fig. 8. Conceptual models of carbon cycling in photosynthetic microbial mats found in water bodies with a relatively low (Guerrero Negro) andhigh (Lake Chiprana) concentration of DIC. In the Guerrero Negro mats under full light illumination, the oxygenic and anoxygenic phototrophscompete for low levels of bicarbonate, resulting in lower oxygenic photosynthesis and thus oxygen concentrations. Under VIS illumination theanoxygenic phototrophs possibly switch to aerobic heterotrophy, increasing the concentration of bicarbonate directly but also by their effect onthe pH. The increased bicarbonate concentrations allow for higher rates of oxygenic photosynthesis and thus oxygen concentrations. In theLake Chiprana mats, bicarbonate concentrations are not limiting, thus the only effect when switching from full to VIS illumination is the switchof the Chloroflexus-like bacteria from phototrophy to aerobic heterotrophy, reducing the oxygen concentration, but not affecting the rate ofoxygenic photosynthesis.
12 N. Finke et al.
© 2012 Society for Applied Microbiology and Blackwell Publishing Ltd, Environmental Microbiology

specificity of Rubisco (Berg, 2011). Measurements ofgOP by switching off only VIS light under full illuminationcompared with switching off the full light spectrum(Supplementary material S1; Fig. S1) showed, however,that O2 photoreduction by anoxygenic phototrophs is notimportant in our mats. Additionally, the O2 time-coursemeasurements showed an instantaneous decrease inoxygen concentrations upon shift from full to VIS illumi-nation (Fig. 6B). This is inconsistent with O2 reduction byanoxygenic phototrophs, as reducing O2 reduction byturning off NIR light should lead to an increase, not adecrease in oxygen concentration.
Activity of anoxygenic phototrophs
Chloroflexi, comprising the phototrophic Chloroflexaceae,including Chloroflexus and Roseiflexus, are abundantthroughout the Guerrero Negro mat including the oxicsurface layer (0–1 mm) (Ley et al., 2006; Dillon et al.,2009). Depth profiles of scalar irradiance spectra indicatedthat Bchl a-containing organisms, such as Roseiflexus,were present already in the 190–370 mm interval of the mat(Fig. 7). We could not detect Bchl c, a pigment found inChloroflexus sp, but previous pigment extractions fromthe same location showed the presence of Bchl c at leastin the layer just below the oxic zone (Ley et al., 2006). Thepresence and activity of anoxygenic phototrophs at375 mm was also demonstrated by the immediate increasein oxygen concentrations following addition of NIR wave-lengths to the VIS-only irradiance in the 1 mM DIC incuba-tion (Fig. 6E). This increase was due to a switch probablyfrom aerobic heterotrophy to anoxygenic phototrophy bythe anoxygenic phototrophs upon illumination with NIRlight. In the 2 mM DIC incubations, no difference in gOPwas seen between full and VIS illumination in the surfacelayer, probably due to higher DIC concentrations.Maximum density of Bchl a was found between 1130 and1320 mm, at the lower end of the zone where oxygen andgOP were detectable (Figs 7B, 1A and B). At 1500 mm, thelight intensity at 800 and 870 nm was less than 4% of thesurficial irradiance. gOP profiles did not show competition
between the photosynthetic guilds measured in parallelmat samples in these horizons (Fig. 1B).
Where DIC limits oxygenic photosynthesis, measuringthe difference in gOP rates under full versus VIS-onlyillumination yields an estimate of the rate of anoxygenicphotosynthesis. Several factors influencing extracellularpH and DIC speciation and concentration must be con-sidered in this calculation. First, the effect of anoxygenicphotosynthesis on pH depends on the electron donorused and the substrate produced (Table 3). The two endmembers would be anoxygenic sulfide-based photosyn-thesis producing either elemental sulfur or sulfate, whichconsumes 3 and 0.5 H+ per bicarbonate fixed respectively.Aerobic respiration of organic carbon releases on average1 H+ per bicarbonate formed. We assume that aerobicrespiration by anoxygenic phototrophs is bracketedbetween negligible rates and their photosynthetic ratein NIR illumination. The effect of consumption of 1 bicar-bonate on the bicarbonate concentration is the same asthe consumption of 1 H+ in the carbonate-buffered system(Asuero 2007; Supplementary material S4). Takentogether, the shift from anoxygenic photosynthesis duringfull illumination to aerobic respiration during NIR darknessresults in a total increase in bicarbonate availabilitybetween S = 1.5 and 6 (mol DIC per mol DIC fixed underfull illumination) using the two end members (Table 4). Foreach oxygen produced, oxygenic photosynthesis con-sumes one bicarbonate and one proton for a total impacton the bicarbonate pool of S = 2, using the notationapplied above and in Tables 3 and 4 for anoxygenic pho-tosynthesis. Thus, a shift from sulfur-producing anoxy-genic photosynthesis to aerobic respiration (S = 6)enables production of 3 O2, while a shift from sulfate-producing anoxygenic photosynthesis to inactivity(S = 1.5) enables production of 0.75 O2. Applying thesefactors to the difference between gOP rates under VISand full illumination thus allows us to bracket the totalrates of anoxygenic photosynthesis (Fig. 9).
Under natural conditions (in situ levels of sulfate andDIC), the depth-integrated (areal) rates of C-fixation byanoxygenic phototrophs in the zone with DIC limitation
Table 3. pH and DIC balance for different photosynthetic and respiratory reactions, normalized per mol of bicarbonate.
Process Reaction H+ balance DIC balance S
PhotosynthesisOxygenic photosynthesis HCO3
- + H2O → CH2O + O2 + OH- -1 -1 -2Anoxygenic photosynthesis to S° HCO3
- + 2 HS- + 3 H+ → CH2O + 2S° +2 H2O -3 -1 -4Anoxygenic photosynthesis using H2 HCO3
- + 2 H2 → CH2O + H2O + OH- -1 -1 -2Photoheterotrophy 2 Succinate + HCO3
- → 2 Fumarate + CH2O + H2O + OH- -1 -1 -2Anoxygenic photosynthesis to sulfate HCO3
- + 1/2 HS- + 1/2 H+ → CH2O + 1/2 SO42- -0.5 -1 -1.5
RespirationAerobic heterotrophy CH2O + O2 + OH- → HCO3
- + H2O +1 +1 +2Heterotrophy using sulfate CH2O + 1/2 SO4
2-→ HCO3- + 1/2 HS- + 1/2 H+ +0.5 +1 +1.5
Fermentation CH2O + H2O + OH- → 2H2 + HCO3- +1 +1 +2
Substrate competition between phototrophs 13
© 2012 Society for Applied Microbiology and Blackwell Publishing Ltd, Environmental Microbiology

Table 4. H+ and DIC balances for activity of anoxygenic phototrophs under full and visible light.
Full light VIS light H+ balance DIC balance S
HCO3- + 2 HS- + 3 H+ -> CH2O + 2 S° +2 H2O → CH2O + O2 -> HCO3
- + H+ +4 +2 +6HCO3
- + 1/2 HS- + 1/2 H+ -> CH2O + 1/2 SO42- → Inactive +0.5 +1 +1.5
The two end-members according to the reactions from Table 3 are anoxygenic phototrophs (i) switching from anoxygenic photoautotrophy (basedon HS- oxidation to elemental S) to aerobic heterotrophy, and (ii) switching from anoxygenic photoautotrophy (based on HS- oxidation to sulfate)to no activity.
Fig. 9. Comparison of measured rates ofgross oxygenic photosynthesis (gOP) underfull and VIS illumination and estimated sum ofgross anoxygenic and oxygenicphotosynthesis (Sum P) (given asnmol C cm-3 s-1) in the mat from GuerreroNegro incubated at natural (2 mM; A, B) andreduced (1 mM; C, D) levels of DIC. Sum P isshown for the two end-members (see Table 4)of anoxygenic phototrophs switching fromusing hydrogen sulfide as electron donorproducing elemental sulfur to aerobicheterotrophy upon dark shift (Sum P Full min)and switching from using hydrogen sulfide aselectron donor producing sulfate to inactivityupon dark shift (Sum P Full max).
14 N. Finke et al.
© 2012 Society for Applied Microbiology and Blackwell Publishing Ltd, Environmental Microbiology

were 10% and 40% of the corresponding gOP rates, andthe volumetric rates were 8–70% and 14–280% of thegOP (Fig. 9, Table 2), as estimated using the two endmembers from Table 4 respectively. In the low DIC incu-bations, these values increased to 30% and 115% for thedepth-integrated and 55–100% and 220–380% for thevolumetric rates. In the high DIC incubations the effect ofthe NIR light on the oxygenic photosynthesis was muchsmaller, changing the depth-integrated rate by about 1%and 4% and the volumetric rates by -2% to 24% and-10% to 95% (Table 2). Taking into account that anoxy-genic C-fixation could only be measured at those depthswhere simultaneous activity of oxygenic and anoxygenicphototrophs lead to DIC limitation, the actual rates ofanoxygenic C-fixation, and the contribution to primaryproduction, was likely higher. Additionally, these interpre-tation assumes photoautotrophy by anoxygenic pho-totrophs only under NIR illumination. Absorption ofbacteriochlorophylls in the VIS range suggests that VISlight might also be used by anoxygenic phototrophs.Unfortunately, we could not find action spectra of anoxy-genic phototrophs to support or undermine this hypoth-esis. If anoxygenic phototrophs could use VIS light, ourcalculated rates of anoxygenic photosynthesis would beunderestimated, as the photoautotrophic activity of anoxy-genic phototrophs would only be reduced, not switched offcompletely, after the transition from full to VIS illumination.Measurements of anoxygenic photosynthesis usingsulfide as electron donor in older mats from GuerreroNegro showed potential rates of sulfide oxidation about30–50% (volume-based) and 10% (area-based) of theC-fixation rates measured in the more active, fresher mats(see Supplementary material S2 for details; Fig. S2,Fig. 1), further supporting the conclusion that the anoxy-genic phototrophs play a quantitatively important role inC-fixation similar to oxygenic phototrophs.
The competition for bicarbonate also has some meth-odological implications on gOP measurements. Polereckyand colleagues (2007) showed that the use of a lightsource that includes NIR light during the light–dark shiftmethod lead to an overestimation of gOP due to a shift ofthe anoxygenic phototrophs from autotrophy to heterotro-phy in their mats from lake Chiprana. In our mats fromGuerrero Negro, the opposite was the case. gOP meas-urements with full light–dark shift, versus VIS light–darkshift under full light illumination resulted in the same rate,whereas rates increased when measured under VIS illu-mination (Fig. S1). In both cases, the light–dark shift willstop phototrophy, which will be followed by a start ofrespiration. The effect on the oxygen concentration, andthus gOP measurement, depends, however, on interac-tion between the photosynthetic guilds and thus thefactors controlling the photosynthetic activity. If the systemis limited by a common substrate for both photosynthetic
guilds, measured rates will be higher under VIS light,whereas they will be higher under full light when thesystem is light limited (Fig. 8). The optimal light source forstudying interactions between photosynthetic guilds inmicrobial mats, but also to measure process rates, willthus depend on the microbial ecology of the system butalso the question to be answered.
The competition between the two guilds can also influ-ence interpretations of light saturation measurements ofoxygenic photosynthesis. Light saturation is the apparentconsequence of substrate limitation or of limitation of therate of electron-transfer in the e--transport chain. In ourmats, gOP at high light intensities is limited by the avail-ability of inorganic carbon, and this apparent limitationheavily depends on the presence and activity of othercommunities that compete for the limiting substrate, andwill therefore be modulated by light quality and intensity.
Electron donor for anoxygenic phototrophs
Anoxygenic phototrophs can use a range of different elec-tron donors, including H2, reduced carbon and reducedS-compounds such as sulfide. The variety of electrondonors for anoxygenic phototrophs makes it very difficultto measure this process directly. In the case of sulfide,however, measurements of the change in sulfide concen-tration after NIR light–dark shift (Caumette et al., 1994)can provide an analogue to the oxygen-based light–darkshift method used for measurements of gOP rates. Appli-cation of this methodology to an older, less active matfrom Guerrero Negro showed that sulfide was used as theelectron donor for anoxygenic photosynthesis (see Sup-plementary material S2 and Fig. S2). As this methodrequires measurable sulfide concentrations, it is not pos-sible to determine anoxygenic photosynthesis in the oxiczone, where sulfide remains below the detection limit.During night, however, sulfide concentrations in theselayers increased and potential rates were measurable byNIR dark–light shift transitions (Fig. S2).
Our low-sulfate experiment also indicates that reducedsulfur species, such as sulfide, were used as electrondonor for anoxygenic photosynthesis in these mats. Thesensitivity of phototrophic sulfur bacteria towards molecu-lar oxygen (de Witt and Van Gemerden, 1990) and theirlower affinity towards sulfide compared with heterotrophicsulfide oxidizers (Visscher et al., 1992) suggests thatsulfide was used as the electron donor in the anoxic partof the mat. At those depths, phototrophic sulfur bacteriaoxidize the sulfide diffusing up from deeper layers, alsoprotecting the cyanobacteria from sulfide poisoning.Under low sulfate conditions [and thus (presumably) lowsulfide; see also (Bebout et al., 2004)], the supply ofsulfide was limited and the anoxygenic phototrophs in theanoxic part of the mat had to use other reduced species,
Substrate competition between phototrophs 15
© 2012 Society for Applied Microbiology and Blackwell Publishing Ltd, Environmental Microbiology

such as hydrogen or reduced organic matter, as electrondonor, preventing these from diffusing up into the oxic partof the mat. If these reduced species were the electrondonor for the anoxygenic phototrophs in the oxic part ofthe mat under high sulfate conditions, the reduced supplyin the low sulfate mats could explain the lower activity ofthe anoxygenic phototrophs that did not influence theactivity of the oxygenic phototrophs (Fig. 4).
Alternatively, the demand for reduced species in theoxic horizon might have been met by high rates of aerobicsulfide production by sulfate-reducing bacteria, as previ-ously reported for Guerrero Negro mats (Canfield andDes Marais, 1991). Our mats incubated at 80 mM sulfatedid not show highest sulfate reduction rates in the oxicsurface layer (data not shown), but fast reoxidation of theproduced sulfide might mask the actual activity. Under lowsulfate conditions, the sulfate reduction rates and thussulfide production rates are lower, resulting in a sulfidelimitation of the phototrophic sulfide-oxidizing bacteria. Inthis scenario, the phototrophic sulfide-oxidizing bacteriawould not only have effectively competed with theoxygenic phototrophs for bicarbonate, but also withchemolithotrophic sulfide oxidizers for sulfide, at sulfideconcentrations below 1 mM.
Implications
Photosynthetic microbial mats may have dominated bio-logical productivity for most of Earth’s history (D.J. DesMarais, 1990; 1995; Catling et al., 2001). The chemicalevolution of our planet was probably more influenced bymicrobial mats and related assemblages than by anyother components of the biosphere. Studying the isotopicimprint of such mats in the geological record is an impor-tant tool in understanding the evolutionary trajectory ofour own biosphere. Our measurements show that at highnatural light levels anoxygenic phototrophs photosyntheti-cally fix carbon in the oxic part of the mat and effectivelycompete with cyanobacteria for inorganic carbon, thusdiminishing overall rates of oxygenic C-fixation. The dif-ferent C-fixation pathways utilized by the two guilds resultin varying isotopic fractionations and resulting isotopicimprints in the geological record (Van Der Meer et al.,2000). For interpretation of the isotopic signal of ancientmicrobial mats it is thus important to consider activity ofboth oxygenic and anoxygenic phototrophs. In the matstudied here the effect on the isotopic signal is likely evenstronger due the competition for inorganic carbonbetween the two guilds, leading to a DIC depletion andthus no fractionation during C-fixation in the most activepart of the photic zone (D. Des Marais, 1995). Detailedstudies on C-fixation and isotopic signals from the differ-ent photosynthetic guilds, but also of C-preservation,under a range of environmental conditions are needed to
better understand the effect of their parallel activity andthus help interpretations of the geological isotopic record.
Inorganic carbon for photosynthetic C-fixation is sup-plied by diffusion from the overlying water column, byrespiration throughout the mat and by upward diffusionfrom deeper layers. Bicarbonate and CO2, the substratesfor the phototrophs, are consumed by photosynthesis, butconcentrations are also decreased by the pH increasedue to photosynthetic activity. In the horizon just below thepeak in gOP, sources and sinks for bicarbonate are notbalanced at high photosynthetic activity, leading to bicar-bonate limitation of the photosynthetic guilds. The activityof the oxygenic phototrophs was reduced by up to 65%due to this competition, and depth-integrated oxygenicphotosynthesis rates were decreased by 18–30%(Table 2). Under low-DIC conditions, gOP in the 1600–2100 mm depth interval could only be measured underVIS-only and not full-light irradiance (Fig. 2F), showingthat anoxygenic phototrophs were able to fully outcom-pete oxygenic phototrophs for inorganic carbon.
Experimental procedures
Sampling and incubations
Microbial mats were collected from pond 4 near 5 of thesalterns from Exportadorade Sal. S.A. de C.V, GuerreroNegro, Mexico. The field site was described in detail by D.Des Marais (1995). Approximately 15 ¥ 20 cm samples of themats were kept in the greenhouse facilities at NASA AmesResearch Center (Bebout et al., 2002) and incubated undernatural light for at least 3 months prior to the measurements.Sulfate concentration in the overlying water was either80 mM (in situ level) or 0.2 mM. After 1.5 years, subsamplesof the mats were transported to the University of SouthernDenmark in Odense and incubated at similar conditions.
One of the oxygen and photosynthesis measurements at80 mM sulfate (shown in Fig. 1A and B), the low sulfateexperiment (Fig. 4) and the scalar irradiance measurement(Fig. 7) were performed at NASA Ames in December 2008,whereas all the other experiments were conducted inOdense in June 2010. Measurements performed at NASAAmes were performed on the whole ~ 15 ¥ 20 cm samplesof the mats, while measurements performed in Odense, andalso the low sulfate experiment, were done in ~ 2 cm corestaken from the mat and transferred to the photosynthesismeasuring box in the lab. The mats were kept at 25°Cduring the measurements.
Microsensor measurements
Oxygen concentrations were measured with Clark-typeoxygen microsensors (Revsbech et al., 1980) purchasedfrom Unisense, Denmark. pH profiles were measured with pHmicroelectrodes (Unisense, Denmark) coupled to a highimpedance pH meter (Mettler Toledo, Germany). Scalar irra-diance profiles were measured with a fibre optic scalar irra-diance microprobe (Lassen and Jørgensen, 1994) coupled to
16 N. Finke et al.
© 2012 Society for Applied Microbiology and Blackwell Publishing Ltd, Environmental Microbiology

a spectrometer (USB 4000, Ocean Optics, USA). The accu-rate positioning of the sensors was controlled by an electronicmicro-manipulator (Unisense). Microsensors were mountedat an angle of 20° to prevent self-shading, which wasaccounted for when calculating the vertical depths below themat surface.
The rates of gOP were measured with the light–dark shiftmethod (Revsbech and Jørgensen, 1983). Specifically, thesample was illuminated with either visible or full (visible andnear infrared) light of constant intensity until steady-stateoxygen concentrations were measured. Subsequently, thelight was switched off and the rate of gOP at the respectivedepth was determined from the initial rate of oxygendecrease after the light-to-dark transition (Revsbech and Jør-gensen, 1983). Comparison of the measurements where thenear infrared light was switched off together with the visiblelight or left unchanged during the visible light-to-dark transi-tion showed no difference (Fig. S1). Furthermore, it made nodifference whether the measurements were started with thevisible or full light-to-dark transition (data not shown). For agiven treatment, profiles of oxygen concentrations and gOPrates were measured in the same mat location for both visibleand full light-to-dark transitions. Unless stated otherwise, themats were pre-incubated under the respective light condi-tions for at least 1 h prior to the measurements.
Rates of oxygenic photosynthesis are given in nmolO2 cm-3 s-1. Due to the assumed 1:1 stoichiometry of O2
produced to C fixed in the photosynthesis equation (Table 3),the values are the same if the rate is expressed as nmol Ccm-3 s-1 as in Fig. 9, where oxygenic and anoxygenic photo-synthesis are combined.
Controlled light conditions
The mats were illuminated with an artificial light source (MI-150, Dolan Jenner, USA; Lightbulb USHIO EKE 21V150W,Japan) fitted with a single ‘goose-neck’ light guide (DolanJenner, USA) and a fibre bundle focusing assembly (NewportCorporation & Spectra-Physics, USA). The light from thissource resembled solar radiation (Table 1; Fig. S3). The lightintensity in the visible range (VIS; 400–700 nm) of the spec-trum was adjusted to a PAR (photosynthetically active radia-tion; 400–700 nm) intensity of 1200 or 1500 mmol photonsm-2 s-1 (measured with a Bio-Rad PAR sensor). This intensityis similar to the noon light levels in the NASA Ames green-house and to in situ conditions in Guerrero Negro. Nearinfrared (NIR) and VIS parts of the incident light wereremoved with a short-pass (700FL07-50S) and long-pass(700FH90-50S, both from Andover Corporation, USA) opticalfilter with a cut-off wavelength of 700 nm respectively. Insome experiments, NIR light was supplied by a combinationof light emitting diodes (ELD-720-524, ELD-740-524, ELD-780-524, ELD-840-515, Roithner Lasertechnik, Vienna,Austria; combined emission range 700–870 nm) rather thanthrough the use of the long-pass optical filter. Currentsthrough the LEDs were adjusted to match their intensities atwavelengths of maximal emission with those of the artificiallight source (see Fig. S3). Photon fluxes for the VIS and NIRlights under the different settings are listed in Table 4. Photonfluxes were measured with a spectrometer (Jazz, OceanOptics) equipped with a cosine corrected irradiance probe.
DIC concentration
Dissolved inorganic carbon was measured in HgCl2-fixedsamples by flow injection (Hall and Aller, 1992). High DICincubations (final concentration 10 mM) were prepared by theaddition of the appropriate amount of 1 M NaHCO3 solutionadjusted to pH 8. To prevent carbonate precipitation, theseincubations were performed in brine prepared with 120 mMMgSO4 instead of 80 mM NaSO4 (Akin and Lagerwerff,1965). Low DIC incubations (final concentration 1 mM) wereprepared by incubation of mat subsamples (2 mM DIC) incarbonate free brine. Prior to gOP measurements mats wereincubated for at least 12 h after the water exchange.
Sulfate concentration
Sulfate concentrations in the water column were controlled bypreparing artificial brine with the targeted sulfate concentra-tion. For the low sulfate treatment (0.2 mM), the overlyingbrine was exchanged three times with sulfate-free brine untilstable concentrations were reached, and the mat was incu-bated for at least 3 months before the measurements. Sulfateconcentrations in the overlying water were measured in HCl-fixed samples on an ion chromatograph (IC2000, Dionex).The sulfide agar plug was prepared by adding 2 mM Na2S(final concentration) to a 1.5% agar solution just before hard-ening. A mat subsample was cored, the upper 5 mm cut offand placed on top of the agar plug in a core liner and incu-bated in the flume with an 80 mM sulfate water column atnatural light.
Pigment concentration profiles
Pigment concentrations inside the mat were estimated byapplying the theoretical basics developed by Al-Najjar andcolleagues (2010). Due to the combination of scattering andabsorption, light attenuates exponentially with depth as itpropagates through the mat. Thus, by subtracting the log-transferred scalar irradiances at wavelengths where the lightabsorption by the pigment is minimal and maximal while itsscattering is approximately equal, and by calculating how thisdifference increases over a given depth interval inside themat, the average pigment concentration within that depthinterval can be estimated. For the Chl a and Bchl a pigments,this can be mathematically formulated as follows. First, nor-malized scalar irradiance was calculated as Nl(z) = Es(z,l)/Es(0, l), where Es(z, l) is the measured scalar irradiance atdepth z and wavelength l. Subsequently, the spectroscopicindex for the two pigments was calculated as SIChla =ln(N777nm) – ln(N680nm) and SIBchl a = ln(N777nm) – ln(N804nm), i.e. asthe depth of the valley in ln(Nl) at the wavelength correspond-ing to the maximum absorption of the respective pigment.Finally, the pigment concentrations were estimated from thespatial derivative of the corresponding spectroscopic index,i.e. Chl a = DSIChl a/Dz and Bchl a = DSIBchl a/Dz, which wasdone at each depth inside the mat.
Acknowledgements
We thank Brad Bebout for help with the microsensor meas-urements, Gaby Eickert for help building the scalar irradiance
Substrate competition between phototrophs 17
© 2012 Society for Applied Microbiology and Blackwell Publishing Ltd, Environmental Microbiology

probes, Michael Kühl for help with the absolute irradiancemeasurements and Dirk de Beer for fruitful discussion. Wealso thank three anonymous reviewers whose commentshelped improve the manuscript. The work was funded by anOak Ridge Postdoctoral Fellowship and a Marie Curie Out-going International Fellowship (Project # 22154).
References
Akin, G.W., and Lagerwerff, J.V. (1965) Calcium carbonateequilibria in solutions open to the air. II. Enhanced solubilityof CaCO3 in the presence of Mg2+ and SO4
2-. GeochimCosmochim Acta 29: 353–360.
Al-Najjar, M.A.A., de Beer, D., Jørgensen, B.B., Kühl, M., andPolerecky, L. (2010) Conversion and conservation of lightenergy in a photosynthetic microbial mat ecosystem. ISMEJ 4: 440–449.
Asada, K. (2000) The water–water cycle as alternativephoton and electron sinks. Philos Trans R Soc Lond B BiolSci 355: 1419–1430.
Asuero, A.G. (2007) Buffer capacity of a polyprotic acid: firstderivative of the buffer capacity and pKa values of singleand overlapping equilibria. Crit Rev Anal Chem 37: 269–301.
Bachar, A., Polerecky, L., Fischer, J.P., Vamvakopoulos, K.,de Beer, D., and Jonkers, H.M. (2008) Two-dimensionalmapping of photopigment distribution and activity ofChloroflexus-like bacteria in a hypersaline microbial mat.FEMS Microbiol Ecol 65: 434–448.
Badger, M.R., and Price, G.D. (1994) The role of carbonic-anhydrase in photosynthesis. Annu Rev Plant PhysiolPlant Mol Biol 45: 369–392.
Badger, M.R., and Price, G.D. (2003) CO2 concentratingmechanisms in cyanobacteria: molecular components,their diversity and evolution. J Exp Bot 54: 609–622.
Bebout, B.M., Carpenter, S.P., Des Marais, D.J., Discipulo,M., Embaye, T., Garcia-Pichel, F., et al. (2002) Long-termmanipulations of intact microbial mat communities in agreenhouse collaboratory: simulating Earth’s present andpast field environments. Astrobiology 2: 383–402.
Bebout, B.M., Hoehler, T.M., Thamdrup, B., Albert, D.B., Car-penter, S.P., Hogan, M., et al. (2004) Methane productionby microbial mats under low sulphate concentrations. Geo-biology 2: 87–96.
Berg, I.A. (2011) Ecological aspects of the distribution ofdifferent autotrophic CO2 fixation pathways. Appl EnvironMicrobiol 77: 1925–1936.
Canfield, D.E., and Des Marais, D.J. (1991) Aerobic sulfatereduction in microbial mats. Science 251: 1471–1473.
Canfield, D.E., and Des Marais, D.J.D. (1993) Biogeochemi-cal cycles of carbon, sulfur, and free oxygen in a microbialmat. Geochim Cosmochim Acta 57: 3971–3984.
Carrasco, M., Mercado, J.M., and Niell, F.X. (2008) Diversityof inorganic carbon acquisition mechanisms by intactmicrobial mats of Microcoleus chthonoplastes (Cyanobac-teriae, Oscillatoriaceae). Physiol Plant 133: 49–58.
Catling, D.C., Zahnle, K.J., and McKay, C.P. (2001) Biogenicmethane, hydrogen escape, and the irreversible oxidationof early Earth. Science 293: 839–843.
Caumette, P., Matheron, R., Raymond, N., and Relexans,J.C. (1994) Microbial mats in the hypersaline ponds of
Mediterranean salterns (Salins-de-Giraud, France). FEMSMicrobiol Ecol 13: 273–286.
Damelio, E.D., Cohen, Y., and Des Marais, D.J. (1987)Association of a new type of gliding, filamentous, purplephototrophic bacterium inside bundles of Microcoleus–Chthonoplastes in hypersaline cyanobacterial mats. ArchMicrobiol 147: 213–220.
Decker, K.L.M., Potter, C.S., Bebout, B.M., Des Marais, D.J.,Carpenter, S., Discipulo, M., et al. (2005) Mathematicalsimulation of the diel O, S, and C biogeochemistry of ahypersaline microbial mat. FEMS Microbiol Ecol 52: 377–395.
Des Marais, D. (1995) The biogeochemistry of hypersalinemicrobial mats. In Advances in Microbial Ecology. Jones,J.G. (ed.). New York, USA: Plenum, pp. 251–274.
Des Marais, D.J. (1990) Microbial mats and the early evolu-tion of life. Trends Ecol Evol 5: 140–144.
Des Marais, D.J. (1995) The biogeochemistry of hypersalinemicrobial mats. Adv Microb Ecol 14: 251–274.
Dillon, J.G., Miller, S., Bebout, B., Hullar, M., Pinel, N., andStahl, D.A. (2009) Spatial and temporal variability ina stratified hypersaline microbial mat community. FEMSMicrobiol Ecol 68: 46–58.
Grötzschel, S., Abed, R.M.M., and de Beer, D. (2002) Meta-bolic shifts in hypersaline microbial mats upon addition oforganic substrates. Environ Microbiol 4: 683–695.
Hall, P.O., and Aller, R.C. (1992) Rapid, small-volume, flow-injection analysis for sum-CO2 and NH4
+ in marine andfresh-waters. Limnol Oceanogr 37: 1113–1119.
Herman, E.K., and Klump, L.R. (2005) Biogeochemistry ofmicrobial mats under Precambrian environmental condi-tions: a modelling study. Geobiology 3: 77–92.
Javor, B.J., and Castenholz, R.W. (1981) Laminated micro-bial mats, laguna Guerrero Negro, Mexico. Geomicrobiol J2: 237–273.
Jensen, J., and Revsbech, N.P. (1989) Photosynthesis andrespiration of a diatom biofilm cultured in a new gradientgrowths chamber. FEMS Microbiol Ecol 62: 29–38.
Jørgensen, B.B., and Des Marais, D.J.D. (1988) Optical-properties of benthic photosynthetic communities – fiber-optic studies of cyanobacterial mats. Limnol Oceanogr 33:99–113.
Kühl, M., Chen, M., Ralph, P.J., Schreiber, U., and Larkum,A.W.D. (2005) A niche for cyanobacteria containing chlo-rophyll d. Nature 433: 820–820.
Lassen, C., and Jørgensen, B.B. (1994) A fiberoptic irradi-ance microsensor (cosine collector) – application for in-situmeasurements of absorption-coefficients in sediments andmicrobial mats. FEMS Microbiol Ecol 15: 321–336.
Ley, R.E., Harris, J.K., Wilcox, J., Spear, J.R., Miller, S.R.,Bebout, B.M., et al. (2006) Unexpected diversity and com-plexity of the Guerrero Negro hypersaline microbial mat.Appl Environ Microbiol 72: 3685–3695.
Ludwig, R., Pringault, O., de Wit, R., de Beer, D., andJonkers, H.M. (2006) Limitation of oxygenic photosynthe-sis and oxygen consumption by phosphate and organicnitrogen in a hypersaline microbial mat: a microsensorstudy. FEMS Microbiol Ecol 57: 9–17.
Mehler, A.H. (1951) Studies on reaction of illuminated chlo-roplasts 1. Mechanism of the reduction of oxygen and otherhill reagents. Arch Biochem Biophys 33: 65–77.
18 N. Finke et al.
© 2012 Society for Applied Microbiology and Blackwell Publishing Ltd, Environmental Microbiology
Polerecky, L., Bachar, A., Schoon, R., Grinstein, M., Jør-gensen, B.B., de Beer, D., and Jonkers, H.M. (2007) Con-tribution of Chloroflexus respiration to oxygen cycling in ahypersaline microbial mat from Lake Chiprana, Spain.Environ Microbiol 9: 2007–2024.
Price, G.D., Woodger, F.J., Badger, M.R., Howitt, S.M., andTucker, L. (2004) Identification of a SulP-type bicarbonatetransporter in marine cyanobacteria. Proc Natl Acad SciUSA 101: 18228–18233.
Raven, J.A. (2009) Contributions of anoxygenic and oxygenicphototrophy and chemilithotrophy to carbon and oxygenfluxes in aquatic environments. Aquat Microb Ecol 56:177–192.
Revsbech, N.P., and Jørgensen, B.B. (1983) Photosynthesisof benthic microflora measured with high spatial-resolutionby the oxygen microprofile method – capabilities and limi-tations of the method. Limnol Oceanogr 28: 749–756.
Revsbech, N.P., Sørensen, J., Blackburn, T.H., and Lomholt,J.P. (1980) Distribution of oxygen in marine-sedimentsmeasured with microelectrodes. Limnol Oceanogr 25:403–411.
Van Der Meer, M.T.J., Schouten, S., De Leeuw, J.W., andWard, D.M. (2000) Autotrophy of green non-sulphurbacteria in hot spring microbial mats: biological explana-tions for isotopically heavy organic carbon in the geologicalrecord. Environ Microbiol 2: 428–435.
Visscher, P.T., Vandenende, F.P., Schaub, B.E.M., and VanGemerden, H. (1992) Competition between anoxygenicphototrophic bacteria and colorless sulfur bacteria in amicrobial mat. FEMS Microbiol Ecol 101: 51–58.
Ward, D.M., Tayne, T.A., Anderson, K.L., and Bateson, M.M.(1987) Community structure and interactions among com-munity members in hot spring cyanobacterial mats. In 41stSymposium of the Society for General Microbiology. Flet-scher, M., Gray, T.R.G., and Jones, J.G. (eds). Universityof St Andrews. Cambridge: Cambridge University Press,pp. 179–210.
de Witt, R., and Van Gemerden, H. (1990) Growth of thephototrophic purple sulfur bacterium Thiocapsaroseoper-sicina under oxic/anoxic regimens in the light. FEMS Micro-biol Lett 73: 69–76.
Zannoni, D., Jasper, P., and Marrs, B. (1978) Light inducedoxygen reduction as a probe of electron-transport between
respiratory and photosynthetic components in membranesof Rhodopseudomonas capsulate. Arch Biochem Biophys191: 625–631.
Zarzycki, J., Brecht, V., Müller, M., and Fuchs, G. (2009)Identifying the missing steps of the autotrophic3-hydroxypropionate CO2 fixation cycle in Chloroflexusaurantiacus. Proc Natl Acad Sci USA 106: 21317–21322.
Zeebe, R.E., and Wolf-Gladrow, D. (2005) CO2 in Seawater:Equilibrium, Kinetics, Isotopes. Amsterdam, the Nether-lands: Elsevier, p. 350.
Supporting information
Additional Supporting Information may be found in the onlineversion of this article:
Supplementary material S1. Measurements of oxygenconcentration changes following light–dark shift in differentwavelength ranges.Fig. S1. Gross oxygenic photosynthesis rates measuredunder full and VIS illumination. Under full illumination ratemeasurements were performed by either turning off the fulllight spectrum (Full, Full shut off) or turning off just the VISlight spectrum, leaving the NIR light on (Full, VIS shut off).Turning off the full light spectrum will affect all phototrophicorganisms, while turning off only the VIS light spectrumleaves anoxygenic phototrophy using NIR light active.Supplementary material S2. Measurement of potentialrates of anoxygenic photosynthesis.Fig. S2. Oxygen, sulfide and anoxygenic photosynthesisprofiles measured in the Guerrero Negro microbial mats.Supplementary material S3. Light intensity spectra of thedifferent illumination settings.Fig. S3. Spectra of the different artificial light sources usedin the experiments, as determined with a calibrated spec-trometer. The sun spectrum is shown for comparison.Supplementary material S4. Change in bicarbonate ionsper added proton.Fig. S4.1. Concentration of HCO3
- ions, buffering capacity,b, and the change in HCO3
- ions per molecule of addedstrong acid, N, as a function of the carbonate buffer pH.Fig. S4.2. The change in HCO3
- ions per molecule of addedstrong acid, N, as a function of the carbonate buffer pH.
Substrate competition between phototrophs 19
© 2012 Society for Applied Microbiology and Blackwell Publishing Ltd, Environmental Microbiology