Heterotrophic bacterial diversity in aquatic microbial mat communities from Antarctica
Upload
independentCategory
view
5download
0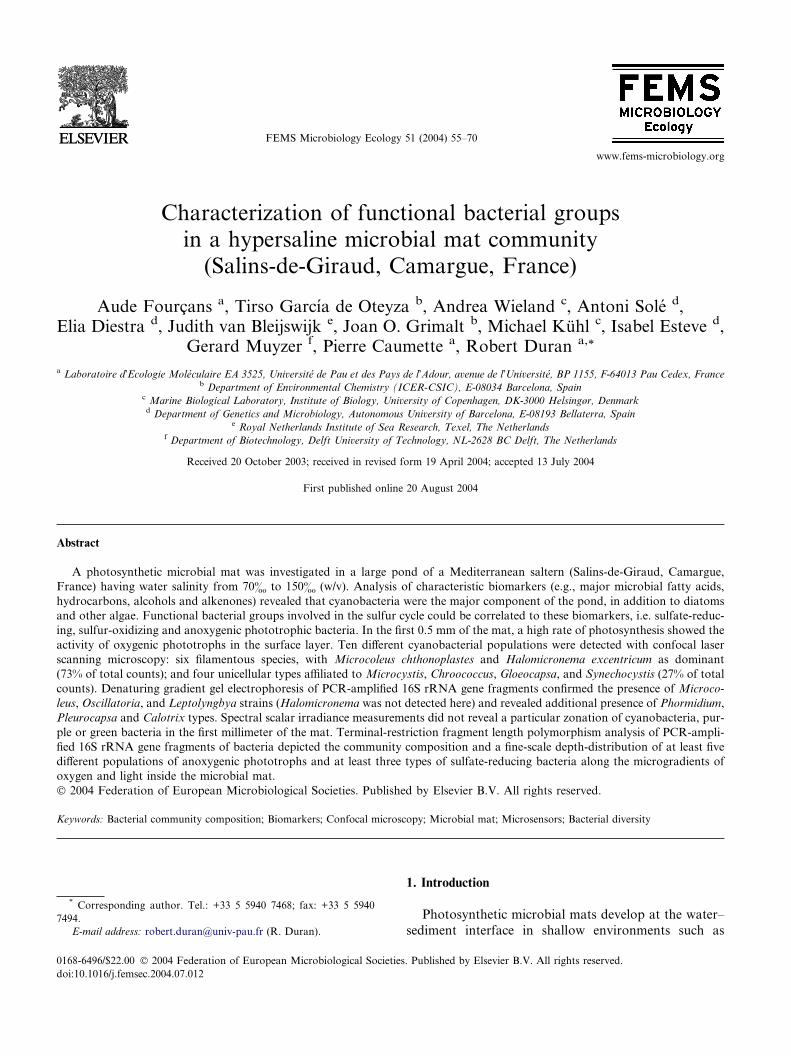
www.fems-microbiology.org
FEMS Microbiology Ecology 51 (2004) 55–70
Characterization of functional bacterial groupsin a hypersaline microbial mat community(Salins-de-Giraud, Camargue, France)
Aude Fourcans a, Tirso Garcıa de Oteyza b, Andrea Wieland c, Antoni Sole d,Elia Diestra d, Judith van Bleijswijk e, Joan O. Grimalt b, Michael Kuhl c, Isabel Esteve d,
Gerard Muyzer f, Pierre Caumette a, Robert Duran a,*
a Laboratoire d�Ecologie Moleculaire EA 3525, Universite de Pau et des Pays de l�Adour, avenue de l�Universite, BP 1155, F-64013 Pau Cedex, Franceb Department of Environmental Chemistry (ICER-CSIC), E-08034 Barcelona, Spain
c Marine Biological Laboratory, Institute of Biology, University of Copenhagen, DK-3000 Helsingør, Denmarkd Department of Genetics and Microbiology, Autonomous University of Barcelona, E-08193 Bellaterra, Spain
e Royal Netherlands Institute of Sea Research, Texel, The Netherlandsf Department of Biotechnology, Delft University of Technology, NL-2628 BC Delft, The Netherlands
Received 20 October 2003; received in revised form 19 April 2004; accepted 13 July 2004
First published online 20 August 2004
Abstract
A photosynthetic microbial mat was investigated in a large pond of a Mediterranean saltern (Salins-de-Giraud, Camargue,
France) having water salinity from 70& to 150& (w/v). Analysis of characteristic biomarkers (e.g., major microbial fatty acids,
hydrocarbons, alcohols and alkenones) revealed that cyanobacteria were the major component of the pond, in addition to diatoms
and other algae. Functional bacterial groups involved in the sulfur cycle could be correlated to these biomarkers, i.e. sulfate-reduc-
ing, sulfur-oxidizing and anoxygenic phototrophic bacteria. In the first 0.5 mm of the mat, a high rate of photosynthesis showed the
activity of oxygenic phototrophs in the surface layer. Ten different cyanobacterial populations were detected with confocal laser
scanning microscopy: six filamentous species, with Microcoleus chthonoplastes and Halomicronema excentricum as dominant
(73% of total counts); and four unicellular types affiliated to Microcystis, Chroococcus, Gloeocapsa, and Synechocystis (27% of total
counts). Denaturing gradient gel electrophoresis of PCR-amplified 16S rRNA gene fragments confirmed the presence of Microco-
leus, Oscillatoria, and Leptolyngbya strains (Halomicronema was not detected here) and revealed additional presence of Phormidium,
Pleurocapsa and Calotrix types. Spectral scalar irradiance measurements did not reveal a particular zonation of cyanobacteria, pur-
ple or green bacteria in the first millimeter of the mat. Terminal-restriction fragment length polymorphism analysis of PCR-ampli-
fied 16S rRNA gene fragments of bacteria depicted the community composition and a fine-scale depth-distribution of at least five
different populations of anoxygenic phototrophs and at least three types of sulfate-reducing bacteria along the microgradients of
oxygen and light inside the microbial mat.
� 2004 Federation of European Microbiological Societies. Published by Elsevier B.V. All rights reserved.
Keywords: Bacterial community composition; Biomarkers; Confocal microscopy; Microbial mat; Microsensors; Bacterial diversity
0168-6496/$22.00 � 2004 Federation of European Microbiological Societies
doi:10.1016/j.femsec.2004.07.012
* Corresponding author. Tel.: +33 5 5940 7468; fax: +33 5 5940
7494.
E-mail address: [email protected] (R. Duran).
1. Introduction
Photosynthetic microbial mats develop at the water–
sediment interface in shallow environments such as
. Published by Elsevier B.V. All rights reserved.

56 A. Fourcans et al. / FEMS Microbiology Ecology 51 (2004) 55–70
estuaries [1,2], sheltered sandy beaches [3,4], or hypersa-
line salterns [5,6]. Most of these microbial mats are
formed of horizontally stratified, multicolored and cohe-
sive thin layers of several functional groups of microor-
ganisms, such as cyanobacteria, colorless sulfur
bacteria, purple sulfur bacteria and sulfate-reducingbacteria, distributed along vertical microgradients of
oxygen, sulfide and light [7,8].
Hypersaline mats from salterns represent interesting
ecosystems adapted to fluctuating salinity conditions.
Microbial mats existing in the most hypersaline ponds
of the salterns of Salins-de-Giraud (Camargue, French
Mediterranean coast) have been described in ecological
and microbiological, and recently molecular studies overthe last 10 years [5,9–11]. These saline ponds with water
salinity between 150& and 300& (w/v) contain micro-
bial mats similar to those previously described in other
hypersaline habitats [6,12]. They are formed of an upper
layer of cyanobacteria belonging to the genus Phormi-
dium, covering a purple layer of phototrophic bacteria
mainly composed of members of the genera Halochro-
matium [13] andHalothiocapsa [14], well adapted to suchhigh salinities. Molecular studies [9] showed that the
bacterial composition of these mats was more diverse
than expected both in Bacterial and in Archaeal groups.
In the present study, we investigated another mat
from the same salterns growing in ponds with lower
salinity (70–150& (w/v)). This mat developed over sev-
eral decades in large areas used by the Saltern Company
as water reservoirs for salt production. The aim of thisanalysis was to characterize the composition of the func-
tional bacterial groups developing in the Camargue
microbial mat. The simultaneous use of different meth-
ods for analysis of bacterial composition and microenvi-
ronment, allowed a precise in situ analysis of the
Camargue mat. In the mat, the major bacterial groups
were investigated by characteristic biomarkers, confocal
laser scanning microscopy (CLSM), denaturing gradientgel electrophoresis (DGGE) and terminal-restriction
fragment length polymorphism (T-RFLP) analysis of
PCR amplified 16S rRNA genes or functional gene frag-
ments. In order to understand the bacterial occurrence
and distribution at the microscale level, all the microbio-
logical results were related to microenvironmental gradi-
ents determined by in situ microsensor measurements.
2. Materials and methods
2.1. Sampling site description
The sampling site was in a very large shallow pond at
the saltern of Salins-de-Giraud, close to the sand barrier
and the sea coast (43�27 03500 N, 04�41 02800 E, Camargue,France). This pond was used for the storage of pre-con-
centrated seawater. In this pond of about 10 km2 area,
the water column never exceeded 20 cm depth and its
salinity ranged from 70& to 150& (w/v). The photosyn-
thetic microbial mat covered a large proportion of this
pond and also of other adjacent ponds, and was consti-
tuted of thin laminated cohesive layers. Due to its devel-
opment over several decades, the mat was about 5–10cm thick. The underlying sediment was mostly com-
posed of a mixture of sand and clay.
2.2. Sampling procedure
All mat samples analyzed were collected in May 2000,
by mean of plexiglass cores. For biomarker analysis,
mat cores of 26 mm inner diamater were immediatelyfrozen until further analysis. For confocal laser scanning
microscopy, two cores (18 mm i.d.) were transferred into
small plastic tubes containing 2.5% (v/v) glutaraldehyde
in phosphate buffer (0.2 M, pH 7.4, adjusted to the
appropriate salinity with NaCl), and stored at 4 �C until
further processing. For DGGE and T-RFLP, the upper
10 mm of the mat cores (35 mm i.d.) were sliced off asep-
tically, transferred to sterile Petri dishes, frozen in liquidnitrogen, and then stored at �80 �C.
2.3. Microsensor measurements of O2 and oxygenic
photosynthesis profiles
Depth profiles of O2 and gross oxygenic photosynthe-
sis were measured in May 2000. Microsensor measure-
ments were done in situ from a small measuringplatform placed above the mat. A Clark-type O2 micro-
sensor [15] connected to a picoammeter (UniSense A/S,
Aarhus, Denmark) was manually operated with a
micromanipulator (Marzhauser, Wetzlar, Germany)
mounted on a heavy solid stand. Microsensor signals
were recorded with a strip battery-operated chart recor-
der (Servogor, Leeds, UK) operated via batteries. The
O2 microsensor had a tip diameter of 6 lm, a stirringsensitivity of �2% and a response time, t90, of 0.2 s.
The O2 microsensor was linearly calibrated on site from
readings of microsensor current in the overlying water
and in the anoxic part of the mat (2% O2). Dissolved
O2 concentrations in the overlying water were deter-
mined by Winkler titration [16]. Experimental light–
dark shifts for in situ measurements of oxygenic gross
photosynthesis [17] were performed with a custom-made, light-impermeable box, which was deployed by
avoiding physical contact with the sensor and thus dis-
turbance of microsensor readings.
2.4. Spectral scalar irradiance measurements with fiber-
optic microprobes
Mat samples were collected in February 2001 forspectral scalar irradiance measurements under control-
led conditions in a laboratory. Due to the time difference

A. Fourcans et al. / FEMS Microbiology Ecology 51 (2004) 55–70 57
between the sampling times (May 2000 for all other
analyses), some seasonal changes in the small-scale ver-
tical location of the different photosynthetic microor-
ganisms in the mat cannot be excluded, despite a
similar macroscopic appearance of the mat at both
times. For spectral light measurements, a fiber-optic sca-lar irradiance microprobe [18], was connected to a sensi-
tive fiber-optic diode array spectrometer with a spectral
range of 250–950 nm (PMA-11, Hamamatsu Photonics,
Toyooku, Japan). Profiles of spectral scalar irradiance
were measured in the mat by stepwise inserting the
microprobe with a motor-driven micromanipulator
(Marzhauser, Eugene, USA) at a zenith angle of 140�relative to the incident light beam. The downwellingspectral scalar irradiance at the mat surface was meas-
ured by positioning the scalar irradiance microprobe
over a black light trap at the same position relative to
the incident light as the mat surface. Scalar irradiance
spectra in the mat were normalized to the downwelling
spectral scalar irradiance at the mat surface. Attenua-
tion spectra of scalar irradiance were calculated over dis-
crete depth intervals from the scalar irradiance profilesaccording to Kuhl and Fenchel [19].
2.5. Analysis of fatty acids, hydrocarbons, alcohols and
alkenones
The microbial mat samples were extracted after
homogenization with methanol, dichloromethane and
n-hexane. Fatty acids were separated from the extractsafter saponification. Afterwards the neutral lipids were
fractionated by column chromatography with silica
and alumina into different compound classes. Hydrocar-
bons and polar fractions were analyzed by gas chroma-
tography (GC) and gas chromatography mass
spectrometry (GC-MS) after derivatisation. The meth-
odology was described in detail recently by Wieland
et al. [4].
2.6. Confocal laser scanning microscopy
The mat samples were analyzed with a microscope
(Olympus BH2, Tokyo, Japan) and a confocal laser-
scanning microscope (Leica TCS 4d, Heidelberg,
Germany) equipped with an argon–krypton laser. For
confocal analysis, slices of defined dimensions wereplaced on cavity slides, sealed with cover slips and ob-
served under an excitation beam of 568 nm. Pigment flu-
orescence emission was detected with a 590 nm long pass
filter. Different 512 · 512 pixel confocal images in two
(optical sections) and three-dimensions (sum of projec-
tions and stereoscopic images) were obtained from these
samples. The cyanobacteria were identified using differ-
ent morphological criteria according to Castenholz [20],i.e. diameter (lm), cell division patterns, and the pres-
ence or absence of a sheath for unicellular morphotypes.
Presence of septation and gas vacuoles was also consid-
ered for filamentous cyanobacteria. In addition, the
abundance of each cyanobacterial genera was deter-
mined by counting the different morphotypes obtained
from CLSM images. A total of 663 filamentous and
237 unicellular cyanobacteria were analyzed.
2.7. DGGE analysis
Genomic DNA was extracted from the mat samples
using the UltraClean Soil DNA Isolation Kit (Mobio
Laboratories, Carlsbad, USA) according to manufac-
turer�s instructions. Serial dilutions of genomic DNA
(up to 10�4) were made in sterile water and stored at�20 �C. To specifically amplify the 16S rRNA gene frag-
ments of oxygenic phototrophs, 1 or 2 ll of the DNA
dilutions were used as templates in 50 or 100 ll PCRreactions using primer pair CYA359F + GC/CYA781R
and PCR conditions as described by Nubel et al. [21].
The two different reverse primers CYA781RA and CY-
A781RC were added in separate PCR reactions. DGGE
was performed according to Schafer and Muyzer [22]with conditions optimized for the oxygenic phototroph
specific PCR fragments [21], on 1 mm thick 6% acryla-
mide/bisacrylamide gels with urea-formamide (UF) gra-
dient of 20–80%. On top of the gradient gel, an
acrylamide gel without UF was cast to obtain loading
slots. Gels were run in TAE (40 mM Tris-acetate pH
8.5, 1 mM EDTA) buffer for 3.5 h at 200 V and at a con-
stant temperature of 60 �C. Subsequently, the gels werestained in an ethidium bromide solution (0.5 lgml�1)
and inspected under UV illumination using a Fluor-S
Multi Imager (Bio-Rad, Hercules, USA). Contrast and
brightness of the photographs were optimized using
Adobe PhotoShop software (Adobe, San Jose, USA).
DNA fragments separated by DGGE were excised from
the gel [23], re-amplified, purified using the Qiaquick gel
extraction kit (Qiagen, Hilden, Germany), and then se-quenced. Purified bands were sequenced in two direc-
tions using the BigDye Terminator cycle sequencing
kit (Applied Biosystem, Foster City, USA) on an ABI
PRISM 310 genetic analyzer (Applied Biosystem). Close
relatives to consensus sequences were searched in the
GenBank Database maintained by the NCBI using
BLAST search [24]. Subsequently, new sequences and
their closest relatives were added to the ARB database[25] and aligned using the automatic alignment tool.
Alignments were then checked and corrected manually
taking the alignments of oxygenic phototrophs that were
already in the ARB database as templates. Phylogenetic
analysis was performed in ARB using several different
algorithms (e.g., maximum parsimony, neighbour-join-
ing, maximum likelihood) to check the consistency of
the tree structure. All three methods gave similar topol-ogy. Neighbour joining was used to draw the phylo-
genetic tree. The GenBank accession numbers of each
58 A. Fourcans et al. / FEMS Microbiology Ecology 51 (2004) 55–70
partial 16S rRNA gene clone (SdG1 to SdG7) are
AY393850 to AY393856.
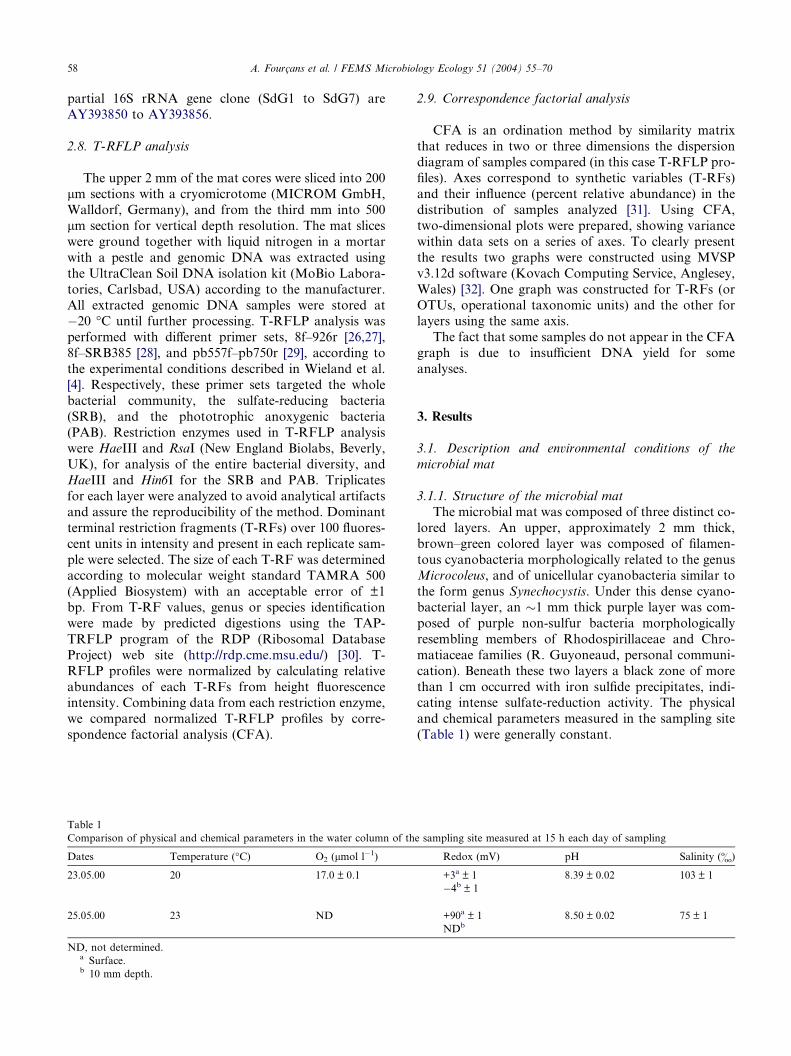
2.8. T-RFLP analysis
The upper 2 mm of the mat cores were sliced into 200lm sections with a cryomicrotome (MICROM GmbH,
Walldorf, Germany), and from the third mm into 500
lm section for vertical depth resolution. The mat slices
were ground together with liquid nitrogen in a mortar
with a pestle and genomic DNA was extracted using
the UltraClean Soil DNA isolation kit (MoBio Labora-
tories, Carlsbad, USA) according to the manufacturer.
All extracted genomic DNA samples were stored at�20 �C until further processing. T-RFLP analysis was
performed with different primer sets, 8f–926r [26,27],
8f–SRB385 [28], and pb557f–pb750r [29], according to
the experimental conditions described in Wieland et al.
[4]. Respectively, these primer sets targeted the whole
bacterial community, the sulfate-reducing bacteria
(SRB), and the phototrophic anoxygenic bacteria
(PAB). Restriction enzymes used in T-RFLP analysiswere HaeIII and RsaI (New England Biolabs, Beverly,
UK), for analysis of the entire bacterial diversity, and
HaeIII and Hin6I for the SRB and PAB. Triplicates
for each layer were analyzed to avoid analytical artifacts
and assure the reproducibility of the method. Dominant
terminal restriction fragments (T-RFs) over 100 fluores-
cent units in intensity and present in each replicate sam-
ple were selected. The size of each T-RF was determinedaccording to molecular weight standard TAMRA 500
(Applied Biosystem) with an acceptable error of ±1
bp. From T-RF values, genus or species identification
were made by predicted digestions using the TAP-
TRFLP program of the RDP (Ribosomal Database
Project) web site (http://rdp.cme.msu.edu/) [30]. T-
RFLP profiles were normalized by calculating relative
abundances of each T-RFs from height fluorescenceintensity. Combining data from each restriction enzyme,
we compared normalized T-RFLP profiles by corre-
spondence factorial analysis (CFA).
Table 1
Comparison of physical and chemical parameters in the water column of th
Dates Temperature (�C) O2 (lmol l�1)
23.05.00 20 17.0 ± 0.1
25.05.00 23 ND
ND, not determined.a Surface.b 10 mm depth.
2.9. Correspondence factorial analysis
CFA is an ordination method by similarity matrix
that reduces in two or three dimensions the dispersion
diagram of samples compared (in this case T-RFLP pro-
files). Axes correspond to synthetic variables (T-RFs)and their influence (percent relative abundance) in the
distribution of samples analyzed [31]. Using CFA,
two-dimensional plots were prepared, showing variance
within data sets on a series of axes. To clearly present
the results two graphs were constructed using MVSP
v3.12d software (Kovach Computing Service, Anglesey,
Wales) [32]. One graph was constructed for T-RFs (or
OTUs, operational taxonomic units) and the other forlayers using the same axis.
The fact that some samples do not appear in the CFA
graph is due to insufficient DNA yield for some
analyses.
3. Results
3.1. Description and environmental conditions of the
microbial mat
3.1.1. Structure of the microbial mat
The microbial mat was composed of three distinct co-
lored layers. An upper, approximately 2 mm thick,
brown–green colored layer was composed of filamen-
tous cyanobacteria morphologically related to the genusMicrocoleus, and of unicellular cyanobacteria similar to
the form genus Synechocystis. Under this dense cyano-
bacterial layer, an �1 mm thick purple layer was com-
posed of purple non-sulfur bacteria morphologically
resembling members of Rhodospirillaceae and Chro-
matiaceae families (R. Guyoneaud, personal communi-
cation). Beneath these two layers a black zone of more
than 1 cm occurred with iron sulfide precipitates, indi-cating intense sulfate-reduction activity. The physical
and chemical parameters measured in the sampling site
(Table 1) were generally constant.
e sampling site measured at 15 h each day of sampling
Redox (mV) pH Salinity (&)
+3a ± 1 8.39 ± 0.02 103 ± 1
�4b ± 1
+90a ± 1 8.50 ± 0.02 75 ± 1
NDb

400 500 600 700 800 9000
2
4
6
8
Atte
nuat
ion
coef
fici
ent,
K0
(mm
-1)
Wavelength (mm)
1
10
100
BChl c
Phycocyanin
Chl a
BChl a
0
0.2
0.4
0.5
0.6
0.7
0.8
Scal
arir
radi
ance
(%of
inci
dent
irra
dian
ce)
Fig. 2. Depth profiles of spectral scalar irradiance in the Camargue
A. Fourcans et al. / FEMS Microbiology Ecology 51 (2004) 55–70 59
3.1.2. Depth profiles of O2, gross photosynthesis, and
spectral scalar irradiance
High O2 consumption in the mat led to a low O2 con-
centration and O2 penetration in situ during the night
(5:32 h, 17 �C, 94& (v/w)), confining the oxic zone to
the top 0.2 mm of the mat (Fig. 1). In the afternoon(15:50 h, 30 �C, 100& (v/w)), high rates of oxygenic
photosynthesis led to a strong increase in O2 concentra-
tion both in the overlying water and within the mat. The
O2 penetration depth in the mat increased to 2 mm.
Gross oxygenic photosynthesis was measurable in the
top 0.6 mm of the mat with a peak in photosynthetic
activity at 0.3–0.6 mm depth. An important photosyn-
thetic activity at 0.3–0.6 mm depth indicated the pres-ence and/or activities of oxygenic phototrophs in the
upper mat layers.
From measured spectral scalar irradiance profiles,
distinct spectral regions of pronounced absorption could
be ascribed to the presence of different pigments (Fig. 2,
upper graph). The presence of cyanobacteria led to pro-
nounced scalar irradiance minima at around 630 and
680 nm, corresponding to phycocyanin and chlorophylla (Chl a) absorption, respectively. The scalar irradiance
minima in the region between 800 and 900 nm corre-
sponds to bacteriochlorophyll a (Bchl a) absorption,
indicating the presence of purple bacteria. A shoulder
at 740–750 nm indicated some absorption by Bchl c pre-
sent in green photosynthetic bacteria. In the spectral re-
gion of 400–550 nm, scalar irradiance was strongly
attenuated due to Chl a and carotenoid absorption.
2.0
1.5
1.0
0.5
0.0
-0.5
-1.0
0 300 600 900
Photosynthesis (nmol O2 cm-3 s-1)
O2 (5:32 h)O2 (15:50 h)
O2 concentration (µM)
Dep
th (
mm
)
0 5 10 15 20 25
Fig. 1. In situ depth profiles of O2 and gross photosynthesis (bars)
measured during the afternoon (15:50 h) and night (5:32 h) in mats
from a pre-concentration pond of the Salins-de-Giraud saltern.
mat normalized to the downwelling spectral scalar irradiance at the
mat surface (upper graph). Numbers indicate depth (mm). Average
attenuation spectrum of scalar irradiance over the depth interval of 0–
0.8 mm (lower graph), calculated from the profile shown in the upper
graph. Broken lines indicate the standard deviations of the attenuation
coefficients, K0.
Absorption by Chl a, phycocyanin, Bchl a, and Bchl c
occurred in all mat layers within the top 0.8 mm ofthe mat, indicating a homogeneous distribution of these
photosynthetic groups. However, the spectral scalar
irradiance in the wavelength regions of Chl a, phycocy-
anin and carotenoid absorption were more strongly
attenuated than wavelengths corresponding to Bchl a
and Bchl c absorption (Fig. 2, lower graph), indicating
as expected a dominance of cyanobacteria in the surface
layer of the mat.
3.2. Bacterial community composition in the top active
layers of the microbial mat
3.2.1. Bacterial community composition estimated by
biomarkers
Fatty acids were the major lipid compounds found
in the microbial mat. Their distribution essentiallyencompassed C14–C22 homologues, namely n-hexadec-
9(Z)-enoic, n-hexadecanoic, n-octadec-9(Z)-enoic,
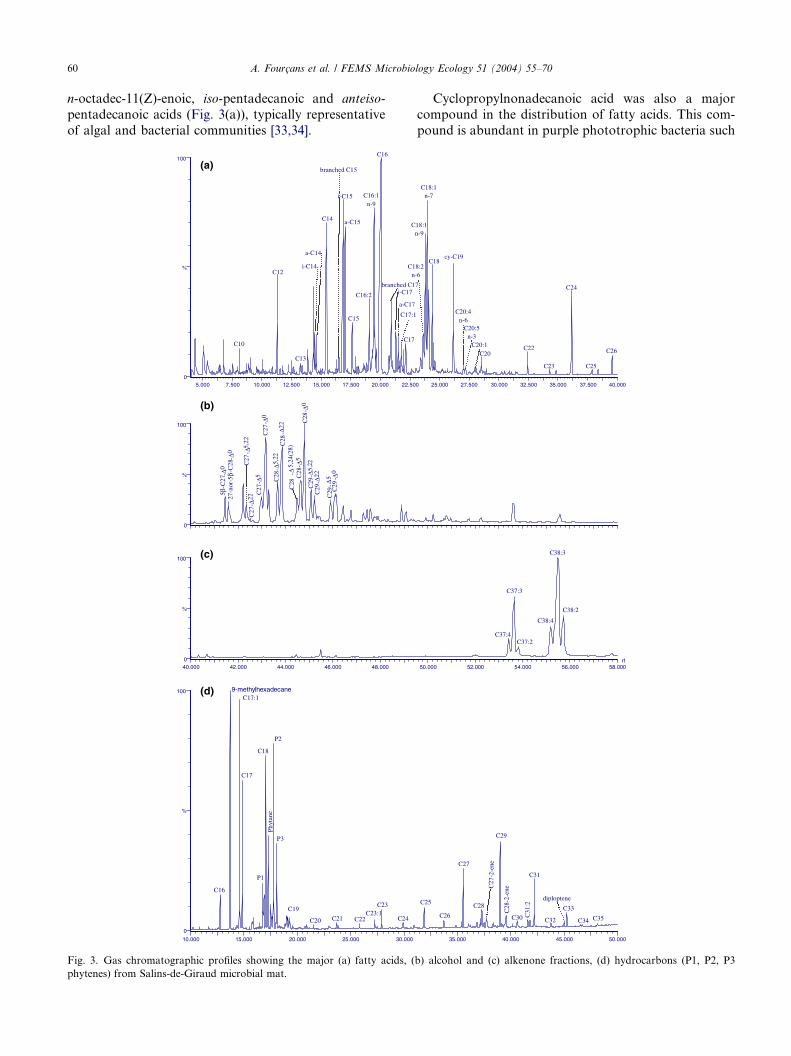
60 A. Fourcans et al. / FEMS Microbiology Ecology 51 (2004) 55–70
n-octadec-11(Z)-enoic, iso-pentadecanoic and anteiso-
pentadecanoic acids (Fig. 3(a)), typically representative
of algal and bacterial communities [33,34].
0
100
%
5.000 7.500 10.000 12.500 15.000 17.500 20.000 22.50
C10
C12
C13
C14
C15
a-C15
i-C15
C16:2
C16:1n-9
C16
i-C17
C17:1
C17
C1n
C
branched C15
a-C14
i-C14
a-C17
branched C1
40.000 42.000 44.000 46.000 48.0000
100
%
0
100
%
C27
- ∆0
C27
- ∆5
C27
- ∆22
C27
- ∆5,
22
C28
- ∆0
C29
- ∆0
C28
- ∆5
C29
-∆5C28
- ∆5,
22
C29
-∆5,
2 2
C28
-∆22
C29
-∆22
C28
-∆5,
24(2
8)
5β-C
27- ∆
027
-nor
-5β-
C28
- ∆0
10.000 15.000 20.000 25.000 30.000
0
100
%
C18
C17
C17:1
Phyt
ane
C19
C20 C21 C22
C23
C24
P1
P3
P2
C16
C23:1
9-methylhexadecane
(a)
(b)
(c)
(d)
Fig. 3. Gas chromatographic profiles showing the major (a) fatty acids, (
phytenes) from Salins-de-Giraud microbial mat.
Cyclopropylnonadecanoic acid was also a major
compound in the distribution of fatty acids. This com-
pound is abundant in purple phototrophic bacteria such
0 25.000 27.500 30.000 32.500 35.000 37.500 40.000
C18
C18:1n-7
8:2-6
18:1n-9
C20:4n-6
C20:5n-3
C20:1C20
C22
C24
C23 C25
C26
cy-C19
7
50.000 52.000 54.000 56.000 58.000rt
C37:4C37:2
C37:3
C38:3
C38:2
C38:4
35.000 40.000 45.000 50.000
C25
C26
C27
C28
C29
C30
C31
C32
C33
C34 C35
C27
-2-e
n e
C28
-2-e
ne
diploptene
C31
:2
b) alcohol and (c) alkenone fractions, (d) hydrocarbons (P1, P2, P3
A. Fourcans et al. / FEMS Microbiology Ecology 51 (2004) 55–70 61
as Rhodobacter and Ectothiorhodospira where it occurs
together with significant amounts of n-octadec-11(Z)-
enoic acid [35]. Iso- and anteiso-pentadecanoic acids
are abundant in SRB and sulfur-oxidizing bacteria such
as Thiomicrospira [35]. The high abundance of iso- and
anteiso-pentadecanoic acids, as well as of cyclopropyl-nonadecanoic and n-octadec-11(Z)-enoic acids likely re-
flects the dominance of two different populations
exchanging hydrogen sulfide, which could be sulfate-re-
ducing and purple phototrophic bacteria, respectively.
n-Heptadecane and n-heptadecenes were the main
hydrocarbons (Fig. 3(c)). These compounds are gener-
ally found in cyanobacteria [36,37] or in phototrophic
eukaryota [38]. Other hydrocarbons specific of cyano-bacterial inputs, such as 9-methylhexadecane, were also
found in major proportions, indicating the dominance
of cyanobacteria in this mat.
The sterol distribution of this mat showed minor pro-
portions of sterols having the unsaturated positions at
D5, D22 and D5,22 (Fig. 3(b)), which could originate from
cyanobacteria [37,39,40], Chlorophyta [41,42], or dia-
toms [42–44]. However, the common diatom marker24-methylcholesta-5,24(28)-dien-3b-ol [42–44] was only
found in minor proportion.
Phyt-1-ene, which occurred together with other phy-
tene homologues, also constituted one of the major
hydrocarbon groups (Fig. 3(d)). These hydrocarbons
are characteristic for methanogenic bacteria [45].
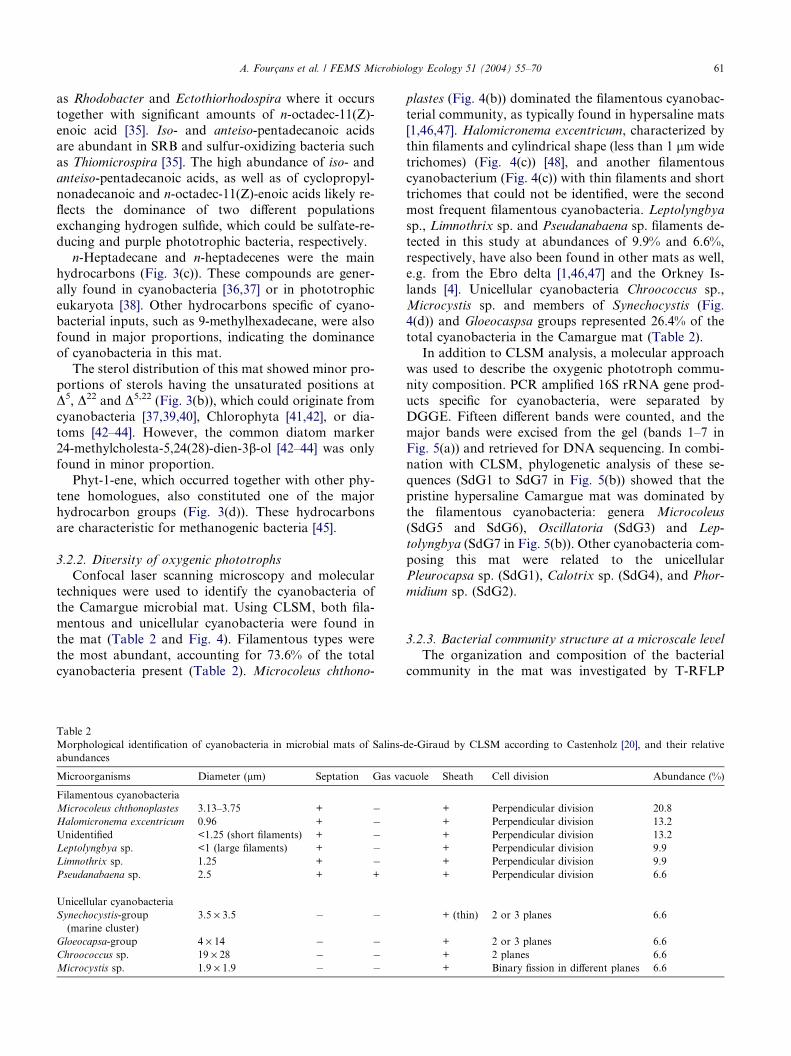
3.2.2. Diversity of oxygenic phototrophs
Confocal laser scanning microscopy and molecular
techniques were used to identify the cyanobacteria of
the Camargue microbial mat. Using CLSM, both fila-
mentous and unicellular cyanobacteria were found in
the mat (Table 2 and Fig. 4). Filamentous types were
the most abundant, accounting for 73.6% of the total
cyanobacteria present (Table 2). Microcoleus chthono-
Table 2
Morphological identification of cyanobacteria in microbial mats of Salins-
abundances
Microorganisms Diameter (lm) Septation Gas va
Filamentous cyanobacteria
Microcoleus chthonoplastes 3.13–3.75 + �Halomicronema excentricum 0.96 + �Unidentified <1.25 (short filaments) + �Leptolyngbya sp. <1 (large filaments) + �Limnothrix sp. 1.25 + �Pseudanabaena sp. 2.5 + +
Unicellular cyanobacteria
Synechocystis-group
(marine cluster)
3.5 · 3.5 � �
Gloeocapsa-group 4 · 14 � �Chroococcus sp. 19 · 28 � �Microcystis sp. 1.9 · 1.9 � �
plastes (Fig. 4(b)) dominated the filamentous cyanobac-
terial community, as typically found in hypersaline mats
[1,46,47]. Halomicronema excentricum, characterized by
thin filaments and cylindrical shape (less than 1 lm wide
trichomes) (Fig. 4(c)) [48], and another filamentous
cyanobacterium (Fig. 4(c)) with thin filaments and shorttrichomes that could not be identified, were the second
most frequent filamentous cyanobacteria. Leptolyngbya
sp., Limnothrix sp. and Pseudanabaena sp. filaments de-
tected in this study at abundances of 9.9% and 6.6%,
respectively, have also been found in other mats as well,
e.g. from the Ebro delta [1,46,47] and the Orkney Is-
lands [4]. Unicellular cyanobacteria Chroococcus sp.,
Microcystis sp. and members of Synechocystis (Fig.4(d)) and Gloeocaspsa groups represented 26.4% of the
total cyanobacteria in the Camargue mat (Table 2).
In addition to CLSM analysis, a molecular approach
was used to describe the oxygenic phototroph commu-
nity composition. PCR amplified 16S rRNA gene prod-
ucts specific for cyanobacteria, were separated by
DGGE. Fifteen different bands were counted, and the
major bands were excised from the gel (bands 1–7 inFig. 5(a)) and retrieved for DNA sequencing. In combi-
nation with CLSM, phylogenetic analysis of these se-
quences (SdG1 to SdG7 in Fig. 5(b)) showed that the
pristine hypersaline Camargue mat was dominated by
the filamentous cyanobacteria: genera Microcoleus
(SdG5 and SdG6), Oscillatoria (SdG3) and Lep-
tolyngbya (SdG7 in Fig. 5(b)). Other cyanobacteria com-
posing this mat were related to the unicellularPleurocapsa sp. (SdG1), Calotrix sp. (SdG4), and Phor-
midium sp. (SdG2).
3.2.3. Bacterial community structure at a microscale level
The organization and composition of the bacterial
community in the mat was investigated by T-RFLP
de-Giraud by CLSM according to Castenholz [20], and their relative
cuole Sheath Cell division Abundance (%)
+ Perpendicular division 20.8
+ Perpendicular division 13.2
+ Perpendicular division 13.2
+ Perpendicular division 9.9
+ Perpendicular division 9.9
+ Perpendicular division 6.6
+ (thin) 2 or 3 planes 6.6
+ 2 or 3 planes 6.6
+ 2 planes 6.6
+ Binary fission in different planes 6.6

Fig. 4. CLSM images in Salins-de-Giraud microbial mat. (a) Leptolyngbya sp., (b) Microcoleus chthonoplastes, (c) Halomicronema excentricum and
the unidentified filaments (indicated by arrow), (d) 1.Microcystis sp., 2. Synechocystis-group., 3. Chroococcus sp. (c) and (d) images are photographic
compositions. Scale bar = 10 lm.
62 A. Fourcans et al. / FEMS Microbiology Ecology 51 (2004) 55–70
using the eubacterial primer set 8f-926r [26,27], targeting
a partial sequence of the 16S rRNA gene. For each
microlayer within the top 3 mm of the mat, and of the
underlying layer, characteristic T-RFLP profiles(approximately 35 T-RFs with HaeIII digestion) were
obtained (data not shown). A CFA combining the data
from HaeIII and RsaI T-RFLP profiles revealed a par-
ticular distribution in three zones: a surface layer
(0–0.2 mm), a large mid layer (0.2–3 mm), and a deeper
region (underlying layer) (Fig. 6(a)). This distribution
was mostly explained by the first axis (27.8%) particu-
larly for the deep third millimeter. Plots of T-RFs inFig. 6(b) showed that T-RF 58 bp (RsaI), presumably
Desulfomicrobium baculatum, and T-RFs 205 and 244
pb (HaeIII), presumably members of the genera Desulfo-
bulbus and Streptomyces respectively, were dominant in
this deeper zone. In contrast, the structure of the surface
mat (0–0.2 mm) was explained by the second axis
(11.8%, Fig. 6(a)), which was influenced by T-RFs of
125 bp (RsaI digest), 200 and 297 bp (HaeIII digest)
(Fig. 6(b)). These T-RFs that match members of the
Neisseria, Chloroflexus andMycoplasma genera were
particularly present in this surface layer.
SRB were accessed by T-RFLP using the specific pri-mer pair 8f–385r [28], and two restriction enzymes
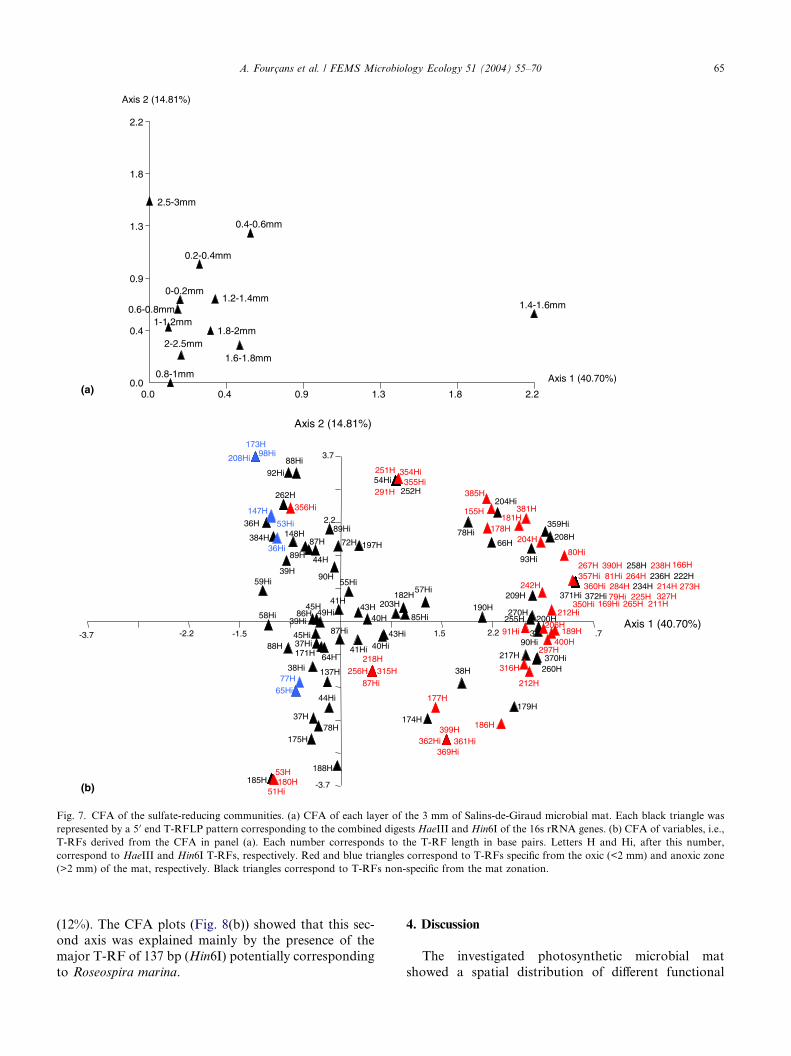
HaeIII and Hin6I. The CFA of this data set also showed
a specific distribution of the SRB. Particularly, two dis-
tinct SRB communities were characteristic of the deeper
layer (2.5–3 mm) and of the layer at 1.4–1.6 mm (Fig.
7(a)). This later layer seemed to be independent, since
the first axis (40.7%) alone explained the distinct struc-
ture of the mid layer. Fig. 7(b) shows that this mid layerwas characterized by many T-RFs. Among them, T-RFs
of 200 and 270 bp (HaeIII) that could be related to gen-
era Desulfovibrio and Desulfobacter, respectively, were
dominant. The composition of the third millimeter of
the mat was essentially explained by the second axis
(14.8%, Fig. 7(a)), which was influenced by many T-
RFs (Fig. 7(b)). Among them, T-RFs of 72 and 197
bp (HaeIII) and of 55 bp (Hin6I) were dominant. The
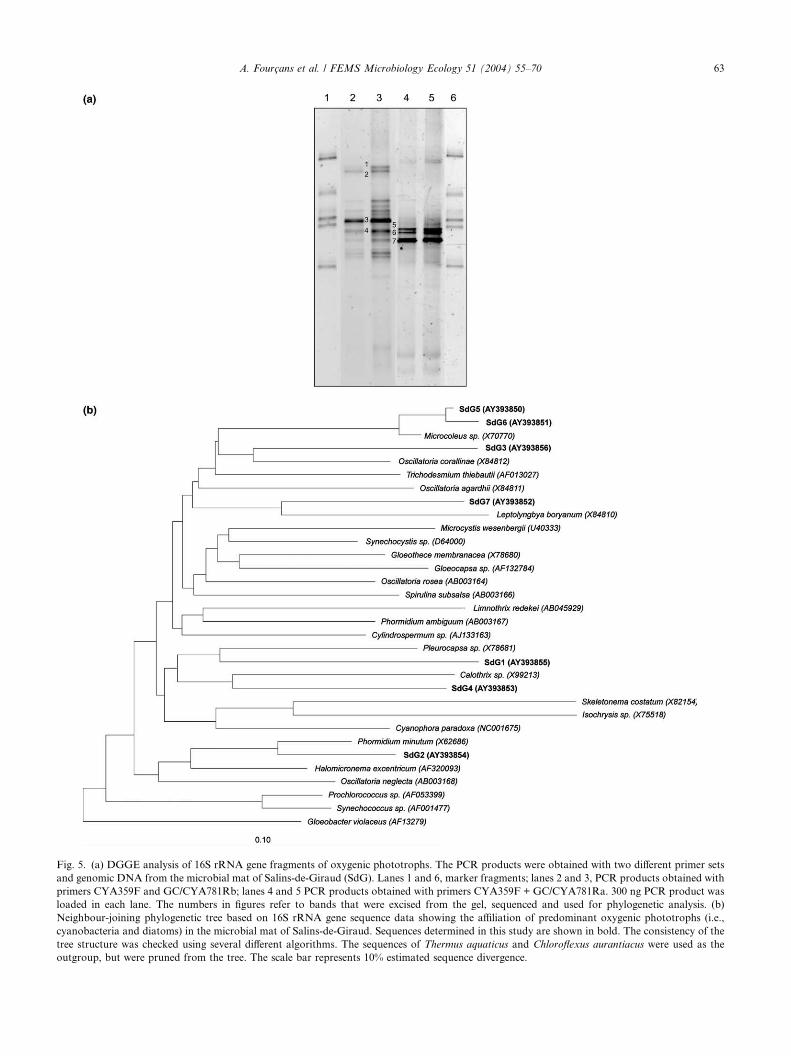
Fig. 5. (a) DGGE analysis of 16S rRNA gene fragments of oxygenic phototrophs. The PCR products were obtained with two different primer sets
and genomic DNA from the microbial mat of Salins-de-Giraud (SdG). Lanes 1 and 6, marker fragments; lanes 2 and 3, PCR products obtained with
primers CYA359F and GC/CYA781Rb; lanes 4 and 5 PCR products obtained with primers CYA359F + GC/CYA781Ra. 300 ng PCR product was
loaded in each lane. The numbers in figures refer to bands that were excised from the gel, sequenced and used for phylogenetic analysis. (b)
Neighbour-joining phylogenetic tree based on 16S rRNA gene sequence data showing the affiliation of predominant oxygenic phototrophs (i.e.,
cyanobacteria and diatoms) in the microbial mat of Salins-de-Giraud. Sequences determined in this study are shown in bold. The consistency of the
tree structure was checked using several different algorithms. The sequences of Thermus aquaticus and Chloroflexus aurantiacus were used as the
outgroup, but were pruned from the tree. The scale bar represents 10% estimated sequence divergence.
A. Fourcans et al. / FEMS Microbiology Ecology 51 (2004) 55–70 63

-2.02
Axis 2 (11.86 %)
Axis 2 (11.86 %)
Axis 1 (27.78%)
36H
39H
40H
50R
57R
58H
58R
59H
59R
60R
62H
67H
102H103H
122R
125R
179H
182H
184H185H
188H
191H
192H
193H
200H
205H
226H
238H
242H
244H
248H
257H
271H287R
290H
293H
297H
321H
373H390H
420R
492R
-1.01
-2.02
1.01
2.02
3.02
4.03
5.04
-1.01 1 .01 2.02 3.02 4.03 5.04
Axis 1 (27.78%)
0.0 0.8 1.7 2.5 3.3 4.2
2.5
3.3
4.2
1.7
0.8
0-0.2mm
0.2-0.4mm
0.4-0.6mm
0.6-0.8mm
0.8-1mm
1-1.2mm1.4-1.6mm
1.6-1.8mm
1.8-2mm
2-2.5mm2 .5-3mm >3mm
0.0(a)
(b)
Fig. 6. CFA of the whole bacterial communities. (a) CFA of each layer of the 3 mm of Salins-de-Giraud microbial mat. Each black triangle was
represented by a 5 0 end T-RFLP pattern corresponding to the combined digestsHaeIII and RsaI of the 16s rRNA genes. (b) CFA of variables, i.e., T-
RFs derived from the CFA in panel (a). Each number corresponds to the T-RF length in base pairs. Letters H and R, after this number, correspond
to HaeIII and RsaI T-RFs, respectively. Red and blue triangles correspond to T-RFs specific from the oxic (<2 mm) and anoxic zone (>2 mm) of the
mat, respectively. Black triangles correspond to T-RFs non-specific from the mat zonation.
64 A. Fourcans et al. / FEMS Microbiology Ecology 51 (2004) 55–70
T-RF of 72 bp may possibly represent some Desulfovib-
rio communities.
In addition to SRB communities, the PAB were also
investigated in the same layers. Their presence in the mat
was detected with the primer pair pb557f–pb750r [29],targeting the pufM gene, which encodes a subunit of
the photosynthetic center of purple sulfur and non-sul-
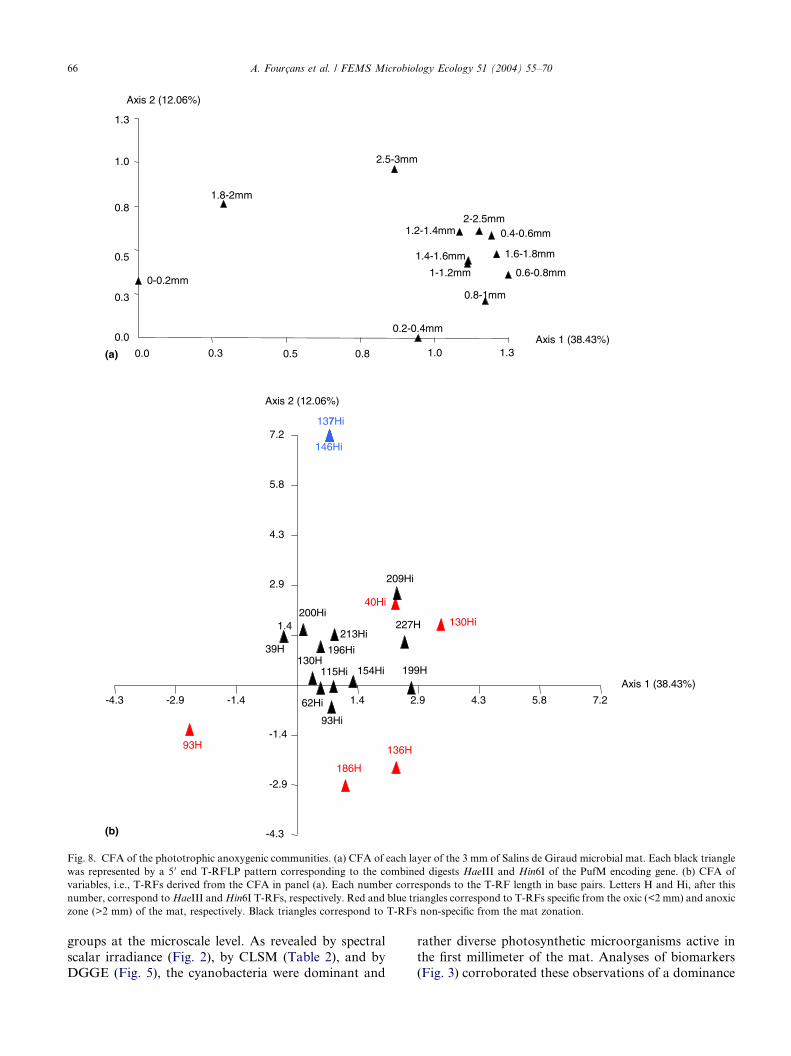
fur bacteria. CFA on T-RFLP patterns of these PAB
communities revealed their organization in five layers
through the top 3 mm of the mat (Fig. 8(a)). The distri-
bution of the layers from 0.2 to 0.4 mm and from 0.4 to
1.8 mm was explained by the first axis (38.4%) corre-
sponding to T-RF (199 pb, HaeIII) possibly related toHalochromatium salexigens (Fig. 8(b)). The three other
layers, from 0 to 0.2 mm, from 1.8 to 2 mm, and from
2.5 to 3 mm, were mostly influenced by the second axis
Axis 2 (14.81%)
Axis 1 (40.70%)
0-0.2mm
0.2-0.4mm
0.4-0.6mm
0.6-0.8mm
0.8-1mm
1-1.2mm
1.2-1.4mm1.4-1.6mm
1.6-1.8mm
1.8-2mm2-2.5mm
2.5-3mm
0.0
0.4
0.9
1.3
1.8
2.2
0.0 0.4 0.9 1.3 1.8 2.2
Axis 2 (14.81%)
Axis 1 (40.70%)
36H
37H
38H
39H
40H
41H43H
44H
45H
53H
64H
66H72H
77H
86H
87H
88H
89H
90H
137H
147H
148H
155H
166H
171H
173H
174H
175H
177H
178H
179H
180H
181H
182H
185H
186H
188H
189H
190H
197H
200H
203H
204H
206H
208H
209H211H
212H
214H
217H218H
222H
225H234H
236H238H
242H
251H
252H
255H
256H
258H
260H
262H
264H
265H
267H
270H
273H284H
291H
297H
315H 316H
327H
381H
384H
385H
390H
399H
400H
36Hi
37Hi
38Hi
39Hi
40Hi41Hi
43Hi45Hi
44Hi
49Hi
51Hi
53Hi
54Hi
55Hi57Hi
58Hi
59Hi
65Hi
78Hi
79Hi
80Hi
81Hi
85Hi
87Hi
87Hi
88Hi
89Hi
90Hi91Hi
92Hi
93Hi
98Hi
169Hi
204Hi
208Hi
212Hi350Hi
354Hi355Hi
356Hi
357Hi
359Hi
360Hi
361Hi362Hi369Hi
370Hi
371Hi 372Hi
-3.7
2.2
3.7
-2.2-3.7 1.5 3 .7
78H
2.2-1.5
(a)
(b)
Fig. 7. CFA of the sulfate-reducing communities. (a) CFA of each layer of the 3 mm of Salins-de-Giraud microbial mat. Each black triangle was
represented by a 5 0 end T-RFLP pattern corresponding to the combined digests HaeIII and Hin6I of the 16s rRNA genes. (b) CFA of variables, i.e.,
T-RFs derived from the CFA in panel (a). Each number corresponds to the T-RF length in base pairs. Letters H and Hi, after this number,
correspond to HaeIII and Hin6I T-RFs, respectively. Red and blue triangles correspond to T-RFs specific from the oxic (<2 mm) and anoxic zone
(>2 mm) of the mat, respectively. Black triangles correspond to T-RFs non-specific from the mat zonation.
A. Fourcans et al. / FEMS Microbiology Ecology 51 (2004) 55–70 65
(12%). The CFA plots (Fig. 8(b)) showed that this sec-ond axis was explained mainly by the presence of the
major T-RF of 137 bp (Hin6I) potentially corresponding
to Roseospira marina.
4. Discussion
The investigated photosynthetic microbial mat
showed a spatial distribution of different functional
Axis 2 (12.06%)
Axis 1 (38.43%)
0-0.2mm
0.2-0.4mm
0.4-0.6mm
0.6-0.8mm
0.8-1mm
1-1.2mm
1.2-1.4mm
1.4-1.6mm 1.6-1.8mm
1.8-2mm
2-2.5mm
2.5-3mm
0.0
0.3
0.5
0.8
1.0
1.3
0.0 0.3 0.5 0.8 1.0 1.3
Axis 1 (38.43%)
-4.3
Axis 2 (12.06%)
39H
93H
130H
136H
186H
199H
227H
40Hi
62Hi
93Hi
115Hi
130Hi
137Hi
146Hi
154Hi
196Hi
200Hi
209Hi
213Hi
-1.4
-2.9
1.4
2.9
4.3
5.8
7.2
-1.4-2.9-4.3 1.4 2.9 4.3 5.8 7.2
(a)
(b)
Fig. 8. CFA of the phototrophic anoxygenic communities. (a) CFA of each layer of the 3 mm of Salins de Giraud microbial mat. Each black triangle
was represented by a 5 0 end T-RFLP pattern corresponding to the combined digests HaeIII and Hin6I of the PufM encoding gene. (b) CFA of
variables, i.e., T-RFs derived from the CFA in panel (a). Each number corresponds to the T-RF length in base pairs. Letters H and Hi, after this
number, correspond toHaeIII andHin6I T-RFs, respectively. Red and blue triangles correspond to T-RFs specific from the oxic (<2 mm) and anoxic
zone (>2 mm) of the mat, respectively. Black triangles correspond to T-RFs non-specific from the mat zonation.
66 A. Fourcans et al. / FEMS Microbiology Ecology 51 (2004) 55–70
groups at the microscale level. As revealed by spectral
scalar irradiance (Fig. 2), by CLSM (Table 2), and byDGGE (Fig. 5), the cyanobacteria were dominant and
rather diverse photosynthetic microorganisms active in
the first millimeter of the mat. Analyses of biomarkers(Fig. 3) corroborated these observations of a dominance

A. Fourcans et al. / FEMS Microbiology Ecology 51 (2004) 55–70 67
of oxygenic phototrophs, since major fatty acids (n-oct-
adec-9(Z)-enoic acid), alcohols (5a(H)-stanols), and
hydrocarbons (n-heptadecane, n-heptadecenes, and 9-
methylhexadecane) found in this mat corresponded to
cyanobacteria [49].
Identification of oxygenic phototrophs down to thegenus or even species level was done by confocal laser
scanning microscopy and sequencing analysis (PCR-
DGGE-sequencing). Two dominant filamentous cyano-
bacteria Microcoleus sp. and Leptolyngbya sp. were
identified by both techniques. Other oxygenic photo-
trophs were either identified by CLSM (Halomicronema,
Limnothrix, Pseudanabaena, Synechocystis – group, Glo-
eocapsa – group, Chroococcus, and Microcystis) or bysequencing analysis (Phormidium, Calotrix, Pleurocapsa,
Oscillatoria). Thus, the combination of both CLSM and
DGGE was useful to fully describe the oxygenic photo-
trophic communities.
As described previously, bacterial biodiversity de-
pends on gradient salinity, with a decreasing bacterial
diversity when salinity increases [50–52]. However, in
this investigated halophilic microbial mat, the diversityof oxygenic phototrophs is moderate in comparison to
those previously described [53] with the dominance of
M. chthonoplastes a typical inhabitant of halophilic
microbial mat [54–56]. At higher salinities, other cyano-
bacterial morphotypes, like Phormidium, could be
dominant [5].
Within the mat, analysis of biomarkers revealed the
presence of purple bacteria like Rhodobacter andEctothiorhodospira, and also of SRB. Iso- and anteiso-
pentadecanoic acids are abundant in SRB and sulfur-
oxidizing bacteria such as Thiomicrospira [35].
Cyclopropylnonadecanoic acid was also a major com-
pound in the distribution of fatty acids. This compound
is abundant in purple phototrophic bacteria such as
Rhodobacter and Ectothiorhodospira where it occurs to-
gether with significant amounts of n-octadec-11(Z)-enoic acid [35]. The ratio between these two acids (0.5)
could be related to the growth status of the microbial
mat, with a high relative proportion of the cyclopropyl
acid being indicative of stationary growth [57]. The high
abundance of iso- and anteiso-pentadecanoic acids, as
well as of cyclopropylnonadecanoic and n-octadec-
11(Z)-enoic acids likely reflects the dominance of two
different populations exchanging hydrogen sulfide,which could be sulfate-reducing and purple photo-
trophic bacteria, respectively. By the use of specific
primer sets, T-RFLP allowed us to distinguish photo-
synthetic anoxygenic bacteria (PAB) and SRB organ-
ized in five and three distinct bacterial groups
among the first 3 mm of this mat, respectively (Figs. 7
and 8).
Measurements of the spectral scalar irradiance re-vealed the presence of purple bacteria in the surface
layer of the mat, especially in the zone at 0.5–0.8 mm
depth (Fig. 2). This confirms the observation with T-
RFLP, showing the presence of distinct populations at
0.4–1.8 mm. In contrast, only few PAB were observed
in the upper layer (0–0.4 mm) (Fig. 8(a)). Therefore,
the PAB developing at greater depths in the mat could
be adapted to lower light intensities, as compared tothe PAB community of the surface layer, since light is
strongly attenuated in the mat (Fig. 2). Moreover, oxy-
gen could also play a role in the stratification of the
PAB, discriminating populations of different tolerance
to the presence of oxygen, especially in the surface layer
of the mat with high oxygen concentrations (Fig. 1).
We could demonstrate the presence of Desulfobacter-
like and Desulfovibrio-like SRB, in the mid layer of themat, corresponding to the fluctuating oxic and anoxic
zone during the diel cycle (Fig. 1). Many Desulfovibrio
species were isolated from the oxic zone of microbial
mats, and were found to be able to tolerate and consume
oxygen [58,59]. An oxygen tolerant SRB community
that could not be correlated by T-RFLP to any known
SRB inhabited the 1.6 mm top layer that is completely
oxic during the day. Previous molecular studies have de-scribed the presence of Desulfonema-like species in the
oxic surface layer of several microbial mats [60,61]. They
were found to be metabolically versatile with a high
affinity to oxygen. In the deeper 3 mm layer, our study
showed that one SRB population was specific to the an-
oxic layer, indicating probably a high sensitivity to oxy-
gen. Thus, T-RFLP analysis illustrated a vertical
stratification of the SRB within the top 3 mm layers ofthe mat, that could be explained by their behavioral re-
sponses to oxygen including aggregation, migration to
anoxic zones, and aerotaxis [58].
The microscale zonation of these populations is
partly controlled by the microgradients of oxygen, sul-
fide and light. In the investigated mat, no free sulfide
was measurable with microsensors (Fig. 2), but iron sul-
fide precipitates, and measurements of sulfate reductionrates (SRR) (Rod Herbert, unpublished results) indi-
cated high bacterial sulfate reduction activity and subse-
quent precipitation of the produced sulfide by iron.
Investigation of the biogeochemistry of the mat in year
2001 confirmed that this Camargue mat is characterized
by high sulfate reduction rates and a high iron and FeS
content [62]. Additionally, in this mat Chloroflexus-like
bacteria, detected by T-RFLP, were found as importantmembers in the surface layer community (Fig. 6). Their
presence was also indicated by the BChl c absorption de-
tected in the top layer of the mat (Fig. 2). These micro-
organisms could play an important role in hypersaline
and iron-rich microbial mats [63].
Biomarkers also evidenced organic matter contribu-
tions to these microbial mats from other origins. Thus,
C37–C38 di-, tri- and tetra-unsaturated alkenones (Fig.3(b)) are specific of Hapthophyceae [64,65]. However,
their occurrence cannot be attributed to species typically

68 A. Fourcans et al. / FEMS Microbiology Ecology 51 (2004) 55–70
found in pelagic environments and are probably related
to unknown species. Moreover, a distribution of C23–
C35 n-alkanes predominated by the odd carbon num-
bered homologues, namely C29, C31 and C33, was found.
This distribution is representative of inputs from higher
plants [66] and is currently found in microbial sedimentsfrom coastal environments [67]. The allochthonous ori-
gin of these n-alkanes is clear based on their biosynthetic
origin. The absence of higher plants nearby hypersaline
systems suggest that their presence in microbial mat sys-
tems such as the one in Camargue may reflect the influ-
ence of wind transported remains from nearby higher
plants, as already observed in other hypersaline areas
[67]. Further evidence of the external origin of theseC23–C35 n-alkanes has been obtained in other coastal
Mediterranean systems from comparison of the d13 C
isotopic composition of these n-alkanes and in situ gen-
erated microbial mat lipids. Whereas the former exhibit
the typical values of higher plant compounds, e.g.
<�20&, the latter reflect the intense use of CO2 as con-
sequence of the high productivity and therefore the d13
C isotopic values are much heavier, >�20& [68].
5. Conclusions
The results presented here demonstrated a clear strat-
ification of the main photosynthetic and sulfur bacterial
populations in distinct and specific vertical microlayers
according to their physiological characteristics. The firstactive millimeter of this photosynthetic microbial mat
was dominated by filamentous cyanobacteria such as
M. chtonoplastes. Beneath this cyanobacterial layer, sul-
fur oxidizing bacteria like Thiomicrospira were present.
Although diverse anoxygenic phototrophic bacteria
such as Rhodobacter and Ectothiorhodospira inhabited
this mat, H. salexigens and R. marina were dominant
in surface and deep zones, respectively. Sulfate reducingbacteria responsible of high sulfate reduction rates were
distributed within the depth profile. Desulfonema domi-
nated the oxic surface, Desulfobacter and Desulfovibrio
the mid oxic–anoxic layer while oxygen sensitive SRB
were located in the deeper zone. Others organisms such
as algae and diatoms contributed to the microbial mat
structure and development.
In man-made artificial salterns, where such a type ofmat develops, environmental conditions can change dra-
matically on a short term [62]. The structures of bacte-
rial communities in microbial mats have mainly been
described globally at the macroscale level. In contrast,
this study of the hypersaline Camargue microbial mat
represents the first exhaustive investigation, which
clearly shows the structure and the distribution of the
main bacterial communities at the microscale levelaccording to the microgradients of oxygen and light.
Acknowledgements
We acknowledge the financial support by the EC
(MATBIOPOL project, grant EVK3-CT-1999-00010).
The authors are grateful to the company of Salins-du-
midi at Salins-de-Giraud for facilitating access to thesalterns, sampling and field experiments. A.F. is partly
supported by a doctoral grant from the general council
of Atlantic Pyrenees. M.K. was supported by the Danish
Natural Science Research Council (contract no.
9700549). Anni Glud is gratefully acknowledged for
microsensor construction and assistance during the field
experiment.
References
[1] Esteve, I., Martınez, M., Mir, J. and Guerrero, R. (1992)
Typology and structure of microbial mats communities in Spain:
A preliminary study. Limnetica 8, 185–195.
[2] Mir, J., Martınez-Alonso, M., Esteve, I. and Guerrero, R. (1991)
Vertical stratification and microbial assemblage of a microbial
mat in the Ebro Delta (Spain). FEMS Microbiol. Ecol. 86, 59–
68.
[3] van Gemerden, H., Tughan, C.S., de Wit, R. and Herbert, R.A.
(1989) Laminated microbial ecosystems on sheltered beaches in
Scapa Flow, Orkney Islands. FEMS Microbiol. Lett. 62, 87–
101.
[4] Wieland, A., Kuhl, M., McGowan, L., Fourcans, A., Duran, R.,
Caumette, P., Garcia De Oteyza, T., Grimalt, J.O., Sole, A.,
Diestra, E., Esteve, I. and Herbert, R.A. (2003) Microbial mats on
the Orkney islands revisited: microenvironment and microbial
community composition. Microbial Ecol. 46, 371–390.
[5] Caumette, P., Matheron, R., Raymond, N. and Relexans, J.C.
(1994) Microbial mats in the hypersaline ponds of Mediterranean
salterns (Salins-de-Giraud, France). FEMS Microbiol. Ecol. 13,
273–286.
[6] Giani, D., Seeler, J., Giani, L. and Krumbein, W.E. (1989)
Microbial mats and physicochemistry in a saltern in the Bretagne
(France) and in a laboratory scale saltern model. FEMS Micro-
biol. Ecol. 62, 151–162.
[7] van Gemerden, H. (1993) Microbial mats: A joint venture. Marine
Geol. 113, 3–25.
[8] Revsbech, N.P., Jørgensen, B.B., Blackburn, T.H. and Cohen, Y.
(1983) Microelectrode studies of the photosynthesis and O2, H2S
and pH profiles of a microbial mat. Limnol. Oceanogr. 28, 1062–
1074.
[9] Moune, S., Caumette, P., Matheron, R. and Willison, J.C. (2003)
Molecular sequence analysis of prokaryotic diversity in the anoxic
sediments underlying cyanobacterial mats of two hypersaline
ponds in Mediterranean salterns. FEMSMicrobiol. Ecol. 44, 117–
130.
[10] Moune, S., Eatock, C., Matheron, R., Willison, J.C., Hirschler,
A., Herbert, R. and Caumette, P. (2000) Orenia salinaria sp. nov.,
a fermentative bacterium isolated from anaerobic sediments of
Mediterranean salterns. Int. J. Syst. Evol. Microbiol. 50 (Pt 2),
721–729.
[11] Moune, S., Manac�h, N., Hirschler, A., Caumette, P., Willison,
J.C. and Matheron, R. (1999) Haloanaerobacter salinarius sp.
nov., a novel halophilic fermentative bacterium that reduces
glycine-betaine to trimethylamine with hydrogen or serine as
electron donors; emendation of the genus Haloanaerobacter. Int.
J. Syst. Bacteriol. 49 (Pt 1), 103–112.

A. Fourcans et al. / FEMS Microbiology Ecology 51 (2004) 55–70 69
[12] Jørgensen, B.B. and Des Marais, D.J. (1988) Optical properties of
benthic photosynthetic communities: Fiber-optic studies of
cyanobacterial mats. Limnol. Oceanogr. 33, 99–113.
[13] Caumette, P., Baulaigue, R. and Matheron, R. (1988) Character-
ization of Chromatium salexigens sp. nov., a halophilic Chromat-
iaceae isolated from Mediterranean salinas. Syst. Appl.
Microbiol. 10, 284–292.
[14] Caumette, P., Baulaigue, R. and Matheron, R. (1991) Thiocapsa
halophila sp. nov., a new halophilic phototrophic purple sulfur
bacterium. Arch. Microbiol. 155, 170–176.
[15] Revsbech, N.P. (1989) An oxygen microelectrode with a guard
cathode. Limnol. Oceanogr. 34, 474–478.
[16] Grasshoff, K., Ehrhardt, M. and Kremling, K. (1983) Methods of
seawater analysis, Weinheim.
[17] Revsbech, N.P. and Jørgensen, B.B. (1983) Photosynthesis of
benthic microflora measured with high spatial resolution by the
oxygen microprofile method: Capabilities and limitations of the
method. Limnol. Oceanogr. 28, 749–756.
[18] Lassen, C., Ploug, H. and Jørgensen, B.B. (1992) A fibre-optic
scalar irradiance microsensor: application for spectral light
measurements in sediments. FEMS Microbiol. Ecol. 86, 247–254.
[19] Kuhl, M. and Fenchel, T. (2000) Bio-optical characteristics and
the vertical distribution of photosynthetic pigments and photo-
synthesis in an artificial cyanobacterial mat. Microbial Ecol. 40,
94–103.
[20] Castenholz, R.W. (2001) Phylum Bx. Cyanobacteria. Oxygenic
Photosynthetic Bacteria, 2nd ed., New York, pp. 473–599.
[21] Nubel, U., Garcia-Pichel, F. and Muyzer, G. (1997) PCR primers
to amplify 16S rRNA genes from cyanobacteria. Appl. Environ.
Microbiol. 63, 3327–3332.
[22] Schafer, H. and Muyzer, G. (2001) Denaturing Gradient Gel
Electrophoresis in Marine Microbial Ecology. pp. 425–468.
[23] Muyzer, G., Brinkhoff, T., Nubel, U., Santegoeds, C., Schafer, H.
and Wawer, C. (1998) Denaturing gradient gel electrophoresis
(DGGE) in microbial ecology. Kluwer, Dordrecht, 1–27.
[24] Wheeler, D.L., Church, D.M., Federhen, S., Lash, A.E., Madden,
T.L., Pontius, J.U., Schuler, G.D., Schriml, L.M., Sequeira, E.,
Tatusova, T.A. and Wagner, L. (2003) Database resources of the
National Center for Biotechnology. Nucl. Acids Res. 31, 28–33.
[25] Ludwig, W., Strunk, O., Westram, R., Richter, L., Meier, H.,
Yadhukumar, A., Buchner, A., Lai, T., Steppi, S., Jobb, G.,
Forster, W., Brettske, I., Gerber, S., Ginhart, A.W., Gross, O.,
Grumann, S., Hermann, S., Jost, R., Konig, A., Liss, T.,
Lussmann, R., May, M., Nonhoff, B., Reichel, B., Strehlow, R.,
Stamatakis, A., Stuckmann, N., Vilbig, A., Lenke, M., Ludwig,
T., Bode, A. and Schleifer, K.-H. (2004) ARB: a software
environment for sequence data. Nucl. Acids. Res. 32, 1363–1371.
[26] Lane, D.J. (1991) rRNA Sequencing. pp. 115–175.
[27] Weisburg, W.G., Barns, S.M., Pelletier, D.A. and Lane, D.J.
(1991) 16S ribosomal DNA amplification for phylogenetic study.
J. Bacteriol. 173, 697–703.
[28] Amann, R., Binder, B., Olson, R., Chisholm, S., Devereux, R.
and Stahl, D. (1990) Combination of 16S rRNA-targeted oligo-
nucleotide probes with flow cytometry for analyzing mixed
microbial populations. Appl. Environ. Microbiol. 56, 1919–1925.
[29] Achenbach, L.A., Carey, J. and Madigan, M.T. (2001) Photo-
synthetic and phylogenetic primers for detection of anoxygenic
phototrophs in natural environments. Appl. Environ. Microbiol.
67, 2922–2926.
[30] Maidak, B.L., Cole, J.R., Lilburn, T.G., Parker Jr., C.T.,
Saxman, P.R., Farris, R.J., Garrity, G.M., Olsen, G.J., Schmidt,
T.M. and Tiedje, J.M. (2001) The RDP-II (Ribosomal Database
Project). Nucl. Acids Res. 29, 173–174.
[31] Gauch, J.H.G. (1982) Multivariate Analysis in Community
Ecology, New York, p. 298.
[32] Kovach, W.L. (1999) MVSP – a Multivariate Statistical Package
for Windows, ver. 3.1., Wales UK.
[33] Grimalt, J.O. and Albaiges, J. (1990) Characterization of the
depositional environments of the Ebro Delta (western Mediter-
ranean) by the study of sedimentary lipid markers. Marine Geol.
95, 207–224.
[34] Volkman, J.K., Johns, R.B., Guillan, F.T., Perry, G.J. and Bavor,
H.J. (1980) Microbial lipids of an intertidal sediment-I. Fatty
acids and hydrocarbons. Geochim. Cosmochim. Acta 44, 1133–
1143.
[35] Grimalt, J.O., de Witt, R., Teixidor, P. and Albaiges, J. (1992)
Lipid biogeochemistry of Phormidium andMicrocoleus mats. Org.
Geochem. 19, 509–530.
[36] Han, J., McCarthy, E.D., Calvin, M. and Benn, M.H. (1968)
Hydrocarbon constituents of the blue-green algae Nostoc musco-
rum, Anacystis nudulans, Phormidium luridum and Chlorogloea
fritschii. J. Chem. Soc., 2785–2791.
[37] Paoletti, C., Pushparaj, B., Florenzano, G., Capella, P. and
Lercker, G. (1976) Unsaponifiable matter of green and blue-green
algal lipids as a factor of biochemical differentiation of their
biomasses: II. Terpenic alcohol and sterol fractions. Lipids 11,
266–271.
[38] Blumer, M., Guillard, R.R.L. and Chase, T. (1971) Hydrocarbons
of marine phytoplankton. Marine Biol. 8, 183–189.
[39] Nes, W.R. and McKean, M.L. (1977). Biogeochemistry of
Steroids and Other Isoprenoids, Baltimore, MD.
[40] Nishimura, M. (1977) Origin of stanols in young lacustrine
sediments. Nature 270, 711–712.
[41] Patterson, G.W. (1974) Sterols of some green algae. Comp.
Biochem. Physiol. B 47, 453–457.
[42] Ballantine, J.A., Lavis, A. and Morris, R.J. (1979) Sterols of the
phytoplankton – effects of illumination and growth stage.
Phytochemistry 18, 1459–1466.
[43] Orcutt, D.M. and Paterson, G.W. (1975) Sterol, fatty acid and
elemental composition of diatoms grown in chemically defined
media. Comp. Biochem. Physiol. B 50, 579–583.
[44] Kates, M., Tremblay, P., Anderson, R. and Volcani, B.E. (1978)
Identification of the free and conjugated sterol in a non-
photosynthetic diatom, Nitzschia alba as 24-methylene choles-
terol. Lipids 13, 34–41.
[45] Tornabene, T.G., Langworthy, T.A., Holzer, G. and Oro, J.
(1979) Squalenes, phytanes and other isoprenoids as major
neutral lipids of methanogenic and thermoacidophilic ‘‘archae-
bacteria’’. J. Mol. Evolut. 13, 73–83.
[46] Sole, A., Gaju, N. and Esteve, I. (2003) The biomass dynamics of
cyanobacteria in an annual cycle determined by confocal laser
scanning microscopy. Scanning 25, 1–7.
[47] Sole, A., Gaju, N., Guerrero, R. and Esteve, I. (1998) Confocal
laser scanning microscopy of Ebro Delta microbial mats. Microsc.
Anal. (Europ. Ed) 29, 13–15.
[48] Abed, R.M., Garcia-Pichel, F. and Hernandez-Marine, M. (2002)
Polyphasic characterization of benthic, moderately halophilic,
moderately thermophilic cyanobacteria with very thin trichomes
and the proposal of Halomicronema excentricum gen. nov., sp.
nov. Arch. Microbiol. 177, 361–370.
[49] Chuecas, L. and Riley, J.P. (1969) Component fatty acids of the
total lipids of some marine phytoplankton. J. Marine Biol. Assoc.
UK 49, 97–116.
[50] Benlloch, S., Lopez-Lopez, A., Casamayor, E.O., Ovreas, L.,
Goddard, V., Daae, F.L., Smerdon, G., Massana, R., Joint, I.,
Thingstad, F., Pedros-Alio, C. and Rodriguez-Valera, F. (2002)
Prokaryotic genetic diversity throughout the salinity gradient of a
coastal solar saltern. Environ. Microbiol. 4, 349–360.
[51] Casamayor, E.O., Massana, R., Benlloch, S., Ovreas, L., Diez, B.,
Goddard, V.J., Gasol, J.M., Joint, I., Rodrıguez-Valera, F. and
Pedros-Alio, C. (2002) Changes in archaeal, bacterial and
eukaryal assemblages along a salinity gradient by comparison of
genetic fingerprinting methods in a multipond solar saltern.
Environ. Microbiol. 4, 338–348.

70 A. Fourcans et al. / FEMS Microbiology Ecology 51 (2004) 55–70
[52] Nubel, U., Garcıa-Pichel, F. and Muyzer, G. (2000) The
halotolerance and phylogeny of cyanobacteria with tightly coiled
trichomes (Spirulina Turpin) and the description of Halospirulina
tapeticola gen. nov., sp. nov. Int. J. Syst. Evol. Microbiol. 50,
1265–1277.
[53] Nubel, U., Garcıa-Pichel, F. and Muyzer, G. (1997) PCR primers
to amplify 16S rRNA genes from cyanobacteria. Appl. Environ.
Microbiol. 63, 3327–3332.
[54] Karsten, U. (1996) Growth and organic osmolytes of geograph-
ically different isolates of Microcoleus chthonoplastes (cyanobac-
teria). from benthic microbial mats: Response to salinity change.
J. Phycol. 32, 501–506.
[55] Guerrero, R., Urmeneta, J. and Rampone, G. (1993) Distribution
of types of microbial mats at the Ebro Delta, Spain. Biosystems
31, 135–144.
[56] Jonkers, H.M., Ludwig, R., DeWit, R., Pringault, O., Muyzer,
G., Niemann, H., Finke, N. and De Beer, D. (2003) Structural
and functional analysis of a microbial mat ecosystem from a
unique permanent hypersaline inland lake: �La Salada de Chipr-
ana� (NE Spain). FEMS Microbiol. Ecol. 44, 175–189.
[57] Navarrete, A., Urmeneta, J. and Guerrero, R. (2001) Physiolog-
ical status and community composition of microbial mats by
signature lipid biomarkers. pp. 111–116.
[58] Cypionka, H. (2000) Oxygen respiration by Desulfovibrio species.
Ann. Rev. Microbiol. 54, 827–848.
[59] Cypionka, H., Widdel, F. and Pfennig, N. (1985) Survival of
sulfate-reducing bacteria after oxygen stress, and growth in sulfate-
free oxygen-sulfide gradients. FEMSMicrobiol. Lett. 31, 39–45.
[60] Minz, D., Fishbain, S., Green, S.J., Muyzer, G., Cohen, Y.,
Rittmann, B.E. and Stahl, D.A. (1999) Unexpected population
distribution in a microbial mat community: sulfate-reducing
bacteria localized to the highly oxic chemocline in contrast to a
eukaryotic preference for anoxia. Appl. Environ. Microbiol. 65,
4659–4665.
[61] Minz, D., Flax, J.L., Green, S.J., Muyzer, G., Cohen, Y., Wagner,
M., Rittmann, B.E. and Stahl, D.A. (1999) Diversity of sulfate-
reducing bacteria in oxic and anoxic regions of a microbial mat
characterized by comparative analysis of dissimilatory sulfite
reductase genes. Appl. Environ. Microbiol. 65, 4666–4671.
[62] Wieland, A., Zopfi, J., Benthien, M. and Kuhl, M. (2004)
Biogeochemistry of an iron-rich hypersaline microbial mat
(Camargue, France). Microbial Ecology, in press.
[63] Pierson, B.K. and Parenteau, M.N. (2000) Phototrophs in high
iron microbial mats: microstructure of mats in iron-depositing hot
springs. FEMS Microbiol. Ecol. 32, 181–196.
[64] Volkman, J.K., Guillan, F.T., Johns, R.B. and Eglinton, G.
(1981) Sources of neutral lipids in a temperate intertidal sediment.
Geochim. Cosmochim. Acta 45, 1817–1828.
[65] Marlowe, I.T., Brassell, S.C., Eglinton, G. and Green, J.C. (1984)
Long chain unsaturated ketones and esters in living algae and
marine sediments. Org. Geochem. 6, 135–141.
[66] Eglinton, G. and Hamilton, R.J. (1967) Leaf epicuticular waxes.
Science 156, 1322.
[67] Barbe, A., Grimalt, J.O., Pueyo, J.J. and Albaiges, J. (1990)
Characterization of model evaporitic environments through the
study of lipid components. Org. Geochem. 16, 815–828.
[68] Schouten, S., Hartgers, W.A., Lopez, J.F., Grimalt, J.O. and
SinningheDamste, J.S. (2001) A molecular isotopic study of 13C-
enriched organic matter in evaporitic deposits: recognition of
CO2-limited ecosystems. Org. Geochem. 32, 277–286.
Copyright © 2022 FDOKUMEN