Optical gas sensing properties of thermally hydrocarbonized porous silicon Bragg reflectors
Upload
khangminh22Category
view
5download
0
Louisiana State UniversityLSU Digital Commons
LSU Master's Theses Graduate School
2011
Comparison of thermally pasteurized andultrasonically pasteurized blueberry juice(Vaccinium corymbosum) and an investigation ofblueberry juice effect on lipid oxidation duringmicroencapsulation of poly-unsaturated fish oilsFathima Waheeda MohideenLouisiana State University and Agricultural and Mechanical College, [email protected]
Follow this and additional works at: https://digitalcommons.lsu.edu/gradschool_theses
Part of the Life Sciences Commons
This Thesis is brought to you for free and open access by the Graduate School at LSU Digital Commons. It has been accepted for inclusion in LSUMaster's Theses by an authorized graduate school editor of LSU Digital Commons. For more information, please contact [email protected].
Recommended CitationMohideen, Fathima Waheeda, "Comparison of thermally pasteurized and ultrasonically pasteurized blueberry juice (Vacciniumcorymbosum) and an investigation of blueberry juice effect on lipid oxidation during microencapsulation of poly-unsaturated fish oils"(2011). LSU Master's Theses. 78.https://digitalcommons.lsu.edu/gradschool_theses/78
COMPARISON OF THERMALLY PASTEURIZED AND ULTRASONICALLY
PASTEURIZED BLUEBERRY JUICE (VACCINIUM CORYMBOSUM) AND AN
INVESTIGATION OF BLUEBERRY JUICE EFFECT ON LIPID OXIDATION
DURING MICROENCAPSULATION OF POLY-UNSATURATED FISH OILS
A Thesis
Submitted to the Graduate Faculty of the
Louisiana State University and
Agricultural and Mechanical College
in partial fulfillment of the
requirements for the degree of
Master of Science
in
The Department of Food Science
by
Fathima Waheeda Mohideen
B.Sc, University of Peradeniya, 2008
August 2011
ii
ACKNOWLEGEMENTS
I definitely could not able to make it without the support and encouragement
surrounding me. I want to express my sincere gratitude to Dr Subramaniam Sathivel, my
major advisor, for his guidance, motivation and support through my life and studies at LSU. I
want to thank my committee members: Dr Joan King, Dr Paul Wilson and Dr David
Bankston for their unreserved assistance; useful suggestions and advice. I also like to thank
Dr Joan King for her kindness for letting me use the HPLC, and Dr Paul Wilson for providing
us a rotary evaporator to conduct our research work.
I would like to convey my special sincere gratitude to Dr Alfredo Prudente for his
immense guidance and kind support for my project work, specially helping me with the
HPLC analysis. I would like to thank Dr Jack Losso and Dr John Finley for their kind
assistance regarding my project work and letting me use the freeze dryer; Dr Peter Bechtel
and Dr Jesse Stine for helping us to conduct fatty acid methyl ester profile analysis; Dr Ying
Xiao for helping us to obtain scanning electron microstructure; Dr Bob Xiang for his
immense help regarding operating the spray dryer and obtaining research supplies; Dr Ahmed
Moursey for his kind support for my research work.
I am greatly thankful for my lab mates Huaixia Yin, Luis Espinoza, Ahalya, Daniel,
Kevin, Jenny, Luis Alfaro, Yuting, Jie, Juan and Jianing for their unconditional guidance and
kind support for my project work. Thank you for your friendship and for making time at work
fun.
I would like to thank firms and organizations that supported my research: Omega
Protein Inc. for supplying purified menhaden oil; Fishery Industrial Technology Center,
Alaska, for supplying crude salmon oil; ADM Company for supplying corn syrup and many
others, and finally I would like to thank my family and friends for their support and love and
motivation to make the best out of myself. Thank you!
iii
TABLE OF CONTENTS
ACKNOWLEGEMENTS……………………………………………………………………..ii
LIST OF TABLES ...................................................................................................................vi
LIST OF FIGURES.................................................................................................................. ix
ABSTRACT ............................................................................................................................ xi
CHAPTER 1. LITERATURE REVIEW...................................................................................1
1.1 Ultra-sonication ...……………………...………………………………………………….1
1.1.1 Power Ultrasound………………………….……...……………………………..1
1.1.2 Ultrasonic Liquid Processor………………………..……………………………3
1.1.3 Ultrasonic Processing Parameters ………………………………………….…...3
1.1.4 Inactivation of Microorganisms ……………………………...……………...….6
1.1.5 Modes of Ultrasonication Processing………………….……………….………..7
1.1.6 Application of Power Ultrasound in Food Processing ………..…………….…..8
1.2 Blueberries…………………..……………………………………………………………..8
1.2.1 Anthocyanins………………………………………...…………………………10
1.2.2 Polyphenols….……………………………...…………….……………………11
1.2.3 Flavonoids……………...………………………………………………………12
1.2.4 Antioxidant Activity………………………………..………………………….13
1.2.5 Nutritional and Health Benefits………...…………………..………………….13
1.2.6 Blueberry Juice…………………..……………………………………………..14
1.3 Marine Oils……………………………………………………………………………….14
1.3.1 Menhaden Oil………..………………………………...…………………….…15
1.3.2 Salmon Oil…………...…………………...…………………………………….15
1.3.3 Health Benefits………………………………………..……………………….16
1.3.4 Lipid Oxidation………………………………………..………………………16
1.4 Microencapsulation……………..………………………………………………………..17
1.4.1 Wall Materials…………..………...……………………………………………18
1.4.2 Spray Drying………...……………...………………………………………….18
CHAPTER 2. EFFECT OF THERMAL PASTEURIZATION AND ULTRASONICATION
ON PHYSICO-CHEMICAL PROPERTIES AND MICROBIAL COUNTS OF
BLUEBERRY (VACCINIUM CORYMBOSUM) JUICE….... …………..…..19
2.1 Introduction………………………………………………………………………………19
2.2 Materials and Methods………..………………………………………………………….21
2.2.1 Preparation of Blueberry Juice…………………………………………………21
2.2.2 Thermal Pasteurization Treatments……..…………………..…………………22
2.2.3 Ultrasonication Treatments…………………………………………………….22
2.2.4 Estimation of Applied Energy Rate……………………………………………24
2.2.5 Microbial Counts……………………………………..………………………..24
2.2.5.1 Aerobic Plate Count (APC)………………………..………...………24
2.2.5.2 Total Coliforms (TC)…………………………………………..……..25
2.2.5.3 Yeasts and Molds……………………...……………………….…….25
2.2.6 Total Anthocyanin Content (TAC)…….……………………………………….26
2.2.7 Total Phenol Content (TPC)……………………..……...……………………...27
2.2.8 Antioxidant Activity (AA)……………………….…...………………………..27
iv
2.2.9 Total Soluble Solids, pH, and Titratable Acidity ……………………….……..28
2.2.10 Measurement of Juice Color..………………....……...……………...………..28
2.2.11 Degradation Kinetics of Anthocyanins………….…..………………………..29
2.2.12 Statistical Analysis………………….………...………………………………30
2.3 Results and Discussion…………..……………………………………………….………30
2.3.1 Applied Energy Density………………………..……………………………...30
2.3.2 Microbial Counts……….………………………………………………………31
2.3.3 TAC, TPC and AA of Untreated and Treated Juices…………..…..…………..36
2.3.4 pH, Titratable Acidity and °Brix……………………………………...………..41
2.3.5 Juice Color…………………...……...………………………………………….41
2.3.6 Anthocyanin Degradation Kinetics………………..……..…………………….45
2.4 Conclusions …………………………………………………………………………….48
CHAPTER 3. EFFECTS OF BLUEBERRY (VACCINIUM CORYMBOSUM) JUICE ON
LIPID OXIDATION DURING SPRAY DRYING OF
MICROENCAPSULATED SALMON OIL AND MENHADEN
OIL………………..………………………………...…………………………50
3.1 Introduction………………………………………………………………………………50
3.2 Materials and Methods……………..……………...…………………………….……….53
3.2.1 Preparation of Blueberry Juice (BJ)………………….……………….…..……53
3.2.2 Physico-chemical Properties of BJ………..…………....………..……...……..53
3.2.3.Physico-chemical Properties of Fish Oil……..……………………………….54
3.2.4 Preparation of Feed Emulsions………………...……………………………….56
3.2.5 Emulsion Stability, pH and Color…..………………………………………….57
3.2.6 Emulsion Rheological Properties……..………..………………………………57
3.2.7 Preparation of Spray Dried Microcapsules……...……………………………..58
3.2.8 Lipid Oxidation Parameters of Feed Emulsions and Microcapsules…….…….60
3.2.9 Fatty Acid Methyl Ester (FAME) Profile Analysis…..……………..…………61
3.2.10 Microencapsulation Efficiency Analysis………….………………..…………62
3.2.11 Color of Microencapsulated Fish Oil Powder….…………………………….63
3.2.12 Morphology of Microcapsules……..…………………………...…………….63
3.2.13 Particle Size Distribution Analysis……………………………………………64
3.2.14 Statistical Analysis………..…………..………………………………………64
3.3. Results and Discussion…………………………………………………………………..64
3.3.1 Physico-chemical Properties and Percent Yield of BJ………..…………….…64
3.3.2 Lipid Oxidation Parameters and Color of Purified MO and SO……………….67
3.3.3 Emulsion Stability, pH and Color of Emulsions……………………………….68
3.3.4 Rheological Properties of Emulsions…………...………………...……………70
3.3.5 Lipid Oxidation During Emulsification…………………………..……………77
3.3.6 ME of Microencapsulated MO and SO Powders……..……………………….82
3.3.7 Color of Microencapsulated Powders…..…………….………………….…….84
3.3.8 Lipid Oxidation During Microencapsulation………………………..…………86
3.3.9 FAME Composition of MO, SO and Microencapsulated Powders….….…..…88
3.3.10 Particle Size of Powders………………………………………………………91
3.3.11 SEM of Powders……………….…………………………….……………..…93
3.4 Conclusions………………………………….…………………………………………...98
CHAPTER 4 SUMMARY AND CONCLUSIONS .............................................................. 99
v
REFERENCES.......................................................................................................................102
APPENDIX:
A. BLUEBERRY JUICE TAC, TPC AND AA GRAPHS FOR THERMAL
PASTEURIZATION AND ULTRASONICATION………………………………………..115
B. SPRAY DRYER PERFORMANCE ............................................................................... 118
C. SPRAY DRYER PERFORMANCE CALCULATIONS…………….………..….……..121
D. SPRAY DRYER PERFORMANCE TABLES…..……………………………….……..123
VITA......................................................................................................................................127
vi
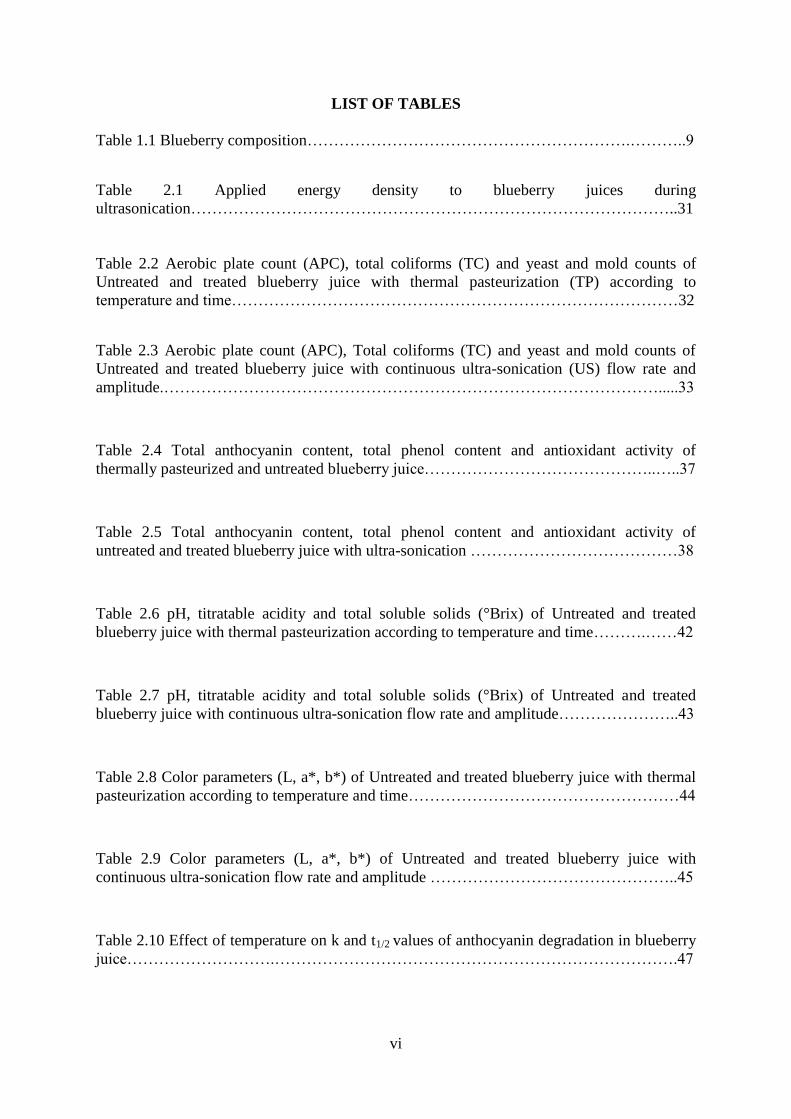
LIST OF TABLES
Table 1.1 Blueberry composition…………………………………………………….………..9
Table 2.1 Applied energy density to blueberry juices during
ultrasonication………………………………………………………………………………..31
Table 2.2 Aerobic plate count (APC), total coliforms (TC) and yeast and mold counts of
Untreated and treated blueberry juice with thermal pasteurization (TP) according to
temperature and time…………………………………………………………………………32
Table 2.3 Aerobic plate count (APC), Total coliforms (TC) and yeast and mold counts of
Untreated and treated blueberry juice with continuous ultra-sonication (US) flow rate and
amplitude.………………………………………………………………………………….....33
Table 2.4 Total anthocyanin content, total phenol content and antioxidant activity of
thermally pasteurized and untreated blueberry juice……………………………………..…..37
Table 2.5 Total anthocyanin content, total phenol content and antioxidant activity of
untreated and treated blueberry juice with ultra-sonication …………………………………38
Table 2.6 pH, titratable acidity and total soluble solids (°Brix) of Untreated and treated
blueberry juice with thermal pasteurization according to temperature and time……….……42
Table 2.7 pH, titratable acidity and total soluble solids (°Brix) of Untreated and treated
blueberry juice with continuous ultra-sonication flow rate and amplitude…………………..43
Table 2.8 Color parameters (L, a*, b*) of Untreated and treated blueberry juice with thermal
pasteurization according to temperature and time……………………………………………44
Table 2.9 Color parameters (L, a*, b*) of Untreated and treated blueberry juice with
continuous ultra-sonication flow rate and amplitude ………………………………………..45
Table 2.10 Effect of temperature on k and t1/2 values of anthocyanin degradation in blueberry
juice……………………….………………………………………………………………….47
vii
Table 2.11 Activation energy of anthocyanin degradation…………………………………..48
Table 3.1 Emulsion formulation (% w/w) to produce microencapsulated MO & SO
powders….…………………………………………………………………………………...56
Table 3.2 Physico-chemical properties and yield (%) of BJ……...………………………….65
Table 3.3 PV, AV, Totox and color of MO and SO………………………………………….67
Table 3.4 Emulsion stability, pH and color of MO emulsions………..……………..……….68
Table 3.5 Emulsion stability, pH and color of SO emulsions………..………………..……..69
Table 3.6 Flow behavior properties of EMO, 5EMOBJ and 10EMOBJ.……..…………….70
Table 3.7 Flow behavior properties of ESO, 5ESOBJ and 10ESOBJ……….………………71
Table 3.8 Apparent viscosity change of EMO, 5EMOBJ and 10EMOBJ with
temperature……………………………………………………………………….…………..72
Table 3.9 Apparent viscosity change of ESO, 5ESOBJ and 10ESOBJ with
temperature………………………………………………………………………………..….72
Table 3.10 PV, AV, Totox value of MO and MO emulsions……………………...…………79
Table 3.11 PV, AV, Totox value of SO and SO emulsions…………………………...……..80
Table 3.12 Surface oil content, total oil content and microencapsulation efficiency of MO and
SO microencapsulated powders…………...…………………………………………………82
Table 3.13 Color of microencapsulated MO and SO powders……………………………….84
Table 3.14 FAMEs Composition (% w/w) of MO, MMO, 5MMOBJ and
10MMOBJ…………………………………………………………………………..……….89

viii
Table 3.15 FAMEs Composition (% w/w) of SO, MSO, 5MSOBJ and
10MSOBJ………………………………………………………………...………….………90

ix
LIST OF FIGURES
Figure 1.1 Ultrasonic cavitation………………………………………………………………2
Figure 1.2 Ultrasonic probe (a) generator: (b) Ultrasonic converter: (c) standard and booster
horns: (d) Probes………………………………………………………………………………3
Figure 1.3 Graph of flow rate (L/h) and energy (kW) for ultrasound applications……...…….4
Figure 1.4 Anthocyanidin structure…………………………………………………………..10
Figure 1.5 Structures of phenolic acids present in blueberries……………………….………11
Figure 1.6 Some structures of flavonoids present in blueberries……………………….……12
Figure 1.7 Blueberry juice processing…………………………………….………………….14
Figure 1.8 Chemical structures of EPA and DHA…………………..……………………….15
Figure 2.1 Processing flow diagram of juice processing …………………………………….22
Figure 2.2 Ultra-sonication system used to sonicate blueberry juice ……………….……….23
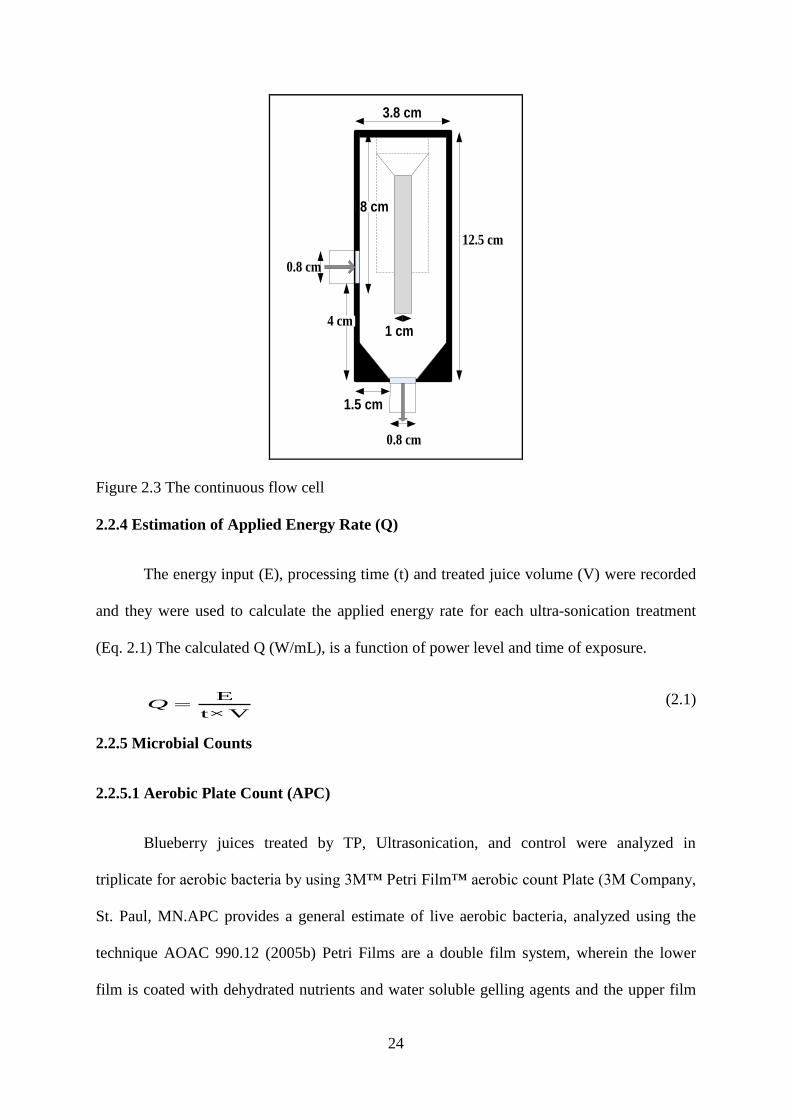
Figure 2.3 The continuous flow cell …..………………………………………..……………24
Figure 2.4 Degradation of anthocyanins in blueberry juice during heating at 80, 85 and 90
°C……………………………………………………………………….…………………….46
Figure 2.5 The Arrhenius plot for degradation of anthocyanin pigments in blueberry
juice………………………………………………………………………………………..…47
Figure 3.1 Pilot plant spray dryer……………………………………………..………….…..59
x
Figure 3.2 Shear viscosity as a function of shear rate in emulsions of EMO, 5EMOBJ and
10EMOBJ (a, b and c respectively)……………………………………….…………………73
Figure 3.3 shear viscosity as a function of shear rate in emulsions of ESO, 5ESOBJ and
10ESOBJ (a, b and c respectively)………………………………..…………………………75
Figure 3.4 Viscoelastic properties of EMO, 5EMOBJ, and 10EMOBJ…….…………..…..76
Figure 3.5 Viscoelastic properties of ESO, 5ESOBJ, and 10ESOBJ…………….…………76
Figure 3.6 Rheology Properties of EMO, 5EMOBJ and 10EMOBJ: Phase Angle (δ) vs.
angular frequency………………………….…………………………………………………78
Figure 3.7 Rheology Properties of ESO, 5ESOBJ and 10ESOBJ: Phase Angle (δ) vs. angular
frequency…………………………………………………………………………..…………78
Figure 3.8 Image of microencapsulated 10MMOBJ, 5MMOBJ and MMO powders (a, b, and
c respectively)……………..………………………………………………………………….85
Figure 3.9 Image of microencapsulated 10MSOBJ, 5MSOBJ and MSO powders (a, b, and c
respectively)……………...………………………………………………………………..…85
Figure 3.10 PV, AV, Totox value of MMO, 5MMOBJ and 10MMOBJ powders………….86
Figure 3.11 PV, AV, Totox value of MSO, 5MSOBJ and 10MSOBJ powders……….……87
Figure 3.12 Particle size distribution of MMO, 5MMOBJ and 10MMOBJ………..………92
Figure 3.13 Particle size distribution of MSO, 5MSOBJ and 10MSOBJ……..……………93
Figure 3.14 SEM image of microencapsulated MMO, 5MMOBJ and 10MMOBJ powders (a,
b, and c respectively)……………………………………………………………..………..…94
Figure 3.15 SEM image of microencapsulated MSO, 5MSOBJ and 10MSOBJ powders (a, b,
and c respectively)…..…………………………………………………………………..……96
xi
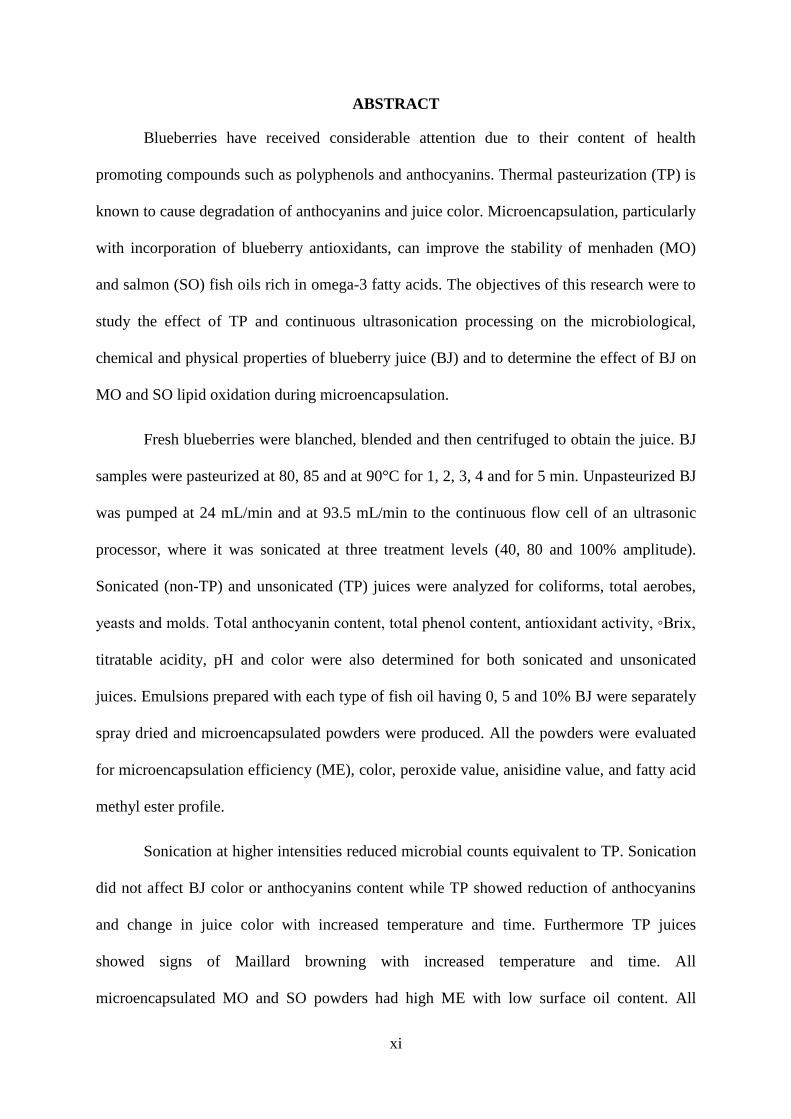
ABSTRACT
Blueberries have received considerable attention due to their content of health
promoting compounds such as polyphenols and anthocyanins. Thermal pasteurization (TP) is
known to cause degradation of anthocyanins and juice color. Microencapsulation, particularly
with incorporation of blueberry antioxidants, can improve the stability of menhaden (MO)
and salmon (SO) fish oils rich in omega-3 fatty acids. The objectives of this research were to
study the effect of TP and continuous ultrasonication processing on the microbiological,
chemical and physical properties of blueberry juice (BJ) and to determine the effect of BJ on
MO and SO lipid oxidation during microencapsulation.
Fresh blueberries were blanched, blended and then centrifuged to obtain the juice. BJ
samples were pasteurized at 80, 85 and at 90°C for 1, 2, 3, 4 and for 5 min. Unpasteurized BJ
was pumped at 24 mL/min and at 93.5 mL/min to the continuous flow cell of an ultrasonic
processor, where it was sonicated at three treatment levels (40, 80 and 100% amplitude).
Sonicated (non-TP) and unsonicated (TP) juices were analyzed for coliforms, total aerobes,
yeasts and molds. Total anthocyanin content, total phenol content, antioxidant activity, ◦Brix,
titratable acidity, pH and color were also determined for both sonicated and unsonicated
juices. Emulsions prepared with each type of fish oil having 0, 5 and 10% BJ were separately
spray dried and microencapsulated powders were produced. All the powders were evaluated
for microencapsulation efficiency (ME), color, peroxide value, anisidine value, and fatty acid
methyl ester profile.
Sonication at higher intensities reduced microbial counts equivalent to TP. Sonication
did not affect BJ color or anthocyanins content while TP showed reduction of anthocyanins
and change in juice color with increased temperature and time. Furthermore TP juices
showed signs of Maillard browning with increased temperature and time. All
microencapsulated MO and SO powders had high ME with low surface oil content. All
xii
powders containing 10% BJ showed less lipid oxidation during emulsification and spray
drying than powders containing 5% BJ and 0% BJ. This study demonstrated that
ultrasonication can be an alternative pasteurization treatment to TP and that BJ reduced lipid
oxidation in fish oils during microencapsulation.

1
CHAPTER 1 LITERATURE REVIEW
1.1 Ultra-sonication
Sonic waves having frequencies (>20 kHz) above the range audible to humans are
defined as ultrasound (Soria, and Villamiel 2010; Elmehdi and others 2003). Ultrasound
range can be divided into three different frequency ranges: diagnostic ultrasound (1-10 MHz),
high frequency ultrasound having 100 KHz- 1 MHz with low sound intensity (0.1-1 W/cm2)
and low frequency power ultrasound in the kHz range (20-100 kHz) with high sound intensity
(10-1000 W/cm2) (Ashokkumar and Kentish 2011). High frequency ultrasound applications
include food quality analysis, non-destructive inspection and medical imaging. Power
ultrasound which has high energy is widely used for many commercial applications such as
emulsification, homogenization, extraction, low temperature pasteurization, degassing,
defoaming, particle size reduction and viscosity alteration (Lorimer and others 1996).
1.1.1 Power Ultrasound
Power ultrasound employs a more powerful form of ultrasound at a lower frequency
(20-100 kHz). It can provide the mechanical effect of cavitation in liquid systems which can
alter physical and chemical properties of food depending on the type of material involved.
When ultrasound waves pass through a medium they will induce a series of compression and
rarefaction waves on the molecules of the medium. Initially this will enforce a sinusoidal
acoustic pressure (Pa) in addition to the hydrostatic pressure acting on the medium (Soria and
Villamiel 2010). This acoustic pressure can be represented by the following Eq. 1.1 using
wave frequency (f), time (t) and the maximum pressure amplitude of the wave (Pa,max). Pa,max
is directly proportional to the power input of the transducer (Bates and Patist 2008).
Pa = Pa, max sin (2πft) (1.1)
2
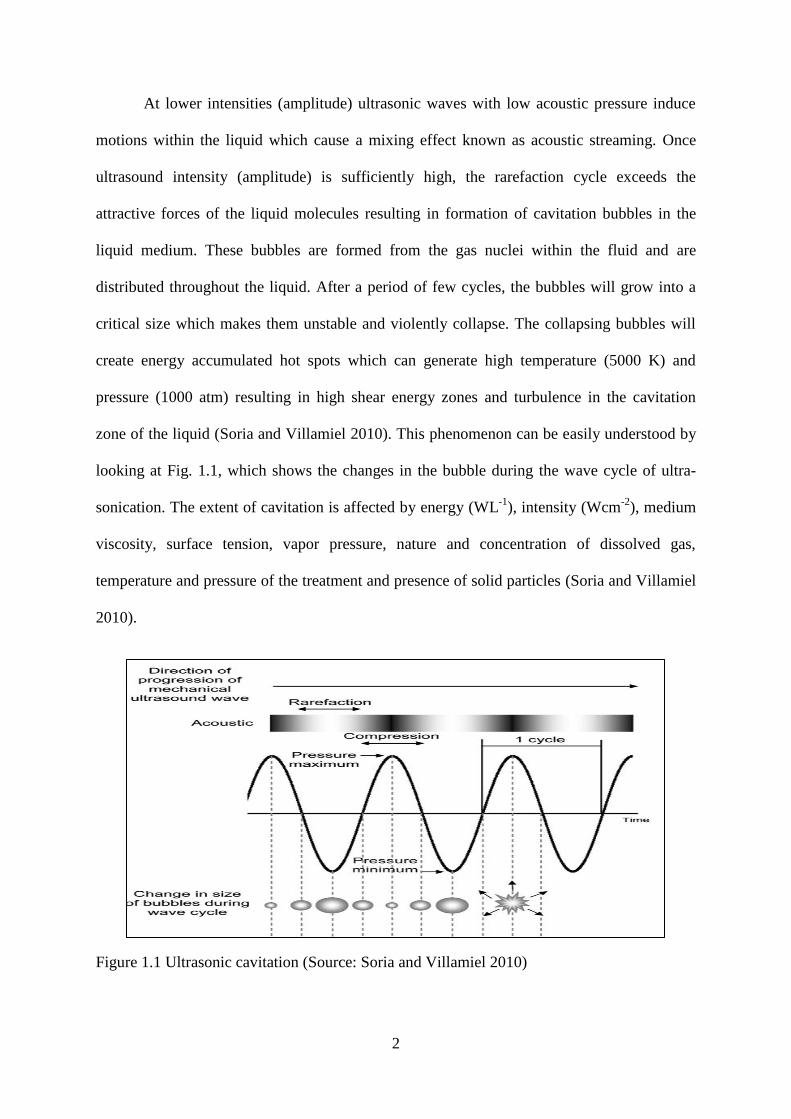
At lower intensities (amplitude) ultrasonic waves with low acoustic pressure induce
motions within the liquid which cause a mixing effect known as acoustic streaming. Once
ultrasound intensity (amplitude) is sufficiently high, the rarefaction cycle exceeds the
attractive forces of the liquid molecules resulting in formation of cavitation bubbles in the
liquid medium. These bubbles are formed from the gas nuclei within the fluid and are
distributed throughout the liquid. After a period of few cycles, the bubbles will grow into a
critical size which makes them unstable and violently collapse. The collapsing bubbles will
create energy accumulated hot spots which can generate high temperature (5000 K) and
pressure (1000 atm) resulting in high shear energy zones and turbulence in the cavitation
zone of the liquid (Soria and Villamiel 2010). This phenomenon can be easily understood by
looking at Fig. 1.1, which shows the changes in the bubble during the wave cycle of ultra-
sonication. The extent of cavitation is affected by energy (WL-1
), intensity (Wcm-2
), medium
viscosity, surface tension, vapor pressure, nature and concentration of dissolved gas,
temperature and pressure of the treatment and presence of solid particles (Soria and Villamiel
2010).
Figure 1.1 Ultrasonic cavitation (Source: Soria and Villamiel 2010)
3
1.1.2 Ultrasonic Liquid Processor
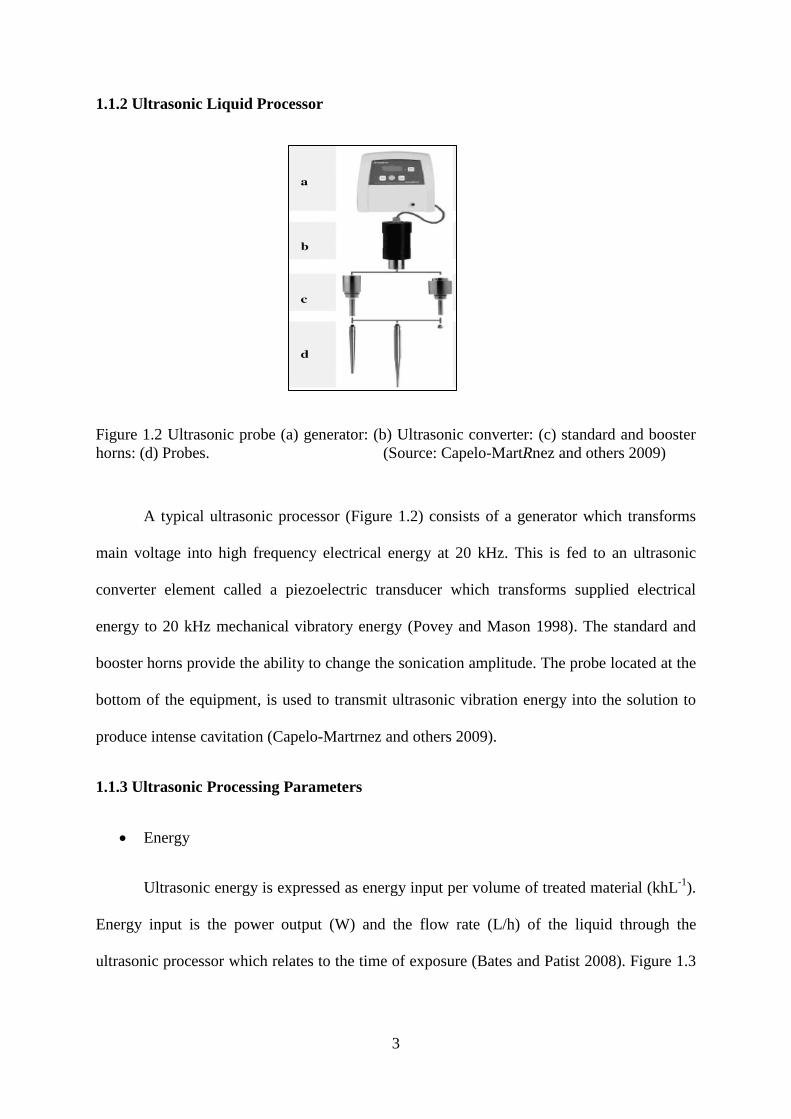
Figure 1.2 Ultrasonic probe (a) generator: (b) Ultrasonic converter: (c) standard and booster
horns: (d) Probes. (Source: Capelo-MartRnez and others 2009)
A typical ultrasonic processor (Figure 1.2) consists of a generator which transforms
main voltage into high frequency electrical energy at 20 kHz. This is fed to an ultrasonic
converter element called a piezoelectric transducer which transforms supplied electrical
energy to 20 kHz mechanical vibratory energy (Povey and Mason 1998). The standard and
booster horns provide the ability to change the sonication amplitude. The probe located at the
bottom of the equipment, is used to transmit ultrasonic vibration energy into the solution to
produce intense cavitation (Capelo-Martrnez and others 2009).
1.1.3 Ultrasonic Processing Parameters
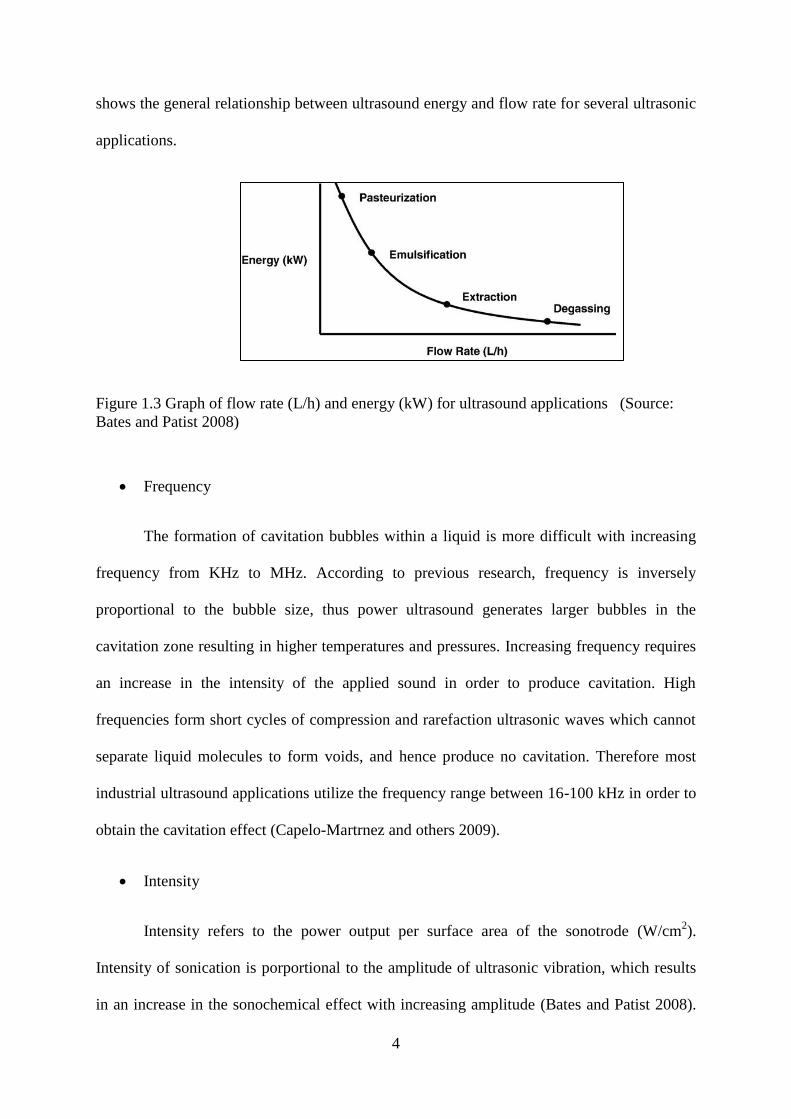
Energy
Ultrasonic energy is expressed as energy input per volume of treated material (khL-1
).
Energy input is the power output (W) and the flow rate (L/h) of the liquid through the
ultrasonic processor which relates to the time of exposure (Bates and Patist 2008). Figure 1.3
4
shows the general relationship between ultrasound energy and flow rate for several ultrasonic
applications.
Figure 1.3 Graph of flow rate (L/h) and energy (kW) for ultrasound applications (Source:
Bates and Patist 2008)
Frequency
The formation of cavitation bubbles within a liquid is more difficult with increasing
frequency from KHz to MHz. According to previous research, frequency is inversely
proportional to the bubble size, thus power ultrasound generates larger bubbles in the
cavitation zone resulting in higher temperatures and pressures. Increasing frequency requires
an increase in the intensity of the applied sound in order to produce cavitation. High
frequencies form short cycles of compression and rarefaction ultrasonic waves which cannot
separate liquid molecules to form voids, and hence produce no cavitation. Therefore most
industrial ultrasound applications utilize the frequency range between 16-100 kHz in order to
obtain the cavitation effect (Capelo-Martrnez and others 2009).
Intensity
Intensity refers to the power output per surface area of the sonotrode (W/cm2).
Intensity of sonication is porportional to the amplitude of ultrasonic vibration, which results
in an increase in the sonochemical effect with increasing amplitude (Bates and Patist 2008).
5
Although there is a minimum intensity required to achieve cavitation, higher amplitudes are
not always necessary to obtain the desired sonication effect. Also employing higher
amplitudes may cause rapid deterioration of the ultrasonic transducers which provide only
liquid agitation without any cavitation effect. But increased amplitude may be essential for
high viscosity samples which need more mechanical vibration in order to promote cavitation
(Capelo-MartRnez and others 2009).
Solvent
Ultrasonication applications are commonly performed in water, but depending on the
requirement, less polar liquids can also be used. However, solvent selection should consider
the liquid properites of the solvent since high viscosity and high surface tension of the solvent
tends to retard the cavitation effect (Capelo-MartRnez and others 2009).
Temperature
Although an increase in temperature leads to an increase the number of cavitation
bubbles, the collpase of these bubbles is hindered by the increased vapor pressure. Thus
cavitation is better attained at lower temperatures. Contrarily, the temperatrue has an effect
on liquid vapor pressure, surface tension and viscosity where an increase in temperature
reduces the viscosity allowing more violent cavitation bubbles. A compromise between
temperature and cavitation should be achieved in order to optimize processing
(Muthukumaran and others 2006).
External Pressure
The number of cavitation bubbles is reduced by the increased external pressure due to
increase of the cavitation threshold (Muthukumaran and others 2006). Conversely the
increased pressure in the liquid will increase pressure in the collapsed bubbles resulting in a

6
more rapid and violent collapse providing a greater sonochemical effect (Lorimer and Mason
1987). The ultrasonication process can be intensified by increasing the external pressure
without the need of increasing the amplitude (Bates and Patist 2008; Hielscher 2005).
Bubbled Gas
Dissolved gas in a liquid can favor the ultrasonication process by acting as nuclei for
caviation. In order to increase the cavitation effect, the gas must be bubbled continuously into
the solvent. The monoatomic gases like He, Ar and Ne can be used for this purpose (Capelo-
MartRnez and others 2009).
1.1.4 Inactivation of Microorganisms
The food industry is considering ultrasonication as a potential non thermal
preservation technique due the previous research findings related to its effect on microbial
inactivation. Many researchers believe that the inactivation is mainly due to direct cavitation
damage to microbial cell membranes (McKellar and others 2003). But some research findings
showed that the inactivation can be achieved without the effect of cavitation. The ultrasound
assisted microbial inactivation shows different sensitivities based on size, shape and species
of the microorganisms (Barbosa-canovas and others 2011). According to previous research
data, bigger cells show more inactivation than smaller ones, and coccal forms are more
sensitive than rod shaped bacteria. Also gram positive are more resistant than gram negative
bacteria and aerobes show more sensitivity than anaerobic bacteria. Furthermore
physiological condition of the cells also effect the rate of inactivation with younger cells
being more sensitive than older cells, and spore forms show higher resistance than vegetative
cells. Based on previous research findings, ultrasound has shown its potential ability to
destroy food borne pathogens such as E coli, Salmonellae, Ascaris, Giargia, Cryptosporidium

7
cysts and polio virus. The effect is increased when applied with other anti-microbial methods
such as heat and pressure (Ashokkumar and Kentish 2011).
1.1.5 Modes of Ultra-sonication Processing
Power ultrasound can process a liquid in three different modes.
Sonication
The microbial inactivation caused by sonication at sub lethal temperatures shows a
lower killing rate compared to other modes. However ultrasound alone has the ability to
destroy bacterial cell walls. In many cases higher intensities are required for complete
sterilization (Feng and others 2008).
Thermo Sonication
Thermosonication refers to the combined application of sonication with mild heat. In
1987, a research group found the synergistic effect of ultrasound and temperature where
increased temperature increases the ultrasound effectiveness (Feng and others 2009).
According to previous research data, sonication combined with heat has a greater lethality
than temperature only treatment. The researchers demonstrated that the lethality is mainly
due to the extensive physical damage on the bacterial cell envelope in the form of wrinkles,
ruptures and perforations. However, there is a maximum temperature that exists for each
organism where beyond this point sonication does not show increased inactivation (Feng and
others 2008).
Mano Sonication
Sonication treatment combined with moderate pressure, termed as mano-sonication, is
the most effective sonication form of microbial inactivation. Increased lethality under
8
moderate pressure was suggested to be the effect of increased intensity of cavitation. In 1999,
researchers discovered that the low frequency ultrasound inactivation of Listeria
monocytogenes increased when the applied pressure increased from ambient to 200 kPa
(McKellar and others 2003). An increased pressure beyond the moderate level does not
provide an increased rate of inactivation. It should be noted that the pressure level employed
in mano-sonication is not in the lethal range as in high pressure processing (Feng and others
2008).
Mano Thermo-sonication (MTS)
Sonication treatment combined with mild heat and pressure is known as mano
thermo-sonication has exhibited enhanced microbial inactivation in many research
applications (Feng and others 2009).
1.1.6 Application of Power Ultrasound in Food Processing
Power ultrasonication has many applications in the food industry for its mechanical,
chemical and bio-chemical effects. Mechanical uses include crystallization of fats and sugars,
degassing, destruction of foams, extraction of flavorings, filtration and drying, freezing,
mixing and homogenization and tenderization of meat. The bio-chemical and chemical
applications mainly involve bactericidal action, effluent treatment, modification of growth of
living cells, alteration of enzyme activity and sterilization of equipment (Ashokkumar and
Kentish 2011; Feng and others 2008).
1.2 Blueberries
Blueberry is a common name for the group of flowering plants belonging to the genus
Vaccinium, section Cyanococcus. The high bush, low bush and rabbit eye are the types of
blueberries grown in North America. The high bush blueberry, also called cultivated
blueberry is developed from wild high bush blueberry species which are grown in 35 states

9
and two provinces in Canada (Girard and others 2006). These berries are larger in size and
sold as both fresh and frozen.
Table 1.1 Blueberry composition (Source: USDA 2004)
Nutrients Blueberries (100 g)
Food Energy (Kcal) 57.00
Proximate Protein (g) 0.74
Total Lipid (fat) g 0.33
Carbohydrate (g) 14.49
Dietary Fiber (g) 2.40
Ash (g) 0.24
Water (g) 84.21
Minerals Calcium (mg) 6.00
Copper (mg) 0.06
Iron (mg) 0.28
Magnesium (mg) 6.00
Manganese (mg) 0.34
Phosphorous (mg) 12.00
Potassium (mg) 77.00
Selenium (mg) 0.10
Sodium (mg) 1.00
Vitamins Vitamin C (mg) 7.70
Thiamin (mg) 0.04
Riboflavin (mg) 0.04
Niacin (mg) 0.42
Pantothenic Acid (mg) 0.12
Vitamin B-6 (mg) 0.05

10
(Table 1.1 continued)
Folate (mg) 6.00
Vitamin A (IU) 54.00
Vitamin E (mg ATE) 0.57
However low bush blueberry, known as wild blueberry is grown in northeastern USA
and Canada, and sold mainly as frozen blueberries (Girard and others 2006). The composition
of blueberries is shown in Table 1.1. The Vaccinium corymbosum (northern high bush) is the
common cultivated species. Southern high bush blueberry is a new type of blueberry which is
a hybrid of northern high bush and native southern blueberry species. High bush blueberries
are large in size with intense dark blue color which increases its fresh market value and
suitability for processing. North America is the world’s leading producer of blueberries
where 60% of the fruit goes to the fresh market and 40% is processed (Trehane 2004).
1.2.1 Anthocyanins
Anthocyanins are naturally occurring water soluble pigments which are glycosides of
aglycones of anthocyanidins. Anthocyanins change color depending on the pH of the
medium. In acidic solutions, their color changes to red, and in basic medium their color
changes to blue while in neutral conditions, anthocyanin has a violet color. The bluish red
colors of the blueberries are mainly due to presence of anthocyanins.
Figure 1.4 Anthocyanidin structure
Cyanidin R1 = OH , R2 = H
Peonidin R1=OCH3, R2 = H
Delphinidin R1=R2=OH
Petunidin R1=OCH3, R2=OH
Malvidin R1=R2=OCH3
11
There are fifteen different anthocyanins present in blueberry fruit. They are
galactosides, glucosides, and arabinosides of delphinidin, cyanidin, petunidin, peonidin and
malvidin (Kalt and Dufour 1997; Girardin and others 1996; Haluk and others 1998).
Anthocyanins have antioxidant properties which play an important role in prevention
of cardivasular illnesses, cancer and diabetes. There are several factors effecting anthocyanin
stability such as pH, temperature, light, oxygen, enzymes, ascorbic acids, sugars, sulfite salts
(sulfur dioxide), metal ions and co-pigments. Heating magnitude and temperature have a
greater effect on anthocyanin stability (Brunton and others 2010a; Erdman and others 2005).
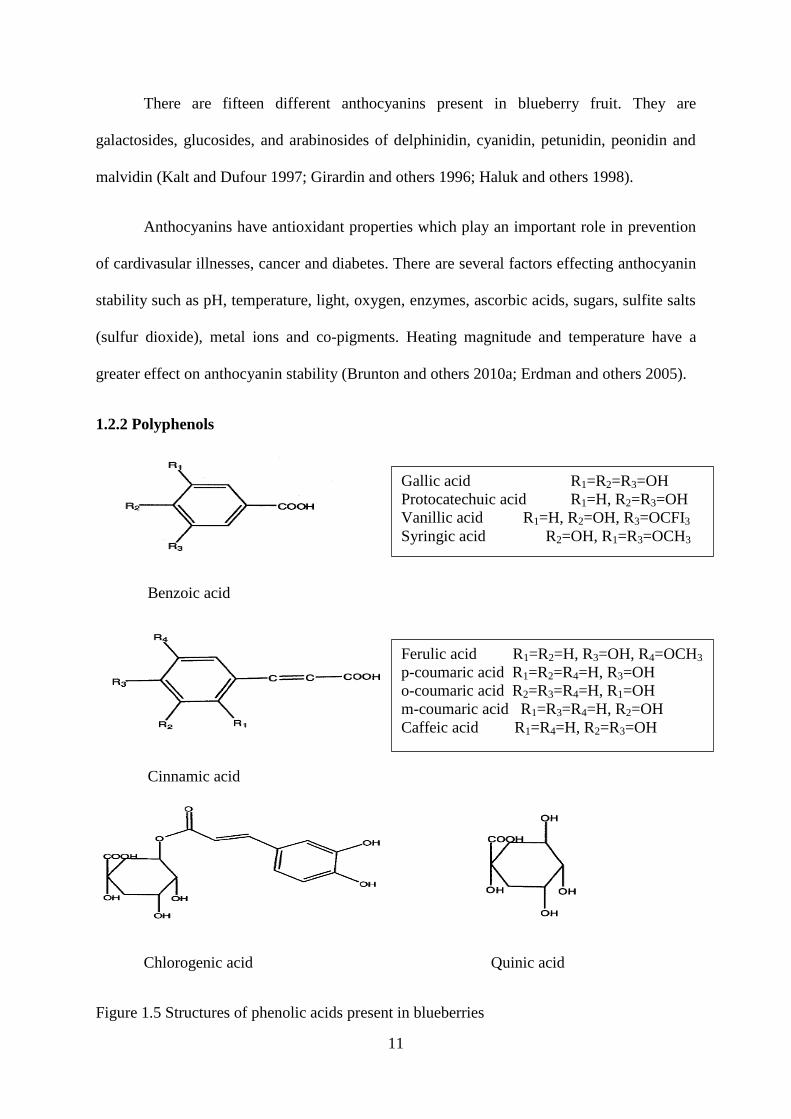
1.2.2 Polyphenols
Benzoic acid
Cinnamic acid
Chlorogenic acid Quinic acid
Figure 1.5 Structures of phenolic acids present in blueberries
Gallic acid R1=R2=R3=OH
Protocatechuic acid R1=H, R2=R3=OH
Vanillic acid R1=H, R2=OH, R3=OCFI3
Syringic acid R2=OH, R1=R3=OCH3
Ferulic acid R1=R2=H, R3=OH, R4=OCH3
p-coumaric acid R1=R2=R4=H, R3=OH
o-coumaric acid R2=R3=R4=H, R1=OH
m-coumaric acid R1=R3=R4=H, R2=OH
Caffeic acid R1=R4=H, R2=R3=OH

12
The composition of phenolic acids varies between blueberry cultivars. The structures
of phenolic acids are shown in Figure 1.5.
Most of the phenolic acids present in blueberries are derivatives of benzoic acids and
cinnamic acids. These phenolic acids are also known as non-flavonoids. Vanillic acid,
syringic acid, gallic acid, protocatechuic acid, m-hydroxybenzoic acid, p-hydroxybenzoic
acid and ellagic acids are derivatives of benzoic acids (Sellappan and others 2002; Häkkinen
and others 1999; Amakura and others 2000), while chlorogenic acid, caffeic acid, ferulic
acid, quinic acid, p-coumaric acid, o-coumaric acid and m-coumaric acid are derivatives of
cinnamic acids (Sellappan and others 2002; Häkkinen and others 1999). The major phenolic
acid present in blueberries is chlorogenic acid (Kalt and others 2000; Wang and Zheng 2003).
Phenolic acids are rarely present as free acids and are mostly esterified with other phenolic,
acids and sugars.
1.2.3 Flavonoids
Flavanols
Flavonols
Figure 1.6 Some structures of flavonoids present in blueberries
(+)-Catechin (2R, 3S)
(-)-Epicatechin (2R, 3R)
Kaempferol R1=R2=H
Quercetin R1=OH, R2=H
Myercetin R1=R2=OH
13
Blueberries are rich in flavonoids. Anthocyanins, flavonols, flavones, flavanonols and
flavan-3-ols have been reported to be present in blueberries. Flavonoids exhibit antioxidant
and anti-carcinogenic properties. According to previous epidemiological studies, high intake
of flavonoids provides protection against coronary heart disease, stroke and lung cancer.
Quercetin, kaempferol and myricetin are some flavonols present in blueberries (Sellappan
and others 2002; Azar and others 1987).
1.2.4 Antioxidant Activity
Blueberry has high antioxidant activity compared with many other fruits. The
antioxidant activity of the berries ranges from 8.1-38.3 µmol TE/g. According to the USDA
Human Nutrition Research Center, fresh blueberries ranked among the top for having higher
antioxidant activity (ORAC 2400 units/ 100g) compared with many fruits and vegetables
(Chien and Su 2007). The factors important for antioxidant activity in blueberries are mainly
anthocyanin content, phenolic content, maturity and post-harvest storage conditions.
1.2.5 Nutritional and Health Benefits
Diets rich in fruits and vegetables have been known to reduce certain types of cancer,
cardiovascular and chronic diseases (Donner and others 2000). Most of these benefits are
related to phytochemicals present in fruits and vegetables which contribute to their
antioxidant activity. The natural antioxidants present in fruits and vegetables such as
anthocyanins, polyphenolics, vitamin C, vitamin E and carotenoids are assumed to have a
preventive action against chronic diseases. Antioxidant compound reduce the oxidative
damage of free radicals by neutralization. Free radicals can be produced within the human
body due to body functions as respiration, and can be induced through environmental
conditions as UV radiation, air pollution, and habits such as consumptions of charred food
and smoking (Erdman and others 2005). The importance of blueberries should be emphasized

14
because they have the highest antioxidant capacity compared to 42 fruit and vegetables
evaluated. Blueberries are also known as a good source of dietary fiber, calcium, iron,
vitamin A and Vitamin C.
1.2.6 Blueberry Juice
Figure 1.7 Blueberry juice processing (Source: Durst and others 2002)
Blueberry juice is one of the processed products of blueberries. Commercial blueberry
juice processing involves the processing steps of blanching, enzyme treatment, clarification
and pasteurization (Figure 1.7).
1.3 Marine Oils
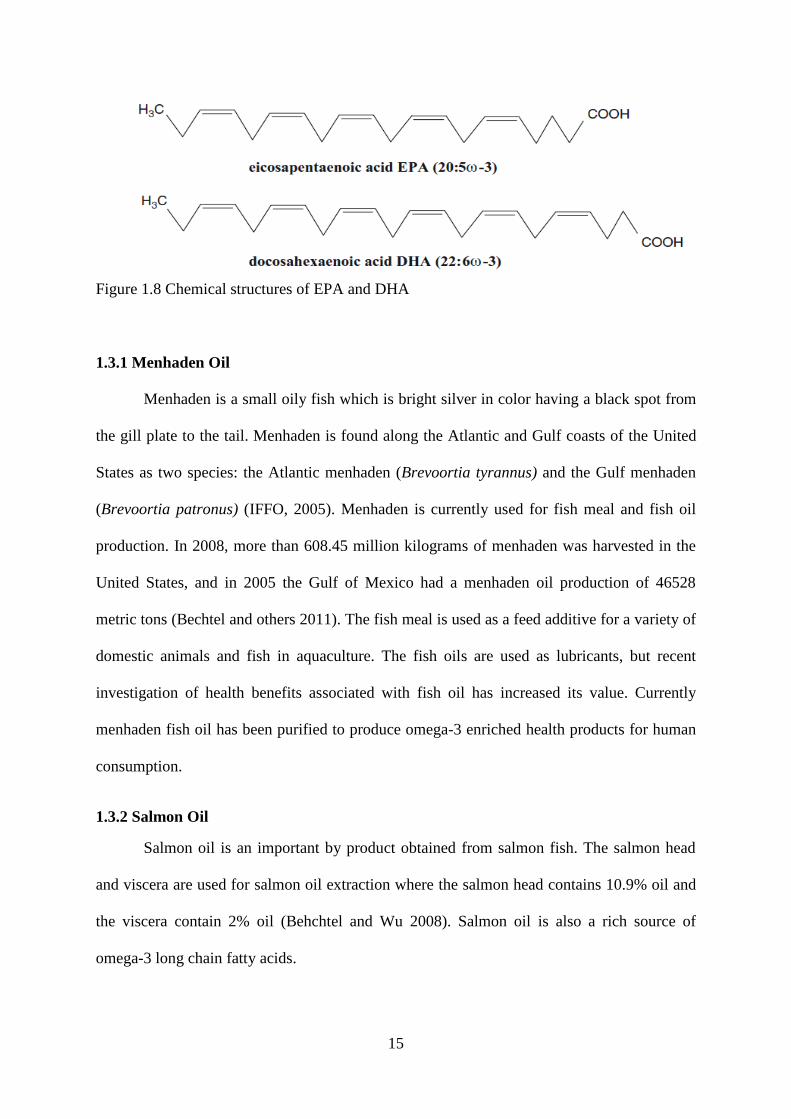
Marine fish oils are the main source of long chain omega-3 poly unsaturated fatty
acids (Anwar and others 2010). The omega-3 poly-unsaturated fatty acid group includes
alpha-linolenic acid (ALA C 18:3), eicosapentaenoic acid (EPA C20:5) and docosahexaenoic
acid (DHA C22:6). The chemical structures of EPA and DHA are shown in Figure 1.8.
15
Figure 1.8 Chemical structures of EPA and DHA
1.3.1 Menhaden Oil
Menhaden is a small oily fish which is bright silver in color having a black spot from
the gill plate to the tail. Menhaden is found along the Atlantic and Gulf coasts of the United
States as two species: the Atlantic menhaden (Brevoortia tyrannus) and the Gulf menhaden
(Brevoortia patronus) (IFFO, 2005). Menhaden is currently used for fish meal and fish oil
production. In 2008, more than 608.45 million kilograms of menhaden was harvested in the
United States, and in 2005 the Gulf of Mexico had a menhaden oil production of 46528
metric tons (Bechtel and others 2011). The fish meal is used as a feed additive for a variety of
domestic animals and fish in aquaculture. The fish oils are used as lubricants, but recent
investigation of health benefits associated with fish oil has increased its value. Currently
menhaden fish oil has been purified to produce omega-3 enriched health products for human
consumption.
1.3.2 Salmon Oil
Salmon oil is an important by product obtained from salmon fish. The salmon head
and viscera are used for salmon oil extraction where the salmon head contains 10.9% oil and
the viscera contain 2% oil (Behchtel and Wu 2008). Salmon oil is also a rich source of
omega-3 long chain fatty acids.
16
1.3.3 Health Benefits
According to many research findings poly unsaturated fatty acids are associated with
a low incidence of coronary heart disease and cancers (Barrow and others 2009). Both EPA
and DHA are important for cardiovascular systems.
EPA has an anti-inflammatory response acting as a building block of eicosanoids
known to act as cell messengers. Eicosanoids have an effect on blood pressure, blood
clotting, immune function, allergic response and gastric secretion. DHA is mainly a structural
component of the brain, which relates to brain function (Berger and others 1999; Chan and
others 2009; IFFO 2008; Barrow and others 2009).
1.3.4 Lipid Oxidation
Marine fish oils are very sensitive to lipid oxidation due to their highly unsaturated
nature. Lipid oxidation of marine oils leads to formation off flavors and odors while
degrading important health beneficial compounds such as EPA and DHA.
Lipid oxidation is a free radial reaction which occurs in three distinct stages as
initiation, propagation and termination (Colakoglu 2007; McDonald and Min 1996).
Initiation
Lipid oxidation can be initiated by number of factors including heat, UV and ionizing
radiation, peroxides (lipoperoxides and hydrogen peroxides) and metals.
RH Energy / catalyst R . + H.
Under these conditions, peroxides are cleaved and formed into alkoxy and hydroxyl
radicals. These can act as initiators of subsequent chain reactions (Halliwell and Chirico
1993; Ladikos and Lougovois 1990).
17
Propagation
The propagation reaction is primarily a radical chain reaction. During this stage
peroxide radicals react with oxygen to form the radical ROO accelerates degradation. In order
to prevent this reaction the oxygen level should be very low (Halliwell and Chirico 1993;
Ladikos and Lougovois 1990).
R. + O2 ROO.
ROO. + RH ROOH + R.
Termination
The propagation reaction continues until the termination reaction occurs. The
termination reactions lead to formation of dimers, polymers, ketones and alcohols (Halliwell
and Chirico 1993; Ladikos and Lougovois 1990).
R. + R. RR
ROO. + ROO. O2 + ROOR
ROO. + R. ROOR
1.4 Microencapsulation
Microencapsulation refers to the envelopment of small solid particles, liquid droplets
or gases in a coating mainly consisting of polymers. Microcapsules consist of two distinct
regions as inner core material and external wall material. Microcapsules can be categorized
into two groups based on their morphology; mononuclear capsules where a single core is
enveloped by a coating, and aggregates which have many cores surrounded in a matrix
(Homayouni and others 2008). Microencapsulation of marine oils prevents contact with

18
oxygen, metals and exposure to light. Also encapsulation facilitates trapping of off flavor in
marine oils while facilitating ease of enrichment in foods (Shahidi and Han 1993).
1.4.1 Wall Materials
Stability of produced fish oil microcapsules depends heavily on wall material and
processing conditions. The choice of wall materials for microencapsulation is critical since it
determines the initial feed emulsion properties, retention of core material during the process
of drying and shelf life of the powders after drying. The main types of wall material used for
microencapsulation are carbohydrates (modified and hydrolyzed starch, cellulose derivatives,
gums and cyclodextrin) and proteins (whey proteins, caseinates and gelatin) (Shahidi and
Han 1993).
1.4.2 Spray Drying
Spray drying is the most commonly used microencapsulation technique in the food
industry. Initially oil in water emulsion is prepared and the water phase is converted into a
dry powder by spraying the feed into a hot dry air. The typical spray drying process contains
several stages including atomization, air contact, evaporation and product recovery. Spray
drying is a one step process where drying proceeds until the desired moisture content in the
product is obtained (Shahidi and Han 1993). The resident time of particles within the spray
drier is less than 30 seconds (Adamiec and others 2002) thus the entire process of
dehydration takes only a very short time. The fish oil loading obtained through spray drying
ranges from 1 to 60% in weight, and particle size ranges from 10 to 400 µm.

19
CHAPTER 2 EFFECT OF THERMAL PASTEURIZATION AND ULTRA-
SONICATION ON PHYSICO-CHEMICAL PROPERTIES AND MICROBIAL
COUNTS OF BLUEBERRY (VACCINIUM CORYMBOSUM) JUICE
2.1 Introduction
In recent years, the application of ultrasonication in food processing has been
attractive because of its ability to inactivate microorganisms either without altering or having
relatively small effect on bioactive compounds, sensory and nutritional properties of food
(Heinz and others 2004). Ultrasonication is considered as one of the potential non thermal
pasteurization techniques for processing fruit juice (Deeth and others 2003). It is a simple and
effective method in retaining original characteristics of fruit juice which may make it more
advantageous than thermal pasteurization. The 2001 FDA report on “Kinetics of microbial
inactivation for alternative food processing technologies” indicated that ultrasound
processing could be used as one of the potential alternative techniques for conventional
pasteurization (Roberts and Salleh-Mack 2007). Ultrasound can be divided into three levels
based on its frequency ranges: diagnostic ultrasound (1-10 MHz), high frequency ultrasound
(100 kHz-1 MHz) and power ultrasound (16-100 kHz) (Bates and Patist 2008).
Inactivation of microorganisms can be explained by the effect of mechanical
cavitation generated by ultrasonication. Cavitation alters physical and chemical properties of
a food depending on the type of material involved (Cullen and others 2010). Ultrasound
waves passed through a liquid medium induces high pressure (compression) and low pressure
(rarefaction) wave cycles on the molecules of the liquid medium. Gas bubbles formed within
the liquid medium (in our study liquid food) by mechanical cavitation, are then dispersed
throughout the liquid. These bubbles continuously grow bigger and reach a condition where
they are unstable and begun to collapse (Bates and Patist 2008). The collapsing bubbles
generate high temperature hot zones and pressure in the medium (Feng and others 2008).

20
The high temperature and pressure generated in the liquid medium due to cavitation are last
only for a very short period of time (Flint and Suslick 1991). However they are able to
damage the cell membranes of microorganisms. The high pressure generated in the medium
due to the bubbles collapsing is the main cause of microorganism inactivation. The hot zones
are also able to kill microorganisms but their effect is localized. The growth and collapse of
the bubbles determine the amount of energy released by cavitation. Low frequency
ultrasound, for example 20 kHz, is more effective in inactivating microorganisms because it
generates large cavitation bubbles resulting in high temperature and pressure generated in the
cavitation zone (Bates & Patist, 2008). Chouliara et al. (2010) have shown that ultrasound
can reduce the total viable counts and psychrotrophs in raw and thermally sterilized milk, an
effect that last for up to 6 days of storage. Also Ultrasound has shown significant effect on
inactivating E.coli (Roberts and Salleh-Mack 2007).
Recently blueberries (Vaccinium corymbosum L.) have gained much consumer
attention due to the presence of health promoting compounds such as polyphenols and
anthocyanins. These compounds have antioxidant properties which can neutralize unstable
free radicals linked with the development of a number of diseases such as cancer,
cardiovascular disease and age related conditions such as Alzheimer’s (Cao et al., 1998).
According to the USDA database, blueberries have an antioxidant activity of 6552 µmol
TE/100g, which is reported as higher than many fruits and vegetables (USDA, 2004). The
polyphenols and anthocyanins present in the berries are the major contributors to their
antioxidant activity (Durst and others 2002). Anthocyanins are important for blueberry juice
in terms of juice color and antioxidant activity and have been shown to have an important
role in the prevention of neuronal and cardio vascular diseases, cancer and diabetes (Brunton
and others 2010a). Because of seasonality and short shelf life more than fifty percent of
harvested blueberries are used for processing into juice, purees and other blueberry products

21
(NASS 2006). The thermal processing employed in juice production readily degrades
anthocyanin pigments affecting juice color and nutritional properties (Guimarăes and others
2010). The blueberry juice processing industry desires a fresh like product with natural color
and flavor while preserving the nutritional and health compounds initially present in the fruit.
Presently, thermal pasteurization is the common method used for blueberry juice processing
to provide microbiological stability and extended shelf life (Brownmiller and others 2008).
But thermal pasteurization is associated with degradation of anthocyanins and sensory
properties. Therefore there is a need for a non-thermal preservation technique or a technique
to provide adequate microbial stability which can also preserve the bioactive compounds,
nutritional and sensory properties.
The objectives of this study were to: (1) determine the effect of thermal pasteurization
and of continuous ultra-sonication processing on the microbiological, chemical and physical
properties of blueberry juice, (2) and to estimate the influence of temperature on blueberry
anthocyanin degradation kinetics.
2.2 Materials and Methods
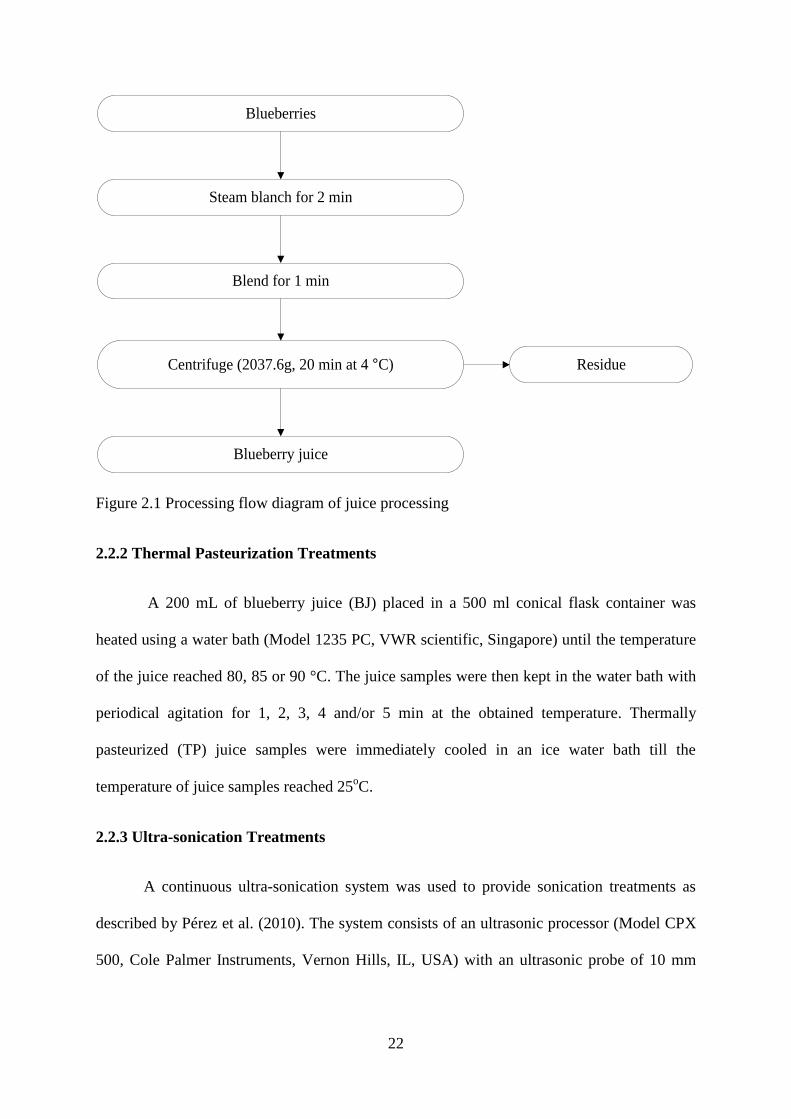
2.2.1 Preparation of Blueberry Juice
Locally purchased fresh imported northern high bush blueberries (Vaccinium
corymbosum L.) were used to produce blueberry juice according to the process flow diagram
shown in Figure 2.1. Berries were steam blanched for 2 min and rapidly cooled to 10 °C.
After that berries were blended using a mechanical blender (Magic bullet, China) for 1 min,
and the mash was centrifuged at 2037.6×g (J2-HC-TB-002 model, Beckman instruments Inc.,
CA, USA) for 20 min at 4 °C to separate the juice from the solid phase.
22
Blueberries
Steam blanch for 2 min
Blend for 1 min
Centrifuge (2037.6g, 20 min at 4 °C)
Blueberry juice
Residue
Figure 2.1 Processing flow diagram of juice processing
2.2.2 Thermal Pasteurization Treatments
A 200 mL of blueberry juice (BJ) placed in a 500 ml conical flask container was
heated using a water bath (Model 1235 PC, VWR scientific, Singapore) until the temperature
of the juice reached 80, 85 or 90 °C. The juice samples were then kept in the water bath with
periodical agitation for 1, 2, 3, 4 and/or 5 min at the obtained temperature. Thermally
pasteurized (TP) juice samples were immediately cooled in an ice water bath till the
temperature of juice samples reached 25oC.
2.2.3 Ultra-sonication Treatments
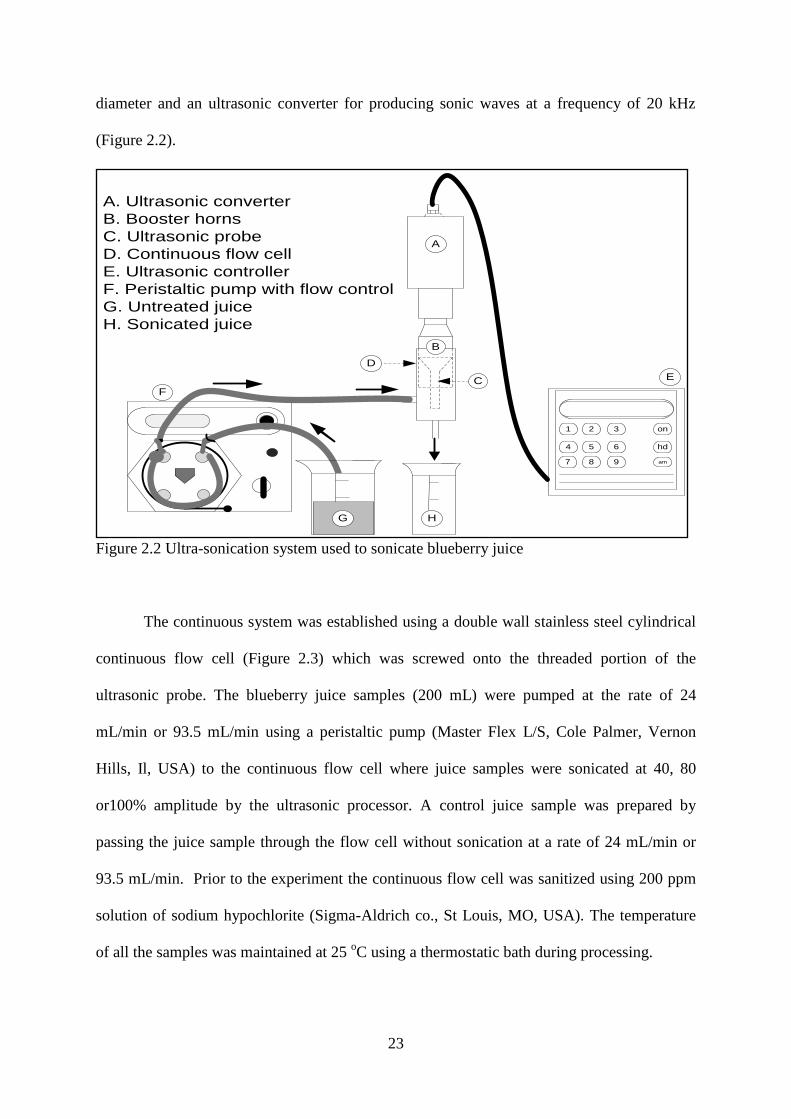
A continuous ultra-sonication system was used to provide sonication treatments as
described by Pérez et al. (2010). The system consists of an ultrasonic processor (Model CPX
500, Cole Palmer Instruments, Vernon Hills, IL, USA) with an ultrasonic probe of 10 mm
23
diameter and an ultrasonic converter for producing sonic waves at a frequency of 20 kHz
(Figure 2.2).
Figure 2.2 Ultra-sonication system used to sonicate blueberry juice
The continuous system was established using a double wall stainless steel cylindrical
continuous flow cell (Figure 2.3) which was screwed onto the threaded portion of the
ultrasonic probe. The blueberry juice samples (200 mL) were pumped at the rate of 24
mL/min or 93.5 mL/min using a peristaltic pump (Master Flex L/S, Cole Palmer, Vernon
Hills, Il, USA) to the continuous flow cell where juice samples were sonicated at 40, 80
or100% amplitude by the ultrasonic processor. A control juice sample was prepared by
passing the juice sample through the flow cell without sonication at a rate of 24 mL/min or
93.5 mL/min. Prior to the experiment the continuous flow cell was sanitized using 200 ppm
solution of sodium hypochlorite (Sigma-Aldrich co., St Louis, MO, USA). The temperature
of all the samples was maintained at 25 oC using a thermostatic bath during processing.
1
6
8
5
7
4
32
9
hd
on
am
A
B
C
G
F
E
H
D
A. Ultrasonic converter
B. Booster horns
C. Ultrasonic probe
D. Continuous flow cell
E. Ultrasonic controller
F. Peristaltic pump with flow control
G. Untreated juice
H. Sonicated juice
24
3.8 cm
12.5 cm
1 cm
0.8 cm
0.8 cm
1.5 cm
8 cm
4 cm
Figure 2.3 The continuous flow cell
2.2.4 Estimation of Applied Energy Rate (Q)
The energy input (E), processing time (t) and treated juice volume (V) were recorded
and they were used to calculate the applied energy rate for each ultra-sonication treatment
(Eq. 2.1) The calculated Q (W/mL), is a function of power level and time of exposure.
E
t×VQ (2.1)
2.2.5 Microbial Counts
2.2.5.1 Aerobic Plate Count (APC)
Blueberry juices treated by TP, Ultrasonication, and control were analyzed in
triplicate for aerobic bacteria by using 3M™ Petri Film™ aerobic count Plate (3M Company,
St. Paul, MN.APC provides a general estimate of live aerobic bacteria, analyzed using the
technique AOAC 990.12 (2005b) Petri Films are a double film system, wherein the lower
film is coated with dehydrated nutrients and water soluble gelling agents and the upper film
25
contains gelling agents and 2,3,5-triphenyltetrazolium chloride (TTC). One mL of juice was
placed on the center of the lower film and then the upper film was placed on the top of the
lower film. After gelling (<1 min) petri film plates were incubated for 48 h±3h at 35°C±1°C
and the red colonies were counted using the naked eye.
2.2.5.2 Total Coliforms (TC)
All juice samples were analyzed for total coliforms (AOAC 991.14, 2005b) using
total coliform Petri Film obtained from 3M Microbiology (St Paul, MN, USA). The Petri
Films contain violet red bile (VRB) nutrients, gelling agent and an indicator of glucuronidase
activity. As above, 1 mL of juice samples was inoculated in the Petri Films and incubated for
24 h±2h at 35 °C±1 °C and the red colonies with formed gas were counted. The coliforms are
considered as gram negative rods which ferment lactose and produce acid and gas. The
produced acid changes the pH modifying the gel color into darker red. The gas trapped
around red colonies confirms the presence of coliforms.
2.2.5.3 Yeasts and Molds
All of the juice samples were analyzed in triplicates for yeasts and molds (AOAC
997.02, 2005b) using Petri Films (3M Microbiology, St Paul, MN, USA). The Petri Films
contain nutrients and a gelling agent favorable for yeast and molds growth. Yeast are
typically indicated by small blue-green colonies with diffuse edges and center foci while
molds are identified by large variably colored colonies with diffuse edges and center foci.
One mL of juice was used as the inoculant as explained previously. Yeasts and molds
colonies were counted after an incubation period of 3 to 5 days at room temperature.
The APC, TC and yeasts and molds colonies were counted and reported as CFU/mL
using Eq. 2.2.

26
CFU/mL = [number of colonies * dilution factor] (2.2)
Aliquot plated (1mL)
2.2.6 Total Anthocyanin Content (TAC)
The total monomeric anthocyanin content of the blueberry juice was determined by
using the pH differential method of AOAC 2005.02 (AOAC, 2005a). Juice samples were
separately diluted with buffer solutions (Sigma-Aldrich Co., St Louis, MO, USA) of KCl
(0.025 M, pH 1.0) and CH3COONa (0.4 M, pH 4.5) according to a pre-determined dilution
factor (Dilution factor 10). The absorbance of these prepared dilutions was measured at 520
nm and 700 nm using a spectrophotometer (Thermo Fisher Scientific, Vernon Hills, IL). The
absorbance value (A) was calculated as follows (Eq.2.3).
520 700 1.0 520 700 4.5 A A – A pH A – A pH (2.3)
Where A520 is the absorbance value at 520 nm in pH 1.0 or pH 4.5 buffers; A700 is the
absorbance value at 700 nm in pH 1.0 or pH 4.5 buffers.
The monomeric anthocyanin content of the juice samples was calculated using Eq.
2.4, and was expressed in mg/L of cyanidin-3-glucoside equivalents.
Monomeric anthocyanin pigment concentration (mg/L) =
(2.4)
Where MW is the molecular weight of cyanidin-3-glucoside (449.2 gmol-1
), DF is the
dilution factor (10), ε is the molar extinction coefficient (26900 Lmol-1
cm -1
), and l is the path
length of the cuvette in cm (1 cm).
27
2.2.7 Total Phenol Content (TPC)
The total phenol content of juice samples was analyzed according to Folin-ciocalteu
method (Singleton and Sinkard 1997). Twenty µl of diluted juice samples (1:10) was
prepared with 1.58 ml of water and 100 µl Folin-ciocalteu reagent (Sigma-Aldrich co., St
Louis, MO, USA) in a cuvette. The juice mixture was shaken for 30 sec and let stand for 5
min, and a 300 µl solution of saturated sodium carbonate was added to the mixture. The
mixtures were placed in cuvettes at 20°C for 2 hours and absorbance was determined at 765
nm using spectrophotometer (Thermo Fisher Scientific, Vernon Hills, IL) using a blank
solution prepared with 20 µl of distilled water. The results were expressed as mg/L of gallic
acid equivalent using a gallic acid standard curve prepared using gallic acid concentrations of
0, 50, 100, 150, 250 and 500 mg/L.
2.2.8 Antioxidant Activity (AA)
The DPPH radical scavenging assay was used to determine the antioxidant activity of
the juice samples according to the method of Arlorio et al. (2009). A 700 µl of 100 µM
DPPH (Sigma-Aldrich co., St Louis, MO, USA) solution prepared in methanol (Sigma-
Aldrich Co., St Louis, MO, USA) was mixed with an equal volume of juice. The mixture was
shaken vigorously and kept in a dark room at room temperature for 30 min. The juice mixture
was placed in a spectrophotometer (Thermo Fisher Scientific, Vernon Hills, IL) and
absorbance was measured at 515 nm (Ab sample). A solution of 700 µl 100 µM DPPH and
700 µl distilled water was prepared and absorbance was measured at 515 nm (Ab control).
Methanol was used as a blank for the spectrophotometer analysis. The antiradical activity of
the samples was calculated as inhibition percentage using Eq. 2.5.
Inhibition percentage (%) =
(2.5)

28
The procedure was also repeated for the trolox standard curve using trolox
concentrations of 4, 8, 12, 16 and 20 µg/mL and the data were expressed as mmol/100 mL
trolox equivalent.
2.2.9 Total Soluble Solids, pH, and Titratable Acidity
The juice samples were analyzed for total soluble solids (TSS), pH and titratable
acidity. The total soluble solids of juice samples were determined at 20 °C using a digital
refractometer (Model AR 200 Reichart Analytical Instruments, NY, USA). Blueberry juice
samples were separately placed on the lens of the refractometer, and analyzed at 20°C.
Results were reported as °Brix values. The pH of the juice was measured using a bench top
pH meter (Symphony, VWR Scientific 5B70P, PA, USA). Titratable acidity was determined
by titrating a 10 g aliquot of blueberry juice sample to pH 8.2 using 0.1 N NaOH (Sigma-
Aldrich co., St Louis, Mo, USA). The results were expressed as percent total organic acid on
the basis of citric acid.
2.2.10 Measurement of Juice Color
The Color of the juice samples were measured in triplicate using a Lab Scan XE
Colorimeter (Hunter Associates Laboratory, INC. Resbon, VA, USA) and was reported in
CIE LAB color scale (L*, a* and b* values). The instrument was calibrated initially with
black and white standard tiles. Four grams of blueberry juice were weighed and placed in a
hexagonal plastic container. Five containers were stacked together to prevent disturbance
from the black base. Chroma and hue angle value were calculated using Equations (2.6) and
(2.7), respectively. The negative hue angle values were converted into positive values by
adding 180°to make them fall in the 90° – 180° quadrant (+b* = yellow; -a* = green).
Chroma =2 2* *a b (2.6)

29
Hue angle =1 *
tan ( )*
b
a
(2.7)
2.2.11 Degradation Kinetics of Anthocyanins
A first order (Eq. 2.8) model was used to describe the anthocyanins degradation
kinetics according to Guimarăes et al. (2010).
Ct =Co exp (-kt) (2.8)
t 1/2 = - ln 0.5 /k (2.9)
Where Co is the initial anthocyanin content (mg/L cya-3-glu); Ct is the anthocyanin
content (mg/L cya-3-glu) after heating at 80, 85 or 90 oC for 1, 2, 3, 4 and/or 5 min. (t) The
first-order degradation rate constant is represented as k and t1/2 is half life time (Eq. 2.9).
The logarithms were taken on both sides of Eq. 2.8 (Eq. 2.10).
ktCC 'lnln (2.10)
Eq. 2.10 was rearranged as Eq. (2.11)
lnt
Ckt
C
(2.11)
A plot of
tC
Cln versus t was constructed to determine k values and correlation
coefficients. The k value from the first order model was used to estimate the half- life of
anthocyanin using Eq 2.9. ln(k) values were plotted against 1/T and the activation energy for
anthocyanin degradation was obtained with the Arrhenius model (Eq. 2.12). The magnitude
of Eo was calculated as the slope of the plot multiply by the gas constant.
00ln ln
Ek k
RT
(2.12)
30
Where ko is the frequency factor (min-1
); k is the degradation rate constant; Eo is the
activation energy (kJmol-1
); R is the universal gas constant (8.314 Jmol-1
K-1
); and T is the
absolute temperature (K).
The effect of temperature on the rate of reaction was alternatively characterized by the
temperature coefficient (Q10). The change in the anthocyanin degradation can be explained by
Q10 when the temperature increases by 10 °C (Eq. 2.13).
Anthoycyanin degradation rate constant at 80 °C and 90 °C were used to calculate Q10
value using the Equation 2.13.
(10/90 80 )
10
80( )
90
C Cat
at
K CQ
K C
(2.13)
2.2.12 Statistical Analysis
All of the treatments and analyses were conducted in triplicate. One way analysis of
variance (ANOVA) following a Dunnett Test was carried out to determine the difference
between treatment means with the control. Means of treatment combinations of (thermal
processing temperature and time, and ultra-sonication flow rate and amplitude) were
separately analyzed using a 2-factorial randomized block design (RCBD). The treatment
main and interaction effects were obtained using the post hoc test of Tukeys Studentized
Range Test (SAS version 9.2, SAS institute INC., Cary, NC, USA). The statistical
significance level was set to α = 0.05.
2.3. Results and Discussion
2.3.1 Applied Energy Density
The applied energy density (Table 2.1) designates that the application of total
sonication energy per mL of juice during the ultrasonication process (Ashokkumar and others
2010). The resident time for sonicating juice reduces with high flow rate and sonication
energy rate increases with increasing sonication intensity (amplitude).

31
Table 2.1 Applied energy density to blueberry juices during ultrasonication
Amplitude
Applied energy rate (W/mL)
at 24 mL/min
Applied energy rate (W/mL)
at 93.5 mL/min
40% 13.88±2.45 3.64 ±1.75
80% 43.45±4.12 10.58 ±1.32
100% 73.60±5.35 19.74 ±2.03
2.3.2 Microbial Counts
Until the occurrence of major outbreaks related to E.coli 0157:H7 and salmonella in
non-pasteurized orange and apple juices, it was widely accepted that most low pH, high acid
foods do not cause food poisoning outbreaks (Parish 1997; Feng and others 2009). This was
mainly based on the assumption that organic acids have inhibitory and antimicrobial activity
over food borne pathogens. But the outbreaks have shown that the acidity and low pH
condition does not assure microbial safety in these fruit juices. After these incidences, FDA
required processors to achieve a 5-log reduction in the number of most resistant pathogens in
the finish products (USFDA 2001).
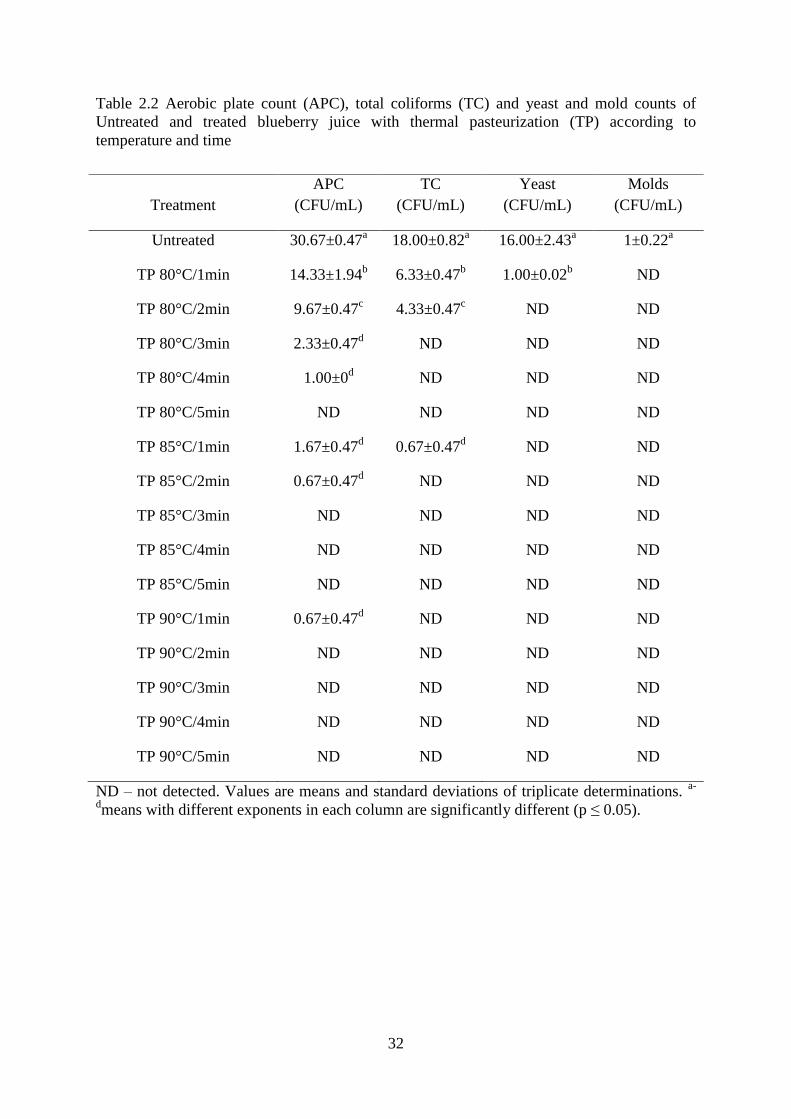
Most juice processors use thermal pasteurization to eliminate pathogenic
microorganisms. The aerobic plate count, total coliforms, yeasts and mold counts are used to
monitor the effectiveness of the pasteurization technique in fruit juices. Table 2.2 shows
microbial counts of APC, TC, yeast and mold for blueberry juice treated with thermal
pasteurization (TP). All selected temperatures (80, 85 and 90 °C) showed reduced counts (p ≤
0.05) of APC, TC, yeasts and molds compared to untreated juice. The reduction was greater
with increased temperature and heating time.
32
Table 2.2 Aerobic plate count (APC), total coliforms (TC) and yeast and mold counts of
Untreated and treated blueberry juice with thermal pasteurization (TP) according to
temperature and time
ND – not detected. Values are means and standard deviations of triplicate determinations. a-
dmeans with different exponents in each column are significantly different (p ≤ 0.05).
Treatment
APC
(CFU/mL)
TC
(CFU/mL)
Yeast
(CFU/mL)
Molds
(CFU/mL)
Untreated 30.67±0.47a 18.00±0.82
a 16.00±2.43
a 1±0.22
a
TP 80°C/1min 14.33±1.94b 6.33±0.47
b 1.00±0.02
b ND
TP 80°C/2min 9.67±0.47c 4.33±0.47
c ND ND
TP 80°C/3min 2.33±0.47d ND ND ND
TP 80°C/4min 1.00±0d ND ND ND
TP 80°C/5min ND ND ND ND
TP 85°C/1min 1.67±0.47d 0.67±0.47
d ND ND
TP 85°C/2min 0.67±0.47d ND ND ND
TP 85°C/3min ND ND ND ND
TP 85°C/4min ND ND ND ND
TP 85°C/5min ND ND ND ND
TP 90°C/1min 0.67±0.47d ND ND ND
TP 90°C/2min ND ND ND ND
TP 90°C/3min ND ND ND ND
TP 90°C/4min ND ND ND ND
TP 90°C/5min ND ND ND ND
33
Table 2.3 Aerobic plate count (APC), Total coliforms (TC) and yeast and mold counts of
Untreated and treated blueberry juice with continuous ultra-sonication (US) flow rate and
amplitude.
ND – not detected. Values are means and standard deviations of triplicate determinations. a-
fmeans with different exponents in each column are significantly different (p ≤ 0.05).
Although the high sugar content of blueberries is often subjects them to mold attacks,
mold counts in the final juice prior to pasteurization was lower than expected. This may have
been due to blanching. Except for the time temperature combinations of 80°C/ for1 and 2
min, and 85 °C for 1 min, the thermal treatments showed zero counts for total coliforms.
Commercial thermal pasteurization of blueberry juices is done by using a time temperature
combination of 90°C/60 sec or 90°C/90 sec (Brownmiller and others 2008).
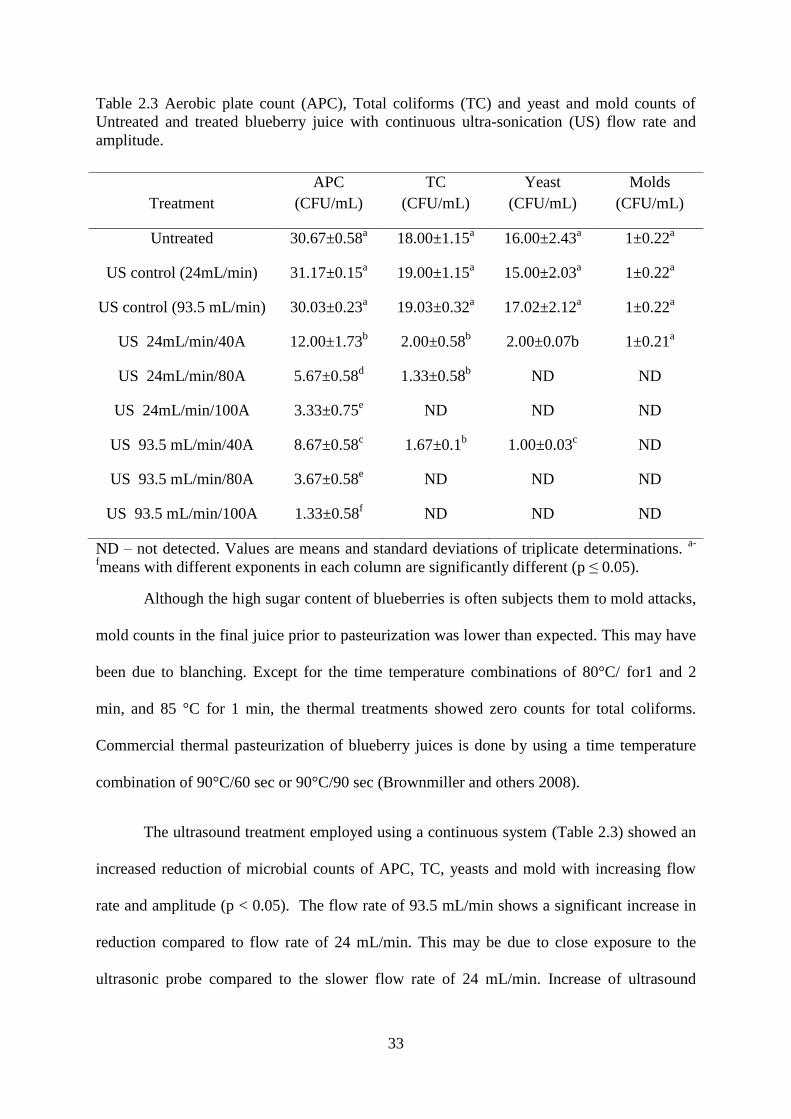
The ultrasound treatment employed using a continuous system (Table 2.3) showed an
increased reduction of microbial counts of APC, TC, yeasts and mold with increasing flow
rate and amplitude (p < 0.05). The flow rate of 93.5 mL/min shows a significant increase in
reduction compared to flow rate of 24 mL/min. This may be due to close exposure to the
ultrasonic probe compared to the slower flow rate of 24 mL/min. Increase of ultrasound
Treatment
APC
(CFU/mL)
TC
(CFU/mL)
Yeast
(CFU/mL)
Molds
(CFU/mL)
Untreated 30.67±0.58a 18.00±1.15
a 16.00±2.43
a 1±0.22
a
US control (24mL/min) 31.17±0.15a 19.00±1.15
a 15.00±2.03
a 1±0.22
a
US control (93.5 mL/min) 30.03±0.23a 19.03±0.32
a 17.02±2.12
a 1±0.22
a
US 24mL/min/40A 12.00±1.73b 2.00±0.58
b 2.00±0.07b 1±0.21
a
US 24mL/min/80A 5.67±0.58d 1.33±0.58
b ND ND
US 24mL/min/100A 3.33±0.75e ND ND ND
US 93.5 mL/min/40A 8.67±0.58c 1.67±0.1
b 1.00±0.03
c ND
US 93.5 mL/min/80A 3.67±0.58e ND ND ND
US 93.5 mL/min/100A 1.33±0.58f ND ND ND

34
intensity (amplitude) showed greater reduction in all TPC, TC, yeast and mold counts (p <
0.05). This reduction is in agreement with previous research work done by Adekunte et al.
(2010) about the effect of sonication on yeast inactivation in tomato juices. They observed an
increase in yeast inactivation with increased amplitude and processing time in batch
processing conditions. Also they stated that sonication alone can achieve a 5-log reduction in
yeast at moderate temperatures. Yeast inactivation was assumed mainly to be due to the
combined effect of physical and chemical mechanisms occurring during cavitation. Since
yeast cells are relatively rigid and not easy to rupture by cavitation effect, the proposed
inactivation is assumed to be mainly due to formation of free radicals (hydrogen peroxide)
and release of intracellular protein. Many previous research findings show greater reduction
of microorganisms with increase in ultrasound intensity (Jong and Villamiel 2000; Hoover
2000; Chen and others 2009). The sonication control treatments conducted for both flow rates
of 24 mL/min and 93.5 mL/min showed the effect on microbial inactivation was mainly due
to the sonication effect. The sonication controls showed similar microbial counts as untreated
juices.
Although APC counts in ultrasound treated juices show significant reduction, none of
the treatments yielded zero counts while many thermal treatments did. According to
D`Amico et al. (2006) continuous flow sonication treatment using 20 kHz at 100% amplitude
combined with mild heat (57 °C) for 18 min showed a 5-log reduction in total aerobic
bacteria present in raw milk and a 6-log reduction in E. coli O157:H7 in apple cider.
Similarly the effect of ultrasound is more pronounced when combined with heat (Mckellar
and others 2003; Mcclements 1995; Chen and others 2007a). A possible explanation for this
observation is ultra-sonication makes microbes more susceptible for inactivation by other
inhibitory mechanisms. Although an increase of temperature leads to an increase in the
number of cavitation bubbles, the collpase of these bubbles is hindered by the increased

35
vapor pressure (Jong and Villamiel 2000). Therefore cavitation is higher at moderate
temperatures. Heinz et al. (2003) demonstrated that ultrasound treatment at moderate
temperatures can provide an identical rate of bacterial inactivation as conventional thermal
processing.
TC counts (Table 2.3) showed a better reduction with ultrasound, where treatment
combinations of flow rate and intensity 24 mL/min and 100% amplitude; 93.5 mL/min 80%
and 100% amplitude showed zero counts similar to many thermal treatments. Based on
previous research findings gram negative bacteria such as Escherichia coli are more
succeptilble to sonication inactivation compared to gram positive bacteria. This could be
mainly due to the presence of thicker cell walls and a more tightly packed layer of
peptidoglycan in gram positive bacteria, which cannot be ruptured by sonication (Mckellar
and others 2003). However O`Brien et al. (1991) argued that increased reduction related to
gram negative bacteria may be due to the damage on the inner (cytoplasmic) cell membrane
because the percentage killed by ultrasound energy cannot be related to the cell morphology.
It is belived that pathogenic E.coli may survive in acidic environement such as fruit juices.
Bluberry juices have a pH value of 3.12, which might enhance acid resistance and the
survival of this pathogen in juices. Previous research findings have shown that E.Coli
O157:H7 can survive in concentrates of apple, orange,pineapple and white grape juice up to
12 weeks (Gombas and others 2003). Sonication showed a greater reduction of TC with
increasing amplitude (Table 2.3). This observation is in accordance with the research work
done by Bourke et al. (2009). They studied the effect of ultrasound inactivation on two strains
of E.coli and found a greater than 5-log reduction with increasing level of amplitude for a
processing time of less than 15 min. The results of that study indicated that ultrasound alone
can inactivate acid tolerant E.coli effectively in fruit juices without the use of extra heating
(Bourke et al., 2009; Roberts and Saleeh-Mack 2007).

36
Most of the previous research work employed a batch method of sonication where
microbial inactivation occured mainly due to a caviation effect and to a lesser extent by
generated heat. But continuous flow ultrasound does not generate a significant amount of heat
compared to the batch method, where the cavitation effect is exclusively involved in
microbial inactivation. The microbial inactivation owing to sonication is mainly ascribed to
the physical effect of cavitation, mechanical and micromechanical shocks, and chemical
effect of free radical formation in sonicated juices (Adekunte and others 2010; Chen and
others 2007a). Although sonication alone can cause microbial inactivation, it might require
greater processing time or multiple runs of continuous flow processing. Many previous
research studies showed that sonication at lethal temperatures (thermo-sonication) or pressure
(Manosonciation) or with the presence of both temperature and pressure (mano-thermo-
sonciation) provide a greater effect of inactivation when compared to sonication only
treatment. This will enable shorter processing time perhaps resulting in greater juice quality
(Feng and others 2009); Heinz and others 2004; Butz and Tauscher 2009).
2.3.3 Total Anthocyanin Content (TAC), Total Phenol Content (TPC) and Antioxidant
Activity (AA) of Untreated and Treated Blueberry Juices
Anthocyanins, bioactive compounds, found in blueberries provide desirable reddish
purple color in the he fruit juice. They are highly unstable and can degrade and lose their
bioactive properties during processing because of conditions including pH, temperature, light,
oxygen, and the presence of enzymes and metallic ions (Brunton and others 2010b). The
effect of TP on blueberry juice TAC content is shown in Table 2.4. The control (untreated)
blueberry contained 408 mg/L of anthocyanin (cyanidin-3-glucoside equivalents). Amakura
and others (2000) have reported that anthocyanin content of high bush blueberries ranges
from 25 to 495 mg/100g.

37
Table 2.4 Total anthocyanin content, total phenol content and antioxidant activity of
thermally pasteurized and untreated blueberry juice
Values are means and standard deviations of triplicate determinations. a-g
Means with different
exponents in each columns are significantly different (p < 0.05).
TAC = total anthocyanin content (mg of cyaniding-3-glucoside equivalents /L of juice
(cyaniding-3-glucoside equivalents)); TPC = Total phenol content ( mg of gallic acid (GA) /L
of juice (GA) equivalents)); AA = Antioxidant activity (mmol of trolox (TE)/100 mL of juice
(trolox (TE) equivalents).
TP juices had significantly lower levels of TAC than the untreated juice, except TP
80°C/1 min and TP 80°C/2 min. This study showed that the reduction of TAC significantly (p
≤ 0.05) increased with increasing pasteurization temperature and time. The similar effects of
Treatment TAC TPC AA
Untreated (Control) 408.29±20.39a 1918.61±28.19
f 5.08±0.07
g
TP 80°C/1min 370.67±13.19ab
2119.61±44.22d 5.90±0.05
bc
TP 80°C/2min 366.54±06.85ab
2293.83±13.00c 5.60±0.08
e
TP 80°C/3min 351.85±17.53b 2551.94±68.46
a 5.40±0.09
f
TP 80°C/4min 326.46±12.75cd
2107.50±65.49d 5.85±0.06
cd
TP 80°C/5min 312.95±16.21de
2035.28±63.66de
6.21±0.08a
TP 85°C/1min 365.55±10.01ab
2257.50±41.38c 5.78±0.12
de
TP 85°C/2min 340.66±09.90b 2093.61±89.38
de 5.67±0.12
e
TP 85°C/3min 335.99±12.71b 2160.28±42.28
d 5.84±0.13
cd
TP 85°C/4min 317.30±15.98de
2057.50±41.65e 5.91±0.09
bc
TP 85°C/5min 305.28±8.34def
2021.39±55.09e 6.23±0.07
a
TP 90°C/1min 358.39±12.79b 2263.06±50.23
c 5.90±0.09
bc
TP 90°C/2min 336.05±11.69bc
2429.72±87.57ab
5.62±0.08e
TP 90°C/3min 329.84±19.00cd
2332.50±48.05b 6.04±0.09
b
TP 90°C/4min 304.79±11.03ef
2235.28±48.08c 6.23±0.10
a
TP 90°C/5min 297.09±07.57f 2032.50±29.76
e 6.32±0.14
a
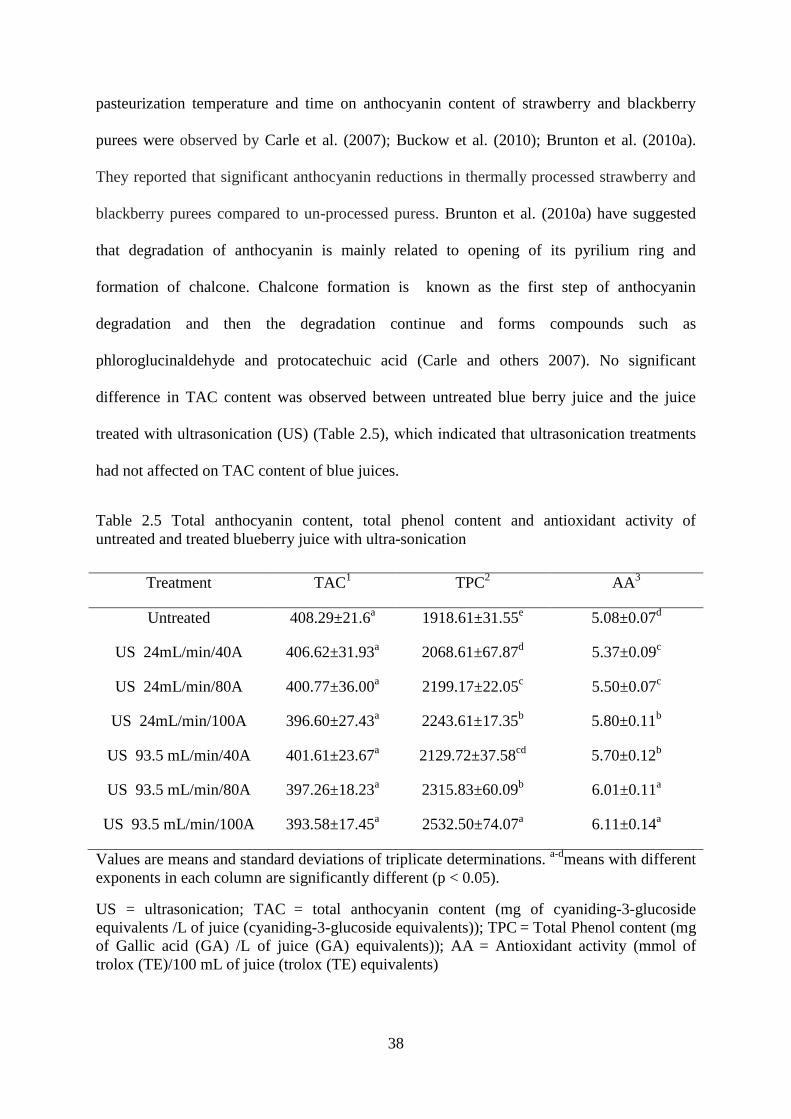
38
pasteurization temperature and time on anthocyanin content of strawberry and blackberry
purees were observed by Carle et al. (2007); Buckow et al. (2010); Brunton et al. (2010a).
They reported that significant anthocyanin reductions in thermally processed strawberry and
blackberry purees compared to un-processed puress. Brunton et al. (2010a) have suggested
that degradation of anthocyanin is mainly related to opening of its pyrilium ring and
formation of chalcone. Chalcone formation is known as the first step of anthocyanin
degradation and then the degradation continue and forms compounds such as
phloroglucinaldehyde and protocatechuic acid (Carle and others 2007). No significant
difference in TAC content was observed between untreated blue berry juice and the juice
treated with ultrasonication (US) (Table 2.5), which indicated that ultrasonication treatments
had not affected on TAC content of blue juices.
Table 2.5 Total anthocyanin content, total phenol content and antioxidant activity of
untreated and treated blueberry juice with ultra-sonication
Values are means and standard deviations of triplicate determinations. a-d
means with different
exponents in each column are significantly different (p < 0.05).
US = ultrasonication; TAC
= total anthocyanin content (mg of cyaniding-3-glucoside
equivalents /L of juice (cyaniding-3-glucoside equivalents)); TPC = Total Phenol content (mg
of Gallic acid (GA) /L of juice (GA) equivalents)); AA = Antioxidant activity (mmol of
trolox (TE)/100 mL of juice (trolox (TE) equivalents)
Treatment TAC1 TPC
2 AA
3
Untreated 408.29±21.6a 1918.61±31.55
e 5.08±0.07
d
US 24mL/min/40A 406.62±31.93a 2068.61±67.87
d 5.37±0.09
c
US 24mL/min/80A 400.77±36.00a 2199.17±22.05
c 5.50±0.07
c
US 24mL/min/100A 396.60±27.43a 2243.61±17.35
b 5.80±0.11
b
US 93.5 mL/min/40A 401.61±23.67a 2129.72±37.58
cd 5.70±0.12
b
US 93.5 mL/min/80A 397.26±18.23a 2315.83±60.09
b 6.01±0.11
a
US 93.5 mL/min/100A 393.58±17.45a 2532.50±74.07
a 6.11±0.14
a
39
A similar observation found by Pérez et al. (2010) for blackberry juice when the juice
was treated with a continuous flow ultra-sonication system, the TAC content was not
affected. Cullen et al. (2009a) reported that ultrasonicated blackberry juice retained a
significant amount of anthocyanins (>94%) at the maximum ultrasonication treatment
condition (100% amplitude for 10 min). Brunton et al. (2009a) and Brunton et al. (2010b)
have reported that about 5% degradation of TAC in fruit juices can occur when fruit juices
are processed under extreme non-thermal processing conditions such as sonicating a fruit at
100% amplitude or pressurizing at 500 MPa. However, our study showed that ultrasonication
treatments retained TAC in the blueberry juices better than the thermally pasteurized juices
regardless of the ultrasonication conditions.
The effect of TP with different heating times and temperature on the TPC of blueberry
juices is shown in Table 2.4. The control, the juice treated with TP 80°C/1min,TP 80°C/5min,
TP 85°C/4min, TP 85°C/5min, and TP 90°C/5min had lower TPC than juices treated with
other TP conditions. The juices treated at 80°C for 1 min and for 3 min had higher TPC than
those treated at 80oC for 4 or for 5 min. But the juices treated at 85°C and 90°C show
graduation reduction in TPC with increased heating temperature and time.
In general, temperature has a detrimental effect on phenols. Chlorogenic acid, the
main phenolic compound present in blueberries has been shown to decrease with heating time
and temperature in citrus juices (Chen and others 2007b). The esterified bond of chlorogenic
acid is assumed to be cleaved by heat treatment. The effect of US on TPC is shown in Table
2.5. The TPC content of US treated juices significantly increased with flow rate and
amplitude (p ≤ 0.05). All of the US juices have a higher content of TPC than the untreated
juice. The highest TPC content was yielded by the treatment of US 93.5 mL/min at 100%
amplitude resulting in a having TPC content of 2532mg/L gallic acid equivalent. The
sonication increases the TPC in the juice by extracting the bound phenolic present in the
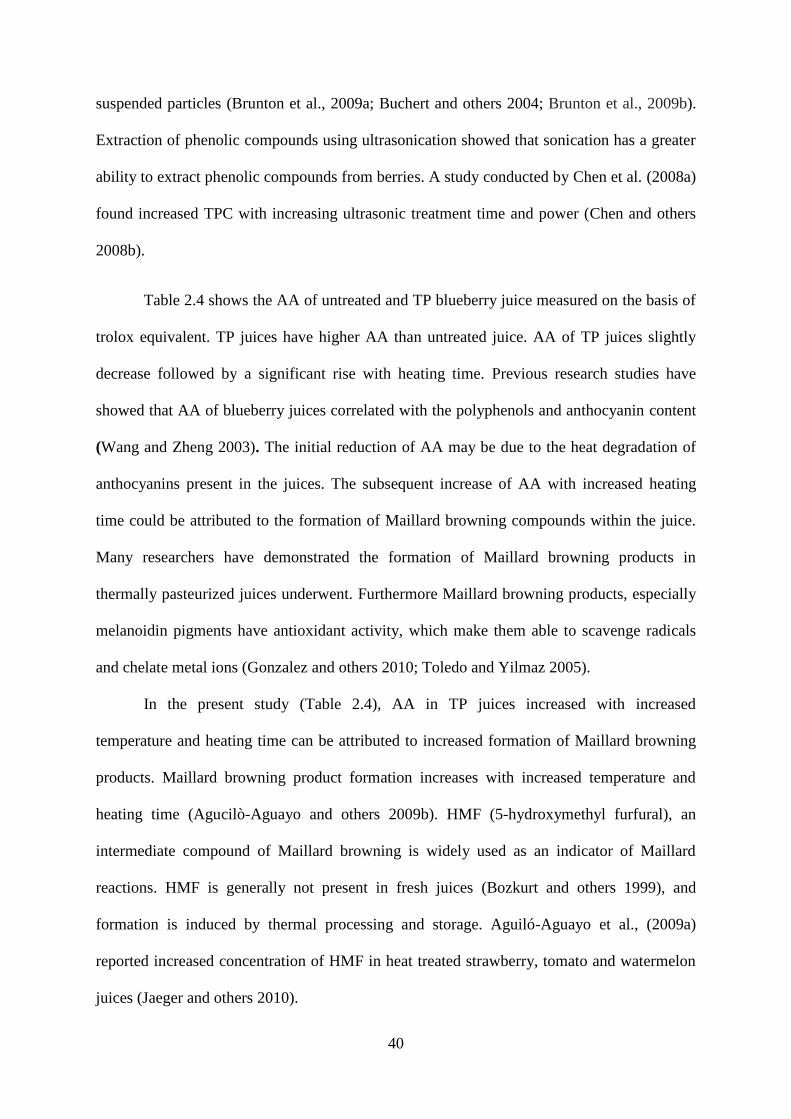
40
suspended particles (Brunton et al., 2009a; Buchert and others 2004; Brunton et al., 2009b).
Extraction of phenolic compounds using ultrasonication showed that sonication has a greater
ability to extract phenolic compounds from berries. A study conducted by Chen et al. (2008a)
found increased TPC with increasing ultrasonic treatment time and power (Chen and others
2008b).
Table 2.4 shows the AA of untreated and TP blueberry juice measured on the basis of
trolox equivalent. TP juices have higher AA than untreated juice. AA of TP juices slightly
decrease followed by a significant rise with heating time. Previous research studies have
showed that AA of blueberry juices correlated with the polyphenols and anthocyanin content
(Wang and Zheng 2003). The initial reduction of AA may be due to the heat degradation of
anthocyanins present in the juices. The subsequent increase of AA with increased heating
time could be attributed to the formation of Maillard browning compounds within the juice.
Many researchers have demonstrated the formation of Maillard browning products in
thermally pasteurized juices underwent. Furthermore Maillard browning products, especially
melanoidin pigments have antioxidant activity, which make them able to scavenge radicals
and chelate metal ions (Gonzalez and others 2010; Toledo and Yilmaz 2005).
In the present study (Table 2.4), AA in TP juices increased with increased
temperature and heating time can be attributed to increased formation of Maillard browning
products. Maillard browning product formation increases with increased temperature and
heating time (Agucilò-Aguayo and others 2009b). HMF (5-hydroxymethyl furfural), an
intermediate compound of Maillard browning is widely used as an indicator of Maillard
reactions. HMF is generally not present in fresh juices (Bozkurt and others 1999), and
formation is induced by thermal processing and storage. Aguiló-Aguayo et al., (2009a)
reported increased concentration of HMF in heat treated strawberry, tomato and watermelon
juices (Jaeger and others 2010).

41
Ultrasound treated juices (Table 2.5) do not produce browning compounds as thermal
processing (Gòmez-Lòpez and others 2010; Cullen and others 2010). Hence the increased
AA of US treated juices with increased flow rate and amplitude can be presumed due to
extraction of bound polyphenols and anthocyanin from suspended juice particles.
2.3.4 pH, Titratable Acidity and °Brix
No significant difference in pH, titratable acidity or brix (p>= 0.05) was noted for any
of the treatments (Table 2.6 and 2.7). These results are in agreement with the many previous
research findings, where ultrasound processing was shown to have no significant effect on
TA, pH and °Brix regardless of ultrasonic intensity (amplitude) and processing time (Kim
and others 2004; Cullen and others 2009b; Brunton and others 2010b; Chen and others
2007a; Cullen and others 2008). Also in these studies thermal pasteurization did not show
any significant effect on juice TA, pH and °Brix.
2.3.5 Juice Color
Juice color is important for consumer’s sensory acceptance. A bright deep red to
purple colour is desired in blueberry juices. Also juice deep red color is related to the
anthocyanin content in the juices. The L* value is closely associated with the browning in
juice which results in a darkening of the color and a decrease in the L* value (Cullen and
others 2009b).
The L* value of TP juices in the present study decrease with increasing temperature
and heating time (Table 2.8) indicating the formation of dark color Maillard browning
pigments. Hendrick et al. (2007) reported increased degradation of color with increasing
temperature in tomato puree and strawberry juices. In previous studies, formations of
browning pigments in thermally processed juice are explained by the increased formation of
HMF (Aguiló-Aguayo and others 2009a).

42
Table 2.6 pH, titratable acidity and total soluble solids (°Brix) of Untreated and treated
blueberry juice with thermal pasteurization according to temperature and time
Values are means and standard deviations of triplicate determinations. aMeans with different
letters in each columns are significantly different (p < 0.05).
1 Expressed as percent citric acid g/100 g
Treatment pH Titrable acidity1 °Brix
Untreated 3.14±0.01a 0.84±0.01
a 11.1±0.1
a
TP 80°C/1min 3.12±0.01a 0.84±0.03
a 11.0±0.2
a
TP 80°C/2min 3.12±0.02a 0.81±0.03
a 11.1±0.3
a
TP 80°C/3min 3.13±0.02a 0.82±0.01
a 10.9±0.1
a
TP 80°C/4min 3.13±0.01a 0.84±0.02
a 11.0±0.4
a
TP 80°C/5min 3.12±0.01a 0.83±0.01
a 10.9±0.3
a
TP 85°C/1min 3.13±0.02a 0.83±0.02
a 10.9±0.2
a
TP 85°C/2min 3.13±0.01a 0.83±0.01
a 11.0±0.3
a
TP 85°C/3min 3.14±0.01a 0.83±0.01
a 10.9±0.3
a
TP 85°C/4min 3.14±0.01a 0.83±0.01
a 11.0±0.2
a
TP 85°C/5min 3.13±0.02a 0.83±0.03
a 11.0±0.1
a
TP 90°C/1min 3.14±0.03a 0.83±0.02
a 10.9±0.4
a
TP 90°C/2min 3.13±0.01a 0.82±0.02
a 10.9±0.3
a
TP 90°C/3min 3.14±0.01a 0.83±0.02
a 10.9±0.3
a
TP 90°C/4min 3.14±0.02a 0.84±0.02
a 10.9±0.3
a
TP 90°C/5min 3.14±0.01a 0.83±0.03
a 10.9±0.8
a

43
Table 2.7 pH, titratable acidity and total soluble solids (°Brix) of Untreated and treated
blueberry juice with continuous ultra-sonication flow rate and amplitude
Values are means and standard deviations of triplicate determinations. aMeans with different
letters in each columns are significantly different (p < 0.05).
1 Expressed as percent citric acid g/100 g (fresh weight basis)
In our study, the a* value for TP juice significantly decreased with increasing
temperature and time. A similar pattern of reduction was observed by Aguilò-Aguayo et al.,
(2009b) in strawberry juice. They suggested the reduction of the a* value is mainly as a result
of anthocyanin degradation and formation of Maillard reaction products. The reduction of the
a* value in TP juices closely correlated with the anthocyanin degradation where red colour of
the juice is exclusively due to the anthocyanins (Brunton and others 2009b).
As explained above, TP caused degradation of anthocyanins and juice colour while
enhancing the undesirable reactions that lead to formation of HMF. However US treated juice
(Table 2.9) does not exhibit significant changes in L* or in a* value, indicating the ability to
preserve juice quality, which is in agreement with Perez et al. (2010).
Chroma corresponds to a color fading of juices. TP shows a significant reduction with
increased temperature and time while US does not show a significant difference.
Treatment pH Titrable acidity1 °Brix
Untreated 3.14±0.01a 0.84±0.01
a 11.1±0.1
a
US 24mL/min/40A 3.13±0.03a 0.83±0.01
a 10.9±0.3
a
US 24mL/min/80A 3.13±0.02a 0.83±0.02
a 11.0±0.4
a
US 24mL/min/100A 3.13±0.02a 0.83±0.02
a 11.0±0.4
a
US 93.5 mL/min/40A 3.12±0.01a 0.83±0.01
a 10.9±0.3
a
US 93.5 mL/min/80A 3.13±0.02a 0.84±0.01
a 10.9±0.2
a
US 93.5 mL/min/100A 3.12±0.01a 0.83±0.02
a 10.9±0.6
a
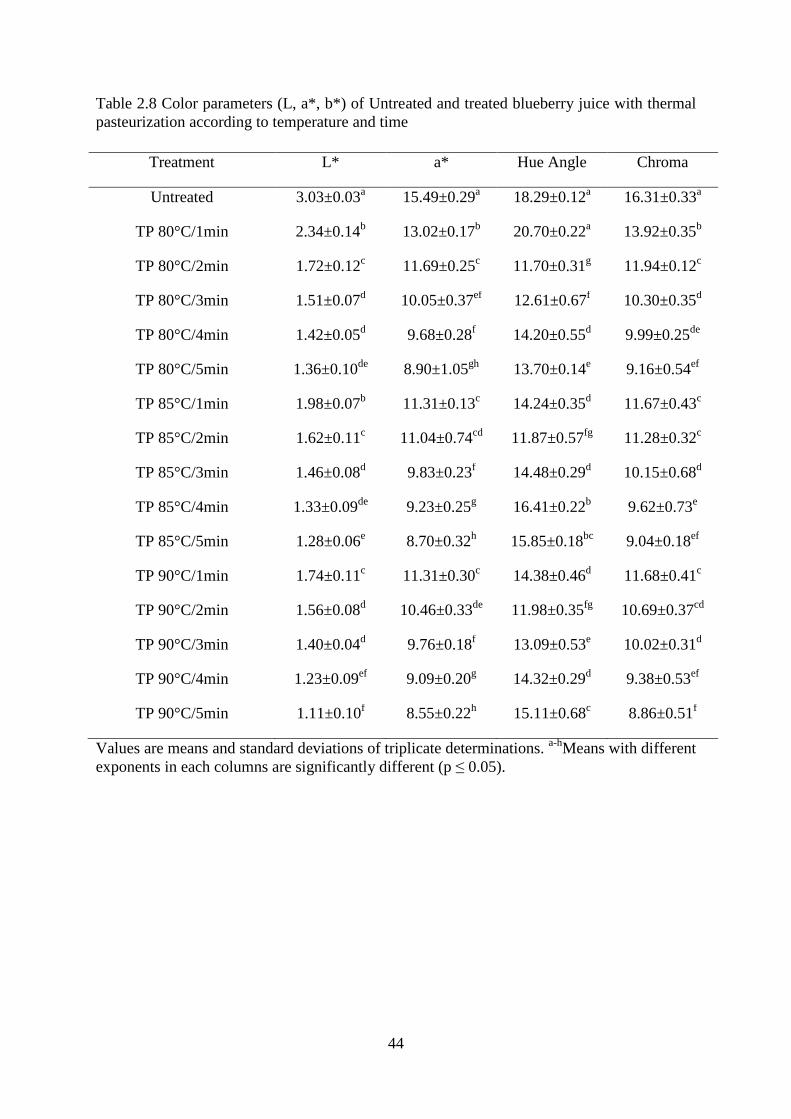
44
Table 2.8 Color parameters (L, a*, b*) of Untreated and treated blueberry juice with thermal
pasteurization according to temperature and time
Values are means and standard deviations of triplicate determinations. a-h
Means with different
exponents in each columns are significantly different (p ≤ 0.05).
Treatment L* a* Hue Angle Chroma
Untreated 3.03±0.03a 15.49±0.29
a 18.29±0.12
a 16.31±0.33
a
TP 80°C/1min 2.34±0.14b 13.02±0.17
b 20.70±0.22
a 13.92±0.35
b
TP 80°C/2min 1.72±0.12c 11.69±0.25
c 11.70±0.31
g 11.94±0.12
c
TP 80°C/3min 1.51±0.07d 10.05±0.37
ef 12.61±0.67
f 10.30±0.35
d
TP 80°C/4min 1.42±0.05d 9.68±0.28
f 14.20±0.55
d 9.99±0.25
de
TP 80°C/5min 1.36±0.10de
8.90±1.05gh
13.70±0.14e 9.16±0.54
ef
TP 85°C/1min 1.98±0.07b 11.31±0.13
c 14.24±0.35
d 11.67±0.43
c
TP 85°C/2min 1.62±0.11c 11.04±0.74
cd 11.87±0.57
fg 11.28±0.32
c
TP 85°C/3min 1.46±0.08d 9.83±0.23
f 14.48±0.29
d 10.15±0.68
d
TP 85°C/4min 1.33±0.09de
9.23±0.25g 16.41±0.22
b 9.62±0.73
e
TP 85°C/5min 1.28±0.06e 8.70±0.32
h 15.85±0.18
bc 9.04±0.18
ef
TP 90°C/1min 1.74±0.11c 11.31±0.30
c 14.38±0.46
d 11.68±0.41
c
TP 90°C/2min 1.56±0.08d 10.46±0.33
de 11.98±0.35
fg 10.69±0.37
cd
TP 90°C/3min 1.40±0.04d 9.76±0.18
f 13.09±0.53
e 10.02±0.31
d
TP 90°C/4min 1.23±0.09ef
9.09±0.20g 14.32±0.29
d 9.38±0.53
ef
TP 90°C/5min 1.11±0.10f 8.55±0.22
h 15.11±0.68
c 8.86±0.51
f
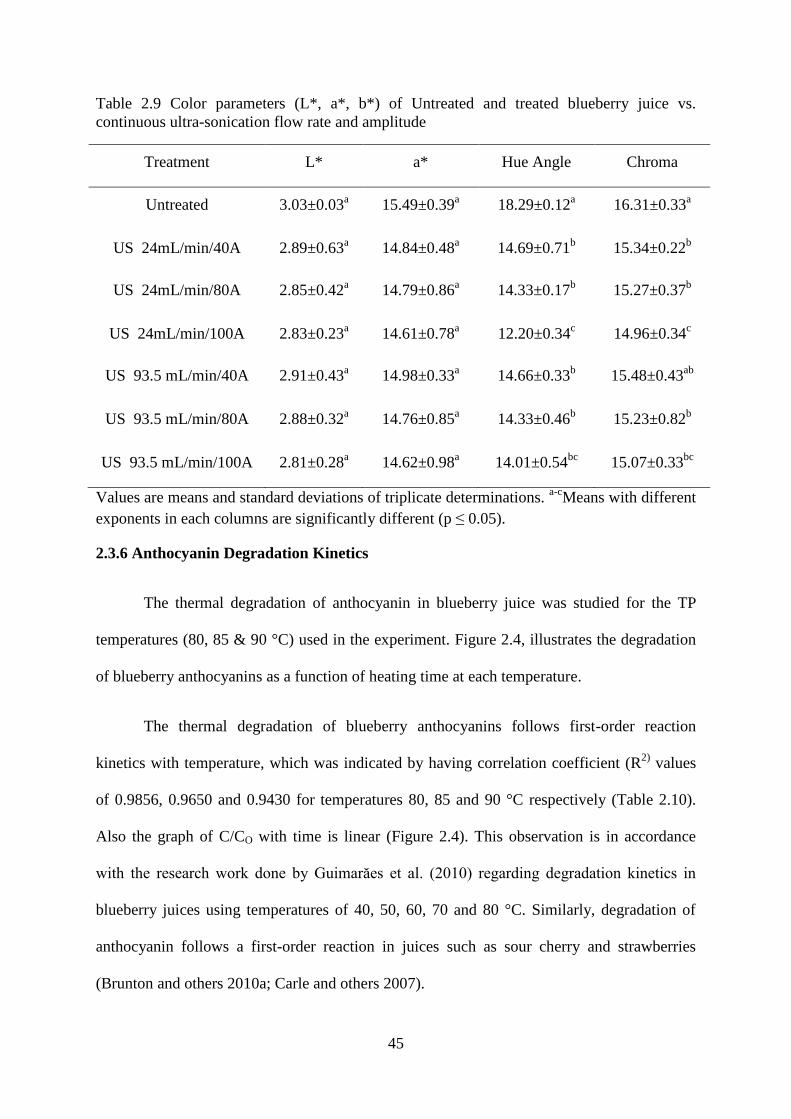
45
Table 2.9 Color parameters (L*, a*, b*) of Untreated and treated blueberry juice vs.
continuous ultra-sonication flow rate and amplitude
Treatment L* a* Hue Angle Chroma
Untreated 3.03±0.03a 15.49±0.39
a 18.29±0.12
a 16.31±0.33
a
US 24mL/min/40A 2.89±0.63a 14.84±0.48
a 14.69±0.71
b 15.34±0.22
b
US 24mL/min/80A 2.85±0.42a 14.79±0.86
a 14.33±0.17
b 15.27±0.37
b
US 24mL/min/100A 2.83±0.23a 14.61±0.78
a 12.20±0.34
c 14.96±0.34
c
US 93.5 mL/min/40A 2.91±0.43a 14.98±0.33
a 14.66±0.33
b 15.48±0.43
ab
US 93.5 mL/min/80A 2.88±0.32a 14.76±0.85
a 14.33±0.46
b 15.23±0.82
b
US 93.5 mL/min/100A 2.81±0.28a 14.62±0.98
a 14.01±0.54
bc 15.07±0.33
bc
Values are means and standard deviations of triplicate determinations. a-c
Means with different
exponents in each columns are significantly different (p ≤ 0.05).
2.3.6 Anthocyanin Degradation Kinetics
The thermal degradation of anthocyanin in blueberry juice was studied for the TP
temperatures (80, 85 & 90 °C) used in the experiment. Figure 2.4, illustrates the degradation
of blueberry anthocyanins as a function of heating time at each temperature.
The thermal degradation of blueberry anthocyanins follows first-order reaction
kinetics with temperature, which was indicated by having correlation coefficient (R2)
values
of 0.9856, 0.9650 and 0.9430 for temperatures 80, 85 and 90 °C respectively (Table 2.10).
Also the graph of C/CO with time is linear (Figure 2.4). This observation is in accordance
with the research work done by Guimarăes et al. (2010) regarding degradation kinetics in
blueberry juices using temperatures of 40, 50, 60, 70 and 80 °C. Similarly, degradation of
anthocyanin follows a first-order reaction in juices such as sour cherry and strawberries
(Brunton and others 2010a; Carle and others 2007).
46
Figure 2.4 Degradation of anthocyanins in blueberry juice during heating at 80, 85 and 90 °C.
Each point represents average of three replicates. Values are means of triplicate
determinations
The anthocyanin degradation rate increases with increasing temperature with higher
temperatures causing greater degradation (Hendrickx and others 2010). This can also be
demonstrated by the rate constant (k) values obtained for different temperatures. The k value
varied from 0.0009, 0.001, 0.0012 sec-1
at 80, 85 and 90 °C respectively (Table 2.10). The
reported k values for these temperatures are much lower than previous research values.
Guimarăes et al. (2010) reported a k value of 0.0022 at 80°C. The t1/2 value was 12.84, 11.55
and 9.63 h at 80, 85 and 90 °C temperatures respectively (Table 2.10). These values are much
higher than the previous research findings. Guimarăes et al. (2010) indicated the t1/2 value of
blueberry juice at 80°C as 5.11 hr, and they did not study the kinetics beyond 80 °C. The high
t1/2 value indicates greater stability of anthocyanins in different heating temperatures where
our results show a reduced stability with increasing temperature from 80 to 90 °C. Some
researchers argue that the difference in t1/2 value of anthocyanins present in different types of
juices will be a result of different anthocyanin forms and possible interaction of anthocyanin
with other fruit constituents (Acosta and others 2009). According to previous research work
the anthocyanin stability in blueberry juice is higher than that in the juices from blackberry
-0.35
-0.3
-0.25
-0.2
-0.15
-0.1
-0.05
0
0 50 100 150 200 250 300 350
An
thocy
an
in c
on
ten
t ln
(C/C
0)
Time (Seconds)
Degradation rate of anthocyanins
80 C
85 C
90 C

47
due to greater t1/2 at the same temperature (Guimarăes and others 2010; Buckow and others
2010).
Table 2.10 Effect of temperature on k and t1/2 values of anthocyanin degradation in blueberry
juice
k – degradation rate constant; t1/2 -- half-life; R2- square of correlation coefficient. Values are
means and standard deviations of triplicate determinations
Figure 2.5. The Arrhenius plot for degradation of anthocyanin pigments in blueberry juice.
Values are means of triplicate determinations
The temperature dependence of the rate constants is shown using the Arrhenius plot
(Figure 2.5). According to our results (Table 2.11), the activation energy of blueberry
anthocyanins is 30.64 kJmol-1
. This value is much lower than the value of 80.42 determined
by Guimarăes et al., (2010). Higher activation energy indicates that a smaller temperature is
required in order to degrade a specific compound (Prapulla and others 2005).
y = -3.6846x + 3.4071 R² = 0.9742
-7.05
-7
-6.95
-6.9
-6.85
-6.8
-6.75
-6.7
2.74 2.75 2.76 2.77 2.78 2.79 2.8 2.81 2.82 2.83 2.84
ln k
1/T × 1000 (k)
Arrhenius plot of anthocyanin degradation
Temperature (°C) k × 103
(sec-1) t1/2 (h) R2
80 0.9±0.03 12.84±0.88 0.9856
85 1.0±0.01 11.55±0.54 0.9650
90 1.2±0.01 9.63±0.21 0.9430

48
Table 2.11 Activation energy of anthocyanin degradation
Temperature (°C) T (Kelvin) k
Activation energy
(kJmol-1
)
80 353.15 0.0009 30.64
85 358.15 0.001
90 363.15 0.0012
k – degradation rate constant; T – absolute temperature. Values are means of triplicate
determinations
The Q10 measures degradation rate of anthocyanin as a consequence of increasing the
temperature by 10 °C. The temperature coefficient (Q10) of blueberry anthocyanin
degradation for the temperature range of 80 to 90 °C is 1.333±0.02. This value follows the
same pattern of Q10 obtained in blueberry juice studies conducted by Guimarăes et al.,
(2010). They observed a reduction of Q10 value in juices with increasing temperature from 40
to 80 °C. They reported a value of 2.95 at 60 to 70 °C and a value of 1.67 at 70 to 80 °C. In
their study, the high Q10 value related to the greater dependence of anthocyanin degradation is
occurred at the temperature range of 60 to 70 °C. In present study, low Q10 value at the
temperature range of 80 to 90 °C shows a lower influence of temperature at this range on
anthocyanin degradation kinetics.
2.4. Conclusions
The present study demonstrated that US processing preserves the anthocyanins and
juice color better than conventional TP while still providing significant reduction in microbial
counts of APC, TC, yeast and mold. Thus US has the potential, with further development, to
be an alternative to thermal pasteurization and which would result in a higher quality juice.
The continous flow method of US method used in this study allows continous juice
processing (as does commercial thermal pasteurization equipment), which should be useful
for commercial implementation. However, optimum US conditions of flow rate and
amplitude must be estabilished in order to provide a 5-log reduction in pertinent
microorganisms present in the juices. Combining other antimicrobial methods might provide
49
more inactivation than by US alone. The degradation kinetic studies of anthocyanin with
temperature allows prediction of possible of juice quality loss during TP.
50
CHAPTER 3 EFFECTS OF BLUEBERRY (VACCINIUM CORYMBOSUM) JUICE
ON LIPID OXIDATION DURING SPRAY DRYING OF MICROENCAPSULATED
SALMON OIL AND MENHADEN OIL
3.1 Introduction
Microencapsulation is defined as a process by which small particles of core material
such as fish oil and flavors are enveloped within a wall material to form micro size capsules
(Assadpoor and others 2008a; Drusch and Schwarz 2006b; Huang and Klaypradit 2008).
Although many methods are available for microencapsulation, spray drying is the most
common technique employed to produce micro capsules food related applications because
equipment is readily available for producing good quality micro-capsule powders (Assadpoor
and others 2008b). Also, spray drying is known to be an economical (Ersus and Yurdagel
2007; Drusch and Mannino 2009b) and flexible operation. The spray drying
microencapsulation process involves conversion of liquid oil or flavors in the form of an
emulsion into a dry powder, protecting the encapsulated material from further oxidation.
Spray drying is a one-step continuous operation of drying involving several stages such as
feed atomization, mixing of hot air and feed spray, evaporation and separation of produced
powders (Langrish 2009).
Fish oils have recently received greater attention because of the presence of omega-3
type long chain polyunsaturated fatty acids (PUFA). Polyunsaturated fatty acids especially
omega 3 PUFA such as eicosapentaenoic acid (EPA) and docosahexaenoic acid (DHA) have
been shown to have preventive and curative effects on cardiovascular disease, cancers and
impediments to infant neural development (Law and others 2001; Kruif and others 2001;
Jaworska and others 2007; Bralley and others 2009; Gilmore and others 2000). Menhaden
(Brevoortia patronus and Brevoortia tyrannus) oil has been reported to have an EPA and
DHA content of 12.8 – 15.4% and 6.0 – 9.1% respectively (IFFO 2005) whereas salmon
51
(Oncorhynchus nerka) oil levels were 13% and 18% (Beindroff and Zidam, 2010)
respectively. According to previous research findings (Behchtel and Wu 2008; Garg and
others 2006), decreased rate of cardiovascular incidences were reported in populations with
greater fish consumption. Most western diets are rich in saturated fats compared to
unsaturated fatty acids (Laufenberg and Kolanowski 2006). The American Heart Association
recommends intake of EPA and DHA for coronary heart disease patients and people having
high triglyceride levels, at levels of 1g per day and 2 -4 g/day respectively (Appel and others
2002; Browning and others 2006). Instead of changing the dietary pattern of these
individuals, which is difficult to do in practice, increased intake of fish oil can be achieved by
food enrichment with fish oil. But direct incorporation of fish oil into food is associated with
problems such as reduced sensory acceptance and reduced product shelf life. The PUFA are
highly unstable and undergo quick oxidation resulting in formation of toxic hydro-peroxides
and objectionable off flavors (Kolanowski and others 2006). Microencapsulation of fish oil is
a technique developed to overcome these constraints. Successful fish oil microencapsulation
results in the prevention of contact of the oil with oxygen or metal ions, direct light exposure
and the trapping off flavors (Beindroff and Zidam 2010; Auty and others 2001; Bohin and
others 2006). Although spray drying is the most popular microencapsulation technique used
in the food industries, it is known to induce lipid oxidation and produce powders with porous
structure (Liu and Yang 2011; Huang and Klaypradit 2008). Though low spray drying
temperatures are advantageous, fish oil microencapsulation requires temperatures as high as
170°C (Drusch and others 2006c; Chambin and others 2007) which might induce lipid
oxidation during the process of spray drying (Drusch and others 2009c). Beindroff and
Zidam (2010) suggested the use of nitrogen gas while spray drying and producing powders
using two step processes where the particles are initially half dried using a spray drier and
further dried using a filtermat spray dryer or fluidized bed dryer (Bhandari and Jafari 2007a).

52
Although these methods reduced lipid oxidation, they significantly increased the cost of
production. The addition of antioxidants such as tocopherol or trolox C into the fish oil
emulsions has been suggested for increasing the storage stability of fish oil. Even though
these antioxidants can act as pro-oxidants in higher concentrations, it was found that
combination of antioxidants such as tocopherol, ascorbyl palmitate and rosemary extract
significantly retarded the auto-oxidation of fish oil microcapsules upon storage (Baik and
others 2004). The addition of synthetic antioxidants into fish oil microcapsules may provide a
negative perception among health conscious consumers. The research related to incorporation
of natural antioxidants into fish oil emulsions is scant. Natural antioxidants might reduce the
possible lipid oxidation occurring during the process of emulsification (ultra-sonication) and
spray drying, and provide greater storage stability in microencapsulated powders (even with a
high load of core material) and still retain a positive perception among consumers.
Berries, especially blueberries (Vaccinium corymbosum) are considered to be a good
source of phenolic compounds. These fruits have received much attention owing to their high
antioxidant activity as compared to many other fruits and vegetables. Polyphenols and
anthocyanins present in blueberries are known to have a positive role in human health and
disease prevention (Brownmiller and others 2008; Wang and Zheng 2003). The berry
antioxidants can scavenge free radicals in oils, and also have the ability to chelate pro-
oxidants such as metal ions. This could result in reduced lipid oxidation and increased fish oil
stability during emulsification, spray drying, and subsequent storage. The objectives of this
study were to: (1) determine the effect of blueberry juice addition on lipid oxidation during
emulsification and spray drying of microencapsulated menhaden and microencapsulated
salmon oil; (2) evaluate their emulsion and powder characteristics; and (3) estimate their
microencapsulated powder production rate and energy efficiency.

53
3.2 Materials and Methods
3.2.1 Preparation of Blueberry Juice (BJ)
Three batches of fresh imported high bush blueberries (Vaccinium corymbosum L.)
obtained locally were steam blanched using a steamer for 2 min and rapidly cool down to 10
°C using an ice water bath. Berries were then blended using a mechanical blender (Magic
bullet, China) for 1 min and the mash was centrifuged at 2037.6×g using a centrifuge (J2-HC-
TB-002 model, Beckman instruments Inc., California, USA) for 20 min at 4 °C to separate
the liquid phase from the solid phase.
3.2.2 Physico Chemical Properties of BJ
Blueberry juice yield was calculated as: (weight of juice/initial berry weight)*100.
Total monomeric anthocyanin content (TAC) of the blueberry juice was determined by the
pH differential method of AOAC 2005.02 (AOAC, 2005b) as described in section 2.2.6. The
results were expressed as mg of cyanidin-3-glucoside equivalents of per liter of juice.
Total phenol content (TPC) of blueberry juice was determined according to the Folin-
ciocalteau method (Sinkard and Singleton 1997) as described in section 2.2.7. The results are
expressed as milligrams of gallic acid equivalent (GAE) per liter of juice.
The antioxidant activity (AA) of blueberry juice was determined by employing the
DPPH radical scavenging assay (1,1-Diphenyl-2-picryl-hydrazyl) according to the method of
Arlorio et al. (2009) with some modifications. More details of the analyses were provided in
2.2.8. The results were expressed as µmol of trolox equivalent (TE) per 100 mL of juice.
Juice pH value was measured using a bench top pH meter (Symphony, VWR
Scientific 5B70P, PA, USA). The titratable acidity was determined using a titration method
as described in section 2.2.9, and results were expressed as percent total organic acid on the
basis of citric acid which is the predominant acid present in blueberries (Ehlenfeldt et. al.
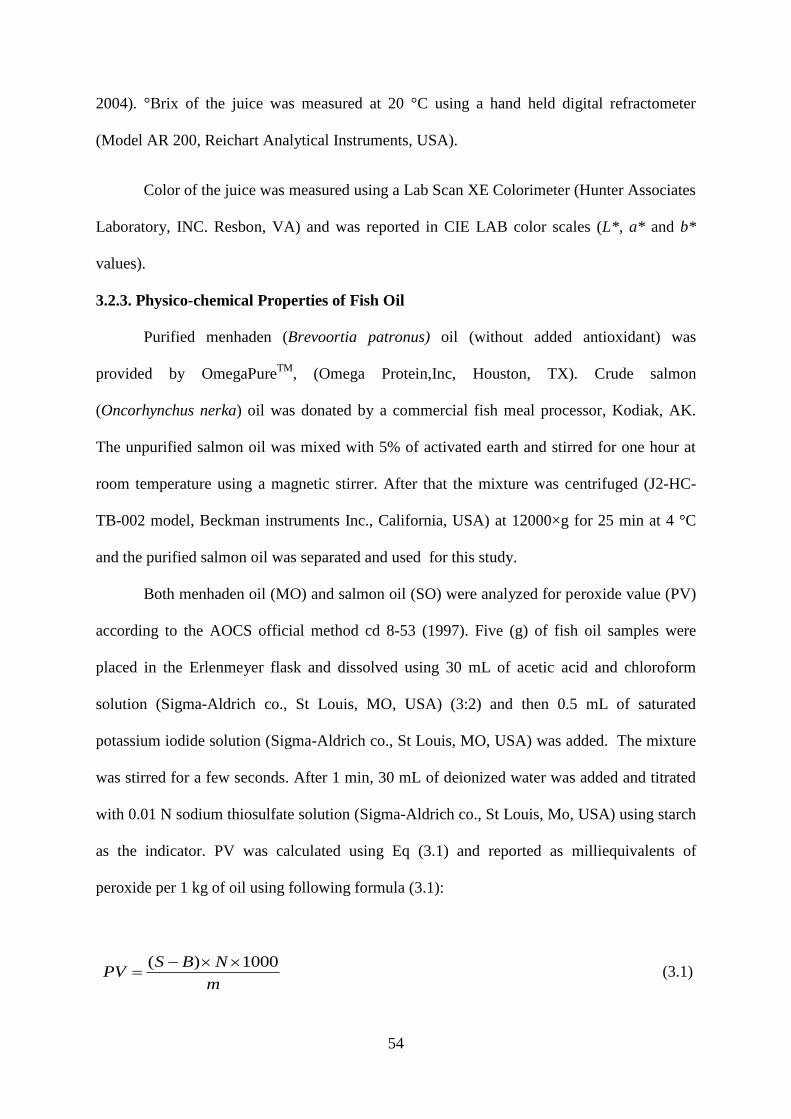
54
2004). °Brix of the juice was measured at 20 °C using a hand held digital refractometer
(Model AR 200, Reichart Analytical Instruments, USA).
Color of the juice was measured using a Lab Scan XE Colorimeter (Hunter Associates
Laboratory, INC. Resbon, VA) and was reported in CIE LAB color scales (L*, a* and b*
values).
3.2.3. Physico-chemical Properties of Fish Oil
Purified menhaden (Brevoortia patronus) oil (without added antioxidant) was
provided by OmegaPureTM
, (Omega Protein,Inc, Houston, TX). Crude salmon
(Oncorhynchus nerka) oil was donated by a commercial fish meal processor, Kodiak, AK.
The unpurified salmon oil was mixed with 5% of activated earth and stirred for one hour at
room temperature using a magnetic stirrer. After that the mixture was centrifuged (J2-HC-
TB-002 model, Beckman instruments Inc., California, USA) at 12000×g for 25 min at 4 °C
and the purified salmon oil was separated and used for this study.
Both menhaden oil (MO) and salmon oil (SO) were analyzed for peroxide value (PV)
according to the AOCS official method cd 8-53 (1997). Five (g) of fish oil samples were
placed in the Erlenmeyer flask and dissolved using 30 mL of acetic acid and chloroform
solution (Sigma-Aldrich co., St Louis, MO, USA) (3:2) and then 0.5 mL of saturated
potassium iodide solution (Sigma-Aldrich co., St Louis, MO, USA) was added. The mixture
was stirred for a few seconds. After 1 min, 30 mL of deionized water was added and titrated
with 0.01 N sodium thiosulfate solution (Sigma-Aldrich co., St Louis, Mo, USA) using starch
as the indicator. PV was calculated using Eq (3.1) and reported as milliequivalents of
peroxide per 1 kg of oil using following formula (3.1):
( ) 1000S B N
PVm
(3.1)
55
Where B is the volume of titrant (mL) of blank; S is volume of titrant (mL) of sample;
N is normality of sodium thiosulfate solution, and m is mass (Kg) of the oil sample.
p-andisine value (p-AV) which represents secondary lipid oxidation products in the
oils was estimated using the method AOCS official method cd 18-90 (1997). One gram (g)
of fish oil samples were placed in a 25 mL volumetric flasks and dissolved with isooctane
(2,2,4-trimethylpentane) obtained from Sigma-Aldrich Co., St Louis, MO, USA. The
absorbance (Ab) of these solutions was measured at 350 nm using a spectrophotometer
(Thermo Fisher Scientific, Vernon Hills, IL, USA). Then 5 mL of this fish oil solution was
transferred into a test tube and 1 mL of p-anisidine (Sigma-Aldrich co., St Louis, Mo, USA)
reagent (0.25 g/100 mL) was added. After 10 min, the absorbance (As) of this mixture was
measured at 350 nm using a reference blank. The p-AV was calculated using the formula
(3.2).
p-AV25 (1.2 )As Ab
m
(3.2)
The Totox values of the oils were calculated using the equation: Totox = AV + 2PV
as described by AOCS (cg 3-91, 2007). Totox provides the overall oxidation state of the oils.
The color of the fish oils were measured using a Lab Scan XE Colorimeter (Hunter
Associates Laboratory, INC. Resbon, VA) and was reported in CIE LAB color scales (L*, a*
and b* values). Chroma and hue angle value were calculated using the Equations (3.3) and
(3.4), respectively. The negative hue angle values were converted into positive values by
adding 180°, in order to make them fall in the 90° – 180° quadrant (+b* = yellow; -a* =
green).
Chroma = [a*2 + b*
2]1/2
(3.3)
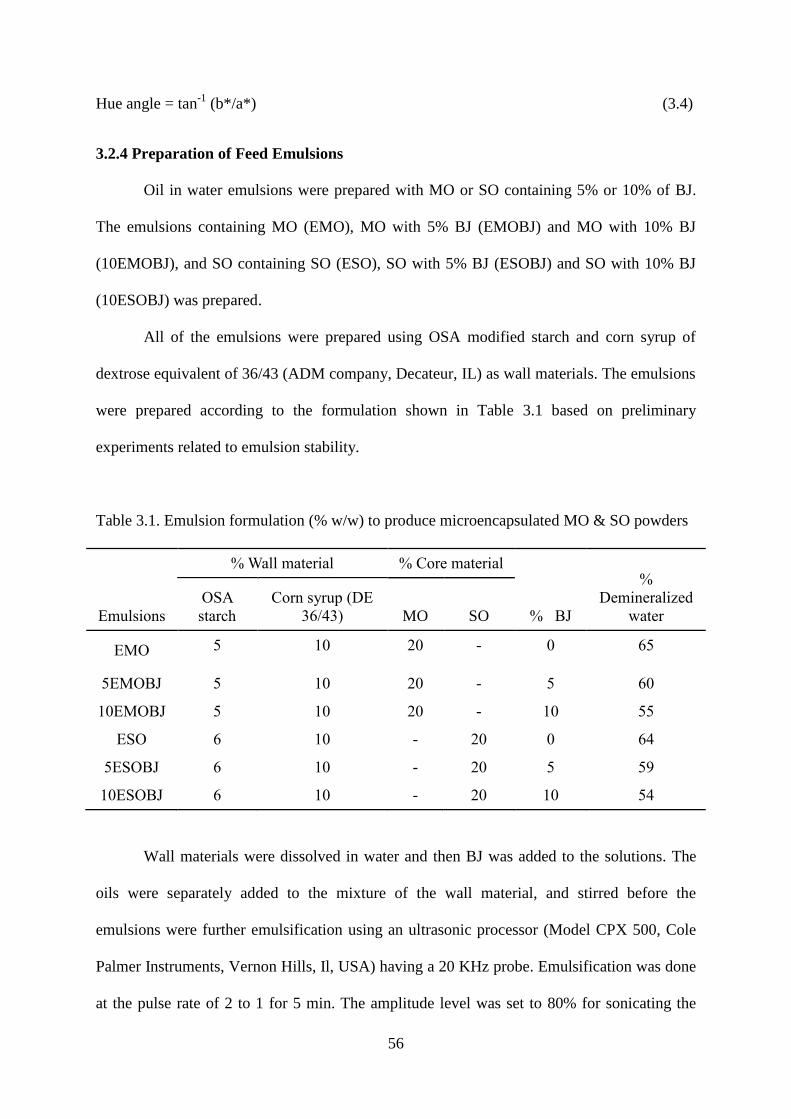
56
Hue angle = tan-1
(b*/a*) (3.4)
3.2.4 Preparation of Feed Emulsions
Oil in water emulsions were prepared with MO or SO containing 5% or 10% of BJ.
The emulsions containing MO (EMO), MO with 5% BJ (EMOBJ) and MO with 10% BJ
(10EMOBJ), and SO containing SO (ESO), SO with 5% BJ (ESOBJ) and SO with 10% BJ
(10ESOBJ) was prepared.
All of the emulsions were prepared using OSA modified starch and corn syrup of
dextrose equivalent of 36/43 (ADM company, Decateur, IL) as wall materials. The emulsions
were prepared according to the formulation shown in Table 3.1 based on preliminary
experiments related to emulsion stability.
Table 3.1. Emulsion formulation (% w/w) to produce microencapsulated MO & SO powders
Emulsions
% Wall material % Core material
% BJ
%
Demineralized
water
OSA
starch
Corn syrup (DE
36/43) MO SO
EMO 5 10 20 - 0 65
5EMOBJ 5 10 20 - 5 60
10EMOBJ 5 10 20 - 10 55
ESO 6 10 - 20 0 64
5ESOBJ 6 10 - 20 5 59
10ESOBJ 6 10 - 20 10 54
Wall materials were dissolved in water and then BJ was added to the solutions. The
oils were separately added to the mixture of the wall material, and stirred before the
emulsions were further emulsification using an ultrasonic processor (Model CPX 500, Cole
Palmer Instruments, Vernon Hills, Il, USA) having a 20 KHz probe. Emulsification was done
at the pulse rate of 2 to 1 for 5 min. The amplitude level was set to 80% for sonicating the

57
emulsions. During the emulsification process the Temperature of sample containers were kept
at 20 oC using an ice bath.
3.2.5 Emulsion Stability, pH and Color
The stability of the emulsions was evaluated according to a method described by Min
and others (2003) with modifications. Five grams of an emulsion sample was placed in a 10
mL centrifuge tube, and stored at -20 °C for 2 days. After that the sample was allowed to
thaw at room temperature for one hour. Then the sample was centrifuged at 15000×g for 40
min at -2 °C, and the amount of oil separated was measured. The oil recovery percentage was
calculated using formula 3.5. The emulsion stability was determined using the formula 3.6.
Oil recovery percentage = weight of oil recovered × 100 % (3.5)
Emulsion weight (5g)
Emulsion stability = 100% – Oil recovery percentage (3.6)
Emulsion pH value was measured using a bench top pH meter (Symphony, VWR
Scientific 5B70P, PA, USA). Color of the emulsions were measured using a Lab Scan XE
Colorimeter (Hunter Associates Laboratory, INC. Resbon, VA) and was reported in CIE
LAB color scales (L*, a* and b* values).
3.2.6 Emulsion Rheological Properties
Emulsion flow properties and viscoelastic properties were determined using an AR
2000ex Rheometer (TA Instruments, New Castle, DE). The Rheometer was fitted with a plate
geometry employing 40 mm diameter and 400 µm sample gap. The emulsion sample was
placed on the temperature controlled plate and allowed to equilibrate at temperatures of 5, 15
and/or 25 ºC. The shear stress of the emulsions was measured at shear rates of 1 to 200 s-1
.
The emulsion flow properties were analyzed using the power law (Equation 3.7) model where

58
ζ represents shear stress (Pa); γ symbolizes shear rate (s-1
); K represent consistency index
(Pa.sn), and n symbolize flow behavior index.
ζ = k γn
(3.7)
A linear plot of log ζ and log γ was constructed, and the magnitude of k and n were
determined from the intercept and slope respectively. The k, n and apparent viscosity of the
emulsions were reported. A plot was constructed for each temperature of shear viscosity
against shear rate.
The viscoelastic properties of emulsions were determined by conducting a frequency
sweep test using a frequency range of 0.1 to 10 Hz, and a constant temperature of 25 °C. The
storage (G`) and loss (G``) modulus (Pa) curves against angular frequency were obtained
from Universal Analysis (TA instrument) software, and they were calculated according to the
following Equations 3.8 and 3.9. The lost tangent value was calculated (Equation 3.10) using
G` and G``. A plot was constructed of vs. angular frequency.
0
0
G` Cos
(3.8)
0
0
G`̀ Sin
(3.9)
``
`
GTan
G (3.10)
Where tan represents the lost tangent, represents generated stress and
represents oscillating strain.
3.2.7 Preparation of Spray Dried Microcapsules
The infeed emulsions were transformed into microcapsules using a pilot plant spray
drier (FT 80 Tall Form Spray Dryer, Armfiled Inc., Jackson, NJ, USA) at the Food
Processing Pilot Plant, Louisiana State University Agricultural Center following a co-current
drying condition (Figure 3.1). The spray drier is composed of a cylindrical chamber of 1.7 m
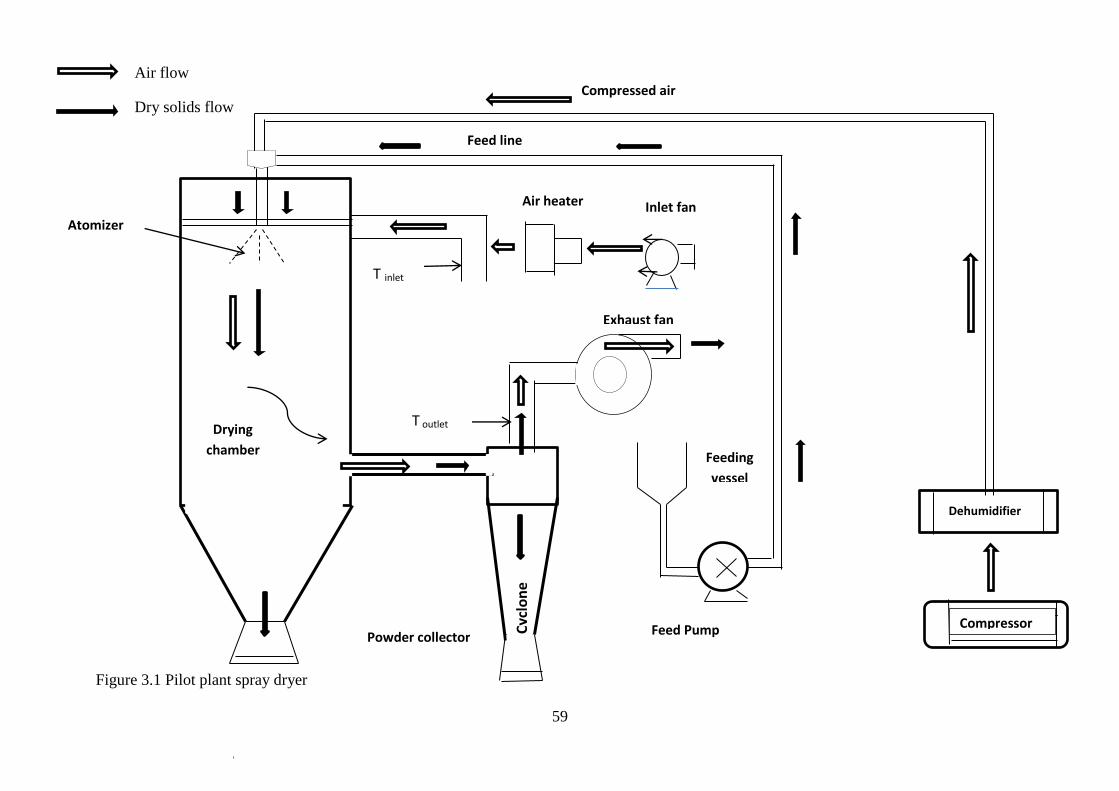
59
Figure 3.1 Pilot plant spray dryer
Compressed air
Feed line
Air heater
HEAheateInlet fan
Exhaust fan
Atomizer
Drying
chamber
Cyc
lon
e
Powder collector
T inlet
T outlet
Feeding
vessel
Feed Pump
Dehumidifier
Compressor
Air flow
Dry solids flow
60
height and 0.3 m diameter, and equipped with a pressurized air atomizing nozzle and
automated introduction of the feed into the drying chamber through a feed pump. The
operational conditions of the spray drying were: inlet air temperature 170 °C, and nozzle air
gauge pressure of 0.7 bars. The emulsions of EMO, 5EMOBJ and 10EMOBEJ were spray
dried to produce microencapsulated powders of MMO, 5MMOBJ and 10MMOBJ
respectively. Similarly emulsions of ESO, 5ESOBJ and 10ESOBJ were spray dried to
produce powders of MSO, 5MSOBJ and 10MSOBJ respectively. The dried powders were
collected and stored in amber bottles at 4°C for further analysis.
3.2.8 Lipid Oxidation Parameters of Feed Emulsions and Microcapsules
The microencapsulated oil from emulsions was extracted out according to a method
described by Shahidi and others (2007). Ten grams of emulsion were mixed with 100 mL of
chloroform (Sigma-Aldrich co., St Louis, MO, USA) 50 mL of methanol (Sigma-Aldrich co.,
St Louis, MO, USA), and a few crystals of tert-butylhydroquinone (TBHQ). The mixture was
centrifuged (J2-HC-TB-002 model, Beckman instruments Inc., CA, USA) at 12000×g at 4 oC
for 5 min. The centrifuged mixture was transferred into a separatory funnel, and the
chloroform layer was removed. Oil was recovered by evaporating the chloroform layer using
a rotary evaporator (Rotavapor, Model 121, Bűchi Co., Switzerland) under vacuum at 40 °C.
The same technique was used to extract oil from microcapsules with minor
modifications. Ten grams of microencapsulated powders were dissolved in 50 mL of 0.88%
(w/w) KCl (Sigma-Aldrich co., St Louis, Mo, USA) solution. Then 100 mL of chloroform, 50
mL of methanol, and a few crystals of tert-butylhydroquinone (Sigma-Aldrich co., St Louis,
MO, USA) were added into the mixture. The mixture was centrifuged as previously described
and the oil was recovered from the solvent at 40 °C.
61
The recovered oil from emulsions and microcapsules were analyzed for PV (AOCS cd
8-53, 1997), p-AV (AOCS cd 18-90, 1997), Totox (AOCS cg 3-91, 1997) as described in
section 3.2.3.
3.2.9 Fatty Acid Methyl Ester (FAME) Profile Analysis
Fatty acid methyl esters (FAME) of MO, SO, and oil extracted from the
microcapsules were prepared according to the method described by Maxwell and Marmer
(1983). Approximately 20 mg of oil sample was mixed with 4.5 mL of isooctane, 500 µl of
internal standard (10 mg methyl tricosanoate (23:0)/mL isooctane) and 500 µl of 2N KOH
(1.12g/10 mL methanol) in a glass test tube. The contents were vortexed for 60 s and
centrifuged for 3 min at 3200 rpm. The lower methanol layer was discarded. One mL of
saturated ammonium acetate solution was added into the tube and stirred with the vortex.
The mixture was centrifuged and the aqueous layer was removed and discarded. The above
procedure was repeated with 1 mL of water instead of ammonium acetate. Two to three g of
anhydrous sodium sulfate was placed in the tube and the mixture was vortexed and then
allowed to stand for 30 min. Then the mixture was centrifuged for 15 min at 3200 rpm. The
upper isooctane layer (0.5 mL) was transferred into an amber GC vial. 0.5 mL of isooctane
added and contents were stored at -70 °C for further analysis.
The fatty acid methyl esters were analyzed using a gas chromatograph (model 7890A
Agilent) coupled with a flame ionization detector (Agilent Technologies Inc, Santa Clara
CA., USA). The separation of the methyl esters was conducted using a FAMEWAXTM
(RESTEK, USA) capillary column (30m × 0.32 mm i.d. × 0.25 µm, Restek, Bellefonte, PA).
Data was collected and analyzed with the GC ChemStation program (ver E.02.00.493 Agilent
Technologies, Inc.). Helium gas was used at an average velocity of 64cm/sec as a carrier gas.
The injector and detector temperatures were set to 250 °C and 280 ºC respectively. A split
62
injection was used (50:1 split ratio), and the injection volume was 1 µl. The following oven
program was employed: 195 ºC to 240 ºC at a rate of 5 ºC/min for 9 min and holding time of
2 min for a total run time of 11 min. The peaks were identified using retention times of
standards: Supelco 37, PUFA #1, PUFA #3, and cod liver oil from Supelco (Bellefonte, PA).
Data was expressed as percent of total integrated area (Oliveria and Bechtel 2005).
3.2.10 Microencapsulation Efficiency Analysis
Encapsulation efficiency designates the amount of core material encapsulated within
the powder particles. The microencapsulation efficiency (ME) of spray dried powders were
calculated using surface oil content and total oil content according to 3.11.
ME = Total oil content – Surface oil content × 100 (3.11)
Total oil content
Surface oil content refers to the free or extractable oil around microcapsules. The
surface oil contents of microencapsulated fish oil powders were determined using petroleum
ether as the extraction solvent using a method described by Assadpoor and others (2008a)
with minor modifications. Ten gram of microencapsulated powder was added to 100 mL of
petroleum ether (Sigma-Aldrich co., St Louis, MO, USA), and the resultant suspension was
manually shaken. Then the suspension was placed on an automatic shaker (Lab-Line 3525
incubator shaker, International MI-SS Inc. Corona, CA) for 15 min and then the mixture was
filtered using a Whatman 4 filter paper (Whatman International Ltd, England). The powder
residue was washed using 5 mL of the solvent three times. The filtrate solution and washed
solvent was transferred into a round bottom flask and the solvent was evaporated at 60 ºC
using a rotary evaporator (Rotavapor, Model 121, Bűchi Co., Switzerland) under vacuum at 4
ºC to recover the oil. After evaporation, the flask was dried in a hot air oven (VWR
International, PA, USA) at 103 ºC for 1 h. The surface oil content was measured based on the

63
weight difference between the initial clean flask and the flask with the extracted oil residue.
The results were expressed as amount of surface oil content per gram of microcapsules.
The total oil content of the microcapsules which include both encapsulated and
surface oil, was determined as described by Augustin and others (2009) with some
modifications. The microcapsules (0.5 g) were initially digested with 1 mL of 36% w/w
hydrochloric acid (Sigma-Aldrich co., St Louis, MO, USA) in a screw cap test tube at 100 ºC
for 10 min. The tube was cooled to room temperature and 10 mL of ethanol (96% v/v)
(Sigma-Aldrich co., St Louis, MO, USA) was added. Twenty filve mL of Petroleum ether
(Sigma-Aldrich co., St Louis, MO, USA) and twenty five mL of diethyl ether (1:1) (Sigma-
Aldrich co., St Louis, Mo, USA) was used to extract the oil from the mixture. The extracted
solvent was removed using a rotary evaporator (Rotavapor, Model 121, Bűchi Co.,
Switzerland) and the flask with the residue was dried using a hot air oven at 100 ºC for 1 h.
The total oil content was calculated by gravimetric difference and expressed as the oil content
per gram of microcapsules.
3.2.11 Color of Microencapsulated Fish Oil Powder
The color of the microcapsules was measured using a Lab Scan XE Colorimeter
(Hunter Associates Laboratory, INC. Resbon, VA) and was reported in CIE LAB color scales
(L*, a* and b* values).
3.2.12 Morphology of Microcapsules
The morphology of microcapsules was observed using a scanning electron
microscope (SEM) using an acceleration voltage of 5 kV. Microcapsules were mounted onto
an aluminum SEM specimen stub using a double sided sticky tape, and coated with
gold:palladium (60:40) using S150 sputter coater (Edwards High Vacuum International,
64
Wilmington, MA) to make the samples conductive. The coated stubs were examined and
imaged with SEM.
3.2.13 Particle Size Distribution Analysis
The particle size of the microcapsules was measured using a Microtrac S3500 light
scattering system (MicroTrac, Largo FL, USA). The system consists of three fixed 780 nm
solid state lenses with a computerized single lens alignment. The measurement capacity was
from 0.24 to 2800 mm diameter. Initially a certain amount of powder sample was placed in
the test chamber with circulating ethyl alcohol (Sigma-Aldrich co., St Louis, MO, USA).
Before each test a 10 s period of ultrasound mixing was conducted at 20 W. The sample was
pumped through the sample cell at 40% of the maximum flow rate. Light was scattered from
the tri lasers from low to high angles (0-163°), and the complete light scattering pattern was
collected. Modified Mie-scattering technique was employed to calculate the volume
distribution of particle size using light scattering pattern. Results were noted as 50th
(median)
and 90th
percentiles of the microcapsules sizes.
3.2.15 Statistical Analysis
Mean values and standard deviations of triplicate experiments were reported. Analysis
of variance (ANOVA) was carried out to determine the difference among treatments means
(SAS Version 8.2, SAS Institute Inc., Cary, NC) using the post hoc Tukey's Studentized
Range Test.
3.3. Results and Discussion
3.3.1 Physico-chemical Properties and Percent Yield of BJ
Blueberry juice yield was 61% (w/w) of liquid matter separated from the residue.
Blueberry seeds, mucilage and pectin were contained in the residue. BJ contained 106.38 of
TAC (mg/L cya-3-glu) and 3273 of TPC (mg/L gallic acid equivalents) (Table 3.2). The BJ

65
had high a* and low L* values, which indicated the juice was dark reddish purple in color.
The BJ was acidic in nature having a pH value of 3.23 and titratable acidity of 0.83 (citric
acid equivalents).
Table 3.2 Physico-chemical properties and yield (%) of BJ
a Expressed in mg/l of cyanindin-3-glucoside equivalents.
b Expressed in mg/l gallic acid equivalents.
cExpressed in µmol/100 mL Trolox equivalents.
dExpressed based on ctiric acid.
eThe values are taken at 20 °C.
Values are means and SD of triplicate determinations. BJ=blueberry juice; TAC= total
anthocyanin content; TPC = total phenol content; AA=antioxidant activity.
Blueberries showed high antioxidant activity due to the presence of anthocyanins and
polyphenols. Blueberries contain myricetin, quercetin, chlorogenic acid and kaempferol as
phenolic compounds, where chlorogenic acid contributes mostly to the antioxidant activity. It
has been reported that Anthocyanin contributes equally as phenolic acid related to antioxidant
activity of blueberries (Wang and Zheng 2003).
BJ yield (%) 61.04±3.93
TAC a 106.38±9.54
TPC b 3273±22.31
AA c 3021.70±232.22
⁰Brixe 11.3 ±1.76
pHe 3.23±0.34
Percent Titratable acidity d 0.83 ±0.03
Color L* 6.65±0.03
a* 32.11±0.04
b* 11.32±0.05
66
According to the US Department of Agriculture, blueberries ranked as number one in
antioxidant activity based on ORAC assay (oxygen radical absorbing capacity) compared to
40 common fresh fruits and vegetables. Fresh blueberries contain 2400 ORAC units/100
grams (Booth and others 1998; Cao and others 1998), which is higher than other berries
including grapes, strawberries, raspberries and cranberries. Several methods are available to
determine antioxidant activity, where in this study DPPH (2,2-diphenyl-1-picrylhydrazyl)
assay was used to measure the antioxidant activity of BJ. The DPPH mainly addresses the
radial scavenging ability of an antioxidant (Faria and others 2005) which is appropriate to
indicate antioxidant activity in a lipid system, where lipid oxidation is carried out by a series
of free radical reactions. The value obtained (3022 µmol TE/100g) (Table 3.2) was lower
than the values reported in the previous study related to blueberry fruit based on DPPH assay.
Bi et al. (2010) reported a total antioxidant activity (5630-7600 µmol TE/100g) based on
DPPH assay in many blueberry cultivars.
Antioxidant compounds, such as phenolic acids, polyphenols and flavonoids, present
in the berries are able to scavenge free radicals as peroxide, hydro-peroxide and lipid
peroxide, and thus inhibit oxidative mechanisms that lead to lipid oxidation. Often, for ease
of comparison antioxidant activity of these compounds are represented based on a common
reference standard such as trolox (6-hydroxy-2,5,7,8-tetramethylchroman-2-carboxylic acid).
Many previous research studies represent the total antioxidant activity of different fruits and
vegetables by combining lipophilic and hydrophilic antioxidant values. Frankel (1996) has
reported that lipophilic antioxidant including tocopherol and ascorbyl palmitate are more
effective in oil-in-water emulsions than in bulk oil compared to hydrophilic antioxidants
(trolox and ascorbic acid). Blueberries are found to have both hydrophilic and lipophilic
antioxidants which make them able to work effectively in both oil in water emulsions and
bulk oil (Beecher and others 2004).
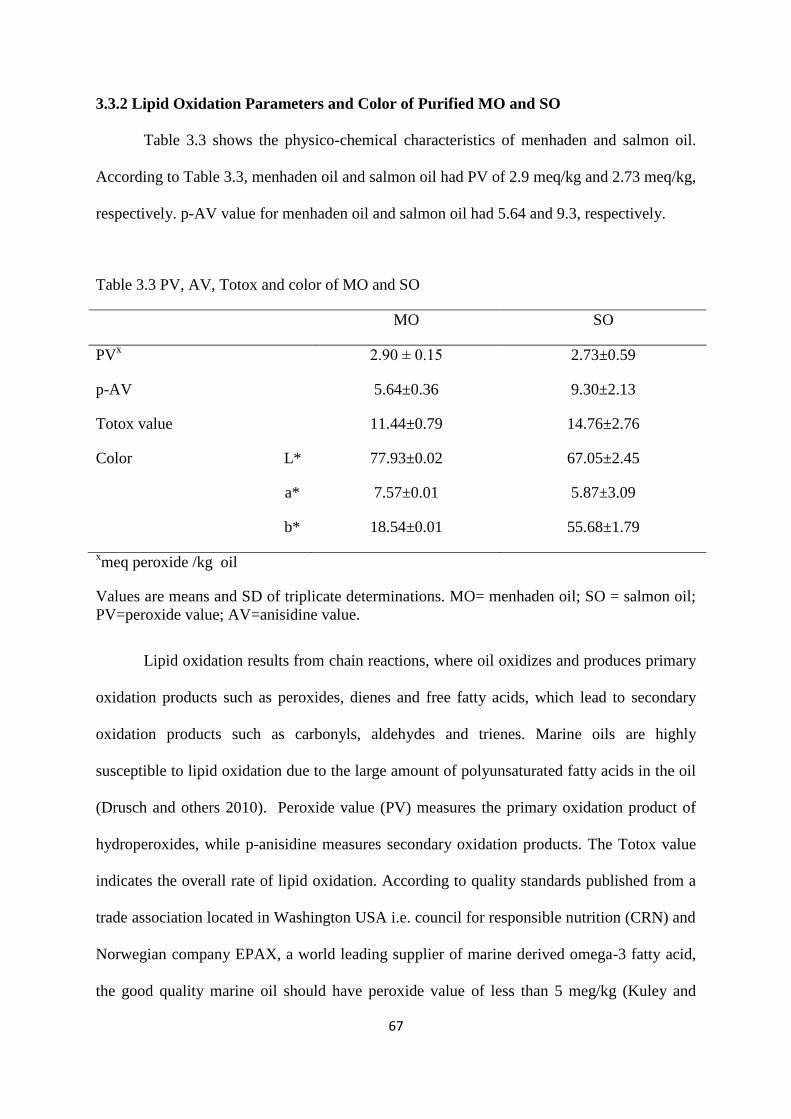
67
3.3.2 Lipid Oxidation Parameters and Color of Purified MO and SO
Table 3.3 shows the physico-chemical characteristics of menhaden and salmon oil.
According to Table 3.3, menhaden oil and salmon oil had PV of 2.9 meq/kg and 2.73 meq/kg,
respectively. p-AV value for menhaden oil and salmon oil had 5.64 and 9.3, respectively.
Table 3.3 PV, AV, Totox and color of MO and SO
MO SO
PVx 2.90 ± 0.15 2.73±0.59
p-AV 5.64±0.36 9.30±2.13
Totox value 11.44±0.79 14.76±2.76
Color L* 77.93±0.02 67.05±2.45
a* 7.57±0.01 5.87±3.09
b* 18.54±0.01 55.68±1.79
xmeq peroxide /kg oil
Values are means and SD of triplicate determinations. MO= menhaden oil; SO = salmon oil;
PV=peroxide value; AV=anisidine value.
Lipid oxidation results from chain reactions, where oil oxidizes and produces primary
oxidation products such as peroxides, dienes and free fatty acids, which lead to secondary
oxidation products such as carbonyls, aldehydes and trienes. Marine oils are highly
susceptible to lipid oxidation due to the large amount of polyunsaturated fatty acids in the oil
(Drusch and others 2010). Peroxide value (PV) measures the primary oxidation product of
hydroperoxides, while p-anisidine measures secondary oxidation products. The Totox value
indicates the overall rate of lipid oxidation. According to quality standards published from a
trade association located in Washington USA i.e. council for responsible nutrition (CRN) and
Norwegian company EPAX, a world leading supplier of marine derived omega-3 fatty acid,
the good quality marine oil should have peroxide value of less than 5 meg/kg (Kuley and
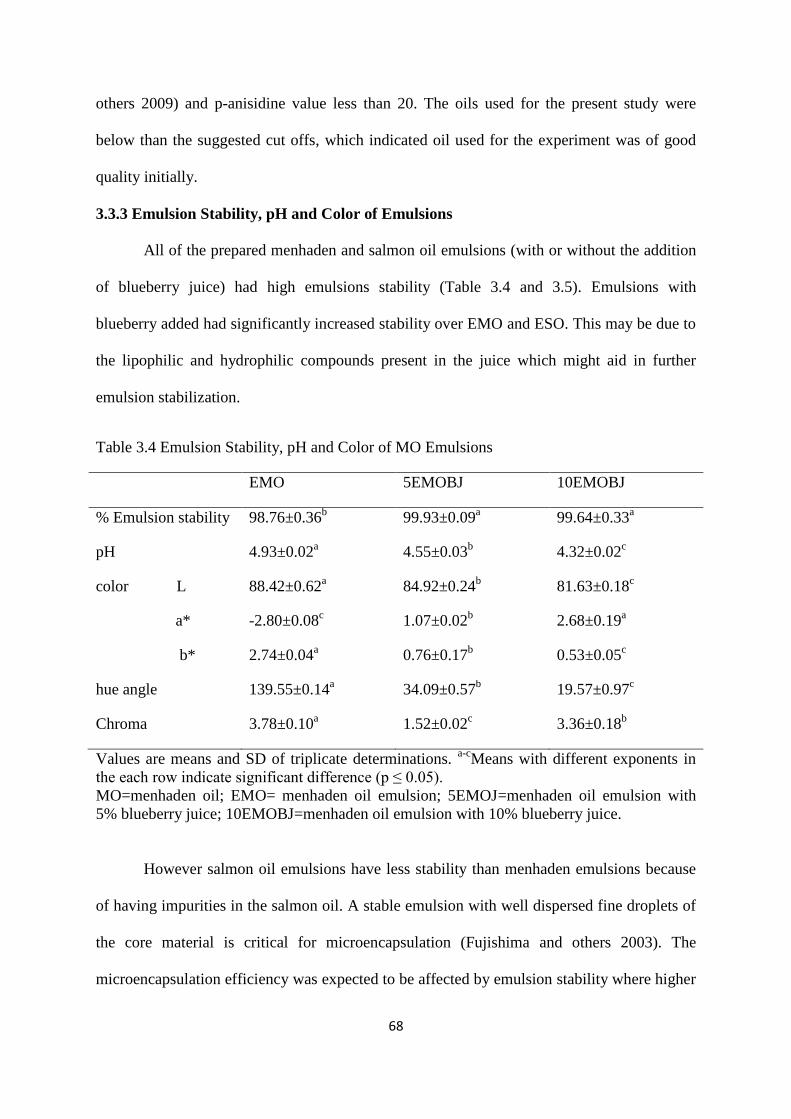
68
others 2009) and p-anisidine value less than 20. The oils used for the present study were
below than the suggested cut offs, which indicated oil used for the experiment was of good
quality initially.
3.3.3 Emulsion Stability, pH and Color of Emulsions
All of the prepared menhaden and salmon oil emulsions (with or without the addition
of blueberry juice) had high emulsions stability (Table 3.4 and 3.5). Emulsions with
blueberry added had significantly increased stability over EMO and ESO. This may be due to
the lipophilic and hydrophilic compounds present in the juice which might aid in further
emulsion stabilization.
Table 3.4 Emulsion Stability, pH and Color of MO Emulsions
EMO 5EMOBJ 10EMOBJ
% Emulsion stability 98.76±0.36b 99.93±0.09
a 99.64±0.33
a
pH 4.93±0.02a 4.55±0.03
b 4.32±0.02
c
color L 88.42±0.62a 84.92±0.24
b 81.63±0.18
c
a* -2.80±0.08c 1.07±0.02
b 2.68±0.19
a
b* 2.74±0.04a 0.76±0.17
b 0.53±0.05
c
hue angle 139.55±0.14a 34.09±0.57
b 19.57±0.97
c
Chroma 3.78±0.10a 1.52±0.02
c 3.36±0.18
b
Values are means and SD of triplicate determinations. a-c
Means with different exponents in
the each row indicate significant difference (p ≤ 0.05).
MO=menhaden oil; EMO= menhaden oil emulsion; 5EMOJ=menhaden oil emulsion with
5% blueberry juice; 10EMOBJ=menhaden oil emulsion with 10% blueberry juice.
However salmon oil emulsions have less stability than menhaden emulsions because
of having impurities in the salmon oil. A stable emulsion with well dispersed fine droplets of
the core material is critical for microencapsulation (Fujishima and others 2003). The
microencapsulation efficiency was expected to be affected by emulsion stability where higher

69
stability interconnected with higher efficiency (Augustin and others 2006). The pH value of
the emulsions decreased with the juice addition.
The 10EMOBJ emulsion had a lower pH value than 5EMOBJ whereas EMO has a
higher value than EMOBJ (Table 3.4), similarly pH of salmon oil emulsions increased in
order of 10ESOBJ, 5ESOBJ and ESO respectively (Table 3.5). However emulsion stability
was not affected by the pH of the emulsions, indicating starch emulsifier (OSA starch) was
not affected by the pH of the solution. But emulsions stabilized using protein emulsifiers are
sensitive to the pH of the solution.
Table 3.5 Emulsion stability, pH and colour of SO emulsions
ESO 5ESOBJ 10ESOBJ
% Emulsion stability 86.56±0.82a 89.93±0.91
a 87.23±1.13
a
pH 4.83±0.05a 4.31±0.03
b 4.16±0.08
c
color L 85.37±0.38a 82.25±0.17
b 80.94±0.12
c
a* -0.37±0.17c 1.53±0.26
b 2.91±0.07
a
b* 10.61±2.45a 4.97±0.11
b 1.99±0.09
c
hue angle 99.33±0.31a 75.61±0.62
b 33.19±0.96
c
Chroma 10.88±2.50a 5.17±0.10
b 3.65±0.10
c
Values are means and SD of triplicate determinations. a-c
Means with different exponents in
the each row indicate significant difference (p ≤ 0.05).
SO=salmon oil; ESO= salmon oil emulsion; 5ESOBJ=salmon oil emulsion with 5%
blueberry juice; 10ESOBJ=salmon oil emulsion with 10% blueberry juice.
Blueberry extract significantly change the emulsion color from off white to light pink
color. 10EMOBJ and 5EMOBJ had higher a* and lower L* & b* values compared to EMO,
and 10ESOBJ and 5ESOBJ had higher a* and lower L* and b* values compared to ESO. In
most cases emulsion color is not a critical parameter, since the final product is intended to be
used for food enrichment.

70
3.3.4 Rheological Properties of Emulsions
Flow Behavior of Emulsions
Flow behaviors of feed emulsions are important for the spray drying operation. The
emulsion viscosity is important to determine the particle size of the powders. More viscous
emulsions produce larger droplet size while atomization produces powders with large particle
size. The flow index (n) of emulsion EMO, 5EMOBJ and 10EMOBJ were less than 1 at all of
the temperatures used, indicating a pseudo plastic fluid behavior (Table 3.6).
Correspondingly n value of ESO, 5ESOBJ and 10ESOBJ were less than 1, representing a
pseudo plastic fluid (Table 3.7).
Table 3.6 Flow behavior properties of EMO, 5EMOBJ and 10EMOBJ.
Temp.
°C
n k (Pa.n)
EMO 5EMOBJ 10EMOBJ EMO 5EMOBJ 10EMOBJ
5 0.770±
0.018cA
0.695±
0.008cB
0.770±
0.015cA
0.137±
0.009aB
0.264±
0.014aA
0.137±
0.007aB
15 0.827±
0.024bA
0.717±
0.002bC
0.797±
0.002bB
0.047±
0.005bC
0.183±
0.005bA
0.094±
0.002bB
25 0.912±
0.005aA
0.763±
0.003aC
0.819±
0.003aB
0.024±
0.001cC
0.118±
0.002cA
0.065±
0.003cB
Values are means and SD of triplicate determinations. a-c
Means with different exponents in
the each column indicate significant difference (p ≤ 0.05). A-C
Means with different exponents
in the each row indicate significant difference (p ≤ 0.05). EMO= menhaden oil emulsion;
5EMOBJ= menhaden oil emulsion with 5% blueberry juice; 10EMOBJ = menhaden oil
emulsion with 10% blueberry juice. n = flow index; k =consistency index.
The flow index of all emulsions increased with increased temperature. Thus emulsions
attempt to behave as Newtonian fluids at higher temperatures. EMO shows higher flow index

71
compare to 5EMOBJ and 10EMOBJ. This may be due to the fact that SEMOBJ and
10EMOBJ has lower moisture content compared to EMO.
Table 3.7 Flow behavior properties of ESO, 5ESOBJ and 10ESOBJ.
Temp.
°C
n k (Pa.n)
ESO 5ESOBJ 10ESOBJ ESO 5ESOBJ 10ESOBJ
5 0.788±
0.002bA
0.683±
0.001bB
0.392±
0.001bC
0.117±
0.051aC
0.246±
0.007aB
2.941±
0.046aA
15 0.793±
0.008bA
0.700±
0.013bB
0.400±
0.032bC
0.100±
0.044bB
0.211±
0.021bC
2.212±
0.0452bA
25 0.815±
0.004aA
0.719±
0.002aB
0.493±
0.031aC
0.078±
0.034cB
0.159±
0.006cC
1.14±
0.065cA
Values are means and SD of triplicate determinations. a-c
Means with different exponents in
the each column indicate significant difference (p ≤ 0.05). A-C
Means with different exponents
in the each row indicate significant difference (p ≤ 0.05). ESO= salmon oil emulsion;
5ESOBJ= salmon oil emulsion with 5% blueberry juice; 10ESOBJ = salmon oil emulsion
with 10% blueberry juice; n = flow index; k =consistency index.
Conversely, the emulsion consistency index (k) decreased with increased temperature in
all the emulsions. A higher k value in emulsions indicates a more viscous consistency
(Bechtel and others 2009). Among different emulsions, 5EMOBJ showed higher k value than
10EMOBJ. EMO showed the lowest k value (Table 3.6). The k value of 10ESOBJ was
greater than 5ESOBJ, and ESO has the lowest k value (Table 3.7). The higher k value may be
due to the solids present in the juice. But 5EMOBJ having highest k value, does not show any
clear relationship between total solids with the k value.
According to the Table 3.8 and 3.9, apparent viscosity of the emulsions decreased with
increasing temperature. Emulsions viscosity is important during microencapsulation since it
has a direct effect on emulsions droplet size during atomization (Hui and others 2010;
Bechtel and others 2011).

72
Table 3.8 Apparent viscosity change of EMO, 5EMOBJ and 10EMOBJ with temperature
Temp. °C Apparent viscosity (Pa.s)
EMO 5EMOBJ 10EMOBJ
5 0.023±0.002aC
0.040±0.001aB
0.053±0.000aA
15 0.019±0.000bC
0.032±0.000bB
0.041±0.001bA
25 0.011±0.001cC
0.014±0.000cB
0.016±0.000cA
Values are means and SD of triplicate determinations. a-c
Means with different exponents in
the each column indicate significant difference (p ≤ 0.05). A-C
Means with different exponents
in the each row indicate significant difference (p ≤ 0.05). EMO= menhaden oil emulsion;
5EMOBJ= menhaden oil emulsion with 5% blueberry juice; 10EMOBJ = menhaden oil
emulsion with 10% blueberry juice.
Table 3.9 Apparent viscosity change of ESO, 5ESOBJ and 10ESOBJ with temperature
Temp. °C Apparent viscosity (Pa.s)
ESO 5ESOBJ 10ESOBJ
5 0.042±0.002aC
0.052±0.002aB
1.046±0.042aA
15 0.034±0.002bC
0.044±0.001bB
0.096±0.005bA
25 0.030±0.000cC
0.038±0.001cB
0.082±0.001cA
Values are means and SD of triplicate determinations. a-c
Means with different exponents in
the each column indicate significant difference (p ≤ 0.05). A-C
Means with different exponents
in the each row indicate significant difference (p ≤ 0.05). ESO= salmon oil emulsion;
5ESOBJ= salmon oil emulsion with 5% blueberry juice; 10ESOBJ = salmon oil emulsion
with 10% blueberry juice.
The apparent viscosity at a shear rate of 200 s-1
was highest in 10EMOBJ emulsion
compared to 5EMOBJ and EMO, designating more pseudo plastic behavior. In salmon oil
emulsions, 10ESOBJ showed greater viscosity than 5ESOBJ.
According to Figure 3.2 and 3.3, all of the emulsions showed a decrease in viscosity
with increased shear rate. Inversely they will increase in viscosity with decreased shear rate
indicating alignment of the long polymer chains along the flow lines.

73
(a)
(b)
(c)
Figure 3.2 shear viscosity as a function of shear rate in emulsions of EMO, 5EMOBJ and
10EMOBJ (a, b and c respectively).
Values are means and SD of triplicate determinations. EMO = menhaden oil emulsion;
5EMOBJ = menhaden oil emulsion with 5% blueberry juice; 10EMOBJ = menhaden oil
emulsion with 10% blueberry juice.
0.00
0.05
0.10
0.15
0.20
0.25
0.30
0 50 100 150 200 250
Sh
ear
vis
cosi
ty (
Pa.s
)
Shear rate (1/s)
EMO
5 °C
15 °C
25 °C
0.00
0.05
0.10
0.15
0 50 100 150 200 250
Sh
ear
pre
ssu
re (
Pa.s
)
Shear rate (1/s)
5EMOBJ
5 °C
15 °C
25 °C
0.00
0.05
0.10
0.15
0.20
0.25
0.30
0 50 100 150 200 250
Sh
ear
vis
cosi
ty (
Pa.s
)
Shear rate (1/s)
10EM0BJ
5 °C
15 °C
25 °C

74
Figure 3.2 and 3.3, illustrates the shear thinning behavior of all three emulsions where
EMO and ESO showed significant shear thinning at 5 ºC. But EMO and ESO shear thinning
behavior at 15 and 25 ºC was not significant. Shear thinning fluids decrease in viscosity with
increased shear rate. But with increased temperature shear thinning behavior delayed in all
emulsions. The shear-thinning region is a consequence of a dramatic shear-induced structural
breakdown, related to a mechanism of oil droplet deflocculation occurring in concentrated
emulsions.
Viscoelastic Properties of Emulsions
A fluid behaves as a liquid and a gel is referred to as a viscoelastic fluids. They can be
pumped easily although they act as viscous liquids, and are able to suspend small solid
particles owing to their elastic property. Viscoelastic property of an emulsion can be
quantified using measurement of their G` (elastic or storage modulus) and G`` (viscous or
loss modulus) as a function of frequency at a constant temperature. G’ is a measure of energy
recovered per cycle of sinusoidal shear deformation and G” is an estimate of energy
dissipated as heat per cycle (Gunasekaran and Sun 2010; Bechtel and others 2011).
In other words G` measures the deformation energy of a sample during the shear
process which represents elastic behavior, and G`` measures the deformation energy used up
during the shear process and lost afterwards which represents viscous behavior. The material
will behave like a solid when G` > G`` indicating the elastic nature with zero recovery. If
G``> G`, material will behave like a liquid indicating viscous dissipation of used energy
during deformation (Tabilo-Munizaga and Barbosa-Cànovas 2005).
Shift angle or delta degree is another property important in emulsions which measures
energy loss (loss factor) compared to energy stored in each cycle of deformation (Bechtel and
others 2011). The loss factor (delta angle) shows the ratio of viscous (G``) to the elastic (G`)
of deformation behavior.

75
(a)
(b)
(c)
Figure 3.3 shear viscosity as a function of shear rate in emulsions of ESO, 5ESOBJ and
10ESOBJ (a, b and c respectively).
Values are means and SD of triplicate determinations. ESO= salmon oil emulsion; 5ESOBJ=
salmon oil emulsion with 5% blueberry juice; 10ESOBJ = salmon oil emulsion with 10%
blueberry juice.
0.00
0.10
0.20
0.30
0.40
0 50 100 150 200
Sh
ear
vis
cosi
ty (
Pa.s
)
Shear rate (1/s)
ESO
5 °C
15 °C
25 °C
0.00
0.05
0.10
0.15
0.20
0.25
0.30
0.35
0 50 100 150 200
Sh
ear
Vis
cosi
ty (
Pa.s
)
shear rate (1/s)
5ESOBJ
5 °C
15 °C
25 °C
0
1
2
3
4
5
6
0 50 100 150 200
Sh
ear
Vis
cosi
ty (
Pa.s
)
Shear rate (1/s)
10ESOBJ
5 °C
15 °C
25 °C

76
The material is called viscoelastic when the loss factor is in between 0 and 90°. In
pure viscous systems as water, the delta degree is 90º whereas purely elastic systems delta
degree is 0º (Tadros 1994).
Figure 3.4 Viscoelastic properties of EMO, 5EMOBJ, and 10EMOBJ
Values are means and SD of triplicate determinations.
EMO = menhaden oil emulsion; 5EMOBJ = menhaden oil emulsion with 5% blueberry juice;
10EMOBJ = menhaden oil emulsion with 10% blueberry juice; G' = storage modulus; G” =
loss modulus.
Figure 3.5 Viscoelastic properties of ESO, 5ESOBJ, and 10ESOBJ.
Values are means and SD of triplicate determinations.
ESO = salmon oil emulsion; 5ESOBJ = salmon oil emulsion with 5% blueberry juice;
10ESOBJ = salmon oil emulsion with 10% blueberry juice; G' = storage modulus; G” = loss
modulus
0
0.5
1
1.5
2
2.5
0 10 20 30 40 50 60 70
G`
G``
(P
a)
Angular frequency (rad/s)
Frequency sweep test
G` (EMO)
G`` (EMO)
G` (5EMOBJ)
G`` (5EMOBJ)
G` (10EMOBJ)
G`` (10EMOBJ)
0
1
2
3
4
5
6
0 10 20 30 40 50 60 70
G`
G``
(P
a)
Angular frequency (rad/s)
Frequency sweep test
G` (ESO)
G`` (ESO)
G` (5ESOBJ)
G`` (5ESOBJ)
G` (10ESOBJ)
G``(10ESOBJ)

77
Delta degree (loss factor) of EMO, 5EMOBJ and 10EMOBJ; ESO, 5ESOBJ and
10ESOBJ (Figure 3.6 and 3.7) lies between 0º and 90º indicating a viscoelastic behavior
(Bechtel and others 2009). All three menhaden emulsions (EMO, 5EMOBJ and 10EMOBJ)
show no significant difference in loss factor. All of the menhaden emulsions are viscoelastic.
But the delta degree angle was around 60-70º in menhaden oil emulsions (Figure 3.6), which
indicated more viscous behavior of emulsions compared to elastic behavior. However salmon
oil emulsions showed increased elastic behavior with addition of BJ. 10ESOBJ had a lower
loss factor compared to 5ESOBJ, and ESO had the highest loss factor (Figure 3.7).
All of the emulsions showed a higher G`` compared to G` due to presence of modified
starch as the wall materials. Both G` and G`` rise in magnitude with increased angular
frequency (Figure 3.4 and 3.5). Salmon oil emulsions showed increase G` and G`` with
increased BJ addition, where menhaden emulsion showed no significant difference. Previous
researchers reported a similar behavior in oil-in-water emulsions stabilized with starch.
According to them, lowering the density difference between starch soluble water phase and
oil phase, results in the loss modulus (G``) dominating the elastic modulus (G`) with increase
in delta degree. The modified starch provides polymeric hindrance to the oil droplets without
contributing to the elasticity of emulsions (Britten and others 2008). Also OSA emulsified
starch is known to produce stable emulsions, and corn syrup is added as a bulking agent
(Erdman and others 2005). The emulsions with visco-elastic properties are stable because
they retard the rearrangement of macroscopic phase separation (Bechtel and others 2011).
3.3.5 Lipid Oxidation During Emulsification
The peroxide value (PV), p-anisidine value (AV) and Totox value of EMO, 5EMOBJ
and 10EMOBJ after emulsification is shown in Table 3.10. When compared with initial MO
condition, the emulsification process significantly increased the PV and AV in EMO and
5EMOBJ emulsions.
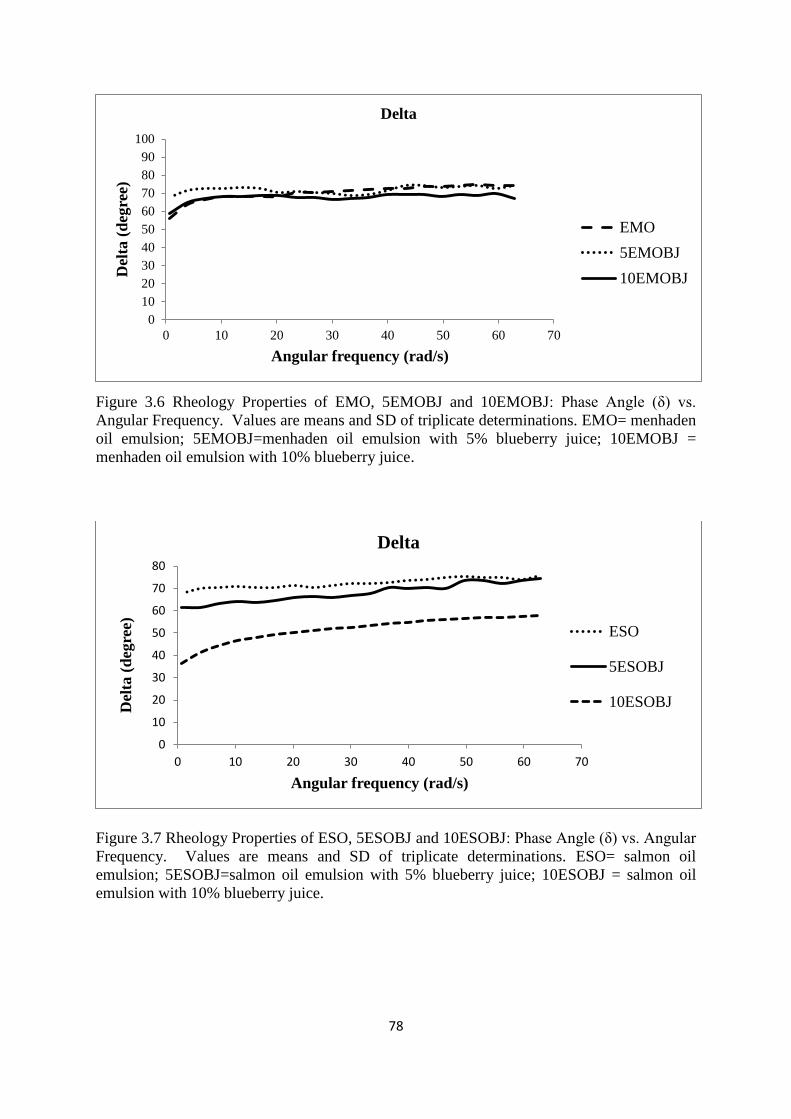
78
Figure 3.6 Rheology Properties of EMO, 5EMOBJ and 10EMOBJ: Phase Angle (δ) vs.
Angular Frequency. Values are means and SD of triplicate determinations. EMO= menhaden
oil emulsion; 5EMOBJ=menhaden oil emulsion with 5% blueberry juice; 10EMOBJ =
menhaden oil emulsion with 10% blueberry juice.
Figure 3.7 Rheology Properties of ESO, 5ESOBJ and 10ESOBJ: Phase Angle (δ) vs. Angular
Frequency. Values are means and SD of triplicate determinations. ESO= salmon oil
emulsion; 5ESOBJ=salmon oil emulsion with 5% blueberry juice; 10ESOBJ = salmon oil
emulsion with 10% blueberry juice.
0
10
20
30
40
50
60
70
80
90
100
0 10 20 30 40 50 60 70
Del
ta (
deg
ree)
Angular frequency (rad/s)
Delta
EMO
5EMOBJ
10EMOBJ
0
10
20
30
40
50
60
70
80
0 10 20 30 40 50 60 70
Del
ta (
deg
ree)
Angular frequency (rad/s)
Delta
ESO
5ESOBJ
10ESOBJ
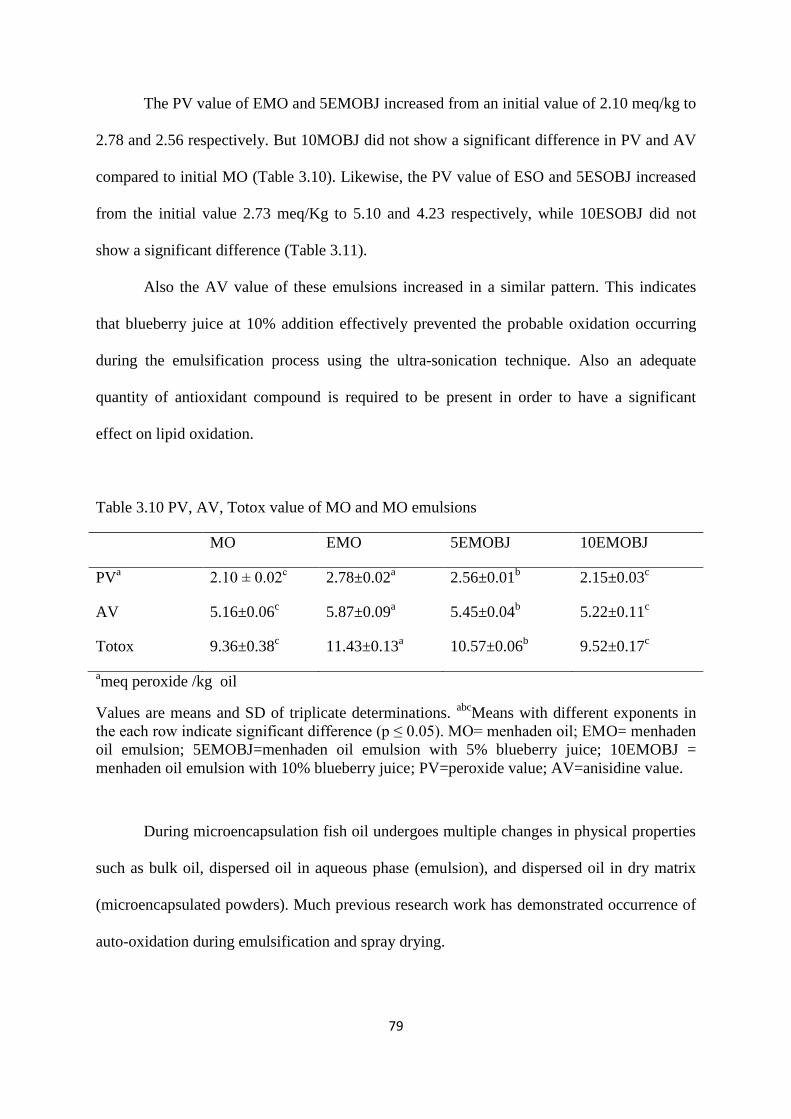
79
The PV value of EMO and 5EMOBJ increased from an initial value of 2.10 meq/kg to
2.78 and 2.56 respectively. But 10MOBJ did not show a significant difference in PV and AV
compared to initial MO (Table 3.10). Likewise, the PV value of ESO and 5ESOBJ increased
from the initial value 2.73 meq/Kg to 5.10 and 4.23 respectively, while 10ESOBJ did not
show a significant difference (Table 3.11).
Also the AV value of these emulsions increased in a similar pattern. This indicates
that blueberry juice at 10% addition effectively prevented the probable oxidation occurring
during the emulsification process using the ultra-sonication technique. Also an adequate
quantity of antioxidant compound is required to be present in order to have a significant
effect on lipid oxidation.
Table 3.10 PV, AV, Totox value of MO and MO emulsions
MO EMO 5EMOBJ 10EMOBJ
PVa 2.10 ± 0.02
c 2.78±0.02
a 2.56±0.01
b 2.15±0.03
c
AV 5.16±0.06c 5.87±0.09
a 5.45±0.04
b 5.22±0.11
c
Totox 9.36±0.38c 11.43±0.13
a 10.57±0.06
b 9.52±0.17
c
ameq peroxide /kg oil
Values are means and SD of triplicate determinations. abc
Means with different exponents in
the each row indicate significant difference (p ≤ 0.05). MO= menhaden oil; EMO= menhaden
oil emulsion; 5EMOBJ=menhaden oil emulsion with 5% blueberry juice; 10EMOBJ =
menhaden oil emulsion with 10% blueberry juice; PV=peroxide value; AV=anisidine value.
During microencapsulation fish oil undergoes multiple changes in physical properties
such as bulk oil, dispersed oil in aqueous phase (emulsion), and dispersed oil in dry matrix
(microencapsulated powders). Much previous research work has demonstrated occurrence of
auto-oxidation during emulsification and spray drying.
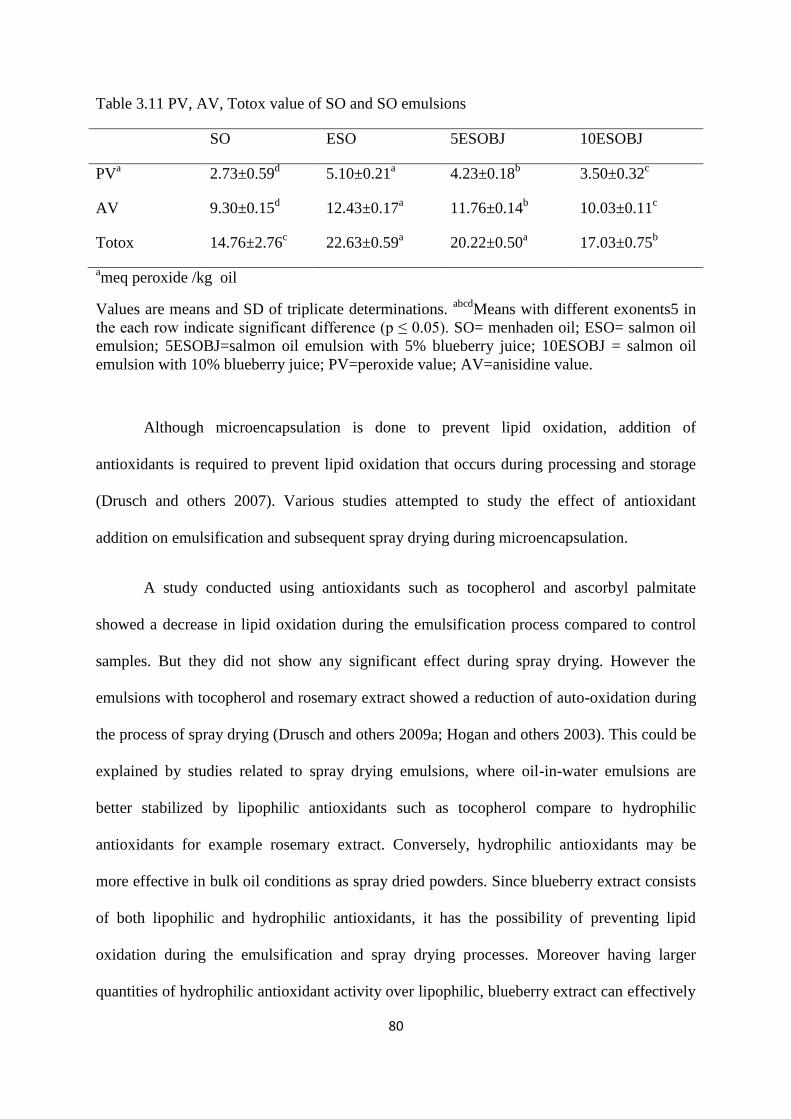
80
Table 3.11 PV, AV, Totox value of SO and SO emulsions
SO ESO 5ESOBJ 10ESOBJ
PVa 2.73±0.59
d 5.10±0.21
a 4.23±0.18
b 3.50±0.32
c
AV 9.30±0.15d 12.43±0.17
a 11.76±0.14
b 10.03±0.11
c
Totox 14.76±2.76c 22.63±0.59
a 20.22±0.50
a 17.03±0.75
b
ameq peroxide /kg oil
Values are means and SD of triplicate determinations. abcd
Means with different exonents5 in
the each row indicate significant difference (p ≤ 0.05). SO= menhaden oil; ESO= salmon oil
emulsion; 5ESOBJ=salmon oil emulsion with 5% blueberry juice; 10ESOBJ = salmon oil
emulsion with 10% blueberry juice; PV=peroxide value; AV=anisidine value.
Although microencapsulation is done to prevent lipid oxidation, addition of
antioxidants is required to prevent lipid oxidation that occurs during processing and storage
(Drusch and others 2007). Various studies attempted to study the effect of antioxidant
addition on emulsification and subsequent spray drying during microencapsulation.
A study conducted using antioxidants such as tocopherol and ascorbyl palmitate
showed a decrease in lipid oxidation during the emulsification process compared to control
samples. But they did not show any significant effect during spray drying. However the
emulsions with tocopherol and rosemary extract showed a reduction of auto-oxidation during
the process of spray drying (Drusch and others 2009a; Hogan and others 2003). This could be
explained by studies related to spray drying emulsions, where oil-in-water emulsions are
better stabilized by lipophilic antioxidants such as tocopherol compare to hydrophilic
antioxidants for example rosemary extract. Conversely, hydrophilic antioxidants may be
more effective in bulk oil conditions as spray dried powders. Since blueberry extract consists
of both lipophilic and hydrophilic antioxidants, it has the possibility of preventing lipid
oxidation during the emulsification and spray drying processes. Moreover having larger
quantities of hydrophilic antioxidant activity over lipophilic, blueberry extract can effectively

81
prevent lipid oxidation in the microencapsulated powders during spray drying and subsequent
storage.
Also different studies observed high levels of tocopherol and lycophene addition were
related to an increase in lipid oxidation (Kolanowski and others 2006). High levels of
tocopherol promote hydroperoxide formation through accumulation of tocopherol radicals
which have been shown to be unsuitable to stabilize fish oil emulsions rich in polyunsaturated
fatty acids (Drusch and others 2009a; Beindroff and Zidam 2010). But antioxidants such as
polyphenols do not produce free radicals since the molecule can stabilize itself after
neutralization of free radicals.
The emulsification method used in the experiment i.e. ultra-sonication is known to
cause lipid oxidation. Chemat and others (2004) reported an increase in PV value from 5.38
meq/kg to 6.33 meq/kg in sonicated sunflower oil samples processed for 2 min (20 KHz, 150
W). The ultrasound assisted lipid oxidation is attributed to the cavitation phenomenon, which
affected structural and functional components leading to lipid oxidation. The collapse of
cavitation bubbles in the emulsions result in formation of energy accumulated hot spots
having temperatures above 5000 ºC and pressure of 500 MPa which caused lipid oxidation by
mechanisms like the thermal effect, due to free radicals generated during sonication and
mechanical forces created by micro-streaming and shock waves.
Furthermore intense mechanical stress and agitation owing to shear and turbulence
during emulsification lead to oxygen inclusion and distribution within the emulsions which
will increase the rate of lipid oxidation (Drusch and others 2009a; Dunford and Legako
2010). Furthermore it has shown that oxygen availability in the emulsion related to an
increase in lipid oxidation during the time of spray drying rather than in drying gas (Drusch
and Mannino 2009b).

82
3.3.6 ME of Microencapsulated MO and SO Powders
Table 3.12 shows the surface oil content, total oil content and microencapsulation
efficiency (ME) of microencapsulated powders of menhaden oil and salmon oil. The high oil
load was used in the experiment in order to study the effect of extract antioxidant on lipid
oxidation at worst possible conditions. The total oil content of menhaden oil and salmon oil
powders were 55-59% and 52-53% respectively.
Table 3.12. Surface oil content, total oil content and microencapsulation efficiency of MO
and SO microencapsulated powders
Values are means and SD of triplicate determinations. a-c
Means and xy
means with different
exponents in the each row indicate significant difference (p ≤ 0.05).
MO= menhaden oil; SO = salmon oil; EMO= menhaden oil emulsion; 5EMOBJ=menhaden
oil emulsion with 5% blueberry juice; 10EMOBJ = menhaden oil emulsion with 10%
blueberry juice; ESO= salmon oil emulsion; 5ESOBJ=salmon oil emulsion with 5%
blueberry juice; 10ESOBJ = salmon oil emulsion with 10% blueberry juice.
There was no significant difference of total oil content in menhaden oil MMO,
5MMOBJ and 10MMOBJ powders. Similarly salmon oil MSO, 5MSOBJ and 10MSOBJ
shows no significant difference in total oil content. But surface oil content of MMO was
Powder properties MO SO
MMO 5MMOBJ 10MMOBJ MSO 5MSOBJ 10MSOBJ
Surface oil content
(g/g)
0.072±
0.001a
0.036±
0.003c
0.059±
0.001b
0.098±
0.001x
0.085±
0.002z
0.089±
0.003y
Total oil content
(g/g)
0.59±
0.02a
0.57±
0.04a
0.55±
0.01a
0.52±
0.03x
0.53±
0.02x
0.53±
0.03x
Microencapsulation
efficiency %
87.80±
0.92b
93.68±
0.66a
89.27±
0.60b
81.15±
1.36y
83.96 ±
0.98x
83.20±
0.12x

83
significantly higher than 10MMOBJ and 5MMOBJ. 5MMOBJ showed the least surface oil
content compared to other menhaden oil powders.
Likewise, salmon oil powders showed higher surface oil content in MSO sample
where 5MSOBJ showed the least amount of surface oil. All of the menhaden oil powders
showed greater microencapsulation efficiency. 5MMOBJ showed significantly higher
encapsulation efficiency than MMO and 10MMOBJ. MMO and 10MMOBJ showed no
significant difference in microencapsulation efficiency. On the other hand salmon oil
powders showed less encapsulation efficiency compared to menhaden powders with
encapsulation efficiency between 81-83%. The 10MSOBJ and 5MSOBJ had significantly
higher encapsulation efficiency than MSO. The lower ME in salmon oil powders is attributed
to the purity of the initial oil. Salmon crude oil was purified using 5% activated earth to
separate the oil from the other impurities. But this procedure did not follow proper oil
purification which will cause retention of some impurities in the purified oil. These impurities
might affect the microencapsulation process leading to lowered ME.
Successful microencapsulation of fish oil should result in higher microencapsulation
efficiency with low minimum surface oil content on the powder particles. The surface oil
contents not only effect the wettability and dispensability of the powder but also readily
undergoes lipid oxidation (Assadpoor and others 2008a). Microencapsulation efficiency can
be affected by many factors such as properties of wall and core materials, emulsion
characteristics and spray drying parameters (Bhandari and others 2007a; Assadpoor and
others 2008b). Generally microencapsulated powder has oil load percentages ranging from
30-50%. Having higher oil load in the microcapsules is advantageous. But high oil load in
microcapsules is associated with reduced encapsulation efficiencies and increased surface oil
contents (Chan and others 2009). It has been suggested that core to wall material ratio of 1:4
is optimal for wall materials like gum arabic and modified starches (Bhandari and others

84
2007b). However the microcapsules produced using n-OSA emulsifying starch and corn
syrup with an oil load of 57% in menhaden oil powders, and 52% in salmon oil powders,
produced powders with higher ME. Changing the core material and wall material of these
powder formulations could produce powders with 100% ME.
Some previous research work has shown that feed solid content has an impact on ME.
Higher emulsion solid content will increase core material retention by reducing the time
taken to form the semi permeable membrane at the surface of drying powder particles. This
will increase the rapid skin formation around the microcapsules (Bhandari and others 2007b).
But higher feed solid content will increase the emulsion viscosities, and create larger droplets
corresponding to increased particle size of microcapsules. During the experiment n-OSA
starch was used in combination with corn syrup as wall materials because high dextrose
equivalent (DE) corn syrup is less permeable to oxygen and offers better protection to
encapsulated oil.
3.3.7 Color of Microencapsulated Powders
Table 3.13 Color of microencapsulated MO and SO powders
Values are means and SD of triplicate determinations. abc
Means and xy
means with different
exonents in the each row indicate significant difference (p ≤ 0.05).
MO= menhaden oil; SO = salmon oil; MMO= microencapsulated menhaden oil;
5MMOBJ=microencapsulated menhaden oil with 5% blueberry juice; 10MMOBJ =
microencapsulated menhaden oil with 10% blueberry juice; MSO= microencapsulated
salmon oil; 5MSOBJ=microencapsulated salmon oil with 5% blueberry juice; 10MSOBJ =
microencapsulated salmon oil with 10% blueberry juice.
MO SO
MMO 5MMOBJ 10MMOBJ MSO 5MSOBJ 10MSOBJ
L 97.03±0.03a 89.33±0.02
b 83.41±0.02
c 91.86±1.97
x 88.04±2.15
y 80.23±3.52
z
a* -1.04±0.01c 3.42±0.01
b 6.13±0.01
a 0.54±0.09
z 2.18±0.22
y 5.68±0.93
x
b* 5.24±0.03a 1.27±0.03
b 1.07±0.01
c 9.48±1.03
x 5.45±0.92
y 3.45±0.84
z
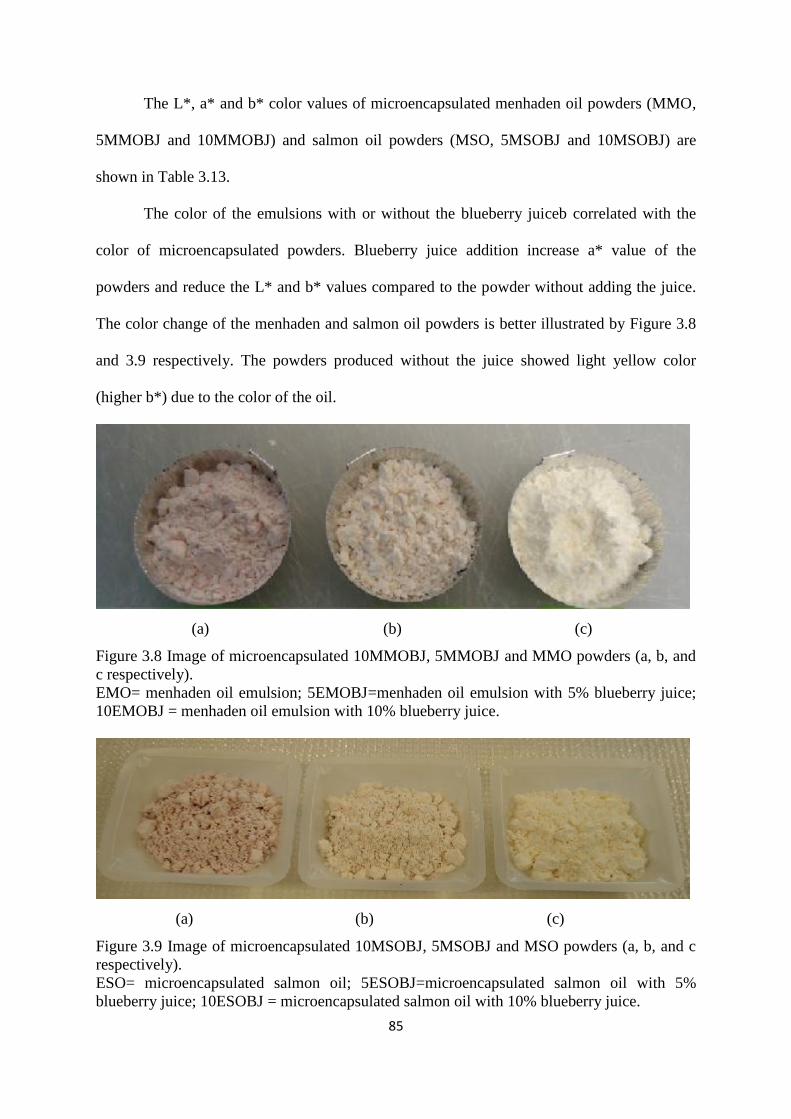
85
The L*, a* and b* color values of microencapsulated menhaden oil powders (MMO,
5MMOBJ and 10MMOBJ) and salmon oil powders (MSO, 5MSOBJ and 10MSOBJ) are
shown in Table 3.13.
The color of the emulsions with or without the blueberry juiceb correlated with the
color of microencapsulated powders. Blueberry juice addition increase a* value of the
powders and reduce the L* and b* values compared to the powder without adding the juice.
The color change of the menhaden and salmon oil powders is better illustrated by Figure 3.8
and 3.9 respectively. The powders produced without the juice showed light yellow color
(higher b*) due to the color of the oil.
(a) (b) (c)
Figure 3.8 Image of microencapsulated 10MMOBJ, 5MMOBJ and MMO powders (a, b, and
c respectively).
EMO= menhaden oil emulsion; 5EMOBJ=menhaden oil emulsion with 5% blueberry juice;
10EMOBJ = menhaden oil emulsion with 10% blueberry juice.
(a) (b) (c)
Figure 3.9 Image of microencapsulated 10MSOBJ, 5MSOBJ and MSO powders (a, b, and c
respectively).
ESO= microencapsulated salmon oil; 5ESOBJ=microencapsulated salmon oil with 5%
blueberry juice; 10ESOBJ = microencapsulated salmon oil with 10% blueberry juice.

86
3.3.8 Lipid Oxidation During Microencapsulation
After emulsion is sprayed into the drying chamber, the temperature of the droplet
surface will be at the wet bulb temperature correspond to the drying temperature during the
initial stages of drying. In most cases droplet temperature does not exceed 100 ºC (Chambin
and others 2007). Mostly this temperature is indicated by the air exhaust temperature, which
is typically around 50-80 ºC. During the drying process a film is formed at the surface of the
drying particle (Beindroff and Zidam 2010).
Many authors argue that lipid oxidation is slowed down in a low moisture
environment. But conversely some researchers reported that extreme dry conditions
accelerate lipid oxidation (Baik and others 2004). But more rapid oxidation was observed in
the intermediate moisture content level.
Figure 3.10 PV, AV, Totox value of MMO, 5MMOBJ and 10MMOBJ powders.
Values are means and SD of triplicate determinations. MO= menhaden oil; MMO=
microencapsulated menhaden oil; 5MMOBJ=microencapsulated menhaden oil with 5%
blueberry juice; 10MMOBJ = microencapsulated menhaden oil with 10% blueberry juice;
PV=peroxide value; AV=anisidine value.
0
2
4
6
8
10
12
14
16
18
20
MO MMO 5MMOBJ 10MMOBJ
Treatments
PV
AV
TOTOX

87
Baik and others (2004) reported increase of PV of fish oil emulsions from 9.5±0.4
mmol/Kg to 17.4±4.0 mmol/Kg in the spray dried powders (Drusch and others 2009a; Drusch
and others 2006a). They explained that during the spray drying process, fish oil exposed to
air, high temperature and high pressure leads to increase lipid oxidation (Franke and
Heinzelmann 1999). Similarly, our experimental results showed an increase in PV and AV in
microencapsulated menhaden and salmon oil powders compared to pure oil without the
addition of blueberry juice (Figure 3.10 and 3.11).
According to Figure 3.10, 10MMOBJ significantly had lower PV, AV and Totox
value compared to 5MMOBJ and MMO powders. This indicated that 10MMOBJ with 10%
juice addition prevented the lipid oxidation during spray drying. Correspondingly, 5MMOBJ
significantly lowered PV, AV and Totox value compared to MMO. This showed that
increased amount of juice addition reduced lipid oxidation during spray drying. But
10MMOBJ had significantly higher lipid oxidation values compared to initial menhaden oil.
Figure 3.11 PV, AV, Totox value of MSO, 5MSOBJ and 10MSOBJ powders.
Values are means and SD of triplicate determinations. SO=salmon oil; MSO=
microencapsulated salmon oil; 5MSOBJ=microencapsulated salmon oil with 5% blueberry
juice; 10MSOBJ = microencapsulated salmon oil with 10% blueberry juice; PV=peroxide
value; AV=anisidine value.
0
5
10
15
20
25
30
35
SO MSO 5MSOBJ 10MSOBJ
Treatments
PV
AV
TOTOX
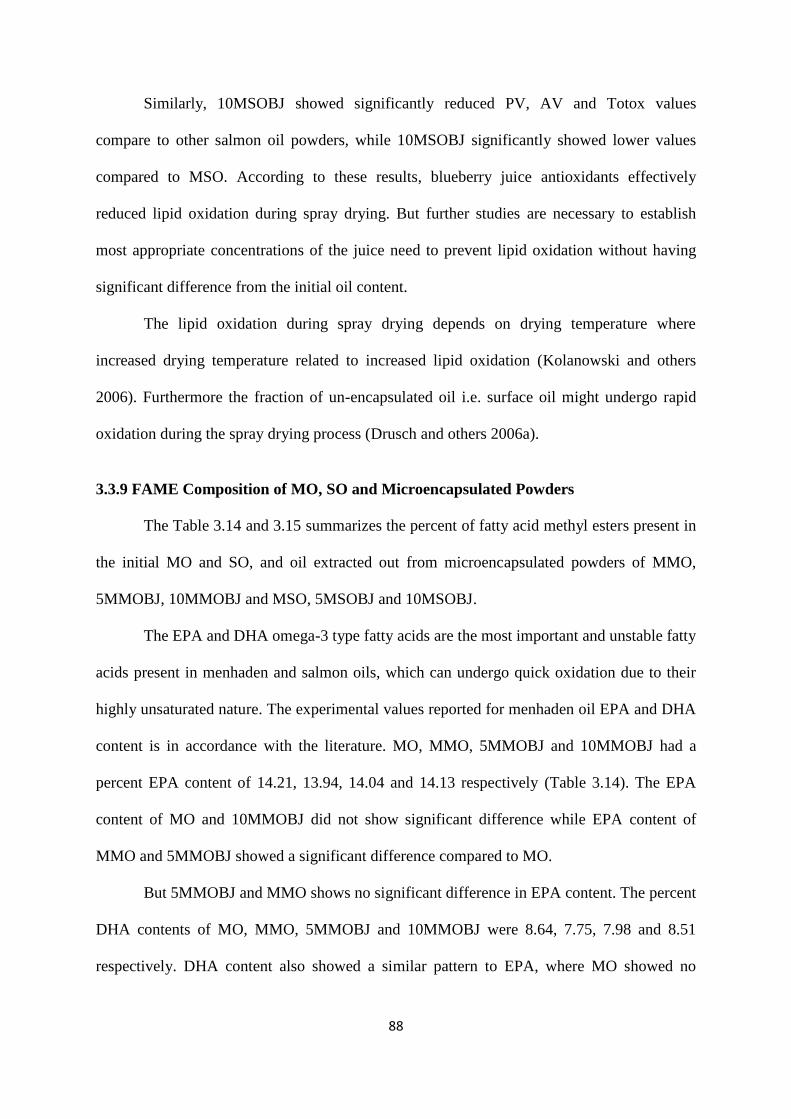
88
Similarly, 10MSOBJ showed significantly reduced PV, AV and Totox values
compare to other salmon oil powders, while 10MSOBJ significantly showed lower values
compared to MSO. According to these results, blueberry juice antioxidants effectively
reduced lipid oxidation during spray drying. But further studies are necessary to establish
most appropriate concentrations of the juice need to prevent lipid oxidation without having
significant difference from the initial oil content.
The lipid oxidation during spray drying depends on drying temperature where
increased drying temperature related to increased lipid oxidation (Kolanowski and others
2006). Furthermore the fraction of un-encapsulated oil i.e. surface oil might undergo rapid
oxidation during the spray drying process (Drusch and others 2006a).
3.3.9 FAME Composition of MO, SO and Microencapsulated Powders
The Table 3.14 and 3.15 summarizes the percent of fatty acid methyl esters present in
the initial MO and SO, and oil extracted out from microencapsulated powders of MMO,
5MMOBJ, 10MMOBJ and MSO, 5MSOBJ and 10MSOBJ.
The EPA and DHA omega-3 type fatty acids are the most important and unstable fatty
acids present in menhaden and salmon oils, which can undergo quick oxidation due to their
highly unsaturated nature. The experimental values reported for menhaden oil EPA and DHA
content is in accordance with the literature. MO, MMO, 5MMOBJ and 10MMOBJ had a
percent EPA content of 14.21, 13.94, 14.04 and 14.13 respectively (Table 3.14). The EPA
content of MO and 10MMOBJ did not show significant difference while EPA content of
MMO and 5MMOBJ showed a significant difference compared to MO.
But 5MMOBJ and MMO shows no significant difference in EPA content. The percent
DHA contents of MO, MMO, 5MMOBJ and 10MMOBJ were 8.64, 7.75, 7.98 and 8.51
respectively. DHA content also showed a similar pattern to EPA, where MO showed no

89
difference from 10MMOBJ, while MO was significantly different from 5MMOBJ and MMO,
and 5MMOBJ showed no difference from MMO.
Table 3.14 FAMEs Composition (% w/w) of MO, MMO, 5MMOBJ and 10MMOBJ.
MO 10MMOBJ 5MMOBJ MMO
C14:0 Myristic 8.73±0.07a 8.88±0.07
a 8.81±0.06
a 8.86±0.06
a
C16:0 Palmitic 19.31±0.10b 19.68±0.28
a 19.25±0.23
b 19.54±0.06
a
C16:1n7 palmitooleic 11.87±0.07a 11.90±0.05
a 12.07±0.04
a 11.97±0.07
a
C18:0 Stearic 3.63±0.01a 3.63±0.04
a 3.63±0.03
a 3.67±0.01
a
C18:1n9c Oleic 6.29±0.03a 6.36±0.02
a 6.40±0.04
a 6.35±0.02
a
C18:1n5 3.11±0.02b 3.14±0.01
b 3.17±0.01
a 3.14±0.01
b
C18:2n6c Linoleic 1.52±0.01a 1.53±0.01
a 1.54±0.01
a 1.53±0.01
a
C18:3n3 Alpha-Linolenic 1.69±0.02a 1.67±0.02
a 1.69±0.01
a 1.67±0.01
a
C20:1n9 0.99±0.00a 1.01±0.02
a 1.03±0.03
a 1.02±0.01
a
C20:3n3 1.80±0.00b 1.80±0.01
a 1.83±0.02
a 1.80±0.02
a
C20:4n6 arachidonic 1.15±0.06a 1.16±0.02
a 1.17±0.01
a 1.15±0.01
a
EPA (20:5n3) 14.21±0.03a 14.13±0.05
a 14.04±0.03
b 13.94±0.08
b
DHA (22:6n3) 8.64±0.20a 8.51±0.08
a 7.98±0.08
b 7.75±0.03
b
C24:1n9 13.64±0.20a 13.51±0.08
a 13.75±0.08
a 13.51±0.04
a
Total omega 3 24.54±0.05a 24.31±0.03
b 23.71±0.08
c 23.36±0.06
d
Total omega 6 2.67±0.02b 2.69±0.01
b 2.71±0.03
a 2.68±0.02
a
Saturates 33.24±0.51a 33.80±0.80
a 33.28±0.77
a 33.67±0.81
a
Mono unsaturates (M) 36.28±0.19a 36.30±0.13
a 36.80±0.18
a 36.37±0.13
a
Poly unsaturates (P) 29.01±0.27a 28.80±0.19
a 28.25±0.15
b 27.84±0.16
c
ω3/ω6 9.19±0.03a 9.04±0.01
b 8.75±0.02
c 8.72±0.01
c
P/S 0.87±0.02a 0.85±0.02
a 0.85±0.05
a 0.83±0.03
a
Total fatty acids identified 98.53±0.12 98.90±0.08 98.38±0.11 97.88±0.12
Values are means and SD of triplicate determinations.
a-bcMeans with different exponents in
the each row indicate significant difference (p ≤ 0.05). MO=menhaden oil; MMO=
microencapsulated menhaden oil; 5MMOBJ=microencapsulated menhaden oil with 5%
blueberry juice; 10MMOBJ = microencapsulated menhaden oil with 10% blueberry juice;
FAMEs = fatty acid methyl esters, P/S = polyunsaturated fatty acids/ saturated fatty acids.
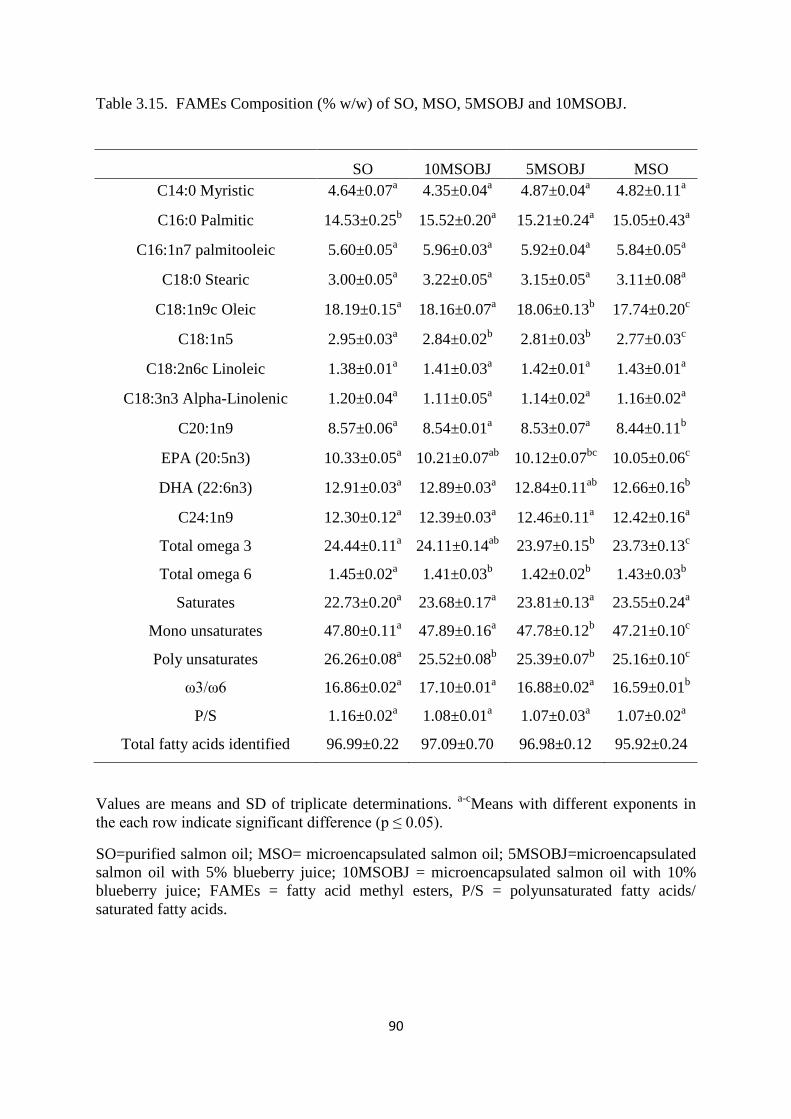
90
Table 3.15. FAMEs Composition (% w/w) of SO, MSO, 5MSOBJ and 10MSOBJ.
SO 10MSOBJ 5MSOBJ MSO
C14:0 Myristic 4.64±0.07a 4.35±0.04
a 4.87±0.04
a 4.82±0.11
a
C16:0 Palmitic 14.53±0.25b 15.52±0.20
a 15.21±0.24
a 15.05±0.43
a
C16:1n7 palmitooleic 5.60±0.05a 5.96±0.03
a 5.92±0.04
a 5.84±0.05
a
C18:0 Stearic 3.00±0.05a 3.22±0.05
a 3.15±0.05
a 3.11±0.08
a
C18:1n9c Oleic 18.19±0.15a 18.16±0.07
a 18.06±0.13
b 17.74±0.20
c
C18:1n5 2.95±0.03a 2.84±0.02
b 2.81±0.03
b 2.77±0.03
c
C18:2n6c Linoleic 1.38±0.01a 1.41±0.03
a 1.42±0.01
a 1.43±0.01
a
C18:3n3 Alpha-Linolenic 1.20±0.04a 1.11±0.05
a 1.14±0.02
a 1.16±0.02
a
C20:1n9 8.57±0.06a 8.54±0.01
a 8.53±0.07
a 8.44±0.11
b
EPA (20:5n3) 10.33±0.05a 10.21±0.07
ab 10.12±0.07
bc 10.05±0.06
c
DHA (22:6n3) 12.91±0.03a 12.89±0.03
a 12.84±0.11
ab 12.66±0.16
b
C24:1n9 12.30±0.12a 12.39±0.03
a 12.46±0.11
a 12.42±0.16
a
Total omega 3 24.44±0.11a 24.11±0.14
ab 23.97±0.15
b 23.73±0.13
c
Total omega 6 1.45±0.02a 1.41±0.03
b 1.42±0.02
b 1.43±0.03
b
Saturates 22.73±0.20a 23.68±0.17
a 23.81±0.13
a 23.55±0.24
a
Mono unsaturates 47.80±0.11a 47.89±0.16
a 47.78±0.12
b 47.21±0.10
c
Poly unsaturates 26.26±0.08a 25.52±0.08
b 25.39±0.07
b 25.16±0.10
c
ω3/ω6 16.86±0.02a 17.10±0.01
a 16.88±0.02
a 16.59±0.01
b
P/S 1.16±0.02a 1.08±0.01
a 1.07±0.03
a 1.07±0.02
a
Total fatty acids identified 96.99±0.22 97.09±0.70 96.98±0.12 95.92±0.24
Values are means and SD of triplicate determinations. a-c
Means with different exponents in
the each row indicate significant difference (p ≤ 0.05).
SO=purified salmon oil; MSO= microencapsulated salmon oil; 5MSOBJ=microencapsulated
salmon oil with 5% blueberry juice; 10MSOBJ = microencapsulated salmon oil with 10%
blueberry juice; FAMEs = fatty acid methyl esters, P/S = polyunsaturated fatty acids/
saturated fatty acids.
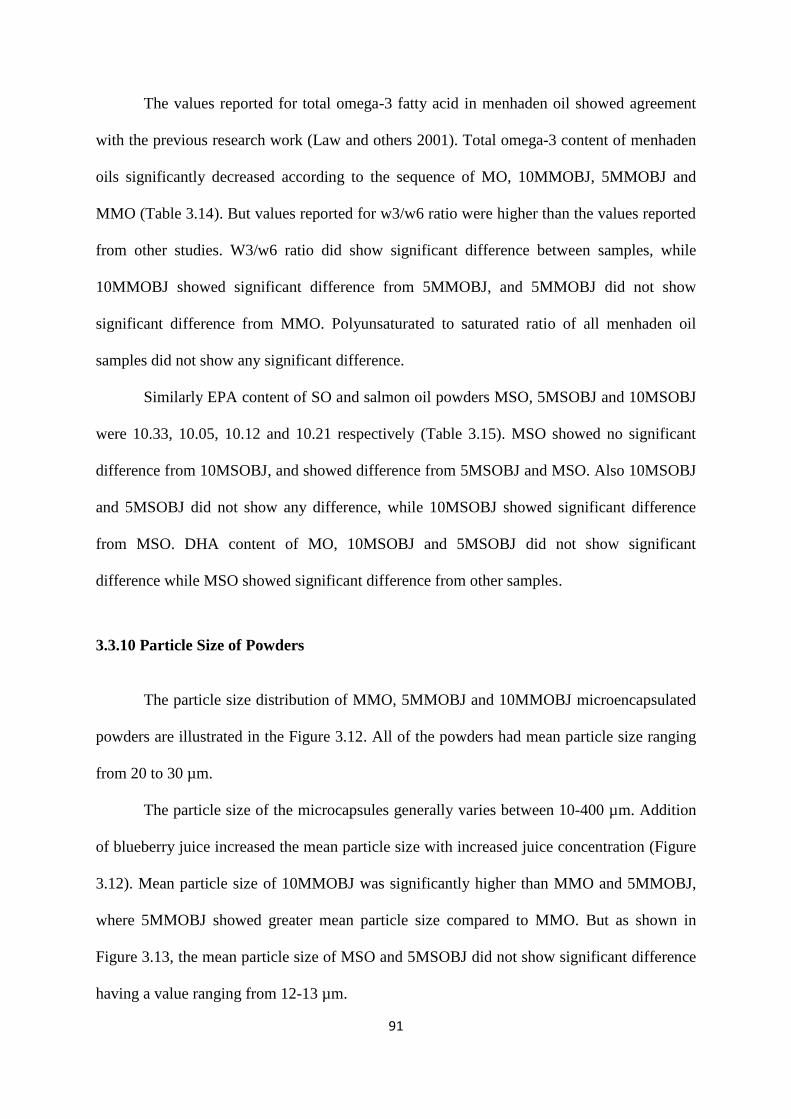
91
The values reported for total omega-3 fatty acid in menhaden oil showed agreement
with the previous research work (Law and others 2001). Total omega-3 content of menhaden
oils significantly decreased according to the sequence of MO, 10MMOBJ, 5MMOBJ and
MMO (Table 3.14). But values reported for w3/w6 ratio were higher than the values reported
from other studies. W3/w6 ratio did show significant difference between samples, while
10MMOBJ showed significant difference from 5MMOBJ, and 5MMOBJ did not show
significant difference from MMO. Polyunsaturated to saturated ratio of all menhaden oil
samples did not show any significant difference.
Similarly EPA content of SO and salmon oil powders MSO, 5MSOBJ and 10MSOBJ
were 10.33, 10.05, 10.12 and 10.21 respectively (Table 3.15). MSO showed no significant
difference from 10MSOBJ, and showed difference from 5MSOBJ and MSO. Also 10MSOBJ
and 5MSOBJ did not show any difference, while 10MSOBJ showed significant difference
from MSO. DHA content of MO, 10MSOBJ and 5MSOBJ did not show significant
difference while MSO showed significant difference from other samples.
3.3.10 Particle Size of Powders
The particle size distribution of MMO, 5MMOBJ and 10MMOBJ microencapsulated
powders are illustrated in the Figure 3.12. All of the powders had mean particle size ranging
from 20 to 30 µm.
The particle size of the microcapsules generally varies between 10-400 µm. Addition
of blueberry juice increased the mean particle size with increased juice concentration (Figure
3.12). Mean particle size of 10MMOBJ was significantly higher than MMO and 5MMOBJ,
where 5MMOBJ showed greater mean particle size compared to MMO. But as shown in
Figure 3.13, the mean particle size of MSO and 5MSOBJ did not show significant difference
having a value ranging from 12-13 µm.
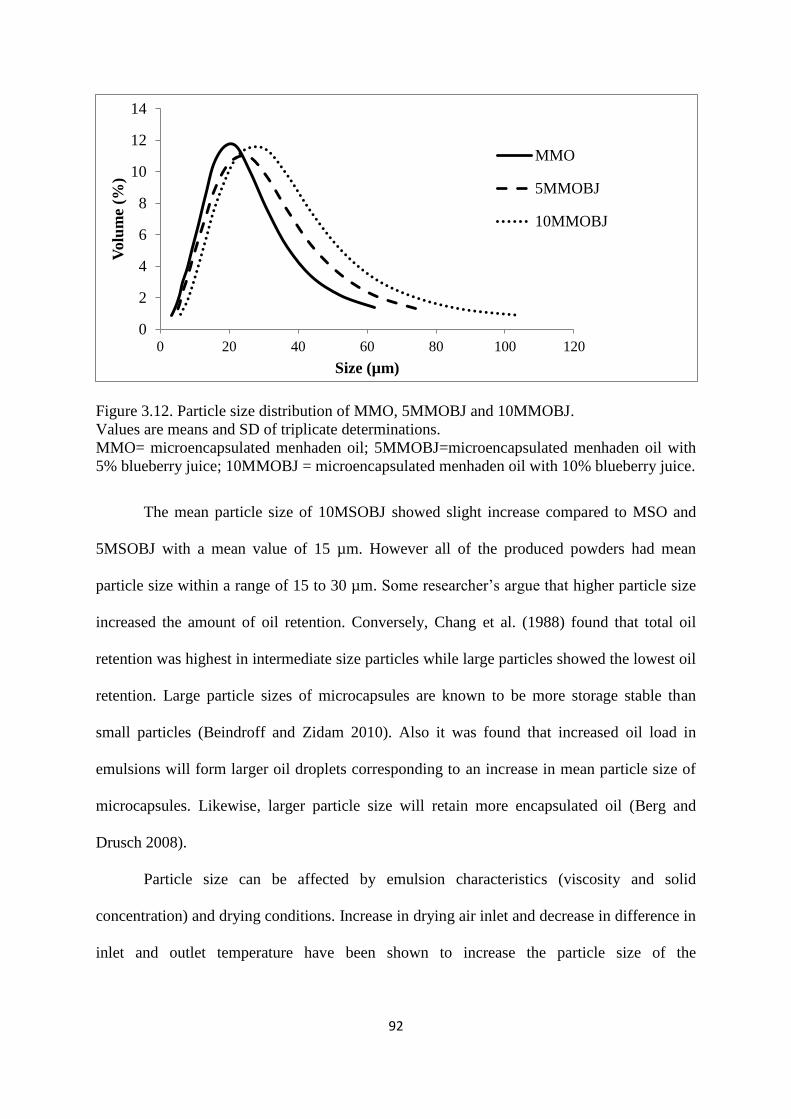
92
Figure 3.12. Particle size distribution of MMO, 5MMOBJ and 10MMOBJ.
Values are means and SD of triplicate determinations.
MMO= microencapsulated menhaden oil; 5MMOBJ=microencapsulated menhaden oil with
5% blueberry juice; 10MMOBJ = microencapsulated menhaden oil with 10% blueberry juice.
The mean particle size of 10MSOBJ showed slight increase compared to MSO and
5MSOBJ with a mean value of 15 µm. However all of the produced powders had mean
particle size within a range of 15 to 30 µm. Some researcher’s argue that higher particle size
increased the amount of oil retention. Conversely, Chang et al. (1988) found that total oil
retention was highest in intermediate size particles while large particles showed the lowest oil
retention. Large particle sizes of microcapsules are known to be more storage stable than
small particles (Beindroff and Zidam 2010). Also it was found that increased oil load in
emulsions will form larger oil droplets corresponding to an increase in mean particle size of
microcapsules. Likewise, larger particle size will retain more encapsulated oil (Berg and
Drusch 2008).
Particle size can be affected by emulsion characteristics (viscosity and solid
concentration) and drying conditions. Increase in drying air inlet and decrease in difference in
inlet and outlet temperature have been shown to increase the particle size of the
0
2
4
6
8
10
12
14
0 20 40 60 80 100 120
Volu
me
(%)
Size (µm)
MMO
5MMOBJ
10MMOBJ

93
microcapsules. This is mainly due to the fact that, higher drying rates set the particle sizes
earlier and this will prevent the shrinkage of the particle drying.
Figure 3.13 Particle size distribution of MSO, 5MSOBJ and 10MSOBJ.
Values are means and SD of triplicate determinations.
MSO= microencapsulated salmon oil; 5MSOBJ=microencapsulated salmon oil with 5%
blueberry juice; 10MSOBJ = microencapsulated salmon oil with 10% blueberry juice.
The drying air condition influence is greater compared to emulsion composition. Also
atomization controls the particle size of the microcapsules, where nozzle atomization
produces larger particle size than wheel atomization. However it is preferable to produce
large particles in order to facilitate rehydration where small particles show poor dispersion
properties that tend to form lumps on the liquid surface (Assadpoor and others 2008b;
Bhandari and others 2007b).
3.3.11 SEM of Powders
Scanning electron microscopy (SEM) of menhaden oil powders MMO, 5MMOBJ and
10MMOBJ, and salmon oil powders MSO, 5MSOBJ, and 10MSOBJ are illustrated on Figure
3.14 and 3.15 respectively.
0
2
4
6
8
10
12
0 5 10 15 20 25 30
Volu
me
(%)
Size (µm)
MSO
5MSOBJ
10MSOBJ
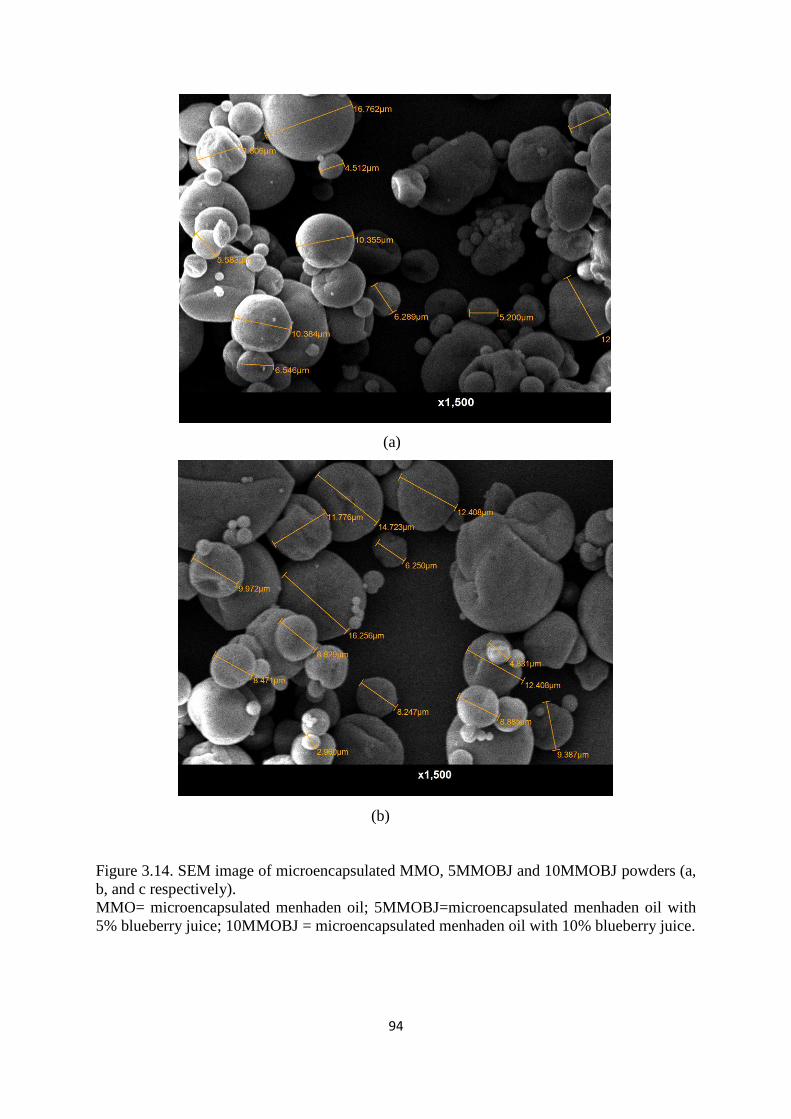
94
(a)
(b)
Figure 3.14. SEM image of microencapsulated MMO, 5MMOBJ and 10MMOBJ powders (a,
b, and c respectively).
MMO= microencapsulated menhaden oil; 5MMOBJ=microencapsulated menhaden oil with
5% blueberry juice; 10MMOBJ = microencapsulated menhaden oil with 10% blueberry juice.
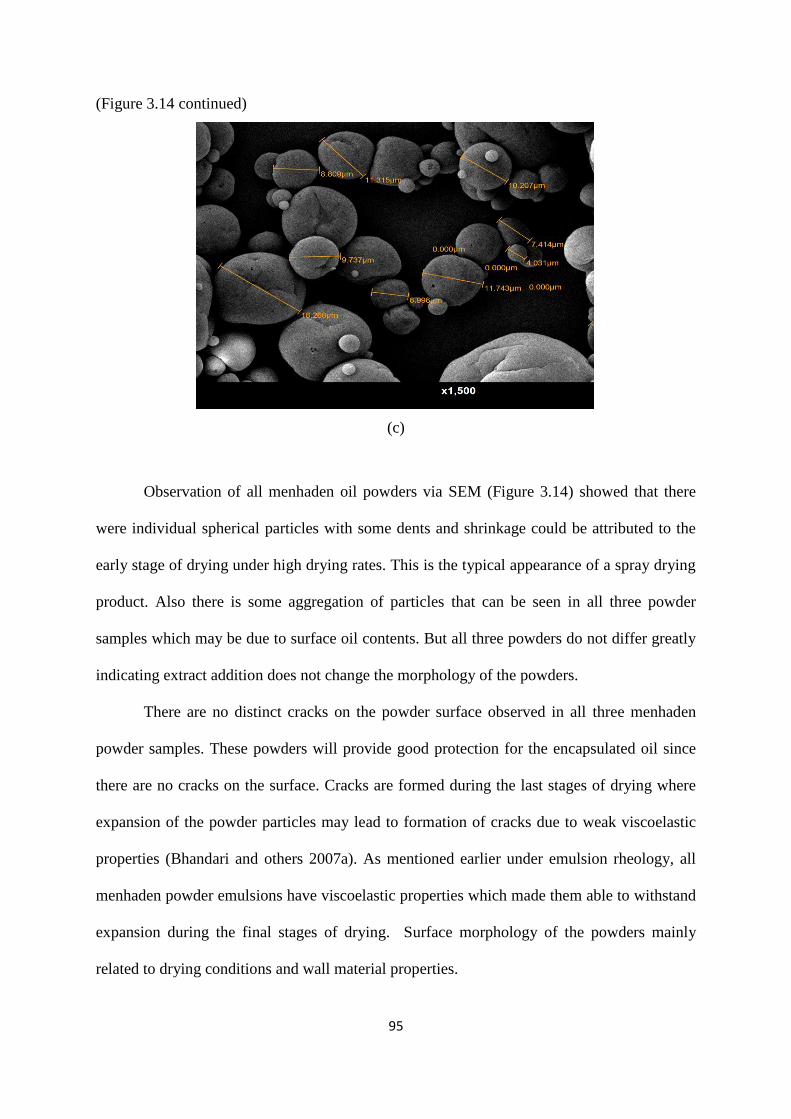
95
(Figure 3.14 continued)
(c)
Observation of all menhaden oil powders via SEM (Figure 3.14) showed that there
were individual spherical particles with some dents and shrinkage could be attributed to the
early stage of drying under high drying rates. This is the typical appearance of a spray drying
product. Also there is some aggregation of particles that can be seen in all three powder
samples which may be due to surface oil contents. But all three powders do not differ greatly
indicating extract addition does not change the morphology of the powders.
There are no distinct cracks on the powder surface observed in all three menhaden
powder samples. These powders will provide good protection for the encapsulated oil since
there are no cracks on the surface. Cracks are formed during the last stages of drying where
expansion of the powder particles may lead to formation of cracks due to weak viscoelastic
properties (Bhandari and others 2007a). As mentioned earlier under emulsion rheology, all
menhaden powder emulsions have viscoelastic properties which made them able to withstand
expansion during the final stages of drying. Surface morphology of the powders mainly
related to drying conditions and wall material properties.
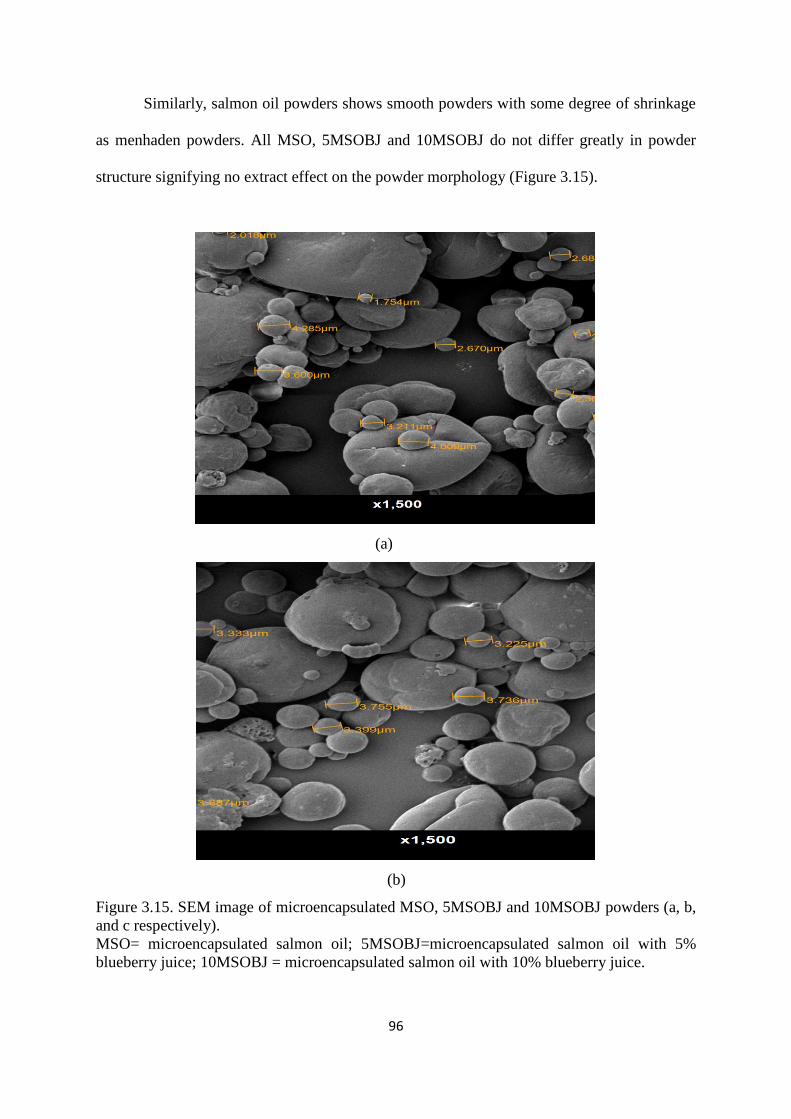
96
Similarly, salmon oil powders shows smooth powders with some degree of shrinkage
as menhaden powders. All MSO, 5MSOBJ and 10MSOBJ do not differ greatly in powder
structure signifying no extract effect on the powder morphology (Figure 3.15).
(a)
(b)
Figure 3.15. SEM image of microencapsulated MSO, 5MSOBJ and 10MSOBJ powders (a, b,
and c respectively).
MSO= microencapsulated salmon oil; 5MSOBJ=microencapsulated salmon oil with 5%
blueberry juice; 10MSOBJ = microencapsulated salmon oil with 10% blueberry juice.
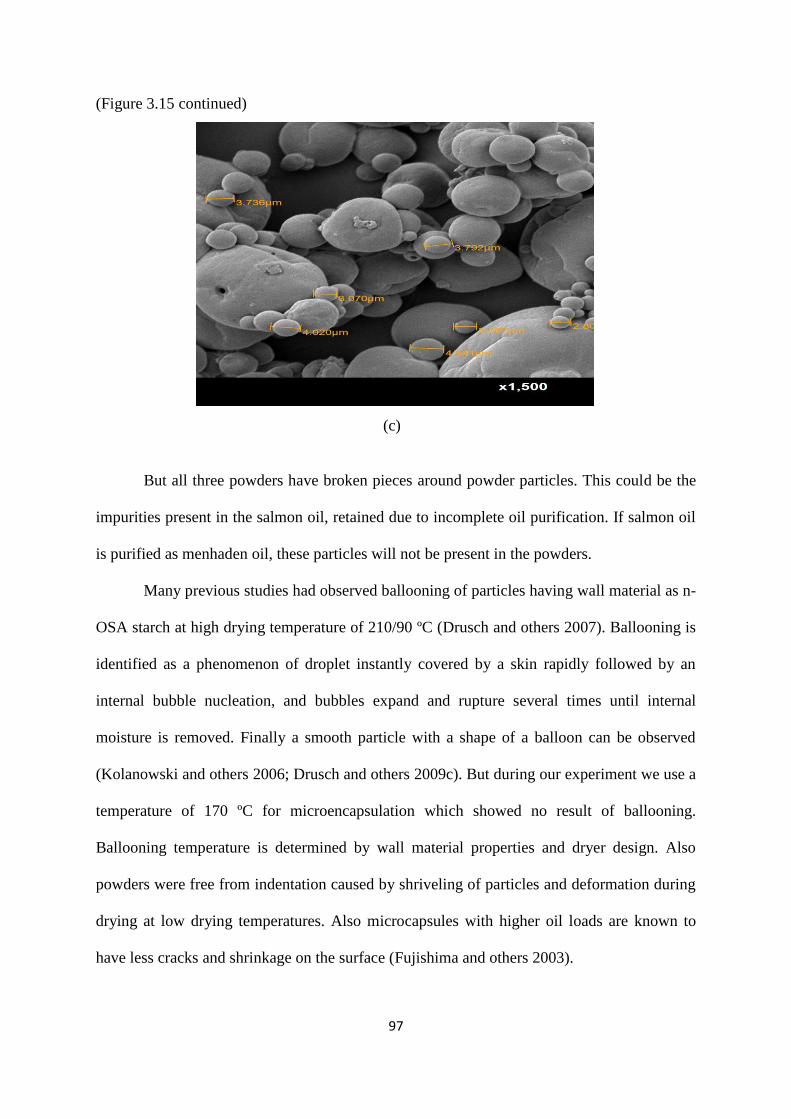
97
(Figure 3.15 continued)
(c)
But all three powders have broken pieces around powder particles. This could be the
impurities present in the salmon oil, retained due to incomplete oil purification. If salmon oil
is purified as menhaden oil, these particles will not be present in the powders.
Many previous studies had observed ballooning of particles having wall material as n-
OSA starch at high drying temperature of 210/90 ºC (Drusch and others 2007). Ballooning is
identified as a phenomenon of droplet instantly covered by a skin rapidly followed by an
internal bubble nucleation, and bubbles expand and rupture several times until internal
moisture is removed. Finally a smooth particle with a shape of a balloon can be observed
(Kolanowski and others 2006; Drusch and others 2009c). But during our experiment we use a
temperature of 170 ºC for microencapsulation which showed no result of ballooning.
Ballooning temperature is determined by wall material properties and dryer design. Also
powders were free from indentation caused by shriveling of particles and deformation during
drying at low drying temperatures. Also microcapsules with higher oil loads are known to
have less cracks and shrinkage on the surface (Fujishima and others 2003).

98
3.4 Conclusions
Menhaden and salmon oil emulsions produced with or without blueberry juice had
high emulsions stabilities. All of the emulsions showed pseudo plastic (n <1) shear thinning
flow behavior, and viscoelastic properties with G`` > G`. The viscous nature was more
emphasized than elastic nature due to usage of modified starch as a wall material. The juice
addition changed the color of emulsions and microencapsulated powders by increasing a* and
reducing L* and b* values. During the emulsification and spray drying process blueberry
juice retarded the lipid oxidation. The increased juice addition related to decreased lipid
oxidation in emulsions and powders. Also powders with or without blueberry juice did not
show significant differences in powder morphology even having a higher oil load above 50%.
Particle size of the powders ranged between 20-30 µm. this study indicated that blueberry
juice could be effectively added to the fish oil emulsions in order to prevent potential lipid
oxidation during emulsification and spray drying process without significantly altering
emulsion and powder characteristics.
99
CHAPTER 4 SUMMARY AND CONCLUSIONS
Blueberries have received greater attention owing to their positive effect on human
health and disease prevention. These benefits are mainly related to the presence of
polyphenolics, including anthoycanins, anthocyanidins, flavan-3-ol and flavonols in the fruit.
The importance of blueberries has greatly emphasized their high antioxidant activity
compared to many fruits and vegetables. Recently blueberries are marketed fresh, frozen and
processed into a wide variety of products, including fruit juices, purees and concentrates.
Blueberry juice processors follow thermal pasteurization in order to comply with the FDA
standards of providing 5-log reduction in pertinent micro-organisms present in the juice. But
thermal pasteurization is associated with destruction of anthocyanins and sensory properties.
Consumers have greater demand for fresh like fruit juices with high contents of bioactive
compounds. For this reason non thermal processing techniques are required to test for
microbial inactivation and preservation of juice quality. The aim of this study was to compare
effects of thermal pasteurization and continuous ultra-sonication processing on physico-
chemical and microbiological properties of blueberry juice. Also the aim of this study
extended to evaluation of the effect of blueberry extract on lipid oxidation of
microencapsulated menhaden and salmon oil.
The specific objectives of the study were to : (1) determine the effect of thermal
pasteurization time and temperature on physico-chemical properties and microbial counts of
blueberry juice; (2) determine the effect of ultrasonication flow rate and amplitude in a
continuous system on physico-chemical properties and microbial counts of blueberry juice;
(3) determine the degradation rates of anthocyanins in blueberry juice with thermal
pasteurization; (4) prepare blueberry juice and characterize of the juice for anthocyanins,
polyphenols and antioxidant activity; (5) prepare and evaluate the physico-chemical,
rheological properties, and lipid oxidation of prepared emulsions of menhaden and salmon oil

100
with or without blueberry juice; (6) evaluate the lipid oxidation and fatty acid methyl ester
profile of spray dried microencapsulated powders produced from menhaden and salmon oil
emulsions; (7) evaluate microencapsulated powders for powder properties, color and
microencapsulation efficiency; (8) estimate the production rate and energy requirement for
spray drying of menhaden and salmon oil emulsions in order to produce microencapsulated
powders.
The second chapter was devoted to study and compare the effects of thermal
pasteurization temperature (80, 85 and 90 ºC) and time (1, 2, 3, 4 and 5 min), and
ultrasonication flow rate (24 mL/min and 93.5 mL/min) and amplitude (40%, 80% and
100%) on prepared blueberry juice physical (color), chemical (anthocyanin content, total
phenol content, antioxidant activity, pH, ºBrix and titratable acidity) and microbiological
(aerobic plate count, total coliforms and yeast & mold counts) properties. Microbial counts of
juices reduced with increasing thermal pasteurization and ultrasonication processing
conditions. Ultrasonication showed greater reduction in counts with increased amplitude
(intensity). The study showed increased degradation of anthocyanins with increased
temperature and time in thermal pasteurization while ultrasonication showed no significant
difference. The color of the juice changed with thermal pasteurization conditions while all
ultrasonication processing conditions yielded no differences. Total phenol content of juice
increased with increased conditions of ultrasonication, and in some treatment combinations of
thermal pasteurization indicating an extraction of bio-active compounds from suspended juice
particles. Antioxidant activity of juices increased with sonication intensity and flow rate
related to compound extraction. Antioxidant activity increase associated with thermal
pasteurization at higher temperatures and heating time showed a possibility of occurring
Maillard browning.

101
In chapter three, the effect of blueberry juice (BJ) antioxidants on lipid oxidation of
microencapsulated menhaden and salmon oil during the time of emulsification and spray
drying was studied. All prepared emulsions showed pseudo plastic shear thinning behavior
and viscoelastic properties. Although juice addition changed the emulsion pH and color, there
was no effect on emulsion stability even at a higher oil load at 57%. The lipid oxidation of
fish oil emulsions during emulsification was prevented by blueberry juice addition. The 10%
juice added emulsions (10ESOBJ/10EMOBJ) showed no difference during emulsification
compared to 5% added emulsions (5ESOBJ/5EMOBJ). 10% blueberry juice added emulsions
showed reduced lipid oxidation during the time of spray drying. The juice addition did not
show significant difference in produced microcapsules for particle size and microstructure.
The particle size of microcapsules ranged from 10-20 µm. The BJ added microcapsules
showed better encapsulation efficiencies and lower surface oil contents compared to
microcapsules produced without the juice. However BJ changed the color of microcapsules
by increasing a* and lowering the L*. There was no significant difference in production rate
and energy requirement within salmon and menhaden oil powders.
In summary, ultrasonication continuous system can be effectively used for
pasteurization of blueberry juices in order to preserve bioactive compounds and juice initial
quality. But further research work is necessary to ensure 5-log reduction. Microencapsulation
emulsions can be stabilized using natural antioxidants like blueberry juice in order to prevent
lipid oxidation during emulsification, spray drying and subsequent storage. This study
demonstrated that ultrasonication has a potential to pasteurize blueberry juice, preserving its
initial juice quality. Also blueberry antioxidants can be effectively utilized to prevent lipid
oxidation in spray dried fish oil emulsions and microencapsulated powders.

102
REFERENCES
Acosta, O., Cisse, M., Dhuique-Mayer, C., Dorner, M., & Vailliant, F. (2009). Thermal
degradation kinetics of anthocyanins from blood orange, blackberry, and roselle Using the
Arrhenius, Eyring, and Ball models. Journal of Agriculture and Food Chemistry, 57, 6285–
6291.
Adamiec, J., Delag, A., Strumilo, C., and Zbicinski, I. (2002). Advanced experimental
analysis of drying kinetics in spray drying. Chemical Engineering Journal, 86: 207-216.
Adekunte, A. O., Cullen, P. J., O`Donnell, D. C. P., Scannell, A. G. M., & Tiwari, B. k.
(2010). Effect of sonication on colour, ascorbic acid and yeast inactivation in tomato juice.
Food Chemistry, 122, 500-507.
Aguiló-Aguayo, I., Martín-Belloso, O., & Soliva-Fortuny, R. (2009a). Avoiding non-
enzymatic browning by high-intensity pulsed electric fields in strawberry, tomato and
watermelon juices. Journal of Food Engineering, 92, 37–43.
Aguilò-Aguayo, I., Martin-Belloso., Oms-Oliu, G., & Soliva-Fortuny, R. (2009b). Changes in
quality attributes throughout storage of strawberry juice processed by high-intensity pulsed
electric fields or heat treatments. Food Science and Technology, 42, 813 -818.
AIChe testing procedure. 2003. Spray dryers: A guide to performance evaluation. 2nd
ed.
American Institiute of Chemical Engineers, New York, USA.
Amakura, Y., Umino, Y., Tsuji, S., and Tonogai, Y. (2000). Influence of jam processing on
the radical scavenging activity and phenolic content in berries. Journal of Agriculture and
Food Chemistry, 48:6292-6297.
Anwar, S. H., Kunz, B., and Weissbrodt, J. (2010). Microencapsulation of fish oil by spray
granulation and fluid bed film coating. Journal of Food Science, 75(6): E359-E371.
AOAC, (2005a). AOAC Official Method 2005.02, Total Monomeric Anthocyanin Pigment
Content of Fruit Juices, Beverages, Natural Colorants, and Wines: pH Differential Method.
Journal of AOAC international, 88, 1269.
AOAC, (2005b). Association of Official Analytical Chemists. USA.
AOCS, (1997). American Oil Chemists' Society. Offical method cd 8-53 peroxide value, cd
18-90 p-ansidine value, cg 3-91 recommended practices for assessing oil quality and stability
In Official Methods and Recommended Practices of the American Oil Chemists' Society
Urbana, IL, USA.
Appel, L. J., Harris, W. S., and Kris-Etherton, P. M. (2002). Fish consumption, fish oil,
omega-3 fatty acids, and cardiovascular disease, American Heart Association, 106:2747.
Arlorio, M., CoÏsson, J., Gindro, R., Locatelli, M., Rinaldi, M., & Travaglia, F. (2009). Study
of the DPPH-Scavenging activity: Development of a free software for the correct
interpretation of data. Food Chemistry, 114, 89-897.
103
Ashokkumar, M., and Kentish, S., (2011). The physical and chemical effects of ultrasound In
Ultrasoiund technologies for food and bioprocessing. Feng, H., Barobosa-cànovas, G. V.,
Weiss, J. (ed). Springer, NY, USA. pp1-105.
Ashokkumar, M., Bhaskarachaya, R., Kentish, S., & Zisu, B. (2010). Ultrasonic processing
of dairy systems in large scale reactors. Ultrasonics Sonochemistry, 17, 1075–1081.
Assadpoor, E., Bhandari, B., He, Y., and Jafari, S. M. (2008a). Nano-particle encapsulation
of fish oil by spray drying, Food Research International, 41:172-183.
Assadpoor, E., Bhandari, B., He, Y., and Jafari, S. M. (2008b). Encapsulation efficiency of
food flavors and oils during spray drying. Drying Technology, 26: 816-835.
Augustin, M. A., Cheng, L. J., Sanguansri, L., and Shen, Z. (2010). Oxidative stability of
microencapsulated fish oil powders stabilized by blends of chitosan, modified starch, and
glucose. Journal of Agriculture and Food Chemistry, 58: 4487-4493.
Augustin, M. A., Kosaraju, S. L. and Weerakkody, R. (2009). In-vitor evaluation of
hydrocolloid-based encapsulated fish oil. Food Hydrocolloids, 23: 1413-1419.
Augustin, M. A., Bode, O., and Sanguansri, L. (2006). Maillard reaction products as
encapsulants for fish oil powders. Journal of Food Science, 71(2): E26-E32.
Auty, M. A., Fureby, A., Haahr, A. M., Kelly, J., Kelly, P. M., Keogh, M. K., and
O`Kennedy, B. T. (2001). Stability to oxidation of spray dried fish oil powder
microencapsulated using milk ingredients. Journal of Food Science, 66(2): 217-224.
Azar, M., Brun, S., and Verette, E. (1987). Identification of some phenolic compounds in
bilberry juice Vaccinium myrtillus. Journal of Food Science, 52(5): 1255-1257.
Baik, M. Y., Chinachoti, P., Decker, E. A., McClements, D. J., Nawar, W. W., and Subendro,
E. L. (2004). Effects of antioxidants and humidity on the oxidative stability of
microencapsulated fish oil. Journal of the American Oil Chemists Society, 81(4): 355-360.
Barrow, C. J., Holub, B. J., and Nolan, C. (2009). Bioequivalence of encapsulated and
microencapsulated fish oil upplementation. Journal of Functional Foods, 1: 38-43.
Barobosa-canovas, G., Fneg, H., and Weiss, J. 2011. Ultrasound technologies for food and
bio processing. Springen, USA. Pp 1-35.
Bates, D., & Patist, A. (2008). Ultrasonic innovations in the food industry: from the
laboratory to commercial production. Innovative Food Science and Emerging Technologies,
9, 147.154.
Bankston, J. D., Pu, J., and Sathivel, S. (2011). Developing microencapsulated flaxseed oil
containing shrimp (Litopenaeus setiferus) astaxanthin using a pilot scale spray dryer.
Biosystems Engineering. 108:121-132.

104
Bauersfeld, P. E., Galloway, S. B., Hale, M. B., and Joseph, J. D. (1991). New products and
markets for menhaden, Brevoortia spp. Marine Fisheries review, 53(4): 42-48.
Bechtel, P. J., Sathivel, S., and Wan, Y. (2011). Physical and nutritional properties of baby
food containing menhaden oil (Brevoortia tyrannus) and microencapsulated menhaden oil.
LWT-Food Science and Technology, 44: 576-581.
Bechtel, P., King, J. M., Sathivel, S., and Yin, H. (2009). Physical and nutritional roperties of
catfish roe spray dried protein powder and its application in an emulsion system. Journal of
Food Engineering, 95: 76-81.
Behchtel, P. J. and Wu, T. H. (2008). Salmon by-product storage and oil extraction, Food
Chemistry, 111: 868-871.
Beecher, G. R., Gebhardt, E., Haytowitz, D. B., Holdon, J. M., Prior, R. L., and Wu, X.
(2004). Lipophilic and hydrophilic antioxidant capacities of common foods in the United
States. Journal of Agriculture and Food Chemistry, 52:4026-4037.
Beindroff, C. M., and Zidam, N. J. (2010). Microencapsulation of fish oil in Encapsulation
technologies for active food ingredients and food processing, Nedovic, V. A., and Zuidam, N.
J.(ed). Springer, NY. USA. Pp 161-170.
Berg, S., and Drusch, S. (2008). Extractable oil in microcapsules prepared by spray drying:
Localisation, determination and impact on oxidative stability. Food Chemistry, 109: 17-24.
Berger, S., Kolanowski, W., and ṥwiderski, F. (1999). Possibilities of fish oil application for
food products enrichment with ω-3 PUFA. Intrnational Journal of Food Science and
Nutrition, 50: 39-49.
Bhandari, B., He, Y., and Jafari, S. M. (2007a). Encapsulation of nanoparticles of d-limonene
by spray drying: role of emulsifiers and emulsifying techniques. Drying Technology,
25:1079-1083.
Bhandari, B., He, Y., Jafari, S. M. (2007b). Role of powder partivcle zsize on the
encapsulation efficiency of oils during spray drying. Drying Technology, 25: 1091-1099.
Bi, A., Brala, A., Bursa, D., Evi, K., Dragovi-Uzelac, V., Levaj, B., and Savi, Z. (2010).
Evaluation of phnolic content and antioxidant capacity of blueberry cultivars (Vaccinium
corymbosum L.) grown in the northwest Croatia. Food Technol Biotechnol., 48(2): 214-221.
Bohin, M., Cuvelier, M. E., Dumoulin, E., Fuchs, M., Ordonnaud, C., Peyrat-Maillard, M. N.,
and Turchiulli, C. (2006). Encapsulation of oil in powder using spray drying and fluidized
bed agglomeration. Journal of Food Engineering, 75: 27-35.
Booth, S. L., Cao, G., Sadowski, J. A., and Prior, R. L. (1998). Increases in human plasma
antioxidant capacity after consumption of controlled diets high in fruit and vegetables.
American Journal of Clinical Nutrition, 68:1081-1087.
105
Bourke, P., Cullen, P. J., Frĭas, J. M., Kelly, B., & Patil, S. (2009). The effects of acid
adaptation on Escherichia coli inactivation using power ultrasound. Innovative Food Science
and Emerging Technologies, 10, 486-490.
Boyd, L. C., Dean, L. L., & Leavens, J. B. (2010). Processing effects on the flavor and
quality of blueberries in Flavors in noncarbonated beverages. American Chemical Society,
Washington, DC (pp 129-141).
Bozkurt, H. S., Eren, S., & Së, F. G. U. (1999). Nonenzymic browning reactions in boiled
grape juice and its models during storage. Food Chemistry, 64, 89-93.
Bralley, J. A., Church, T. S., David, R. M., Earnest, C. P., Hammar, M. K., Mikus, C. R., and
Munsey, M. (2009). Microencapsulated foods as a functional delivery vehicle for omega-3
fatty acids: a pilot study. Journal of the International Society of Sports Nutrition, 6:12.
Britten, M., Fustier, P., Taherian, A. R., and Ramaswamy, H. S. (2008). Rheology and
stability of beverage emulsions in the presence and absence of weighting agents: A review.
Food Biophysics, 3: 279-286.
Browning, L. M., Bryant, S. P., Jebb, S. A., Krebs, J. D., M iller, G. J., Mishra, G. D., and
Moore, C. S. (2006). Oily fish reduces plasma triacylglycerols: a primary prevention study in
overweight men and women. Nutrition, 22: 1012-1024.
Brownmiller, C., Howard, L. R., & Prior, R. L. (2008). Processing and storage effects on
monomeric anthocyanins, percent polymeric color, and antioxidant capacity of processed
blueberry products. Journal of Food Science, 73(5), H72-H79.
Brunton, N. P., O’Donnell, C., Patras, A., & Tiwari, B. K. (2010a). Effect of thermal
processing on anthocyanin stability in foods; mechanisms and kinetics of degradation. Trends
in Food Science and Technology, 21, 3-11.
Brunton, N., Cullen, P. J., O`Donnell, C. P., Patras, A., & Tiwari, B. K. (2010b). Effect of
ultrasound processing on anthocyanins and color of red grape juice. Ultrasonics
Sonochemistry, 17, 598-604.
Brunton, N., Cullen, P. J., O`Donnell, C. P., Patras, A., & Tiwari, B. K. (2009a). Stability of
anthocyanins and ascorbic acid in sonicated strawberry juice during storage. European Food
Research and Technology, 228, 717-724.
Brunton, P., Butler, F., Patras, A., & Pieve, S. D. (2009b). Impact of high pressure processing
on total antioxidant activity, phenolic, ascorbic acid, anthocyanin content and colour of
strawberry and blackberry purees. Innovative Food Science and Emerging Technologies, 10,
308–313.
Buchert, J., Mokkila, M., Mustranta, A., & Poutanen, K. (2004). Combining power
ultrasound with enzymes in berry juice processing. 2nd
Int. Conf. Biocatalysis of Food and
Drinks, Stugart, Germany.
106
Buckow, R., Kanstell, A., Terefe, N. S., & Versteeg, C. (2010). Pressure and temperature
effects on degradation kinetics and storage stability of total anthocyanins in blueberry juice.
Journal of Agriculture and Food Chemistry, 58, 10076–10084.
Butz, P., & Tauscher, B. (2009). Emerging technologies: chemical aspects. Food Research
International, 35, 279 – 284.
Cao, G., Ehlenfeldt, M., Kalt, W., Krewer, G., Lischner, N., Mainland, C. M., Martin, A.,
Mceven, J., O,Brien, C., Prior, R. L., and Sofic, E., (1998). Antioxidant capacity as
influenced by total phenolic and anthocyanin content, maturity, and variety of Vaccinium
species, Journal of Agricultural and Food Chemistry, 46:2686-2693.
Carle, R., Sadilova, E., & Stintzing, F. C. (2007). Thermal degradation of anthocyanins and
its impact on colour and in vitro antioxidant capacity. Molecular Nutrition & Food Research,
51, 1461 – 1471.
Capelo-MartRnez, J., Lodeiro, C., and Santos, H. S. (2009). The power ultrasound In
Ultrasound In chemistry: analytical applications. Wiley-VCH, Germany, pp 1-16.
Chambin, O., Gharsallaoui, A., Roudaut, G., Saurel, R., and Voilley, A. (2007). Applications
of spray drying in microencapsulation of food ingredients: An overview. Food Research
International, 40: 1107-1121.
Chan, L. W., Heng, P. W. S., and Tan, L. H. (2009). Alginate/starch composites as wall
material to achieve microencapsulation with high oil loading, Journal of Microencapsulation,
26(3): 263-271.
Chan, L. W., Heng, P. W. S., and Tan, L. H. 2005. Effect of oil loading on microspheres
produced by spray drying. Journal of Microencapsulation, 22(3): 253-259.
Chang, Y.I.; Scire, J.; Jacobs, B. (1988). Effect of particle-size and microstructure properties
on encapsulated orange oil. ACS Symposium Series, 370, 87–102.
Chemat, F., Costes, P., Grondin, I., Moutoussamy, L., Sing, S. C., and Smadja, J. (2004).
High power ultrasound on lipid oxidation of refined sunflower oil. Ultrasonics
Sonochemistry, 11: 281-285
Chen, T., Hui, Y., Loi, Y. M., Yuani, Y., & Yuei, T. (2009). Effect of ultrasonic treatments
on thermoacidophilic Alicyclobacillus acidoterrestris in apple juice. Journal of Food
Procesing and Preservation, 33(3), 370-383.
Chen, J., Fang, Z., Liu, D., Ma, Y., Xu, G., & Ye, X. (2008a). Phenolic compounds and
antioxidant activity of extracts from ultrasonic treatment of Satsuma mandarin (Citrus Unshin
marc.) peels. Journal of Agriculture and Food Chemistry, 56, 5682-5690.
Chen, J. C., Liu, D. H., Ma, Y. G., & Ye, X. Q. (2008b). Effect of ultrasonic treatment on the
total phenolic and antioxidant activity of extracts from citrus peel. Journal of Food Science,
73(8), T117-T120.

107
Chen, L. H., Liew, F. F., & Soh, C. Y. (2007a). Effects of sonication and carbonation on
guava juice quality. Food Chemistry, 104, 1396-1401.
Chen, J., Liu, D., Xu, G., & Ye, X. (2007b). Effect of heat treatment on the phnolic
compounds and antioxidant capacity of citrus peel extract. Journal of Agriculture and Food
Chemistry, 55, 330-335.
Chien, P., and Su, M. (2007). Antioxidant activity, anthoycnains, and phenolics of rabbiteye
blueberry (Vaccinium ashei) fluid products as affected by fermentation. Food Chemistry,
104: 182-187.
Chouliara, E., Georgogianni, K. G., Kanellopoulou, N., & Kontominas, M. G. (2010). Effect
of ultrasonication on microbiological, chemical and sensory properties of raw, thermized and
pasteurized milk. International Dairy Journal, 20, 307-313.
Colakoglu, A. S. (2007). Oxidation kinetics of soybean oil in the presence of monoolein,
stearic acid and iron. Food Chemistry, 101(2):724-728.
Cullen, P. J., O.Donnell, C. P., Tiwari, B. K., & Valdramidis, V. P. (2010). Quantitative
modeling approaches for ascorbic acid degradation and non-enzymatic browning of orange
juice during ultrasound processing. Journal of Food Engineering, 96(3), 449-454.
Cullen, P. J., O`Donnell, C. P., & Tiwari, B. K. (2009a). Effect of sonication on retention of
anthocyanins in blackberry juice. Journal of Food Engineering, 93,166-171.
Cullen, P. J., Muthukumarappan, K., O`Donnell, C. P., & Tiwari, B. K. (2009b). Effect of
sonication on orange juice quality parameters during storage. International Journal of Food
Science and Technology, 44, 586–595.
Cullen, P. J., Muthukumarappan, K., O`Donnell, C. P., & Tiwari, B. K. (2008). Effects of
Sonication on the Kinetics of Orange Juice Quality Parameters. Journal of Agriculture and
Food Chemistry, 56, 2423–2428.
D`Amico, D. J., GuO, M., Silk, T. M., & Wu, J. (2006). Inactivation of microorganisms in
milk and apple cider treated with ultrasound. Journal of Food protection, 69(3), 556-563.
Deeth, H. C., Griffiths, M. W., Mittal, G. S., & Ross, A. I. V. (2003). Combining non-thermal
technologies to control food borne microorganisms. International Journal of Food
Microbiology, 89, 125 -138.
Donner, H., Kalt, W., and McDonald, J. E. (2000). Anthocyanins, phenolics, and antioxidant
capacity of processed lowbush blueberry products. Journal of Food Science, 65(3): 390-393.
Drusch, S., Schwarz, K., and Serfert, Y. (2010). Sensory odour profiling and lipid oxidation
status of fish oil and microencapsulated fish oil, Food Chemistry, 123: 968-975.
Drusch, S., Schwarz, K., and Serfert, Y. (2009a). Chemical stabilization of oils rich in long-
chain polyunsaturated fatty acids during homogenization, microencapsulation and storage.
Food Chemistry, 113: 1106–1112.

108
Drusch, S, and Mannino, S. (2009b). Patent-based review on industrial approaches for the
microencapsulation of oils rich in polyunsaturated fatty acids. Trends in Food Science and
Technology, 20:237-244.
Drusch, S., Kind, M., Schmidt-Hansberg, B., Schwarz, K., and Serfert, Y. (2009c). Process
engineering parameters and type of n-octenylsuccinate-derivatised starch affect oxidative
stability of microencapsulated long chain polyunsaturated fatty acids. Journal of Food
Engineering, 95: 386-392
Drusch, S., Scamicchio, M., Schmidt-hansberg, and Schwarz, K. (2007). Impact of physico-
chemical characteristics on the oxidative stability of fish oil microencapsulated by spray-
drying. Journal of Agriculure and Food Chemistry., 55: 11044-11051.
Drusch, S., Schwarz, K., and Serfert, Y. (2006a). Microencapsulation of fish oil with n-
octenylsuccinate-derivatised starch: Flow properties and oxidative stability, European.
Journal of. Lipid Science and Technology 108: 501–512.
Drusch, S., and Schwarz, K. (2006b). Microencapsulation properties of two different types of
n-octenylsuccinate-derivatized starch. Euopean Food Research Technology, 222: 155-164.
Drusch, S., Serfert, Y., Van Den Heuvel, A., & Schwarz, K. (2006c). Physicochemical
characterization and oxidative stability of fish oil encapsulated in an amorphous matrix
containing trehalose. Food Research International, 39, 807–815.
Dunford, N. T., and Legako, J. (2010). Effect of spray nozzle design on fish oil whey protein
microcapsule properties. Journal of Food Science, 75(6): E395-E400.
Durst, R. W. Lee, J., and Wrostland, R. E. (2002). Impact of juice processing on blueberry
anthoycyanins and polyphenolics: comparison of two pretreatments. Journal of Food Science,
67(5): 1660-1667.
Durst, R. W., Skrede, G., & Wrolstad, R. E. (2000). Changes in antohcyanins and
polyphenolics during juice processing of highbush blueberries (Vaccinium corymbosum L.).
Journal of Food Science, 65(2), 357-364.
Ehlenfeldt, M. K., Meredith, F. I., and Ballington, J. R. 1994. Unique organic profile of
rabbiteye vs. highbush blueberries. Horticulture Science,29(4):321–3.
Elmehdi, H.M., Page, J. H., and Scanlon, M. G. (2003). Using ultrasound to investigate the
cellular structure of bread crumb. Journal of Cereal Science, 38, 33–42.
Erdman, J. W., Lila, M. A., and Schmidt, B. M. (2005). Effects of food processing on
blueberry antiproliferation and antioxidant activity. Journal of Food Science, 70(6): S389-
S394.
Ersus, S., and Yurdagel, U. (2007). Microencapsulation of anthocyanin pigments of black
carrot (Daucuscarota L.) by spray drier. Journal of Food Engineering, 80:805-812.
109
Faria, A., Freitas, V. D., Gameiro, P., Mateus, A. N., Neves, P., Oliveria, J., and Santos-
Buelga, C., (2005). Antioxidant properties of prepared blueberry (Vaccinium myrtillus)
extracts. Journal of Agriculture and Food Chemistry, 53:6896-6902.
Feng, H., Lee, B., Martin, S. E., & Zhou, B. (2009). Effect of pH on inactivation of
Escherichia coli k12 by sonication, manosonication, thermosonication and
manothermosonication. Journal of Food Science, 74(4), E191-E198.
Feng, H., Heilscher, T., & Yang, W. (2008). Power ultrasound. Food Science and Technology
International, 14, 433-436.
Flint, E. B. and Suslick, K. S. (1991). The Temperature of Cavitation, Science, 253, 1397-
1399.
Franke, K., and Heinzelmann, K. (1999). Using freezing and drying techniques of emulsions
for the microencapsulation of fish oil to improve oxidation stability. Colloids and Surfaces B:
Biointerfaces, 12: 223-229.
Frankel, E. N., (1996). Antioxidants in foods and food quality. Food Chemistry, 57(1):51-55.
Fujishima, N., Kangani, Y., Kometani, T., Matsuda, K., Matsumura, Y., and Sugimura, S.
(2003). Oxidative stability, Structure, and physical characteristics of microcapsules formed
by spray drying of fish oil with protein and dextrin wall materials. Journal of Food Science,
68(7): 2248-2255.
Garg, M. L., Moughan, P. J., Singh, H., and Wood, L. G. (2006). Means of delivering
recommended levels of long chain n-3 polyunsaturated fatty acids in human diets. Journal of
Food Science, 71(5): R66-R71.
Gilmore, W. S., Kelly, P. M., Keogh, M. K., M`arquez-Ruiz, G., McCabe, A. J., McGlynn,
H., Murray, C. A., Robson, P. J., Strain, J. J., and Wallace, J. M. W. (2000). Bioavailability
of n-3 polyunsaturated fatty acids (PUFA) in foods enriched with microencapsulated fish oil.
Annals of Nutrition and Metabolism, 44: 157-162.
Girard, K. K., Hui, Y. H., and Sinha, N. K. (2006). Cranberry, blueberry, currant, and
gooseberry (chapter 21) In Handbook of fruits and fruit processing, Blackwell Publishing,
USA.
Giradin, M., Kader, F., Metche, M., and Rovel, B. (1997). Mehcanism of browning in fresh
highbush blueberry fruit (Vaccinium corymbosum L). role of blueberry polyphenol oxidase,
chlorogenic acid and anthocyanins. Journal of the Science of Food and Agriculture, 74: 31-
34.
Girardin, M., Kader, F., Metche, M., and Rovel, B. (1996). Fractionation and identification of
the phenolic compounds of highbush blueberries (Vaccinium corymbosum L.). Food
Chemistry, 55(1): 35-40.
110
Gombas, D. E., Nogueira, M. C. L., & Oyarzabal, O. A. (2003). Survival of Escherichia coli
O157:H7, Listeria monocytogenes, and Salmonella in juice concentrates. Journal of Food
Protection, 66, 1595−1598.
Gòmez-Lòpez, V. M., Martĭnez-Yépez, A., Orsolani, L., & Tapia, M. S. (2010).
Microbiological and sensory quality of sonicated calcium added orange juice. Food Science
and Technology, 43,808-813.
Gonzalez, E., Lòpez, J., Miranda, M., Scala, K. D., Uribe, E., Vega-Gălvez, A., & Vergara, J.
(2010). Effect of air temperature on drying kinetics, vitamin C, antioxidant activity, total
phenolic content, non-enzymatic browning and firmness of blueberries variety o`neil. Food
Bioprocess Technology, 33, 772-777.
Guimarăes, P. V. R., Kechinski, C. P. K., Marczak, L. D. F., Noreňa, C. P. Z., & Tessaro, I.
C. (2010). Degradation kinetics of anthocyanin in blueberry juice during thermal treatment.
Journal of Food Science, 75 (2), C173-C176.
Gunasekaran, S., and Sun, C. (2010). Rheology and oxidative stability of whey protein
isolate-stabilized menhaden oil-in-water emulsions as a function of heat treatment. Journal of
Food Science, 75(1): C3-C8.
Häkkinen, S., Heinonen, M., Karenlampi, S., Mykkanen, H., Ruuskanen, J., and Törrönen, R.
(1999). Screening of selected flavonoids and phenolic acids in 19 berries. Food Research
International, 32:345-353.
Halliwell, B., and Chirico, S. (1993). Lipid-Peroxidation - Its Mechanism, Measurement, and
Significance. American Journal of Clinical Nutrition, (5):S715-S725.
Haluk, J., Kader, F., Metche, M., and Nicolas, J. (1998). Degradation of cyaniding-3-
glucoside by blueberry polyphenol oxidase: Kinetic studies and mechanisms. Journal of
Agriculture and Food Chemistry, 46: 3060-3065.
Hielscher, T. (2005). Ultrasonic production of nano-size dispersions and emulsions. Paper
presented at 1st Workshop on Nano Technology Transfer, ENS Paris, 14–16 December, Paris
France.
Heinz, V., Knorr, D., Lee, D., & Zenker, M. (2004). Applications and potential of ultrasonics
in food processing. Trends in Food Science and Technology, 15, 261-266.
Heinz, V., Knorr, D., & Zenker, M. (2003). Application of ultrasound-assisted thermal
processing for preservation and quality retention of liquid foods. Journal of Food Protection,
66(9), 1642-1649.
Hendrickx, M., Loey, A. V., Oey, I., Plancken, V. D., & Verbeyst, L. (2010). Kinetic study
on the thermal and pressure degradation of anthocyanins in strawberries. Food Chemistry,
123, 269–274.

111
Hendrick, M., Loey, A. V., & Rodrigo, D. (2007). Combined thermal and high pressure
colour degradation of tomato puree and strawberry juice. Journal of Food Engineering, 79,
553–560.
Hogan, S. A., O`Riordan, E. D., and O`Sullivan, M. (2003). Microencapsulation and
oxidative stability of spray dried fish oil emulsions. Journal of Microencapsulation, 20(5):
675-688.
Homayouni, A., Azizi, A., Ehsani, M. R., Yarmand, M. S., and Razavi, S. H. (2008). Effect
of microencapsulation and resistant starch on the probiotic survival and sensory properties of
synbiotic ice cream. Food Chemistry, 111(1):50-55.
Hoover, D. G. (2000). Ultrasound. Journal of Food Safety, 65, 93-95.
Huang, Y., and Klaypradit, W. (2008). Fish oil encapsulation with chitosan using ultrasonic
atomizer. LWT, 1133-1139.
Hui, M., Lui, O., Wang, A., and Xie, Y. (2010). The effects of rheological properties of wall
materials on morphology and particle size distribution of microcapsule. Journal of Food
Science, 28(5): 433-439.
IFFO, (2008). The healthiest omega-3s EPA and DHA are found mainly in fish oil and
fishmeal, www.iffo.net .Hertfordshire, UK.
IFFO. (2005). The production of fish meal and fish oil from gulf menhaden.
http://www.iffo.net/downloads/63.pdf, International fish meal and fish oil organization, UK.
Irmouli, M., Kader, F., Metche, M., and Nicolas, J. P. (2002). Involvement of blueberry
peroxidase in the mechanisms of anthoycyanin degradation in blueberry juice. Journal of
Food Science, 67(3): 910-915.
Jaworska, D., Kolanowski, W., Kunz, B., and Weiβbrodt. (2007). Sensory assessmenet of
microencapsulated fish oil powder. Journal of American Oil Chemists Society, 84: 37-45.
Jaeger, H., Janositz, A., & Knorr, D. (2010). The Maillard reaction and its control during
food processing: The potential of emerging technologies. Pathologie Biologie, 58, 207–213.
Jong, P. D., & Villamiel, M. (2000). Inactivation of Pseudomonas flourescens and
Streptococcus thermophiles in trypticase soy broth and total bacteria in milk by continuous
flow ultrasonic treatment and conventional heating. Journal of Food Engineering, 45, 171-
179.
Kader, F., Metche, M., and Nicolas, J. (1999). Degradation of pelargonidin 3-glucoside in the
presence of chlorogenic acid and blueberry polyphenol oxidase. Journal of the Science of
Food and Agriculture,79: 517-522
Kalt, W., McDonald, J.E., and Donner, H. (2000). Anthocyanins, phenolics, and antioxidant
capacity of processed lowbush blueberry products. Journal of Food Science, 65:390-393.
112
Kalt, W. and Dufour, D. (1997). Health functionality of blueberries. Horticulture Technology,
7:216-221.
Kim, T., & Silva, J. L. (2004). Effects of continuous ultrasound on selected characteristics of
orange juice. Journal of Food Technology, 2(3), 120-124.
Kolanowski, W., Kunz, B.,Laufenberg, G., Weibbrodt, J. and Ziolkowski, M. (2006).
Microencapsulation of fish oil by spray drying-impact on oxidative stability. Part 1,
European Food Research Technology, 222: 336-342.
Kruif, C. G. D., Meer, R. V. D., and Schrooyen, P. M. M. (2001). Microencapsulation: its
application in nutrition, Proceedings of the nutrition society, 60:475-479.
Kuley, E., Zogul, F. O., and Zogul, Y. O. (2009). Quality changes of marinated tench (Tinca
tinca) during refrigerated storage. Food Science and Technology International, 15(5):513-
521.
Ladikos, D., and Lougovois, V. (1990). Lipid Oxidation in Muscle Foods - a Review. Food
Chemistry, 35(4):295-314.
Langrish, T. A. G. (2009). Multi-scale mathematical modeling of spray dryers. Journal of
Food Engineering, 93: 218-228.
Laufenberg, G., and Kolanowski, W. (2006). Enrichment of food products with
polyunsaturated fatty acids by fish oil addition. European Food Research Technology, 222:
472-477.
Law, E. C., Osman, H., and Suria, A. R. (2001). Fatty acid composition and cholesterol
content of selected marine fish in Malaysian waters. Food Chemistry, 73: 55-60.
Liu, T., and Yang, T. (2011). Optimization of emulsification and microencapsulation of
evening primrose oil and its oxidative stability during storage by response surface
methodology. Journal of Food Quality, 34: 64-73.
Lorimer, J. P., Mason, T. J., & Paniwnyk, L. (1996). The uses of ultrasound in food
technology. Ultrasounds Sonochemistry, 3, s253-s260.
Lorimer, J. P., and Mason, T. J. (1987), Sonochemistry Part 1. The Physical Aspects.
Chemical Society Reviews, 16, 239–274.
Maxwell, R. J.; Marmer, W. N. (1983). Systematic protocol for the accumulation of fatty acid
data from multiple tissue samples: tissue handling, lipid extraction and class separation, and
capillary gas chromatographic analysis. Lipids, 18, 453.
Mcclements, D J. (1995). Advances in the application of ultrasound in food analysis and
processing. Trends in Food Science & Technology. 6, 293-299.
McDonald, R. E, and Min, D. B. (1996). Food lipids and health. New York: Marcel Dekker.
Mckellar, R. C., Mohareb, E., & Piyadena, P. (2003). Inactivation of microbes using
ultrasound: a review. International Journal of Food Microbiology, 87, 207-216.

113
Min S., Mistry B.S., and Lee H.O. (2003). Improvement of oxidative and emulsion stability
of model salad dressing by glucose oxidase-catalase. Journal of Food Science. 68. 1272-5.
Muthukumaran, S., Kentish, S. E., Stevens, G. W., and Ashokkumar, M. (2006). Application
of ultrasound in membrane separation processes: A review. Review of Chemical Engineering,
22, 155–194.
NASS, (2006). National Agricultural Statistics Service. US Department of Agrriculture.
O`Brien, W. D., Scherba, G., & Weigel, R. M. (1991). Quantitative assessment of the
germicidal efficacy of ultrasonic energy. Applied and Environmental Microbiology, 57(7),
2079-2084.
Oliveira, A. C. M., and P. Bechtel. 2005. Lipid composition of Alaska pink salmon
(Oncorhynchus gorbuscha) and Alaska walleye Pollock (Theragra chalcogramma)
byproducts. Journal of Aquatic Food Product Technology 14: 73-91.
Oxygen Radical Absorbance Capacity (ORAC) of Selected Foods. (2007). Nutrient Data
Laboratory Beltsville Human Nutrition Research Center (BHNRC) Agricultural Research
Service (ARS), U.S. Department of Agriculture.
Parish, M. E., (1997). Public health and non-pasteurized fruit juices. Critical Reviews in
Microbiology, 23(2), 109-119.
Pérez, A., Vaillant, F., & Wong, E. (2010). Osmonication of blackberry juice:impact on
selected pathogens, spoilage microorganisms, and main quality parameters. Journal of Food
Science, 75, M468-M474.
Povey, M., and Mason, T. (1998). Ultrasound in food processing. London, Blackie Academic
and Professional.
Prapulla, S. G., Ramesh, M. N., & Vikram, V. B. (2005). Thermal degradation kinetics of
nutrients in ornage juice heated by electromagnetic and conventional methods. Journal of
Food Engineering, 69, 31-40.
Roberts, J. S., & Saleeh-Mack, S. Z. (2007). Ultrasound pasteurization: The effects of
temperature, soluble solids, organic acids and pH on the inactivation of Escherichia coli
ATCC 25922. Ultrasonics Sonochemistry, 14, 323–329.
Sellappan, S., Akoh, C.C., and Krewer, G. (2002). Phenolic compounds and antioxidant
capacity of Georgia-grown blueberries and blackberries. Journal of Agriculture and Food
Chemistry, 50:2432- 2438.
Shahidi, F., and Wanasundara, U. N. (2007). Storage stability of microencapsulated seal
blubber oil. Journal of Food Lipids. 2(2): 73-86.
Shahidi, F., and Han, X. Q. (1993). Encapsulation of Food Ingredients. Critcal Review Food
Science, 33(6):501-547.

114
Singh, R. P., & Heldman, D. R. (2001). Introduction to food engineering. San Diego, CA:
Academic Press.
Singleton, V. L., & Slinkard, K., (1997). Total phenol analysis: Automation and comparison
with manual methods. American Journal of Enology and Viticulture, 28, 49-55.
Soria, A. C., & Villamiel, M. (2010). Effect of ultrasound on the technological properties and
bioactivity of foods: a review. Trends in Food Science and Technology, 21, 323-331.
Tabilo-Munizaga and Barbosa-Cànovas, G. V. (2005). Rheology for the food industry,
Journal of Food Engineering, 67: 147-56.
Tadros, T. F. (1994). Fundamental principles of emulsion rheology and their applications,
Colloids and Surface Physicochemical and Engineering Aspects, 91: 39-55.
Toledo, R., & Yilmaz, Y. (2005). Antioxidant activity of water-soluble Maillard reaction
products. Food Chemistry, 93, 273-278.
Trehane, J. 2004. Blueberries, cranberries and other vacciniums. Royal Horticultue Society,
Hong Kong. Pp 87-100.
USDA, 2004. USDA National Nutrient Database for standard reference. Betsville Human
Nutrition Research Center, ARS.
USFDA (U. S. Food & Drug Administration) (2001). Hazard analysis and critical control
point (HACCP); Procedures for the safe and sanitary processing and importing of juice; Final
rule (21 CFR 20) Federal register, vol. 66: 6137−6202.
Wang, S. Y., and Zheng, W., (2003). Oxygen radical absorbing capacity of phenolics in
blueberries, cranberries, chokeberries, and lingonberries, Journal of Agricultural and Food
Chemistry, 51, 502-509.

115
APPENDIX A: BLUEBERRY JUICE TAC, TPC AND AA GRAPHS FOR THERMAL
PASTEURIZATION AND ULTRASONICATION
Total anthocyanin content (TAC) of thermally pasteurized blueberry juice as a function of
heating time
Total phenol content (TPC) of thermally pasteurized blueberry juice as a function heating
time
0
50
100
150
200
250
300
350
400
450
0 1 2 3 4 5
TA
C m
g/l
(cy
a-3
-glu
)
Heating time (min)
Total anthocyanin content
80°C
85°C
90°C
0
500
1000
1500
2000
2500
3000
0 1 2 3 4 5
mg/l
gall
ic a
cid
eq
.
Heating time (min)
Total phenol content
80°C
85°C
90°C

116
Total phenol content (TPC) of sonicated blueberry juice as a function of amplitude
Antioxidant activity (AA) of thermally pasteurized blueberry juice changes with heating time
0
500
1000
1500
2000
2500
3000
0 20 40 60 80 100
mg/l
gal
lic
acid
Amplitude (%)
Total phenol content
24 mL/min
93.5 mL/min
0
1
2
3
4
5
6
7
0 1 2 3 4 5
mm
ol
TE
/100 m
L
Heating time (min)
Antioxidant activity (DPPH)
80°C
85°C
90°C
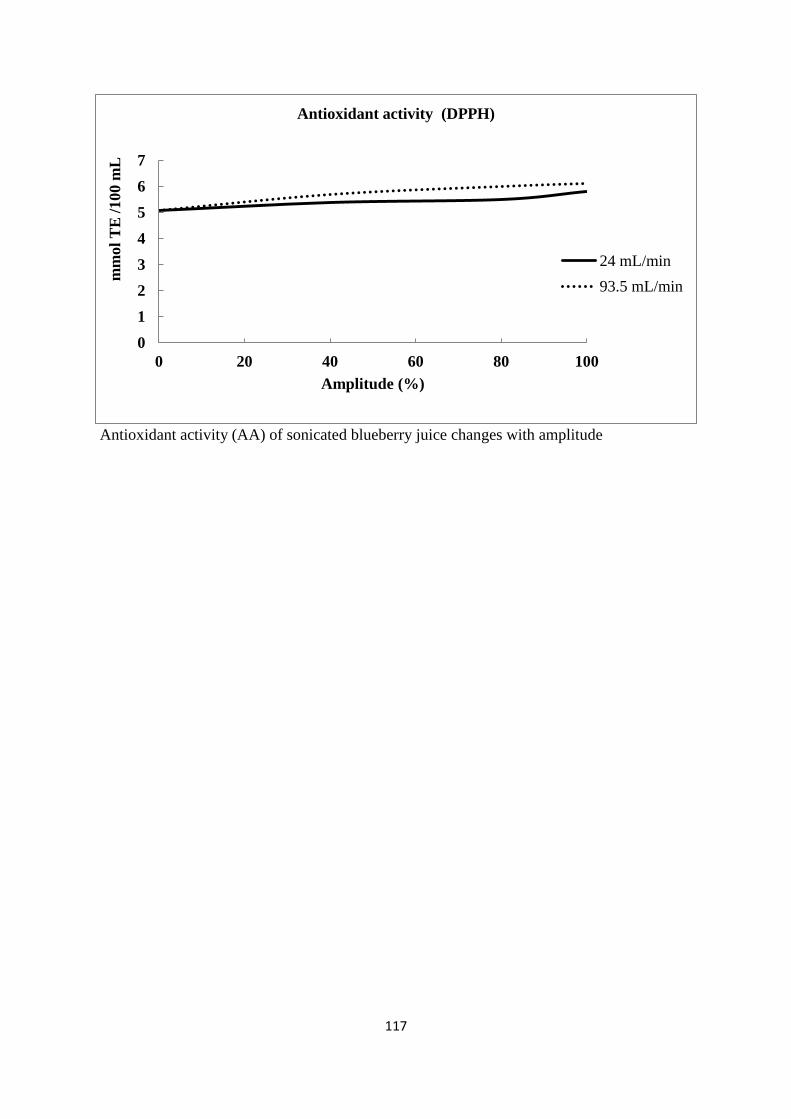
117
Antioxidant activity (AA) of sonicated blueberry juice changes with amplitude
0
1
2
3
4
5
6
7
0 20 40 60 80 100
mm
ol
TE
/100 m
L
Amplitude (%)
Antioxidant activity (DPPH)
24 mL/min
93.5 mL/min

118
APPENDIX B: SPRAY DRYING PERFORMANCE
During the time of spray drying, temperature, relative humidity, and air velocity of
ambient air and exhaust air was measured using an Omega 4-in-1 multifunctional
anemometer (Omega Engineering, Stamford, CT, USA). Moisture content of emulsions,
microencapsulated powder and dust were analyzed using a SMART system 5 microwave
moisture/solids analyzer (CEM Corporation, Matthews, NC, USA). The ambient and exhaust
air pipe inner diameters were measured. The temperature of emulsion, powders and dust were
measured.
Actual and estimate powder production rate
The actual microencapsulated powder production rate was calculated according to the
procedure given by Bankston and others (2011). The overall mass balance of dry solids (basis
of one hour) during spray drying was represented by the Equation (1).
(1)
Where me represents emulsion flow rate (Kg dry solids/h) and md represents dust flow
rate (kg dry solids /h). Following this equation the estimated microencapsulated powder
production rate (mP) was calculated. The mP includes the powder collected from cyclone and
powder retained in the spray dryer.
For the purpose of the mass balance calculation, the powder retained in the spray drier
and powder collected from cyclone was assumed to have similar physical properties. The
actual powder production rate was calculated using collected powder in the cyclone vessel,
and it was compared with the estimated production rate (mP).

119
Evaporation rate
The total mass balance for water entering and leaving the spray dryer was calculated
according to the Equation (2).
maaAHaa + mewe = maoAHao + mdwd + mpwp (2)
Where maa and mao represent flow rate of dry air mass (Kg dry air/h) of inlet ambient
air and outlet air respectively. me and md represent mass flow rate (kg dry solids/hr) of
emulsion and dust respectively. AHaa and AHao represent absolute humidity (kg water/kg dry
air) of inlet ambient air and outlet air respectively. The we, wd, wp represents moisture content
in dry basis (kg water/ kg dry solids) of emulsion, dust and product respectively.
Material flow diagram for spray drying of fish oil emulsions
Evaporation rate of the drying process was calculated following two different
methods (Bankston and others 2011), as based on moisture uptake by the air (Eva), and
moisture content of the emulsion, powder collected through cyclone vessel and dust (Evp)
according to corresponding Equations of (3) and (4).
Eva = maoAHao - maaAHaa (3)
Inlet ambient air
maa, AHaaTaa
Heater Drying chamber
Drying air
Emulsion me we Outlet air
mao AHao Dust md wd
Air + Dust
+ Powder Cyclone
Powder mp wP

120
Evp = mewe – mdwd – mpwp (4)
Estimation of energy required to produce microcapsules
The Equation (5) was used to calculate the energy required to heat inlet ambient air
explained by Singh and Heldman (2001).
Q = maacpʌT = maa(Caa + CvAHaa) (Tad –Taa) (5)
Where Cp, Caa and Cv is specific heat (KJ/KgK) of inlet ambient air, inlet ambient dry
air and water vapor respectively. ʌT represent temperature difference between inlet ambient
air and heated air (K). Taa and Tad represent temperature (K) of inlet drying air and inlet
ambient air respectively.
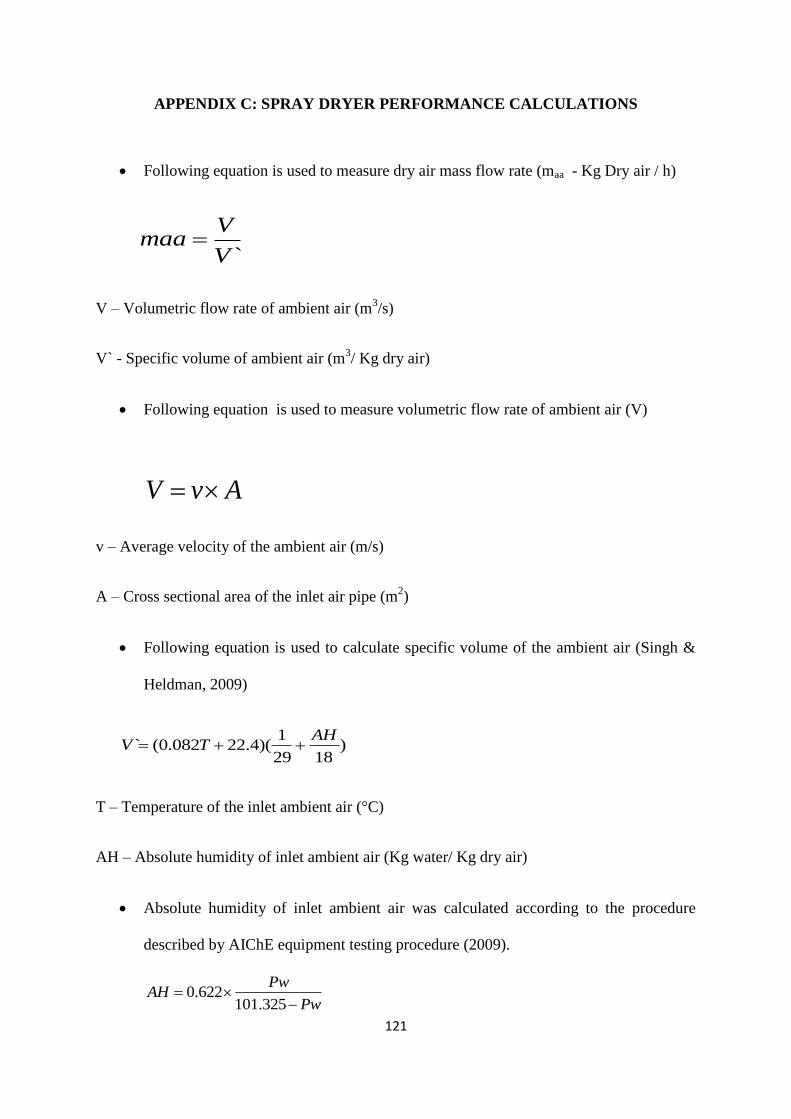
121
APPENDIX C: SPRAY DRYER PERFORMANCE CALCULATIONS
Following equation is used to measure dry air mass flow rate (maa - Kg Dry air / h)
`
Vmaa
V
V – Volumetric flow rate of ambient air (m3/s)
V` - Specific volume of ambient air (m3/ Kg dry air)
Following equation is used to measure volumetric flow rate of ambient air (V)
V v A
v – Average velocity of the ambient air (m/s)
A – Cross sectional area of the inlet air pipe (m2)
Following equation is used to calculate specific volume of the ambient air (Singh &
Heldman, 2009)
1` (0.082 22.4)( )
29 18
AHV T
T – Temperature of the inlet ambient air (°C)
AH – Absolute humidity of inlet ambient air (Kg water/ Kg dry air)
Absolute humidity of inlet ambient air was calculated according to the procedure
described by AIChE equipment testing procedure (2009).
0.622101.325
PwAH
Pw
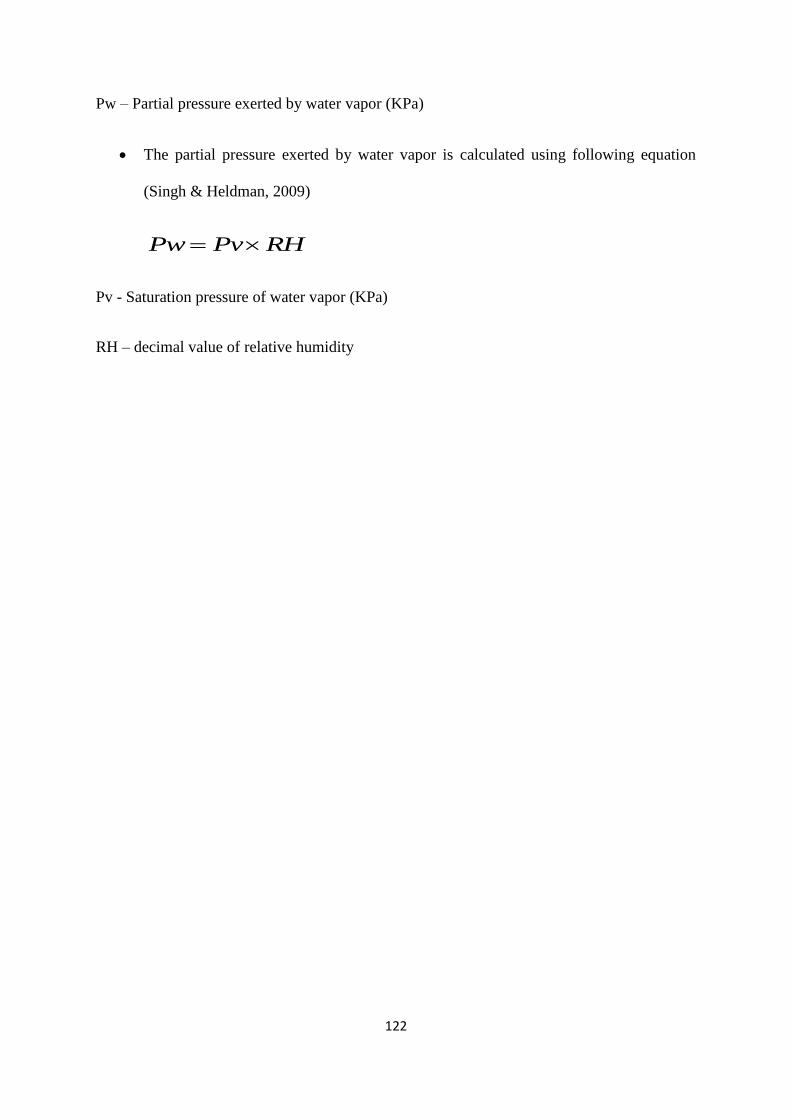
122
Pw – Partial pressure exerted by water vapor (KPa)
The partial pressure exerted by water vapor is calculated using following equation
(Singh & Heldman, 2009)
Pw Pv RH
Pv - Saturation pressure of water vapor (KPa)
RH – decimal value of relative humidity
123
APPENDIX D: SPRAY DRYER PERFORMANCE TABLES
Material and energy balances for a process are important for an industry to control the
processing and especially yields of the products. Tables 1 and 2, indicates the material
balance for menhaden (MMO, 5MMOBJ and 10MMOBJ) and salmon oil powders (MSO,
5MSOBJ and 10MSOBJ). Also Table 3 and 4 represent the tables for energy balance
calculations for menhaden and salmon oil powders. This indicates that increase of spray
drying temperature increased the required energy to spray dry. Increase of drying temperature
will also increase the cost of production. It should be considered that part of the energy
supplied was used for the actual spray drying process, and the rest of the energy was loss with
exhaust air and loss from the spray dryer to the outside environment.
Efficient use of energy is important for spray drying activity. According to AIChe
equipment testing procedure (2003), optimum condition of spray drying which provides
highest thermal efficiency is at the highest temperature difference between inlet and outlet air
(ʌT). Thermal efficiency is defined as the ratio of heat used in evaporation to heat input.
Increased inlet air temperature increases evaporation capacity of the spray dryer but may
affect the product properties. Increase inlet temperatures are known to form hollow particles
and also increase thermal degradation. The low inlet temperatures result in low evaporation
rates, which produce powders with higher moisture content and agglomerated powders
(Bankston and others 2011). Therefore, optimum conditions required to spray dry a specific
product needs to be established by trial and error.
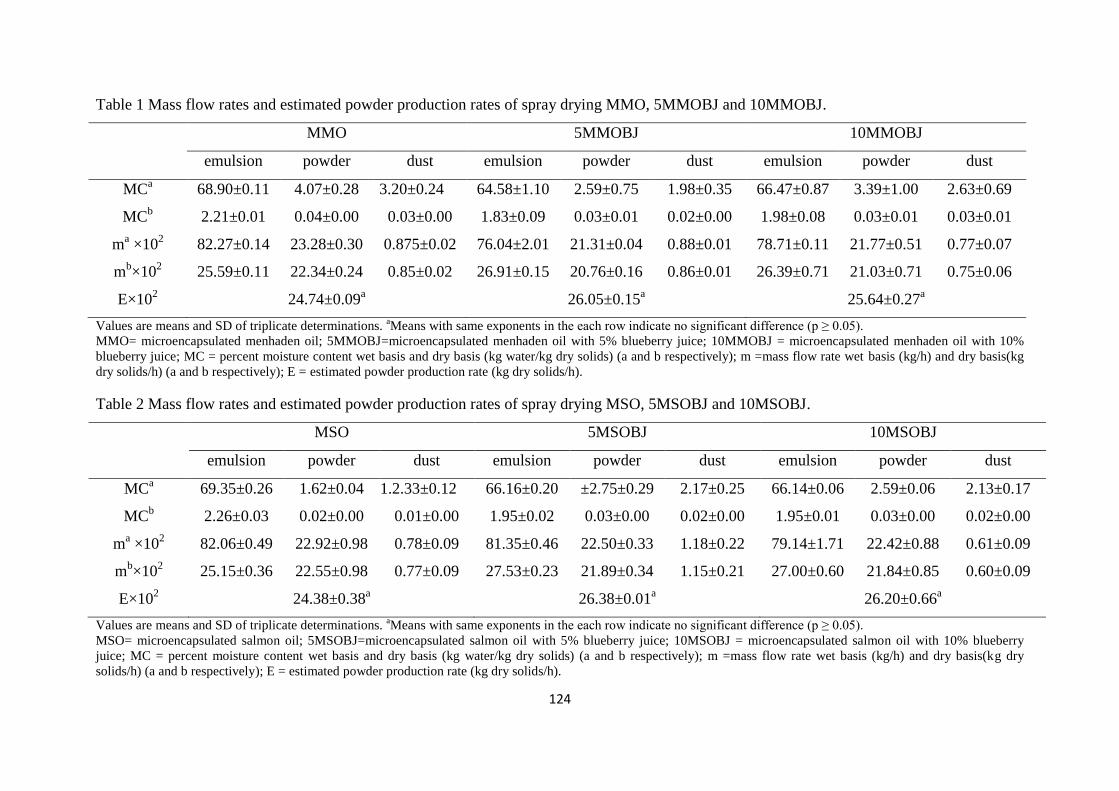
124
Table 1 Mass flow rates and estimated powder production rates of spray drying MMO, 5MMOBJ and 10MMOBJ.
MMO 5MMOBJ 10MMOBJ
emulsion powder dust emulsion powder dust emulsion powder dust
MCa 68.90±0.11 4.07±0.28 3.20±0.24 64.58±1.10 2.59±0.75 1.98±0.35 66.47±0.87 3.39±1.00 2.63±0.69
MCb 2.21±0.01 0.04±0.00 0.03±0.00 1.83±0.09 0.03±0.01 0.02±0.00 1.98±0.08 0.03±0.01 0.03±0.01
ma ×10
2 82.27±0.14 23.28±0.30 0.875±0.02 76.04±2.01 21.31±0.04 0.88±0.01 78.71±0.11 21.77±0.51 0.77±0.07
mb×10
2 25.59±0.11 22.34±0.24 0.85±0.02 26.91±0.15 20.76±0.16 0.86±0.01 26.39±0.71 21.03±0.71 0.75±0.06
E×102 24.74±0.09
a 26.05±0.15
a 25.64±0.27
a
Values are means and SD of triplicate determinations. aMeans with same exponents in the each row indicate no significant difference (p ≥ 0.05).
MMO= microencapsulated menhaden oil; 5MMOBJ=microencapsulated menhaden oil with 5% blueberry juice; 10MMOBJ = microencapsulated menhaden oil with 10%
blueberry juice; MC = percent moisture content wet basis and dry basis (kg water/kg dry solids) (a and b respectively); m =mass flow rate wet basis (kg/h) and dry basis(kg
dry solids/h) (a and b respectively); E = estimated powder production rate (kg dry solids/h).
Table 2 Mass flow rates and estimated powder production rates of spray drying MSO, 5MSOBJ and 10MSOBJ.
MSO 5MSOBJ 10MSOBJ
emulsion powder dust emulsion powder dust emulsion powder dust
MCa 69.35±0.26 1.62±0.04 1.2.33±0.12 66.16±0.20 ±2.75±0.29 2.17±0.25 66.14±0.06 2.59±0.06 2.13±0.17
MCb 2.26±0.03 0.02±0.00 0.01±0.00 1.95±0.02 0.03±0.00 0.02±0.00 1.95±0.01 0.03±0.00 0.02±0.00
ma ×10
2 82.06±0.49 22.92±0.98 0.78±0.09 81.35±0.46 22.50±0.33 1.18±0.22 79.14±1.71 22.42±0.88 0.61±0.09
mb×10
2 25.15±0.36 22.55±0.98 0.77±0.09 27.53±0.23 21.89±0.34 1.15±0.21 27.00±0.60 21.84±0.85 0.60±0.09
E×102 24.38±0.38
a 26.38±0.01
a 26.20±0.66
a
Values are means and SD of triplicate determinations. aMeans with same exponents in the each row indicate no significant difference (p ≥ 0.05).
MSO= microencapsulated salmon oil; 5MSOBJ=microencapsulated salmon oil with 5% blueberry juice; 10MSOBJ = microencapsulated salmon oil with 10% blueberry
juice; MC = percent moisture content wet basis and dry basis (kg water/kg dry solids) (a and b respectively); m =mass flow rate wet basis (kg/h) and dry basis(kg dry
solids/h) (a and b respectively); E = estimated powder production rate (kg dry solids/h).
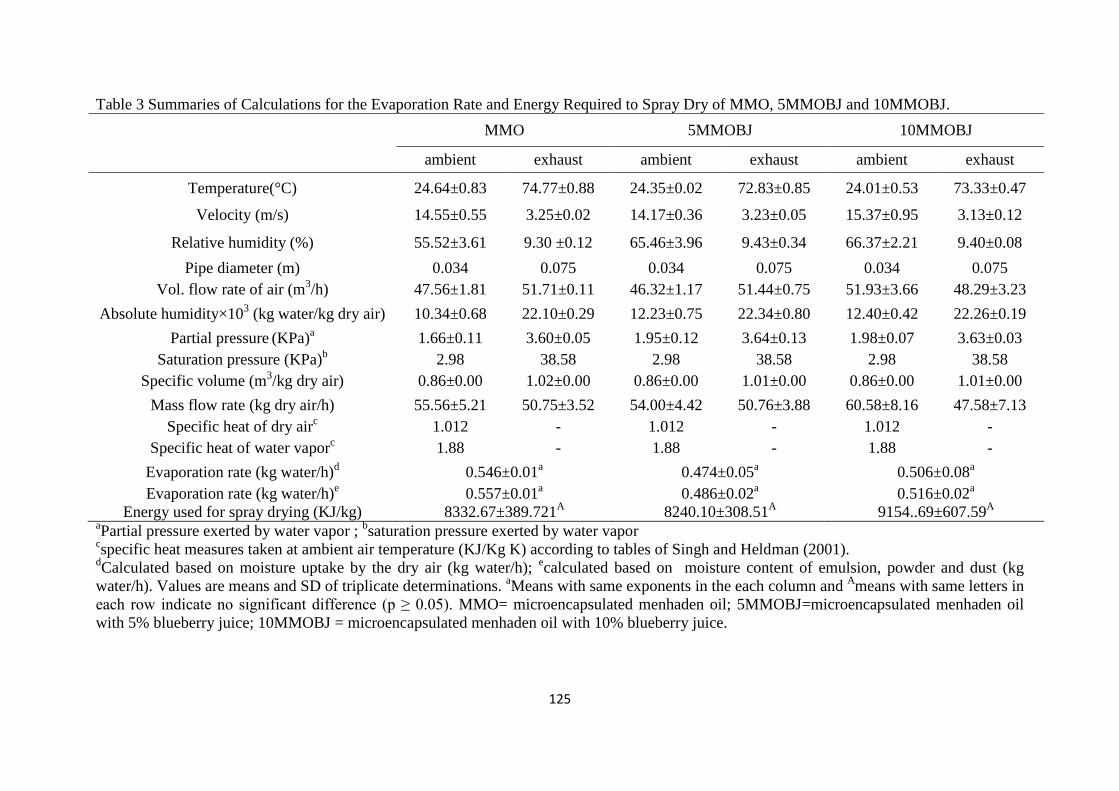
125
Table 3 Summaries of Calculations for the Evaporation Rate and Energy Required to Spray Dry of MMO, 5MMOBJ and 10MMOBJ.
MMO 5MMOBJ 10MMOBJ
ambient exhaust ambient exhaust ambient exhaust
Temperature(°C) 24.64±0.83 74.77±0.88 24.35±0.02 72.83±0.85 24.01±0.53 73.33±0.47
Velocity (m/s) 14.55±0.55 3.25±0.02 14.17±0.36 3.23±0.05 15.37±0.95 3.13±0.12
Relative humidity (%) 55.52±3.61 9.30 ±0.12 65.46±3.96 9.43±0.34 66.37±2.21 9.40±0.08
Pipe diameter (m) 0.034 0.075 0.034 0.075 0.034 0.075
Vol. flow rate of air (m3/h) 47.56±1.81 51.71±0.11 46.32±1.17 51.44±0.75 51.93±3.66 48.29±3.23
Absolute humidity×103 (kg water/kg dry air) 10.34±0.68 22.10±0.29 12.23±0.75 22.34±0.80 12.40±0.42 22.26±0.19
Partial pressure (KPa)
a 1.66±0.11 3.60±0.05 1.95±0.12 3.64±0.13 1.98±0.07 3.63±0.03
Saturation pressure (KPa)b 2.98 38.58 2.98 38.58 2.98 38.58
Specific volume (m3/kg dry air) 0.86±0.00 1.02±0.00 0.86±0.00 1.01±0.00 0.86±0.00 1.01±0.00
Mass flow rate (kg dry air/h) 55.56±5.21 50.75±3.52 54.00±4.42 50.76±3.88 60.58±8.16 47.58±7.13
Specific heat of dry airc 1.012 - 1.012 - 1.012 -
Specific heat of water vaporc 1.88 - 1.88 - 1.88 -
Evaporation rate (kg water/h)d 0.546±0.01
a 0.474±0.05
a 0.506±0.08
a
Evaporation rate (kg water/h)e 0.557±0.01
a 0.486±0.02
a 0.516±0.02
a
Energy used for spray drying (KJ/kg) 8332.67±389.721A 8240.10±308.51
A 9154..69±607.59
A
aPartial pressure exerted by water vapor ;
bsaturation pressure exerted by water vapor
cspecific heat measures taken at ambient air temperature (KJ/Kg K) according to tables of Singh and Heldman (2001).
dCalculated based on moisture uptake by the dry air (kg water/h);
ecalculated based on moisture content of emulsion, powder and dust (kg
water/h). Values are means and SD of triplicate determinations. aMeans with same exponents in the each column and
Ameans with same letters in
each row indicate no significant difference (p ≥ 0.05). MMO= microencapsulated menhaden oil; 5MMOBJ=microencapsulated menhaden oil
with 5% blueberry juice; 10MMOBJ = microencapsulated menhaden oil with 10% blueberry juice.
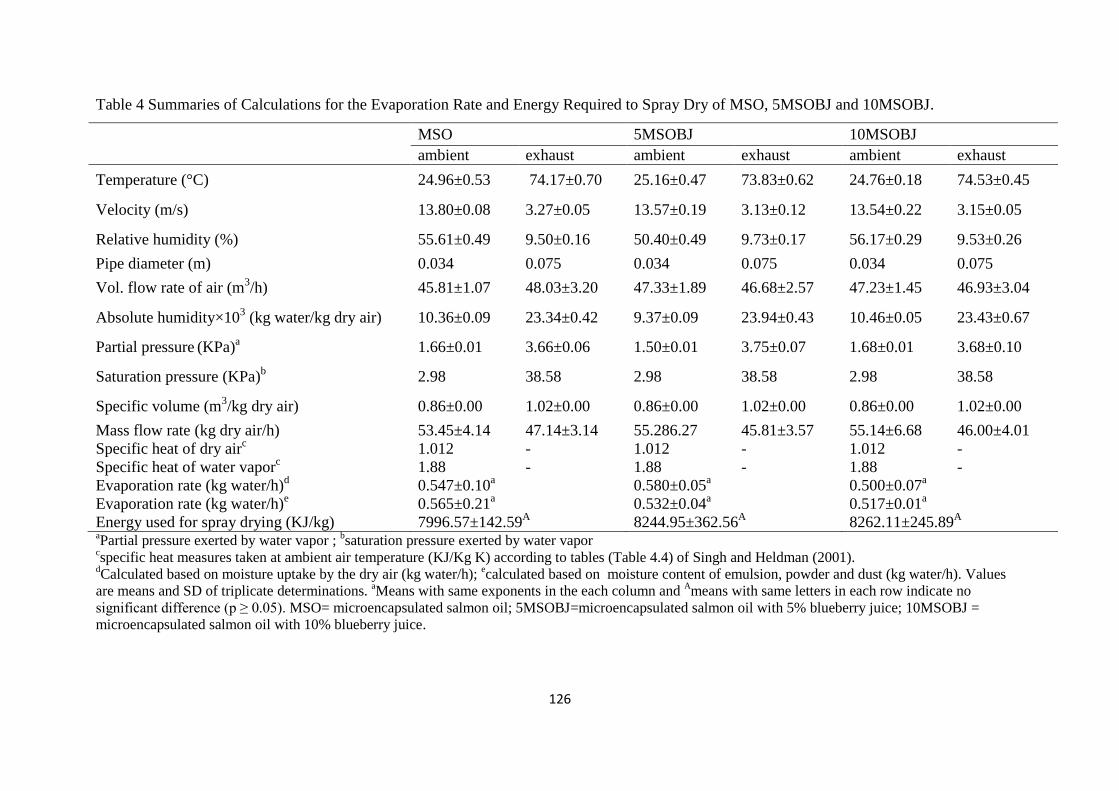
126
Table 4 Summaries of Calculations for the Evaporation Rate and Energy Required to Spray Dry of MSO, 5MSOBJ and 10MSOBJ.
MSO 5MSOBJ 10MSOBJ
ambient exhaust ambient exhaust ambient exhaust
Temperature (°C) 24.96±0.53 74.17±0.70 25.16±0.47 73.83±0.62 24.76±0.18 74.53±0.45
Velocity (m/s) 13.80±0.08 3.27±0.05 13.57±0.19 3.13±0.12 13.54±0.22 3.15±0.05
Relative humidity (%) 55.61±0.49 9.50±0.16 50.40±0.49 9.73±0.17 56.17±0.29 9.53±0.26
Pipe diameter (m) 0.034 0.075 0.034 0.075 0.034 0.075
Vol. flow rate of air (m3/h) 45.81±1.07 48.03±3.20 47.33±1.89 46.68±2.57 47.23±1.45 46.93±3.04
Absolute humidity×103 (kg water/kg dry air) 10.36±0.09 23.34±0.42 9.37±0.09 23.94±0.43 10.46±0.05 23.43±0.67
Partial pressure (KPa)
a 1.66±0.01 3.66±0.06 1.50±0.01 3.75±0.07 1.68±0.01 3.68±0.10
Saturation pressure (KPa)b 2.98 38.58 2.98 38.58 2.98 38.58
Specific volume (m3/kg dry air) 0.86±0.00 1.02±0.00 0.86±0.00 1.02±0.00 0.86±0.00 1.02±0.00
Mass flow rate (kg dry air/h) 53.45±4.14 47.14±3.14 55.286.27 45.81±3.57 55.14±6.68 46.00±4.01
Specific heat of dry airc 1.012 - 1.012 - 1.012 -
Specific heat of water vaporc 1.88 - 1.88 - 1.88 -
Evaporation rate (kg water/h)d 0.547±0.10
a 0.580±0.05
a 0.500±0.07
a
Evaporation rate (kg water/h)e 0.565±0.21
a 0.532±0.04
a 0.517±0.01
a
Energy used for spray drying (KJ/kg) 7996.57±142.59A 8244.95±362.56
A 8262.11±245.89
A
aPartial pressure exerted by water vapor ;
bsaturation pressure exerted by water vapor
cspecific heat measures taken at ambient air temperature (KJ/Kg K) according to tables (Table 4.4) of Singh and Heldman (2001).
dCalculated based on moisture uptake by the dry air (kg water/h);
ecalculated based on moisture content of emulsion, powder and dust (kg water/h). Values
are means and SD of triplicate determinations. aMeans with same exponents in the each column and
Ameans with same letters in each row indicate no
significant difference (p ≥ 0.05). MSO= microencapsulated salmon oil; 5MSOBJ=microencapsulated salmon oil with 5% blueberry juice; 10MSOBJ =
microencapsulated salmon oil with 10% blueberry juice.

127
. VITA
Fathima Waheeda Mohideen was born in August 1982 in Colombo, Sri Lanka. She earned
her bachelor of agriculture specializing in food science and technology at the University of
Peradeniya, Sri Lanka, in March 2008. She joined the Department of Food Science at
Louisiana State University for her Master of Science in August 2009. Currently, she is a
master’s degree candidate and will receive her degree in August 2011.
Copyright © 2022 FDOKUMEN