Comparison of self-assessment and partnered-assessment as cost-effective alternative methods for...
14
International Journal of Industrial Ergonomics 28 (2001) 327–340 Comparison of self-assessment and partnered-assessment as cost-effective alternative methods for office workstation evaluation Sharon M.B. Joines a,b , Carolyn M. Sommerich b, * a North Carolina Ergonomics Resource Center, Raleigh, NC, USA b Department of Industrial Engineering, North Carolina State University, Box 7906, Raleigh, NC, 27695, USA Received 14 January 2001; received in revised form 14 March 2001; accepted 19 April 2001 Abstract A study was conducted in order to determine if anthropometric and office workstation measurements could be accurately collected individually by the employees who worked as those stations, or alternatively by two-person teams consisting of the employee and a co-worker. An iterative process was used to develop a method that would: (1) require a minimum number of measurements to be made by the employees, (2) produce an acceptable level of accuracy, and (3) provide useful information for analyzing employee–workstation fit. Results of the study showed acceptable accuracy when using a combined assisted and unassisted data collection approach. Relevance to industry Office workstation assessment can be a challenge for companies with large numbers of employees working in office settings, particularly if those settings are distributed across a country or the globe. Developing a formulaic method for accurately measuring those workstations by someone other than the company’s expert (ergonomist or other) has several benefits, including: (1) ability to measure more workstations in the same time period; (2) freeing the expert to perform tasks and analyses that require his/her expertise; and (3) inducing active involvement of employees in the company’s health and safety (or ergonomics) efforts. r 2001 Elsevier Science B.V. All rights reserved. Keywords: Ergonomics program; Intervention methods; VDT workstation; Musculoskeletal disorders 1. Introduction Many epidemiological studies of office workers have shown that ‘‘poor’’ ergonomics in office work settings, including physical design, work organiza- tion design, and psychosocial aspects of work, have been associated with physical discomfort and symptoms in office workers (Ryan and Bampton, 1988; Smith et al., 1981; Bergqvist et al., 1995; Bernard et al., 1994; Hales et al., 1994; H . unting et al., 1981; Sauter et al., 1991; Karlqvist et al., 1996). In particular, physical characteristics of the office workstation have been associated with *Corresponding author. Tel.: +1-919-515-8614; fax: +1- 919-515-5281. E-mail address: [email protected] (C.M. Sommerich). 0169-8141/01/$ -see front matter r 2001 Elsevier Science B.V. All rights reserved. PII:S0169-8141(01)00039-7
Transcript of Comparison of self-assessment and partnered-assessment as cost-effective alternative methods for...
International Journal of Industrial Ergonomics 28 (2001) 327–340
Comparison of self-assessment and partnered-assessmentas cost-effective alternative methods for office
workstation evaluation
Sharon M.B. Joinesa,b, Carolyn M. Sommerichb,*aNorth Carolina Ergonomics Resource Center, Raleigh, NC, USA
bDepartment of Industrial Engineering, North Carolina State University, Box 7906, Raleigh, NC, 27695, USA
Received 14 January 2001; received in revised form 14 March 2001; accepted 19 April 2001
Abstract
A study was conducted in order to determine if anthropometric and office workstation measurements could beaccurately collected individually by the employees who worked as those stations, or alternatively by two-person teams
consisting of the employee and a co-worker. An iterative process was used to develop a method that would: (1) require aminimum number of measurements to be made by the employees, (2) produce an acceptable level of accuracy, and (3)provide useful information for analyzing employee–workstation fit. Results of the study showed acceptable accuracy
when using a combined assisted and unassisted data collection approach.
Relevance to industry
Office workstation assessment can be a challenge for companies with large numbers of employees working in officesettings, particularly if those settings are distributed across a country or the globe. Developing a formulaic method for
accurately measuring those workstations by someone other than the company’s expert (ergonomist or other) has severalbenefits, including: (1) ability to measure more workstations in the same time period; (2) freeing the expert to performtasks and analyses that require his/her expertise; and (3) inducing active involvement of employees in the company’shealth and safety (or ergonomics) efforts. r 2001 Elsevier Science B.V. All rights reserved.
Keywords: Ergonomics program; Intervention methods; VDT workstation; Musculoskeletal disorders
1. Introduction
Many epidemiological studies of office workershave shown that ‘‘poor’’ ergonomics in office work
settings, including physical design, work organiza-tion design, and psychosocial aspects of work,have been associated with physical discomfort andsymptoms in office workers (Ryan and Bampton,1988; Smith et al., 1981; Bergqvist et al., 1995;Bernard et al., 1994; Hales et al., 1994; H .untinget al., 1981; Sauter et al., 1991; Karlqvist et al.,1996). In particular, physical characteristics of theoffice workstation have been associated with
*Corresponding author. Tel.: +1-919-515-8614; fax: +1-
919-515-5281.
E-mail address: [email protected]
(C.M. Sommerich).
0169-8141/01/$ -see front matter r 2001 Elsevier Science B.V. All rights reserved.
PII: S 0 1 6 9 - 8 1 4 1 ( 0 1 ) 0 0 0 3 9 - 7
musculoskeletal discomfort in studies by Bergqvistet al. (1995); H .unting et al. (1981); Sauter et al.(1991) and Karlqvist et al. (1996). Significantly,‘‘good’’ physical ergonomic design features ofoffice work have been shown to reduce musculos-keletal stress, both in laboratory experiments(Villanueva et al., 1997; Price and Dowell, 1998;Sommerich et al., 2001), and in interventionresearch (Aar(as et al., 1998; Mekhora et al., 2000).Determining the current state of an office work
environment, with regards to ergonomic factors,requires evaluation of the fit between employeesand their work conditions. Such evaluations canprovide essential insight into areas in need ofmodification, be they aspects of the physical, workorganization, or psychosocial work environment.However, these evaluations can pose problems foremployers with large staffs or with multiple worksites distributed across a country or the globe, orfor smaller employers who lack in-house ergo-nomic expertise. Employers in any of thesesituations could benefit from using self-reportmethods in the data collection phase of theworkstation assessment process. This would allowin-house experts or external consultants to focuson the analysis, recommendation development,and recommendation implementation phases ofthe process. It also opens the way for computer-ized analysis and recommendations for manyroutine problems.Data collection for a workstation assessment
can include measurements of the person and theworkstation, documentation of the workspacelayout, task assessment, musculoskeletal discom-fort assessment, documentation of work organiza-tion factors, and assessment of psychosocial workfactors. Self-report has been successfully used inepidemiological studies to collect information onmusculoskeletal discomfort and on factors relatedto work organization and psychosocial factors(Bernard et al., 1994; Hales et al., 1994; Smithet al., 1981). There is some concern, though,regarding reliance on self-report for factors relatedto physical work load (Wiktorin et al., 1996),under which workstation measures and the physi-cal fit between employee and workstation can becategorized. Hochanadel (1995), who requiredoffice workers to provide stature and ‘‘keyboard
surface height’’ as inputs to a computerizedworkstation adjustment program, commented onconcerns regarding the validity of the inputs to theprogram, as well as the employee’s ability tocorrectly implement workstation adjustments thatwere output from the program. Those outputsincluded recommended dimensions for the em-ployee’s chair and monitor height.Correct assessment of at least one relative
dimension has been shown to be difficult. Usinga self-report questionnaire containing illustrations,Karlqvist et al. (1996) requested information onoffice workers’ workstationsFspecifically regard-ing vertical location of the elbow relative to thekeyboard, and horizontal locations of the mouseand keyboard relative to the edge of the worksurface and the mid-sagittal plane of the worker.Results showed that VDT users were able tocorrectly categorize the location of the mouse, asbeing either optimally or non-optimally located(sensitivity=91%, specificity=87%). Participantswere also able to successfully categorize thekeyboard as being in an optimal location whenthat was the case, but were less likely to recognizethe keyboard location as non-optimal when it wasclassified as such by the researchers (specifi-city=98%, sensitivity=57%). Participants foundit difficult to judge the location of their elbows asnon-optimal relative to the keyboard (sensitiv-ity=19%, specificity=93%, based on an absolutedifference in height of more or less than 4 cm).Given the degree of success reported by
Karlqvist et al. (1996), it was reasonable to expectto be able to successfully develop a method forself-reporting the physical aspects of a VDTworkstation, in particular the workstation dimen-sions and layout. The importance of the design ofthe instructions for measuring the workstation wasrecognized from the start. However, anotheraspect of the method would be particularlyinteresting to evaluate, that being a test of twoways of gathering the information: having anemployee collect data on his/her own workstationvs. having an employee choose a co-worker tocollect the workstation information. In somerespects this is analogous to trying to cut one’sown hair vs. having someone else cut it. It wasexpected that measurements made by a co-worker
S.M.B. Joines, C.M. Sommerich / International Journal of Industrial Ergonomics 28 (2001) 327–340328
would be more accurate than measurements madeby the individual.This paper, then, describes a study conducted to
(1) determine an appropriate format for providinginstructions for accurate reporting of dimensionaland layout data describing a VDT office work-station by office workers untrained in ergonomics;and (2) evaluate and compare the accuracy of self-assessment and partnered-assessment methods forcollecting the dimensional data. An accurate self-reporting method for collecting such data is one ofthe few remaining elements of a self-report-baseddata collection phase for the office workstationevaluation process.An abbreviated presentation of the work first
appeared as a conference proceedings paper(Joines and Sommerich, 2000). This presentationof the work supersedes the first. It includesportions of the text that were excluded in thePDF conversion process, an expanded analysis ofthe results, and some corrections to the originalpresentation.
2. Project background and questionnaire design
The opportunity to test various methods ofcollecting self-report information on worker andworkstation dimensions and workstation layoutarose when a large employer requested an ergo-nomic evaluation of approximately 400 employeeswho were located in cities and towns across NorthCarolina. The employee job descriptions includeda variety of skill levels. Most jobs were adminis-trative positions, but clerical filing, librarian,graphic design, and field evaluation were alsorepresented. The client imposed three stipulations:
* each employee was to be evaluated in a well-documented, consistent manner regardless ofthe current working conditions;
* a software package they had purchased was tobe used in the analysis (this software requiredseveral dimensions not typically collected dur-ing a basic ergonomic analysis of a work-station); and
* the budget for the ergonomic evaluation projectwas limited.
These restrictions required a creative approachto the job, and the job itself provided anopportunity to test ideas regarding partnered-and self-reporting methods as viable means ofconducting workstation assessment.The first step in the process was the develop-
ment of a questionnaire, and the second wasthe evaluation and comparison of the two methodsof data collection. The questionnaire was designedto collect four categories of data: workstationlayout, workstation dimensions, anthropometricdata, and employee–workstation interactiondimensions. In addition to the type of data to becollected, several other factors were consideredwhen designing the questionnaire:
* it should facilitate accuracy of responses andmeasurements, by users with little or noergonomics training;
* it should not appear to be over-whelming inlength;
* the amount of time required to complete itshould be minimized; and
* it should provide the user with an overview ofthe dimensions of interest in an ergonomicevaluation.
The questionnaire was structured as follows:four questions were designed to document theworkstation layout; 21 questions addressed work-station dimensions; seven questions addressedbasic anthropometry; and two questions addressedthe physical proximity between the employee andthe workstation. In light of the considerationslisted above, the questionnaire was constructed torequire either dimensional or forced-choice re-sponses, and was arranged to fit on one sheet ofpaper (front and back). Graphics were utilizedwherever possible. A paper format was used toavoid technology barriers, such as lack of access tothe Internet.
2.1. Pilot testing
A pilot group of eight employees volunteered totest the effectiveness of the initial questionnaire.Participants knew their employer was in theprocess of implementing an ergonomics initiative.
S.M.B. Joines, C.M. Sommerich / International Journal of Industrial Ergonomics 28 (2001) 327–340 329
They were informed that they would be using aform that might eventually be used in thatinitiative. Minimal verbal instructions weregiven, to test the effectiveness of the writteninstructions. Participants were provided withtraditional wooden yardsticks and were instructedto follow the directions on the questionnaire formin collecting personal and workstation measure-ments. The same measurements were then repeatedfor each participant and workstation by agraduate student researcher with experience inanthropometric data collection (the first author ofthis paper). All measurements were made ininches, and were converted to centimeters duringthe analysis. Comparisons were made between themeasurements taken by the employees and thosetaken by the researcher to determine whererefinements were needed on the questionnaireform.
2.2. Results of pilot testing
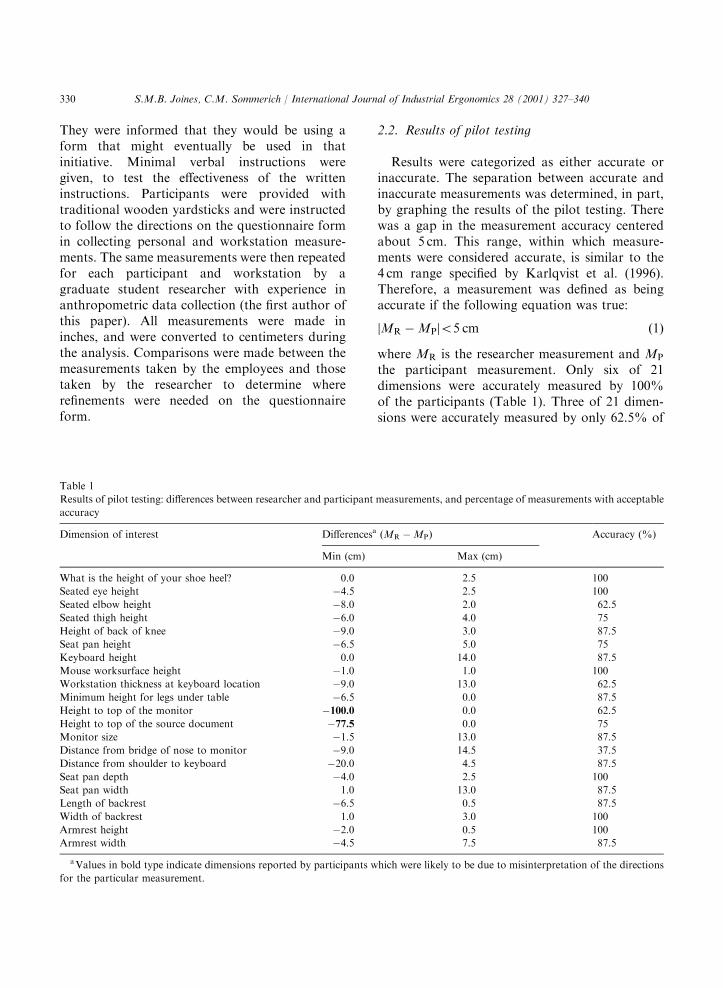
Results were categorized as either accurate orinaccurate. The separation between accurate andinaccurate measurements was determined, in part,by graphing the results of the pilot testing. Therewas a gap in the measurement accuracy centeredabout 5 cm. This range, within which measure-ments were considered accurate, is similar to the4 cm range specified by Karlqvist et al. (1996).Therefore, a measurement was defined as beingaccurate if the following equation was true:
jMR �MPjo5 cm ð1Þ
where MR is the researcher measurement and MP
the participant measurement. Only six of 21dimensions were accurately measured by 100%of the participants (Table 1). Three of 21 dimen-sions were accurately measured by only 62.5% of
Table 1
Results of pilot testing: differences between researcher and participant measurements, and percentage of measurements with acceptable
accuracy
Dimension of interest Differencesa ðMR �MPÞ Accuracy (%)
Min (cm) Max (cm)
What is the height of your shoe heel? 0.0 2.5 100
Seated eye height �4.5 2.5 100
Seated elbow height �8.0 2.0 62.5
Seated thigh height �6.0 4.0 75
Height of back of knee �9.0 3.0 87.5
Seat pan height �6.5 5.0 75
Keyboard height 0.0 14.0 87.5
Mouse worksurface height �1.0 1.0 100
Workstation thickness at keyboard location �9.0 13.0 62.5
Minimum height for legs under table �6.5 0.0 87.5
Height to top of the monitor �100.0 0.0 62.5
Height to top of the source document �77.5 0.0 75
Monitor size �1.5 13.0 87.5
Distance from bridge of nose to monitor �9.0 14.5 37.5
Distance from shoulder to keyboard �20.0 4.5 87.5
Seat pan depth �4.0 2.5 100
Seat pan width 1.0 13.0 87.5
Length of backrest �6.5 0.5 87.5
Width of backrest 1.0 3.0 100
Armrest height �2.0 0.5 100
Armrest width �4.5 7.5 87.5
aValues in bold type indicate dimensions reported by participants which were likely to be due to misinterpretation of the directions
for the particular measurement.
S.M.B. Joines, C.M. Sommerich / International Journal of Industrial Ergonomics 28 (2001) 327–340330
the participants. One dimension was measuredaccurately by only 37.5% of the participants.Analysis of the range over which the differencesbetween the participants’ and researcher’s mea-surements spanned suggested a misinterpretationof some of the dimension descriptions (Table 1, inbold type). Participant-by-participant investiga-tion into measurement discrepancies revealedseveral sources of error that seemed likely to becorrectable. Several measurements with largedeviations could be explained by misinterpreta-tions of the dimension description, such asmeasuring from the floor rather than from thedesktop, or by misleading drawings. It wasbelieved that such misinterpretations could beeliminated using additional visual aids or photo-graphs.
2.3. Questionnaire redesign
Based on the results of the pilot test, a second-generation data collection questionnaire wascreated. Some of the original considerations, suchas minimizing apparent questionnaire length andproviding the individuals with an overview of theworkstation evaluation, were abandoned duringthe redesign process. The redesigned questionnairefeatured one measurement per page, which wouldhelp participants focus on each specific measure-ment, in turn. Each page contained a measurementdescription, written instructions, a line drawingspecific to the measurement of interest, and adigital picture of a person taking the measurement.An example is provided in Fig. 1.With the revisions made to the questionnaire,
the next step in the process was to compare datacollection methods. The revised questionnaire wasalso re-evaluated in this step.
3. Method
3.1. Study design
Thirty participants with varied job titles (refer toSection 2 for listing of jobs) tested the second-generation questionnaire. Employees were evenly
divided into two groups. Each participantin Group U (unassisted group) was asked tocomplete the questionnaire unaided. Each partici-pant in Group A (assisted group) was asked toselect a co-worker of his/her own choosing to takethe measurements. Group U consisted of 13women and two men; group A consisted of 10women and five men. The groups were constructedto balance age and job-type, though there was nocontrol for the co-workers chosen by Group Aparticipants. All jobs required a high schooldiploma, and some also required a college degree.In each group, participants were evenly distributedamong the fourth, fifth, and six decades of life.Only two of the 30 participants were in theirtwenties. Initially, the groups were also balancedfor sex, but as attrition and scheduling problemsarose, participants were replaced with individualsof similar job type and age. The final gender tallywas 23 females and seven males. As with the pilotquestionnaire, the researcher repeated the mea-surements for all participants after they hadcompleted the questionnaire. Participants’ ques-tionnaires were not reviewed before the researchermade her measurements, thereby ensuring no biasin the researcher’s measurements. Dimensionswere measured to the nearest quarter inch(0.64 cm) using yardsticks provided to the partici-pants. Data were converted to centimeters duringthe analysis.
3.2. Data analysis
Six analyses were performed on the data.Correlation coefficients were calculated to deter-mine if one group or the other made measurementsthat were better correlated with the researcher’smeasurements. The t-test statistic was calculatedto determine if the differences between theparticipants’ and the researcher’s measurementsdiffered between the two methods. Three statisticswere calculated to characterize the differencesbetween the researcher’s and the participants’measurements: root mean square (RMS) todescribe a weighted-average accuracy which im-poses greater penalties for larger errors; largestabsolute difference (LAD) to identify the poorest
S.M.B. Joines, C.M. Sommerich / International Journal of Industrial Ergonomics 28 (2001) 327–340 331

measurement for each dimension; and groupaccuracy percentage (GAP), calculated asthe percentage of each group’s participants’layouts and measurements (per Eq. (1)) that wereaccurate.Finally, two statistics were calculated to
characterize the level of success in utilizingdata from the questionnaire to identify well-placed and poorly placed workstation compo-nents. Sensitivity and specificity were calculatedto assess two important aspects of workstation–employee fit, keyboard height and mouseworksurface height, both relative to user’s elbowheight.
4. Results
4.1. Correlation between participants’ andresearcher’s measurements
Correlation coefficients were calculated betweenparticipants’ and researcher’s measurements ofanthropometry and workstation dimensions.Weak or negative correlation would signal seriousproblems with a measurement, though, conversely,good correlation would not guarantee accuracy.Consistently inaccurate participant measurementscould be well correlated with the researcher’smeasurements.
Fig. 1. From the revised questionnaire, this is an example of an instructional page for reporting a workstation dimension. Each page
contains a measurement description, written instructions, a line drawing specific to the measurement of interest, and a digital picture of
a person taking the measurement. Specifically, this is the page for the seat pan height measurement.
S.M.B. Joines, C.M. Sommerich / International Journal of Industrial Ergonomics 28 (2001) 327–340332
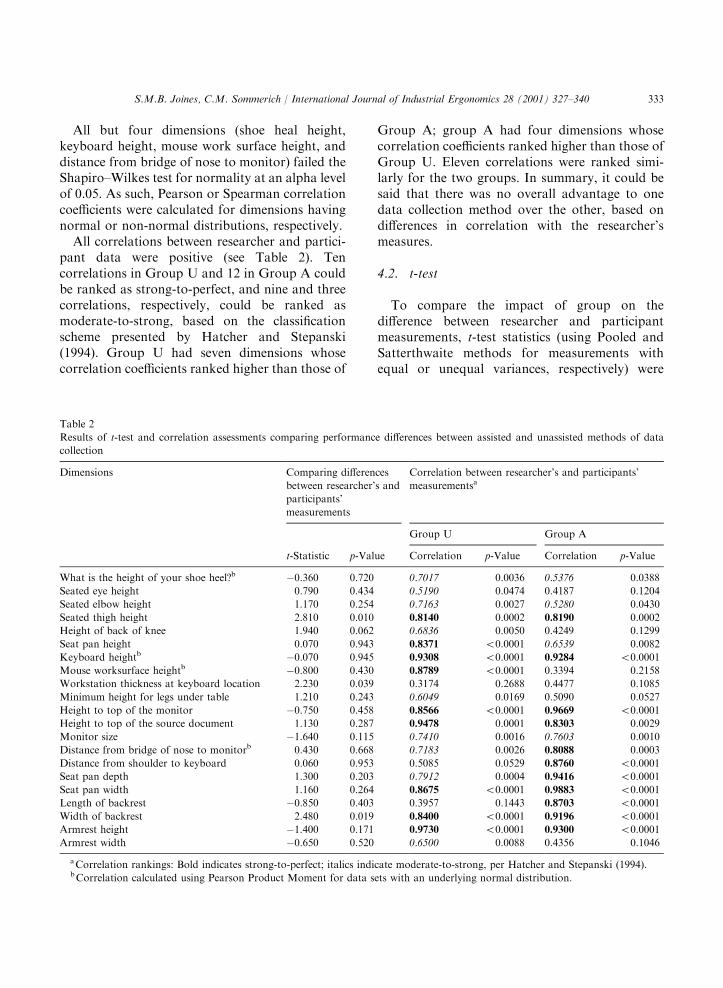
All but four dimensions (shoe heal height,keyboard height, mouse work surface height, anddistance from bridge of nose to monitor) failed theShapiro–Wilkes test for normality at an alpha levelof 0.05. As such, Pearson or Spearman correlationcoefficients were calculated for dimensions havingnormal or non-normal distributions, respectively.All correlations between researcher and partici-
pant data were positive (see Table 2). Tencorrelations in Group U and 12 in Group A couldbe ranked as strong-to-perfect, and nine and threecorrelations, respectively, could be ranked asmoderate-to-strong, based on the classificationscheme presented by Hatcher and Stepanski(1994). Group U had seven dimensions whosecorrelation coefficients ranked higher than those of
Group A; group A had four dimensions whosecorrelation coefficients ranked higher than those ofGroup U. Eleven correlations were ranked simi-larly for the two groups. In summary, it could besaid that there was no overall advantage to onedata collection method over the other, based ondifferences in correlation with the researcher’smeasures.
4.2. t-test
To compare the impact of group on thedifference between researcher and participantmeasurements, t-test statistics (using Pooled andSatterthwaite methods for measurements withequal or unequal variances, respectively) were
Table 2
Results of t-test and correlation assessments comparing performance differences between assisted and unassisted methods of data
collection
Dimensions Comparing differences
between researcher’s and
participants’
measurements
Correlation between researcher’s and participants’
measurementsa
Group U Group A
t-Statistic p-Value Correlation p-Value Correlation p-Value
What is the height of your shoe heel?b �0.360 0.720 0.7017 0.0036 0.5376 0.0388
Seated eye height 0.790 0.434 0.5190 0.0474 0.4187 0.1204
Seated elbow height 1.170 0.254 0.7163 0.0027 0.5280 0.0430
Seated thigh height 2.810 0.010 0.8140 0.0002 0.8190 0.0002
Height of back of knee 1.940 0.062 0.6836 0.0050 0.4249 0.1299
Seat pan height 0.070 0.943 0.8371 o0.0001 0.6539 0.0082
Keyboard heightb �0.070 0.945 0.9308 o0.0001 0.9284 o0.0001
Mouse worksurface heightb �0.800 0.430 0.8789 o0.0001 0.3394 0.2158
Workstation thickness at keyboard location 2.230 0.039 0.3174 0.2688 0.4477 0.1085
Minimum height for legs under table 1.210 0.243 0.6049 0.0169 0.5090 0.0527
Height to top of the monitor �0.750 0.458 0.8566 o0.0001 0.9669 o0.0001
Height to top of the source document 1.130 0.287 0.9478 0.0001 0.8303 0.0029
Monitor size �1.640 0.115 0.7410 0.0016 0.7603 0.0010
Distance from bridge of nose to monitorb 0.430 0.668 0.7183 0.0026 0.8088 0.0003
Distance from shoulder to keyboard 0.060 0.953 0.5085 0.0529 0.8760 o0.0001
Seat pan depth 1.300 0.203 0.7912 0.0004 0.9416 o0.0001
Seat pan width 1.160 0.264 0.8675 o0.0001 0.9883 o0.0001
Length of backrest �0.850 0.403 0.3957 0.1443 0.8703 o0.0001
Width of backrest 2.480 0.019 0.8400 o0.0001 0.9196 o0.0001
Armrest height �1.400 0.171 0.9730 o0.0001 0.9300 o0.0001
Armrest width �0.650 0.520 0.6500 0.0088 0.4356 0.1046
aCorrelation rankings: Bold indicates strong-to-perfect; italics indicate moderate-to-strong, per Hatcher and Stepanski (1994).bCorrelation calculated using Pearson Product Moment for data sets with an underlying normal distribution.
S.M.B. Joines, C.M. Sommerich / International Journal of Industrial Ergonomics 28 (2001) 327–340 333
calculated. In addition to indicating whether ornot there was a difference in the size of themeasurement errors between the two groups, the t-test in SAS (SAS, Cary NC) also provides a test todetermine whether the mean of the values beingtested is zero or non-zero. In this case the valuesbeing tested were the ‘‘errors’’ of each measure-ment, defined as the difference between theresearcher’s and the participants’ measurement.This could be useful for identifying participants’measurements that were consistently differentfrom the researcher’s. Such problems might beaddressed by making further changes to thequestionnaire, or they might be addressed post-collection with a correction factor.Differences, in the average magnitude of the
errors, between Groups A and U were significantfor only three dimensions: seated thigh height,workstation thickness at keyboard location, andwidth of the backrest. The results of the t-tests aresummarized in the second column of Table 2.Groups U and A had five and four dimensions,respectively, for which the mean difference be-tween the researcher’s measures and theparticipants’ were non-zero. The largest meandifference was about 2 cm, but most of the otherswere only about 0.5 cm. This demonstrates that themeasurement errors made by the participants weregenerally not systematic. Results of this evaluationdo not favor one group over the other. Onaverage, both groups displayed similarly goodlevels of mean accuracy.
4.3. Root mean square
The root mean square (RMS) for each dimen-sion was calculated to characterize a weightedaverage of the physical difference between theparticipants’ and the researcher’s measurements,imposing a greater penalty for larger errors.The analysis, summarized in Table 3, produced
consistently low RMS values for both groups for13 of the 21 measurements. RMS values of MR �MP differences greater than 5 cm were consideredlarge (identified in Table 3 with *). Large RMSvalues were calculated for three dimensions forboth Group U and A: distance from nose tomonitor, distance from shoulder to keyboard, and
armrest width. RMS values were large for GroupA for two other dimensions: seated elbow heightand height to top of source document. RMS valueswere large for Group U for three other dimen-sions: minimum leg height, seat pan width, andlength of backrest. Overall, performance wassimilar between the groups, with similar RMSvalues for 16 of 21 dimensions.
4.4. Largest absolute difference
The largest absolute differences (LAD) wereidentified for each dimension, to characterize thelargest single errors among all participants withineach Group. Dimensions with large RMS valuesalso had LAD values greater than 10 cm (noted inTable 3 with * *). Additionally, the LAD for themouse worksurface height and backrest lengthwere large for Group A, and monitor size andseated thigh height were large for Group U. ForGroup A, seven LAD were more than 10 cm,ranging from 10.8 to 50.8 cm. For Group U, eightLAD exceeded 10 cm, ranging from 10.2 to53.3 cm. Eleven dimensions did not have largeLADs occur in either group, while four dimensionshad large LADs occur in both groups. Armrestwidth was particularly problematic for bothgroups (both groups’ LADs were greater than50 cm).
4.5. Group accuracy percentage for measurementsand layouts
Group accuracy percentage (GAP) expresses thepercentage of the participants in a group whosemeasurements on a given dimension were accurate(differed by less than 5 cm from the researcher’smeasure). This expresses how well each group didon each measurement, in terms of acceptableaccuracy.Each group demonstrated 100% accuracy for
ten of the 21 dimension measurements, with sixdimensions in common. In Group A, 19 of the 21dimensions were accurately measured for at least80% of the participants; for Group U, it was 18 of21. The lowest GAP for each group occurred forthe distance from shoulder to keyboard measure-ment, and at 35.7% was particularly poor for
S.M.B. Joines, C.M. Sommerich / International Journal of Industrial Ergonomics 28 (2001) 327–340334
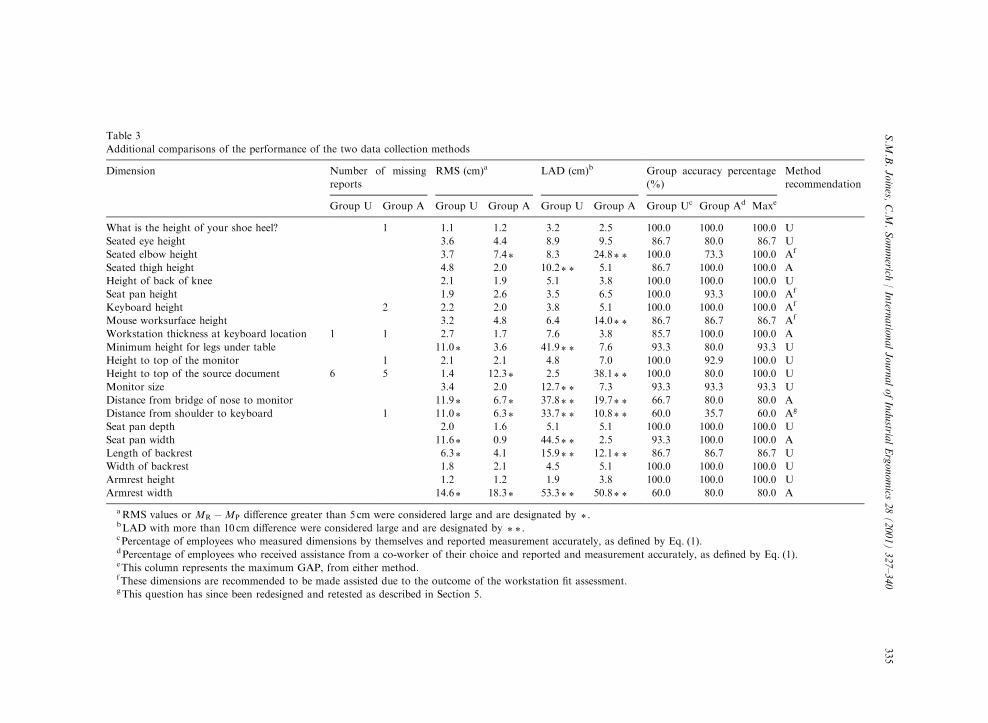
Table 3
Additional comparisons of the performance of the two data collection methods
Dimension Number of missing
reports
RMS (cm)a LAD (cm)b Group accuracy percentage
(%)
Method
recommendation
Group U Group A Group U Group A Group U Group A Group Uc Group Ad Maxe
What is the height of your shoe heel? 1 1.1 1.2 3.2 2.5 100.0 100.0 100.0 U
Seated eye height 3.6 4.4 8.9 9.5 86.7 80.0 86.7 U
Seated elbow height 3.7 7.4* 8.3 24.8* * 100.0 73.3 100.0 Af
Seated thigh height 4.8 2.0 10.2* * 5.1 86.7 100.0 100.0 A
Height of back of knee 2.1 1.9 5.1 3.8 100.0 100.0 100.0 U
Seat pan height 1.9 2.6 3.5 6.5 100.0 93.3 100.0 Af
Keyboard height 2 2.2 2.0 3.8 5.1 100.0 100.0 100.0 Af
Mouse worksurface height 3.2 4.8 6.4 14.0* * 86.7 86.7 86.7 Af
Workstation thickness at keyboard location 1 1 2.7 1.7 7.6 3.8 85.7 100.0 100.0 A
Minimum height for legs under table 11.0* 3.6 41.9* * 7.6 93.3 80.0 93.3 U
Height to top of the monitor 1 2.1 2.1 4.8 7.0 100.0 92.9 100.0 U
Height to top of the source document 6 5 1.4 12.3* 2.5 38.1* * 100.0 80.0 100.0 U
Monitor size 3.4 2.0 12.7* * 7.3 93.3 93.3 93.3 U
Distance from bridge of nose to monitor 11.9* 6.7* 37.8* * 19.7* * 66.7 80.0 80.0 A
Distance from shoulder to keyboard 1 11.0* 6.3* 33.7* * 10.8* * 60.0 35.7 60.0 Ag
Seat pan depth 2.0 1.6 5.1 5.1 100.0 100.0 100.0 U
Seat pan width 11.6* 0.9 44.5* * 2.5 93.3 100.0 100.0 A
Length of backrest 6.3* 4.1 15.9* * 12.1* * 86.7 86.7 86.7 U
Width of backrest 1.8 2.1 4.5 5.1 100.0 100.0 100.0 U
Armrest height 1.2 1.2 1.9 3.8 100.0 100.0 100.0 U
Armrest width 14.6* 18.3* 53.3* * 50.8* * 60.0 80.0 80.0 A
aRMS values or MR �MP difference greater than 5 cm were considered large and are designated by * .bLAD with more than 10 cm difference were considered large and are designated by * * .cPercentage of employees who measured dimensions by themselves and reported measurement accurately, as defined by Eq. (1).dPercentage of employees who received assistance from a co-worker of their choice and reported and measurement accurately, as defined by Eq. (1).eThis column represents the maximum GAP, from either method.fThese dimensions are recommended to be made assisted due to the outcome of the workstation fit assessment.gThis question has since been redesigned and retested as described in Section 5.
S.M
.B.Joines,
C.M
.Sommerich
/Intern
atio
nalJournalofIndustria
lErgonom
ics28(2001)327–340
335
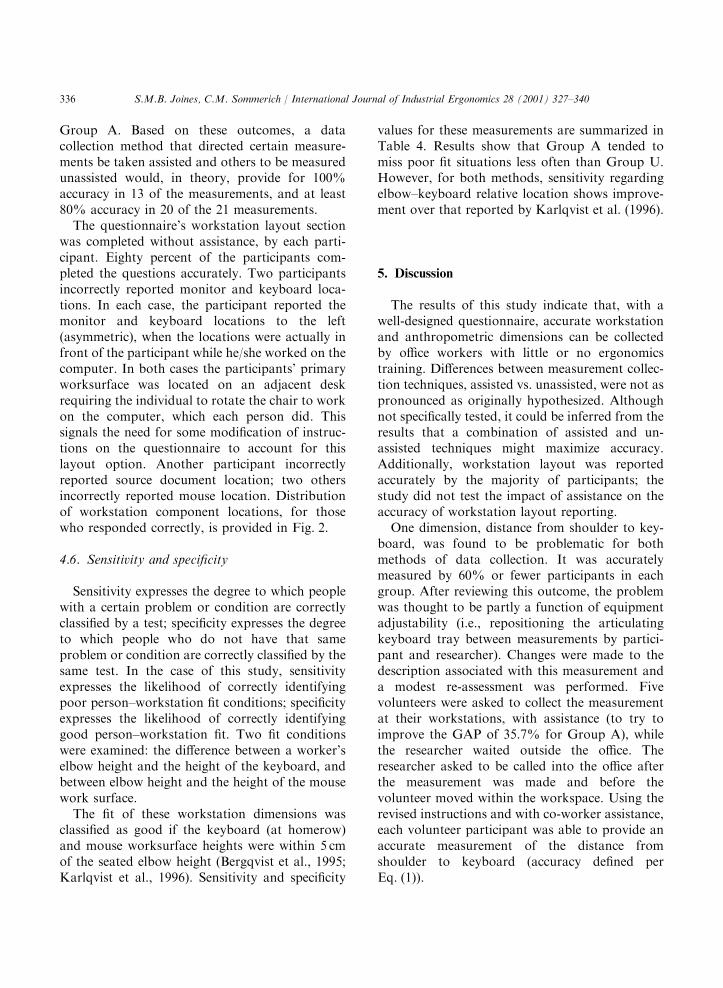
Group A. Based on these outcomes, a datacollection method that directed certain measure-ments be taken assisted and others to be measuredunassisted would, in theory, provide for 100%accuracy in 13 of the measurements, and at least80% accuracy in 20 of the 21 measurements.The questionnaire’s workstation layout section
was completed without assistance, by each parti-cipant. Eighty percent of the participants com-pleted the questions accurately. Two participantsincorrectly reported monitor and keyboard loca-tions. In each case, the participant reported themonitor and keyboard locations to the left(asymmetric), when the locations were actually infront of the participant while he/she worked on thecomputer. In both cases the participants’ primaryworksurface was located on an adjacent deskrequiring the individual to rotate the chair to workon the computer, which each person did. Thissignals the need for some modification of instruc-tions on the questionnaire to account for thislayout option. Another participant incorrectlyreported source document location; two othersincorrectly reported mouse location. Distributionof workstation component locations, for thosewho responded correctly, is provided in Fig. 2.
4.6. Sensitivity and specificity
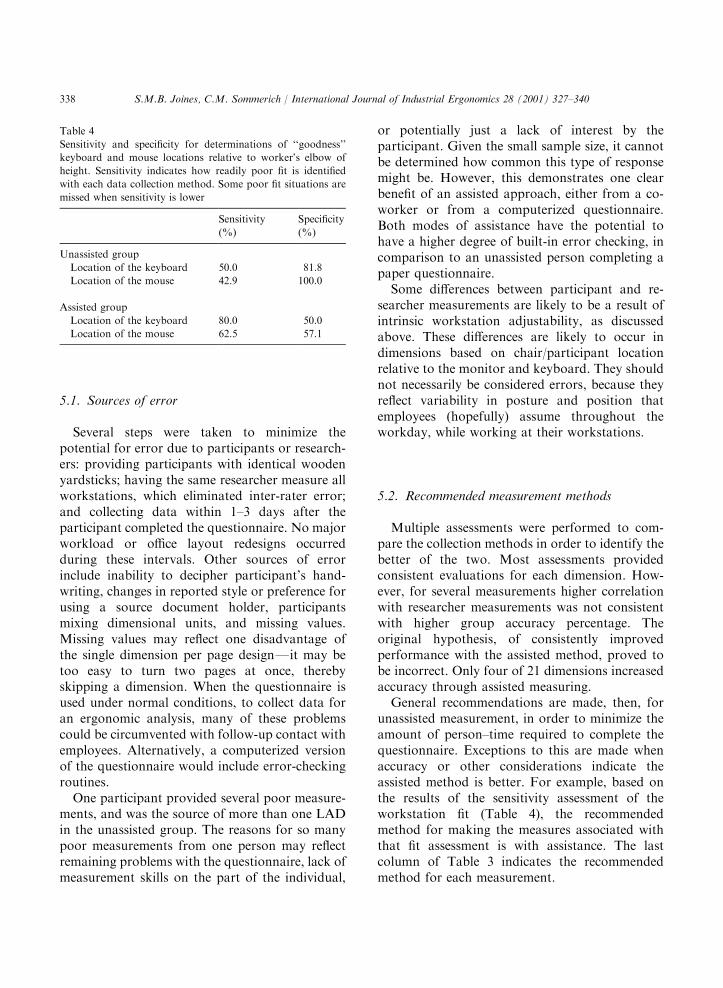
Sensitivity expresses the degree to which peoplewith a certain problem or condition are correctlyclassified by a test; specificity expresses the degreeto which people who do not have that sameproblem or condition are correctly classified by thesame test. In the case of this study, sensitivityexpresses the likelihood of correctly identifyingpoor person–workstation fit conditions; specificityexpresses the likelihood of correctly identifyinggood person–workstation fit. Two fit conditionswere examined: the difference between a worker’selbow height and the height of the keyboard, andbetween elbow height and the height of the mousework surface.The fit of these workstation dimensions was
classified as good if the keyboard (at homerow)and mouse worksurface heights were within 5 cmof the seated elbow height (Bergqvist et al., 1995;Karlqvist et al., 1996). Sensitivity and specificity
values for these measurements are summarized inTable 4. Results show that Group A tended tomiss poor fit situations less often than Group U.However, for both methods, sensitivity regardingelbow–keyboard relative location shows improve-ment over that reported by Karlqvist et al. (1996).
5. Discussion
The results of this study indicate that, with awell-designed questionnaire, accurate workstationand anthropometric dimensions can be collectedby office workers with little or no ergonomicstraining. Differences between measurement collec-tion techniques, assisted vs. unassisted, were not aspronounced as originally hypothesized. Althoughnot specifically tested, it could be inferred from theresults that a combination of assisted and un-assisted techniques might maximize accuracy.Additionally, workstation layout was reportedaccurately by the majority of participants; thestudy did not test the impact of assistance on theaccuracy of workstation layout reporting.One dimension, distance from shoulder to key-
board, was found to be problematic for bothmethods of data collection. It was accuratelymeasured by 60% or fewer participants in eachgroup. After reviewing this outcome, the problemwas thought to be partly a function of equipmentadjustability (i.e., repositioning the articulatingkeyboard tray between measurements by partici-pant and researcher). Changes were made to thedescription associated with this measurement anda modest re-assessment was performed. Fivevolunteers were asked to collect the measurementat their workstations, with assistance (to try toimprove the GAP of 35.7% for Group A), whilethe researcher waited outside the office. Theresearcher asked to be called into the office afterthe measurement was made and before thevolunteer moved within the workspace. Using therevised instructions and with co-worker assistance,each volunteer participant was able to provide anaccurate measurement of the distance fromshoulder to keyboard (accuracy defined perEq. (1)).
S.M.B. Joines, C.M. Sommerich / International Journal of Industrial Ergonomics 28 (2001) 327–340336
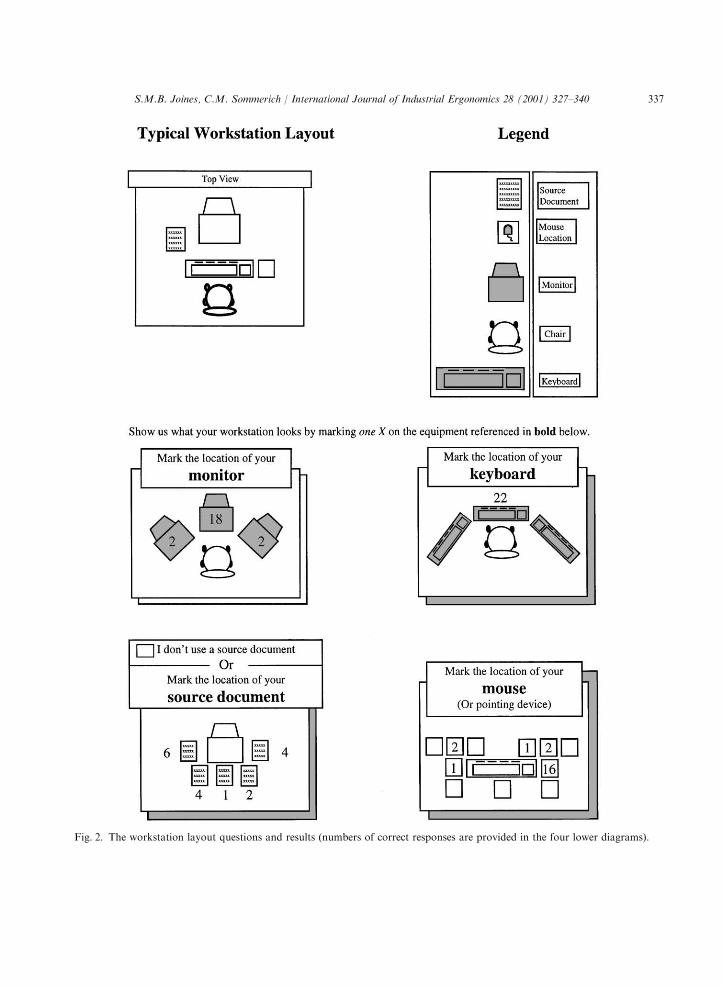
Fig. 2. The workstation layout questions and results (numbers of correct responses are provided in the four lower diagrams).
S.M.B. Joines, C.M. Sommerich / International Journal of Industrial Ergonomics 28 (2001) 327–340 337
5.1. Sources of error
Several steps were taken to minimize thepotential for error due to participants or research-ers: providing participants with identical woodenyardsticks; having the same researcher measure allworkstations, which eliminated inter-rater error;and collecting data within 1–3 days after theparticipant completed the questionnaire. No majorworkload or office layout redesigns occurredduring these intervals. Other sources of errorinclude inability to decipher participant’s hand-writing, changes in reported style or preference forusing a source document holder, participantsmixing dimensional units, and missing values.Missing values may reflect one disadvantage ofthe single dimension per page designFit may betoo easy to turn two pages at once, therebyskipping a dimension. When the questionnaire isused under normal conditions, to collect data foran ergonomic analysis, many of these problemscould be circumvented with follow-up contact withemployees. Alternatively, a computerized versionof the questionnaire would include error-checkingroutines.One participant provided several poor measure-
ments, and was the source of more than one LADin the unassisted group. The reasons for so manypoor measurements from one person may reflectremaining problems with the questionnaire, lack ofmeasurement skills on the part of the individual,
or potentially just a lack of interest by theparticipant. Given the small sample size, it cannotbe determined how common this type of responsemight be. However, this demonstrates one clearbenefit of an assisted approach, either from a co-worker or from a computerized questionnaire.Both modes of assistance have the potential tohave a higher degree of built-in error checking, incomparison to an unassisted person completing apaper questionnaire.Some differences between participant and re-
searcher measurements are likely to be a result ofintrinsic workstation adjustability, as discussedabove. These differences are likely to occur indimensions based on chair/participant locationrelative to the monitor and keyboard. They shouldnot necessarily be considered errors, because theyreflect variability in posture and position thatemployees (hopefully) assume throughout theworkday, while working at their workstations.
5.2. Recommended measurement methods
Multiple assessments were performed to com-pare the collection methods in order to identify thebetter of the two. Most assessments providedconsistent evaluations for each dimension. How-ever, for several measurements higher correlationwith researcher measurements was not consistentwith higher group accuracy percentage. Theoriginal hypothesis, of consistently improvedperformance with the assisted method, proved tobe incorrect. Only four of 21 dimensions increasedaccuracy through assisted measuring.General recommendations are made, then, for
unassisted measurement, in order to minimize theamount of person–time required to complete thequestionnaire. Exceptions to this are made whenaccuracy or other considerations indicate theassisted method is better. For example, based onthe results of the sensitivity assessment of theworkstation fit (Table 4), the recommendedmethod for making the measures associated withthat fit assessment is with assistance. The lastcolumn of Table 3 indicates the recommendedmethod for each measurement.
Table 4
Sensitivity and specificity for determinations of ‘‘goodness’’
keyboard and mouse locations relative to worker’s elbow of
height. Sensitivity indicates how readily poor fit is identified
with each data collection method. Some poor fit situations are
missed when sensitivity is lower
Sensitivity
(%)
Specificity
(%)
Unassisted group
Location of the keyboard 50.0 81.8
Location of the mouse 42.9 100.0
Assisted group
Location of the keyboard 80.0 50.0
Location of the mouse 62.5 57.1
S.M.B. Joines, C.M. Sommerich / International Journal of Industrial Ergonomics 28 (2001) 327–340338
6. Conclusions
This study demonstrated that individuals un-trained in ergonomics can provide anthropometricand VDT workstation dimensional informationand workstation layout information that is suffi-ciently accurate for a typical ergonomic assessmentprocess. The questionnaire designed to facilitatecollection of this information has the followingimportant features:
* only one measurement per page, to focus theemployee on performing the measurementcorrectly;
* a set of written instructions associated witheach measurement, to highlight important datacollection techniques (such as holding theyardstick upright and not at an angle);
* a text description of the dimension which wasaccurate and brief;
* a digital image of each measurement beingtaken;
* a large line drawing focusing only on thedimension of interest, to reduce ambiguityassociated with other information in the digitalphotos (i.e. not reusing the drawing of thewhole workstation for each measurement); and
* dimensions were ordered to maximize thenumber of measurements taken in a given area,to reduce the variability associated with theparticipant moving in and out of his/her chairand about the workstation.
With explicit written and visual instructionsprovided to them, office workers with no specifictraining in ergonomics, either with or withoutassistance from a co-worker, were able to providecertain measurements of themselves and theirworkstations, which were reasonably accurateand would be useful to an ergonomist and/or anergonomic assessment process. The questionnairewas created to facilitate accurate collection ofworkstation and anthropometric data, freeing theergonomist to focus on complex assessments,solution development, and implementation.The primary advantage this questionnaire pro-
vides is the ability to tailor a worker’s workstationto that individual, by using the specific anthro-pometry of that individual and the specific
dimensional characteristics of his/her workstation.Existing computerized VDT workstation assess-ment programs do not collect this type or amountof information, so must make recommendationsbased on numerous assumptions about a user’santhropometric make-up.
6.1. Future directions
An abridged version of this survey is indevelopment. It eliminates some measurementsthat were specific to the particular project thatprovided the opportunity for this study. Themeasurements being selected for inclusion arelimited to those necessary to characterize a work-er’s anthropometry and workstation. The surveywill be field-tested by other researchers, in order tomake further improvements. Several organizationshave expressed interest in serving as beta test sitesfor the shortened assessment tool. A futuredevelopment will be a web-based version that willinclude video clips demonstrating measurementmethods.
Acknowledgements
This research was supported in part by theNorth Carolina Ergonomics Resource Center.
References
Aar(as, A., Horgen, G., Bjorset, H.H., Ro, O., Thoresen, M.,
1998. Musculoskeletal, visual and psychosocial stress in
VDU operators before and after multidisciplinary ergo-
nomic interventions. Applied Ergonomics 29, 335–354.
Bergqvist, U., Wolgast, E., Nilsson, B., Voss, M., 1995.
Musculoskeletal disorders among visual display terminal
workers: individual, ergonomic, and work organizational
factors. Ergonomics 38, 763–776.
Bernard, B., Sauter, S., Fine, L., Peterson, M., Hales, T., 1994.
Job task and psychosocial risk factors for work-related
musculoskeletal disorders among newspaper employees.
Skandinavian Journal of Work Environment and Health
20, 417–426.
Hales, T.R., Sauter, S.L., Peterson, M.R., Fine, L.J., Putz-
Anderson, V., Schleifer, L.R., Ochs, T.T., Bernard, B.P.,
1994. Musculoskeletal disorders among visual display
terminal users in a telecommunications company. Ergo-
nomics 37, 1603–1621.
S.M.B. Joines, C.M. Sommerich / International Journal of Industrial Ergonomics 28 (2001) 327–340 339
Hatcher, L., Stepanski, E.J., 1994. A Step-by-Step Approach to
Using the SAS System for Univariate and Multivariate
Statistics. SAS Institute Inc., Cary, NC.
Hochanadel, C.D., 1995. Computer workstation adjustment: a
novel process and large sample study. Applied Ergonomics
26, 315–326.
H .unting, W., Laubli, T., Grandjean, E., 1981. Postural and
visual loads at VDT workplaces. I. Constrained postures.
Ergonomics 24, 917–931.
Joines, S.M.B., Sommerich, C.M., 2000. Cost effective alter-
native methods for office workstation measurements: self-
assessment and partnered-assessment. In Proceedings of the
IEA 2000/HFES 2000 Congress. Human Factors and
Ergonomics Society, pp. 5: 44–47.
Karlqvist, L.K., Hagberg, M., K .oster, M., Wenemark, M.,(Anell, R., 1996. Musculoskeletal symptoms among compu-
ter-assisted design (CAD) operators and evaluation of a
self-assessment questionnaire. International Journal of
Occupational and Environmental Health 2, 185–194.
Mekhora, K., Liston, C.B., Nanthavanij, S., Cole, J.H., 2000.
The effect of ergonomic intervention on discomfort in
computer users with tension neck syndrome. International
Journal of Industrial Ergonomics 26, 367–379.
Price, J.A., Dowell, W.R., 1998. Laptop configurations in
offices: effects on posture and discomfort. In Proceedings of
the Human Factors and Ergonomics Society 42nd Annual
Meeting, pp. 629–633.
Ryan, G.A., Bampton, M., 1988. Comparison of data process
operators with and without upper limb symptoms. Com-
munity Health Studies 12, 63–68.
Sauter, S.L., Schleifer, L.M., Knutson, S.J., 1991. Work
posture, workstation design, and musculoskeletal discom-
fort in a VDT data entry task. Human Factors 33, 151–167.
Smith, M.J., Cohen, B.G.F., Stammerjohn Jr., L.W., Happ, A.,
1981. An investigation of health complaints and job stress in
video display operations. Human Factors 23, 387–400.
Sommerich, C.M., Joines, S.M.B., Psihogios, J.P., 2001. Effects
of computer monitor viewing angle and related factors on
strain, performance, and preference outcomes. Human
Factors 43, 39–55.
Villanueva, M.B., Jonai, H., Sotoyama, M., Hisanaga, N.,
Takeuchi, Y., Saito, S., 1997. Sitting posture and neck and
shoulder muscle activities at different screen height settings
of the visual display terminal. Industrial Health 35,
330–336.
Wiktorin, C., Hjelm, E.W., Winkel, J., K .oster, M., Group,
S.M.I.S., 1996. Reproducibility of a questionnaire for
assessment of physical load during work and leisure time.
Journal of Occupational and Environmental Medicine 38,
190–201.
S.M.B. Joines, C.M. Sommerich / International Journal of Industrial Ergonomics 28 (2001) 327–340340