Voyager™ Biospectrometry™ Workstation
740
Voyager ™ Biospectrometry ™ Workstation With Delayed Extraction ® Technology User Guide Version 5.1 Series Software
-
Upload
khangminh22 -
Category
Documents
-
view
2 -
download
0
Transcript of Voyager™ Biospectrometry™ Workstation
Voyager™ Biospectrometry™ Workstation With Delayed Extraction® Technology
User GuideVersion 5.1 Series Software

NOTICE© Copyright 2001 Applied Biosystems
All rights reserved
For research use only. Not for use in diagnostic procedures.
Information in this document is subject to change without notice and does notrepresent a commitment by Applied Biosystems. Applied Biosystemsassumes no responsibility for any errors that may appear in this document.This manual is believed to be complete and accurate at the time ofpublication. In no event shall Applied Biosystems be liable for incidental,special, multiple, or consequential damages in connection with or arising fromthe use of this document.
Voyager products and their use are covered by one or more of the following USPatents: 5,288,644 · 5,643,798 · 5,453,247 · 5,625,184 · 5,627,369 · 5,760,393 ·5,885,775 · 5,827,659 · 5,821,063. Additional US and foreign patents arepending.
Applied Biosystems, Delayed Extraction, SymBiot and the fractal icon areregistered trademarks and Biospectrometry, Data Explorer, Sequazyme andVoyager are trademarks of Applera Corporation or its subsidiaries in the U.S.and certain other countries.
Acqiris is a registered trademark of Acqiris SA.
Acrobat and Adobe are registered trademarks of Adobe Systems Incorporated.
LIQUI-NOX is a trademark of Alconox, Inc.
Biacore is a registered trademark of Biacore AB.
Trans-Blot is a registered trademark of Bio-Rad Laboratories.
Teflon is a registered trademark of E.I. Du Pont de Nemours and Co.
Pentium is a registered trademark of Intel Corporation.
IBM is a registered trademark of International Business Machines Corporation.
LeCroy is a registered trademark of LeCroy Corporation.
Microsoft, MS, and Windows NT are registered trademarks of Microsoft Corporation.
Milli-Q and Zip Tip are registered trademarks of Millipore Corporation
PhastGel is a trademark of Pharmacia.
Tektronix is a registered trademark of Tektronix, Inc.
Printed in the USA, 05/2001
Part Number 4317707 Rev. B


Table of Contents
Table of Contents
Safety and Compliance Information ..................................... xv
How to Use This Guide ........................................................... xxix
Chapter 1 Introducing the Voyager™ Biospectrometry™Workstations
1.1 Voyager-DE™ and Voyager-DE PRO System Overview ................... 1-2
1.2 Voyager-DE™ STR System Overview .......................................... 1-5
1.3 MALDI-TOF MS Technology Overview ......................................... 1-7
1.4 Voyager-DE™ (Delayed Extraction®) Technology ........................... 1-11
1.5 Parts of the Voyager-DE and Voyager-DE PRO Systems ................. 1-17
1.5.1 System Components .............................................................1-17
1.5.2 Mass Spectrometer ...............................................................1-20
1.5.3 Vacuum System ....................................................................1-25
1.5.3.1 Voyager-DE Vacuum System ................................1-26
1.5.3.2 Voyager-DE PRO Vacuum System .......................1-28
1.5.4 Computer Components .........................................................1-30
1.6 Parts of the Voyager-DE STR System ......................................... 1-31
1.6.1 System Components .............................................................1-31
1.6.2 Mass Spectrometer ...............................................................1-33
1.6.3 Vacuum System ....................................................................1-37
1.6.4 Front Panel Indicators ...........................................................1-39
1.6.5 Computer Components .........................................................1-41
1.7 Software Overview ................................................................. 1-42
1.7.1 Control Software (Instrument andSequence Control Panels) ....................................................1-42
1.7.2 Post-Processing Software (Data Explorer™) .........................1-45
Voyager™ Biospectrometry™ Workstation User’s Guide iii
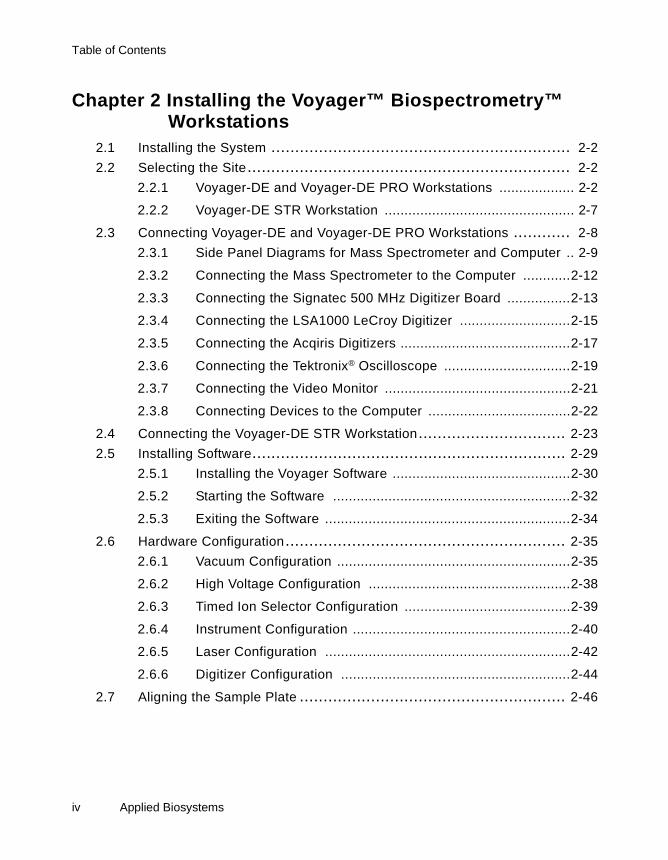
Table of Contents
Chapter 2 Installing the Voyager™ Biospectrometry™Workstations
2.1 Installing the System ............................................................... 2-2
2.2 Selecting the Site.................................................................... 2-2
2.2.1 Voyager-DE and Voyager-DE PRO Workstations ................... 2-2
2.2.2 Voyager-DE STR Workstation ................................................ 2-7
2.3 Connecting Voyager-DE and Voyager-DE PRO Workstations ............ 2-8
2.3.1 Side Panel Diagrams for Mass Spectrometer and Computer .. 2-9
2.3.2 Connecting the Mass Spectrometer to the Computer ............2-12
2.3.3 Connecting the Signatec 500 MHz Digitizer Board ................2-13
2.3.4 Connecting the LSA1000 LeCroy Digitizer ............................2-15
2.3.5 Connecting the Acqiris Digitizers ...........................................2-17
2.3.6 Connecting the Tektronix® Oscilloscope ................................2-19
2.3.7 Connecting the Video Monitor ...............................................2-21
2.3.8 Connecting Devices to the Computer ....................................2-22
2.4 Connecting the Voyager-DE STR Workstation............................... 2-23
2.5 Installing Software.................................................................. 2-29
2.5.1 Installing the Voyager Software .............................................2-30
2.5.2 Starting the Software ............................................................2-32
2.5.3 Exiting the Software ..............................................................2-34
2.6 Hardware Configuration........................................................... 2-35
2.6.1 Vacuum Configuration ...........................................................2-35
2.6.2 High Voltage Configuration ...................................................2-38
2.6.3 Timed Ion Selector Configuration ..........................................2-39
2.6.4 Instrument Configuration .......................................................2-40
2.6.5 Laser Configuration ..............................................................2-42
2.6.6 Digitizer Configuration ..........................................................2-44
2.7 Aligning the Sample Plate ........................................................ 2-46
iv Applied Biosystems

Table of Contents
2.8 Running OptiPlate to Optimize Mass Accuracy.............................. 2-53
2.8.1 Overview ...............................................................................2-53
2.8.2 Requirements .......................................................................2-55
2.8.3 Preparing to Optimize ...........................................................2-58
2.8.4 Running OptiPlate .................................................................2-63
2.8.5 Evaluating and Saving Results ..............................................2-69
2.9 Resetting the Optional External Laser ......................................... 2-71
2.10 Startup and Shutdown ............................................................. 2-73
2.11 Checking System Status and Pressures ...................................... 2-76
Chapter 3 Preparing Samples3.1 Preparing Samples ................................................................. 3-2
3.1.1 Selecting a Matrix .................................................................. 3-3
3.1.2 Preparing Matrix .................................................................... 3-4
3.1.3 Matrix Information .................................................................. 3-6
3.1.4 Preparing Sample .................................................................3-22
3.1.5 Sample Cleanup ...................................................................3-25
3.1.5.1 Washing ...............................................................3-26
3.1.5.2 Drop Dialysis (Floating Membrane) ......................3-27
3.1.5.3 Cation Exchange ..................................................3-29
3.1.5.4 ZipTips® ................................................................3-31
3.1.6 Mixing Sample and Matrix (Dried Droplet Application) ...........3-33
3.2 Loading Samples on Sample Plates ........................................... 3-35
3.2.1 Overview ...............................................................................3-35
3.2.2 Locating Standards for Optimum Mass Accuracy ..................3-38
3.2.3 Loading Samples (Dried Droplet Application) ........................3-41
3.2.4 Loading Samples (Thin Layer Application) ............................3-44
3.2.5 Examining Crystals on Sample Plates ...................................3-45
3.3 Cleaning Sample Plates .......................................................... 3-47
Voyager™ Biospectrometry™ Workstation User’s Guide v

Table of Contents
3.4 Loading Sample Plates in the Mass Spectrometer ......................... 3-50
3.4.1 Assigning Plate IDs ...............................................................3-50
3.4.2 Using the Mass Accuracy Optimization Option ......................3-52
3.4.3 Ejecting the Sample Holder ...................................................3-54
3.4.4 Loading Sample Plates .........................................................3-55
3.5 Sample Plate Types................................................................ 3-61
3.5.1 Sample Plate Types and Applications ...................................3-62
3.5.2 Editable-Configuration Plate (.PLT) Types Provided withthe System ............................................................................3-65
3.5.3 Guidelines for Defining Custom Plate Types .........................3-68
3.5.4 Creating and Editing .PLT Files .............................................3-76
3.5.5 Adjusting the Laser Position for a Custom .PLT File ..............3-85
Chapter 4 Voyager Instrument Control Panel Basics4.1 Instrument Control Panel .......................................................... 4-2
4.1.1 Parts of the Instrument Control Panel .................................... 4-2
4.1.2 Manual and Automatic Control Modes .................................... 4-6
4.1.3 Accessing the Sequence Control Panel andthe Data Explorer Software .....................................................4-7
4.2 Using the Control Pages ........................................................... 4-8
4.3 Using the Spectrum Window..................................................... 4-10
4.3.1 Adjusting the Display Range .................................................4-10
4.3.2 Zooming on Traces ...............................................................4-13
4.3.3 Adding Traces to a Window ..................................................4-13
4.3.4 Annotating Traces .................................................................4-16
4.3.5 Previewing and Printing Traces .............................................4-18
4.4 Customizing the Instrument Control Panel ................................... 4-21
4.5 Controlling the Workstation ...................................................... 4-24
4.5.1 Using Toolbar Buttons and Instrument Menu Commands ......4-24
4.5.2 Adjusting Laser Intensity and Selecting Sample Position ......4-27
vi Applied Biosystems

Table of Contents
4.6 Sequence Control Panel .......................................................... 4-32
4.7 How the Instrument and Sequence Control Panels Interact .............. 4-33
Chapter 5 Optimizing Instrument Settings5.1 Loading, Modifying, and Saving Instrument Settings........................ 5-2
5.1.1 Using Instrument Settings (.BIC) Files ................................... 5-2
5.1.2 Standard Instrument Settings (.BIC) Files Provided ................ 5-3
5.1.3 Opening and Viewing Instrument Settings .............................. 5-7
5.1.4 Modifying an Instrument Settings File (.BIC) .......................... 5-8
5.1.5 Saving and Printing Instrument Settings ...............................5-11
5.1.6 Setting Instrument Settings Files to “Read-Only” Status ........5-13
5.2 Instrument Settings Parameter Descriptions ................................. 5-14
5.2.1 Instrument Settings Page ......................................................5-15
5.2.2 Mode/Digitizer Dialog Box .....................................................5-24
5.2.3 Automatic Control Dialog Box ...............................................5-33
5.2.4 Description of Spectrum Accumulation Options .....................5-39
5.3 Impact of Changing Instrument Settings Parameters ...................... 5-49
5.3.1 Summary of Parameters .......................................................5-49
5.3.2 Understanding Grid Voltage% ...............................................5-51
5.3.3 Understanding Delay Time ....................................................5-54
5.3.4 Understanding Guide Wire Voltage% ....................................5-56
5.3.5 Understanding Digitizer Settings ...........................................5-57
5.3.5.1 Bin Size ................................................................5-57
5.3.5.2 Vertical Digitizer Settings ......................................5-60
5.4 Optimizing Instrument Settings Parameters .................................. 5-64
5.4.1 Optimization Strategy ............................................................5-65
5.4.2 Determining the Laser Setting ...............................................5-67
Voyager™ Biospectrometry™ Workstation User’s Guide vii

Table of Contents
5.4.3 Optimizing Resolution ...........................................................5-71
5.4.3.1 Overview ..............................................................5-72
5.4.3.2 Acceptable Resolution inDelayed Extraction Mode .....................................5-75
5.4.3.3 Optimizing Guide Wire Voltage% ..........................5-76
5.4.3.4 Optimizing Delay Time .........................................5-77
5.4.3.5 Optimizing Grid Voltage% .....................................5-82
5.4.4 Optimizing Signal-to-Noise Ratio ..........................................5-85
5.4.4.1 Overview ..............................................................5-86
5.4.4.2 Setting Accelerating Voltage .................................5-87
5.4.4.3 Setting Guide Wire Voltage% ...............................5-88
5.4.4.4 Setting Shots/Spectrum ........................................5-89
5.4.4.5 Setting Low Mass Gate ........................................5-89
5.5 Converting Version 4 Methods and Search Pattern Files ................. 5-92
Chapter 6 Acquiring Spectra from the Instrument ControlPanel
6.1 Before You Begin .................................................................... 6-2
6.1.1 Overview of Acquisition Options ............................................. 6-2
6.1.2 Guidelines for Acquiring ......................................................... 6-4
6.1.3 Calibrating the Mass Scale .................................................... 6-7
6.2 Acquiring in Manual Mode from the Instrument Control Panel ........... 6-11
6.2.1 Manually Acquiring, Evaluating, and Saving Spectra ............. 6-11
6.2.2 Manually Accumulating Spectra from Multiple Acquisitions ...6-19
6.3 Obtaining Good Spectra in Delayed Extraction Mode...................... 6-21
6.3.1 What Is a Good Spectrum? ...................................................6-21
6.3.2 Laser Intensity ......................................................................6-24
6.3.3 Parameters Affecting Resolution andSignal-to-Noise Ratio ............................................................6-25
6.4 Making Accurate Mass Measurements ........................................ 6-26
viii Applied Biosystems

Table of Contents
6.5 Evaluating Data in the Instrument Control Panel ............................ 6-28
6.5.1 Detecting, Integrating, and Labeling Peaks ...........................6-28
6.5.2 Calculating Mass Resolution .................................................6-30
6.5.3 Calculating Signal-to-Noise Ratio ..........................................6-33
6.6 Acquiring in Automatic Mode from the Instrument Control Panel........ 6-35
6.6.1 Before Acquiring in Automatic Control Mode .........................6-36
6.6.2 Setting Instrument Settings for Automatic Control Mode .......6-37
6.6.3 Automatically Acquiring, Evaluating, and Saving Spectra ......6-45
6.6.4 Search Patterns ....................................................................6-46
6.6.5 Creating and Editing .SP Files Using theSearch Pattern Editor ............................................................6-50
6.6.6 Process that Occurs During Acquisition in Automatic Mode ..6-58
6.6.7 Process that Occurs when Accumulating Spectra fromMultiple Search Pattern Positions .........................................6-65
6.6.7.1 Process that Occurs when AccumulatingAll Spectra ...........................................................6-66
6.6.7.2 Process that Occurs when AccumulatingPassing Spectra ...................................................6-67
Chapter 7 Acquiring Spectra from the Sequence ControlPanel
7.1 Overview .............................................................................. 7-2
7.2 Understanding Settings, Macros, and Calibration............................ 7-3
7.3 Before Creating a Sequence...................................................... 7-7
7.3.1 Optimizing Instrument Settings (.BIC) Files for aSequence Run ........................................................................7-7
7.3.2 Creating Macros .................................................................... 7-8
7.3.3 Creating Calibration (.CAL) Files ........................................... 7-11
7.3.4 Creating Processing Settings (.SET) Files ............................7-12
Voyager™ Biospectrometry™ Workstation User’s Guide ix

Table of Contents
7.4 Creating a Sequence .............................................................. 7-13
7.4.1 Setting General Sequence Parameters .................................7-13
7.4.2 Creating a Run List ...............................................................7-14
7.5 Preparing to Run a Sequence ................................................... 7-24
7.6 Running a Sequence .............................................................. 7-25
7.6.1 Starting a Sequence ..............................................................7-25
7.6.2 What the System Checks When You Start a Sequence .........7-26
7.6.3 During and After Acquiring a Sequence ................................7-28
7.6.4 Stopping a Sequence ............................................................7-29
7.6.5 Checking Sequence Status ...................................................7-29
7.7 Automatic Calibration During a Sequence Run ............................. 7-32
7.7.1 Calibration Options in a Sequence ........................................7-32
7.7.2 External Calibration Standard Requirements .........................7-33
7.7.3 Performing Close External Calibration ..................................7-34
7.7.4 Internal Standard Calibration Considerations ........................7-39
7.8 Customizing the Sequence Control Panel .................................... 7-43
7.8.1 Customizing the Sequence Display .......................................7-43
7.8.2 Setting Sequence Control Panel Preferences .......................7-45
Chapter 8 PSD Analysis8.1 PSD Quick Start ..................................................................... 8-2
8.1.1 PSD Analysis of Angiotensin .................................................. 8-7
8.1.2 PSD Analysis of an Unknown ................................................8-15
8.2 Overview of PSD Analysis........................................................ 8-20
8.2.1 Post-Source Decay Analysis .................................................8-20
8.2.2 Differences From Regular Analysis .......................................8-24
8.2.3 Segments and Composite Spectra ........................................8-25
8.2.4 PSD Data Files .....................................................................8-27
8.2.5 Mass Calculation for Fragment Ions ......................................8-28
8.2.6 Optimizing the Precursor Ion Selector ...................................8-29
x Applied Biosystems

Table of Contents
8.3 Enhancing Fragmentation with CID ............................................ 8-31
8.4 Acquiring PSD Data with Standard .BIC Files inManual Control Mode ............................................................. 8-37
8.4.1 Determining the Precursor Ion Mass .....................................8-38
8.4.2 Determining the Number of Segments to Acquire for aComplete Composite Spectrum .............................................8-40
8.4.3 Setting PSD Acquisition Parameters for Manual Mode ..........8-43
8.4.4 Filling in the Segment List and Saving the .BIC File ..............8-47
8.4.5 Acquiring and Saving PSD Segments in Manual Mode .........8-52
8.5 Acquiring PSD Data with Standard .BIC Files inAutomatic Control Mode .......................................................... 8-57
8.5.1 Setting PSD Acquisition Parameters forAutomatic Control Mode ........................................................8-58
8.5.2 Setting Laser Increment and Saving the .BIC File .................8-62
8.5.3 Acquiring PSD Segments in Automatic Control Mode ............8-63
8.6 Exploring PSD Mode .............................................................. 8-65
8.6.1 Observing the Effects of Laser Intensity ................................8-66
8.6.2 Observing the Effects of Precursor Ion Selector ....................8-69
8.6.3 Observing the Effects of Grid Voltage% ................................8-73
8.6.4 Summary ..............................................................................8-76
8.7 Viewing PSD Data.................................................................. 8-77
Chapter 9 Maintenance and Troubleshooting9.1 Maintenance .......................................................................... 9-2
9.1.1 Maintenance Schedule ........................................................... 9-2
9.1.2 Hardware Maintenance .......................................................... 9-3
9.1.3 Backing Up and Archiving Data .............................................. 9-6
9.2 Troubleshooting...................................................................... 9-7
9.2.1 Spectrum Troubleshooting ..................................................... 9-7
9.2.2 Software Troubleshooting .....................................................9-19
9.2.3 Hardware Troubleshooting ....................................................9-23
Voyager™ Biospectrometry™ Workstation User’s Guide xi

Table of Contents
Appendix A Specifications ................................................................ A-1
Appendix B Warranty/Service Information .............................. B-1
Appendix C Matrixes .............................................................................. C-1
Appendix D Log Sheets ........................................................................ D-1
Appendix E Grid Voltage% and Delay Time Settings ....... E-1
Appendix F Reference Standard Information ........................ F-1
Appendix G Maintenance Log ..........................................................G-1
Appendix H Continuous Extraction Mode ............................... H-1
Appendix I Using the Oscilloscope and Control Stick ..... I-1
Glossary
Bibliography
Index
xii Applied Biosystems

Safety and Compliance Information
1
Safety and Compliance InformationIn this section This section includes:
• Instrument safety• Safety and EMC standards• Laser safety
Instrument Safety
In this section This section includes:
• Notes, Hints, Cautions, and Warnings• Safety symbols• Before operating this instrument• Material Safety Data Sheets (MSDSs)• General Warnings
Notes, Hints,Cautions, and
Warnings
Notes, Hints, Cautions, and Warnings are used in thisdocument as follows.
A Note provides important information to the operator. Forexample:
NOTE: If you are prompted to insert the boot diskette intothe drive, insert it, then press any key.
A Hint provides helpful suggestions not essential to the use ofthe system. For example:
Hint: To avoid complicated file naming, use Save First toPass or Save Best Only modes.
Voyager™ Biospectrometry™ Workstation User’s Guide xiii

Safety and Compliance Information
1
A Caution provides information to avoid damage to the systemor loss of data. For example:CAUTION
Do not touch the lamp. This may damage the lamp.
A Warning provides specific information essential to the safetyof the operator. For example:
WARNING
CHEMICAL HAZARD. Wear appropriate personalprotection and always observe safe laboratory practiceswhen operating your system.
Remarques,recommandationset avertissements
Une remarque fournit une information importante à l’opérateurer se présente ainsi:
REMARQUE: Si on vous demande d’insérer la disquette dedémarrage dans le lecteur, insérez-la puis appuyez surn’importe quelle touche.
Une recommandation fournit une information destinée à éviterdes détériorations du système ou la perte de données:
RECOMMANDATIONLa lampe peut être endommagée. N’y touchez pas.
Un avertissement fournit une information indispensable à lasécurité de l’operateur et se présente ainsi:
AVERTISSEMENT
Conformez-vous toujours aux règlements du laboratoirequand vous utilisez votre système.
xiv Applied Biosystems

Safety and Compliance Information
1
Safety symbols The following symbols may be displayed on the system.These symbols may also appear next to associated warningsin this document.
Electrical Symbols The following chart is an illustrated glossary of electricalsymbols that may be displayed on your instrument. Wheneversuch symbols appear on instruments, please observeappropriate safety procedures.
This symbol indicates the on position of the main power switch.
This symbol indicates the off position of the main power switch.
This symbol indicates the on/off position of a push-push mainpower switch.
This symbol indicates that a terminal may be connected toanother instrument’s signal ground reference. This is not aprotected ground terminal.
This symbol indicates that this is a protective groundingterminal that must be connected to earth ground before anyother electrical connections are made to the instrument.
A terminal marked with this symbol either receives or deliversalternating current or voltage.
A terminal marked with this symbol can receive or supply analternating and a direct current or voltage.
This symbol appears next to the values of the fuses required bythe system.
~~
Voyager™ Biospectrometry™ Workstation User’s Guide xv

Safety and Compliance Information
1
Non-electricalSymbols
The following is an illustrated glossary of non-electrical safetyalert symbols that may be displayed on your instrument.
WARNING: This symbol indicates the presence of high voltageand warns the user to proceed with caution.
WARNING: This symbol alerts you to consult the manual forfurther information and to proceed with caution.
WARNING: This symbol illustrates a heater hazard. Proceedwith caution when working around these areas to avoid beingburned by hot components.
This symbol indicates that a laser is present inside theinstrument.
xvi Applied Biosystems
Safety and Compliance Information
1
Symboles desalertes desécurité
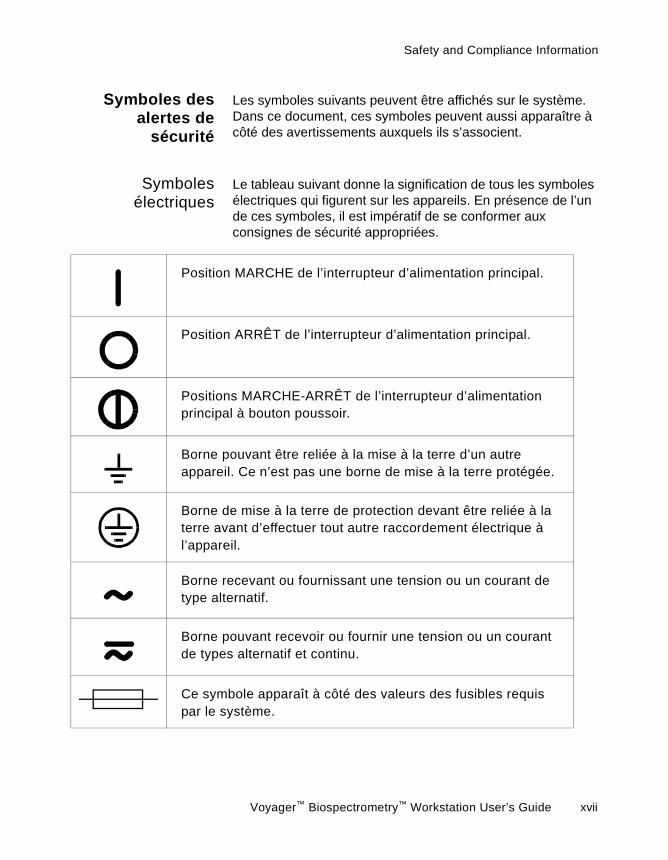
Les symboles suivants peuvent être affichés sur le système.Dans ce document, ces symboles peuvent aussi apparaître àcôté des avertissements auxquels ils s’associent.
Symbolesélectriques
Le tableau suivant donne la signification de tous les symbolesélectriques qui figurent sur les appareils. En présence de l’unde ces symboles, il est impératif de se conformer auxconsignes de sécurité appropriées.
Position MARCHE de l’interrupteur d’alimentation principal.
Position ARRÊT de l’interrupteur d’alimentation principal.
Positions MARCHE-ARRÊT de l’interrupteur d’alimentationprincipal à bouton poussoir.
Borne pouvant être reliée à la mise à la terre d’un autreappareil. Ce n’est pas une borne de mise à la terre protégée.
Borne de mise à la terre de protection devant être reliée à laterre avant d’effectuer tout autre raccordement électrique àl’appareil.
Borne recevant ou fournissant une tension ou un courant detype alternatif.
Borne pouvant recevoir ou fournir une tension ou un courantde types alternatif et continu.
Ce symbole apparaît à côté des valeurs des fusibles requispar le système.
~~
Voyager™ Biospectrometry™ Workstation User’s Guide xvii
Safety and Compliance Information
1
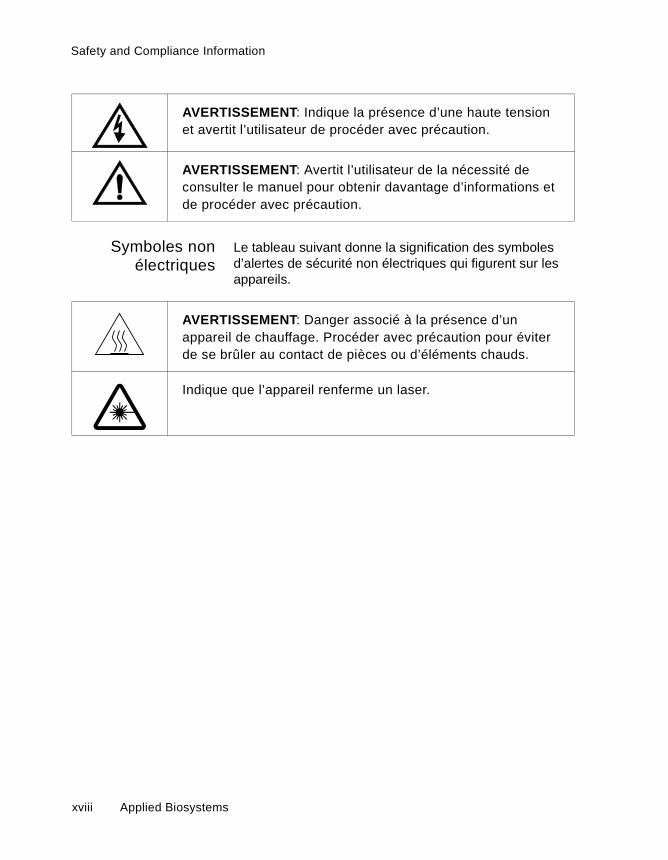
Symboles nonélectriques
Le tableau suivant donne la signification des symbolesd’alertes de sécurité non électriques qui figurent sur lesappareils.
AVERTISSEMENT: Indique la présence d’une haute tensionet avertit l’utilisateur de procéder avec précaution.
AVERTISSEMENT: Avertit l’utilisateur de la nécessité deconsulter le manuel pour obtenir davantage d’informations etde procéder avec précaution.
AVERTISSEMENT: Danger associé à la présence d’unappareil de chauffage. Procéder avec précaution pour éviterde se brûler au contact de pièces ou d’éléments chauds.
Indique que l’appareil renferme un laser.
xviii Applied Biosystems
Safety and Compliance Information
1
Before operatingthis instrumentEnsure that anyone involved with the operation of theinstrument is instructed in both general safety practices forlaboratories and specific safety practices for the instrument.Make sure you have read and understood all related MaterialSafety Data Sheets.
Material SafetyData Sheets
(MSDSs)
Some of the chemicals that may be used with your system arelisted as hazardous by their manufacturer. When hazardsexist, they are prominently displayed on the labels of allchemicals. In addition, MSDSs supplied by the chemicalmanufacturer provide information about:
• Physical characteristics• Safety precautions• Health hazards• First-aid• Spill clean-up• Disposal procedures
WARNING
CHEMICAL HAZARD. Before handling any chemicals, referto the Material Safety Data Sheet provided by themanufacturer, and observe all relevant precautions.
AVERTISSEMENT
RISQUE CHIMIQUE. Avant de manipuler des produitschimiques, veuillez consulter la fiche de sécurité dumatériel fournie par le fabricant, et observer les mesures deprécaution qui s’imposent.
Voyager™ Biospectrometry™ Workstation User’s Guide xix

Safety and Compliance Information
1
To order MSDSs... Then...Over the Internet Go to our Web site atwww.appliedbiosystems.com/techsupport.
Click MSDSs.
Enter keywords (or partial words), or a part number,or the MSDSs Documents on Demand indexnumber.
Click Search.
Click the Adobe Acrobat symbol to view, print, ordownload the document, or check the box of thedesired document and delivery method(fax or e-mail).
By telephone in theUnited States
Dial 1-800-327-3002, then press 1.
xx Applied Biosystems
Safety and Compliance Information
1
General WarningsWARNING
FIRE HAZARD. Using a fuse of the wrong type or ratingcan cause a fire. Replace fuses with those of the same typeand rating.
AVERTISSEMENT
DANGER D’INCENDIE. L’usage d’un fusible de type ou devaleur nominale différents risque de provoquer un incendie.Il convient donc de remplacer les fusibles usagés par desfusibles du même type et de la même valeur nominale.
WARNING
LASER HAZARD. The laser emits ultraviolet radiation.Lasers can burn the retina and leave permanent blindspots. Do not remove any instrument panels or look directlyinto the laser beam or allow a reflection of the beam toenter your eyes. Wear proper eye protection if any panelsare removed for service.
AVERTISSEMENT
DANGER LASER. Le laser émet des radiationsultraviolettes. Les lasers peuvent brûler la rétine et laisserdes points aveugles permanents. Il convient de ne pasretirer le panneau avant ou les panneaux latéraux del’appareil et de ne pas regarder directement dans lefaisceau laser ou laisser une réflexion du faisceau entrerdans les yeux. Portez des protections adéquates pour lesyeux si le panneau avant ou les panneaux latéraux ont étéretirés afin d’effectuer l’entretien.
Voyager™ Biospectrometry™ Workstation User’s Guide xxi

Safety and Compliance Information
1
WARNINGELECTRICAL SHOCK HAZARD. Severe electrical shockcan result by operating the instrument without the panels inplace. Do not remove instrument panels. High voltagecontacts are exposed with panels removed.
AVERTISSEMENT
RISQUE DE DÉCHARGE ÉLECTRIQUE. Des déchargesélectriques sérieuses peuvent résulter du fonctionnementde l’appareil lorsque le panneau avant et les panneauxlatéraux sont retirés. Ne pas retirer le panneau avant ou lespanneaux latéraux. Des contacts haute tension sontexposés lorsque les panneaux sont retirés.
WARNING
CHEMICAL HAZARD. To prevent eye injury, always weareye protection when working with solvents.
AVERTISSEMENT
RISQUE CHIMIQUE. Pour éviter les blessures aux yeux,porter toujours des protections pour les yeux lorsque vousmanipulez des solvants.
WARNING
PHYSICAL INJURY HAZARD. Use the VoyagerBiospectrometry Workstation only as specified in thisdocument. Using this system in a manner not specified mayresult in injury or damage to the system.
xxii Applied Biosystems
Safety and Compliance Information
1
AVERTISSEMENTDANGER DE BLESSURES CORPORELLES.Veuillezsuivre avec attention les indications figurant dans cedocument lorsque vous utilisez la Station de Travail deBiosptectrométrie Voyager. Un usage différent de la stationpourrait causer un accident ou endommager le système.
Voyager™ Biospectrometry™ Workstation User’s Guide xxiii

Safety and Compliance Information
1
Safety and EMC(Electromagnetic Compliance) StandardsUS Safety andEMC
Standards
Safety
This instrument has been tested to and complies withstandard ANSI/UL 3101-1, “Electrical Equipment forLaboratory Use; Part 1: General Requirements”, 1st Edition. Itis an ETL Testing Laboratories listed product.
EMC
This device complies with Part 15 of the FCC Rules. Operationis subject to the following two conditions: (1) This device maynot cause harmful interference, and (2) this device mustaccept any interference received, including interference thatmay cause undesired operation.
WARNING
Changes or modifications to this unit not expresslyapproved by the party responsible for compliance couldvoid the user’s authority to operate the equipment.
NOTE: This equipment has been tested and found tocomply with the limits for a Class A digital device, pursuantto Part 15 of the FCC Rules. These limits are designed toprovide reasonable protection against harmful interferencewhen the equipment is operated in a commercialenvironment. This equipment generates, uses, and canradiate radio frequency energy and, if not installed andused in accordance with the instruction manual, may causeharmful interference to radio communications. Operation ofthis equipment in a residential area is likely to causeharmful interference in which case the user will be requiredto correct the interference at his own expense.
NOTE: Shielded cables must be used with this unit toensure compliance with the Class A FCC limits.
xxiv Applied Biosystems

Safety and Compliance Information
1
Canadian Safetyand EMCStandards
Safety
This instrument has been tested to and complies withstandard CSA 1010, “Safety Requirements for ElectricalEquipment for Measurement, Control, and Laboratory Use;Part 1: General Requirements”. It is an ETL TestingLaboratories listed product.
Sécurité
Cet instrument a été vérifié avec la norme CSA 1010,«Spécifications de sécurité du matériel électrique utilisé pourles mesures, les contrôles et dans les laboratoires ; Partie 1 :Spécifications générales», et il est conforme à cette norme.C’est un produit homologué par les ETL Testing Laboratories.
EMC
This Class A digital apparatus meets all requirements of theCanadian Interference-Causing Equipment Regulations.
Cet appareil numérique de la classe A respecte toutes lesexigences du Règlement sur le materiel brouilleur du Canada.
European Safetyand EMC
Standards
Safety
This instrument meets European requirements for safety(EMC Directive 73/23/EEC). This instrument has been testedto and complies with standard EN61010-1 “SafetyRequirements for Electrical Equipment for Measurement,Control and Laboratory Use”.
EMC
This instrument meets European requirements for emissionand immunity (EMC Directive 98/336/EEC). This product hasbeen evaluated to the EN61326:1998, “Electrical Equipmentfor Measurement, Control and Laboratory Use—EMCRequirements”. Radiated Emissions were evaluated toGroup 1, Class B requirements.
Voyager™ Biospectrometry™ Workstation User’s Guide xxv

Safety and Compliance Information
1
Laser SafetyLaserclassification
The Voyager™ Biospectrometry™ Workstation uses a standardnitrogen laser and an optional Nd:YAG laser. Under normaloperating conditions, the instrument laser is categorized as aClass I laser. Under certain conditions during servicing, wheninterlocks have been circumvented, the lasers fall into thefollowing categories (can cause permanent eye damage):
• Nitrogen—Class IIIb• Nd:YAG—Class IV
The Voyager Biospectrometry Workstation complies with Title21, U.S. Government DHEW/BRH Performance Standards,Chapter 1, Subchapter J, Section 1040, as applicable.
Laser safetyfeatures
The following safety features are included on the VoyagerBiospectrometry Workstation:
• Cabinet is designed to prevent access to collateral laserradiation exceeding the accessible emission limits inPerformance Standards for Laser Products, 21 CFR1040.10.
• Front and side panels have interlock switches that disablethe laser when panels are removed.
• Safety labels for Class I standards are affixed to the unit.
Laser safetyrequirements
To ensure safe laser operation, note the following:
• The system must be installed and maintained by anApplied Biosystems Technical Representative.
• All panels must be installed during operation. When allpanels are installed, there should be no detectableradiation present. If any panels are removed when thelaser is operational, you may be exposed to laseremissions in excess of Class 1 rating.
• Do not remove labels or disable safety interlocks.
Additional safetyinformation
Refer to the users manual provided with the laser foradditional information on government and industry safetyregulations.
xxvi Applied Biosystems
How to Use This Guide
1
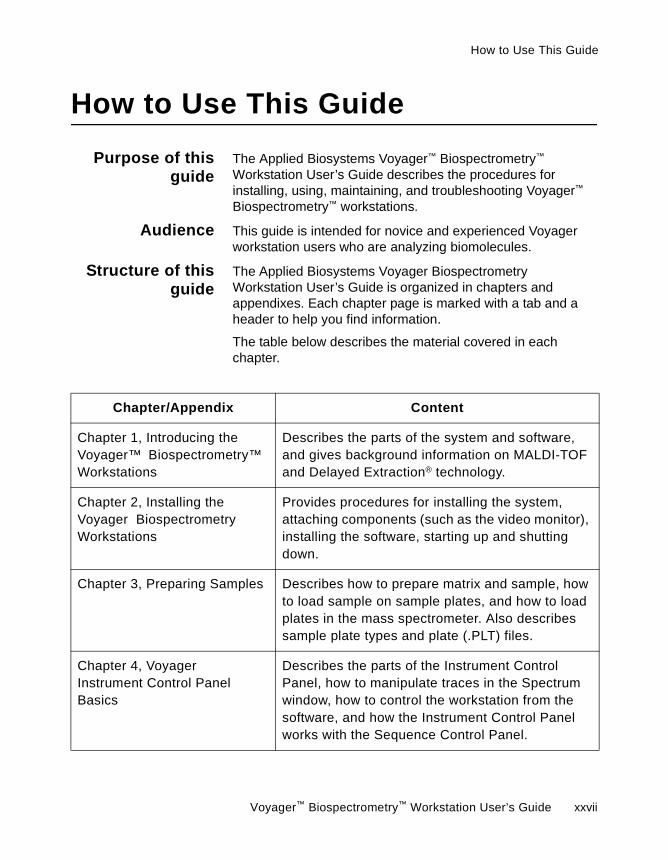
How to Use This GuidePurpose of thisguide
The Applied Biosystems Voyager™ Biospectrometry™
Workstation User’s Guide describes the procedures forinstalling, using, maintaining, and troubleshooting Voyager™
Biospectrometry™ workstations.
Audience This guide is intended for novice and experienced Voyagerworkstation users who are analyzing biomolecules.
Structure of thisguide
The Applied Biosystems Voyager BiospectrometryWorkstation User’s Guide is organized in chapters andappendixes. Each chapter page is marked with a tab and aheader to help you find information.
The table below describes the material covered in eachchapter.
Chapter/Appendix Content
Chapter 1, Introducing theVoyager™ Biospectrometry™Workstations
Describes the parts of the system and software,and gives background information on MALDI-TOFand Delayed Extraction® technology.
Chapter 2, Installing theVoyager BiospectrometryWorkstations
Provides procedures for installing the system,attaching components (such as the video monitor),installing the software, starting up and shuttingdown.
Chapter 3, Preparing Samples Describes how to prepare matrix and sample, howto load sample on sample plates, and how to loadplates in the mass spectrometer. Also describessample plate types and plate (.PLT) files.
Chapter 4, VoyagerInstrument Control PanelBasics
Describes the parts of the Instrument ControlPanel, how to manipulate traces in the Spectrumwindow, how to control the workstation from thesoftware, and how the Instrument Control Panelworks with the Sequence Control Panel.
Voyager™ Biospectrometry™ Workstation User’s Guide xxvii

How to Use This Guide
1
Chapter 5, OptimizingInstrument SettingsDescribes instrument settings (.BIC) files and howto optimize them.
Chapter 6, Acquiring Spectrafrom the Instrument ControlPanel
Describes how to acquire mass spectra fromsingle samples using the Instrument Control Panelin Manual Control mode and Automatic Controlmode.
Chapter 7, Acquiring Spectrafrom the Sequence ControlPanel
Describes how to acquire mass spectra frommultiple samples using the Sequence ControlPanel.
Chapter 8, PSD Analysis Describes using PSD analysis software, andexploring the impact of system settings on thequality of data obtained.
Chapter 9, Maintenance andTroubleshooting
Lists routine maintenance procedures performedby Applied Biosystems.
Contains troubleshooting information and errorcodes.
Appendix A, Specifications Includes system specifications.
Appendix B, Warranty/ServiceInformation
Contains warranty, service, return, and spare partsinformation.
Appendix C, Matrixes Lists chemical structures and preparationinformation for common matrixes.
Appendix D, Log Sheets Contains blank log sheets that you can copy anduse to record sample location.
Appendix E, Grid Voltage%and Delay Time Settings
Contains graphs that illustrate the relationshipbetween these Delayed Extraction tuningparameters.
Chapter/Appendix Content
xxviii Applied Biosystems

How to Use This Guide
1
Relateddocumentation
The related documents shipped with your system are:
• Voyager™ Biospectrometry™ Workstation GettingStarted Guide —Use this guide to learn the basics ofoperating the system. It provides step-by-stepinformation for running your first experiment.
• Data Explorer™ Software User’s Guide —Refer tothis guide for functions in the Data Explorer softwarethat are not described in the Voyager BiospectrometryWorkstation User’s Guide.
Referencedocumentation
The reference documents shipped with your system are:
• Printer documentation (depends on the printer youpurchase)—Use this documentation to set up andservice your printer.
Appendix F, ReferenceStandard Information
Includes molecular weights and mass to timeconversions for standard calibration compounds.Also lists theoretical cleavages and observedfragment masses for angiotensin.
Appendix G, Maintenance Log Includes a log sheet for tracking routinemaintenance.
Appendix H, ContinuousExtraction Mode
Includes information for running the system inContinuous Extraction mode for diagnosticpurposes.
Appendix I, Using theOscilloscope and Control Stick
Describes the front panel controls of theoscilloscope hardware and how to use the Controlstick to move sample position, start and stop thelaser, and start and stop acquisition.
Chapter/Appendix Content
Voyager™ Biospectrometry™ Workstation User’s Guide xxix

How to Use This Guide
1
• Microsoft ® Windows NT® User’s Guide and relateddocuments—Use this guide to learn detailedinformation about the Microsoft Windows NT userinterface.
• Varian Turbopump Instruction Manual
• Varian Turbocontroller Instruction Manual
• Varian Multigauge Controller Manual
• Mechanical Pump Operating Instructions
• GAST Compressor Operating and MaintenanceInstructions
You also receive the appropriate manual for the digitizerincluded with your system.
Send us yourcomments
We welcome your comments and suggestions for improvingour manuals. You can send us your comments in two ways.
• On the web at:
www.appliedbiosystems.com/about/contact.html
• By e-mail at:
xxx Applied Biosystems

1Chapter
1 Introducing theVoyager™
Biospectrometry™
Workstations
This chapter contains the following sections:1.1 Voyager-DE™ and Voyager-DE PRO
System Overview ............................................. 1-2
1.2 Voyager-DE™ STR System Overview ............... 1-5
1.3 MALDI-TOF MS Technology Overview ............. 1-7
1.4 Voyager-DE™ (Delayed Extraction®)Technology .................................................... 1-11
1.5 Parts of the Voyager-DE andVoyager-DE PRO Systems ............................ 1-17
1.6 Parts of the Voyager-DE STR System............ 1-31
1.7 Software Overview......................................... 1-42
Voyager™ Biospectrometry™ Workstation User’s Guide 1-1

Chapter 1 Introducing the Voyager™ Biospectrometry™ Workstations
1
1.1 Voyager-DE™ andVoyager-DE PROSystem OverviewThe Voyager-DE™ and Voyager-DE PRO Biospectrometry™
Workstations are designed for use by mass spectrometrists,biochemists, molecular biologists, and life scientists.
Voyager-DE The Applied Biosystems Voyager-DE BiospectrometryWorkstation (Figure 1-1) is a benchtop MALDI-TOF(matrix-assisted laser desorption ionization time-of-flight)mass spectrometer. Voyager Delayed Extraction® technologyprovides improved resolution and mass accuracy.
Figure 1-1 Voyager-DE Biospectrometry Workstation
PB100465
1-2 Applied Biosystems
Voyager-DE™ and Voyager-DE PRO System Overview
1
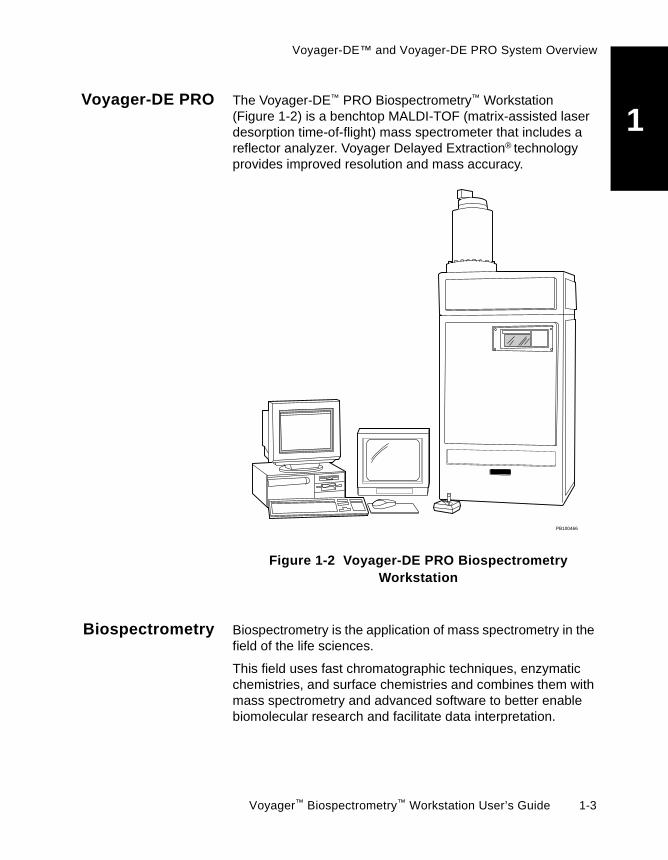
Voyager-DE PRO The Voyager-DE™ PRO Biospectrometry™ Workstation(Figure 1-2) is a benchtop MALDI-TOF (matrix-assisted laserdesorption time-of-flight) mass spectrometer that includes areflector analyzer. Voyager Delayed Extraction® technologyprovides improved resolution and mass accuracy.
Figure 1-2 Voyager-DE PRO BiospectrometryWorkstation
Biospectrometry Biospectrometry is the application of mass spectrometry in thefield of the life sciences.
This field uses fast chromatographic techniques, enzymaticchemistries, and surface chemistries and combines them withmass spectrometry and advanced software to better enablebiomolecular research and facilitate data interpretation.
PB100466
Voyager™ Biospectrometry™ Workstation User’s Guide 1-3

Chapter 1 Introducing the Voyager™ Biospectrometry™ Workstations
1
Features Features of the Voyager-DE and Voyager-DE PROBiospectrometry Workstations include:
• High-speed digitizer options and laser rates for optimumsample throughput
• Positive or negative ion detection
• m/z range in excess of 300 kDa
• Sensitivity to less than 5 femtomoles with dried dropletapplication
• Ion path length:
• Voyager-DE—1.2 meter• Voyager-DE PRO in linear mode—1.3 meter• Voyager-DE PRO in reflector mode—2.0 meter
• Variable acceleration voltage
• Compact benchtop design
• Variable two-stage ion source
• Automated single-plate sample loading system, sampleplates with various formats available
• Beam guide technology for high mass sensitivity
• Video camera and monitor for sample viewing
• Low mass gate matrix suppression
• Intuitive Microsoft ® Windows NT®-based software
Features unique to the Voyager-DE PRO BiospectrometryWorkstation include:
• High-performance reflector• Timed ion selector• Post-source decay (PSD) analysis capability• Linear or reflector mode operation• Collision-induced dissociation (CID) option
1-4 Applied Biosystems
Voyager-DE™ STR System Overview
1
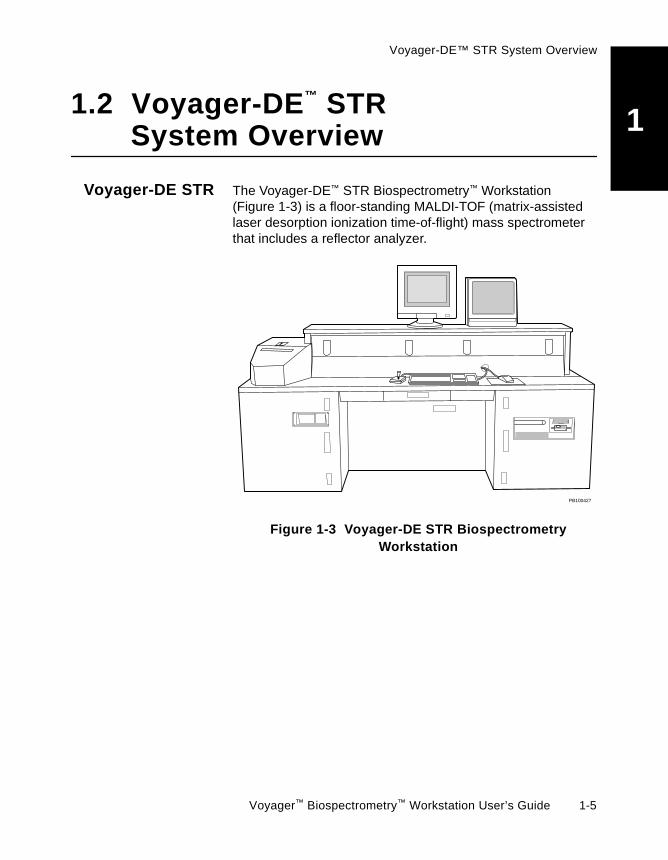
1.2 Voyager-DE™ STRSystem OverviewVoyager-DE STR The Voyager-DE™ STR Biospectrometry™ Workstation(Figure 1-3) is a floor-standing MALDI-TOF (matrix-assistedlaser desorption ionization time-of-flight) mass spectrometerthat includes a reflector analyzer.
Figure 1-3 Voyager-DE STR BiospectrometryWorkstation
PB100427
Voyager™ Biospectrometry™ Workstation User’s Guide 1-5

Chapter 1 Introducing the Voyager™ Biospectrometry™ Workstations
1
Biospectrometry Biospectrometry is the application of mass spectrometry in thefield of the life sciences.
This field uses fast chromatographic techniques, enzymaticchemistries, and surface chemistries and combines them withmass spectrometry and advanced software to better enablebiomolecular research and facilitate data interpretation.
Features Features of the Voyager-DE STR BiospectrometryWorkstation include:
• High-speed digitizer options and laser rates for optimumsample throughput
• Positive and negative ion detection
• Modular horizontal design
• High-performance reflector
• Post-source decay (PSD) analysis capability
• Linear or reflector mode operation
• Ion path length:
• Linear mode—2.0 meter
• Reflector mode—3.0 meter
• Timed ion selection
• m/z range in excess of 300 kDa
• Sensitivity to less than 5 femtomoles with dried dropletapplication
• Variable two-stage ion source
• Automated single-plate sample-loading system; sampleplates of various formats available
• Ion focusing lens technology for increased sensitivity(serial number 4154 and later)
• Video camera and monitor for sample viewing
• Low mass gate matrix suppression
• Intuitive Microsoft ® Windows NT®-based software
• Collision-induced dissociation (CID) option
• Second laser option
1-6 Applied Biosystems

MALDI-TOF MS Technology Overview
1
1.3 MALDI-TOF MSTechnology OverviewMassspectrometry
Mass spectrometry measures the mass of molecules bymeasuring the mass-to-charge ratio (m/z). Mass is amolecular attribute that can help identify or confirm the identityof a molecule.
Molecular weight measurements by mass spectrometry arebased upon the production, separation, and detection ofmolecular ions. A typical mass spectrometer includes:
• Ion source—Ionizes sample and generates gas phaseions
• Analyzer—Separates ions according to individualmass-to-charge ratios
• Detector—Detects and amplifies ions
• Data system—Converts detection of ions into a readableor graphic display
Advantages of mass spectrometry technology include:
• Can directly measure an absolute physical constant
• Provides highly sensitive detection
• Can analyze mixtures and different classes ofbiopolymers, including peptides, oligonucleotides, andoligosaccharides
MALDI-TOF massspectrometry
The Voyager Biospectrometry Workstations are MALDI-TOFmass spectrometry systems:
• MALDI—Matrix-Assisted Laser Desorption Ionizationsample ionization mechanism
• TOF—Time-of-Flight analysis and detection mechanism
Voyager™ Biospectrometry™ Workstation User’s Guide 1-7

Chapter 1 Introducing the Voyager™ Biospectrometry™ Workstations
1
Matrix-AssistedLaser DesorptionIonization (MALDI)
In Matrix-Assisted Laser Desorption Ionization (MALDI),sample is embedded in a low molecular weight,UV-absorbing matrix that enhances intact desorption andionization of the sample.
The matrix is present in vast excess of sample, andtherefore isolates individual sample molecules.
Figure 1-4 illustrates the ionization of sample.
Figure 1-4 Matrix-Assisted Laser DesorptionIonization
Time-of-Flight(TOF)
Time-of-flight mass spectrometry works on the principle that ifions are accelerated with the same potential from a fixed pointand at a fixed initial time and are allowed to drift, the ions willseparate according to their mass-to-charge ratios. Lighter ionsdrift more quickly to the detector. Heavier ions drift moreslowly (Figure 1-5).
Ions generated by MALDI exhibit a broad energy spread afteracceleration in a stationary electric field. By forming ions in afield-free region, and then applying a high voltage pulse after apredetermined time delay to accelerate the ions, this energyspread can be minimized. See Section 1.4, Voyager-DE™(Delayed Extraction®) Technology, for more information.
Matrix Sample
LaserEnergy transfer
Ionization
+ ++
+from matrix tosample
1-8 Applied Biosystems

MALDI-TOF MS Technology Overview
1
For acquiring TOF spectra, time measurement depends onextraction mode:• Delayed Extraction mode—Measurement of the ionsignal starts when the extraction pulse is applied. Thetime at which the extraction pulse is applied isuser-settable. See Section 1.4, Voyager-DE™ (DelayedExtraction®) Technology for more information.
• Continuous Extraction mode—The extraction field iscontinuously applied. Measurement of the ion signalstarts when the laser pulses.
Figure 1-5 Time of Flight Analysis
The time required for ions to reach the detector at the oppositeend of the flight tube (drift time) is measured. The number ofions reaching the detector at any given time is also measured,and is referred to as ion intensity (abundance) or signalintensity.
+ ++
+
Heavierions
Lighterions
Flight PathTime
Intensity+ ++
+ ++
++
+ +++
Lighterions
Heavierions
Voyager™ Biospectrometry™ Workstation User’s Guide 1-9
Chapter 1 Introducing the Voyager™ Biospectrometry™ Workstations
1
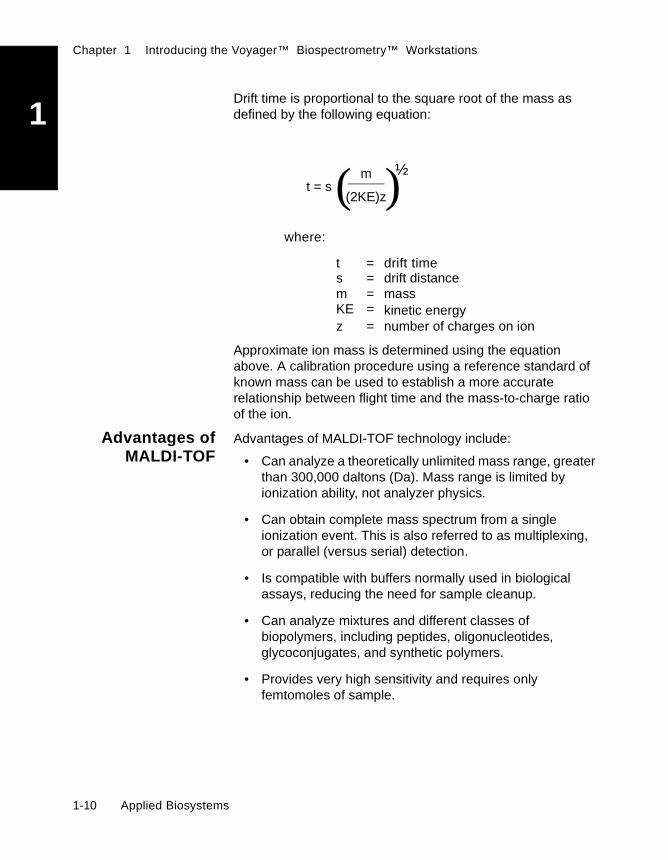
Drift time is proportional to the square root of the mass asdefined by the following equation:Approximate ion mass is determined using the equationabove. A calibration procedure using a reference standard ofknown mass can be used to establish a more accuraterelationship between flight time and the mass-to-charge ratioof the ion.
Advantages ofMALDI-TOF
Advantages of MALDI-TOF technology include:
• Can analyze a theoretically unlimited mass range, greaterthan 300,000 daltons (Da). Mass range is limited byionization ability, not analyzer physics.
• Can obtain complete mass spectrum from a singleionization event. This is also referred to as multiplexing,or parallel (versus serial) detection.
• Is compatible with buffers normally used in biologicalassays, reducing the need for sample cleanup.
• Can analyze mixtures and different classes ofbiopolymers, including peptides, oligonucleotides,glycoconjugates, and synthetic polymers.
• Provides very high sensitivity and requires onlyfemtomoles of sample.
t = sm
(2KE)z( )½
where:
t drift time=s = drift distancem = massKE = kinetic energyz = number of charges on ion
1-10 Applied Biosystems
Voyager-DE™ (Delayed Extraction®) Technology
1
1.4 Voyager-DE™(Delayed Extraction®
) Technology
In this section This section describes:
• Limitations of MALDI technology• Delayed Extraction• Delayed Extraction versus Continuous Extraction• Benefits of Delayed Extraction• Velocity focusing
Limitations ofMALDI
technology
In traditional MALDI, ions exhibit a broad kinetic energydistribution which is largely due to the initial velocity impartedto ions during the desorption/ionization process. This initialvelocity of desorbed analyte ions is nearly independent ofmass of the analyte and the initial kinetic energy isproportional to the mass. In addition, when desorption occursin a strong electrical field, energy is lost by collisions with theneutral plume, and further mass-dependent energy dispersionresults.
According to the theory of “time-lag energy focusing” asoriginally developed by Wiley and McLaren1, the dependenceof ion flight time on initial velocity can be corrected, to the firstorder, by delaying the extraction of ions from the source. Ifhigher order terms are insignificant, then the mass resolutionshould be determined by the ratio of the total flight time to theuncertainty in the time measurement. The observed massresolution should increase in proportion to the effective lengthof the ion flight path.
1. W. C. Wiley and I. H. McLaren, Rev. Sci. Instrum., 1953, 26, 1150–1157,W. C. Wiley, U.S. Patent 2,685,035.
Voyager™ Biospectrometry™ Workstation User’s Guide 1-11

Chapter 1 Introducing the Voyager™ Biospectrometry™ Workstations
1
DelayedExtractionWith Voyager-DE™ (Delayed Extraction®) technology, ionsform in a field-free region, and then are extracted by applyinga high voltage pulse to the accelerating voltage after apredetermined time delay.
Figure 1-6 compares Delayed and Continuous Extraction.
Figure 1-6 Delayed Versus Continuous Extraction
DelayedExtraction versus
ContinuousExtraction
The Voyager-DE systems can be operated in DelayedExtraction (DE) or Continuous Extraction mode.
NOTE: Due to the superior results obtained with DelayedExtraction (DE) mode, use Continuous Extraction mode fordiagnostic purposes only. See Appendix H, ContinuousExtraction Mode, for more information on optimizingmethods and obtaining good spectra.
In Delayed Extraction mode:
• Potential gradient does not exist when sample is ionized(sample plate and grid are at similar potentials)
• Accelerating voltage is pulsed after a user-set time delay(potential gradient is applied) and ions are accelerated
Acceleratingvoltage
Gridvoltage
laser pulse
time
U
Continuous Extraction
Acceleratingvoltage
Gridvoltage
laser pulse
time
U
timedelay
Delayed Extraction
PB100772
1-12 Applied Biosystems

Voyager-DE™ (Delayed Extraction®) Technology
1
In Continuous Extraction mode:• Accelerating voltage is continuously applied, and thepotential gradient exists when sample is ionized
• Ions are immediately accelerated
Figure 1-7 and Figure 1-8 show the improved resolutionobtained in Delayed Extraction mode.
Figure 1-7 Comparison of Angiotensin Resolution with Delayed and ContinuousExtraction (Linear Mode)
Figure 1-8 Comparison of ACTH (Clip 18–39) Resolution with Delayed andContinuous Extraction (Reflector Mode)
Continuous ExtractionDelayed Extraction
Peaks areno longerresolved
Delayed Extraction Continuous Extraction
Peaks areno longerresolved
Voyager™ Biospectrometry™ Workstation User’s Guide 1-13

Chapter 1 Introducing the Voyager™ Biospectrometry™ Workstations
1
Benefits ofDelayedExtraction
Delayed Extraction of ions overcomes many of the adverseeffects of Continuous Extraction:
Benefits ofDelayed Extraction
Adverse Effects ofContinuous Extraction
Velocity focusing of ions is controlledby variable-voltage grid in the ionsource and the delay time applied toacceleration. See “Velocity focusing”on page 1-15.
Resolution and mass accuracy areimproved.
Initial velocity distribution of ions.
Minimal energy loss from collision ofions. Ion acceleration is delayed, theion/neutral plume becomes less dense,and ion collision is minimized.
Substantial energy loss from collision ofions. Ions are accelerated immediatelyafter sample is ionized and collide in thedense ion/neutral plume.
Fragmentation is greatly reduced byacceleration delay.
Background noise is reduced, and theeffect of laser intensity on performance isminimized.
Background noise from fragmentation inthe source (prompt fragmentation) relatedto ion collision.
Less analyte/matrix-dependentperformance because initial velocitydistribution and energy loss iscorrected or minimized.
Analyte/matrix-dependent performance,because initial velocity distribution andenergy loss conditions are specificallyrelated to the sample and matrix used.
1-14 Applied Biosystems
Voyager-DE™ (Delayed Extraction®) Technology
1
Velocity focusing Delayed Extraction technology facilitates tuning modes, whenthe time-of-flight of an ion is independent of the initial velocity.
After ions are released from the sample surface, their positionin the ion source is correlated with their initial velocity.
When the extraction voltage pulse is applied, initially slowerions acquire slightly higher energy from the accelerating fieldthan initially faster ions. By careful tuning of variable-voltagegrid in the source and the delay time applied toacceleration, slow and fast ions of the same mass reach thedetector plane at the same time. This is referred to as “velocityfocusing”.
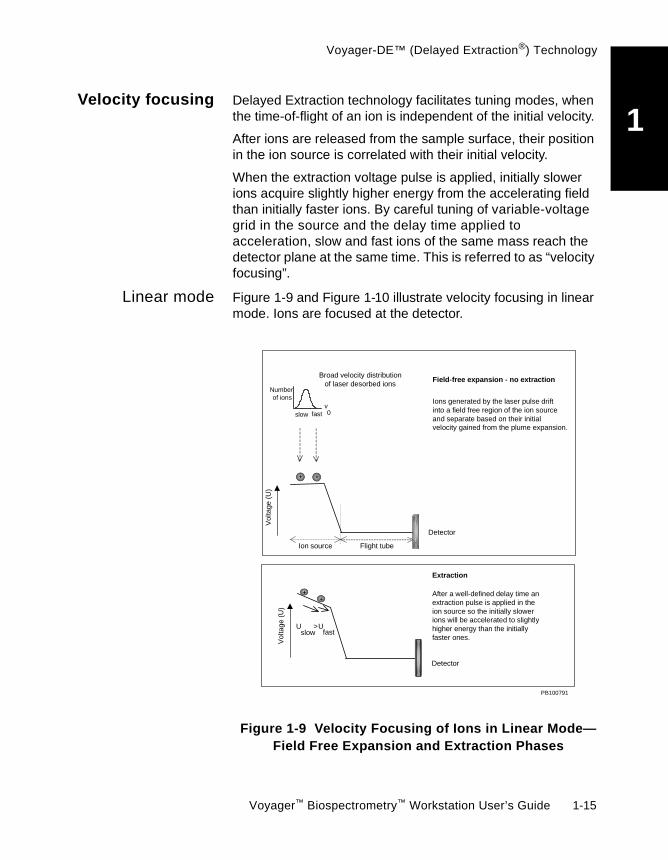
Linear mode Figure 1-9 and Figure 1-10 illustrate velocity focusing in linearmode. Ions are focused at the detector.
Figure 1-9 Velocity Focusing of Ions in Linear Mode—Field Free Expansion and Extraction Phases
Detector
Broad velocity distributionof laser desorbed ions
v0slow fast
Numberof ions
+ +
Vol
tage
(U)
Ion source Flight tube
Field-free expansion - no extraction
Ions generated by the laser pulse driftinto a field free region of the ion sourceand separate based on their initialvelocity gained from the plume expansion.
Detector
Uslow
>Ufast
Vol
tage
(U)
++
Extraction
After a well-defined delay time anextraction pulse is applied in theion source so the initially slowerions will be accelerated to slightlyhigher energy than the initiallyfaster ones.
PB100791
Voyager™ Biospectrometry™ Workstation User’s Guide 1-15

Chapter 1 Introducing the Voyager™ Biospectrometry™ Workstations
1
Figure 1-10 Velocity Focusing of Ions inLinear Mode—Detection Phase
Reflector mode In Reflector mode, ions are velocity-focused at the exit of theion source instead of at the detector. By tuning thevariable-voltage grid and the acceleration delay time, you canalter the point at which ions are focused, and enhanceresolution. This initial focus is refocused by the reflector, whichyou can tune for second-order velocity focusing.
Detector
Vol
tage
(U)
+
+
Detection
Extraction delay and themagnitude of the extraction pulsecan set that ions of a given mass-to-charge ratio with different initialvelocity reach the detector exactlyat the same time.
slow fastt = t
PB100773
1-16 Applied Biosystems
Parts of the Voyager-DE and Voyager-DE PRO Systems
1
1.5 Parts of the Voyager-DE andVoyager-DE PRO SystemsThis section describes:
• System components• Mass spectrometer• Vacuum system• Computer components
1.5.1 System Components
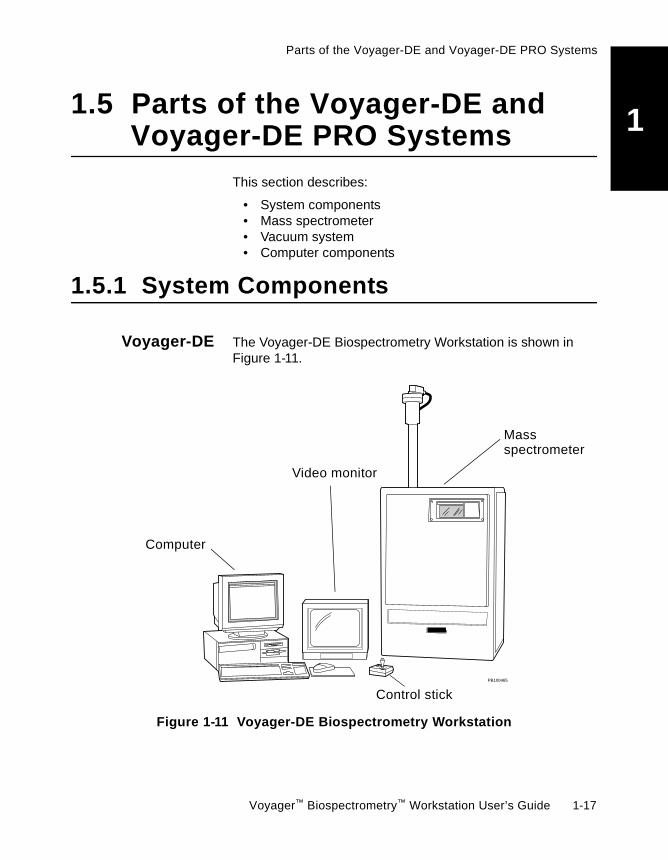
Voyager-DE The Voyager-DE Biospectrometry Workstation is shown inFigure 1-11.
Figure 1-11 Voyager-DE Biospectrometry Workstation
PB100465
Computer
Video monitor
Control stick
Massspectrometer
Voyager™ Biospectrometry™ Workstation User’s Guide 1-17

Chapter 1 Introducing the Voyager™ Biospectrometry™ Workstations
1
Voyager-DE PRO The Voyager-DE PRO Biospectrometry Workstation is shownin Figure 1-12.
Figure 1-12 Voyager-DE PRO Biospectrometry Workstation
PB100466
Computer
Video monitor
Massspectrometer
Control stick
1-18 Applied Biosystems

Parts of the Voyager-DE and Voyager-DE PRO Systems
1
Parts of the Voyager-DE and Voyager-DE PRO systemsinclude:• Mass spectrometer—A time-of-flight massspectrometer, described in Section 1.5.2, MassSpectrometer. The high-vacuum system of the massspectrometer is described in Section 1.5.3, VacuumSystem.
• Computer/Data System—A computer that operates theVoyager control software and the Voyager processingsoftware. You control the mass spectrometer using thecomputer.
• Digitizer (not shown)—An analog-to-digital converterthat allows the signal from the mass spectrometer to betransferred to the computer.
The standard digitizers provided are:
• Voyager-DE—500 MHz• Voyager-DE RP—2 GHz
Optional 2 to 4 GHz oscilloscopes are also available.
• Video monitor—A monitor that displays a real-time videoimage of the sample spot for examination duringacquisition.
• Control stick—A device that controls position of thesample plate in the mass spectrometer. Allows you tostart and stop acquisition and transfer data to theprocessing software.
NOTE: You can also control sample position, start andstop acquisition, and transfer data using the VoyagerInstrument Control Panel software.
Voyager™ Biospectrometry™ Workstation User’s Guide 1-19
Chapter 1 Introducing the Voyager™ Biospectrometry™ Workstations
1
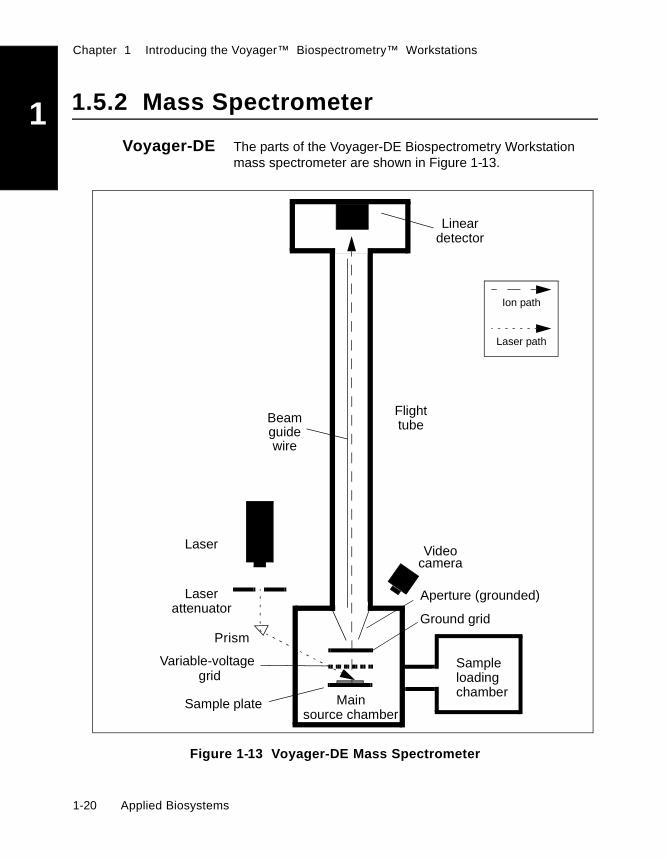
1.5.2 Mass SpectrometerVoyager-DE The parts of the Voyager-DE Biospectrometry Workstationmass spectrometer are shown in Figure 1-13.
Figure 1-13 Voyager-DE Mass Spectrometer
Mainsource chamber
VideoLaser
Laserattenuator
Flighttube
Lineardetector
camera
Beamguidewire
Sample plate
Aperture (grounded)
Sampleloadingchamber
Ion path
Laser path
Prism
Variable-voltage
Ground grid
grid
1-20 Applied Biosystems

Parts of the Voyager-DE and Voyager-DE PRO Systems
1
Voyager-DE PRO The parts of the Voyager-DE PRO BiospectrometryWorkstation mass spectrometer are shown in Figure 1-14.
Figure 1-14 Voyager-DE PRO Mass Spectrometer (Single-Stage Reflector)
Mainsource
Variable-voltage
Video
Laser
Laserattenuator
Flighttube
Lineardetector
Reflectordetector
Reflector
camera
Beamguidewire
(electrostaticmirror)
Ion path in reflector mode
Sample
Aperture (grounded)Sampleloadingchamber
chamber
Timed Ion
Laser path
Prism
Groundgrid
Collision cell (optional)
plate
grid
Selector
Voyager™ Biospectrometry™ Workstation User’s Guide 1-21

Chapter 1 Introducing the Voyager™ Biospectrometry™ Workstations
1
Parts of the massspectrometerThe Voyager-DE and Voyager-DE PRO mass spectrometersinclude:
• Laser, attenuator, and prism—A nitrogen laser thatoperates at 337 nm and ionizes sample. It produces3-nanosecond-duration pulses. Laser rate can be set toDefault (3 Hz) or Optimized (see page 5-26). Maximumpossible rate is 20 Hz; actual rate depends on thedigitizer installed and the digitizer Bin Size setting.
NOTE: Optimized laser rate is available only onsystems with the following serial numbers:Voyager-DE—1171 and later; Voyager-DE PRO—6131and later.
The laser attenuator varies the intensity of the laser beamreaching the sample.
The prism deflects the laser beam into the ion source.
• Ion Source—A high voltage region used to accelerateions. Includes:
• Sample plate and sample stage—An areasupplied with voltage (0 to 25,000 V) foracceleration of ions into the flight tube.
• Variable-voltage grid—A grid supplied withadditional voltage to fine-tune ion acceleration.
• Ground grid—Ground surface for formation ofpotential gradient.
• Grounded aperture—Entrance to flight tube.
For more information on the ion source and voltages, seeSection 5.4.4.2, Setting Accelerating Voltage, andSection 5.4.3.5, Optimizing Grid Voltage%.
• Video camera—A camera that displays a real-timesample image (100 times magnification) on the videomonitor.
1-22 Applied Biosystems
Parts of the Voyager-DE and Voyager-DE PRO Systems
1
• Vacuum system—A pumping system and sealedenclosure that creates and maintains a high-vacuumenvironment for unobstructed ion drift. Refer toSection 1.5.3, Vacuum System, for more information.
• Flight tube and beam guide wire—A field-free region(no additional accelerating forces are present) in whichions drift at a velocity inversely proportional to the squareroot of their masses. The voltage applied to the beamguide wire overcomes the dispersion effect from the ionsource and refocuses ions on the detector.
• Linear detector—A device that detects ions that traveldown the flight tube. The linear detector measures ionabundance over time and sends a signal to the digitizerfor conversion.
On the Voyager-DE PRO system, the linear detector isused in Linear mode only. It is not used in Reflector orPSD mode.
Linear detectors are hybrid high-current detectorsconsisting of a single microchannel plate, a fastscintillator, and a photomultiplier. These detectors havesuperior tolerance for high ion currents.
NOTE: High current detectors are standard onVoyager-DE systems with serial number 1128 andlater, and Voyager-DE PRO systems with serialnumber 6007 and later.
Voyager™ Biospectrometry™ Workstation User’s Guide 1-23
Chapter 1 Introducing the Voyager™ Biospectrometry™ Workstations
1
Additionalparts of theVoyager-DE PRO
Parts unique to the Voyager-DE PRO mass spectrometer:
• Collision Cell—Provided with CID (Collision-InducedDissociation) option for enhanced fragmentation in PSDanalysis.
• Reflector—A single-stage gridded mirror that focusesenergy. In reflector mode, a uniform electric field isapplied to the mirror to reflect ions. Ion reflection:
• Filters out neutral molecules
• Corrects time dispersion due to initial kineticenergy distribution
• Provides greater mass accuracy and resolution
The single-stage design provides high mass resolutionacross a wide mass range and highly accurate massmeasurements. Accurate calibration formulas for thesingle-stage reflector allow you to vary instrumentconditions without degrading mass accuracy. Also, easycalibration of PSD data is facilitated by single-stagereflectors. For more information, see Chapter 8, PSDAnalysis.
• Reflector detector—The reflector detector measuresions reflected by the mirror. The reflector detector sendsa signal to the digitizer for conversion.
Two multichannel plate reflector detectors optimized forresponse time are included.
1-24 Applied Biosystems

Parts of the Voyager-DE and Voyager-DE PRO Systems
1
• Timed Ion Selector—A device that allows only ions of aselected mass of interest to pass to the detector.
The Timed Ion Selector (TIS) device is aBradbury-Nielson gate positioned approximately 676 mmfrom the ion source. This prevents ions deflected by thegate from entering the reflector and reduces backgroundnoise in the detector in PSD experiments.
When the Timed Ion Selector is turned on, voltage isapplied to the Timed Ion Selector to deflect ions. At thetime that corresponds to the ion of interest, voltage isturned off, and the ion of interest passes to the detector.After the ion passes through the Timed Ion Selector,voltage is turned on again.
1.5.3 Vacuum System
The Voyager-DE and Voyager-DE PRO BiospectrometryWorkstations provide a high-vacuum environment fortime-of-flight analysis. The high vacuum environment:
• Allows unobstructed ion drift
• Provides conditions needed to maintain the high potentialdifference between the ion source and ground
Voyager™ Biospectrometry™ Workstation User’s Guide 1-25
Chapter 1 Introducing the Voyager™ Biospectrometry™ Workstations
1
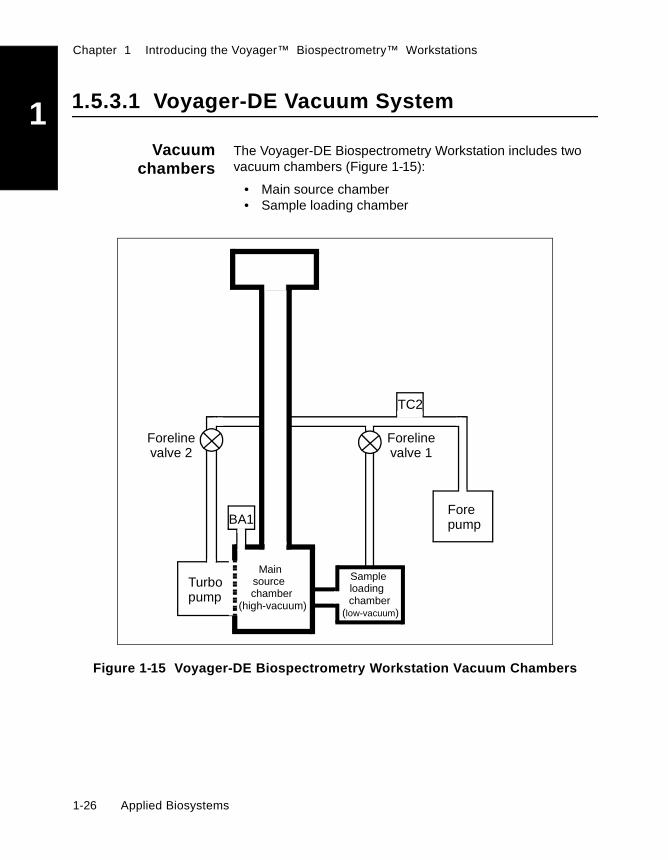
1.5.3.1 Voyager-DE Vacuum SystemVacuumchambers
The Voyager-DE Biospectrometry Workstation includes twovacuum chambers (Figure 1-15):
• Main source chamber• Sample loading chamber
Figure 1-15 Voyager-DE Biospectrometry Workstation Vacuum Chambers
Mainsource
(high-vacuum)
TC2
Turbo
Forepump
pump
BA1
chamber
Sampleloading
(low-vacuum)chamber
Forelinevalve 2
Forelinevalve 1
1-26 Applied Biosystems

Parts of the Voyager-DE and Voyager-DE PRO Systems
1
Vacuum pumps Two vacuum pumps create the vacuum environment:• Fore pump—Creates a vacuum in the sample loadingchamber, creates a lower-than-atmospheric-pressurecondition before the turbo pump starts, and providesbacking pressure to the turbo pump.
• Turbo pump—Creates a high vacuum condition in themain source chamber.
Vacuum is maintained in the chambers by valves that isolatethe chambers.
Vacuum gauges The Voyager-DE Biospectrometry Workstation includes twovacuum gauges:
• BA1 (Bayard-Alpert Gauge)—Monitors pressure in themain source chamber.
• TC2—Monitors pressure in the sample chamber.
Readings from the vacuum gauges are displayed in theSystem Status Control page in the Instrument Control Panel.See Section 2.11, Checking System Status and Pressures.
Voyager™ Biospectrometry™ Workstation User’s Guide 1-27

Chapter 1 Introducing the Voyager™ Biospectrometry™ Workstations
1
1.5.3.2 Voyager-DE PRO Vacuum SystemVacuumchambers
The Voyager-DE PRO Biospectrometry Workstation includesthree vacuum chambers (Figure 1-16):
• Main source chamber• Sample loading chamber• Mirror chamber
Figure 1-16 Voyager-DE PRO Biospectrometry Workstation Vacuum Chambers
Mirror
(high-vacuum)chamber
Mainsource
(high-vacuum)
Turbo
Forepump
pump 1
BA1
chamber
Sampleloading
(low-vacuum)chamber
Foreline
Turbopump 2
BA2
TC2valve 2
Forelinevalve 1
1-28 Applied Biosystems
Parts of the Voyager-DE and Voyager-DE PRO Systems
1
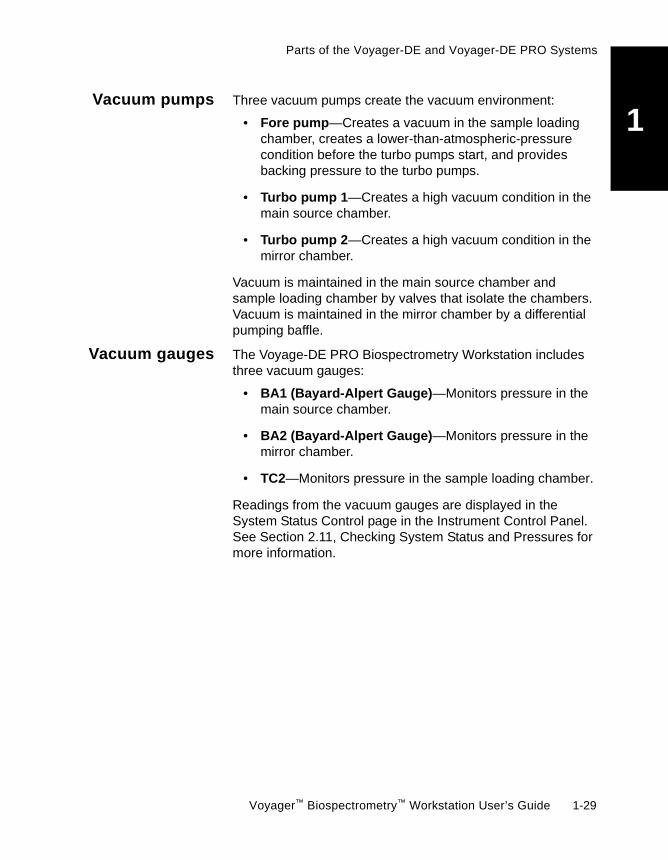
Vacuum pumps Three vacuum pumps create the vacuum environment:• Fore pump—Creates a vacuum in the sample loadingchamber, creates a lower-than-atmospheric-pressurecondition before the turbo pumps start, and providesbacking pressure to the turbo pumps.
• Turbo pump 1—Creates a high vacuum condition in themain source chamber.
• Turbo pump 2—Creates a high vacuum condition in themirror chamber.
Vacuum is maintained in the main source chamber andsample loading chamber by valves that isolate the chambers.Vacuum is maintained in the mirror chamber by a differentialpumping baffle.
Vacuum gauges The Voyage-DE PRO Biospectrometry Workstation includesthree vacuum gauges:
• BA1 (Bayard-Alpert Gauge)—Monitors pressure in themain source chamber.
• BA2 (Bayard-Alpert Gauge)—Monitors pressure in themirror chamber.
• TC2—Monitors pressure in the sample loading chamber.
Readings from the vacuum gauges are displayed in theSystem Status Control page in the Instrument Control Panel.See Section 2.11, Checking System Status and Pressures formore information.
Voyager™ Biospectrometry™ Workstation User’s Guide 1-29
Chapter 1 Introducing the Voyager™ Biospectrometry™ Workstations
1
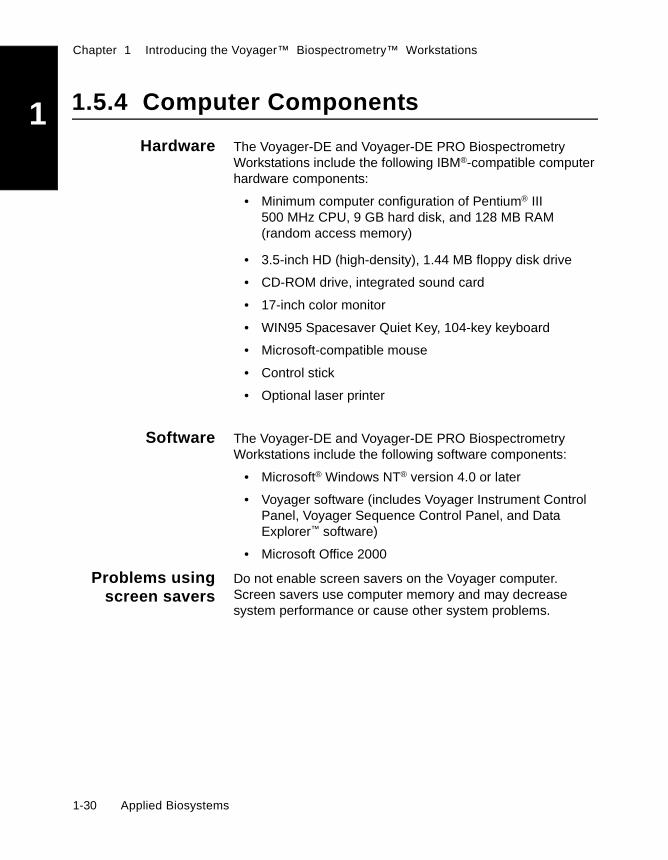
1.5.4 Computer ComponentsHardware The Voyager-DE and Voyager-DE PRO BiospectrometryWorkstations include the following IBM®-compatible computerhardware components:
• Minimum computer configuration of Pentium® III500 MHz CPU, 9 GB hard disk, and 128 MB RAM(random access memory)
• 3.5-inch HD (high-density), 1.44 MB floppy disk drive
• CD-ROM drive, integrated sound card
• 17-inch color monitor
• WIN95 Spacesaver Quiet Key, 104-key keyboard
• Microsoft-compatible mouse
• Control stick
• Optional laser printer
Software The Voyager-DE and Voyager-DE PRO BiospectrometryWorkstations include the following software components:
• Microsoft® Windows NT® version 4.0 or later
• Voyager software (includes Voyager Instrument ControlPanel, Voyager Sequence Control Panel, and DataExplorer™ software)
• Microsoft Office 2000
Problems usingscreen savers
Do not enable screen savers on the Voyager computer.Screen savers use computer memory and may decreasesystem performance or cause other system problems.
1-30 Applied Biosystems
Parts of the Voyager-DE STR System
1
1.6 Parts of theVoyager-DE STR SystemThis section describes:
• System components• Mass spectrometer• Vacuum system• Front panel indicators• Computer components
1.6.1 System Components
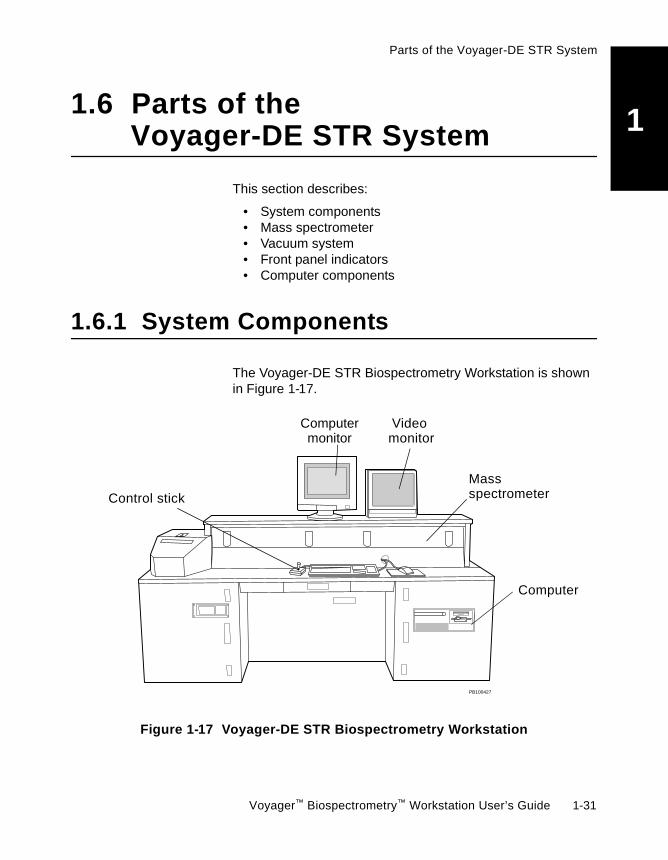
The Voyager-DE STR Biospectrometry Workstation is shownin Figure 1-17.
Figure 1-17 Voyager-DE STR Biospectrometry Workstation
PB100427
Computer
Video
Control stick
Massspectrometer
Computermonitor monitor
Voyager™ Biospectrometry™ Workstation User’s Guide 1-31

Chapter 1 Introducing the Voyager™ Biospectrometry™ Workstations
1
Parts of the Voyager-DE STR system include:• Mass spectrometer—A time-of-flight massspectrometer, described in Section 1.6.2, MassSpectrometer. The high-vacuum system of the massspectrometer is described in Section 1.6.3, VacuumSystem.
• Computer/Data System—A computer that operates theVoyager control software and the Voyager processingsoftware. You control the mass spectrometer using thecomputer.
• Digitizer (not shown)—An analog-to-digital converterthat allows the signal from the mass spectrometer to betransferred to the computer.
The standard digitizer provided is a 4 GHz digitizer.
• Video monitor—A monitor that displays a real-time videoimage of the sample spot for examination duringacquisition.
• Control stick—A peripheral device that controls positionof the sample plate in the mass spectrometer. Allows youto start and stop acquisition and transfer data to theprocessing software.
NOTE: You can also control sample position, start andstop acquisition, and transfer data using the VoyagerInstrument Control Panel software.
1-32 Applied Biosystems
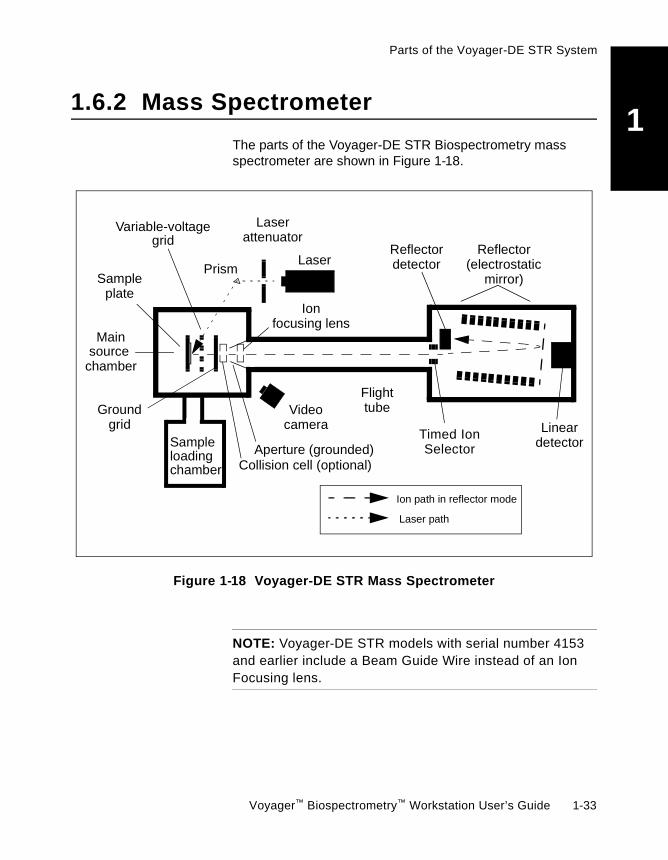
Parts of the Voyager-DE STR System
1
1.6.2 Mass SpectrometerThe parts of the Voyager-DE STR Biospectrometry massspectrometer are shown in Figure 1-18.
Figure 1-18 Voyager-DE STR Mass Spectrometer
NOTE: Voyager-DE STR models with serial number 4153and earlier include a Beam Guide Wire instead of an IonFocusing lens.
Mainsource
Variable-voltage
Video
Laser
Laserattenuator
Flighttube
Lineardetector
Reflectordetector
Reflector
camera
Ionfocusing lens
(electrostaticmirror)
Ion path in reflector mode
Sample
Aperture (grounded)Sampleloadingchamber
chamber
Timed Ion
Laser path
Prism
Groundgrid
Collision cell (optional)
plate
grid
Selector
Voyager™ Biospectrometry™ Workstation User’s Guide 1-33

Chapter 1 Introducing the Voyager™ Biospectrometry™ Workstations
1
Parts of the massspectrometerThe Voyager-DE STR mass spectrometer includes:
• Laser, attenuator, and prism—A nitrogen laser thatoperates at 337 nm and ionizes sample. It produces3-nanosecond-duration pulses. Laser rate can be set toDefault (3 Hz) or Optimized (see page 5-26). Maximumpossible rate is 20 Hz; actual rate depends on thedigitizer installed and the digitizer Bin Size setting.
NOTE: Optimized laser rate is available only onVoyager-DE STR systems with serial number 4161 andlater.
The laser attenuator varies the intensity of the laser beamreaching the sample.
The prism deflects the laser beam into the ion source.
• Ion Source—A high voltage region used to accelerateions. Includes:
• Sample plate and sample stage—An areasupplied with voltage (0 to 25,000 V) foracceleration of ions into the flight tube.
• Variable-voltage grid—A grid supplied withadditional voltage to fine-tune ion acceleration.
• Ground grid—Ground surface for formation ofpotential gradient.
• Collision cell—Provided with CID(Collision-Induced Dissociation) option forenhanced fragmentation in PSD analysis.
• Grounded aperture—Entrance to flight tube.
For more information on the ion source and voltages, seeSection 5.4.4.2, Setting Accelerating Voltage, andSection 5.4.3.5, Optimizing Grid Voltage%.
1-34 Applied Biosystems

Parts of the Voyager-DE STR System
1
• Video camera—A camera that displays a real-timesample image (100 times magnification) on the videomonitor.
• Vacuum system—A pumping system and a sealedenclosure that creates and maintains a high-vacuumenvironment for unobstructed ion drift. For moreinformation, see Section 1.6.3, Vacuum System.
• Flight tube and ion focusing lens—A field-free region(no additional accelerating forces are present) in whichions drift at a velocity inversely proportional to the squareroot of their masses. The fixed voltage (50 percent of theAccelerating Voltage) applied to the ion focusing lensrefocuses ions on the detector.
NOTE: Voyager-DE STR models with serial number4153 and earlier include a beam guide wire instead ofan ion focusing lens.
• Linear detector—A device that detects ions that traveldown the flight tube. The linear detector measures ionabundance over time and sends a signal to the digitizerfor conversion.
The linear detector is used in Linear mode only. It is notused in Reflector or PSD mode.
Linear detectors are hybrid high-current detectorsconsisting of a single microchannel plate, a fastscintillator, and a photomultiplier. These detectors havesuperior tolerance for high ion currents.
NOTE: High current detectors are standard onVoyager-DE STR systems with serial numbers 4112,4113, and 4116 and later.
Voyager™ Biospectrometry™ Workstation User’s Guide 1-35

Chapter 1 Introducing the Voyager™ Biospectrometry™ Workstations
1
• Reflector—A single-stage, gridded mirror that focusesenergy. In reflector mode, a uniform electric field isapplied to the mirror to reflect ions. Ion reflection:
• Filters out neutral molecules
• Corrects time dispersion due to initial kineticenergy distribution
• Provides greater mass accuracy and resolution
The single-stage design provides high mass resolutionacross a wide range and highly accurate massmeasurements. Accurate calibration formulas for thesingle-stage reflector allow the user to vary instrumentconditions without degrading mass accuracy. Also, easycalibration of PSD data is facilitated by single-stagereflectors. For more information, see Chapter 8, PSDAnalysis.
• Reflector detector—The reflector detector measuresions reflected by the mirror. The reflector detector sendsa signal to the digitizer for conversion.
Two multichannel plate reflector detectors optimized forresponse time are included.
• Timed Ion Selector—A device that allows only ions of aselected mass of interest to pass to the detector.
The Timed Ion Selector (TIS) device is aBradbury-Nielson gate positioned approximately 676 mmfrom the ion source. This prevents ions deflected by thegate from entering the reflector and reduces backgroundnoise in the detector in PSD experiments.
When the Timed Ion Selector is turned on, voltage isapplied to the Time Ion Selector to deflect ions. At thetime that corresponds to the ion of interest, voltage isturned off, and the ion of interest passes to the detector.After the ion passes through the Timed Ion Selector,voltage is turned on again.
1-36 Applied Biosystems

Parts of the Voyager-DE STR System
1
1.6.3 Vacuum SystemOverview The Voyager-DE STR Biospectrometry Workstation provides ahigh-vacuum environment for time-of-flight analysis. The highvacuum environment:
• Allows unobstructed ion drift
• Provides conditions needed to maintain the high potentialdifference between the ion source and ground
Vacuumchambers
The Voyager-DE STR Biospectrometry Workstation includesthree vacuum chambers (Figure 1-19):
• Main source chamber• Sample loading chamber• Mirror chamber
Vacuum pumps Three vacuum pumps create the vacuum environment:
• Fore pump—Creates a vacuum in the sample loadingchamber, creates a lower-than-atmospheric-pressurecondition before the turbo pumps start, and providesbacking pressure to the turbo pumps.
• Turbo pump 1—Creates a high vacuum condition in themain source chamber.
• Turbo pump 2—Creates a high vacuum condition in themirror chamber.
Vacuum is maintained in the main source chamber andsample loading chamber by valves that isolate the chambers.Vacuum is maintained in the mirror chamber by a differentialpumping baffle.
Voyager™ Biospectrometry™ Workstation User’s Guide 1-37
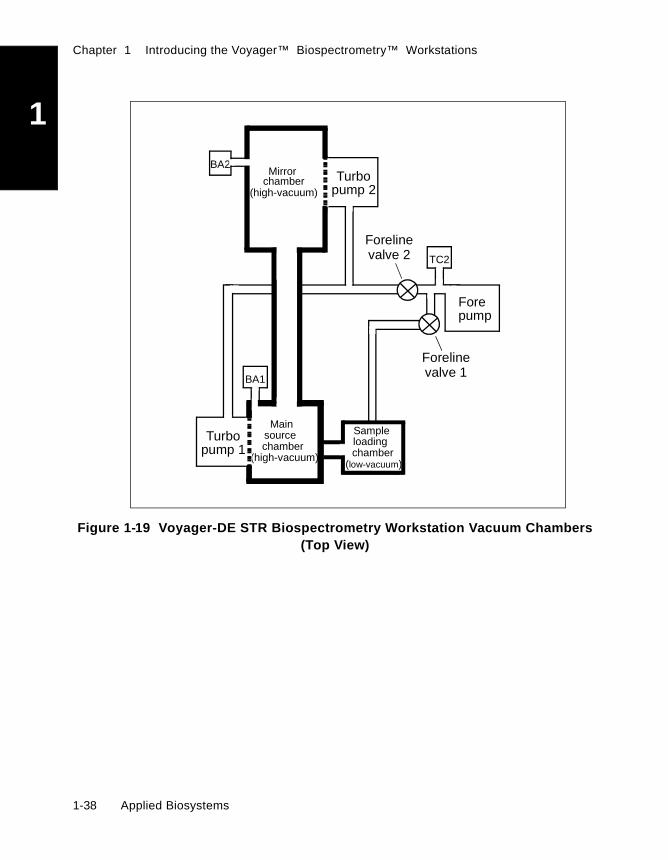
Chapter 1 Introducing the Voyager™ Biospectrometry™ Workstations
1
Figure 1-19 Voyager-DE STR Biospectrometry Workstation Vacuum Chambers(Top View)
Mirror
(high-vacuum)chamber
Mainsource
(high-vacuum)
Turbo
Forepump
pump 1
BA1
chamber
Sampleloading
(low-vacuum)chamber
Turbopump 2
BA2
TC2
Forelinevalve 2
Forelinevalve 1
1-38 Applied Biosystems
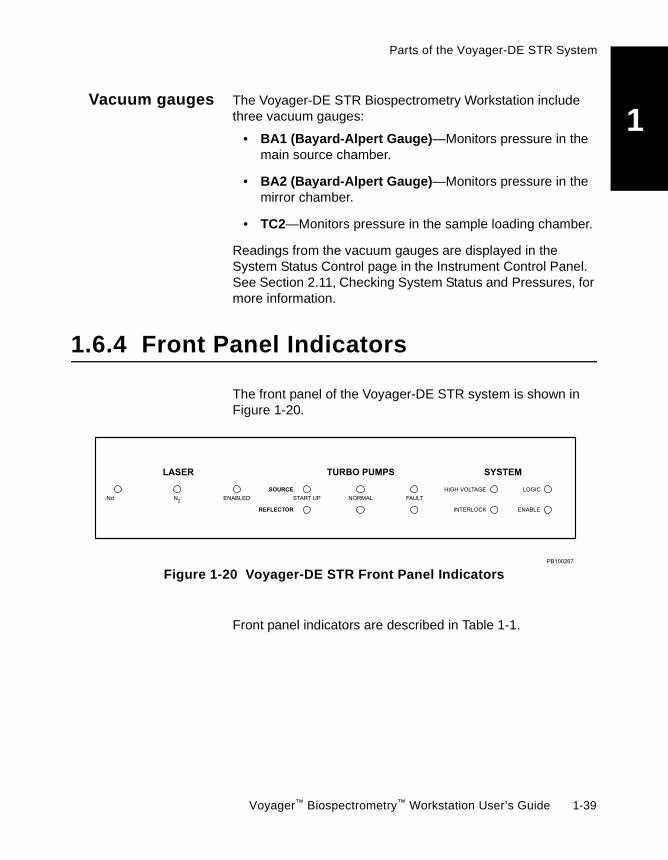
Parts of the Voyager-DE STR System
1
Vacuum gauges The Voyager-DE STR Biospectrometry Workstation includethree vacuum gauges:
• BA1 (Bayard-Alpert Gauge)—Monitors pressure in themain source chamber.
• BA2 (Bayard-Alpert Gauge)—Monitors pressure in themirror chamber.
• TC2—Monitors pressure in the sample loading chamber.
Readings from the vacuum gauges are displayed in theSystem Status Control page in the Instrument Control Panel.See Section 2.11, Checking System Status and Pressures, formore information.
1.6.4 Front Panel Indicators
The front panel of the Voyager-DE STR system is shown inFigure 1-20.
Figure 1-20 Voyager-DE STR Front Panel Indicators
Front panel indicators are described in Table 1-1.
Voyager™ Biospectrometry™ Workstation User’s Guide 1-39

Chapter 1 Introducing the Voyager™ Biospectrometry™ Workstations
1
Table 1-1 Front Panel IndicatorsIndicator Indication When Lit
Laser
Laser N2 (Red) Laser power is on.
Enabled (Red) Laser is firing.
Turbo Pumps
Startup (Yellow) One or both turbo pumps are initializing.
Normal (Green) Both turbo pumps are operating at normal speed.
Fault (Red) One or both turbo pumps are off. Should not be lit duringnormal operation.
System
High Voltage High voltage is on.
Interlock An interlock error (door open or panel off). Automaticallydisables laser and high voltage.
Logic Internal control board in mass spectrometer has beenpowered up.
Enabled Computer is controlling mass spectrometer.
1-40 Applied Biosystems

Parts of the Voyager-DE STR System
1
1.6.5 Computer ComponentsHardware The Voyager-DE STR Biospectrometry Workstation includesthe following IBM®-compatible computer hardwarecomponents:
• Minimum computer configuration of Pentium® III500 MHz CPU, 9 GB hard disk, and 128 MB RAM(random access memory)
• 3.5-inch HD (high density), 1.44 MB floppy disk drive
• CD-ROM drive, integrated sound card
• 17-inch color monitor
• WIN95 Spacesaver Quiet Key, 104-key keyboard
• Microsoft-compatible mouse
• Control stick
• Optional laser printer
Software The Voyager-DE STR Biospectrometry Workstation includesthe following software components:
• Microsoft® Windows® NT version 4.0 or later
• Voyager software (includes Voyager Instrument ControlPanel, Voyager Sequence Control Panel, and DataExplorer software)
• Microsoft Office 2000
Problems usingscreen savers
Do not enable screen savers on the Voyager computer.Screen savers use computer memory and may decreasesystem performance or cause other system problems.
Voyager™ Biospectrometry™ Workstation User’s Guide 1-41

Chapter 1 Introducing the Voyager™ Biospectrometry™ Workstations
1
1.7 Software OverviewThe Voyager Biospectrometry Workstation software includescontrol software (Voyager Instrument Control Panel, VoyagerSequence Control Panel) and post-processing software (DataExplorer software):
• Voyager Instrument Control Panel—Controls the massspectrometer for calibration and acquisition of singlesamples.
• Voyager Sequence Control Panel—Works inconjunction with the Instrument Control Panel to allowyou to acquire multiple samples using different instrumentsettings (.BIC) files.
• Data Explorer processing software—Allowspost-processing analysis of mass spectral data.
1.7.1 Control Software (Instrumentand Sequence Control Panels)
InstrumentControl Panel
The Voyager Instrument Control Panel allows you to directlycontrol the Voyager mass spectrometer to acquire massspectra one at a time.
The Instrument Control Panel provides the following features:
• Mass calibration, mass resolution calculator, andsignal-to-noise ratio calculator functions.
• Direct control of instrument hardware including highvoltages, load/eject, and acquisition start/stop.
• Real-time viewing and manipulation of mass-calibrated(default or external calibration) and peak-labeled spectraltraces as data is acquired with Acqiris®, LeCroy®, andSignatec digitizers.
1-42 Applied Biosystems

Software Overview
1
• Ability to zoom in on up to four different areas of a trace.• Ability to acquire single samples in Manual or AutomaticControl mode.
• Manual accumulation of mass spectra from multipleacquisitions into a single data file.
The Instrument Control Panel (Figure 1-21) is displayed whenyou start the Voyager Control Panel software.
The Instrument Control software is described in Chapter 4,Voyager Instrument Control Panel Basics.
Figure 1-21 Voyager Instrument Control Panel
Voyager™ Biospectrometry™ Workstation User’s Guide 1-43

Chapter 1 Introducing the Voyager™ Biospectrometry™ Workstations
1
Sequence ControlPanelThe Sequence Control Panel works with the InstrumentControl Panel to allow you to acquire multiple samples usingdifferent instrument settings (.BIC) files.
The Sequence Control Panel (Figure 1-22) is displayed whenyou start the Voyager Sequence Control software, or click atoolbar button in the Instrument Control Panel.
The Sequence Control software and how the Instrument andSequence Control panels interact are described in Chapter 4,Voyager Instrument Control Panel Basics.
Figure 1-22 Sequence Control Panel
Data (.DAT) fileformat
Data (.DAT) file format incorporates all information into asingle file about how a data file is acquired and processed.This format improves data processing and data storageefficiency. Voyager .DAT files can contain one or morespectra.
You can also store parameters in separate files by extractinginformation from a .DAT file as needed for use with other files.For more information, the Data Explorer Software User’sGuide, Section 1.2, File Formats and Types.
1-44 Applied Biosystems

Software Overview
1
1.7.2 Post-Processing Software(Data Explorer™)
The Data Explorer™ software is a powerful software modulethat allows you to graphically and interactively manipulatespectral and chromatogram (multispectrum) data.
Using the Data Explorer software, you can:
• Automatically and manually calibrate spectrum data.• Set peak detection parameters and custom labels for
regions of the trace.• Calculate centroid mass, elemental composition,
theoretical isotope distributions, resolution, andsignal-to-noise ratio.
• Customize windows, toolbars, and traces.Figure 1-23 shows the Data Explorer main window.
The Data Explorer processing software is described in theData Explorer™ Software User’s Guide.
Figure 1-23 Data Explorer Window
Voyager™ Biospectrometry™ Workstation User’s Guide 1-45

Chapter 1 Introducing the Voyager™ Biospectrometry™ Workstations
1
1-46 Applied Biosystems

2Chapter
2 Installing theVoyagerBiospectrometryWorkstations
This chapter contains the following sections:2.1 Installing the System........................................ 2-2
2.2 Selecting the Site............................................. 2-2
2.3 Connecting Voyager-DE andVoyager-DE PRO Workstations ....................... 2-8
2.4 Connecting theVoyager-DE STR Workstation........................ 2-23
2.5 Installing Software ......................................... 2-29
2.6 Hardware Configuration ................................. 2-35
2.7 Aligning the Sample Plate .............................. 2-46
2.8 Running OptiPlate to Optimize MassAccuracy ....................................................... 2-53
2.9 Resetting the Optional External Laser............ 2-71
2.10 Startup and Shutdown.................................... 2-73
2.11 Checking System Status and Pressures......... 2-76
Voyager™ Biospectrometry™ Workstation User’s Guide 2-1
Chapter 2 Installing the Voyager Biospectrometry Workstations
2
2.1 Installing the System
Your Voyager Biospectrometry Workstation is initially installedby an Applied Biosystems Technical Representative. Do notuse the Voyager system before it is properly installed. Use theinformation in this chapter if you move the Voyager systemafter initial installation.
2.2 Selecting the Site
This section includes:
• Voyager-DE and Voyager-DE PRO Workstations• Voyager-DE STR Workstation
2.2.1 Voyager-DE andVoyager-DE PRO Workstations
In this section This section includes:
• Required space• Weight• Power/voltage requirements• Selecting input voltage
Required space The Voyager-DE and Voyager-DE PRO mass spectrometersmeasure:
• 27 inches (69 cm) deep• 25 inches (64 cm) wide• 65 inches (165 cm) high, includes cabinet and flight tube
Allow an additional 10 inches (26 cm) above the top of theflight tube for service.
Allow 4 inches (10 cm) at the back of the mass spectrometerfor fans and cables.
2-2 Applied Biosystems

Selecting the Site
2
Allow 4 inches (10 cm) on the right side of the massspectrometer for cables.
Allow an additional 40 inches (102 cm) to the right side of themass spectrometer for:
• Video monitor for sample chamber• Computer, monitor, control stick, and keyboard• Printer• Optional oscilloscope or external digitizer
Weight The Voyager-DE system weighs approximately 250 pounds(113 kg).
The Voyager-DE PRO system weighs approximately350 pounds (159 kg).
Power/voltagerequirements
The Voyager-DE and Voyager-DE PRO systems require:
You must be able to quickly disconnect the main power supplyto the instrument, if necessary.
In addition, you need grounded outlets for the:
• Computer CPU• Computer monitor• External digitizer or oscilloscope (if your system includes)• Printer (optional)
Location Power/Voltage Required
US 120 V, 20 A, single-phase dedicatedcircuit, 60 Hz power source
European 230 V, 10 A, single-phase, 50/60 Hz powersource
Voyager™ Biospectrometry™ Workstation User’s Guide 2-3

Chapter 2 Installing the Voyager Biospectrometry Workstations
2
Selecting inputvoltage
If the system is set for a voltage that does not accommodateyour power source, select a different input voltage setting onthe Voyager system. If you select a different input voltagesetting, install fuses of the proper rating. Extra fuses fordifferent voltage settings are supplied with the system.
Perform this procedure before plugging in and powering upthe system for the first time. This procedure is required forVoyager-DE and Voyager-DE PRO systems only.
To select input voltage:
1. Remove the power cord from the mass spectrometer.
2. Carefully remove the voltage selector/fuse holder from thesystem (Figure 2-1) using a small flat-blade screw driver.
3. Carefully remove the voltage selector from the holder andinsert the selector with the proper voltage displayed in thewindow of the holder.
CAUTION
The plastic tabs that hold the voltage selector in placeare fragile. Do not exert force when removing thispiece.
2-4 Applied Biosystems
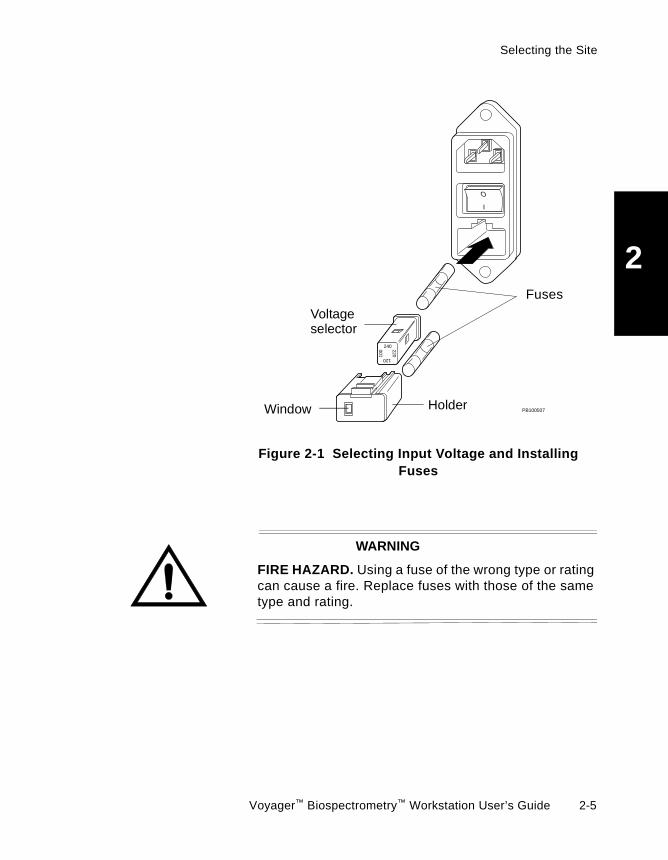
Selecting the Site
2
Figure 2-1 Selecting Input Voltage and InstallingFuses
WARNING
FIRE HAZARD. Using a fuse of the wrong type or ratingcan cause a fire. Replace fuses with those of the sametype and rating.
PB100507
I
O
240 220100
120
Fuses
Voltageselector
HolderWindow
Voyager™ Biospectrometry™ Workstation User’s Guide 2-5
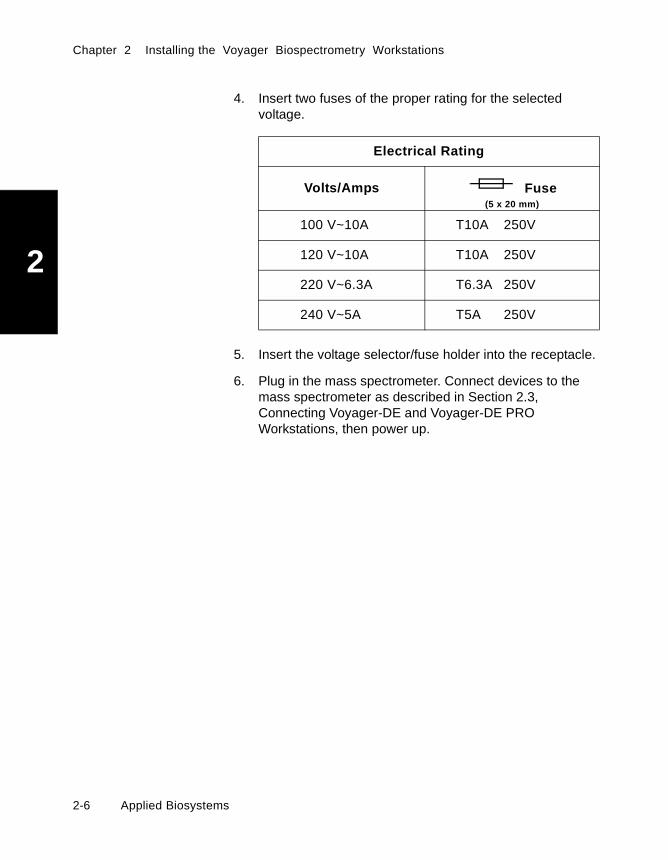
Chapter 2 Installing the Voyager Biospectrometry Workstations
2
4. Insert two fuses of the proper rating for the selectedvoltage.
5. Insert the voltage selector/fuse holder into the receptacle.
6. Plug in the mass spectrometer. Connect devices to themass spectrometer as described in Section 2.3,Connecting Voyager-DE and Voyager-DE PROWorkstations, then power up.
Electrical Rating
Volts/Amps Fuse(5 x 20 mm)
100 V~10A T10A 250V
120 V~10A T10A 250V
220 V~6.3A T6.3A 250V
240 V~5A T5A 250V
2-6 Applied Biosystems

Selecting the Site
2
2.2.2 Voyager-DE STR Workstation
In this section This section includes:
• Required space• Weight• Power/voltage requirements
Required space The Voyager-DE STR system is a floor-standing unit thatmeasures:
• 34 inches (87 cm) deep• 94 inches (239 cm) wide• 46 inches (117 cm) high
The Voyager-DE STR Workstation is constructed on a rollingbase. For service, you must have enough space to pull theworkstation forward 24 inches (61 cm) to allow access at therear of the workstation. Allow an additional 18 inches (48 cm)on the sides for service access.
Weight The Voyager-DE STR system weighs approximately1,100 pounds (499 kg).
Power/voltagerequirements
The Voyager-DE STR systems can be configured to operateat 110 V (voltage is ±10%).
Operating voltage is selected by an internal jumper, whichmust be set by an Applied Biosystems TechnicalRepresentative.
NOTE: Workstations are shipped with the internal voltageselector jumper disconnected.
The Voyager-DE STR systems require a single-phase,50/60 Hz power source at one of the following voltages:
• 100 V, 16 A• 120 V, 16 A• 220 V, 10 A• 240 V, 10 A
Voyager™ Biospectrometry™ Workstation User’s Guide 2-7
Chapter 2 Installing the Voyager Biospectrometry Workstations
2
CAUTION
Before operation, internal jumpers must be set toaccommodate your power source. Do not plug in or powerup the Voyager-DE STR Biospectrometry Workstationunless it has been configured correctly by an AppliedBiosystems Technical Representative.
In addition, you need grounded outlets for:
• Computer monitor• External digitizer (if your system includes one)• Printer (optional)
2.3 Connecting Voyager-DE andVoyager-DE PRO Workstations
This section describes:
• Side panel diagrams for mass spectrometer andcomputer
• Connecting the mass spectrometer to the computer
• Connecting the Signatec 500 MHz digitizer board
• Connecting the LSA1000 LeCroy digitizer
• Connecting the Acqiris digitizers
• Connecting the Tektronix® oscilloscope
• Connecting the video monitor
• Connecting devices to the computer
Before connecting devices to the mass spectrometer, powerdown the mass spectrometer.
When you plug in cables, make sure they are securelyconnected and screwed in place, if connectors include screws.
2-8 Applied Biosystems
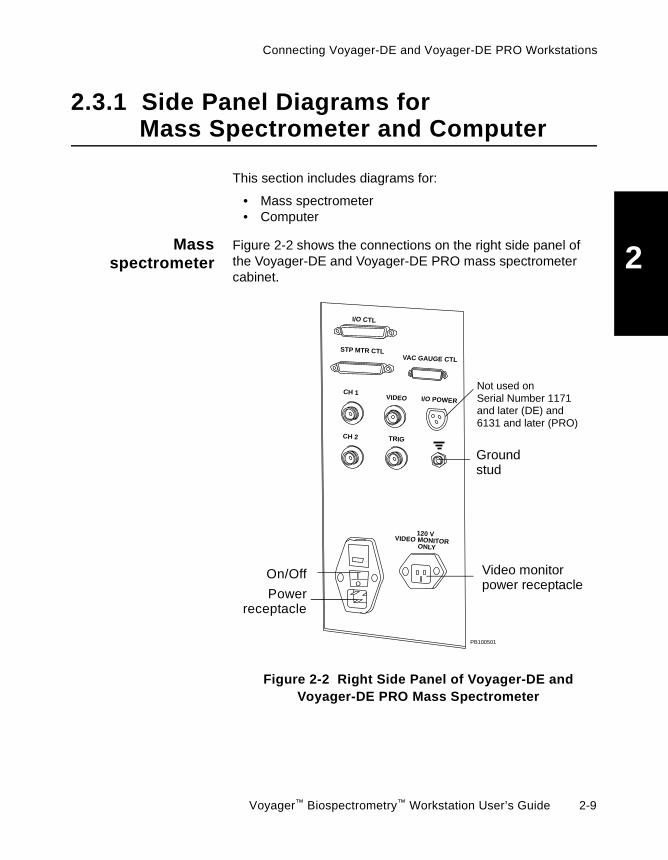
Connecting Voyager-DE and Voyager-DE PRO Workstations
2
2.3.1 Side Panel Diagrams forMass Spectrometer and Computer
This section includes diagrams for:
• Mass spectrometer• Computer
Massspectrometer
Figure 2-2 shows the connections on the right side panel ofthe Voyager-DE and Voyager-DE PRO mass spectrometercabinet.
Figure 2-2 Right Side Panel of Voyager-DE andVoyager-DE PRO Mass Spectrometer
PB100501
I/O CTL
STP MTR CTL
CH 1
CH 2
VIDEO
TRIG
VAC GAUGE CTL
IO
I/O POWER
120 VVIDEO MONITOR
ONLY
On/Off
Powerreceptacle
Video monitorpower receptacle
Groundstud
Not used onSerial Number 1171and later (DE) and6131 and later (PRO)
Voyager™ Biospectrometry™ Workstation User’s Guide 2-9
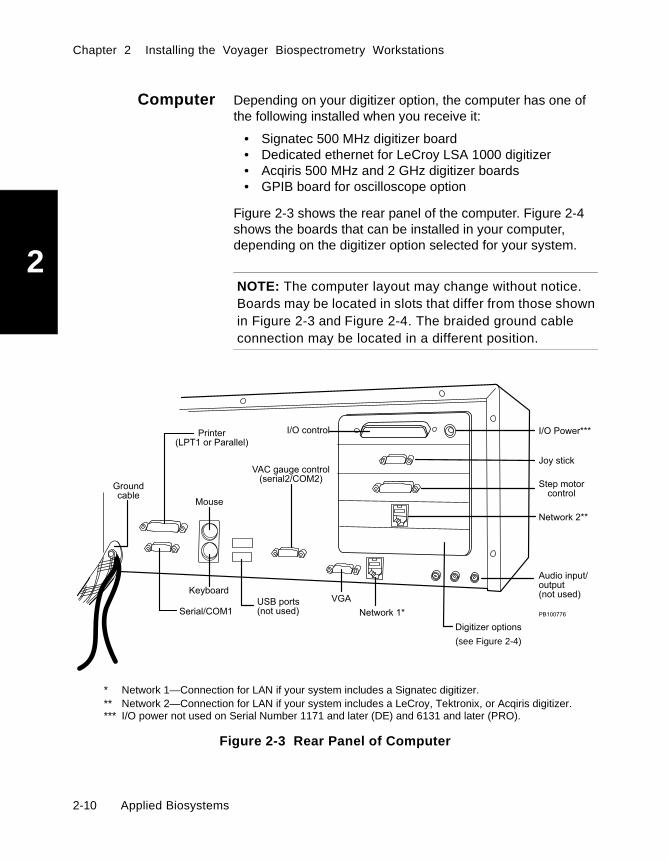
Chapter 2 Installing the Voyager Biospectrometry Workstations
2
Computer Depending on your digitizer option, the computer has one ofthe following installed when you receive it:
• Signatec 500 MHz digitizer board• Dedicated ethernet for LeCroy LSA 1000 digitizer• Acqiris 500 MHz and 2 GHz digitizer boards• GPIB board for oscilloscope option
Figure 2-3 shows the rear panel of the computer. Figure 2-4shows the boards that can be installed in your computer,depending on the digitizer option selected for your system.
NOTE: The computer layout may change without notice.Boards may be located in slots that differ from those shownin Figure 2-3 and Figure 2-4. The braided ground cableconnection may be located in a different position.
Figure 2-3 Rear Panel of Computer
!"
#$!"
#
%&' ((
)!"&(((
*'
$+,
)!"
-.+
%&'(
+!+
/$+
(see Figure 2-4)
Network 1—Connection for LAN if your system includes a Signatec digitizer.Network 2—Connection for LAN if your system includes a LeCroy, Tektronix, or Acqiris digitizer.
***
I/O power not used on Serial Number 1171 and later (DE) and 6131 and later (PRO).***
2-10 Applied Biosystems

Connecting Voyager-DE and Voyager-DE PRO Workstations
2
Figure 2-4 Digitizer Options
NOTE: The network connection to which the LeCroydigitizer is connected requires a specific IP address. Onsome systems, the LeCroy digitizer may be connected to anetwork connector other than the one shown in Figure 2-4.Do not change this connection without consulting anApplied Biosystems technical representative.
0 1
!"#$%
!& %$'("))$("$*!+,--./
!%$0!" !! 1!%! ! 2$%&"$!" $
"3%(#$%.45/
"3%(#$%.5/
2)#3
3
4542%
)%/
3 2)#
4542%
)%/
)%/
4-
4-
3 3 2)#/
*
*
* Acqiris boards require a 90V BNC spark gap and 3dB BNC attenuatorbetween the cable and the board.
Voyager™ Biospectrometry™ Workstation User’s Guide 2-11
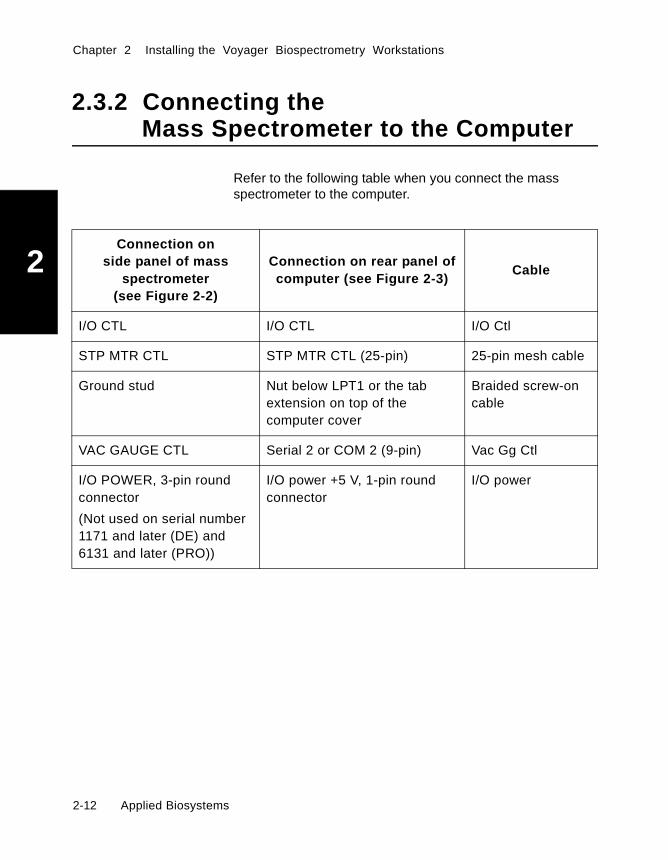
Chapter 2 Installing the Voyager Biospectrometry Workstations
2
2.3.2 Connecting theMass Spectrometer to the Computer
Refer to the following table when you connect the massspectrometer to the computer.
Connection onside panel of mass
spectrometer(see Figure 2-2)
Connection on rear panel ofcomputer (see Figure 2-3)
Cable
I/O CTL I/O CTL I/O Ctl
STP MTR CTL STP MTR CTL (25-pin) 25-pin mesh cable
Ground stud Nut below LPT1 or the tabextension on top of thecomputer cover
Braided screw-oncable
VAC GAUGE CTL Serial 2 or COM 2 (9-pin) Vac Gg Ctl
I/O POWER, 3-pin roundconnector
(Not used on serial number1171 and later (DE) and6131 and later (PRO))
I/O power +5 V, 1-pin roundconnector
I/O power
2-12 Applied Biosystems

Connecting Voyager-DE and Voyager-DE PRO Workstations
2
2.3.3 Connecting theSignatec 500 MHz Digitizer Board
If you have an oscilloscope or an external digitizer on yoursystem, disregard this section.
CAUTION
Do not use the Signatec 500 MHz digitizer board withoutdigitizer signal protection circuits (blue boxes on cables).Operation without digitizer signal protection circuits willresult in damage to the internal digitizer.
Refer to the following table when you connect the Signatec500 MHz digitizer board to the mass spectrometer:
Connection on right sidepanel of massspectrometer
(see Figure 2-2)
Connection on rearpanel of computer
(see Figure 2-4)Cable
TRIG Trig Trig SMA to Trig BNC
CH 1 CH 1 Ch 1 SMA to Ch 1 BNCbetween blue box andcomputer.
Ch1 BNC to Ch1 BNCbetween blue box and massspectrometer.
Ground wire to computerchassis ground screw.
Voyager™ Biospectrometry™ Workstation User’s Guide 2-13
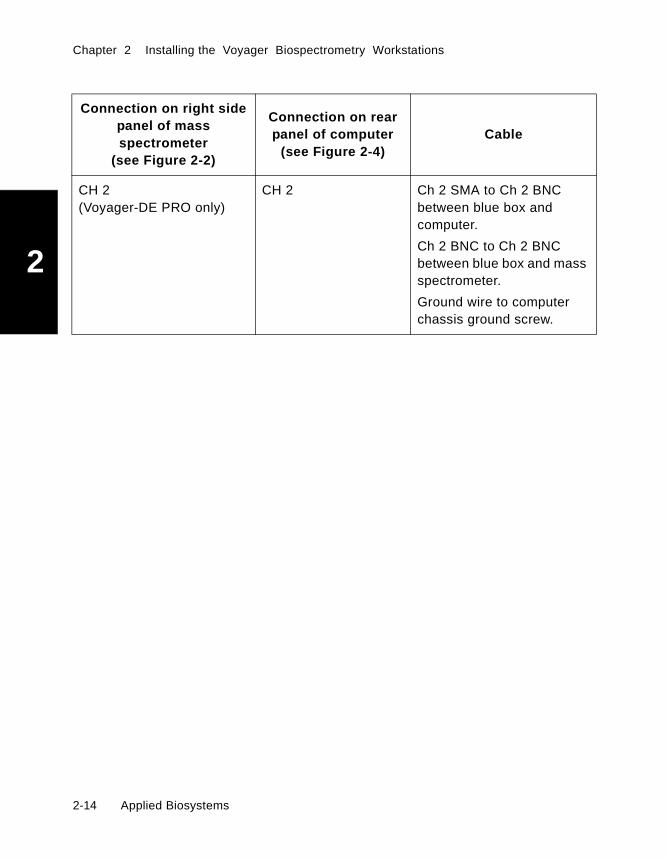
Chapter 2 Installing the Voyager Biospectrometry Workstations
2
CH 2(Voyager-DE PRO only)
CH 2 Ch 2 SMA to Ch 2 BNCbetween blue box andcomputer.
Ch 2 BNC to Ch 2 BNCbetween blue box and massspectrometer.
Ground wire to computerchassis ground screw.
Connection on right sidepanel of massspectrometer
(see Figure 2-2)
Connection on rearpanel of computer
(see Figure 2-4)Cable
2-14 Applied Biosystems
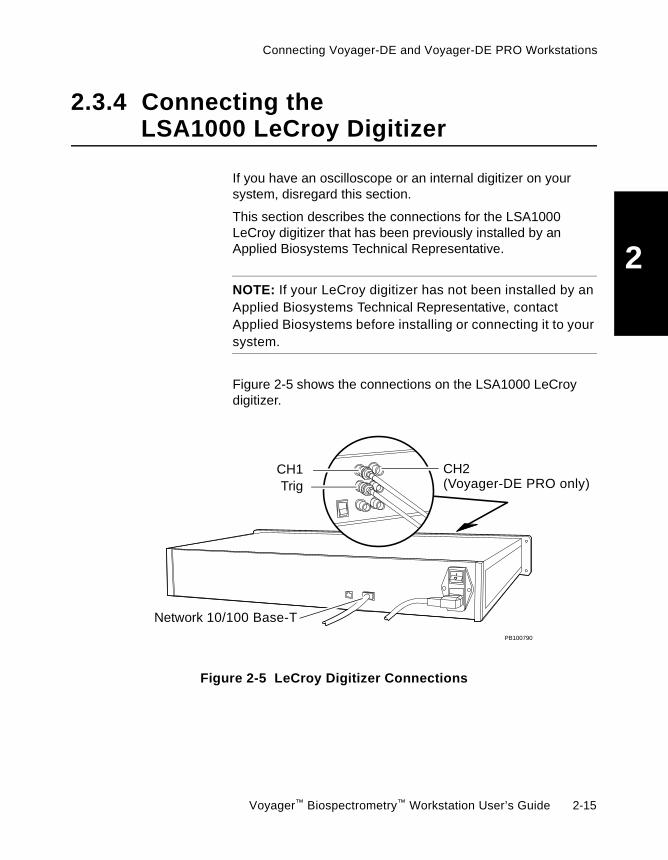
Connecting Voyager-DE and Voyager-DE PRO Workstations
2
2.3.4 Connecting theLSA1000 LeCroy Digitizer
If you have an oscilloscope or an internal digitizer on yoursystem, disregard this section.
This section describes the connections for the LSA1000LeCroy digitizer that has been previously installed by anApplied Biosystems Technical Representative.
NOTE: If your LeCroy digitizer has not been installed by anApplied Biosystems Technical Representative, contactApplied Biosystems before installing or connecting it to yoursystem.
Figure 2-5 shows the connections on the LSA1000 LeCroydigitizer.
Figure 2-5 LeCroy Digitizer Connections
PB100790
CH1 CH2Trig (Voyager-DE PRO only)
Network 10/100 Base-T
Voyager™ Biospectrometry™ Workstation User’s Guide 2-15
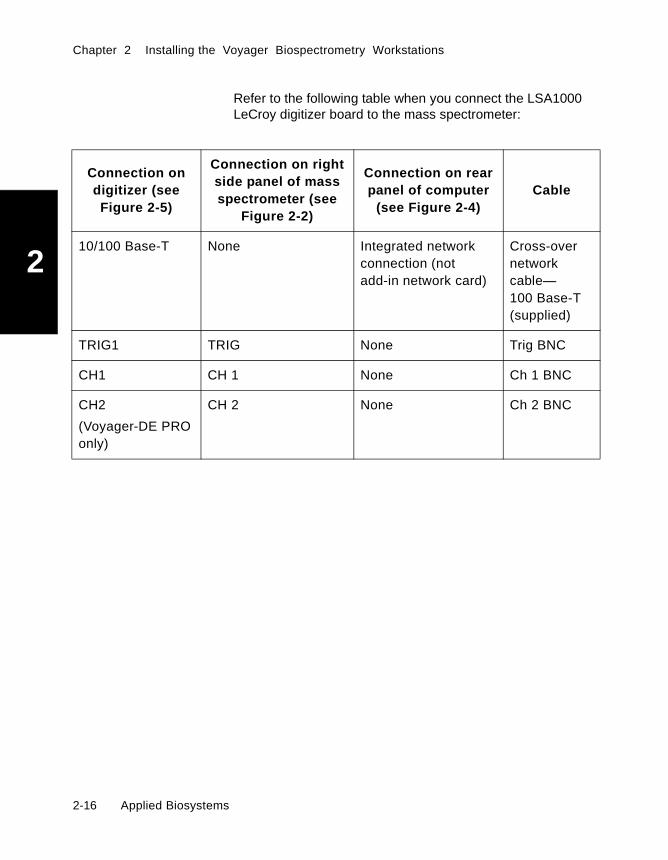
Chapter 2 Installing the Voyager Biospectrometry Workstations
2
Refer to the following table when you connect the LSA1000LeCroy digitizer board to the mass spectrometer:
Connection ondigitizer (seeFigure 2-5)
Connection on rightside panel of massspectrometer (see
Figure 2-2)
Connection on rearpanel of computer
(see Figure 2-4)Cable
10/100 Base-T None Integrated networkconnection (notadd-in network card)
Cross-overnetworkcable—100 Base-T(supplied)
TRIG1 TRIG None Trig BNC
CH1 CH 1 None Ch 1 BNC
CH2
(Voyager-DE PROonly)
CH 2 None Ch 2 BNC
2-16 Applied Biosystems

Connecting Voyager-DE and Voyager-DE PRO Workstations
2
2.3.5 Connecting the Acqiris Digitizers
This section describes how to connect the Acqiris 500 MHzand 2 GHz digitizer boards to the Voyager-DE andVoyager-DE PRO mass spectrometers.
If you have an oscilloscope or an external digitizer on yoursystem, disregard this section.
Refer to the following table when you connect the Acqiris500 MHz digitizer board to the mass spectrometer:
Connection on right sidepanel of mass
spectrometer (seeFigure 2-2)
Connection on rearpanel of computer
(see Figure 2-4)Cable
TRIG EXTERNAL Trig BNC on massspectrometer to EXTERNALBNC on board.
CH 1 INPUT Ch1 BNC on massspectrometer to 90V BNCSpark Gap to 3d BNCAttenuator to INPUT BNCon board.
Ground wire to computerchassis ground screw.
Voyager™ Biospectrometry™ Workstation User’s Guide 2-17

Chapter 2 Installing the Voyager Biospectrometry Workstations
2
Refer to the following table when you connect the Acqiris2 GHz digitizer board to the mass spectrometer:
Connection on right sidepanel of massspectrometer
(see Figure 2-2)
Connection on rearpanel of computer
(see Figure 2-4)Cable
TRIG EXTERNAL Trig BNC on massspectrometer to EXTERNALBNC on board.
CH 1 INPUTA Ch1 BNC on massspectrometer to 90V BNCSpark Gap to 3d BNCAttenuator to INPUTA BNCon board.
Ground wire to computerchassis ground screw.
CH 2
(DE-PRO only)
INPUTB Ch2 BNC on massspectrometer to 90V BNCSpark Gap to 3d BNCAttenuator to INPUTB BNCon board.
Ground wire to computerchassis ground screw.
2-18 Applied Biosystems

Connecting Voyager-DE and Voyager-DE PRO Workstations
2
2.3.6 Connectingthe Tektronix Oscilloscope
If you have an internal digitizer board or external digitizer inyour computer, disregard this section.
Figure 2-6 shows the front panel of the oscilloscope.
Figure 2-6 Oscilloscope Connections
PB100770
CH 1CH 2
AUX 1AUX 2
To TRIGon side panelof massspectrometer
To CH2on side panelof massspectrometer (DE-PRO systems only)
To CH1on side panelof massspectrometer
Voyager™ Biospectrometry™ Workstation User’s Guide 2-19
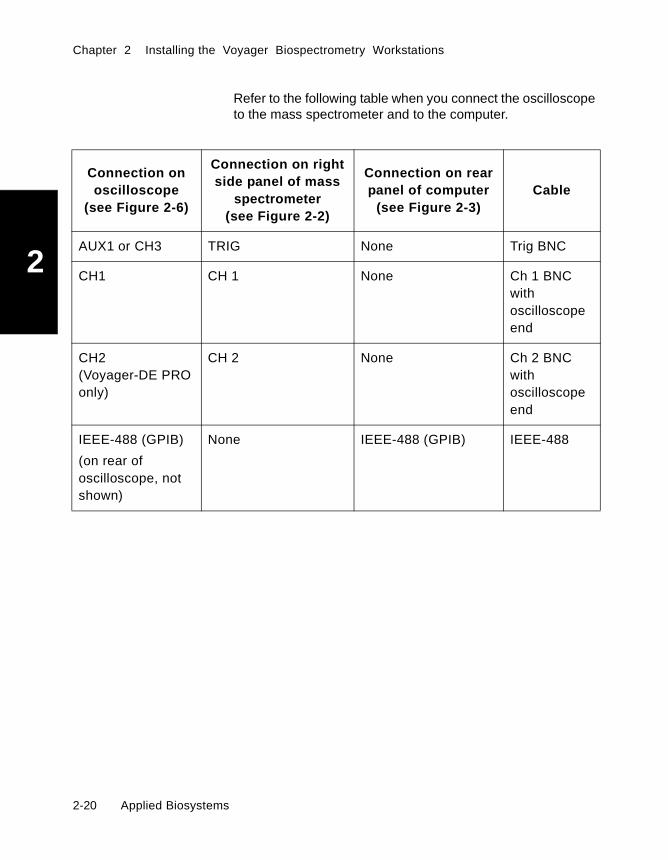
Chapter 2 Installing the Voyager Biospectrometry Workstations
2
Refer to the following table when you connect the oscilloscopeto the mass spectrometer and to the computer.
Connection onoscilloscope
(see Figure 2-6)
Connection on rightside panel of mass
spectrometer(see Figure 2-2)
Connection on rearpanel of computer
(see Figure 2-3)Cable
AUX1 or CH3 TRIG None Trig BNC
CH1 CH 1 None Ch 1 BNCwithoscilloscopeend
CH2(Voyager-DE PROonly)
CH 2 None Ch 2 BNCwithoscilloscopeend
IEEE-488 (GPIB)
(on rear ofoscilloscope, notshown)
None IEEE-488 (GPIB) IEEE-488
2-20 Applied Biosystems

Connecting Voyager-DE and Voyager-DE PRO Workstations
2
2.3.7 Connecting the Video Monitor
Figure 2-7 shows the rear panel of the video monitor.
Figure 2-7 Rear Panel of Video Monitor
Refer to the following table when connecting the video monitorto the Voyager-DE and Voyager-DE PRO workstations.
066
)
"
)
"
Power cordTo Video on side panelof mass spectrometer
Connection onrear panel of
video monitor(see Figure 2-7)
Connection on sidepanel of MassSpectrometer
(see Figure 2-2)
Cable
Video In VIDEO BNC withvideoadapter
Power receptacle VIDEO MONITORONLY
Power
Voyager™ Biospectrometry™ Workstation User’s Guide 2-21
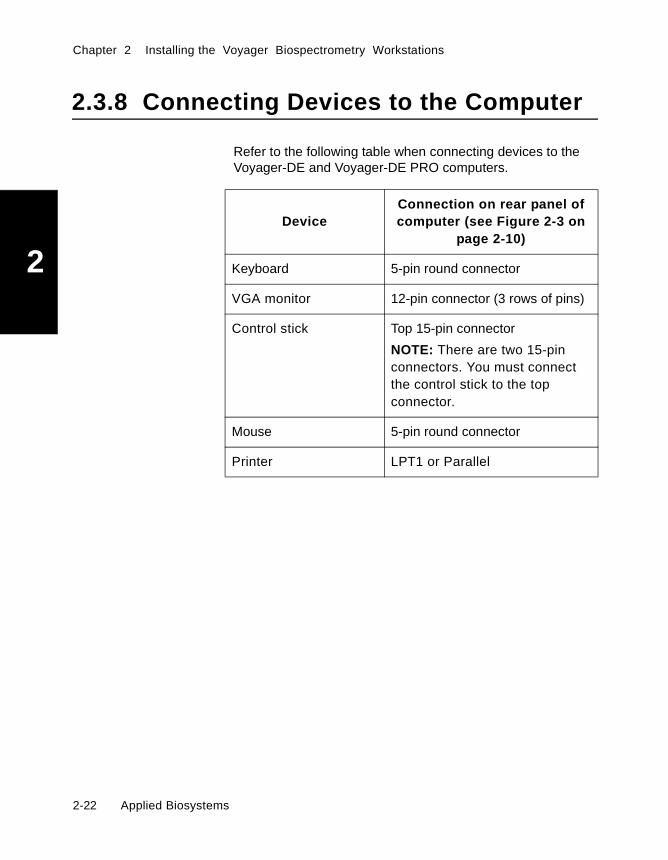
Chapter 2 Installing the Voyager Biospectrometry Workstations
2
2.3.8 Connecting Devices to the Computer
Refer to the following table when connecting devices to theVoyager-DE and Voyager-DE PRO computers.
DeviceConnection on rear panel ofcomputer (see Figure 2-3 on
page 2-10)
Keyboard 5-pin round connector
VGA monitor 12-pin connector (3 rows of pins)
Control stick Top 15-pin connector
NOTE: There are two 15-pinconnectors. You must connectthe control stick to the topconnector.
Mouse 5-pin round connector
Printer LPT1 or Parallel
2-22 Applied Biosystems
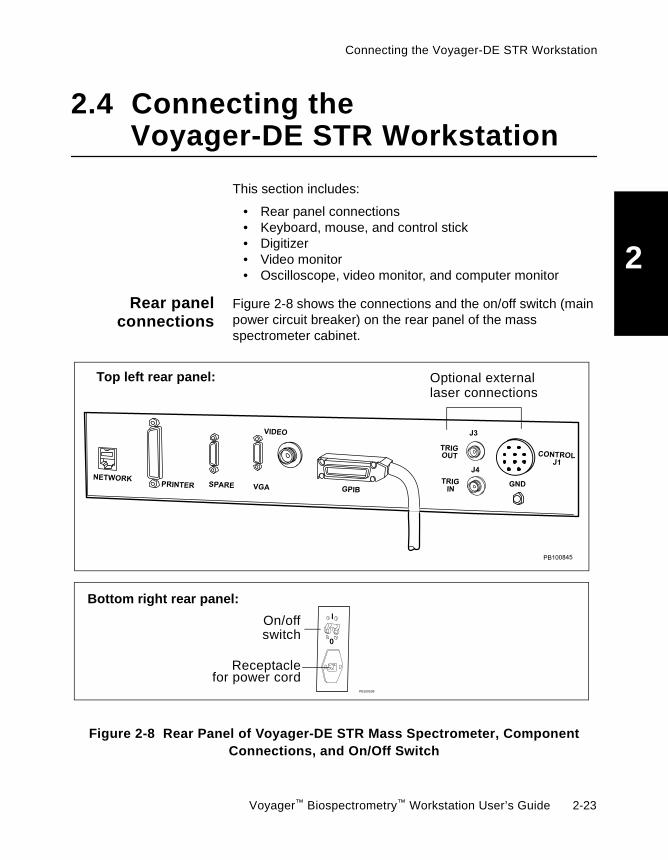
Connecting the Voyager-DE STR Workstation
2
2.4 Connecting theVoyager-DE STR Workstation
This section includes:
• Rear panel connections• Keyboard, mouse, and control stick• Digitizer• Video monitor• Oscilloscope, video monitor, and computer monitor
Rear panelconnections
Figure 2-8 shows the connections and the on/off switch (mainpower circuit breaker) on the rear panel of the massspectrometer cabinet.
Figure 2-8 Rear Panel of Voyager-DE STR Mass Spectrometer, ComponentConnections, and On/Off Switch
Receptacle
On/off
for power cordPB100538
0
l
switch
Optional externallaser connections
Top left rear panel:
Bottom right rear panel:
-,4
Voyager™ Biospectrometry™ Workstation User’s Guide 2-23
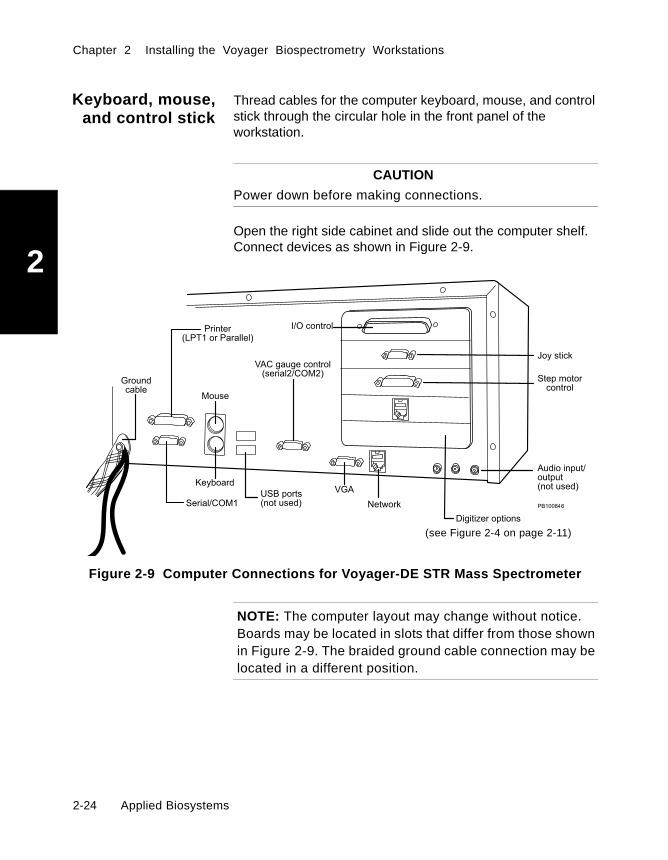
Chapter 2 Installing the Voyager Biospectrometry Workstations
2
Keyboard, mouse,and control stick
Thread cables for the computer keyboard, mouse, and controlstick through the circular hole in the front panel of theworkstation.
CAUTION
Power down before making connections.
Open the right side cabinet and slide out the computer shelf.Connect devices as shown in Figure 2-9.
Figure 2-9 Computer Connections for Voyager-DE STR Mass Spectrometer
NOTE: The computer layout may change without notice.Boards may be located in slots that differ from those shownin Figure 2-9. The braided ground cable connection may belocated in a different position.
06
!"
#$!"
#
*'
$+,
)!"
-.+
%&'
+!+
/$+
(see Figure 2-4 on page 2-11)
2-24 Applied Biosystems

Connecting the Voyager-DE STR Workstation
2
Connections are listed below.
Digitizer Depending on your digitizer option, the computer will have oneof the following installed when you receive it:
• GPIB board for the oscilloscope• Acqiris 2 GHz digitizer board
Figure 2-9 on page 2-24 shows the rear panel of the computer.Figure 2-4 on page 2-11 shows the location of the two boardsthat can be installed in your computer, depending on thedigitizer option selected for your system.
NOTE: The computer layout may change without notice.Boards may be located in slots that differ from those shownin Figure 2-9 and Figure 2-4.
Device Connection
Keyboard 5-pin round connector
VGA monitor 12-pin connector (3 rows of pins)
Control stick 15-pin connector
Mouse COM1 or 5-pin round connector
Printer LPT1 or Parallel
Voyager™ Biospectrometry™ Workstation User’s Guide 2-25

Chapter 2 Installing the Voyager Biospectrometry Workstations
2
Oscilloscope Figure 2-10 shows the front panel of the oscilloscope. TheCH1, CH2 and CH3 (or Aux 1) input cables thread through thecenter hole in the front panel of the Voyager-STR workstation.These cables are connected internally to the detector andcontrol board.
Figure 2-10 Oscilloscope Connections
Acqiris 2 GHzdigitizer
Figure 2-11 shows the connectors on the Acqiris 2 GHzdigitizer board. The input cables from these connectors(INPUTA, INPUTB, and EXTERNAL) connect internally to themass spectrometer linear detector, reflector detector, andcontrol board, respectively.
Figure 2-11 Acqiris 2 GHz Digitizer Board Connections
PB100770
CH 1CH 2
AUX 1AUX 2
To CH3 frominternal control board
To CH2from internalReflector detectoroutput
To CH1from internalLinear detectoroutput
To linear To reflector To internalcontrol boarddetectordetector
2-26 Applied Biosystems

Connecting the Voyager-DE STR Workstation
2
Video monitor Figure 2-12 shows the rear panel of the video monitor.
Figure 2-12 Rear Panel of Video Monitor
NOTE: In the US only, you can plug the video monitor into agrounded wall outlet or into the receptacle on the massspectrometer.
066
)
"
)
"
Power cordTo Video on side panelof mass spectrometer
Voyager™ Biospectrometry™ Workstation User’s Guide 2-27

Chapter 2 Installing the Voyager Biospectrometry Workstations
2
Oscilloscope,video monitor,and computer
monitor
Make the following connections on the rear panel of theVoyager-DE STR system:
Voyager-DE STR(Figure 2-8 on
page 2-23)Connect to Cable
Video Video input ofvideo monitor(Figure 2-12)
BNC with videoadapter
VGA Computer monitor 9-pin connector
GPIB Oscilloscope(Figure 2-10 onpage 2-26)
IEEE-488
NOTE: Thread cables for CH1, CH2, and CH3 (Aux1) inputthrough the circular hole in the front panel of theworkstation.
2-28 Applied Biosystems

Installing Software
2
2.5 Installing Software
All necessary software is installed on your Voyagerworkstation when it is shipped to you. Use these instructionsto reinstall software or install a new version of software.
The Voyager software requires a total of 100 MB of free diskspace plus additional space for data files.
Before installing the Voyager software, make sure thefollowing software is installed on your computer:
• Microsoft Windows NT-based software• All display, network, and printer drivers
Follow the instructions provided with the software listed aboveto install it.
This section describes:
• Installing the Voyager software• Starting the software• Exiting the software
Voyager™ Biospectrometry™ Workstation User’s Guide 2-29

Chapter 2 Installing the Voyager Biospectrometry Workstations
2
2.5.1 Installing the Voyager Software
Installing To install the Voyager software:
1. Insert the Voyager CD into the CD drive in thecomputer.
The installation routine automatically starts and theWelcome dialog box appears.
NOTE: If the installation routine does not automaticallystart, click Start on the Windows NT desktop, clickRun, type D:\VOYAGER\SETUP (or the drivedesignation for your CD drive), and click OK.
2. Click Next.
The Select Components dialog box appears with alloptions selected by default:
• Voyager software—Includes the InstrumentControl Panel and Sequence Control Panel, andall standard calibration reference (.REF), platetype (.PLT), default settings (.SET) files, andsearch pattern (.SP) files provided.
• Data Explorer software—Includes the DataExplorer software and default settings (.SET) files.
• Example files—Includes standard instrumentsettings (.BIC) files, and installs them inC:\VOYAGER\DATA\INSTALLATION.
NOTE: The standard .BIC files are installed in adifferent directory than the .BIC files that havebeen optimized for your system. For moreinformation, see “Standard instrument settingsfiles” on page 5-3.
2-30 Applied Biosystems

Installing Software
2
• User Guides—Includes PDF (portable documentformat) versions of the Voyager documentationthat you can view online using Adobe® Acrobat®
Reader.
3. Click Next.
4. A series of dialog boxes in which you specify thehardware options and serial number for your systemare displayed. Leave settings at the defaults, or changethe settings if needed. Click Next.
The Select Program Folder dialog box appears.
5. Leave the Program Folder set to Voyager. Click Next.
The installation proceeds.
6. A message is displayed asking if you want to install DataAccess Packs. Click Yes.
7. A message is displayed asking if you want to install AdobeAcrobat Reader. Click Yes.
When the software is installed, a message is displayed.The following icons are created and displayed on theWindows desktop:
• Voyager Control Panel• Data Explorer• Voyager Sequence Control Panel
Accessing theonline User’s
Guides
To access the PDF versions of the Voyager documentation:
1. From the Windows Start menu, select Programs.
2. Select Voyager, then select User Guides, and select thedocument to open.
Voyager™ Biospectrometry™ Workstation User’s Guide 2-31
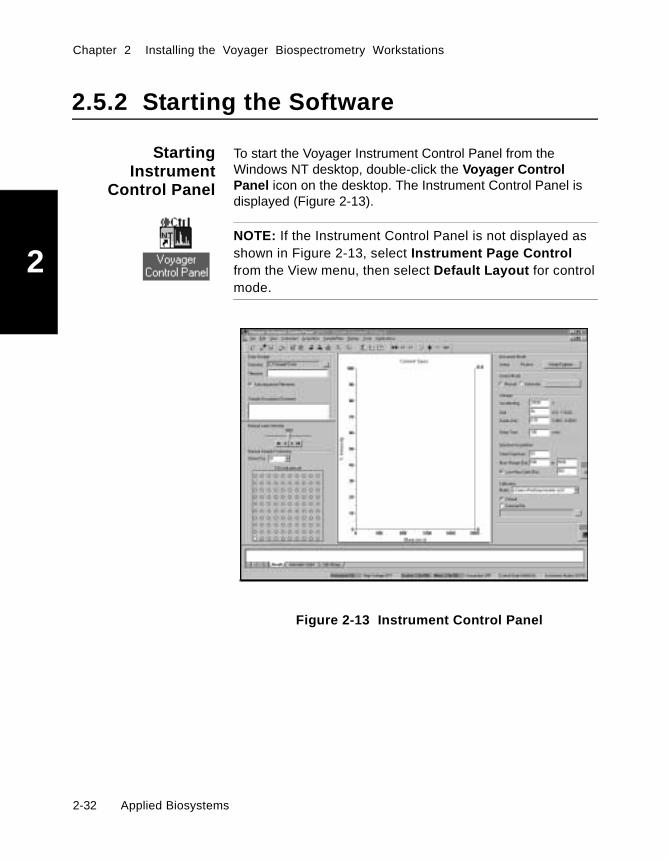
Chapter 2 Installing the Voyager Biospectrometry Workstations
2
2.5.2 Starting the Software
StartingInstrument
Control Panel
To start the Voyager Instrument Control Panel from theWindows NT desktop, double-click the Voyager ControlPanel icon on the desktop. The Instrument Control Panel isdisplayed (Figure 2-13).
NOTE: If the Instrument Control Panel is not displayed asshown in Figure 2-13, select Instrument Page Controlfrom the View menu, then select Default Layout for controlmode.
Figure 2-13 Instrument Control Panel
2-32 Applied Biosystems

Installing Software
2
StartingSequence Control
Panel
To start the Sequence Control Panel from the Windows NTdesktop:
1. Make sure the Instrument Control Panel is running.
NOTE: If you start the Instrument Control Panel usingthe Sequence Control Panel icon, it functions the sameway as if you started it using the Instrument ControlPanel icon, with two exceptions. Warning and errormessages are not displayed during operation, and theInstrument Control Panel will close when you close theSequence Control Panel.
2. Double-click the Sequence Control Panel icon on thedesktop.
NOTE: You can also click a toolbar button in theInstrument Control Panel to start the Sequence ControlPanel.
The Sequence Control Panel opens (Figure 2-14).
Figure 2-14 Sequence Control Panel
Voyager™ Biospectrometry™ Workstation User’s Guide 2-33

Chapter 2 Installing the Voyager Biospectrometry Workstations
2
2.5.3 Exiting the Software
CAUTION
If you are using the Voyager Workstation and you exit theVoyager Instrument Control software, you can no longercontrol the workstation. Do not exit the Voyager softwareuntil you have finished using the workstation.
Sequence ControlPanel
To exit the Sequence Control software:
1. In the Sequence Control window, select Exit from theFile menu.
A message is displayed. Click Yes.
The Sequence Control software closes.
If you started the Instrument Control Panel bydouble-clicking the Sequence Control Panel icon, theInstrument Control software closes.
InstrumentControl Panel
2. If you started the Instrument Control Panel bydouble-clicking the Instrument Control Panel icon,select Exit from the File menu in the Instrument ControlPanel window.
The Instrument Control software closes.
2-34 Applied Biosystems

Hardware Configuration
2
2.6 Hardware Configuration
CAUTION
Do not alter the Hardware Configuration unless instructedto do so by an Applied Biosystems TechnicalRepresentative. Altering these settings may cause yourVoyager Biospectrometry Workstation to functionimproperly.
In this section This section describes:
• Vacuum configuration• High voltage configuration• Timed (Precursor) ion selector configuration• Instrument configuration• Laser configuration• Digitizer configuration
2.6.1 Vacuum Configuration
To check the vacuum configuration:
1. In the Instrument Control Panel, select HardwareConfiguration from the Instrument menu.
2. Click the Vacuum tab to display the Vacuum page(Figure 2-15 on page 2-36).
Voyager™ Biospectrometry™ Workstation User’s Guide 2-35
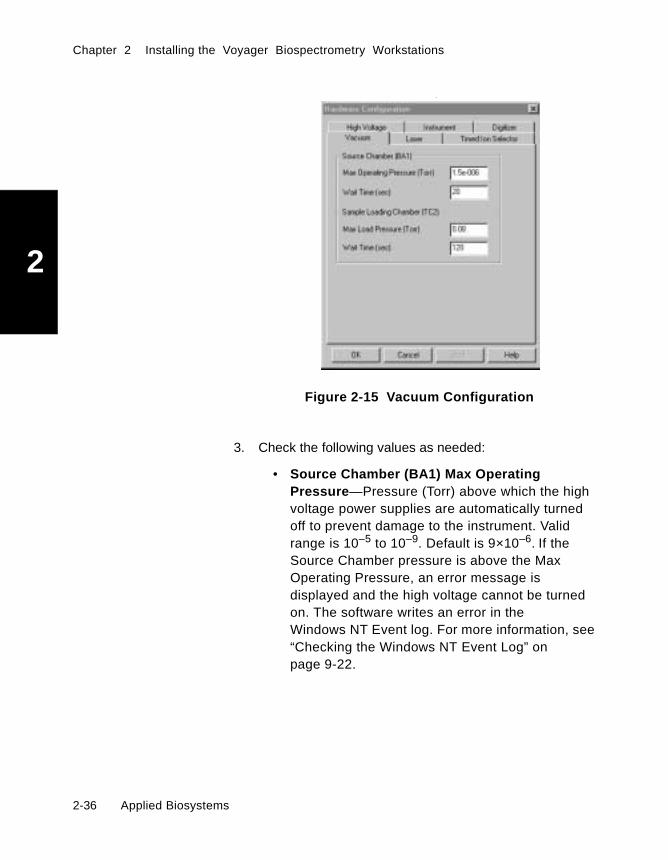
Chapter 2 Installing the Voyager Biospectrometry Workstations
2
.
Figure 2-15 Vacuum Configuration
3. Check the following values as needed:
• Source Chamber (BA1) Max OperatingPressure—Pressure (Torr) above which the highvoltage power supplies are automatically turnedoff to prevent damage to the instrument. Validrange is 10–5 to 10–9. Default is 9×10⁻⁶. If theSource Chamber pressure is above the MaxOperating Pressure, an error message isdisplayed and the high voltage cannot be turnedon. The software writes an error in theWindows NT Event log. For more information, see“Checking the Windows NT Event Log” onpage 9-22.
2-36 Applied Biosystems
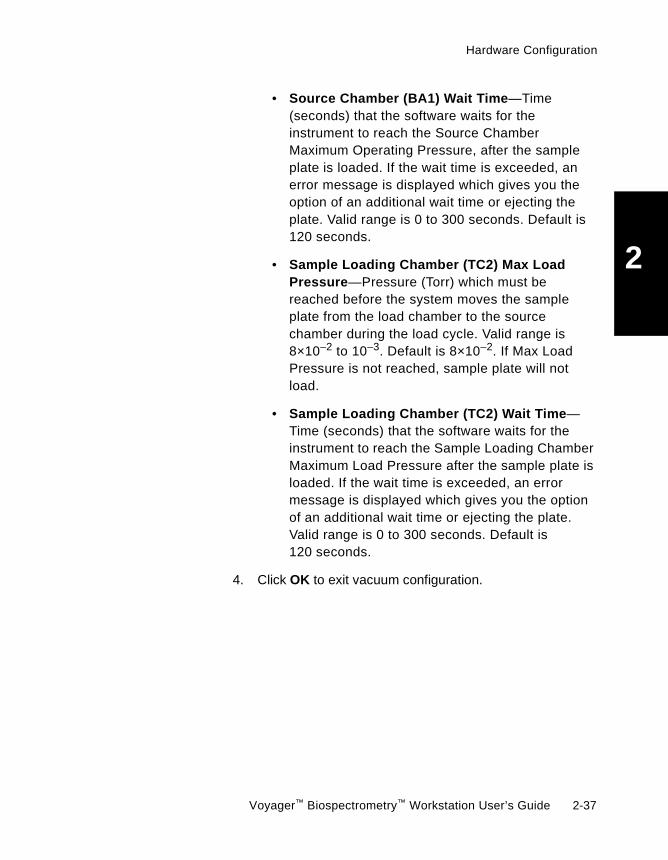
Hardware Configuration
2
• Source Chamber (BA1) Wait Time—Time(seconds) that the software waits for theinstrument to reach the Source ChamberMaximum Operating Pressure, after the sampleplate is loaded. If the wait time is exceeded, anerror message is displayed which gives you theoption of an additional wait time or ejecting theplate. Valid range is 0 to 300 seconds. Default is120 seconds.
• Sample Loading Chamber (TC2) Max LoadPressure—Pressure (Torr) which must bereached before the system moves the sampleplate from the load chamber to the sourcechamber during the load cycle. Valid range is8×10–2 to 10–3. Default is 8×10⁻². If Max LoadPressure is not reached, sample plate will notload.
• Sample Loading Chamber (TC2) Wait Time—Time (seconds) that the software waits for theinstrument to reach the Sample Loading ChamberMaximum Load Pressure after the sample plate isloaded. If the wait time is exceeded, an errormessage is displayed which gives you the optionof an additional wait time or ejecting the plate.Valid range is 0 to 300 seconds. Default is120 seconds.
4. Click OK to exit vacuum configuration.
Voyager™ Biospectrometry™ Workstation User’s Guide 2-37

Chapter 2 Installing the Voyager Biospectrometry Workstations
2
2.6.2 High Voltage Configuration
To check high voltage configuration:
1. In the Instrument Control Panel, select HardwareConfiguration from the Instrument menu.
2. Click the High Voltage tab to display the High Voltagepage (Figure 2-16).
Figure 2-16 High Voltage Configuration
3. Check the following values as needed:
• Maximum Accelerating Voltage—Maximumvalue in volts that the Accelerating Voltage isconfigured (25,000 V).
• Polarity Switch Delay (Read-only)—Time(seconds) that the high voltage power supply waitsbetween switching from positive to negativepolarity.
2-38 Applied Biosystems

Hardware Configuration
2
• Idle Power Off/Idle Time—When enabled, thenumber of minutes after which the high voltagepower supplies automatically turn off, if theinstrument is not used. Default is 60 minutes. Ifthis value is zero, the high voltage remains on untilany of the following occur: you selectInstrument/Turn off High Voltage, Source Pressureexceeds Maximum Operating Pressure, you clickLoad or Eject, you align a sample plate, or youexit the software.
4. Click OK to exit.
2.6.3 Timed Ion Selector Configuration
To check the Timed Ion Selector (called Precursor Ion Selectorin PSD mode) configuration:
1. In the Instrument Control Panel, select HardwareConfiguration from the Instrument menu.
2. Click the Timed Ion Selector tab to display the Timed IonSelector page (Figure 2-17).
Figure 2-17 Timed Ion Selector Configuration
Voyager™ Biospectrometry™ Workstation User’s Guide 2-39

Chapter 2 Installing the Voyager Biospectrometry Workstations
2
3. Check the following values as needed:
• Flight Length to Deflector—Distance inmillimeters from the grid to the deflector.
• Deflector Gate Width—Distance in millimetersthat the Timed Ion Selector is on.
CAUTION
Do not alter the Timed Ion Selector parameters unlessinstructed to do so by an Applied Biosystems TechnicalRepresentative. Altering these settings may cause yourVoyager Biospectrometry Workstation to functionimproperly.
4. Click OK to exit.
2.6.4 Instrument Configuration
To check the instrument configuration:
1. In the Instrument Control Panel, select HardwareConfiguration from the Instrument menu.
2. Click the Instrument tab to display the Instrument page(Figure 2-18).
2-40 Applied Biosystems
Hardware Configuration
2
Figure 2-18 Instrument Configuration
3. Check the following fields as needed:
• Instrument type (Read-only)—Displays yourinstrument type.
• Delayed Extraction (Read-only)—Reflectswhether your system has delayed extractionhardware installed.
• Laboratory Name—You can edit this field todisplay your laboratory name. Names listed in thisfield are included in .DAT files and on printouts.
• Instrument Name—You can edit this field todisplay your instrument name. Names listed in thisfield are included in .DAT files and on printouts.
• Serial Number—Displays the serial number forthe connected instrument.
4. Click OK to exit.
Voyager™ Biospectrometry™ Workstation User’s Guide 2-41
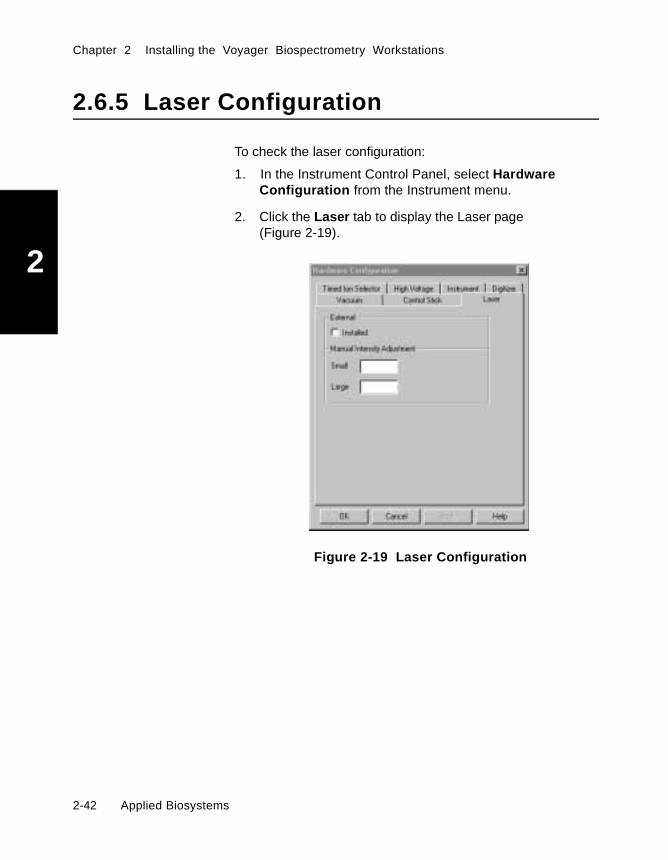
Chapter 2 Installing the Voyager Biospectrometry Workstations
2
2.6.5 Laser Configuration
To check the laser configuration:
1. In the Instrument Control Panel, select HardwareConfiguration from the Instrument menu.
2. Click the Laser tab to display the Laser page(Figure 2-19).
Figure 2-19 Laser Configuration
2-42 Applied Biosystems
Hardware Configuration
2
3. Check the following fields as needed:
• External laser (Read-only)—Checked if anexternal laser is installed.
• Manual Intensity Adjustment—Determines theincrements in which the laser attenuator moveswhen using the Fine and Coarse laser controls onthe Manual Laser/Sample Positioning controlpage:
Small—Determines laser adjustment incrementswhen you click the Fine laser controls orpress Ctrl+PgUp/Ctrl+PgDn.
Large—Determines laser adjustment incrementswhen you click the Coarse laser controls .
NOTE: You set laser firing rate in the Mode/Digitizerdialog box described on page 5-26.
4. Click OK to exit.
Voyager™ Biospectrometry™ Workstation User’s Guide 2-43

Chapter 2 Installing the Voyager Biospectrometry Workstations
2
2.6.6 Digitizer Configuration
To check the configuration of the digitizer:
1. In the Instrument Control Panel, select HardwareConfiguration from the Instrument menu.
2. Click the Digitizer tab to display the Digitizer page(Figure 2-20).
.
Figure 2-20 Digitizer Configuration
Check the Digitizer type field. This is a read-only valuethat displays the digitizer type installed.
3. Select Acquire in Single Shot Mode to set the system tosave only the last acquired spectrum when you save data,instead of averaging spectra.
2-44 Applied Biosystems
Hardware Configuration
2
You can use single-shot mode:
• As a diagnostic to determine if there is scan-to-scan variation in signal
• To acquire data
When single-shot mode is enabled, a maximum of10,000 shots are acquired, but are not averaged. Whenacquisition is stopped, the last single shot acquired isdisplayed in the Spectrum window. A data file containsdata for a single scan.
When single-shot mode is disabled, the Total Shotsspecified in the instrument settings are acquired andare averaged as they are acquired.
4. Click OK to exit.
Voyager™ Biospectrometry™ Workstation User’s Guide 2-45

Chapter 2 Installing the Voyager Biospectrometry Workstations
2
2.7 Aligning the Sample Plate
In this section This section describes:
• Overview• When to align• .PLT files and multiple alignments• How the system aligns a plate• Overview of video monitor display• What you need• Corner positions in .PLT files• Using the control stick• Before aligning• Aligning• Alignment information saved for future use
Overview The Sample Plate Alignment function allows you to align thecenter of sample positions under the laser beam.
When to align For most standard welled plates and .PLT files provided,alignment is not frequently required.
Alignment is more typically required:
• When you are using a custom .PLT file and are spottingsample plates using an automated device.
• When you are using Teflon™ plates, because there can besome variation in the laser-etched indentations on theplate.
Align the Sample Plate if the laser beam is not centered on asample position:
• When you advance to a sample position using theManual Sample Position control page
• Before you acquire data from the InstrumentControl Panel and use automated samplepositioning
• Before you acquire data from the SequenceControl Panel
2-46 Applied Biosystems

Aligning the Sample Plate
2
.PLT files andmultiple
alignments
A .PLT file defines the sample positions on a sample plate. Forexample, 100.PLT may define a 100-well plate. If you havemore than one 100-well plate, you may need to align eachplate. The Voyager software allows you to assign a uniquePlate ID to each plate that allows customized alignment ofmore than one plate that uses the sample .PLT file(Figure 2-21).
Figure 2-21 Multiple Alignments Using Sample .PLTFile
How the systemaligns a plate
When you load a sample plate, the system aligns the plate asdescribed below:
• The software looks for alignment information associatedwith the Plate ID you load and adjusts accordingly.
• If there is no alignment information available for the PlateID (sample plate has not been aligned), the software usesthe default alignment.
Plate A
100well.PLTAligned6/1/00
Plate ID 1A
Plate B
100well.PLTAligned6/15/00
Plate ID 1B
Plate C
100well.PLTAligned6/30/00
Plate ID 1C
Voyager™ Biospectrometry™ Workstation User’s Guide 2-47
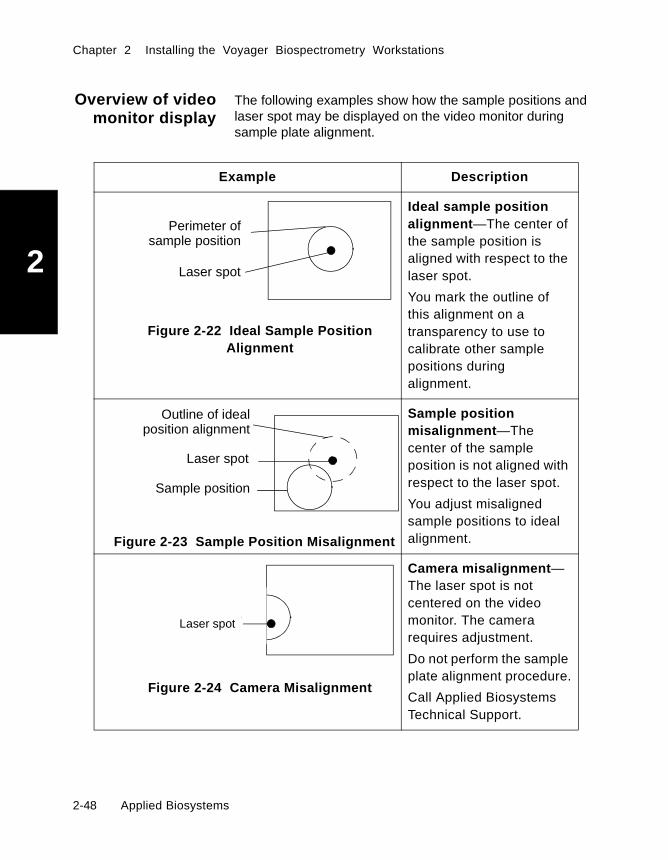
Chapter 2 Installing the Voyager Biospectrometry Workstations
2
Overview of videomonitor display
The following examples show how the sample positions andlaser spot may be displayed on the video monitor duringsample plate alignment.
Example Description
Figure 2-22 Ideal Sample PositionAlignment
Ideal sample positionalignment—The center ofthe sample position isaligned with respect to thelaser spot.
You mark the outline ofthis alignment on atransparency to use tocalibrate other samplepositions duringalignment.
Figure 2-23 Sample Position Misalignment
Sample positionmisalignment—Thecenter of the sampleposition is not aligned withrespect to the laser spot.
You adjust misalignedsample positions to idealalignment.
Figure 2-24 Camera Misalignment
Camera misalignment—The laser spot is notcentered on the videomonitor. The camerarequires adjustment.
Do not perform the sampleplate alignment procedure.
Call Applied BiosystemsTechnical Support.
Laser spot
Perimeter ofsample position
Outline of idealposition alignment
Sample position
Laser spot
Laser spot
2-48 Applied Biosystems

Aligning the Sample Plate
2
What you need To align the sample plate you need the following materials:
• Sample plate with α-cyano-4-hydroxycinnamic acid(CHCA) matrix spotted in four corner sample positions, asdescribed in Table 2-1. For more information, seeSection 3.5.5, Adjusting the Laser Position for a Custom.PLT File.
WARNING
CHEMICAL HAZARD. Alpha-cyano-4-hydroxycinnamic acid (CHCA) matrix may cause eye,skin, and respiratory tract irritation. Read the MSDSand follow the handling instructions. Wear appropriateprotective eyewear, clothing, and gloves.
NOTE: If your monitor screen is marked with theposition at which the laser strikes the sample plate andyou are aligning plates with wells or etched samplepositions, you do not need to spot the sample platewith matrix before aligning. You can align theboundaries of the sample positions with the laserposition mark on your monitor.
• Transparency (mylar overhead or acetate)
• Marking pen
NOTE: View the video monitor from a consistent anglewhen determining laser positions.
Voyager™ Biospectrometry™ Workstation User’s Guide 2-49

Chapter 2 Installing the Voyager Biospectrometry Workstations
2
Corner positionsin .PLT files
Different sample position numbers are associated withdifferent .PLT files. To determine which numbers correspondto the four corners of each .PLT file, see Table 2-1.
Using the controlstick
To align a sample plate, you must use the control stick. Fordetails on using the control stick, see Appendix I, Using theOscilloscope and Control Stick.
Before aligning Before aligning the sample plate:
1. Spot the sample plate with matrix as described in “Whatyou need” on page 2-49.
2. Load the sample plate into the system and select thePlate ID that corresponds to the plate:
• From the Sample Plate menu, select SelectSample Plate to display the Select Sample PlateType dialog box.
• Select a Plate ID. The .PLT file and alignmentinformation associated with the Plate ID areautomatically loaded.
Alternatively you can specify a new Plate ID andselect a .PLT file. For more information, see“Assigning Plate IDs” on page 3-50.
• Click OK.
Table 2-1 Four-Corner Positions on Sample Plates
.PLT fileFour Corner Position
Numbers
64 well disposable plate.PLT 82, 12, 19, 89
100 well plate.PLT 91, 11, 19, 99
384 well plate.PLT P1, C1, C21, P21
400 well plate.PLT T1, A1, A20, T20
96 well × 2 plate.PLT H1_b, A1_a, A12_a,H12_b
2-50 Applied Biosystems

Aligning the Sample Plate
2
Aligning To align the loaded plate:
1. Tape the transparency to the video monitor.
2. Select Align Sample Plate from the Sample Plate menu.
The Sample Plate Alignment wizard (Figure 2-25) isdisplayed.
Figure 2-25 Sample Plate Alignment Wizard
3. Click Next.
The sample plate moves to the first alignment positionon the sample plate. See Table 2-1, “Four-CornerPositions on Sample Plates,” on page 2-50, todetermine your plate positions.
4. Start the laser using the control stick.
NOTE: When aligning the sample plate, starting thelaser does not start acquisition.
Voyager™ Biospectrometry™ Workstation User’s Guide 2-51

Chapter 2 Installing the Voyager Biospectrometry Workstations
2
5. Mark the laser position on the transparency. Do not markthe sample position. Be sure the laser is centered on thevideo monitor and does not appear as shown inFigure 2-24 on page 2-48.
6. Center the sample position under the laser using thecontrol stick.
7. When the position is centered, click Next. The systemadvances to the next corner position for the .PLT type.
8. Repeat step 3 through step 7 for each of the four cornersof the sample plate.
The software calculates the alignment and uses thesettings to ensure all sample positions are centeredunder the laser. If the alignment is successful, amessage is displayed.
9. Do one of the following:
NOTE: A message is displayed if the alignment is outsidethe preferred tolerance. Repeat the alignment procedure byclicking Back. If the alignment is still outside of tolerance,call Applied Biosystems Technical Support.
Alignmentinformation saved
for future use
The alignment information is saved with the Plate ID, andapplied each time you load this Plate ID into the system. Formore information, see “How the system aligns a plate” onpage 2-47.
Click To
Finish Save the alignment for the specifiedPlate ID
Cancel End the Sample Plate procedurewithout saving the alignment for theplate
Back Repeat the alignment procedure
2-52 Applied Biosystems

Running OptiPlate to Optimize Mass Accuracy
2
2.8 Running OptiPlate toOptimize Mass Accuracy
This section includes:
• Overview• Requirements• Preparing to optimize• Running OptiPlate• Evaluating and saving results
2.8.1 Overview
What OptiPlatedoes
The OptiPlate software compensates for differences incalibration across a sample plate caused by variations in:
• Sample plate well depth
• Sample plate surface (flatness)
• Electric field in the source chamber of the massspectrometer
When you run the OptiPlate software, it:
• Calculates a correction factor (called ExtractionCorrection) that minimizes the differences in calibrationacross a sample plate caused by the factors listed above.
• Creates a mass accuracy optimization file that containsthe Extraction Correction for each optimized position onthe plate.
Voyager™ Biospectrometry™ Workstation User’s Guide 2-53

Chapter 2 Installing the Voyager Biospectrometry Workstations
2
Using theoptimization
created byOptiPlate
To use the optimization created by OptiPlate during sampleanalysis, select the Use Mass Accuracy Optimization optionwhen you load a sample plate in the Instrument Control Panel.The Mass Accuracy Optimization option allows you to usefewer standards and still obtain optimum mass accuracy.
For more information, see:
• Section 3.2.2, Locating Standards for Optimum MassAccuracy
• Section 3.4.2, Using the Mass Accuracy OptimizationOption
• Section 3.4.4, Loading Sample Plates
2-54 Applied Biosystems
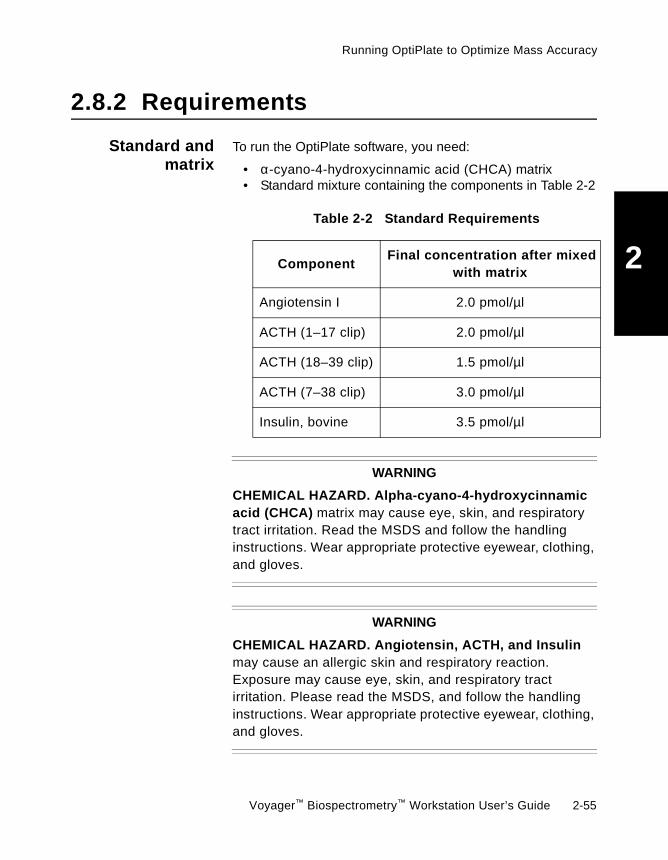
Running OptiPlate to Optimize Mass Accuracy
2
2.8.2 Requirements
Standard andmatrix
To run the OptiPlate software, you need:
• α-cyano-4-hydroxycinnamic acid (CHCA) matrix• Standard mixture containing the components in Table 2-2
WARNING
CHEMICAL HAZARD. Alpha-cyano-4-hydroxycinnamicacid (CHCA) matrix may cause eye, skin, and respiratorytract irritation. Read the MSDS and follow the handlinginstructions. Wear appropriate protective eyewear, clothing,and gloves.
WARNING
CHEMICAL HAZARD. Angiotensin, ACTH, and Insulinmay cause an allergic skin and respiratory reaction.Exposure may cause eye, skin, and respiratory tractirritation. Please read the MSDS, and follow the handlinginstructions. Wear appropriate protective eyewear, clothing,and gloves.
Table 2-2 Standard Requirements
ComponentFinal concentration after mixed
with matrix
Angiotensin I 2.0 pmol/µl
ACTH (1–17 clip) 2.0 pmol/µl
ACTH (18–39 clip) 1.5 pmol/µl
ACTH (7–38 clip) 3.0 pmol/µl
Insulin, bovine 3.5 pmol/µl
Voyager™ Biospectrometry™ Workstation User’s Guide 2-55

Chapter 2 Installing the Voyager Biospectrometry Workstations
2
NOTE: You can use Calibration Mixture 2 from theSequazyme™ Peptide Mass Standards Kit. SeeAppendix B.3, Spare Parts, for the Sequazyme Kit partnumber.
Prepare standards and matrix in 50:50 acetonitrile, 0.1% TFAin deionized water. For more information, see Section 3.1,Preparing Samples.
WARNING
CHEMICAL HAZARD. Acetonitrile is a flammable liquidand vapor. It may cause eye, skin, and respiratory tractirritation, central nervous system depression, and heart,liver, and kidney damage. Please read the MSDS, andfollow the handling instructions. Wear appropriateprotective eyewear, clothing, and gloves.
High-voltagewarmup
At least 30 minutes before you perform plate optimization, turnon high voltage by clicking in the Instrument ControlPanel toolbar. Allow the high voltage power supplies towarm up.
NOTE: By default, high voltage turns off after 60 minutes ifthe instrument is not used. You can change the default inHardware Configuration. See “High Voltage Configuration”on page 2-38.
The warm-up period allows maximum mass accuracy duringplate optimization by reducing variability in acceleratingvoltages, and yields more reproducible ion flight times.
2-56 Applied Biosystems

Running OptiPlate to Optimize Mass Accuracy
2
.PLT file To correctly display results in OptiPlate, use a .PLT file thatspecifies a maximum of 900 positions with either of thefollowing patterns (Figure 2-26):
• A grid with a maximum of 30 rows and 30 columns
• An offset grid with a maximum 15 rows and60 columns
Figure 2-26 Grid or Offset Grid Pattern in .PLT File
NOTE: All .PLT files provided with the system contain fewerthan 900 positions and specify a grid (see “.PLT filesprovided” on page 3-67). New .PLT files created usingCreate PLT File specify a grid (see “Creating a .PLT fileusing Create PLT File” on page 3-79).
If you use a .PLT file that does not meet these requirements,the position location and spacing displayed in the OptiPlatedialog box do not accurately reflect the position location andspacing specified by the .PLT file. However, you can stillobtain valid Extraction Corrections for the positions.
If you use a .PLT file that contains more than 900 positions, anerror message is displayed, and you cannot run OptiPlate.
maximum of 601 2 3 4 512345
maximum of 15
maximum of 301 2 3
1
2
3
maximum of 30
Grid Offset Grid
Voyager™ Biospectrometry™ Workstation User’s Guide 2-57

Chapter 2 Installing the Voyager Biospectrometry Workstations
2
2.8.3 Preparing to Optimize
This section includes:
• Preparing the plate to optimize• Preparing the system• Verifying laser intensity
Preparing theplate to optimize WARNING
CHEMICAL HAZARD. Angiotensin, ACTH, and Insulinmay cause an allergic skin and respiratory reaction.Exposure may cause eye, skin, and respiratory tractirritation. Please read the MSDS, and follow the handlinginstructions. Wear appropriate protective eyewear, clothing,and gloves.
WARNING
CHEMICAL HAZARD. Alpha-cyano-4-hydroxycinnamicacid (CHCA) may cause eye, skin, and respiratory tractirritation. Please read the MSDS, and follow the handlinginstructions. Wear appropriate protective eyewear, clothing,and gloves.
2-58 Applied Biosystems

Running OptiPlate to Optimize Mass Accuracy
2
To prepare the plate:
1. Spot the sample plate with the standard mixture andmatrix prepared in the previous section. Follow theprocedure in Section 3.2.3, Loading Samples(Dried Droplet Application).
Spot a minimum of 15 positions on a plate. For bestresults, spot the number of positions indicated below forthe plate type you are optimizing.
2. Spot one position as the reference position with thestandard mixture and matrix. For best results, select aposition in the center of the plate, for example, position 55or 56 on a 100-well plate.
NOTE: During the optimization procedure, the systemautomatically reanalyzes this position to maintain anaccurate calibration. A position in the middle of theplate minimizes the distance the plate must travel toreanalyze the reference position.
3. Allow the sample plate to dry.
Plate Number of Positions to Spot
100-well 100 positions
400-well 100 positions (every fourth row) andall perimeter positions
96 × 2-well 96—Spot either A or B rows and allperimeter positions
Voyager™ Biospectrometry™ Workstation User’s Guide 2-59

Chapter 2 Installing the Voyager Biospectrometry Workstations
2
Preparing thesystem
To prepare the system:
1. Assign a Plate ID if you have not already assigned onefor the plate. For information, see “Assigning Plate IDs”on page 3-50.
2. Load the plate into the mass spectrometer as described inSection 3.4, Loading Sample Plates in the MassSpectrometer.
Verifying laserintensity
Two instrument settings (.BIC) files are provided for use withOptiPlate:
• OptiPlate_Linear.BIC• OptiPlate_Reflector.BIC
These files are set with values that have been optimized foryour system and contain the following acceptance criteria toensure best results when you run OptiPlate:
Parameter Setting
MinimumSignal Intensity
20,000
MaximumSignal Intensity
60,000
StopConditions
Stop after 8 consecutive failingacquisitions
CriteriaEvaluationMass Range
• Linear mode—1,000 to 6,000 Da• Reflector mode—1,000 to
3,000 Da
2-60 Applied Biosystems
Running OptiPlate to Optimize Mass Accuracy
2
Before running OptiPlate, you need to:
• Determine the laser intensity that yields a signal intensitybetween 20,000 and 60,000 counts (see below).
• Set the Minimum and Maximum Laser Intensity settingsin Automatic Control to ±50 of the laser intensity thatyields signal intensity between 20,000 and 60,000 counts(see below).
Determining thelaser intensity
Due to variations in sample preparation and crystallization, itmay be necessary to determine the laser intensity each timeyou run OptiPlate.
To determine the laser intensity that yields a signal intensitybetween 20,000 and 60,000 counts:
1. In the Instrument Control Panel, load theOptiPlate_Linear.BIC or OptiPlate_Reflector.BIC fileprovided on your system.
2. In the Instrument Settings page, change Control Modefrom Automatic to Manual.
3. Select a position spotted with standard mixture andmatrix from the sample plate you spotted in “Preparingthe plate to optimize” on page 2-58.
4. Start acquisition, move around on the sample positionuntil you observe an acceptable signal, then adjust thelaser intensity until signal intensity is between 20,000 and60,000 counts.
5. Move around to several other locations on the sampleposition to verify that the selected laser intensity yieldssignal in the correct range.
6. Stop acquisition.
Setting Minimumand Maximum
Laser Intensity
To set the Minimum and Maximum Laser Intensity settings inAutomatic Control:
1. In the Instrument Settings page, change Control Modefrom Manual to Automatic.
2. Click Automatic Control.
Voyager™ Biospectrometry™ Workstation User’s Guide 2-61

Chapter 2 Installing the Voyager Biospectrometry Workstations
2
3. In the Automatic Control dialog box, set the Minimum andMaximum Laser Intensity settings to ±50 of the laserintensity that yields signal intensity between 20,000 and60,000 counts.
The recommended ±50 setting is intended to keep thelaser intensity range as narrow as possible, to allowOptiPlate to run as quickly as possible. However, if thelaser intensity range is too narrow, it may not yield signalintensity in the specified range, which will cause OptiPlateto fail. If you observe failures during the OptiPlate run, youmay need to increase the laser intensity range.
4. Click OK.
5. From the File menu, select Save Instrument Setting As,then name the file OptiPlate_Linear1.BIC orOptiPlate_Reflector1.BIC.
NOTE: Save the .BIC file before selecting it inOptiPlate. If you make changes to the .BIC file after youselect it in OptiPlate, OptiPlate does not recognize thechanges.
2-62 Applied Biosystems
Running OptiPlate to Optimize Mass Accuracy
2
2.8.4 Running OptiPlate
This section includes:
• Running OptiPlate• During an OptiPlate run
RunningOptiPlate
To run OptiPlate:
1. In the Instrument Control Panel, select OptiPlate fromthe Tools menu to display the OptiPlate dialog box(Figure 2-27 on page 2-64).
By default, the Plate ID for the plate loaded in the massspectrometer is specified in the OptiPlate software. Ifthere are OptiPlate results associated with the selectedPlate ID, color-coded well positions are displayed. Formore information, see “Color coding” on page 2-69.
If Use Mass Accuracy Optimizations was selected whenyou loaded the specified Plate ID, a message boxindicates that this function is disabled for the OptiPlaterun.
NOTE: For optimum display of results, make sure thecolor palette on your computer is set to more than256 colors. To check, select Settings from the Startmenu, select Control Panel, select Display, then clickSettings.
If you change the Plate ID in the OptiPlate dialog box,make sure the correct physical plate is loaded in themass spectrometer before you continue.
Voyager™ Biospectrometry™ Workstation User’s Guide 2-63

Chapter 2 Installing the Voyager Biospectrometry Workstations
2
Figure 2-27 OptiPlate Dialog Box
2. In the Instrument Settings (.BIC) field, select theOptiPlate_Linear1.BIC or OptiPlate_Reflector1.BICin which you set laser intensities that yield signal intensitybetween 20,000 and 60,000 counts (described in“Verifying laser intensity” on page 2-60).
NOTE: It is good practice to determine the laserintensity that yields acceptable signal intensity beforerunning OptiPlate. Due to variations in samplepreparation and crystallization, it may be necessary todetermine the laser intensity each time you runOptiPlate.
2-64 Applied Biosystems

Running OptiPlate to Optimize Mass Accuracy
2
Setting datastorage
3. Click next to the Data File Path and Root Name field.Specify the directory in which to store the data filescollected by this procedure, then type the base name touse for the data files. Click Open.
Data file names are automatically numbered(autosequenced) when they are acquired.
Setting referenceposition
4. Under Acquisition Pattern, select the position of thereference position you spotted in step 2 in “Preparing theplate to optimize” on page 2-58.
The reference position is indicated with a black dot inthe center of the position.
Selecting positionsto optimize
5. Under Acquisition Pattern, select Include All Positionsor Include Selected Positions to specify the positions tooptimize.
6. If you select the Include Selected Positions option, clickSelect Pattern, then specify the sample positions tooptimize:
To specify Do the following
Individualpositions
Click on a single position.
Multiplepositions
• Click-drag positions or
• Press Shift and click a position toturn on multi select mode, then dragpositions (click again to turn offmulti select mode)
Evenlydistributednumber ofpositions
Select a Fill Increment, then click Fill.For example, select 2 as the fillincrement to fill every other position inevery other row.
Voyager™ Biospectrometry™ Workstation User’s Guide 2-65
Chapter 2 Installing the Voyager Biospectrometry Workstations
2
NOTE: If you change the reference position after youspecify the Acquisition Pattern using Select Pattern, theoriginal reference position is no longer selected foracquisition. You must manually select the position if youwant to acquire it. For example, if you select position 44as the reference position and select positions 43 and 45for acquisition, then change the reference position toposition 42, position 44 is not automatically selected foracquisition.
Setting acquisitionmode
7. Under Data Acquisition, select:
• New Data—To create a new optimization file for aplate that has not been optimized, or to reoptimizea plate.
• Append Data—To do either of the following:
Optimize additional positions on a plate that hasbeen optimized, and add the correctioninformation to the existing optimization file.
Replace existing correction factors for positionsyou select.
Positions selected for optimization are indicated with awhite dot in the center of the position.
Starting acquisition 8. Click Start Acquisition.
Acquisition starts in the Instrument Control Panel.Acquisition and processing status are displayed at thebottom of the OptiPlate screen for each position as it isacquired.
The Data Acquisition mode is automatically set toAppend Data when you start acquisition.
2-66 Applied Biosystems

Running OptiPlate to Optimize Mass Accuracy
2
During anOptiPlate run
During an OptiPlate run, the software:
• Acquires a spectrum at the Reference position.
• Internally calibrates the reference spectrum usingmonoisotopic masses in Reflector mode or averagemasses in Linear mode.
• Acquires a spectrum at each specified position andapplies the reference calibration to the data.
• Calculates and displays the Average Error (ppm) for theposition (compares the observed masses to the observedreference masses, then determines the average erroracross all expected peak masses for the componentslisted in Table 2-2, “Standard Requirements,” onpage 2-55).
• Calculates and displays the Extraction Correction (mm)for the position by performing a least-squares fit of thedata.
• Displays a color code for each position (see “Colorcoding” on page 2-69), and saves the data file for theposition.
• Reacquires the reference spectrum every 3 minutes andupdates the calibration to adjust for instrument drift overtime.
Voyager™ Biospectrometry™ Workstation User’s Guide 2-67

Chapter 2 Installing the Voyager Biospectrometry Workstations
2
If acquisition failsor peaks are not
found
The OptiPlate software may analyze a position more than onetime as described below.
Pausing andresuming the
plate optimization
To stop the OptiPlate run for any reason (for example, younotice that many positions display a black edge indicating theyhave failed optimization, or you realize that you did not savechanges to the .BIC file):
1. Click Stop Acquisition.
2. Wait for acquisition to stop in the Instrument ControlPanel.
3. If necessary, eject the sample plate and spot or respotpositions, or modify then save instrument settings.
4. Allow the sample plate to dry, if necessary.
5. Load the sample plate, if necessary.
If The software
Acquisition fails inReference ornon-referenceposition
Continues acquiring until the numberof consecutive failing acquisitions setin Stop Conditions is met (seepage 2-60).
Expected massesnot found inreference position
Reacquires the reference positionuntil a second successful acquisitionoccurs, then checks for presence ofexpected peaks. If no peaks arefound, the OptiPlate run stops.
Expected massesnot found innon-referenceposition
Does not calculate ExtractionCorrection. Marks position withand continues the OptiPlaterun.
2-68 Applied Biosystems
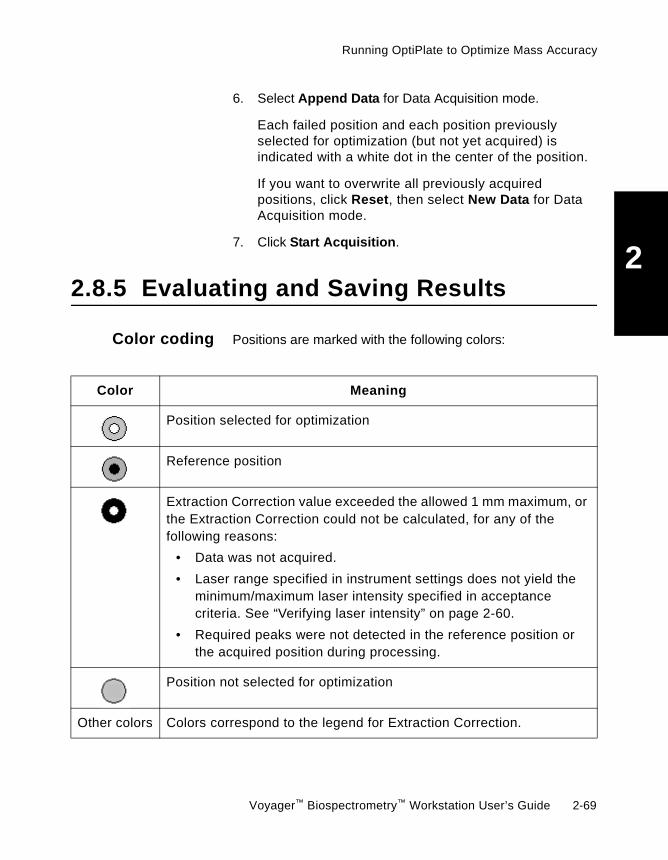
Running OptiPlate to Optimize Mass Accuracy
2
6. Select Append Data for Data Acquisition mode.
Each failed position and each position previouslyselected for optimization (but not yet acquired) isindicated with a white dot in the center of the position.
If you want to overwrite all previously acquiredpositions, click Reset, then select New Data for DataAcquisition mode.
7. Click Start Acquisition.
2.8.5 Evaluating and Saving Results
Color coding Positions are marked with the following colors:
Color Meaning
Position selected for optimization
Reference position
Extraction Correction value exceeded the allowed 1 mm maximum, orthe Extraction Correction could not be calculated, for any of thefollowing reasons:
• Data was not acquired.
• Laser range specified in instrument settings does not yield theminimum/maximum laser intensity specified in acceptancecriteria. See “Verifying laser intensity” on page 2-60.
• Required peaks were not detected in the reference position orthe acquired position during processing.
Position not selected for optimization
Other colors Colors correspond to the legend for Extraction Correction.
Voyager™ Biospectrometry™ Workstation User’s Guide 2-69
Chapter 2 Installing the Voyager Biospectrometry Workstations
2
NOTE: If the reference position is located in the center ofthe plate, most corrections tend to be negative values. Donot expect to see all colors in the color legend representedin position results.
Evaluating results Examine colors to ensure:
• No positions display a black edge, indicating a problemwith optimization
• The reference position corresponds to the color legend atposition 0.00
• Colors of positions change evenly and gradually withincreasing distance from the reference position
Saving When acquisition of all positions is complete and you haveexamined results, click Save.
The optimization file is assigned the same name as thePlate ID, given an OPT_ prefix and an .XML extension, andstored in the same directory as the .PLT file.
For example, if you run OptiPlate for a “Lab1” Plate ID, anoptimization file called OPT_Lab1.XML is created.
Do not delete or move the .XML files. These files areautomatically accessed by the software when you select theOptimize Mass Accuracy option when loading a sample plate.
Deleting data files After performing plate optimization and saving the optimizationfile, you can delete the data files created during thisprocedure. OptiPlate results are associated with the .XML filethat was created (described above), not with data files. Datafiles are no longer needed, even if you append to an existingoptimization file.
2-70 Applied Biosystems

Resetting the Optional External Laser
2
2.9 Resetting theOptional External Laser
When to reset Reset the external laser when you switch from the internal tothe external laser (when you save or load a .BIC file with theexternal laser specified, or run a sequence that contains.BIC files with the external laser specified.)
Resetting To reset:
1. Click OK in the message dialog box instructing you toreset the external laser.
2. On the left side of the external laser cabinet (Figure 2-28),turn the key (located next to the Keyswitch Reset LED)from the On position (right) to the Off position (left), then tothe On position (right).
Figure 2-28 Left Side of External Laser Cabinet
The Laser On LED flashes then remains on.
The light on the Stop button is illuminated.
3. Press the Start button. The light on the Stop button goesoff, and the light on the Start button flashes then goes off.
The laser is now powered on and ready for acquisition.
Stop Start
AC Power On
Laser On
Keyswitch Reset
Interlock
Off Position
On Position
Key
Voyager™ Biospectrometry™ Workstation User’s Guide 2-71

Chapter 2 Installing the Voyager Biospectrometry Workstations
2
Problem withexternal laser
positioning overtime
If the external laser is left on for more than 15 minutes, theposition at which the laser strikes the sample may drift. If thisoccurs, press the Stop button on the left side of the externallaser cabinet to reset the laser. Then press the Start button toreset the laser.
CAUTION
If you do not press the Start button after pressing the Stopbutton, no power is supplied to the laser. The software willallow you to start acquisition, but the laser will not fire. If thelaser is left on for long periods of time, there may be aproblem with laser positioning on the sample. If this occurs,press the Stop button then the Start button to reset thelaser.
2-72 Applied Biosystems

Startup and Shutdown
2
2.10 Startup and Shutdown
In this section This section describes:
• Powering up• Initializing• Reinitializing• Powering down system components• Powering down the mass spectrometer
Powering up To power up the Voyager Workstation:
1. Turn on the main power switch. The power switch islocated:
• On the right side panel of the mass spectrometercabinet on Voyager-DE and Voyager-DE PROsystems.
• On the back panel of the mass spectrometercabinet on the Voyager-DE STR system.
The vacuum pumping system begins running.
After two minutes, the turbo pump starts. You will hear awhine as the vacuum system spins up to speed.
2. Turn on remaining system devices in this order:
• Video monitor• External digitizer, if your system includes one• Oscilloscope, if your system includes one• Computer• Printer
3. If your system includes an oscilloscope, waitapproximately one minute for its initialization cycle tofinish. A message indicates that the power on self checkpassed, then the oscilloscope screen is displayed. Seethe Appendix I, Using the Oscilloscope and Control Stick,for more information.
Voyager™ Biospectrometry™ Workstation User’s Guide 2-73

Chapter 2 Installing the Voyager Biospectrometry Workstations
2
If your system includes a LeCroy digitizer, waitapproximately one minute until the digitizer completesits internal calibration before starting the InstrumentControl Panel.
4. Log on to the Voyager Workstation using your User Nameand Password. See your system administrator for yourUser name and Password.
5. Start the Voyager Instrument Control Panel software bydouble-clicking the Voyager Instrument Control icon onthe Windows NT desktop.
Initializing The hardware is automatically initialized when you start thesoftware.
During initialization, the video image on the sample stage isdisplayed. The sample stage moves to the home position, andthen to the load position. If problems occur, an error messageis displayed when you log on to the workstation. Furtherdetails on any problem can be obtained by viewing theWindows NT Event Log. For more information, see “Checkingthe Windows NT Event Log” on page 9-22.
Reinitializing To reinitialize the hardware:
1. Open the Instrument Control Panel.
2. From the Instrument menu, select Reinitialize. Thesoftware resets all system components and sets upcommunication between the computer and workstation.
2-74 Applied Biosystems

Startup and Shutdown
2
Powering downsystem
components
Leave the Voyager mass spectrometer powered up unless:
• You need to perform maintenance on internal parts• You need to move the system
To power down:
Software andcomputershutdown
1. Close the Instrument Control Panel by selecting Exitfrom the File menu.
2. On the Windows desktop start task bar, click Start, thenclick Shut down. In the Shut Down Windows dialog box,click Shut down the computer and click Yes. Hardware isreinitialized.
NOTE: If you select Close all programs and log on asa different user, hardware is not reinitialized.
3. Power down all other system components (oscilloscope ordigitizer, monitor, and so on).
Wait until a message is displayed indicating that youcan shut down your computer. Power down thecomputer and computer monitor.
Powering downthe mass
spectrometer
If you need to perform maintenance on internal parts or movethe system, power down the spectrometer:
1. Power down the system components.
2. Turn off the main power switch. The power switch islocated:
• On the right side panel of the mass spectrometercabinet on Voyager-DE and Voyager-DE PROsystems.
• On the back panel of the mass spectrometercabinet on the Voyager-DE STR system.
Voyager™ Biospectrometry™ Workstation User’s Guide 2-75

Chapter 2 Installing the Voyager Biospectrometry Workstations
2
2.11 Checking System Statusand Pressures
Display the System Status page for complete statusinformation.
In the Instrument Control Panel, select System Status fromthe View menu to display the System Status page(Figure 2-29).
Figure 2-29 System Status Control Page
System and acquisition status are represented by coloredindicators and read-only text fields described in Table 2-3.Colors represent:
• Green—OK• Yellow—Fault• Gray—Off
System pressures Before acquiring data, allow the pressure in the SourceChamber (BA1) and Mirror Chamber (BA2) to reach:
ModelSource Chamber (BA1)
Pressure (Torr)Mirror Chamber
(BA2) Pressure (Torr)
Voyager-DE andVoyager-DE PRO
Less than 10–6 Less than 10–6
Voyager-DE STR Less than 5×10⁻⁷ Less than 5 ×10⁻⁸
2-76 Applied Biosystems
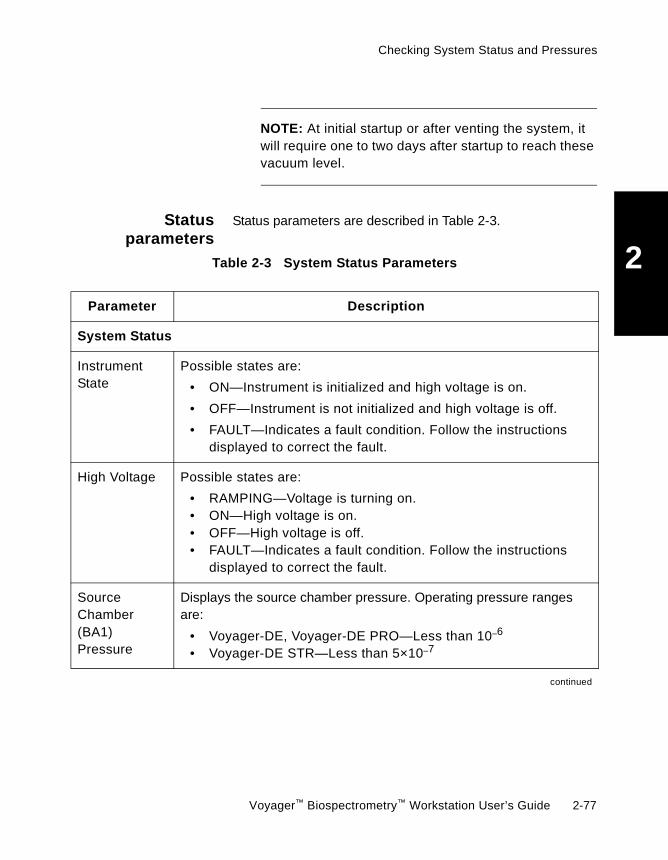
Checking System Status and Pressures
2
NOTE: At initial startup or after venting the system, itwill require one to two days after startup to reach thesevacuum level.
Statusparameters
Status parameters are described in Table 2-3.
Table 2-3 System Status Parameters
Parameter Description
System Status
InstrumentState
Possible states are:
• ON—Instrument is initialized and high voltage is on.
• OFF—Instrument is not initialized and high voltage is off.
• FAULT—Indicates a fault condition. Follow the instructionsdisplayed to correct the fault.
High Voltage Possible states are:
• RAMPING—Voltage is turning on.• ON—High voltage is on.• OFF—High voltage is off.• FAULT—Indicates a fault condition. Follow the instructions
displayed to correct the fault.
SourceChamber(BA1)Pressure
Displays the source chamber pressure. Operating pressure rangesare:
• Voyager-DE, Voyager-DE PRO—Less than 10–6
• Voyager-DE STR—Less than 5×10⁻⁷
continued
Voyager™ Biospectrometry™ Workstation User’s Guide 2-77

Chapter 2 Installing the Voyager Biospectrometry Workstations
2
MirrorChamber(BA2)Pressure
Displays the mirror chamber pressure. Mirror chamber pressureranges are:
• Voyager-DE PRO—Less than 5×10⁻⁷
• Voyager-DE STR—Less than 5×10⁻⁸
NOTE: This status field is not displayed on Voyager-DE systems.
Acquisition Displays acquisition status:
• ON—Instrument is currently acquiring a spectrum.• OFF—Instrument is not acquiring.
Data Storage Displays data storage status:
• ON—Software is currently storing a data file.• OFF—Software is currently not storing a data file.
Table 2-3 System Status Parameters (Continued)
Parameter Description
2-78 Applied Biosystems

3Chapter
3 Preparing Samples
This chapter contains the following sections:3.1 Preparing Samples ......................................... 3-2
3.1.1 Selecting a Matrix ............................3-3
3.1.2 Preparing Matrix ..............................3-4
3.1.3 Matrix Information ............................3-6
3.1.4 Preparing Sample ..........................3-22
3.1.5 Sample Cleanup ............................3-25
3.1.6 Mixing Sample and Matrix(Dried Droplet Application) .............3-33
3.2 Loading Samples on Sample Plates............... 3-35
3.3 Cleaning Sample Plates................................. 3-47
3.4 Loading Sample Plates in theMass Spectrometer........................................ 3-50
3.5 Sample Plate Types ....................................... 3-61
Voyager™ Biospectrometry™ Workstation User’s Guide 3-1
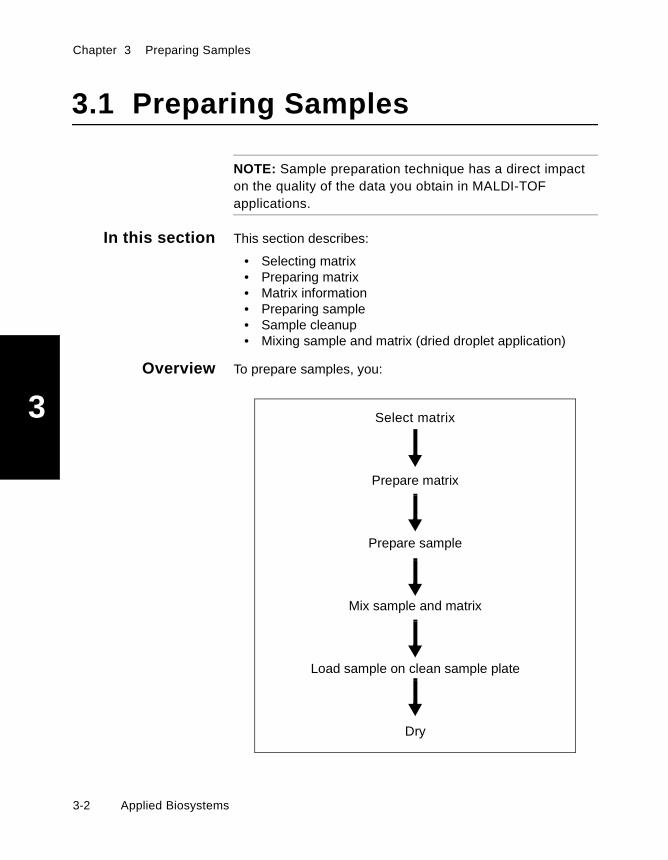
Chapter 3 Preparing Samples
3
3.1 Preparing Samples
NOTE: Sample preparation technique has a direct impacton the quality of the data you obtain in MALDI-TOFapplications.
In this section This section describes:
• Selecting matrix• Preparing matrix• Matrix information• Preparing sample• Sample cleanup• Mixing sample and matrix (dried droplet application)
Overview To prepare samples, you:
Select matrix
Prepare matrix
Prepare sample
Mix sample and matrix
Load sample on clean sample plate
Dry
3-2 Applied Biosystems
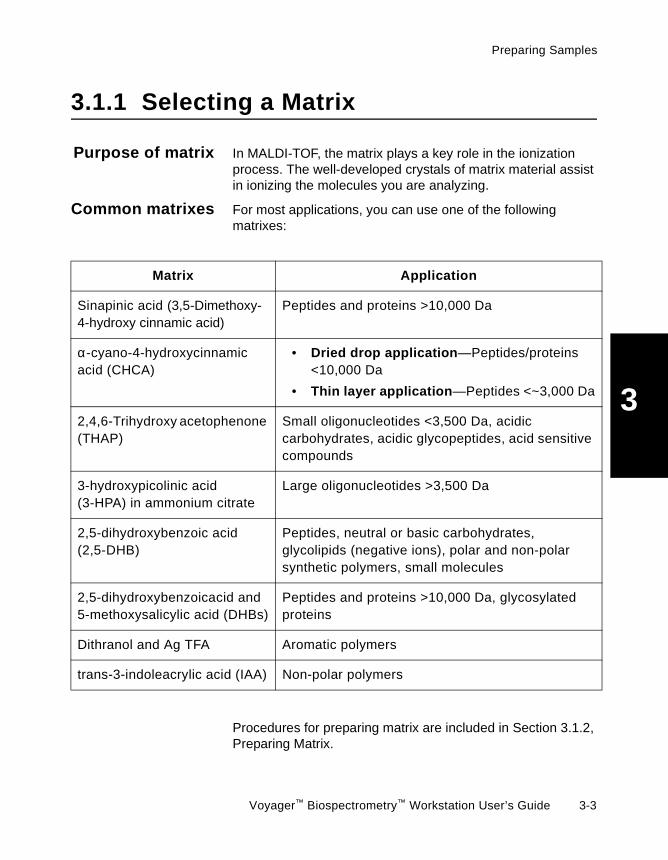
Preparing Samples
3
3.1.1 Selecting a Matrix
Purpose of matrix In MALDI-TOF, the matrix plays a key role in the ionizationprocess. The well-developed crystals of matrix material assistin ionizing the molecules you are analyzing.
Common matrixes For most applications, you can use one of the followingmatrixes:
Procedures for preparing matrix are included in Section 3.1.2,Preparing Matrix.
Matrix Application
Sinapinic acid (3,5-Dimethoxy-4-hydroxy cinnamic acid)
Peptides and proteins >10,000 Da
α-cyano-4-hydroxycinnamicacid (CHCA)
• Dried drop application—Peptides/proteins<10,000 Da
• Thin layer application—Peptides <~3,000 Da
2,4,6-Trihydroxy acetophenone(THAP)
Small oligonucleotides <3,500 Da, acidiccarbohydrates, acidic glycopeptides, acid sensitivecompounds
3-hydroxypicolinic acid(3-HPA) in ammonium citrate
Large oligonucleotides >3,500 Da
2,5-dihydroxybenzoic acid(2,5-DHB)
Peptides, neutral or basic carbohydrates,glycolipids (negative ions), polar and non-polarsynthetic polymers, small molecules
2,5-dihydroxybenzoicacid and5-methoxysalicylic acid (DHBs)
Peptides and proteins >10,000 Da, glycosylatedproteins
Dithranol and Ag TFA Aromatic polymers
trans-3-indoleacrylic acid (IAA) Non-polar polymers
Voyager™ Biospectrometry™ Workstation User’s Guide 3-3
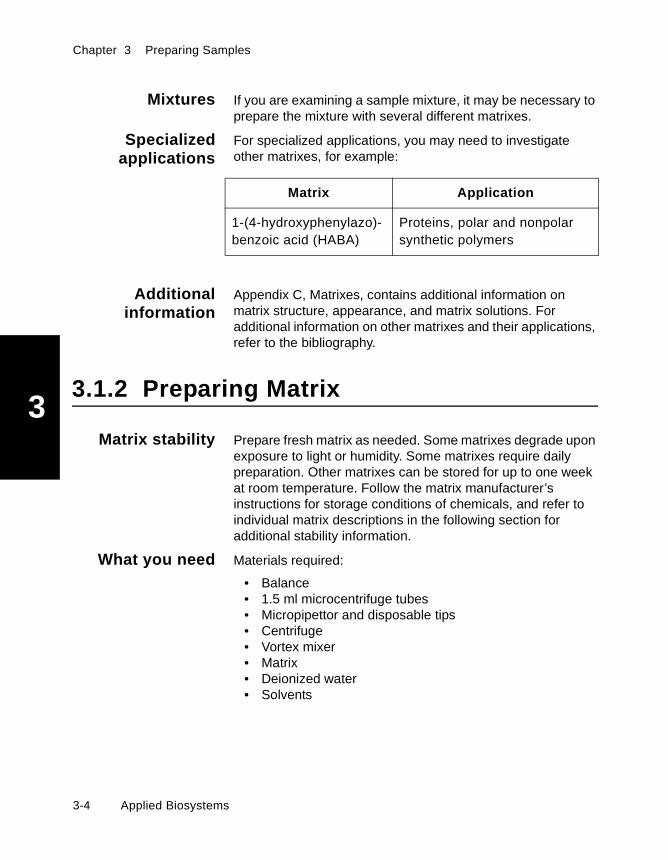
Chapter 3 Preparing Samples
3
Mixtures If you are examining a sample mixture, it may be necessary toprepare the mixture with several different matrixes.
Specializedapplications
For specialized applications, you may need to investigateother matrixes, for example:
Additionalinformation
Appendix C, Matrixes, contains additional information onmatrix structure, appearance, and matrix solutions. Foradditional information on other matrixes and their applications,refer to the bibliography.
3.1.2 Preparing Matrix
Matrix stability Prepare fresh matrix as needed. Some matrixes degrade uponexposure to light or humidity. Some matrixes require dailypreparation. Other matrixes can be stored for up to one weekat room temperature. Follow the matrix manufacturer’sinstructions for storage conditions of chemicals, and refer toindividual matrix descriptions in the following section foradditional stability information.
What you need Materials required:
• Balance• 1.5 ml microcentrifuge tubes• Micropipettor and disposable tips• Centrifuge• Vortex mixer• Matrix• Deionized water• Solvents
Matrix Application
1-(4-hydroxyphenylazo)-benzoic acid (HABA)
Proteins, polar and nonpolarsynthetic polymers
3-4 Applied Biosystems
Preparing Samples
3
NOTE: HPLC-grade water may vary in salt concentrationand may produce adduct ions in mass spectra. A high saltconcentration may interfere with some applications,particularly oligonucleotide analysis. Use double-deionizedwater, such as Milli-Q™ grade 18 mΩ, which is appropriatefor most applications.
WARNING
CHEMICAL HAZARD. Refer to the Material Safety DataSheet (MSDS) provided by the chemical manufacturerbefore handling solvents or matrixes.
Preparing matrix To prepare matrix:
1. Label a 1.5 ml microcentrifuge tube with the name of thematrix, the final concentration, and the date prepared.
2. Before weighing out the matrix, zero the balance with thelabeled tube.
3. Weigh out the matrix into the tube. See “MatrixInformation” on page 3-6 to determine the properconcentration for your matrix.
NOTE: It is not necessary to weigh out the exactamount of matrix. You can record the weight of thematrix and adjust the final concentration accordingly.
NOTE: Use a fresh tip each time you pipette a differentsubstance.
4. Add a volume of appropriate solvent to achieve theneeded concentration for your matrix. See “MatrixInformation” on page 3-6. The solvent should be misciblewith the sample.
Voyager™ Biospectrometry™ Workstation User’s Guide 3-5

Chapter 3 Preparing Samples
3
5. Cap the tube and vortex thoroughly for approximately1 minute or until dissolved. You can shake the tube byhand if you do not have a vortex mixer.
6. Microcentrifuge the tube for 30 seconds at2,000 to 5,000 rpm. Alternatively, allow the solution tosettle for about 10 minutes. You may see a precipitate atthe bottom of the tube.
When applying matrix, use the supernatant, not theprecipitate.
3.1.3 Matrix Information
Refer to the tables on the following pages to determine therequirements for the matrix you are using. This sectionincludes information for:
• Sinapinic acid• α-cyano-4-hydroxycinnamic acid (CHCA)• THAP• 3-HPA• DHB• DHBs• Synthetic polymer matrixes
WARNING
CHEMICAL HAZARD. Refer to the Material Safety DataSheet (MSDS) provided by the chemical manufacturerbefore handling solvents or matrixes.
3-6 Applied Biosystems

Preparing Samples
3
Sinapinic acid Use sinapinic acid for peptides and proteins >10,000 Da.
WARNING
CHEMICAL HAZARD. Please read the MSDS beforehandling any chemical mentioned below, and follow thehandling instructions. Wear appropriate protective eyewear,clothing, and gloves.Sinapinic acid may cause eye, skin, and respiratory tractirritation.Acetonitrile is a flammable liquid and vapor. It may causeeye, skin, and respiratory tract irritation, central nervoussystem depression, and heart, liver, and kidney damage.Trifluoroacetic acid causes severe burns to the eyes, skin,and respiratory tract.
Table 3-1 Sinapinic Acid Matrix Information
Matrix concentration 10 mg/ml
Final sample concentration 0.1–5 pmol/µl
Solvents Acetonitrile, 0.1% TFA in deionized water
Preparation Follow the procedure in “Preparing matrix” onpage 3-5 and combine 700 µl of 0.1% TFA solutionin water, and 300 µl acetonitrile to 10 mg of solidmatrix.
If sample is contaminated with buffer, salt, ordetergent, instead of the proportions listed above,combine 500 µl 0.1% TFA and 500 µl acetonitrile.
Air dry sample plate after loading sample and matrix.
continued
Voyager™ Biospectrometry™ Workstation User’s Guide 3-7
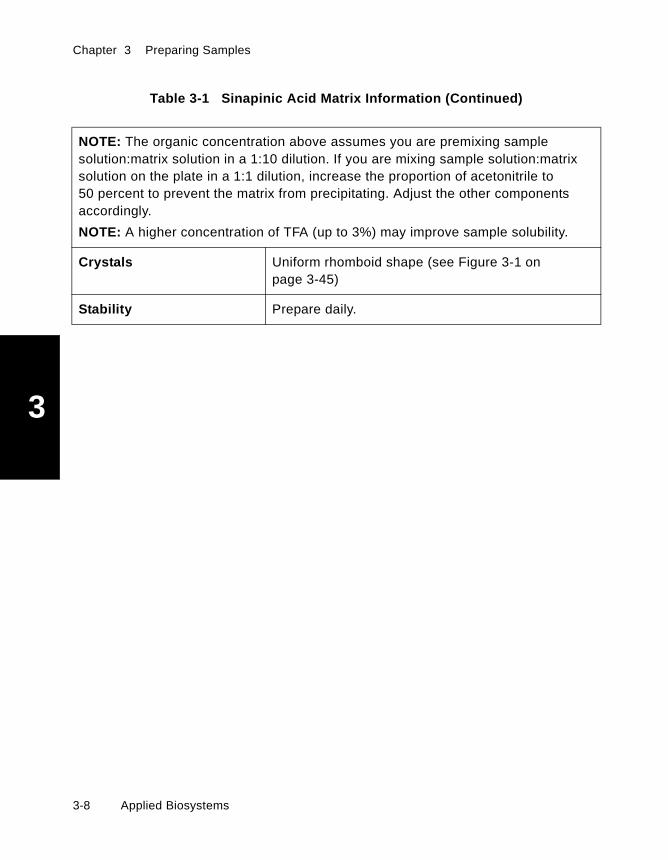
Chapter 3 Preparing Samples
3
NOTE: The organic concentration above assumes you are premixing samplesolution:matrix solution in a 1:10 dilution. If you are mixing sample solution:matrixsolution on the plate in a 1:1 dilution, increase the proportion of acetonitrile to50 percent to prevent the matrix from precipitating. Adjust the other componentsaccordingly.
NOTE: A higher concentration of TFA (up to 3%) may improve sample solubility.
Crystals Uniform rhomboid shape (see Figure 3-1 onpage 3-45)
Stability Prepare daily.
Table 3-1 Sinapinic Acid Matrix Information (Continued)
3-8 Applied Biosystems

Preparing Samples
3
CHCA Use α-cyano-4-hydroxycinnamic acid (CHCA) for:
• Dried drop application—Peptides/proteins <10,000 Da• Thin layer application—Peptides <~3,000 Da1
CHCA for drieddroplet application
Use for peptides/proteins <10,000 Da.
WARNING
CHEMICAL HAZARD. Please read the MSDS beforehandling any chemical mentioned below, and follow thehandling instructions. Wear appropriate protective eyewear,clothing, and gloves.Alpha-cyano-4-hydroxycinnamic acid (CHCA) maycause eye, skin, and respiratory tract irritation.Acetonitrile is a flammable liquid and vapor. It may causeeye, skin, and respiratory tract irritation, central nervoussystem depression, and heart, liver, and kidney damage.Trifluoroacetic acid causes severe burns to the eyes, skin,and respiratory tract.
Table 3-2 CHCA Matrix Information for Dried Droplet Application
Matrix concentration 10 mg/ml
Final sample concentration 0.1–5 pmol/µl
Solvents Acetonitrile, 0.1% TFA in deionized water
Preparation Follow the procedure in “Preparing matrix” onpage 3-5 and combine one part 0.1% TFA solutionwith one part acetonitrile. Dissolve the matrix at aconcentration of 10 mg/ml (for example, add 500 µl0.1% TFA solution and 500 µl acetonitrile to 10 mgof solid matrix).
Air dry sample plate after loading sample and matrix,or use gentle air flow to speed drying.
continued
Voyager™ Biospectrometry™ Workstation User’s Guide 3-9
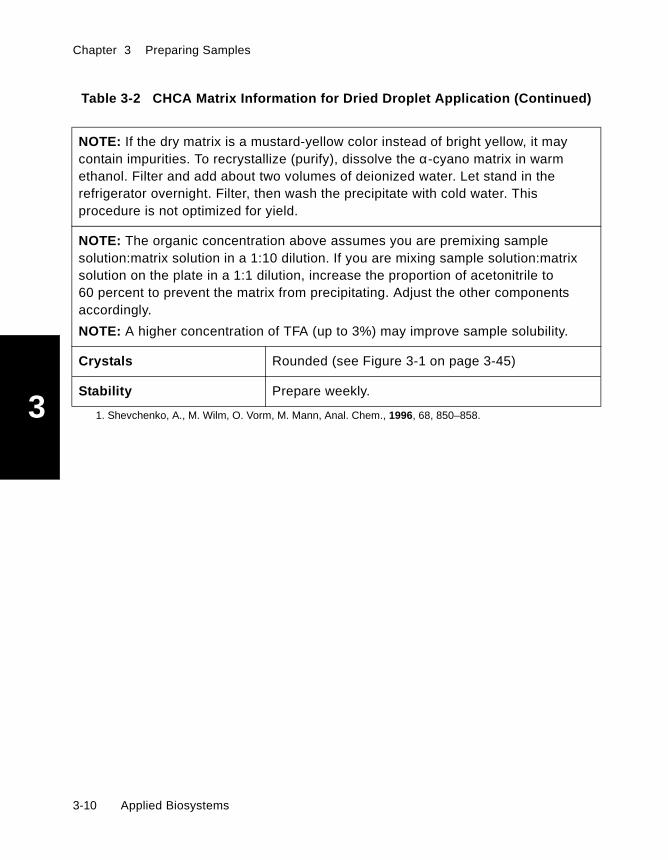
Chapter 3 Preparing Samples
3
NOTE: If the dry matrix is a mustard-yellow color instead of bright yellow, it maycontain impurities. To recrystallize (purify), dissolve the α-cyano matrix in warmethanol. Filter and add about two volumes of deionized water. Let stand in therefrigerator overnight. Filter, then wash the precipitate with cold water. Thisprocedure is not optimized for yield.
NOTE: The organic concentration above assumes you are premixing samplesolution:matrix solution in a 1:10 dilution. If you are mixing sample solution:matrixsolution on the plate in a 1:1 dilution, increase the proportion of acetonitrile to60 percent to prevent the matrix from precipitating. Adjust the other componentsaccordingly.
NOTE: A higher concentration of TFA (up to 3%) may improve sample solubility.
Crystals Rounded (see Figure 3-1 on page 3-45)
Stability Prepare weekly.
1. Shevchenko, A., M. Wilm, O. Vorm, M. Mann, Anal. Chem., 1996, 68, 850–858.
Table 3-2 CHCA Matrix Information for Dried Droplet Application (Continued)
3-10 Applied Biosystems
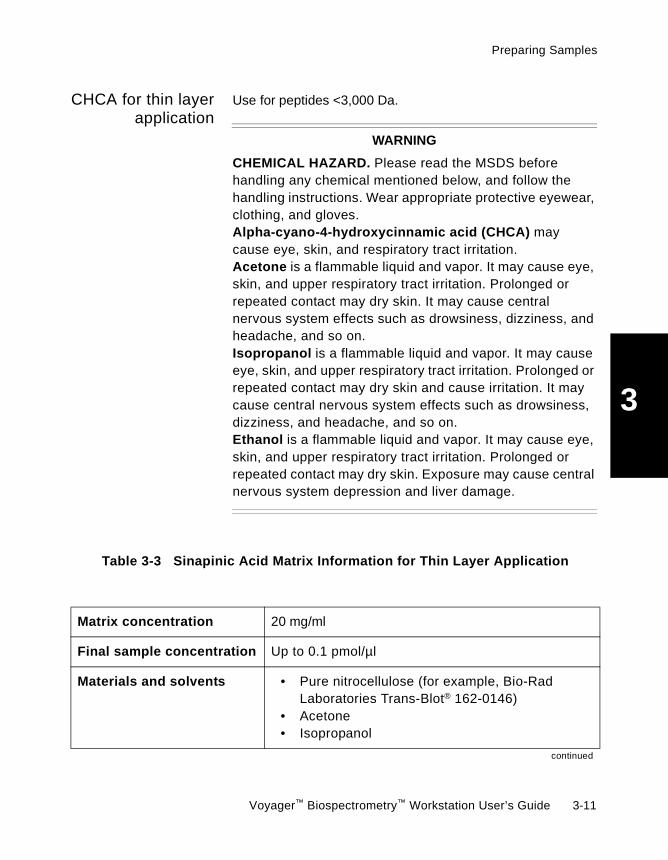
Preparing Samples
3
CHCA for thin layerapplication
Use for peptides <3,000 Da.
WARNING
CHEMICAL HAZARD. Please read the MSDS beforehandling any chemical mentioned below, and follow thehandling instructions. Wear appropriate protective eyewear,clothing, and gloves.Alpha-cyano-4-hydroxycinnamic acid (CHCA) maycause eye, skin, and respiratory tract irritation.Acetone is a flammable liquid and vapor. It may cause eye,skin, and upper respiratory tract irritation. Prolonged orrepeated contact may dry skin. It may cause centralnervous system effects such as drowsiness, dizziness, andheadache, and so on.Isopropanol is a flammable liquid and vapor. It may causeeye, skin, and upper respiratory tract irritation. Prolonged orrepeated contact may dry skin and cause irritation. It maycause central nervous system effects such as drowsiness,dizziness, and headache, and so on.Ethanol is a flammable liquid and vapor. It may cause eye,skin, and upper respiratory tract irritation. Prolonged orrepeated contact may dry skin. Exposure may cause centralnervous system depression and liver damage.
Table 3-3 Sinapinic Acid Matrix Information for Thin Layer Application
Matrix concentration 20 mg/ml
Final sample concentration Up to 0.1 pmol/µl
Materials and solvents • Pure nitrocellulose (for example, Bio-RadLaboratories Trans-Blot® 162-0146)
• Acetone• Isopropanol
continued
Voyager™ Biospectrometry™ Workstation User’s Guide 3-11
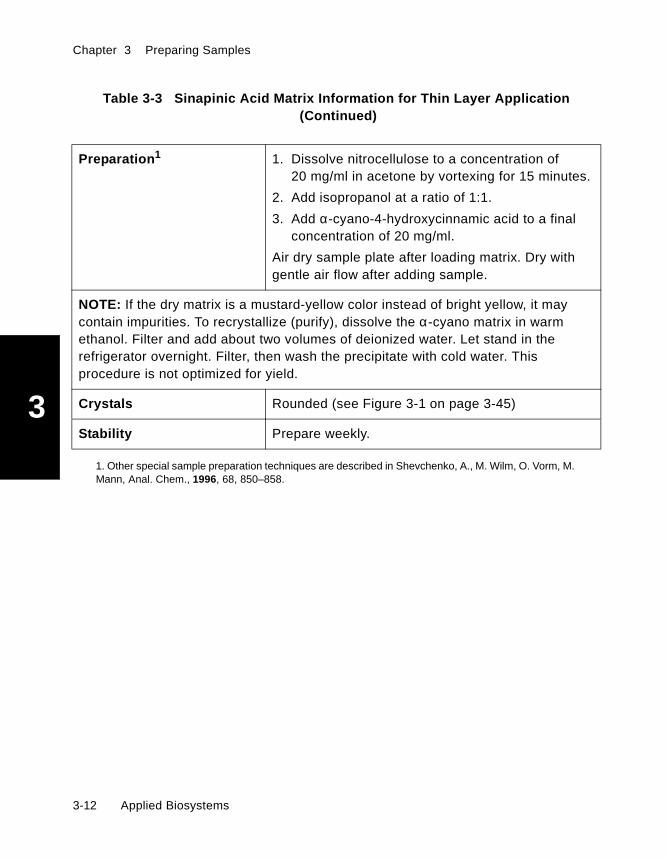
Chapter 3 Preparing Samples
3
Preparation1 1. Dissolve nitrocellulose to a concentration of20 mg/ml in acetone by vortexing for 15 minutes.
2. Add isopropanol at a ratio of 1:1.
3. Add α-cyano-4-hydroxycinnamic acid to a finalconcentration of 20 mg/ml.
Air dry sample plate after loading matrix. Dry withgentle air flow after adding sample.
NOTE: If the dry matrix is a mustard-yellow color instead of bright yellow, it maycontain impurities. To recrystallize (purify), dissolve the α-cyano matrix in warmethanol. Filter and add about two volumes of deionized water. Let stand in therefrigerator overnight. Filter, then wash the precipitate with cold water. Thisprocedure is not optimized for yield.
Crystals Rounded (see Figure 3-1 on page 3-45)
Stability Prepare weekly.
1. Other special sample preparation techniques are described in Shevchenko, A., M. Wilm, O. Vorm, M.Mann, Anal. Chem., 1996, 68, 850–858.
Table 3-3 Sinapinic Acid Matrix Information for Thin Layer Application(Continued)
3-12 Applied Biosystems

Preparing Samples
3
THAP Use THAP for oligonucleotides <3,500 Da, acidiccarbohydrates, acidic glycopeptides, acid sensitivecompounds. THAP provides a more even response than3-HPA.
WARNING
CHEMICAL HAZARD. Please read the MSDS beforehandling any chemical mentioned below, and follow thehandling instructions. Wear appropriate protective eyewear,clothing, and gloves.THAP may cause eye, skin, and respiratory tract irritation.Acetonitrile is a flammable liquid and vapor. It may causeeye, skin, and respiratory tract irritation, central nervoussystem depression, and heart, liver, and kidney damage.
Table 3-4 THAP Matrix Information
Matrix concentration • Oligonucleotides—10 mg/ml• Acidic carbohydrates—2 mg/ml
Additive concentration 50 mg/ml diammonium citrate in deionized water
Final sample concentration 1–10 pmol/µl
Solvents 50 percent acetonitrile and deionized water
NOTE: HPLC-grade water may vary in saltconcentration. Do not use for oligonucleotideanalysis.
continued
Voyager™ Biospectrometry™ Workstation User’s Guide 3-13

Chapter 3 Preparing Samples
3
Preparation1 Follow the procedure in “Preparing matrix” onpage 3-5, the for:
• Small oligonucleotides—Combine 8:1THAP:diammonium citrate. Air dry sample plateafter loading sample and matrix.
• Acidic carbohydrates and glycopeptides—Combine 20:1 THAP:diammonium citrate. Drysample plate under vacuum after loadingsample and matrix. Wait a few minutes afterdrying until the sample absorbs ambienthumidity and turns faint white.
Crystals Larger than sinapinic, overlapping shingles,non-uniform shape (see Figure 3-2 on page 3-46)
Stability Prepare weekly.
1. Other special sample preparation techniques are described in Papac, D.I., A. Wong, A.J.S. Jones,Anal. Chem., 1996, 68, 3215–3223.
Table 3-4 THAP Matrix Information (Continued)
Matrix concentration • Oligonucleotides—10 mg/ml• Acidic carbohydrates—2 mg/ml
Additive concentration 50 mg/ml diammonium citrate in deionized water
3-14 Applied Biosystems

Preparing Samples
3
3-HPA Use 3-HPA for oligonucleotides >3,500 Da.
WARNING
CHEMICAL HAZARD. Please read the MSDS beforehandling any chemical mentioned below, and follow thehandling instructions. Wear appropriate protective eyewear,clothing, and gloves.3-Hydroxypicolinic acid (3-HPA) may cause eye, skin,and respiratory tract irritation.Acetonitrile is a flammable liquid and vapor. It may causeeye, skin, and respiratory tract irritation, central nervoussystem depression, and heart, liver, and kidney damage.
Table 3-5 3-HPA Matrix Information
Matrix concentration 50 mg/ml
Additive concentration 50 mg/ml diammonium citrate in deionized water
Final sample concentration 1–10 pmol/µl
Solvents 50 percent acetonitrile and deionized water
NOTE: HPLC-grade water may vary in saltconcentration. Do not use for oligonucleotideanalysis.
Preparation Follow the procedure in “Preparing matrix” onpage 3-5 and combine 8:1 3-HPA:diammoniumcitrate.
Air dry sample plate after loading sample andmatrix.
Crystals Needle-like crystals inside a ring (see Figure 3-2 onpage 3-46)
Stability Prepare weekly.
Voyager™ Biospectrometry™ Workstation User’s Guide 3-15

Chapter 3 Preparing Samples
3
DHB Use DHB for:
• Neutral carbohydrates• Small molecules
DHB for neutralcarbohydrates WARNING
CHEMICAL HAZARD. Please read the MSDS beforehandling any chemical mentioned below, and follow thehandling instructions. Wear appropriate protective eyewear,clothing, and gloves.
Table 3-6 DHB Matrix Information for Neutral Carbohydrates
Matrix concentration 10 mg/ml
Final sample concentration 10 pmol/µl
Solvents Deionized water
Preparation Follow the procedure in “Preparing matrix” onpage 3-5. Dry down quickly under vacuum for evenresponse. If you allow to air dry, you will see unevenresponse during analysis.
Crystals Milky amorphous appearance for promotingcationization (see Figure 3-3 on page 3-46). Difficultto see crystals when vacuum dried.
Stability Prepare weekly.
3-16 Applied Biosystems

Preparing Samples
3
DHB for smallmolecules WARNING
CHEMICAL HAZARD. Please read the MSDS beforehandling any chemical mentioned below, and follow thehandling instructions. Wear appropriate protective eyewear,clothing, and gloves.Methanol is a flammable liquid and vapor. Exposure maycause eye, skin, and respiratory tract irritation, and centralnervous system depression and blindness.Acetone is a flammable liquid and vapor. It may cause eye,skin, and upper respiratory tract irritation. Prolonged orrepeated contact may dry skin. It may cause centralnervous system effects such as drowsiness, dizziness, andheadache, and so on.
Table 3-7 DHB Matrix Information for Small Molecules
Matrix concentration 10 mg/ml
Final sample concentration Highly sample-dependent. Ideally a minimum of10–200 pmol/µl (10–20 ng/µl).
With lower concentrations, sample signal may bedifficult to distinguish from matrix signal.
Solvents Any solvent in which molecules are soluble(deionized water to 100% methanol or acetone).
Preparation Follow the procedure in “Preparing matrix” onpage 3-5. Dry down quickly under vacuum for evenresponse. If you allow to air dry, you will see a lesseven response during analysis.
Crystals Needle-like crystals arranged in a ring if air-dried(see Figure 3-3 on page 3-46).
Stability Prepare weekly.
Voyager™ Biospectrometry™ Workstation User’s Guide 3-17

Chapter 3 Preparing Samples
3
DHBs Use DHBs for peptides and proteins >10,000 Da, andglycosylated proteins.
WARNING
CHEMICAL HAZARD. Please read the MSDS beforehandling any chemical mentioned below, and follow thehandling instructions. Wear appropriate protective eyewear,clothing, and gloves.Acetonitrile is a flammable liquid and vapor. It may causeeye, skin, and respiratory tract irritation, central nervoussystem depression, and heart, liver, and kidney damage.
Table 3-8 DHBs Matrix Information
Matrix concentration 10 mg/ml
Additive concentration 10 mg/ml 5-methoxysalicylic acid
Final sample concentration 10 pmol/µl to 100 fmol/µl
Solvents 80% 0.1% TFA in deionized water:20% acetonitrile(for DHB)
+
50% acetonitrile:50% deionized water(for 5-methoxysalicylic acid)
Preparation Follow the procedure in “Preparing matrix” onpage 3-5 and combine 9:1 DHB:5-methoxysalicylicacid solutions. Air dry sample plate after loadingsample and matrix.
Crystals Needle-like crystals arranged in a ring if air-dried(see Figure 3-3 on page 3-46). No obvious crystals ifvacuum-dried, or if solvent is a fast-drying organic.
Stability Prepare weekly.
3-18 Applied Biosystems

Preparing Samples
3
Synthetic polymermatrixes
WARNING
CHEMICAL HAZARD. Please read the MSDS beforehandling any chemical mentioned below, and follow thehandling instructions. Wear appropriate protective eyewear,clothing, and gloves.Tetrahydrofuran is a flammable liquid and vapor. It may beharmful if swallowed. Exposure may cause eye andrespiratory tract irritation, central nervous systemdepression, and liver and kidney damage.N,N-Dimethylformamide (DMF) is harmful if inhaled. It is acombustible liquid and vapor. Exposure may cause eye,skin, and respiratory tract irritation, and damage to the liver,kidneys, and heart. It is a suspect cancer hazard.Acetone is a flammable liquid and vapor. It may cause eye,skin, and upper respiratory tract irritation. Prolonged orrepeated contact may dry skin. It may cause centralnervous system effects such as drowsiness, dizziness, andheadache, and so on.
Choice of matrix depends on the sample you are analyzing:
• Aromatic (for example, polystyrene)—Dithranol(25 mg/ml) and 1 mg/ml silver trifluoroacetate (Ag TFA)dissolved in tetrahydrofuran (THF)
• Polar—DHB (10 mg/ml) in deionized water
• Non-polar—Indole acetic acid (10 mg/ml) or DHB in THF,dimethylformamide (DMF), or acetone
Voyager™ Biospectrometry™ Workstation User’s Guide 3-19

Chapter 3 Preparing Samples
3
Table 3-9 Synthetic Polymer Matrix Information
Matrix concentration ~0.1 M (10–1 M)
Final sample concentration ~0.1 mM (10–4 M)
Solvents Sample and matrix dependent. Choose solvents inwhich polymer and matrix are soluble.
Preparation Follow the procedure in “Preparing matrix” onpage 3-5 and combine 1:1 sample:matrix.
See page 3-21 for application techniques.
Apply vacuum drying for non-volatile solvents(water, DMF). Acetone and THF dry instantaneously.
Crystals No crystals visible.
If sample position looks glassy or shiny, it mayindicate sample concentration is too high.
Analyze polymer samples within one hour of loadingon the sample plate. Many polymer/matrix mixturesare not stable once they are loaded.
Areas in which you see hot and cold spots are muchsmaller with polar compounds than with non-polarcompounds.
Stability Prepare weekly. Store THF and acetone solutions intightly sealed vials.
3-20 Applied Biosystems
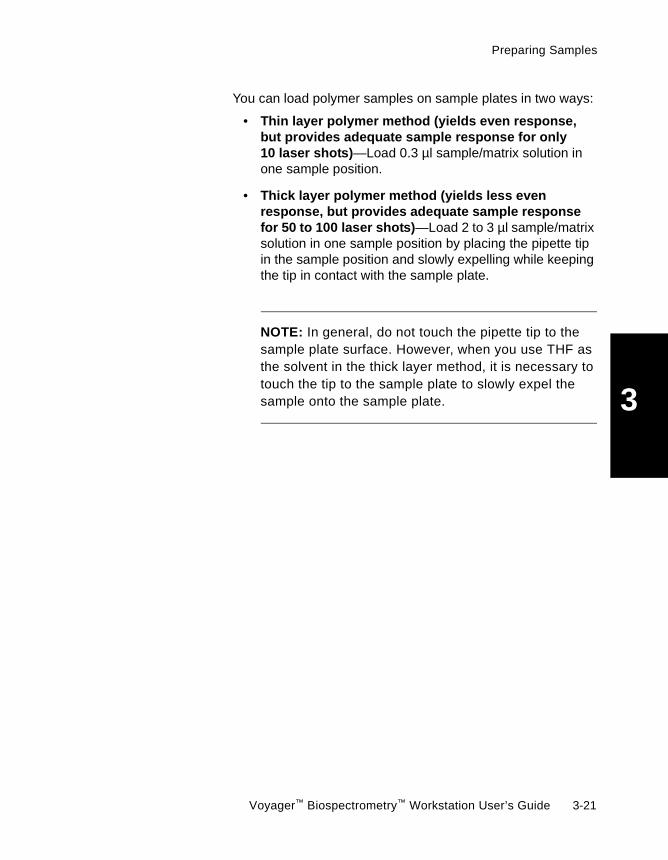
Preparing Samples
3
You can load polymer samples on sample plates in two ways:
• Thin layer polymer method (yields even response,but provides adequate sample response for only10 laser shots)—Load 0.3 µl sample/matrix solution inone sample position.
• Thick layer polymer method (yields less evenresponse, but provides adequate sample responsefor 50 to 100 laser shots)—Load 2 to 3 µl sample/matrixsolution in one sample position by placing the pipette tipin the sample position and slowly expelling while keepingthe tip in contact with the sample plate.
NOTE: In general, do not touch the pipette tip to thesample plate surface. However, when you use THF asthe solvent in the thick layer method, it is necessary totouch the tip to the sample plate to slowly expel thesample onto the sample plate.
Voyager™ Biospectrometry™ Workstation User’s Guide 3-21
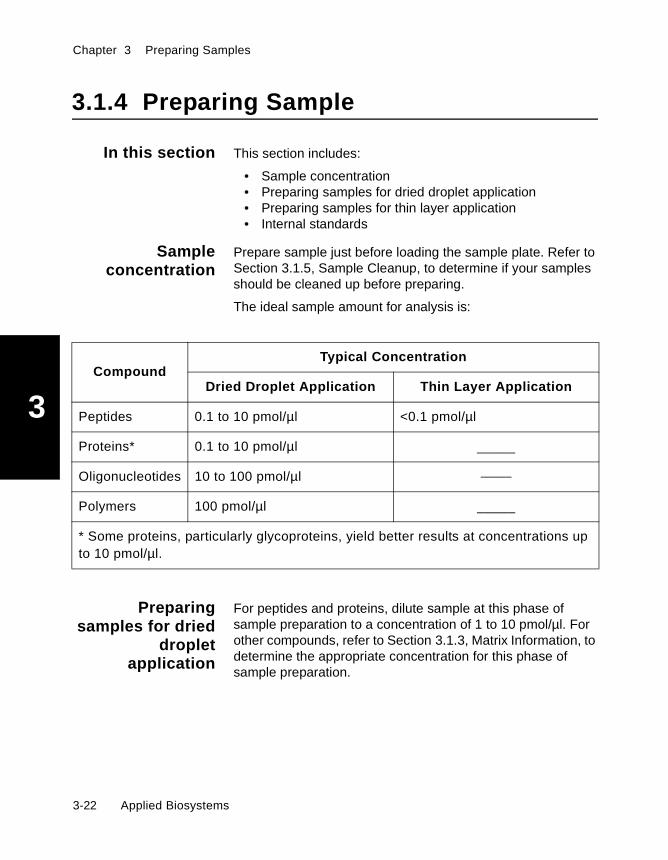
Chapter 3 Preparing Samples
3
3.1.4 Preparing Sample
In this section This section includes:
• Sample concentration• Preparing samples for dried droplet application• Preparing samples for thin layer application• Internal standards
Sampleconcentration
Prepare sample just before loading the sample plate. Refer toSection 3.1.5, Sample Cleanup, to determine if your samplesshould be cleaned up before preparing.
The ideal sample amount for analysis is:
Preparingsamples for dried
dropletapplication
For peptides and proteins, dilute sample at this phase ofsample preparation to a concentration of 1 to 10 pmol/µl. Forother compounds, refer to Section 3.1.3, Matrix Information, todetermine the appropriate concentration for this phase ofsample preparation.
CompoundTypical Concentration
Dried Droplet Application Thin Layer Application
Peptides 0.1 to 10 pmol/µl <0.1 pmol/µl
Proteins* 0.1 to 10 pmol/µl _____
Oligonucleotides 10 to 100 pmol/µl _____
Polymers 100 pmol/µl _____
* Some proteins, particularly glycoproteins, yield better results at concentrations upto 10 pmol/µl.
3-22 Applied Biosystems

Preparing Samples
3
Note the following:
• When diluting sample, keep in mind that you will befurther diluting when you mix sample with matrix.
• If you are unsure of the starting concentration of sample,make a serial dilution to prepare various dilutions of thesame sample.
• Different samples are soluble in different liquids. Trywater first, then add acetonitrile, and then add 0.1% TFAto increase solubility if required.
WARNING
CHEMICAL HAZARD. Acetonitrile is a flammableliquid and vapor. It may cause eye, skin, andrespiratory tract irritation, central nervous systemdepression, and heart, liver, and kidney damage.Please read the MSDS, and follow the handlinginstructions. Wear appropriate protective eyewear,clothing, and gloves.
• A higher concentration of TFA may enhance sampleionization and improve sensitivity in samples prepared inbuffers.
WARNING
CHEMICAL HAZARD. Trifluoroacetic acid causessevere burns to the eyes, skin, and respiratory tract.Please read the MSDS, and follow the handlinginstructions. Wear appropriate protective eyewear,clothing, and gloves.
Voyager™ Biospectrometry™ Workstation User’s Guide 3-23

Chapter 3 Preparing Samples
3
• Many samples adhere strongly to plastic tubes and pipettips. You can minimize sample loss by preparing samplesin 30 percent acetonitrile with 5 to 10 percent TFA.
• Do not dilute sample with phosphate buffered saline(PBS) or other buffer solutions. A high salt concentrationcan interfere with sample ionization and may causeincreased sodium and potassium adduct peaks.
Preparingsamples for thinlayer application
Prepare samples in water. If samples contain organic solvents,they will dissolve the matrix applied to the sample plate.
Internal standards If you require mass accuracy greater than the accuracyprovided by external calibration, (for example, >0.05% on aVoyager-DE system), use an internal standard. SeeAppendix A, Specifications, for the mass accuracy on othersystems.
Add two standards of known molecular weight to the sample.Standards should:
• Closely bracket the molecular weight of your unknown• Be easily distinguished from the unknown
As a starting point, use an internal standard concentration inthe same range as your sample concentration. Because aninternal standard may affect the intensity of the sample signal,it is a good idea to prepare sample with several differentinternal standard concentrations.
3-24 Applied Biosystems

Preparing Samples
3
3.1.5 Sample Cleanup
Cleaningtechniques
Use the following techniques to clean samples:
• Washing• Drop dialysis (floating membrane)• Cation exchange• ZipTips®
When to cleansamples
Sample cleanup is needed if samples:
• Are prepared in phosphate buffers. Ammonium salts orderivatives of organic amines (ammonium bicarbonate,TRIS HCl) do not usually cause a problem in lowconcentrations (less than 50 mM).
• Contain salt, for example, from cation or anion exchangepurification.
• Are contaminated with detergent.
Symptoms that indicate the need for sample cleanup include:
• Poor crystallization on the sample plate.
• Large tail on the high mass side of peaks, which may beunresolved salt or buffer adducts.
• Poor sensitivity with a sample concentration that shouldyield a strong signal. To detect this condition, mix thesample with a standard that you know yields a strongsignal. If the standard no longer exhibits the expectedsignal, a contaminant in the sample is affecting sensitivity.
Voyager™ Biospectrometry™ Workstation User’s Guide 3-25

Chapter 3 Preparing Samples
3
3.1.5.1 Washing
When to use Use this technique when you know the solubility of thecontaminant. You can wash a dried sample directly on thesample plate.
What you need Select a solvent in which the contaminant is more soluble thanthe matrix and the sample. For example, use:
• Cold water (to prevent sample dissolving) with 0.1% TFAfor a polar contaminant, such as a salt or buffer
• 5% isopropanol in water for a non-ionic detergent such asoctyl glucoside
WARNING
CHEMICAL HAZARD. Isopropanol is a flammable liquidand vapor. It may cause eye, skin, and upper respiratorytract irritation. Prolonged or repeated contact may dry skinand cause irritation. It may cause central nervous systemeffects such as drowsiness, dizziness, and headache, andso on. Please read the MSDS, and follow the handlinginstructions. Wear appropriate protective eyewear, clothing,and gloves.
Procedure To wash:
1. Apply sample and matrix to the sample plate and allowto dry.
2. Add 1 to 3 µl of solvent to the dry sample/matrix.
3. Wait 10 seconds, then remove the liquid.
NOTE: Try not to touch the sample plate with the pipettip. If you do touch the spot, do not analyze the areayou touched.
3-26 Applied Biosystems
Preparing Samples
3
4. Repeat step 2 and step 3 one more time.
5. Allow the sample plate to dry before analyzing.
If one wash does not improve results, you can washagain.
3.1.5.2 Drop Dialysis (Floating Membrane)
When to use Use this technique on polar compounds when you knowcontaminants are of low molecular weight. This techniqueworks well for DNA and polar proteins such as glycoproteins.
What you need For drop dialysis, you need a membrane:
• With a pore size of 0.025 µm or smaller• That does not adhere to your sample
Procedure To perform drop dialysis:
1. Fill a small container (for example, a pipet tip box) withabout an inch of deionized water.
2. Place the container on a stable surface.
3. Use forceps to place the membrane in the water with theappropriate side up (refer to manufacturer’s information).Do not use your fingers because you can contaminate themembrane with oil and salt.
4. Place about 10 parts of sample (for example, 10 µl) in thecenter of the membrane.
Voyager™ Biospectrometry™ Workstation User’s Guide 3-27

Chapter 3 Preparing Samples
3
5. Place 1 part of pure acetonitrile (for example, 1 µl) on topof the sample spot to increase surface area. Do notexceed a 10 percent concentration of organic. It maydissolve the membrane.
WARNING
CHEMICAL HAZARD. Acetonitrile is a flammableliquid and vapor. It may cause eye, skin, andrespiratory tract irritation, central nervous systemdepression, and heart, liver, and kidney damage.Please read the MSDS, and follow the handlinginstructions. Wear appropriate protective eyewear,clothing, and gloves.
6. Cover the container to prevent drying and allow it to sit for30 minutes.
7. Note the size of the sample/organic spot, then let it sit for30 more minutes.
The size of the sample spot increases as dialysis isoccurring. This can be used to check for completion.
8. Observe the size of the sample/organic spot. If the size ofthe spot is larger than the first time you checked it, allowthe sample to sit for 15 more minutes. Observe the size ofthe sample/organic spot again.
NOTE: Sample also passes through the membraneduring dialysis, particularly low mass samples. Dialyzesmall molecules for a shorter time than largermolecules. In general, do not dialyze for more thantwo hours.
9. When the size of the sample spot stabilizes, remove thesample and place it in a microcentrifuge tube.
NOTE: The size of the sample drop can increase by afactor of 10 when salt concentration is high.
3-28 Applied Biosystems

Preparing Samples
3
3.1.5.3 Cation Exchange
When to use Use this technique for non-polar proteins or DNA when youknow the sample contains only a salt contaminant. Thistechnique is faster than dialysis but does not remove othercontaminants.
What you need Use 200-mesh cation exchange beads. Cation exchangebeads in the ammonium form work best for MALDIapplications.
Preparation ofbeads in
ammonium form
To prepare cation exchange beads in the ammonium form:
1. Place beads in twice the bead volume of1M ammonium acetate.
2. Leave beads in ammonium acetate overnight.
IMPORTANT. Ammonium acetate. Please read theMSDS, and follow the handling instructions. Wearappropriate protective eyewear, clothing, and gloves.
3. Remove beads, and wash with water, acetone, and thenhexane through a Buchner funnel under vacuum.
WARNING
CHEMICAL HAZARD. Acetone is a flammable liquidand vapor. It may cause eye, skin, and upperrespiratory tract irritation. Prolonged or repeatedcontact may dry skin. It may cause central nervoussystem effects such as drowsiness, dizziness, andheadache, and so on. Please read the MSDS, andfollow the handling instructions. Wear appropriateprotective eyewear, clothing, and gloves.
Voyager™ Biospectrometry™ Workstation User’s Guide 3-29
Chapter 3 Preparing Samples
3
WARNING
CHEMICAL HAZARD. Hexane is a flammable liquidand vapor. It may cause eye, skin, and respiratory tractirritation. Prolonged or repeated contact may dry skin.It may cause central nervous system effects such asdrowsiness, dizziness, and headache, and so on, anddamage the peripheral nervous system (numbness ofthe extremities). Please read the MSDS, and follow thehandling instructions. Wear appropriate protectiveeyewear, clothing, and gloves.
After washing, beads can be stored indefinitely andused as needed.
Procedure To perform cation exchange:
1. Place about 0.1 mg (a small spatula-tip-full) of cationexchange beads on a piece of laboratory film.
2. Add 5 to 10 µl of sample for 200-mesh cation exchangebeads. If sample quantity is limited, you can make up thedifference with deionized water.
3. Add 5 to 10 µl of matrix on top of the sample, as matrixmay also contain salt.
4. Mix by withdrawing and expelling about 20 times with apipet.
NOTE: The volume of sample decreases as the beadsabsorb water.
5. Allow the beads to settle for 30 seconds.
6. Remove the supernatant with a clean pipet tip and spot onthe sample plate.
3-30 Applied Biosystems

Preparing Samples
3
3.1.5.4 ZipTips®
When to use Use this technique for peptides, proteins, and oligonucleotideswhen you know the sample contains salt, buffer, or glycerolcontaminants. This technique is faster, easier, and moreeffective than dialysis for removing contaminants.
NOTE: This technique introduces organic solvent into thesample, which is not compatible with thin layer sampleapplication. If you will apply sample using the thin layerapplication technique, remove the organic solvent from thesample before loading sample on the plate. For moreinformation, see Section 3.2.4, Loading Samples (ThinLayer Application).
Millipore ZipTips® can be used for a wide range of applicationsand are compatible with digestion procedures. You canexpect 50 to 70 percent recovery using the followingprocedure.
NOTE: ZipTips can also be used for sample concentrationand fractionation of complex mixtures.
What you need To clean samples with ZipTips you need:
• Micro-adsorptive C18 pipette ZipTips• Acetonitrile (ACN)• TFA
WARNING
CHEMICAL HAZARD. Acetonitrile is a flammableliquid and vapor. It may cause eye, skin, andrespiratory tract irritation, central nervous systemdepression, and heart, liver, and kidney damage.Please read the MSDS, and follow the handlinginstructions. Wear appropriate protective eyewear,clothing, and gloves.
Voyager™ Biospectrometry™ Workstation User’s Guide 3-31
Chapter 3 Preparing Samples
3
Procedure To clean samples with ZipTips:
1. Wash a C18 ZipTip in the following order with:
• 10 µl of ACN• 10 µl of 50:50 ACN:0.1%TFA• 10 µl of 0.1% TFA• Repeat wash of 10 µl of 0.1% TFA
To wash, draw a few microliters of a wash solution up intothe ZipTip and expel to waste.
2. Draw a few microliters of the sample up and down in theZipTip several times.
3. Discard the liquid. The sample is bound to the C18 surfacein the ZipTip.
4. Wash the ZipTip again with 10 µl of 0.1% TFA by drawingup into the ZipTip and expel to waste.
5. Repeat step 4 two times.
6. Elute the sample with 2 to 3 µl of organic solvent or matrixcontaining approximately 50 percent ACN by drawingsolvent or matrix/solvent up and down in the ZipTipseveral times.
NOTE: A 50 percent organic concentration should give50 to 70 percent sample recovery. You can vary theorganic concentration to optimize recovery.
7. Elute samples directly on the plate as described inSection 3.2.3, Loading Samples(Dried Droplet Application), or into a microcentrifuge tubefor storage.
3-32 Applied Biosystems

Preparing Samples
3
3.1.6 Mixing Sample and Matrix(Dried Droplet Application)
When to use Use dried droplet application if you are analyzing samples witha concentration >0.01 pmol/µl.
If you are analyzing samples with a concentration<0.01 pmol/µl, use the thin layer application techniquedescribed in Section 3.2.4, Loading Samples (Thin LayerApplication).
Premixing sampleand matrix
Mix sample and matrix in microcentrifuge tubes beforeapplying sample to the sample plate when you are:
• Working with concentrated samples with a high saltconcentration and need to make dilutions
• Preparing many samples
• Analyzing non-polar samples and matrix prepared in highorganic concentration that evaporates rapidly
For peptides and proteins, mix 1 µl of sample (concentration of0.1 to 100 pmol/µl) and 9 µl of matrix in a microcentrifuge tube,for a final concentration of 0.1 to 10 pmol/µl. Mix well on avortex mixer or shake by hand.
For other compounds, refer to “Matrix Information” onpage 3-6 to determine the volume of sample and matrix to mixto yield the necessary final sample concentration.
NOTE: If sample concentration is too high, the samplesignal may be suppressed. If sample concentration is toolow, sample signal may not be present.
Voyager™ Biospectrometry™ Workstation User’s Guide 3-33

Chapter 3 Preparing Samples
3
Mixing sampleand matrix on the
sample plate
Mix sample and matrix directly on the sample plate when youare:
• Working with dilute samples and can make a 1:1preparation of sample:matrix
• Analyzing only a few samples
• Concerned about sample adhering to plastic tubes
When mixing directly on the plate, you may need to use ahigher concentration of organic and matrix for matrix solutions.With the 1:1 dilution used in this strategy, the typicalconcentration of organic may not be high enough to keep thematrix in solution.
Load 0.5 to 1 µl of sample on the plate of the appropriateconcentration to yield the necessary final sampleconcentration, followed by 0.5 to 1 µl of matrix. See “MatrixInformation” on page 3-6 for final sample concentrations.
A homogeneous mixture is critical for good crystallization.Applying sample before matrix prevents matrix from dryingbefore it mixes with sample.
3-34 Applied Biosystems

Loading Samples on Sample Plates
3
3.2 LoadingSamples on Sample Plates
In this section This section describes:
• Overview• Locating standards for optimum mass accuracy• Loading samples (dried droplet application)• Loading samples (thin layer application)• Examining crystals on sample plates
3.2.1 Overview
In this section This section describes:
• Types of applications• Types of sample plates• Handling sample plates• Guidelines for good crystallization• Recommended pipette tips
Types ofapplications
Two techniques are available for sample application:
• Dried droplet—Simple application technique suitable formost applications. Can use any type of sample plate.
• Thin layer—Use for increased sensitivity when analyzingpeptides with a concentration <0.1 pmol/µl. Requirespolished blank sample plate (no etched positions).
Voyager™ Biospectrometry™ Workstation User’s Guide 3-35

Chapter 3 Preparing Samples
3
Types of sampleplates
Three types of 100-position reusable sample plates areavailable:
• Polished blank sample plates (with or without samplenumbers)—Liquid is held in place by surface tension ofsample/matrix mixture. Advantage of this type of plate isthat you can observe crystallization pattern, and theactual sample spot is visible.
• Laser-etched sample plates—Liquid is held in place bylaser-etched indentation in plate. Advantage of this typeof plate is that the sample position on the plate iswell-defined. Use laser-etched sample plates whenrunning in Automatic Control mode.
• Welled sample plates—Liquid is held in place byindentation in plate. Advantage of this type of plate is thatthe sample position on the plate is well-defined. Usewelled sample plates:
• When running in Automatic Control mode• To contain larger sample/matrix volumes that will
spread beyond the sample position boundaries,due to volatile solvent content
In addition to 100-position reusable sample plates, theVoyager software supports other reusable and disposableplates. For more information, see:
• Section 3.5, Sample Plate Types• Section 3.5.1, Sample Plate Types and Applications
3-36 Applied Biosystems
Loading Samples on Sample Plates
3
Handling sampleplates
To prevent contamination of your analysis:
• Start with a clean sample plate. See Section 3.3,Cleaning Sample Plates, for more information.
• Handle the sample plate by the edges.
• Use powder-free gloves if you wear gloves.
Guidelines forgood
crystallization
To ensure good crystallization:
• Mix sample and matrix before applying. If you are mixingsample and matrix directly on the sample plate, applysample before matrix to prevent matrix from drying.
• If you are using a welled plate, fill the entire well whenloading the sample plate, if possible, especially ifacquiring in Automatic control mode. Surface tension andsample availability may determine whether you fill thewell completely.
• Do not touch the surface of the sample well with thepipette tip (may cause uneven crystallization).
Recommendedpipette tips
Use finely-tapered pipette tips to dispense sample/matrixsolution on the sample plate. Tips with blunt ends do not easilydispense the small volumes used for sample loading.
Voyager™ Biospectrometry™ Workstation User’s Guide 3-37

Chapter 3 Preparing Samples
3
3.2.2 Locating Standards forOptimum Mass Accuracy
In a typical analysis run that requires optimum mass accuracy,you include samples interspersed with many calibrationstandards, and externally calibrate the samples using theclosest calibration standard.
The number and location of standards you need depends onwhether or not you use the Mass Accuracy Optimizationoption when you analyze samples (described in Section 3.4.2,Using the Mass Accuracy Optimization Option).
Without MassAccuracy
Optimization
To obtain optimum mass accuracy without using the MassAccuracy Optimization option, you must:
• Spot standards in every other position relative to samples
• Locate the standards as close as possible to samples (ason the 96 × 2 sample plate)
Do not use the outer wells on the sample plate when using flator polished blank plates.
With MassAccuracy
Optimization
If you use the Mass Accuracy Optimization option, the numberand location of standards you need to obtain optimum massaccuracy depends on:
• Whether or not you use an optimized sample plate• The type of sample plate you use
3-38 Applied Biosystems

Loading Samples on Sample Plates
3
With an optimizedplate
To obtain optimum mass accuracy using the Mass AccuracyOptimization option and a plate you have optimized withOptiPlate you can:
• Spot one or a few standards on the plate. The number ofstandards required depends on the plate you use andyour mass accuracy needs.
• Locate standards anywhere on the plate, for example, ina center position (on a 96 × 2 plate) and in four cornerpositions (on other plates that have positions located nearthe physical edge of the plate).
• When you analyze, set the run to update the calibrationapproximately every 3 minutes (calibration update maybe required less frequently or not at all, depending onyour mass accuracy needs).
To set the run to update the calibration, list the standardposition in the sequence run list every fifth line or so (theprecise line on which to list the standard depends on thetime required for each line in the sequence to run) andspecify Internal-Update calibration. For moreinformation, see Section 7, Acquiring Spectra fromthe Sequence Control Panel.
PlateNumber of Standards
Needed
96 × 2 1(center)
64, 100, 384, 400 (plateswith positions located nearthe physical edge of the plate)
5(center and 4
corners)
Voyager™ Biospectrometry™ Workstation User’s Guide 3-39
Chapter 3 Preparing Samples
3
With anunoptimized plate
You can use an unoptimized sample plate and still obtainbetter mass accuracy than if you do not use Mass AccuracyOptimization. However, you must run the OptiPlate softwareand optimize at least one sample plate on your system beforeusing an unoptimized plate. For more information, seeSection 2.8, Running OptiPlate to Optimize Mass Accuracy.
To obtain optimum mass accuracy during analysis using theMass Accuracy Optimizations option and a plate you have notoptimized with OptiPlate you can:
• Spot more standards on the plate than if you are using anoptimized plate (but fewer than if you are not using theMass Accuracy Optimization option).
• Locate standards in regular positions on the plate, forexample, every fifth position across the plate.
• When you analyze, set the run to update the calibrationapproximately every 3 minutes (calibration update maybe required less frequently or not at all, depending onyour mass accuracy needs).
To set the run to update the calibration, list the standardposition in the sequence run list every fifth line or so (theprecise line on which to list the standard depends on thetime required for each line in the sequence to run) andspecify Internal-Update calibration. For moreinformation, see Section 7, Acquiring Spectra fromthe Sequence Control Panel.
3-40 Applied Biosystems

Loading Samples on Sample Plates
3
3.2.3 Loading Samples(Dried Droplet Application)
NOTE: If you are loading a plate for acquisition orautomated sample positioning in Automatic Control mode,use a laser-etched or welled sample plate to provide areference point for sample application.
When to use Use this technique for most applications, when sampleconcentration is >0.1 pmol/ µl.
Before loadingsamples
Note the following:
• Some organic solvents such as methanol, acetone, andTHF spread very easily on metal surfaces. If the samplecontains these solvents, try to load smaller volumes(0.5 µl or less).
• Try to place the sample in the center of the sampleposition. If the sample is not in the center, the laserposition shown on the Sample View (see Figure 4-9 onpage 4-31) may not be centered on the sample.
WARNING
CHEMICAL HAZARD. Methanol is a flammable liquidand vapor. Exposure may cause eye, skin, andrespiratory tract irritation, and central nervous systemdepression and blindness. Please read the MSDS, andfollow the handling instructions. Wear appropriateprotective eyewear, clothing, and gloves.
Voyager™ Biospectrometry™ Workstation User’s Guide 3-41
Chapter 3 Preparing Samples
3
WARNING
CHEMICAL HAZARD. Acetone is a flammable liquidand vapor. It may cause eye, skin, and upperrespiratory tract irritation. Prolonged or repeatedcontact may dry skin. It may cause central nervoussystem effects such as drowsiness, dizziness, andheadache, and so on. Please read the MSDS, andfollow the handling instructions. Wear appropriateprotective eyewear, clothing, and gloves.
WARNING
CHEMICAL HAZARD. Tetrahydrofuran is aflammable liquid and vapor. It may be harmful ifswallowed. Exposure may cause eye and respiratorytract irritation, central nervous system depression, andliver and kidney damage.
Loading samples 1. Create a log sheet listing sample position and samplename. Appendix D, Log Sheets, contains a mastersheet that you can copy and use.
NOTE: For optimum mass accuracy, do not use theouter rows of the sample plate, unless you are usinginternal standards.
3-42 Applied Biosystems

Loading Samples on Sample Plates
3
2. Using a clean pipette tip for each new sample, load thefollowing:
• If you premixed samples—Load 0.5 to 2 µl ofsample/matrix solution on the appropriate position.
• If you are mixing sample and matrix on thesample plate—See “Mixing sample and matrix onthe sample plate” on page 3-34.
• If you prepared samples with ZipTips—Load 0.5to 2 µl of sample/matrix solution on the appropriateposition.
Do not touch the tip of the pipette to the sample spot.Make sure the sample is evenly applied to the spot.
3. If you are using DHB matrix for neutral carbohydrates, drythe sample plate quickly under vacuum.
If you are using other matrixes, allow the sample plateto dry for at least five minutes. Preparations with highwater or salt content may require longer to dry.
4. Visually examine the sample spots to make sure theyare dry.
NOTE: If you load the sample plate into the VoyagerBiospectrometry Workstation before the plate is dry, thepressure in the sample chamber rises, and a “TC2pressure too high” error code may be displayed in theControl window. Wait a few minutes for the chamber toreach pressure.
5. Place a protective cover over the plate until you are readyto load the plate. Do not allow the cover to touch thesurface of the plate.
Voyager™ Biospectrometry™ Workstation User’s Guide 3-43

Chapter 3 Preparing Samples
3
3.2.4 Loading Samples(Thin Layer Application)
When to use Use the thin layer application technique1 for increasedsensitivity when analyzing peptides with a concentration<0.1 pmol/ µl.
Loading matrixand samples
To load matrix and samples:
1. Dispense 0.5 µl of matrix prepared for thin layerapplication on the sample plate to form a thin layer. Itwill dry in seconds.
For information, see “CHCA for thin layer application”on page 3-11.
2. Load 0.5 to 1 µl of the sample in each sample positiononto the thin matrix layer applied in step 1.
3. Dry the plate with a heat gun.
4. After drying, load 2 to 3 µl of double-distilled water ontop of each dried sample to wash the sample.
5. Wait 5 seconds, and blow off the water droplet withcompressed air.
6. Repeat step 4 and step 5 two more times.
NOTE: During acquisition, use the “surfing method”(moving the sample plate after every 5 to 10 shots, to a newposition on the sample).
1. Shevchenko, A., M. Wilm, O. Vorm, M. Mann, Anal. Chem., 1996, 68,850–858.
3-44 Applied Biosystems

Loading Samples on Sample Plates
3
3.2.5 Examining Crystals on Sample Plates
Overview If you are using polished blank or laser etched sample plates(see “Types of sample plates” on page 3-36), you can look atthe crystallization of sample and matrix under a microscope. Amagnification of 30X is sufficient to see crystals.
You can also view crystallization on the video monitor on theinstrument.
The morphology of crystals is a critical element for successfulanalysis. Ideally, you want small crystals that are evenlydistributed in the sample well.
α-cyano orsinapinic acid
Figure 3-1 illustrates good patterns of crystallization forα-cyano and sinapinic acid matrixes.
Figure 3-1 Microscopic View of Sample Plate withα-Cyano or Sinapinic Acid Matrixes
With good crystallization, you see small, equally-sized crystalsthat are evenly distributed on the plate. Clumping is notdesirable. If you see clumped crystals with α-cyano orsinapinic acid matrixes, it may indicate:
• Matrix concentration is too high• Organic concentration is too high• Sample plate was dried too quickly• Sample contains contaminants
PB100265
α-cyano Sinapinic acidRounded Rhomboid-shaped
Voyager™ Biospectrometry™ Workstation User’s Guide 3-45

Chapter 3 Preparing Samples
3
You can acquire data from a well that does not have an idealcrystallization pattern. However, when sample containsunevenly distributed crystalllization, it may be difficult toanalyze. This can cause a problem in Automatic mode.
Other matrixes Typical appearance of other matrixes under magnification areshown in Figure 3-2 and Figure 3-3.
When analyzing 3-HPA crystals, aim the laser at the base ofthe fan-like crystals for best response.
Each matrix/sample class may require different laserintensities for analysis.
Figure 3-2 Microscopic View of Sample Plate with3-HPA and THAP Matrixes
Figure 3-3 Microscopic View of Sample Plate with DHB orDHBs Matrix
3 HPANeedles in fan-like arrangement
around outer edge of sample well
THAP
Overlapping shinglesnon-uniform shape
PB100508PB100509
PB100511PB100510
DHB dried under vacuumMilky amorphous
DHB or DHBs, air driedIrregular crystals
in ring
3-46 Applied Biosystems
Cleaning Sample Plates
3
3.3 Cleaning Sample Plates
In this section This section describes procedures for cleaning:
• Teflon® plates• Gold and stainless steel plates
Cleaning Teflonplates
NOTE: Avoid using strong organic solvents such asacetone. Use acetonitrile if a solvent is necessary. Avoidultrasonic cleaning devices.
WARNING
CHEMICAL HAZARD. Acetonitrile is a flammable liquidand vapor. It may cause eye, skin, and respiratory tractirritation, central nervous system depression, and heart,liver, and kidney damage. Please read the MSDS, andfollow the handling instructions. Wear appropriateprotective eyewear, clothing, and gloves.
NOTE: Do not use metal brushes, abrasive surfaces, orsolid detergents to clean Teflon sample plates; they arefragile. Avoid rubbing the surface of the plate. If necessary,wipe gently with lint-free lab tissues.
To clean Teflon plates:
1. Rinse the plate with luke warm water.
2. If necessary, wipe gently with a lint-free lab tissue toremove matrix.
3. Wash the plate with a 1 percent solution of a liquiddetergent.
4. Rinse with deionized water.
Voyager™ Biospectrometry™ Workstation User’s Guide 3-47

Chapter 3 Preparing Samples
3
5. If an organic solvent is necessary, rinse with acetonitrile atthe lowest percentage that will dissolve the matrix.
6. Examine the plate. If you see any sample or matrixresidue, oil, or fingerprints on the plate, soak the sampleplate in a working solution of laboratory detergent inwater (for example, RBS 35 detergent from Pierce orLIQUI-NOX™ from VWR) for the minimum time requiredto remove samples.
IMPORTANT. RBS, LIQUI-NOX. Please read themanufacturer’s MSDS, and follow the handlinginstructions. Wear appropriate protective eyewear,clothing, and gloves.
CAUTION
Do not leave the sample plate in detergent for longerthan 10 minutes. Longer exposure can cause thebottom holders on the sample plate to corrode. Do notsonicate sample plates or use acid to clean sampleplates. Both can alter the surface of the sample plate,and reduce the quality of the data obtained.
7. Rinse the plate thoroughly in deionized water.
8. Allow the plate to dry at room temperature in an areawhere it will not be exposed to contaminants. Allow theplate to dry completely before use to obtain the maximumhydrophobic effect.
Cleaning gold andstainless steel
plates
NOTE: Use a cleaning solvent similar to the samplesolvent.
To clean gold and stainless steel sample plate surfaces:
1. Rinse the plate with a squeeze bottle of solvent.
2. Rub with a lint-free lab tissue to clean.
3. Rinse with deionized water.
3-48 Applied Biosystems
Cleaning Sample Plates
3
4. Examine the plate. If you see any sample or matrixresidue, oil, or fingerprints on the plate, soak the sampleplate in a working solution of laboratory detergent inwater (for example, RBS 35 detergent from Pierce orLIQUI-NOX™ from VWR) for 5 to 10 minutes.
IMPORTANT. RBS, LIQUI-NOX. Please read themanufacturer’s MSDS, and follow the handlinginstructions. Wear appropriate protective eyewear,clothing, and gloves.
CAUTION
Do not leave the sample plate in detergent for longerthan 10 minutes. Longer exposure can cause thebottom holders on the sample plate to corrode. Do notsonicate sample plates or use acid to clean sampleplates. Both can alter the surface of the sample plate,and reduce the quality of the data obtained.
5. If residue remains, wipe the plate with a lint-free tissue orcotton swab. A soft toothbrush also works well.
6. Rinse the plate thoroughly in deionized water.
7. To speed drying, rinse the plate in acetone.
WARNING
CHEMICAL HAZARD. Acetone is a flammable liquidand vapor. It may cause eye, skin, and upperrespiratory tract irritation. Prolonged or repeatedcontact may dry skin. It may cause central nervoussystem effects such as drowsiness, dizziness, andheadache, and so on. Please read the MSDS, andfollow the handling instructions. Wear appropriateprotective eyewear, clothing, and gloves.
8. Allow the plate to dry in an area where it will not beexposed to contaminants.
Voyager™ Biospectrometry™ Workstation User’s Guide 3-49

Chapter 3 Preparing Samples
3
3.4 Loading Sample Platesin the Mass Spectrometer
This section describes:
• Assigning Plate IDs• Using the Mass Accuracy Optimization option• Ejecting the sample holder• Loading sample plates
NOTE: If you load the sample plate into the VoyagerBiospectrometry Workstation before the plate is dry, thepressure in the sample chamber rises, and a “TC2 pressuretoo high” error code may be displayed in the InstrumentControl Panel. Wait a few minutes for the chamber to reachpressure.
3.4.1 Assigning Plate IDs
You assign a unique Plate ID to each physical plate you use.When you load a plate, you select the Plate ID. The followinginformation you previously assigned is automatically loaded:
• .PLT file• Alignment information (if the plate has been aligned)• Mass accuracy optimization information (if the plate has
been optimized)
To assign a Plate ID, select Select Sample Plate from theSample Plate menu and enter the information described inTable 3-10 in the Select Sample Plate dialog box.
NOTE: You can also assign a Plate ID when you load asample plate.
3-50 Applied Biosystems

Loading Sample Plates in the Mass Spectrometer
3
Table 3-10 Sample Plate Information
Parameter Description
Plate ID Unique identifier (up to 32 alphanumeric characters)that you assign to a physical plate. Allows customizedalignment and mass accuracy optimization of more thanone physical plate using the same .PLT file. For moreinformation, see “.PLT files and multiple alignments” onpage 2-47.
Plate Type .PLT file which contains plate configuration information.All .PLT files are located in the C:\VOYAGER directory.For more information on .PLT files, see “.PLT file format”on page 3-68.
Last Aligned Read-only field that displays the date of the lastalignment performed. For information, see Section 2.7,Aligning the Sample Plate.
Optimization Created Read-only field that displays the date and time that theplate associated with the Plate ID selected above wasoptimized for mass accuracy. For information, seeSection 2.8, Running OptiPlate to Optimize MassAccuracy.
Use Mass AccuracyOptimizations
Applies correction factors that optimize mass accuracyto the data as it is acquired. For information, seeSection 3.4.2, Using the Mass Accuracy OptimizationOption.
Voyager™ Biospectrometry™ Workstation User’s Guide 3-51

Chapter 3 Preparing Samples
3
3.4.2 Using theMass Accuracy Optimization Option
In a typical analysis run that requires optimum mass accuracy,you include samples interspersed with many calibrationstandards, and externally calibrate the samples using theclosest calibration standard.
Benefits of usingMass Accuracy
Optimizationduring analysis
The Mass Accuracy Optimization option compensates fordifferences in calibration across a sample plate and increasesthe throughput of sample analysis by:
• Reducing the number of standard positions needed toobtain the optimum mass accuracy. For more information,see Section 3.2.2, Locating Standards for Optimum MassAccuracy.
• Allowing larger distances between samples andstandards, which makes more positions available forsample analysis.
Before using Mass Accuracy Optimization, optimize sampleplates using the OptiPlate software. For more information, seeSection 2.8, Running OptiPlate to Optimize Mass Accuracy.
How massaccuracy
optimization isapplied
To use the Mass Accuracy Optimization option, select the UseMass Accuracy Optimizations option when you load asample plate in the Instrument Control Panel (described inSection 3.4.4, Loading Sample Plates).
The software automatically retrieves the optimizationinformation (created by the OptiPlate software) for the Plate IDassociated with the plate. To compensate for differences incalibration across a sample plate, the software applies theExtraction Correction (calculated by the OptiPlate software)for each position on the sample plate as the data is acquired.
3-52 Applied Biosystems

Loading Sample Plates in the Mass Spectrometer
3
If positions havenot been optimized
If you select the Use Mass Accuracy Optimization option for aPlate ID, and have not optimized all positions on the plate, thesoftware interpolates an Extraction Correction for thecoordinates that correspond to an unoptimized position usingthe correction distances from the closest optimized positions.
If no optimizationfound
If you select the Use Mass Accuracy Optimization option for aPlate ID, and no optimization file exists (either the plate hasnot been optimized, or the optimization file has been moved ordeleted), the most recently created optimization file is used,regardless of plate type. Although using an optimizationfrom another plate does not yield the same degree of massaccuracy as using an optimization specific for a plate, it stillyields better mass accuracy than using no optimization.
Optimizationstrategy
Depending on your mass accuracy needs, you may or may notchoose to optimize all sample plates.
For best mass accuracy, use an optimized sample plate(select a PlateID/.PLT associated with a specific physical plateyou have optimized, then load the optimized physical plate inthe mass spectrometer).
However, you can also do the following (items are listed inorder of decreasing mass accuracy):
• Use the same type of plate as a plate you have optimized(select a PlateID/.PLT associated with a plate you haveoptimized, then load a different physical plate of the sametype in the mass spectrometer).
• Use a different type of plate than a plate you haveoptimized (select the PlateID/.PLT associated with theplate you are using, and the last optimization created willbe used).
Note that all items listed above yield mass accuracy betterthan the accuracy you obtain if you do not use the MassAccuracy Optimization option.
Voyager™ Biospectrometry™ Workstation User’s Guide 3-53
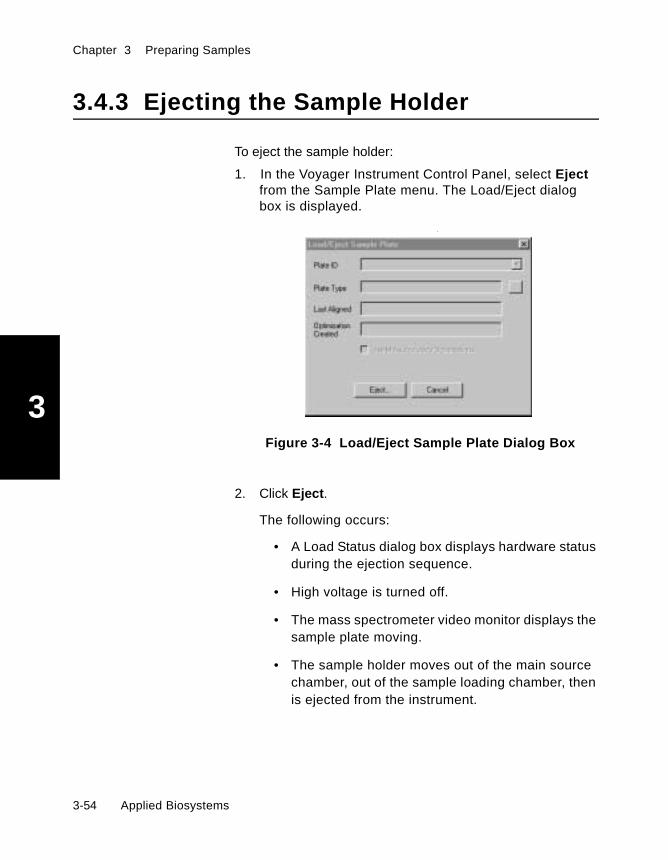
Chapter 3 Preparing Samples
3
3.4.3 Ejecting the Sample Holder
To eject the sample holder:
1. In the Voyager Instrument Control Panel, select Ejectfrom the Sample Plate menu. The Load/Eject dialogbox is displayed.
.
Figure 3-4 Load/Eject Sample Plate Dialog Box
2. Click Eject.
The following occurs:
• A Load Status dialog box displays hardware statusduring the ejection sequence.
• High voltage is turned off.
• The mass spectrometer video monitor displays thesample plate moving.
• The sample holder moves out of the main sourcechamber, out of the sample loading chamber, thenis ejected from the instrument.
3-54 Applied Biosystems

Loading Sample Plates in the Mass Spectrometer
3
NOTE: Do not leave the sample holder in the Eject positionfor more than a few minutes. Minimize the time theinstrument is exposed to the atmosphere to reduce the timeneeded to reach high vacuum after you insert a new plate.
3.4.4 Loading Sample Plates
This section describes loading sample plates in:
• Voyager-DE and Voyager-DE PRO• Voyager-DE STR
Voyager-DE andVoyager-DE PRO
To load sample plates:
1. Eject the sample holder as described in Section 3.4.3,Ejecting the Sample Holder.
2. Hold the sample plate with the bottom of the numbersfacing toward the analyzer (for standard 100-well plate)and with the slanted underside of the plate facing to theleft.
3. Slide the sample plate into the holder from the right sideuntil it snaps into place (Figure 3-5). The ball bearings onthe holder snap into the plate.
CAUTION
If the sample plate does not snap into place, it may beinserted into the holder the wrong way, and it may jaminside the instrument. Remove the plate, slide it into theholder with the slanted underside of the plate facing tothe left and toward the back of the instrument, and snapit into place.
Voyager™ Biospectrometry™ Workstation User’s Guide 3-55
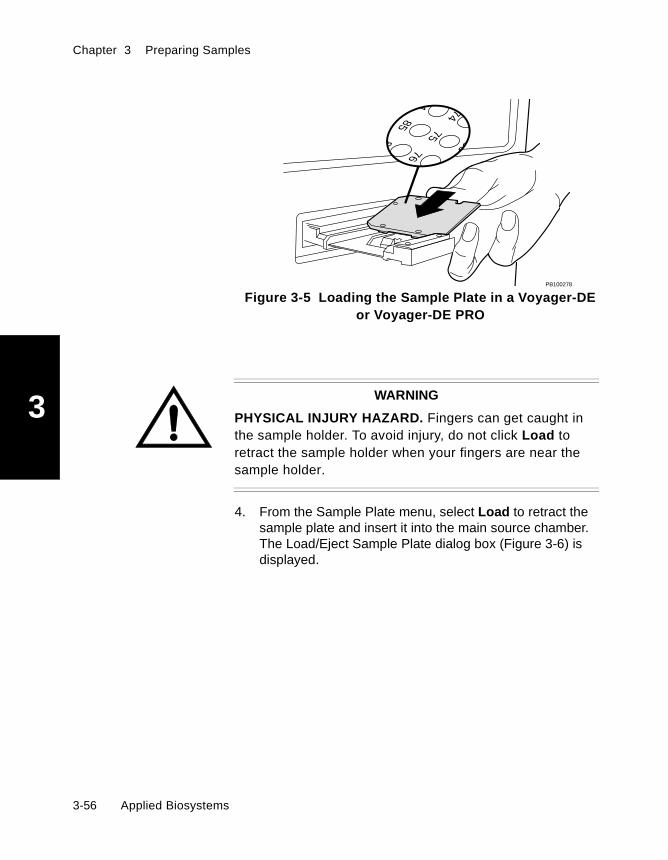
Chapter 3 Preparing Samples
3
Figure 3-5 Loading the Sample Plate in a Voyager-DEor Voyager-DE PRO
WARNING
PHYSICAL INJURY HAZARD. Fingers can get caught inthe sample holder. To avoid injury, do not click Load toretract the sample holder when your fingers are near thesample holder.
4. From the Sample Plate menu, select Load to retract thesample plate and insert it into the main source chamber.The Load/Eject Sample Plate dialog box (Figure 3-6) isdisplayed.
PB100278
65 6674 75 76
4 85 86
3-56 Applied Biosystems
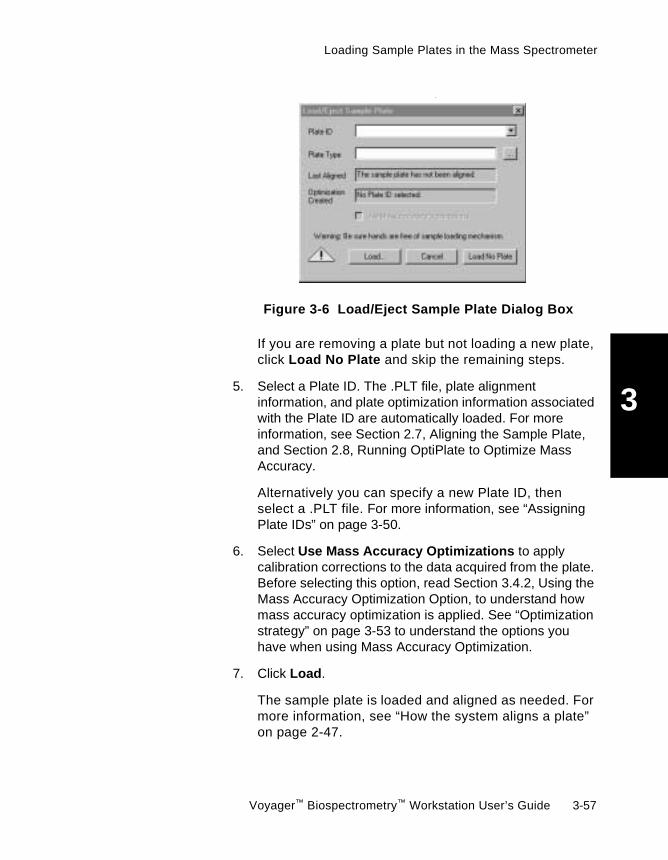
Loading Sample Plates in the Mass Spectrometer
3
.
Figure 3-6 Load/Eject Sample Plate Dialog Box
If you are removing a plate but not loading a new plate,click Load No Plate and skip the remaining steps.
5. Select a Plate ID. The .PLT file, plate alignmentinformation, and plate optimization information associatedwith the Plate ID are automatically loaded. For moreinformation, see Section 2.7, Aligning the Sample Plate,and Section 2.8, Running OptiPlate to Optimize MassAccuracy.
Alternatively you can specify a new Plate ID, thenselect a .PLT file. For more information, see “AssigningPlate IDs” on page 3-50.
6. Select Use Mass Accuracy Optimizations to applycalibration corrections to the data acquired from the plate.Before selecting this option, read Section 3.4.2, Using theMass Accuracy Optimization Option, to understand howmass accuracy optimization is applied. See “Optimizationstrategy” on page 3-53 to understand the options youhave when using Mass Accuracy Optimization.
7. Click Load.
The sample plate is loaded and aligned as needed. Formore information, see “How the system aligns a plate”on page 2-47.
Voyager™ Biospectrometry™ Workstation User’s Guide 3-57

Chapter 3 Preparing Samples
3
It takes 1 or 2 minutes for the sample plate to reach thecorrect position. While the sample plate is moving, theLoad/Eject Status dialog box displays messages aboutthe status of the hardware.
Voyager-DE STR To load sample plates:
1. Eject the sample holder as described in Section 3.4.3,Ejecting the Sample Holder.
2. Hold the sample plate vertically, with the sample surfacefacing to the right, and with the slanted underside of theplate facing toward the back of the instrument.
3. Slide the sample plate into the holder from the front until itsnaps into place (Figure 3-7). The ball bearings on theholder snap into the plate.
CAUTION
If the sample plate does not snap into place, it may beinserted into the holder the wrong way, and it may jaminside the instrument. Remove the plate, slide it into theholder with the slanted underside of the plate facing theleft and toward the back of the instrument, then snap itinto place.
3-58 Applied Biosystems

Loading Sample Plates in the Mass Spectrometer
3
Figure 3-7 Loading the Sample Plate in aVoyager-DE STR
WARNING
PHYSICAL INJURY HAZARD. Fingers can get caught inthe sample holder. To avoid injury, do not click Load toretract the sample holder when your fingers are near thesample holder.
4. From the Sample Plate menu, select Load to retract thesample plate and insert it into the main source chamber.The Load/Eject Sample Plate dialog box (Figure 3-8) isdisplayed.
If you are removing a plate but not loading a new plate,click Load No Plate and skip the remaining steps.
PB100277
4 65 6
4 75 76
4 85 86
Voyager™ Biospectrometry™ Workstation User’s Guide 3-59

Chapter 3 Preparing Samples
3
.
Figure 3-8 Load/Eject Sample Plate Dialog Box
5. Select a Plate ID. The .PLT file, plate alignmentinformation, and plate optimization information associatedwith the Plate ID are automatically loaded. For moreinformation, see Section 2.7, Aligning the Sample Plate,and Section 2.8, Running OptiPlate to Optimize MassAccuracy.
Alternatively you can specify a new Plate ID, thenselect a .PLT file. For more information, see “AssigningPlate IDs” on page 3-50.
6. Select Use Mass Accuracy Optimizations to applycalibration corrections to the data acquired from the plate.Before selecting this option, read Section 3.4.2, Using theMass Accuracy Optimization Option, to understand howmass accuracy optimization is applied. See “Optimizationstrategy” on page 3-53 to understand the options youhave when using Mass Accuracy Optimization.
7. Click OK.
The sample plate is loaded and aligned as needed. Formore information, see “How the system aligns a plate”on page 2-47.
It takes 1 or 2 minutes for the sample plate to reach thecorrect position. While the sample plate is moving, theLoad/Eject Status dialog box displays messages aboutthe status of the hardware.
3-60 Applied Biosystems
Sample Plate Types
3
3.5 Sample Plate Types
Overview The Voyager Instrument Control software supports a variety ofreusable and disposable plates. Each type of physical platehas a corresponding plate (.PLT) file that defines the locationand dimensions of the positions on the plate. Standard .PLTfiles for all standard plates are provided with the software.
You can:
• Customize the standard plate types by copying andediting their .PLT files. See Section 3.5.3, Guidelines forDefining Custom Plate Types.
These additional plate types are custom options. ContactApplied Biosystems for more information.
• Define your own plate types of unlimited positions byediting existing or creating new .PLT files. Forinformation, see Section 3.5.2, Editable-ConfigurationPlate (.PLT) Types Provided with the System, andSection 3.5.4, Creating and Editing .PLT Files.
In this section This section describes:
• Sample plate types and applications
• Editable-configuration plate types provided with thesystem
• Guidelines for defining custom plate types
• Creating and editing .PLT files
• Adjusting the laser position for a custom .PLT file
Voyager™ Biospectrometry™ Workstation User’s Guide 3-61
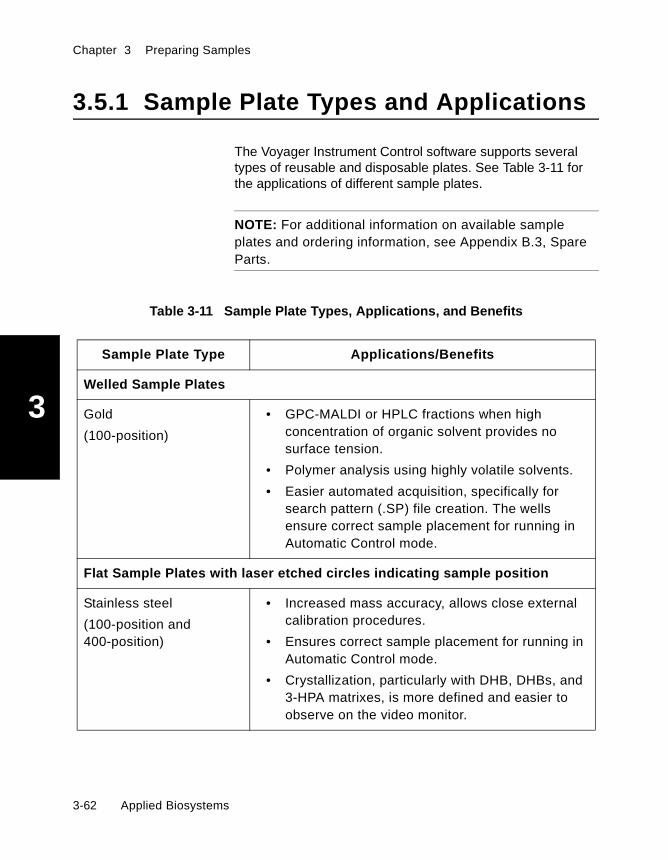
Chapter 3 Preparing Samples
3
3.5.1 Sample Plate Types and Applications
The Voyager Instrument Control software supports severaltypes of reusable and disposable plates. See Table 3-11 forthe applications of different sample plates.
NOTE: For additional information on available sampleplates and ordering information, see Appendix B.3, SpareParts.
Table 3-11 Sample Plate Types, Applications, and Benefits
Sample Plate Type Applications/Benefits
Welled Sample Plates
Gold
(100-position)
• GPC-MALDI or HPLC fractions when highconcentration of organic solvent provides nosurface tension.
• Polymer analysis using highly volatile solvents.
• Easier automated acquisition, specifically forsearch pattern (.SP) file creation. The wellsensure correct sample placement for running inAutomatic Control mode.
Flat Sample Plates with laser etched circles indicating sample position
Stainless steel
(100-position and400-position)
• Increased mass accuracy, allows close externalcalibration procedures.
• Ensures correct sample placement for running inAutomatic Control mode.
• Crystallization, particularly with DHB, DHBs, and3-HPA matrixes, is more defined and easier toobserve on the video monitor.
3-62 Applied Biosystems

Sample Plate Types
3
Special Sample Plates
Stainless steel, polishedblank
• Allows customized sample positioning andpreparation using an automated samplepreparation device.
Disposable (gold-coated)
(100-position)
• Can derivatize the surface of the sample plate forprotein or enzyme immobilization.1, 2
• Long-term storage of samples.
• Eliminates cross-contamination.
Biacore® Chip • Direct analysis of affinity-isolated species.
• Confirmation of binding constant determined bysurface plasmon resonance.3
Membrane, Gels The base surface of the plate is recessed toaccommodate the depth of gels or membranes andcan be used with:
• PVDF or nitrocellulose membranes
• PAGE gels (for example, PhastGel™)
Teflon surface
(384-position or400-position)
• Increases sensitivity because hydrophobic wallsconcentrate the sample into a small area.
• Accurate sample positioning for high throughput.
Table 3-11 Sample Plate Types, Applications, and Benefits (Continued)
Sample Plate Type Applications/Benefits
Voyager™ Biospectrometry™ Workstation User’s Guide 3-63
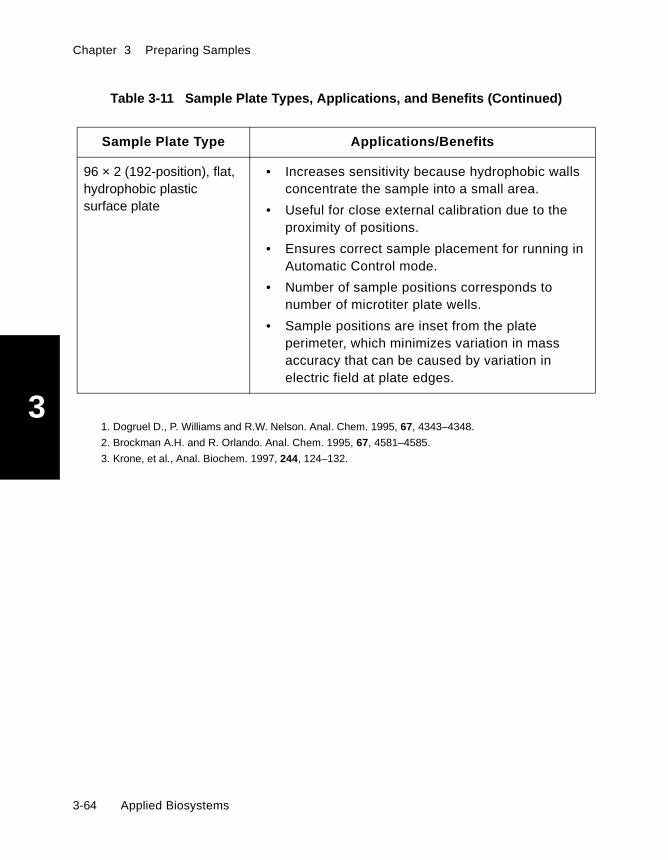
Chapter 3 Preparing Samples
3
96 × 2 (192-position), flat,hydrophobic plasticsurface plate
• Increases sensitivity because hydrophobic wallsconcentrate the sample into a small area.
• Useful for close external calibration due to theproximity of positions.
• Ensures correct sample placement for running inAutomatic Control mode.
• Number of sample positions corresponds tonumber of microtiter plate wells.
• Sample positions are inset from the plateperimeter, which minimizes variation in massaccuracy that can be caused by variation inelectric field at plate edges.
1. Dogruel D., P. Williams and R.W. Nelson. Anal. Chem. 1995, 67, 4343–4348.
2. Brockman A.H. and R. Orlando. Anal. Chem. 1995, 67, 4581–4585.
3. Krone, et al., Anal. Biochem. 1997, 244, 124–132.
Table 3-11 Sample Plate Types, Applications, and Benefits (Continued)
Sample Plate Type Applications/Benefits
3-64 Applied Biosystems

Sample Plate Types
3
3.5.2 Editable-Configuration Plate (.PLT)Types Provided with the System
Selecting platetypes (.PLT files)
You can select plate types (.PLT files) in two ways:
• When loading the plates in the mass spectrometer• From the Sample Plate menu in the Instrument Control
Panel
For an example of how to select plate types, seeSection 3.4.4, Loading Sample Plates.
Customizing .PLTfiles
You can select and use the plate types described below. Youcan also customize these plate types by editing .PLT filesprovided with the system.
Each .PLT file describes a plate configuration available forselection when a plate is loaded into the Voyager system. Formore information, see:
• Section 3.5.3, Guidelines for DefiningCustom Plate Types
• “Creating or editing a .PLT file using Notepad editor” onpage 3-83
NOTE: You cannot edit the original .PLT files provided withthe system. These are read-only files. Open the .PLT filethat describes the plate type you are customizing, edit thefile to describe the plate type you need, then save the filewith a new file name.
Voyager™ Biospectrometry™ Workstation User’s Guide 3-65

Chapter 3 Preparing Samples
3
384-positionTeflon plate
staggeredlocations
Sample locations on 384-position Teflon plates are staggered,as shown in Figure 3-9.
Figure 3-9 384-Position Staggered Sample Locations
96 × 2-positionplate staggered
“a” and “b”locations
Sample locations on 96 × 2-position plates are staggered, asshown in Figure 3-10.
Figure 3-10 96 × 2-Position PlateStaggered “a” and “b” Sample Locations
1 3 5 7 9 11 13 15 17 19 21 23
A
B
1 2 3 4 5 6 7 8 9 10 11 12
A
B
C
A
B
C
Position A1_a
Position A1_b
3-66 Applied Biosystems

Sample Plate Types
3
.PLT filesprovided
The editable-configuration plate types provided with thesystem are described in Table 3-12.
Table 3-12 Editable-Configuration Plate Types
Plate Type(name of.PLT file)
PlateDescription
Numberof
Positions
PositionArrangement
PositionDiameter
(µm)
Position Center-to-Center
Distance (µm)
64 welldisposableplate.PLT
Disposablewith wells
64 8 × 8 (subset of10 × 10)
2,540 5,080 × 5,080
100 wellplate.PLT
Reusable withwells
100 10 × 10 2,540 5,080 × 5,080
384 wellplate.PLT
Reusable withstaggered wells
384 16 × 24(A–P × 1–24)
990.60 1,803.40 × 2,639.06
400 wellplate.PLT
Reusable withwells
400 20 × 20(A–T × 1–20)
990.60 1,760.22 × 1,709.42
96 well x 2plate.PLT
Reusable withstaggered wells
192 8 × 24
A–H × 1_a–12_aand 1_b–12_b
1,500 1,100 × 1,900
Voyager™ Biospectrometry™ Workstation User’s Guide 3-67
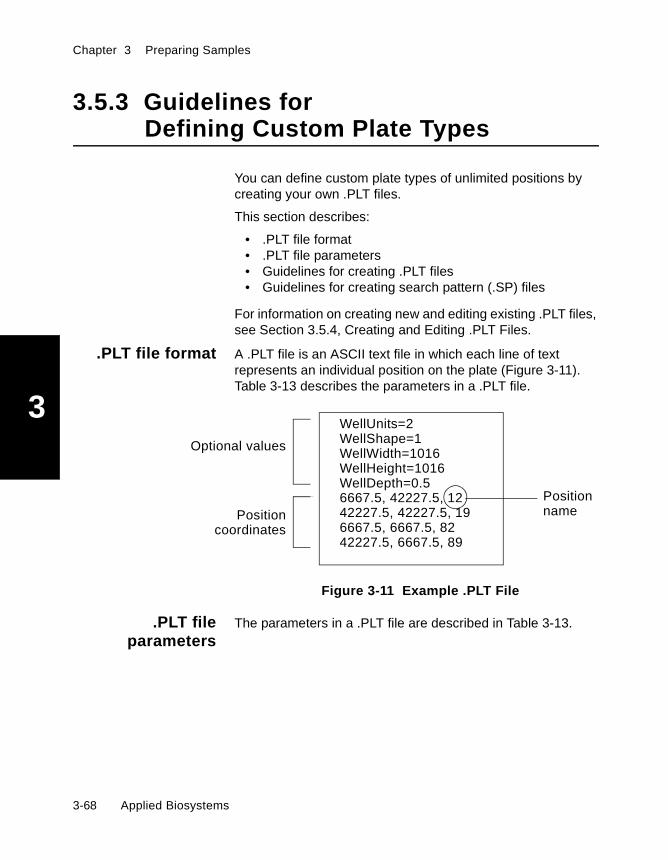
Chapter 3 Preparing Samples
3
3.5.3 Guidelines forDefining Custom Plate Types
You can define custom plate types of unlimited positions bycreating your own .PLT files.
This section describes:
• .PLT file format• .PLT file parameters• Guidelines for creating .PLT files• Guidelines for creating search pattern (.SP) files
For information on creating new and editing existing .PLT files,see Section 3.5.4, Creating and Editing .PLT Files.
.PLT file format A .PLT file is an ASCII text file in which each line of textrepresents an individual position on the plate (Figure 3-11).Table 3-13 describes the parameters in a .PLT file.
Figure 3-11 Example .PLT File
.PLT fileparameters
The parameters in a .PLT file are described in Table 3-13.
WellUnits=2WellShape=1WellWidth=1016WellHeight=1016
6667.5, 42227.5, 1242227.5, 42227.5, 196667.5, 6667.5, 8242227.5, 6667.5, 89
Optional values
PositionnamePosition
coordinates
WellDepth=0.5
3-68 Applied Biosystems

Sample Plate Types
3
Table 3-13 .PLT File Parameters
Parameter Description
WellUnits(optional)
Defines the units of the sample positions that are displayed in theManual Laser/Sample Positioning control page (see Figure 4-9 onpage 4-31). If you do not include the WellUnits parameter, thesoftware uses the default. Allowable values:
• 1 = Steps (default)• 2 = Microns
Automatically set to microns if you create the .PLT file using theCreate PLT File function (described in “Creating a .PLT file usingCreate PLT File” on page 3-79).
WellShape
(optional)
Defines the shape of the sample positions that are displayed in theManual Laser/Sample Positioning control page. If you do not includethe WellShape parameter, the software uses the default. Allowablevalues:
• 1 = Elliptical (default)• 2 = Rectangular
Corresponds to Position Shape parameter in the Create PLT Filedialog box (see Table 3-14, “Create PLT File Parameters,” onpage 3-81).
WellWidth
(optional)
Defines the width of the sample positions that are displayed in theManual Laser/Sample Positioning control page. If you do not includethe WellWidth parameter, the software uses the default (based on thevalue selected for WellUnits). Default values:
• Default Step value = 800• Default Micron value = 2,540
Corresponds to Position Width parameter in the Create PLT Filedialog box (see Table 3-14, “Create PLT File Parameters,” onpage 3-81). Automatically set to microns if you create the .PLT fileusing Create PLT File.
continued
Voyager™ Biospectrometry™ Workstation User’s Guide 3-69

Chapter 3 Preparing Samples
3
WellHeight
(optional)
Defines the height of the sample positions that are displayed in theManual Laser/Sample Positioning control page. If you do not includethe WellHeight parameter, the software uses the default (based onthe value selected for WellUnits). Default values:
• Step value = 800• Micron value = 2,540
Corresponds to Position Height parameter in the Create PLT Filedialog box (see Table 3-14, “Create PLT File Parameters,” onpage 3-81). Automatically set to microns if you create the .PLT fileusing Create PLT File.
WellDepth
(optional)
Depth (mm) of indentation of a non-flat plate (for example, a welledplate) from the surface of the plate to the bottom of the indentation. Ifnot present, the system assumes a depth of 0 (equal to a flat plate).
Corresponds to Position Depth (mm) parameter in the Create PLTFile dialog box (see Table 3-14, “Create PLT File Parameters,” onpage 3-81).
X and Y The coordinates of the position center in reference to the lower leftcorner of the sample plate. To determine the coordinates to enter inthe .PLT file, display the Sample View (see Figure 4-9 on page 4-31)and record the Absolute X, Absolute Y (logical coordinates) pairs foreach specified position. See “Logical Coordinates in Plate View inManual Laser/Sample Positioning Control Page” on page 3-78 forinformation on displaying logical coordinates.
NOTE: On a standard 100-well plate, position 91 is located atX=1587.5, Y=1587.5, and corresponds to the lower left of the sampleplate.
For optimum mass accuracy, do not specify coordinates on the outeredges of a plate.
continued
Table 3-13 .PLT File Parameters (Continued)
Parameter Description
3-70 Applied Biosystems
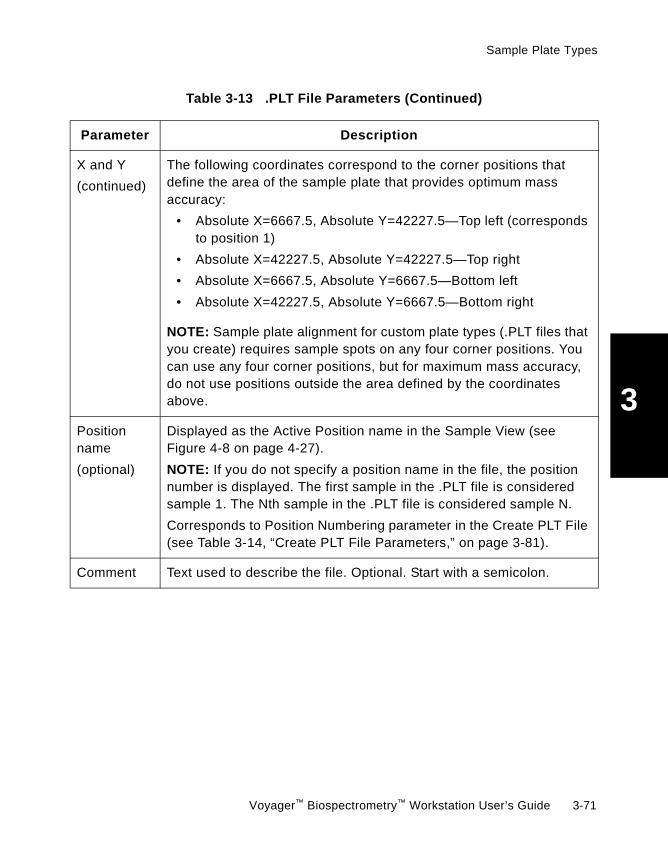
Sample Plate Types
3
X and Y
(continued)
The following coordinates correspond to the corner positions thatdefine the area of the sample plate that provides optimum massaccuracy:
• Absolute X=6667.5, Absolute Y=42227.5—Top left (correspondsto position 1)
• Absolute X=42227.5, Absolute Y=42227.5—Top right
• Absolute X=6667.5, Absolute Y=6667.5—Bottom left
• Absolute X=42227.5, Absolute Y=6667.5—Bottom right
NOTE: Sample plate alignment for custom plate types (.PLT files thatyou create) requires sample spots on any four corner positions. Youcan use any four corner positions, but for maximum mass accuracy,do not use positions outside the area defined by the coordinatesabove.
Positionname
(optional)
Displayed as the Active Position name in the Sample View (seeFigure 4-8 on page 4-27).
NOTE: If you do not specify a position name in the file, the positionnumber is displayed. The first sample in the .PLT file is consideredsample 1. The Nth sample in the .PLT file is considered sample N.
Corresponds to Position Numbering parameter in the Create PLT File(see Table 3-14, “Create PLT File Parameters,” on page 3-81).
Comment Text used to describe the file. Optional. Start with a semicolon.
Table 3-13 .PLT File Parameters (Continued)
Parameter Description
Voyager™ Biospectrometry™ Workstation User’s Guide 3-71

Chapter 3 Preparing Samples
3
Guidelines forcreating .PLT files
Note the following:
• The diameter of a position on a plate is determined by theplate used:
• If you are using welled or laser-etched plates, theposition diameter is determined by the well orlaser-etched position size (2,540 µm on a 100-wellplate).
• If you are using plates with polished blanksurfaces, the position diameter is determined bythe size of the physical sample spot delivered bymanual application or automated samplepreparation device.
• When creating a .PLT file, specify absolute X,Ycoordinates that accommodate the sample diameter, butdo not allow samples to overlap.
• After you create a .PLT file, create an .SP file toaccommodate the sample diameters defined in the .PLTfile. The DEFAULT.SP file is set to analyze 2,540-µmdiameter positions, corresponding to standard samplepositions on a 100-well plate.
NOTE: For optimum mass accuracy (if you do not use theOptimize Mass Accuracy option), do not spot sample onouter rows of the plate.
3-72 Applied Biosystems
Sample Plate Types
3
Guidelines forcreating .SP files
When creating search pattern (.SP) files to analyze samplepositions defined in custom .PLT files, note that the areaavailable for analysis around the absolute X,Y coordinate ofthe position specified in the .PLT file is determined by threefactors:
• Plate being used• Tolerances and non-systematic errors• Search pattern radius
Search pattern files are described in detail in Section 6.6.4,Search Patterns.
NOTE: You can correct for systematic errors introduced bya sample preparation device by aligning the sample plate inthe Voyager Workstation. See Section 2.7, Aligning theSample Plate.If you are using different sample preparation devices, youcan compensate for different systematic errors by creatingdifferent .PLT files and sample plate alignments for eachsystem.
Effect of plate typeon area available
for analysis
When creating search pattern files, consider the plate typesused:
• If you are using laser-etched position plates, the areaavailable for analysis is limited to the well or laser-etchedposition size (2,540 µm on a 100-well plate).
• If you are using plates with polished blank surfaces, thearea available for analysis is determined by the proximityof other positions specified. Approximately half thedistance between the X,Y coordinates of two adjacentpositions is available for analysis of each position. Forexample, if the center X,Y coordinates of the twopositions are 5,080 µm apart (plus positional tolerance,see below), approximately 2,540 µm around theX,Y coordinates is available for analysis of each position(Figure 3-12 on page 3-75).
Voyager™ Biospectrometry™ Workstation User’s Guide 3-73

Chapter 3 Preparing Samples
3
Tolerances andnon-systematic
errors
When creating search pattern files, make sure tocompensate for:
• Positional tolerance (related to variability in the position ofthe plate)
NOTE: Due to limited surface area and variability in theposition of the disposable inserts, do not specify morethan 384 positions for a disposable plate.
• Total allowable tolerance (includes the positionaltolerance plus any non-systematic error introduced bysample application)
Search patternradius
Note the following:
• To ensure complete analysis, the radius of the searchpattern file used must include the radius of the samplespot.
• To prevent analysis of the wrong sample, the radius of thesearch pattern used must not exceed half of thecenter-to-center spacing minus the total allowabletolerance (Figure 3-12).
Positional Tolerance
Plate type µm
Reusable plates 76.2
Disposable plates 381
3-74 Applied Biosystems

Sample Plate Types
3
Figure 3-12 Area Available for AnalysisCenter-to-center distance
X,Ycoordinate
Totalallowabletolerance
Search patternradius
Radius available for analysis(half the center-to-center distance)
Voyager™ Biospectrometry™ Workstation User’s Guide 3-75
Chapter 3 Preparing Samples
3
3.5.4 Creating and Editing .PLT Files
This section includes:
• Preparing the sample plate• Creating a .PLT file using Create PLT File• Creating or editing a .PLT file using Notepad editor• Creating .PLT files for SymBiot® plates
Preparing thesample plate
Preparing the sample plate involves:
• Spotting a sample plate with matrix in specific positions toallow you to see the positions on the video monitor andcorrectly locate the center of the sample position underthe laser.
• Loading a BLANK.PLT file containing one sample positionthat occupies the entire plate, to allow you to navigateanywhere on the plate and determine x,y coordinates.
WARNING
CHEMICAL HAZARD. Alpha-cyano-4-hydroxycinnamicacid (CHCA) may cause eye, skin, and respiratory tractirritation. Please read the MSDS, and follow the handlinginstructions. Wear appropriate protective eyewear, clothing,and gloves.
Preparing To prepare the sample plate before creating a .PLT file:
1. Spot a sample plate with α-cyano-4-hydroxycinnamicacid:
• If you are using the Create PLT File function tocreate the .PLT file, spot the first and last positionson the plate (Figure 3-13).
• If you are using Notepad editor to create the .PLTfile, spot the complete sample position layout forwhich you are creating the .PLT file.
3-76 Applied Biosystems
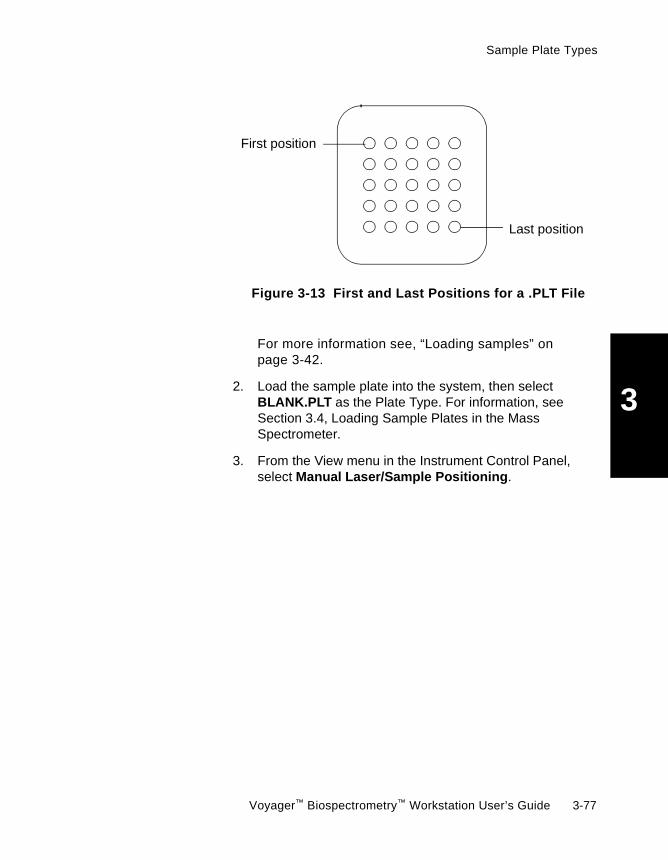
Sample Plate Types
3
Figure 3-13 First and Last Positions for a .PLT File
For more information see, “Loading samples” onpage 3-42.
2. Load the sample plate into the system, then selectBLANK.PLT as the Plate Type. For information, seeSection 3.4, Loading Sample Plates in the MassSpectrometer.
3. From the View menu in the Instrument Control Panel,select Manual Laser/Sample Positioning.
First position
Last position
Voyager™ Biospectrometry™ Workstation User’s Guide 3-77

Chapter 3 Preparing Samples
3
Figure 3-14 shows the Plate View displaying the logicalcoordinates for the BLANK.PLT file.
Figure 3-14 Logical Coordinates in Plate View inManual Laser/Sample Positioning Control Page
Logicalcoordinates
3-78 Applied Biosystems

Sample Plate Types
3
Creating a .PLTfile using Create
PLT File
The Create PLT File function creates .PLT files that specifypositions:
• In evenly spaced rows and columns (identical Ycoordinates for all positions in a row, and identical Xcoordinates for all positions in a column).
• Sequentially from left to right and top to bottom across theplate.
• With units in microns.
To create .PLT files that specify staggered positions (forexample, the 384-well plate shown in Figure 3-9 onpage 3-66) or positions that are not evenly spaced, or to editan existing .PLT file, see “Creating or editing a .PLT file usingNotepad editor” on page 3-83.
Using Create PLTFile
To create a .PLT file using Create PLT File:
1. Perform the procedure in “Preparing the sample plate”on page 3-76.
2. Use the Manual Laser/Sample Positioning control page(see Figure 3-14 on page 3-78) or the control stick todetermine the center Absolute X and Y coordinates for thefirst and last positions on the plate for which you arecreating the .PLT file (see Figure 3-13 on page 3-77).
3. In the Instrument Control Panel, select Create PLT Filefrom the Tools menu to display the Create PLT File dialogbox (Figure 3-15).
Voyager™ Biospectrometry™ Workstation User’s Guide 3-79

Chapter 3 Preparing Samples
3
Figure 3-15 Create PLT File Dialog Box
3-80 Applied Biosystems

Sample Plate Types
3
4. Set the parameters described below:
Table 3-14 Create PLT File Parameters
Parameter Description
Number of columns Limited by plate size. Total number of positions (columns ×rows) cannot exceed 32,766.
NOTE: The OptiPlate application can use .PLT files with amaximum of 30 columns in a grid pattern, or 60 columns inan offset grid pattern.
Number of rows Maximum of 52. Total number of positions (columns × rows)cannot exceed 32,766.
NOTE: The OptiPlate application can use .PLT files with amaximum of 30 rows.
NOTE: The OptiPlate application can use .PLT files with amaximum of 30 rows in a grid pattern, or 15 rows in an offsetgrid pattern.
Position Width andHeight (µm)
Width and height of positions.
Corresponds to WellWidth and WellHeight parameters in the.PLT file (see Table 3-13, “.PLT File Parameters,” onpage 3-69).
Position Depth (mm) Depth of indentation of a non-flat plate (for example, awelled plate) from the plate surface to the bottom of theindentation. A setting of 0 is equal to a flat plate.
Measure the depth of a position on the plate with a micrometerto determine the value to enter.
This parameter corrects for the distance between the sample ina welled plate and the variable-voltage grid in the ion source,which affects calibration. An accurate well depth increases theaccuracy of the default calibration, external calibration, andmass optimization with OptiPlate.
Corresponds to WellDepth parameter in the .PLT file (seeTable 3-13, “.PLT File Parameters,” on page 3-69).
continued
Voyager™ Biospectrometry™ Workstation User’s Guide 3-81

Chapter 3 Preparing Samples
3
5. Click next to the Plate File (PLT) field. Specify thedirectory in which to store the .PLT file, type the name forthe file, then click Save.
6. Click Create PLT.
7. Check the sample plate alignment. See Section 3.5.5,Adjusting the Laser Position for a Custom .PLT File.
Position Shape Ellipse or Rectangle.
Corresponds to WellShape parameter in the .PLT file (seeTable 3-13, “.PLT File Parameters,” on page 3-69).
Position Numbering If you select Numeric, positions are numbered sequentiallyfrom 1 to 32,766.
If you select Alphanumeric, rows are assigned letters, andpositions are numbered sequentially within the row (forexample, A1 through An for the first row, B1 through Bn forthe second row, and so on.) If the number of rows exceeds26, double letters are used (for example AA1 through AAn.)
Corresponds to PositionName parameter in the .PLT file(see Table 3-13, “.PLT File Parameters,” on page 3-69).
First position(upper left) X and YandLast position(lower right) X and Y
Absolute coordinates of starting and ending position centersrelative to the lower left corner of the sample plate.
The software extrapolates to determine coordinates of allother positions.
To determine the coordinates to enter in the .PLT file, displaythe Sample View (see Figure 4-9 on page 4-31) and recordthe Absolute X, Absolute Y (logical coordinates) pairs for thefirst and last position. See “Logical Coordinates in PlateView in Manual Laser/Sample Positioning Control Page” onpage 3-78 for information on displaying logical coordinates.
Comment Comment stored with .PLT file. Optional.
Table 3-14 Create PLT File Parameters (Continued)
Parameter Description
3-82 Applied Biosystems
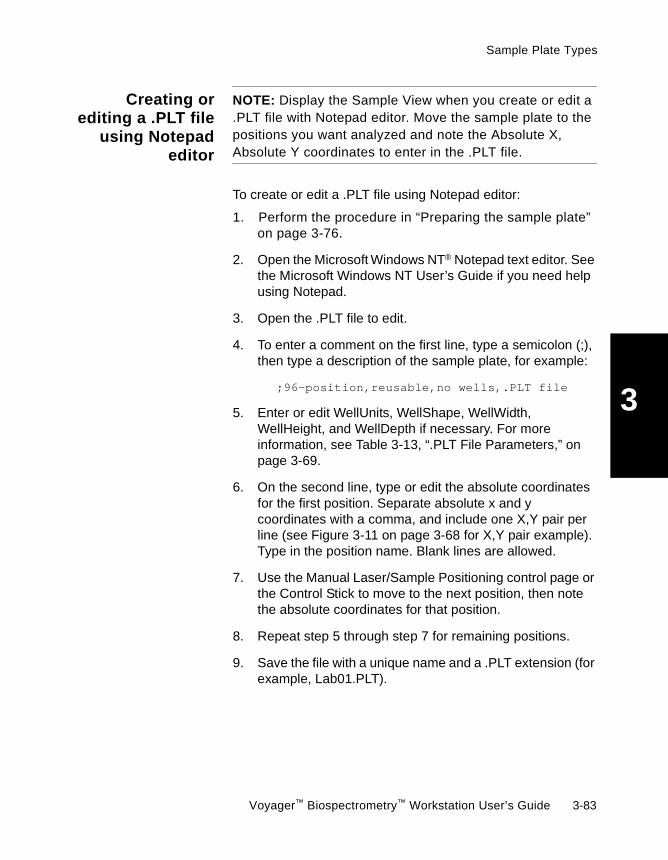
Sample Plate Types
3
Creating orediting a .PLT file
using Notepadeditor
NOTE: Display the Sample View when you create or edit a.PLT file with Notepad editor. Move the sample plate to thepositions you want analyzed and note the Absolute X,Absolute Y coordinates to enter in the .PLT file.
To create or edit a .PLT file using Notepad editor:
1. Perform the procedure in “Preparing the sample plate”on page 3-76.
2. Open the Microsoft Windows NT® Notepad text editor. Seethe Microsoft Windows NT User’s Guide if you need helpusing Notepad.
3. Open the .PLT file to edit.
4. To enter a comment on the first line, type a semicolon (;),then type a description of the sample plate, for example:
;96-position,reusable,no wells,.PLT file
5. Enter or edit WellUnits, WellShape, WellWidth,WellHeight, and WellDepth if necessary. For moreinformation, see Table 3-13, “.PLT File Parameters,” onpage 3-69.
6. On the second line, type or edit the absolute coordinatesfor the first position. Separate absolute x and ycoordinates with a comma, and include one X,Y pair perline (see Figure 3-11 on page 3-68 for X,Y pair example).Type in the position name. Blank lines are allowed.
7. Use the Manual Laser/Sample Positioning control page orthe Control Stick to move to the next position, then notethe absolute coordinates for that position.
8. Repeat step 5 through step 7 for remaining positions.
9. Save the file with a unique name and a .PLT extension (forexample, Lab01.PLT).
Voyager™ Biospectrometry™ Workstation User’s Guide 3-83

Chapter 3 Preparing Samples
3
Hint: Some applications automatically append a .TXTextension to file names. To name the file with a .PLTextension, include the file name and extension indouble-quotes in the Save File dialog box, for example“100Well.PLT”.
10. Check the sample plate alignment. See Section 3.5.5,Adjusting the Laser Position for a Custom .PLT File.
Creating .PLTfiles for SymBiot
plates
If you spot sample plates in evenly spaced rows and columnsusing the SymBiot® Sample Workstation, you can use theCreate PLT File function to extrapolate the X,Y coordinates ofthe sample positions and quickly and easily create a .PLT file.Follow the procedure in “Creating a .PLT file using Create PLTFile” on page 3-79.
If you spot sample plates in more complex patterns, you mustcreate the. PLT file manually. Follow the procedure in“Creating or editing a .PLT file using Notepad editor” onpage 3-83.
3-84 Applied Biosystems

Sample Plate Types
3
3.5.5 Adjusting the LaserPosition for a Custom .PLT File
After you have defined your own sample plate format:
1. Spot sample on the four corner positions defined in the.PLT file. For optimum mass accuracy, do not spotsample on the outer edges of the plate.
2. Load the sample plate and .PLT file as described inSection 3.4.4, Loading Sample Plates.
3. Check the laser beam position on these sample positionsas described in Figure 3-14 on page 3-78.
If the beam does not strike the center of the sampleposition, align the sample plate as described inSection 2.7, Aligning the Sample Plate.
Voyager™ Biospectrometry™ Workstation User’s Guide 3-85

Chapter 3 Preparing Samples
3
3-86 Applied Biosystems

4Chapter
4 VoyagerInstrument ControlPanel Basics
This chapter contains the following sections:
4.1 Instrument Control Panel ................................. 4-2
4.2 Using the Control Pages .................................. 4-8
4.3 Using the Spectrum Window .......................... 4-10
4.4 Customizing the Instrument Control Panel ..... 4-21
4.5 Controlling the Workstation ............................ 4-24
4.6 Sequence Control Panel ................................ 4-32
4.7 How the Instrument andSequence Control Panels Interact.................. 4-33
Voyager™ Biospectrometry™ Workstation User’s Guide 4-1
Chapter 4 Voyager Instrument Control Panel Basics
4
4.1 Instrument Control Panel
The Voyager Instrument Control Panel allows you to directlycontrol the Voyager mass spectrometer to acquire and inspectmass spectra in Manual or Automatic Control mode.
NOTE: The Voyager Sequence Control Panel allows you tocollect data for multiple samples using different conditions.For more information, see Section 4.6, Sequence ControlPanel, and Section 4.7, How the Instrument and SequenceControl Panels Interact.
This section includes:
• Parts of the Instrument Control Panel• Manual and Automatic Control modes• Accessing the Sequence Control Panel and the Data
Explorer Software
4.1.1 Parts of the Instrument Control Panel
The Instrument Control Panel includes:
• Toolbar• Control pages• Spectrum window• Status bar• Output window
When you start the Voyager Instrument Control software, theInstrument Control Panel (Figure 4-1) is displayed.
NOTE: If the Instrument Control Panel is not displayed asshown in Figure 4-1, select Default Layout from the Viewmenu.
4-2 Applied Biosystems

Instrument Control Panel
4
Figure 4-1 Instrument Control Panel
Toolbar The toolbar contains buttons that control the software and theinstrument.
For a description of a toolbar button, place the cursor on it. Abrief description of the button (Tooltip) is displayed below thebutton.
For more information, see Section 4.5.1, Using ToolbarButtons and Instrument Menu Commands.
Toolbar
Status bar
Spectrum window
Instrument settings file name
Manual Laser/
Control page
InstrumentSettings
Sample Position
Data StorageControl page
Output window
Control page
Voyager™ Biospectrometry™ Workstation User’s Guide 4-3
Chapter 4 Voyager Instrument Control Panel Basics
4
Control pages The Instrument Control Panel contains five control pages:
• Instrument Settings—Controls settings for instrumentmode, voltages, spectrum acquisition, and calibration.For more information, see Chapter 5, OptimizingInstrument Settings.
• Data Storage—Controls data storage information suchas file location and file name. For more information, see“Setting Data Storage parameters” on page 6-14.
• System Status—Contains information regarding thestatus of the instrument. For more information, seeSection 2.11, Checking System Status and Pressures.
• Manual Laser/Sample Positioning—Allows you tomanually control the laser intensity and sample plateposition. For more information, see Section 4.5.2,Adjusting Laser Intensity and Selecting Sample Position.
• PSD Acquisition Settings—Allows you to control PSDacquisition. For more information, see Chapter 8, PSDAnalysis.
NOTE: The PSD Acquisition control page is displayedonly if you are in PSD mode on a Voyager-DE PRO orVoyager-DE STR system.
You can access a control page by selecting it from the Viewmenu or clicking the corresponding toolbar button.
You can display any combination of control pages. Forinformation, see Section 4.2, Using the Control Pages.
For a description of parameters contained on the controlpages, see Section 5.2, Instrument SettingsParameter Descriptions, and Chapter 8, PSD Analysis.
4-4 Applied Biosystems

Instrument Control Panel
4
Spectrum window The Spectrum window provides a display of data. The datadisplayed depends on your digitizer option:
• Signatec, LeCroy, or Acqiris digitizers—Displays a live(real-time) spectrum trace as data is acquired. Tracechanges from Live to Current when acquisition ends.
• Tektronix oscilloscope—No trace displayed duringacquisition. Displays a Current spectrum trace whenacquisition is complete.
When acquisition is complete, peaks can be detected andlabeled.
For more information, see Section 4.3, Using theSpectrum Window.
Status bar The status bar (Figure 4-2) at the bottom of the InstrumentControl Panel displays status for Instrument State, HighVoltage, Source (BA1) and Mirror (BA2) Chamber Pressure,Acquisition status, Control Mode set in the loaded .BIC,Instrument Mode and Ion Polarity set in the loaded .BIC, theActive Position selected for analysis, and the current laserintensity.
Figure 4-2 Status Bar
Output window The Output window includes two tabs at the bottom thatdisplay information:
• Data Storage—Displays the file name of the .DAT filewhere the spectrum is stored when you save a spectrum.This tab displays a running list of .DAT files. You can clearthe window by right-clicking on the window and selectingClear.
• Automatic Control—If you are operating in AutomaticControl mode, the Automatic Control tab displays currentlaser setting, search pattern position, and spectrumevaluation results. For information on Automatic Controlmode, see Section 6.6, Acquiring inAutomatic Mode from the Instrument Control Panel.
Voyager™ Biospectrometry™ Workstation User’s Guide 4-5
Chapter 4 Voyager Instrument Control Panel Basics
4
Displaying The Output window is automatically displayed when you:
• Acquire data• Store data
To display the Output window manually, select OutputWindow from the View menu.
To close the Output window, deselect Output Window fromthe View menu, or right-click in the Output window and selectHide.
Maximum numberof entries
The Output window can contain a maximum of 1,000 lines. Ifthe total number of lines exceeds 1,000, the oldest 500 linesare automatically deleted. The most recent 500 entries areretained.
4.1.2 Manual and Automatic Control Modes
Overview The Instrument Control Panel allows two modes of operation:
• Manual Control mode—Enables manual control of thelaser, sample positioning, and data storage.
• Automatic Control mode—Enables automated controlof the laser, sample positioning, data storage after youset spectrum accumulation parameters, and spectrumacceptance criteria.
Manual Controlmode
To select Manual Control mode:
1. Open the Instrument Control Panel.
2. Select Instrument Settings from the View menu.
3. Click the Manual button on the Instrument Settingscontrol page.
Laser controls, sample positioning, and data storageare available for manual adjustment and control.
For additional information on manual control mode, seeSection 5.2.1, Instrument Settings Page.
4-6 Applied Biosystems
Instrument Control Panel
4
AutomaticControl mode
To select Automatic Control mode:
1. Open the Instrument Control Panel.
2. Select Instrument Settings from the View menu.
3. Click the Automatic button on the Instrument Settingscontrol page.
4. Click the Automatic Control button.
5. Set laser controls, sample positioning, and data storagefor automatic adjustment and control as described inSection 6.6.2, Setting Instrument Settings for AutomaticControl Mode.
4.1.3 Accessing the Sequence Control Paneland the Data Explorer Software
You can access the Sequence Control Panel and DataExplorer software from the Instrument Control Panel by:
• Selecting commands from the Applications menu• Clicking toolbar buttons
Accessing DataExplorer
If you access the Data Explorer software from the InstrumentControl Panel, the following happens:
• The last data file you saved in the Instrument ControlPanel is automatically opened in Data Explorer.
• If Data Explorer is already running and displaying a datafile, the data file is automatically closed when you accessData Explorer from the Instrument Control Panel.
Voyager™ Biospectrometry™ Workstation User’s Guide 4-7

Chapter 4 Voyager Instrument Control Panel Basics
4
4.2 Using the Control Pages
The Instrument Control Panel allows you to display, organize,and rearrange one or more control pages.
This section describes:
• Displaying control pages• Types of page control
Displayingcontrol pages
You can display control pages in several ways:
• Select individual control pages from the View menu.
• Select the View menu, then select Default Layout todisplay the Spectrum window, Data Storage, and ManualLaser/Sample Positioning control pages.
NOTE: Depending on the size of your computerscreen, some control pages may be only partiallydisplayed. To display the entire control page, click-dragthe page borders to resize.
Hint: A toolbar button is available for selecting DefaultLayout. See the Data Explorer Software User’s Guide,“Customizing toolbars” on page 1-21, for information oncustomizing the toolbar. The button is located inthe Window category.
4-8 Applied Biosystems
Using the Control Pages
4
Types of pagecontrol
You can select between two types of page control for thecontrol pages:
• Docked—Pages are attached, or “anchored” to otherpages or the edge of the Instrument Control Panel.
You can do the following with a docked page:
• Deselect it from the View menu to close it.
• Double-click it to change it to a floating page(described below). This automatically maximizesthe page. Double-click it again to dock the page.
• Right-click on it and deselect Allow Docking tochange it to a floating page. This automaticallymaximizes the page. Double-click on the page todock the page.
• Click-drag the page borders to resize it.
• Floating—Pages are not docked to other pages or theedge of the Instrument Control Panel.
You can do the following with a floating page:
• Deselect it from the View menu, or click in thetop-right corner of the page to close it.
• Click-drag the page borders to resize it.
• Click-drag it to a different location on the screen.
• Double-click to change it to docked page.
Voyager™ Biospectrometry™ Workstation User’s Guide 4-9

Chapter 4 Voyager Instrument Control Panel Basics
4
4.3 Using the Spectrum Window
This section includes:
• Adjusting the display range• Zooming on traces• Adding traces to a window• Annotating traces• Previewing and printing traces
4.3.1 Adjusting the Display Range
To set the display range in Spectrum window:
1. Click the Spectrum window to activate it.
2. From the Display menu, select Range.
X range 3. Select X Range to set the x-axis range.
The X Axis Setup dialog box (Figure 4-3) is displayed.
Figure 4-3 X Axis Setup Dialog
4. Set From and To values for the display range (m/z units),then click OK.
4-10 Applied Biosystems

Using the Spectrum Window
4
Y range 5. From the Display menu, select Range.
6. Select Y Range to scale the y-axis.
The Y Axis Setup dialog box (Figure 4-4) is displayed.
Figure 4-4 Y Axis Setup Dialog Box
7. Set the parameters described below:
Parameter Description
Scaling Mode
Display Relative Autoscales the trace to the largest peak in the selected range.
Base PeakRelative
Autoscales the trace to the base peak in the entire range, not theselected range. Displays a right-axis label with the base peakintensity.
NOTE: To turn off the right axis, select Graphic Options fromthe Display menu, click the Graph #1 Setup tab, then deselectthe Show Right Y-Axis check box.
continued
Voyager™ Biospectrometry™ Workstation User’s Guide 4-11

Chapter 4 Voyager Instrument Control Panel Basics
4
8. Click OK.
Scaling Mode (continued)
Absolute Value Sets the trace to the Y Display Range you enter in the Y DisplayRange From/To boxes.
Display Min/Max Sets the trace display to the minimum and maximum Y values.
Minimum Absolute Max Y
Use Limit Sets the minimum value for the maximum Y-axis setting. Usefulto maintain relative scaling of peaks and to prevent autoscalingnoise to full scale.
Y Display Range
From/To Sets the range for scaling. If Display Relative or Base PeakRelative is selected, range is in percent.
If Absolute Value is selected, range is in counts.
Parameter Description
4-12 Applied Biosystems
Using the Spectrum Window
4
4.3.2 Zooming on Traces
Zooming andunzooming
You can expand (zoom) an area of a trace by click-dragging abox around the area of interest.
You can also click buttons in the toolbar to:
• Zoom in
• Zoom out to the previous zoom
• Full Unzoom
Expanding andlinking traces
When you have more than one trace displayed in the samedata file in a window, you can:
• Select (click on) a trace, then click in the toolbar toexpand the selected trace for closer examination. Todisplay all traces, click the button again.
• Click in the toolbar to link all traces. Any zoomingactions you perform on one trace affect all traces linkedto it. To unlink traces, click the button again.
4.3.3 Adding Traces to a Window
This section describes:
• Types of traces• Adding traces• Removing traces
Voyager™ Biospectrometry™ Workstation User’s Guide 4-13
Chapter 4 Voyager Instrument Control Panel Basics
4
Types of traces The Spectrum window can contain two types of traces(see Figure 4-5 on page 4-15):
• Live/Current—A live, real-time trace of data. The displayupdates as you view or acquire data. When acquisition iscomplete, the trace name changes from Live to Current.
NOTE: On systems with Signatec, LeCroy, or Acqirisdigitizers, the Live Trace dynamically updates as datais acquired. On systems with Tektronix oscilloscopes, acomplete Current trace is displayed only after acquisitionis complete.
• Accumulated Spectrum—A trace that is made up of oneor more spectra that you have manually or automaticallyaccepted.
Adding traces The Spectrum window can display a total of four traces at onetime. To add a new trace to a window:
1. Activate (click on) the Spectrum window.
2. Click in the toolbar.
NOTE: You can add traces by selecting Add/RemoveTraces from the Display menu.
If the trace position has not previously been used forthe current acquisition, the software adds a Not Usedtrace to the window.
If the trace position has previously been used for thecurrent acquisition, the software adds a trace thatcontains the data originally displayed. For example, ifyou add a second trace, then remove the trace, thenadd the second trace again, the original trace isdisplayed again, instead of a Not Used trace.
4-14 Applied Biosystems

Using the Spectrum Window
4
Hint: Resize the window to view all added traces.
Figure 4-5 Adding Traces
When you add a specific type of trace, the label of the tracechanges from Not Used to the label for the type of tracecreated.
Removing traces To remove a trace from the Spectrum window:
1. Select (click on) the trace.
2. Click in the toolbar.
The trace is removed.
Voyager™ Biospectrometry™ Workstation User’s Guide 4-15

Chapter 4 Voyager Instrument Control Panel Basics
4
4.3.4 Annotating Traces
Two ways toannotate
You can add text annotation to traces by:
• Copying ASCII text from any source, then pasting on thetrace
• Typing text on the trace
Copying text fromASCII source
To copy ASCII text:
1. Open the ASCII text file.
2. Select the line of text to copy, then right-click and selectCopy from the menu displayed.
NOTE: If you select more than one line of text, only thefirst line is pasted when you annotate the trace.
Annotatingthe trace
To annotate the trace:
1. Click on the trace at the location at which you want toinsert text.
2. Right-click, then select Paste text if you copied results, orAdd text annotation if you want to type in text. Type intext as needed.
The text is added to the trace.
NOTE: The text is associated with the x-coordinate. Ifyou zoom on a different region of the trace and thex-coordinate moves out of view, the annotated text alsomoves out of view.
Hint: To move the text, left-click and hold on the text,then drag to the desired position.
4-16 Applied Biosystems
Using the Spectrum Window
4
3. To customize the appearance of the annotated text, seeSection 4.4, Customizing the Instrument Control Panel.
NOTE: Text annotations are associated with theSpectrum window, not the trace. Text annotationsremain in the window after the trace is overwritten by anew trace. Text annotations are not saved in thedata file.
4. To delete the annotation, do either of the following:
• Select the text and right-click. Select theappropriate delete or cut option.
• Right-click on the trace and select Delete All Text.
Voyager™ Biospectrometry™ Workstation User’s Guide 4-17

Chapter 4 Voyager Instrument Control Panel Basics
4
4.3.5 Previewing and Printing Traces
This section includes:
• Previewing and printing traces• Dedicating a printer to landscape orientation• Print Setup
Previewing andprinting
To preview and print traces:
Setting trace colorsmanually
1. Display the traces as desired.
For a clear printout, you can set the Trace Color andother attributes to black before printing traces:
• Select Graphic Options from the Display menu.
• Click Use the same settings for all graphs inView Setup (to change all traces if desired).
• Click Graph #1 Setup, and set colors as needed.
When manually setting colors, note the following:
• Selections set to white (or line widths set to 0)may not print on certain printers.
• If you select different trace colors for multipletraces, only the color for the active trace is saved.
Printing 2. Click on the Spectrum window to print.
3. To print with the x-axis along the longest length of thepaper, select Print Setup from the File menu and selectLandscape orientation.
4-18 Applied Biosystems

Using the Spectrum Window
4
NOTE: If you set Landscape printing orientation withinInstrument Control Panel, this setting is lost when youclose Instrument Control Panel. To permanently set theprinter, see “Dedicating a printer to landscapeorientation” on page 4-20.
4. From the File menu, select Print Preview to view thetraces before printing.
NOTE: To print without previewing, select PrintSpectrum from the File menu.
5. Click Print.
NOTE: To print a trace that is displayed as VerticalBars, change the Line Width to 1. If Line Width is setto 0, Vertical Bar traces may not print. See Section 4.4,Customizing the Instrument Control Panel, forinformation.
NOTE: Line Widths of 0 or 1 (or lines set to the colorwhite) may not print on certain printers. If traces do notprint, change the line width (or color).
Voyager™ Biospectrometry™ Workstation User’s Guide 4-19
Chapter 4 Voyager Instrument Control Panel Basics
4
Dedicating aprinter to
landscapeorientation
To dedicate the printer to landscape orientation, set theorientation from the Windows desktop:
1. Click Start, then select Settings.
2. Click Printers.
3. Select the printer name in the list displayed.
4. Click on File and select Document Defaults.
5. In the Page Setup Tab, select Landscape orientation.
NOTE: This printer setting will affect all applicationsthat use the printer, not just the Voyager software.
NOTE: If you cannot select Landscape orientation, youdo not have access permission. See your administrator.
Print Setup Print Setup allows you to select a printer and set other printeroptions. For more information on Print Setup and connectingprinters to your computer, refer to the documentation providedwith your computer.
4-20 Applied Biosystems

Customizing the Instrument Control Panel
4
4.4 Customizing theInstrument Control Panel
Undockingtoolbars
The toolbar at the top of the Instrument Control Panel isdivided into sections. A section is preceded by a doublevertical bar.
You can “undock” each section of the toolbar and move itanywhere within the Instrument Control Panel byclick-dragging the double bar at the left of the toolbar section.
To move the toolbar section back to the top of the window,click-drag the toolbar back to the original position.
Customizing thetoolbar
See the Data Explorer Software User’s Guide, “Customizingtoolbars” on page 1-21, for information on customizing thetoolbar.
Customizingthe display
To customize the display, use the Graph and Plot Optionsdialog box (Figure 4-6) to:
• Change colors of the trace and trace background• Change color of peak labels• Change the appearance of annotation text• Turn axes on and off, and change axis appearance• Turn cursor and grids on and off
Hint: You can use the same settings for all graphs. Beforemaking individual graph selections, select the View SetupTab. Select Use same settings for all graphs. Select anyGraph Setup tab and make selections. The selections willbe applied to the remaining Graphs Setup tabs.
Voyager™ Biospectrometry™ Workstation User’s Guide 4-21
Chapter 4 Voyager Instrument Control Panel Basics
4
Accessinggraphic options
To access the graphic options:
1. Display the trace of interest.
2. From the Display menu, select Graphic Options, thenclick a Graph Setup tab in the Graph and Plot Optionsdialog box (see Figure 4-6 on page 4-23).
3. Set Setup parameters.
4. Set colors, line widths, data cursors, and graphiccompression. See the Data Explorer Software User’sGuide, Section 1.5, Setting Graphic Options, for moreinformation.
NOTE: Line Widths of 0 or 1 (or lines set to the colorwhite) may not print on certain printers. If traces do notprint, change the line width (or color).
5. Click OK.
Changingline type of trace
You can change between two line types for the trace:
• Lines—Displays a continuous trace of connected datapoints.
• Vertical Bars—Displays a vertical line for each datapoint, where the height of the bar is equal to the intensityof the data point.
NOTE: To print a trace that is displayed as VerticalBars, change the Line Width to 1. If Line Width is set to0, Vertical Bar traces may not print.
4-22 Applied Biosystems
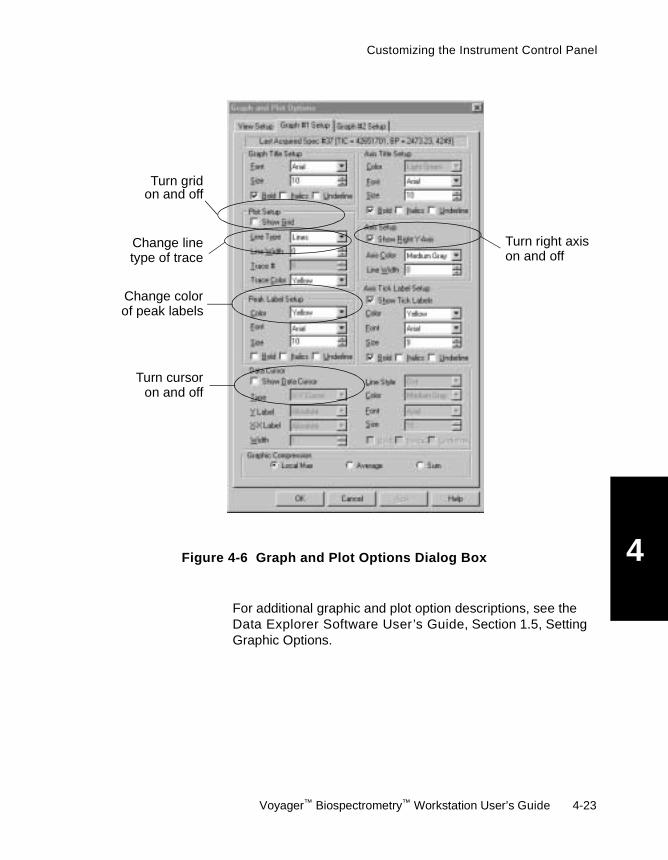
Customizing the Instrument Control Panel
4
Figure 4-6 Graph and Plot Options Dialog BoxFor additional graphic and plot option descriptions, see theData Explorer Software User’s Guide, Section 1.5, SettingGraphic Options.
on and offTurn grid
Change linetype of trace
Change colorof peak labels
Turn right axison and off
Turn cursoron and off
Voyager™ Biospectrometry™ Workstation User’s Guide 4-23

Chapter 4 Voyager Instrument Control Panel Basics
4
4.5 Controlling the Workstation
This section includes:
• Using toolbar buttons and Instrument menu commands• Adjusting laser intensity and selecting sample position
4.5.1 Using Toolbar Buttons andInstrument Menu Commands
Instrument buttons in the toolbar (Figure 4-7) and Instrumentmenu commands allow you to control the software and theVoyager mass spectrometer.
Figure 4-7 Instrument Toolbar
Use toolbar buttons and Instrument menu commands in theInstrument Control Panel to:
• Turn high voltage on and off• Load/eject the sample plate• Select the active sample position• Turn acquisition (laser) on and off• Save data• Accumulate and clear spectra
4-24 Applied Biosystems

Controlling the Workstation
4
Turninghigh voltage on
and off
Click in the toolbar to turn the high voltage on and off.You can also control high voltage by selecting Turn On/OffHigh Voltage from the Instrument menu.
NOTE: High voltage is automatically turned on when anacquisition is started. High voltage is automatically turnedoff when exiting the Instrument Control Panel or ejecting asample plate.
Loading andejecting the
sample plate
Click in the toolbar to load or eject the sample plate. Youcan also load or eject the sample plate by selecting Load orEject from the Sample Plate menu.
Selecting theactive sample
position
Click in the toolbar to select the active sample position.You can also select from the Manual Laser/Sample Positioncontrol page described on page 4-27.
Turningacquisition (laser)
on and off
Click in the toolbar to turn acquisition (laser) on and off.You can also control acquisition by selecting commands fromthe Instrument menu.
When the system is acquiring:
• The button is depressed
• The Acquisition field in the status bar at the bottom of theInstrument Control Panel is green and displays“Acquisition-ON”
• High voltage is on
Saving data Click in the toolbar to manually save the selected currentor accumulated trace. You can also save data by selectingSave Spectrum from the Acquisition menu. For additionalinformation, see “Saving data” on page 6-18.
Voyager™ Biospectrometry™ Workstation User’s Guide 4-25
Chapter 4 Voyager Instrument Control Panel Basics
4
Accumulatingspectra
Click in the toolbar to manually accumulate spectra. Youcan also accumulate spectra by selecting AccumulateSpectrum from the Acquisition menu. For more information,see Section 6.2.2, Manually Accumulating Spectrafrom Multiple Acquisitions.
Clearing anaccumulated
spectrum
Click in the toolbar to manually clear an accumulatedspectrum. You can also clear an accumulated spectrum byselecting Clear Accumulated Spectrum from the Acquisitionmenu. For more information, see Section 6.2.2, ManuallyAccumulating Spectra from Multiple Acquisitions.
4-26 Applied Biosystems

Controlling the Workstation
4
4.5.2 Adjusting Laser Intensity andSelecting Sample Position
This section describes:
• Displaying the Manual Laser/Sample Position page• Manually adjusting laser intensity• Selecting the active sample position in Plate view• Displaying coordinates of active position• Switching between Plate view and Sample view• Adjusting sample position in Sample view
For information on automatically controlling the laser andsample position see Section 5.2.3, Automatic Control DialogBox.
Displaying theManual Laser/
Sample Positioncontrol page
Select Manual Laser/Sample Position from the View menuto display the Manual Laser/Sample Position control page(Figure 4-8 and Figure 4-9 on page 4-31).
Figure 4-8 Manual Laser/Sample Position Control Page—Plate View
Slider lasercontrol
Active position
Coordinates
Fine
Coarse
of activeposition
lasercontrol
lasercontrol
Laser setting
Voyager™ Biospectrometry™ Workstation User’s Guide 4-27

Chapter 4 Voyager Instrument Control Panel Basics
4
Manuallyadjusting laser
intensity
You can adjust the laser intensity using any of the following:
• Slider control—Use to set laser intensity to an exactsetting. To use the slider control, click-drag the slider
to adjust laser intensity.
• Fine laser controls —Use to adjust the intensityin small increments.
• Coarse laser controls —Use to adjust theintensity in large increments.
You can set the small and large increments in the LaserConfiguration dialog box. For more information, see “LaserConfiguration” on page 2-42.
NOTE: After adjusting the laser intensity, the slider and fineand coarse adjusting buttons are disabled while the systemadjusts the laser to the intensity specified.
Hint: You can also set laser intensity by pressingCtrl+PgUp and Ctrl+PgDn on the keyboard. Pressingthese keys adjusts intensity in the same increments as thefine laser control buttons.
4-28 Applied Biosystems

Controlling the Workstation
4
Selecting theactive sample
position in Plateview
The active sample position is the sample position from whichdata is acquired. Select the active sample position (from thePlate view) by doing any of the following:
• Type a position name or number in the Active Positionfield.
• Select a number from the drop-down list in the ActivePosition field.
• Click on a sample position (ToolTip displays the positionnumber).
• Use the control stick to move to a sample position. Formore information on using the control stick, seeSection I.3, Using the Control Stick.
NOTE: When you use the control stick to select a sampleposition, if the software determines that you have gonebeyond the boundary of a position, it will automaticallychange to the closest Active Position. Position boundariesare determined/calculated from the Sample Plate Template(.PLT) file. For more information, see “Effect of plate typeon area available for analysis” on page 3-73.
Displayingcoordinates ofactive position
The location (X,Y) coordinates of the active position aredisplayed at the bottom of the Manual Laser/Sample Positioncontrol page:
• Relative—Displays the X,Y coordinates (microns)relative to the center of the Active Position.
• Absolute—Displays the X,Y coordinates (microns)relative to the home position (position in the lower leftcorner of the sample plate).
NOTE: If the coordinates are not displayed, you canclick-drag the bottom border of the control page to makethem visible.
Voyager™ Biospectrometry™ Workstation User’s Guide 4-29

Chapter 4 Voyager Instrument Control Panel Basics
4
You can use these coordinates when you create a searchpattern file. For information on creating an .SP file, see“Creating and Editing .SP Files Using the Search PatternEditor” on page 6-50.
Switchingbetween Plate
andSample view
You can change the view of the sample plate between thewhole sample plate and a single sample position. Refer to thefollowing table for plate view choices:
In this view... If you... The view...
Plate(Figure 4-8 onpage 4-27)
Single-click on a position • Moves to the selected position
• Displays position number inthe Active Position field
• Turns the Active Positionwhite
Double-click on the activeposition
NOTE: If you double-clickbetween positions, thesoftware zooms on thelocation on which youclicked, and selects theclosest defined position asthe Active Sample Position.
• Moves to the selected position
• Displays position number inthe Active Position field
• Switches to Sample View
• Turns the Active Positionwhite
Double-click on a non-activeposition
• Moves to the selected position
• Makes it the active position
• Displays position number inthe Active Position field
Sample(Figure 4-9 onpage 4-31)
Single-click or double-clickon a position
• Moves to selected location ofthe sample position
4-30 Applied Biosystems

Controlling the Workstation
4
Hint: If you right-click on a position, you can changebetween Sample View and Plate View.
Figure 4-9 Manual Laser/Sample Position Control Page—Sample View
Adjusting sampleposition in the
Sample view
Adjust the sample position (in the Sample view display) bydoing any of the following:
• Click the up/down and left/right scroll bars.
• Click on the sample position to move to that X,Y position.
• Type coordinates (microns) in X and Y fields andclick GO.
NOTE: The motor controlling plate movement moves instep units. Coordinate values entered are rounded tothe nearest step value (1 step=3.175 microns).
• Use the control stick to move to a sample position. Formore information, see Section I.3, Using the ControlStick.
Coordinatesof ActivePosition
Scroll bars
Laser position
Voyager™ Biospectrometry™ Workstation User’s Guide 4-31
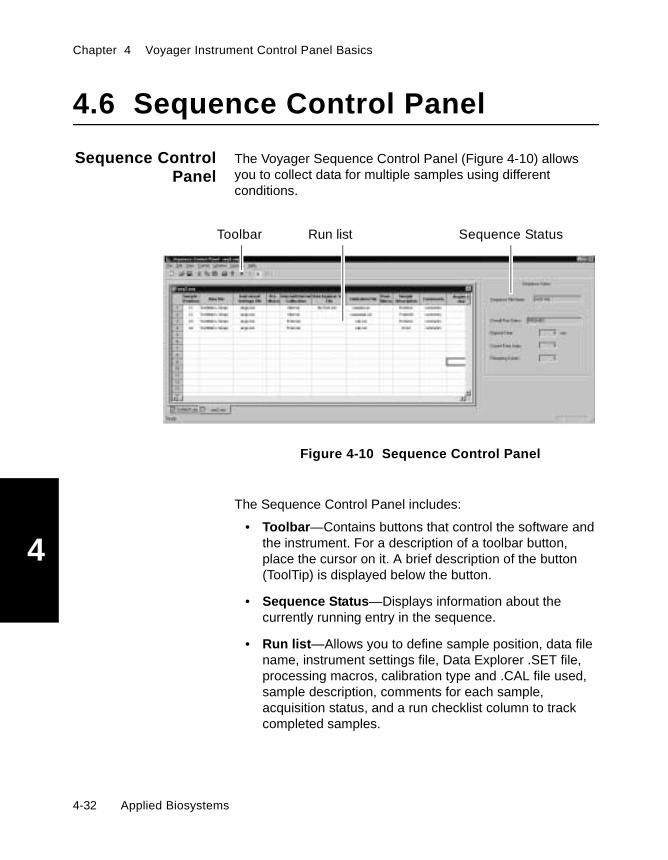
Chapter 4 Voyager Instrument Control Panel Basics
4
4.6 Sequence Control Panel
Sequence ControlPanel
The Voyager Sequence Control Panel (Figure 4-10) allowsyou to collect data for multiple samples using differentconditions.
Figure 4-10 Sequence Control Panel
The Sequence Control Panel includes:
• Toolbar—Contains buttons that control the software andthe instrument. For a description of a toolbar button,place the cursor on it. A brief description of the button(ToolTip) is displayed below the button.
• Sequence Status—Displays information about thecurrently running entry in the sequence.
• Run list—Allows you to define sample position, data filename, instrument settings file, Data Explorer .SET file,processing macros, calibration type and .CAL file used,sample description, comments for each sample,acquisition status, and a run checklist column to trackcompleted samples.
Toolbar Run list Sequence Status
4-32 Applied Biosystems

How the Instrument and Sequence Control Panels Interact
4
When you start the Sequence Control Panel, the InstrumentControl Panel is automatically started and tiled horizontally atthe bottom of the screen. You can hide the Instrument ControlPanel by deselecting Instrument Control Panel from theView menu.
For more information, see Section 4.7, How the Instrumentand Sequence Control Panels Interact, and Chapter 7,Acquiring Spectra from the Sequence Control Panel.
4.7 How the Instrumentand SequenceControl Panels Interact
This section includes:
• Overview• Two ways to start the Instrument Control Panel• During acquisition• Keeping both control panels open• Organizing the desktop and windows
Overview The Sequence Control Panel works in conjunction with theInstrument Control Panel to allow you to acquire multiplesamples using different instrument settings (.BIC) files.
Two ways to startthe InstrumentControl Panel
You can start the Instrument Control Panel in either of twoways:
• Double-click the Instrument Control Panel icon• Double-click the Sequence Control Panel icon
Voyager™ Biospectrometry™ Workstation User’s Guide 4-33
Chapter 4 Voyager Instrument Control Panel Basics
4
If you start the Instrument Control Panel using theSequence Control Panel icon, it functions the same wayas if you started it using the Instrument Control Panelicon, with the following exceptions:
• Warning and error messages are not displayedduring operation.
• The Instrument Control Panel will close when youclose the Sequence Control Panel.
The preferred method is to start the Instrument Control Panelusing the Instrument Control Panel icon, create instrumentsettings files, then open the Sequence Control Panel using theSequence Control Panel icon, or to start the Sequence ControlPanel by clicking on the toolbar button in the InstrumentControl Panel.
Duringacquisition
If you are acquiring data from one Control Panel, theacquisition functions in the other control panel are inactive:
• If you are acquiring data in the Instrument Control Panel,Sequence Control Panel functions are disabled untilacquisition is complete.
• If you are acquiring data in the Sequence Control Panel,Instrument Control Panel acquisition functions aredisabled until acquisition is complete.
NOTE: Other Instrument Control Panel functions areavailable while acquisition is running in the SequenceControl Panel. However, prompts and error messagesare suppressed to prevent the sequence from beinginterrupted.
4-34 Applied Biosystems

How the Instrument and Sequence Control Panels Interact
4
Keeping bothcontrol panels
open
You can keep the Sequence Control Panel and the InstrumentControl Panel open at the same time. However, if you do notneed Sequence Control Panel functions, close the SequenceControl Panel to improve system performance.
CAUTION
If you started the Instrument Control Panel bydouble-clicking the Sequence Control Panel icon, theInstrument Control Panel closes when you close theSequence Control Panel.
Organizing thedesktop
and windows
You can organize the display to suit your needs.
To rearrange the Sequence Control Panel and the InstrumentControl Panel, select commands from the Desktop menu:
• Tile Horizontal—Places the Sequence Control Panel atthe top or bottom of the desktop, and the InstrumentControl Panel in the opposite location.
• Tile Vertical—Places the Sequence Control Panel at theleft or right of the desktop, and the Instrument ControlPanel in the opposite location.
Voyager™ Biospectrometry™ Workstation User’s Guide 4-35

Chapter 4 Voyager Instrument Control Panel Basics
4
4-36 Applied Biosystems

5Chapter
]7
5 OptimizingInstrument Settings
This chapter contains the following sections:
5.1 Loading, Modifying, and Saving Instrument Settings .............. 5-2
5.2 Instrument Settings Parameter Descriptions ........................ 5-14
5.2.1 Instrument Settings Page ........................................ 5-15
5.2.2 Mode/Digitizer Dialog Box ....................................... 5-24
5.2.3 Automatic Control Dialog Box .................................. 5-33
5.2.4 Description of Spectrum Accumulation Options ....... 5-39
5.3 Impact of Changing Instrument Settings Parameters............ 5-49
5.3.1 Summary of Parameters .......................................... 5-49
5.3.2 Understanding Grid Voltage% .................................. 5-51
5.3.3 Understanding Delay Time ....................................... 5-54
5.3.4 Understanding Guide Wire Voltage% ....................... 5-56
5.3.5 Understanding Digitizer Settings .............................. 5-57
5.4 Optimizing Instrument Settings Parameters ......................... 5-64
5.4.1 Optimization Strategy .............................................. 5-65
5.4.2 Determining the Laser Setting ................................. 5-67
5.4.3 Optimizing Resolution .............................................. 5-71
5.4.4 Optimizing Signal-to-Noise Ratio ............................. 5-85
5.5 Converting Version 4 Methods and Search Pattern Files ...... 5- 92
Voyager™ Biospectrometry™ Workstation User’s Guide 5-1
Chapter 5 Optimizing Instrument Settings
5
5.1 Loading, Modifying, andSaving Instrument Settings
This section includes:
• Using instrument settings (.BIC) files• Standard instrument settings (.BIC) files provided• Opening and viewing instrument settings• Modifying an instrument settings (.BIC) file• Saving and printing instrument settings• Setting instrument settings files to “read-only” status
5.1.1 Using Instrument Settings (.BIC) Files
NOTE: Instrument settings and .BIC files replace methodsand .MNU files used in previous versions of Voyagersystems.
Instrumentsettings file
definition
Instrument settings control operation of the Voyager massspectrometer and are stored in .BIC files. Instrument settingsinclude:
• Mode/digitizer settings• Control mode (manual or automatic)• Voltages• Spectrum acquisition settings• Laser intensity settings• Calibration settings• PSD acquisition settings
For more information, see Section 5.2, Instrument SettingsParameter Descriptions, and Chapter 8, PSD Analysis.
You can create instrument settings files with different settingsand save each file for future use. When you analyze samples,you can select an instrument settings file with the appropriatesettings instead of entering new settings.
5-2 Applied Biosystems

Loading, Modifying, and Saving Instrument Settings
5
NOTE: Data storage parameters are not stored in .BIC files.See “Setting Data Storage parameters” on page 6-14, formore information.
Convertingversion 4
methods andsearch pattern
files
Before using methods (.MNU) or search pattern files (.SP)created using version 4.0 software, convert to instrumentsettings (.BIC) and version 5-compatible search pattern (.SP)files. For information, see Section 5.5, Converting Version 4Methods and Search Pattern Files.
5.1.2 Standard InstrumentSettings (.BIC) Files Provided
This section includes:
• Standard instrument settings files• Location of .BIC files• .BIC files and control mode• List of .BIC files
Standardinstrument
settings files
Standard read-only instrument settings files are provided onyour system. These instrument settings files have beenoptimized for your instrument.
CAUTION
These instrument settings files have been used to test andoptimize your system. Do not delete or change theseinstrument settings files.
Standard instrument settings (.BIC) files are initially located inthe C:\VOYAGER\DATA\FACTORY directory.
NOTE: You can also export .BIC files from an existing data(.DAT) file in the Data Explorer software.
Location of .BICfiles
The standard .BIC files provided are initially located in theC:\VOYAGER\FACTORY directory. They can be saved to anydirectory on your system.
Voyager™ Biospectrometry™ Workstation User’s Guide 5-3

Chapter 5 Optimizing Instrument Settings
5
.BIC files andcontrol mode
The default control mode for all .BIC files is Manual. You canmodify any .BIC file for use in Automatic Control mode, andthen save it as a new .BIC file. For information on modifyinginstrument settings (.BIC) files, see Section 5.1.4, Modifyingan Instrument Settings File (.BIC).
List of .BIC files Table 5-1 through Table 5-3 list the standard .BIC filesprovided on your system for the following modes:
• Linear mode• Reflector mode• PSD mode
Table 5-1 Linear Mode .BIC Files
.BIC File Sample TestMass Range in.BIC Optimized
at (Da)*
Angiotensin_Linear.BIC Low masspeptide mix1
Calibration andResolution(angiotensin I)
500–2,000
ACTH_Linear.BIC Peptide mix2 Calibration andResolution(ACTH 18–39)
2,000–3,000
Insulin_Linear.BIC Peptide mix2 Resolution(insulin)
5,000–6,000
Myoglobin_Linear.BIC Low massprotein mix3
Resolution(myoglobin)
15,000–20,000
BSA_Linear.BIC BSA Resolution 60,000–70,000
IgG_Linear.BIC IgG Resolution 100,000–200,000
Peptide_Sensitivity_Linear.BIC Neurotensinin mix1
Sensitivity 1,000–2,000
Peptide_Linear_Negative.BIC Low masspeptide mix1
Negative ionmode
500–2,000
* Mass Range specified for acquisition may be wider.
5-4 Applied Biosystems
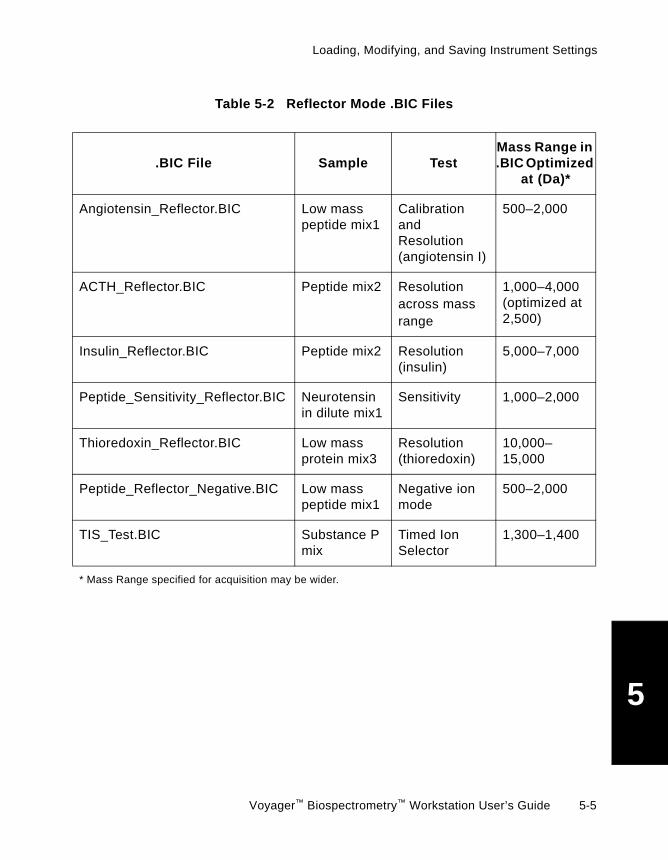
Loading, Modifying, and Saving Instrument Settings
5
Table 5-2 Reflector Mode .BIC Files
.BIC File Sample TestMass Range in.BIC Optimized
at (Da)*
Angiotensin_Reflector.BIC Low masspeptide mix1
CalibrationandResolution(angiotensin I)
500–2,000
ACTH_Reflector.BIC Peptide mix2 Resolutionacross massrange
1,000–4,000(optimized at2,500)
Insulin_Reflector.BIC Peptide mix2 Resolution(insulin)
5,000–7,000
Peptide_Sensitivity_Reflector.BIC Neurotensinin dilute mix1
Sensitivity 1,000–2,000
Thioredoxin_Reflector.BIC Low massprotein mix3
Resolution(thioredoxin)
10,000–15,000
Peptide_Reflector_Negative.BIC Low masspeptide mix1
Negative ionmode
500–2,000
TIS_Test.BIC Substance Pmix
Timed IonSelector
1,300–1,400
* Mass Range specified for acquisition may be wider.
Voyager™ Biospectrometry™ Workstation User’s Guide 5-5
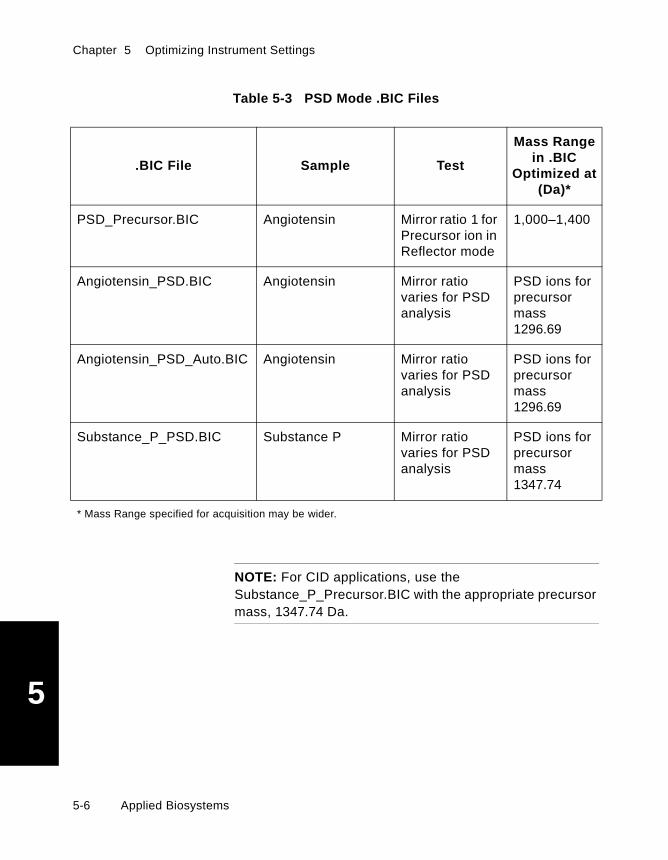
Chapter 5 Optimizing Instrument Settings
5
NOTE: For CID applications, use theSubstance_P_Precursor.BIC with the appropriate precursormass, 1347.74 Da.
Table 5-3 PSD Mode .BIC Files
.BIC File Sample Test
Mass Rangein .BIC
Optimized at(Da)*
PSD_Precursor.BIC Angiotensin Mirror ratio 1 forPrecursor ion inReflector mode
1,000–1,400
Angiotensin_PSD.BIC Angiotensin Mirror ratiovaries for PSDanalysis
PSD ions forprecursormass1296.69
Angiotensin_PSD_Auto.BIC Angiotensin Mirror ratiovaries for PSDanalysis
PSD ions forprecursormass1296.69
Substance_P_PSD.BIC Substance P Mirror ratiovaries for PSDanalysis
PSD ions forprecursormass1347.74
* Mass Range specified for acquisition may be wider.
5-6 Applied Biosystems

Loading, Modifying, and Saving Instrument Settings
5
5.1.3 Opening and ViewingInstrument Settings
Overview There are two ways to open an instrument settings file:
• Directly open a .BIC file
• Select a .DAT file that contains the instrument settings ofinterest, and the software loads the .BIC
Opening From the Instrument Control Panel:
1. Select Open Instrument Settings from the File menu.The Open dialog box is displayed (Figure 5-1).
Figure 5-1 Open Dialog Box
Standard instrument settings files provided are locatedin the C:\VOYAGER\FACTORY directory.
Opening from a.BIC file
2. To open an instrument settings file directly, double-clickthe .BIC file, or select a file and click Open.
Hint: If the .BIC file you need is not visible, click thescroll bar to view more instrument settings files.
Voyager™ Biospectrometry™ Workstation User’s Guide 5-7

Chapter 5 Optimizing Instrument Settings
5
Opening from a.DAT file
To open an instrument settings file from a .DAT file,select .DAT from the Files of Type drop-down list, selectthe .DAT file that contains the .BIC of interest, andclick OK.
The instrument settings file is loaded. The currentlyloaded instrument settings file name is displayed in thetitle bar of the Instrument Control Panel.
Viewing To view all of the instrument settings in a .BIC file, print theinstrument settings as described in “Printing” on page 5-12.
5.1.4 Modifying anInstrument Settings File (.BIC)
In this section This section includes:
• Selecting a .BIC file• Modifying for Manual Control mode• Optimizing• Modifying for Automatic Control mode
Selecting a .BICfile
We suggest that you use standard instruments settings (.BIC)files provided, and modify as needed. However, you can openand modify any .BIC file as needed.
To select a standard instrument settings (.BIC) file:
1. Open a .BIC file for the mass range you are analyzing.For information on mass ranges in .BIC files, seeSection 5.1.2, Standard InstrumentSettings (.BIC) Files Provided.
If a .BIC file for the mass range you are analyzing doesnot exist, open a standard .BIC file with the closesthigher mass.
Hint: To optimize a wide mass range, select a .BIC filewith the mass of the highest component in the range.
2. Save the .BIC file under a new name. Standard .BIC filesare read-only and cannot be saved.
5-8 Applied Biosystems

Loading, Modifying, and Saving Instrument Settings
5
Modifying forManual Control
mode
To modify the instrument settings file for Manual Controlmode:
1. If the Instrument Settings control page (Figure 5-2) isnot displayed, select Instrument Settings from theView menu.
Figure 5-2 Instrument Settings Control Page
2. Click Mode/Digitizer to select settings. For parameterdescriptions, see “Linear/Reflector Digitizer parameters”on page 5-28.
Voyager™ Biospectrometry™ Workstation User’s Guide 5-9

Chapter 5 Optimizing Instrument Settings
5
3. Select Manual Control mode. For parameter descriptions,see Section 5.2.1, Instrument Settings Page.
4. Adjust the mass range if needed.
5. To include matrix peaks in the spectrum for calibration,deselect Low Mass Gate and set the mass to a massbelow the matrix peak mass. For matrix masses, see,Appendix C, Matrixes.
6. Select a calibration file (.CAL), or if you are screeningsamples, use the default calibration. For better massaccuracy, select a .CAL file you recently (same day)generated in the Data Explorer software. For moreinformation, see the Data Explorer Software User’sGuide, Section 5.3.2, Manually Calibrating.
7. Save the .BIC file. For more information, seeSection 5.1.5, Saving and Printing Instrument Settings.
Optimizing For suggested strategies for optimizing parameters, see:
• Section 5.3, Impact of Changing Instrument SettingsParameters
• Section 5.4, Optimizing Instrument Settings Parameters
Modifying forAutomatic
Control mode
After you optimize the instrument settings file for ManualControl mode and ensure that parameters are adjusted toyield optimum performance, you can adjust the instrumentsettings for Automatic Control mode, if desired. For moreinformation, see Section 6.6.2, Setting Instrument Settings forAutomatic Control Mode.
5-10 Applied Biosystems
Loading, Modifying, and Saving Instrument Settings
5
5.1.5 Saving and PrintingInstrument Settings
Saving To save instrument settings:
1. Set all parameters as needed.
2. To save the changes under the current instrument settingsfile name, select Save Instrument Settings from the Filemenu.
The name of the current instrument settings (.BIC) fileis displayed in the title bar of the Instrument ControlPanel.
NOTE: If you try to save a “read-only” instrumentsettings file under the current instrument settings filename, a message is displayed indicating that the filecannot be saved. The current settings can be used foranalysis, but cannot be permanently saved to theinstrument settings file. You can save the changes bysaving the file with a new name by selecting SaveInstrument Settings As from the File menu. Changesto the instrument settings file are lost if you do not savethem before you open a different instrument settings fileor exit the Voyager Instrument Control Panel.
3. To save the settings under a different instrument settingsfile name, select Save Instrument Settings As.
Enter a new name and click Save.
Saving .BIC filesfor different
matrixes
The laser intensity required to yield optimum resolution andsignal-to-noise ratio for a sample can vary substantially fordifferent matrixes. Other instrument settings do not vary forthe same sample in different matrixes.
Because the laser setting is saved in the .BIC file, you cancreate and save different .BIC files for different matrixes.
For more information on laser intensity/settings, seeSection 5.4.2, Determining the Laser Setting.
Voyager™ Biospectrometry™ Workstation User’s Guide 5-11

Chapter 5 Optimizing Instrument Settings
5
Saving .BIC filesfor different
modes
When saving .BIC files for use in different operating modes,make sure to create an identifier so that you will know whichinstrument settings (.BIC) files are optimized for whichexperiments. For example:
• Linear mode—Use _LIN.BIC• Reflector mode—Use _REF.BIC• PSD mode—Use _PSD.BIC
Printing To print instrument settings:
1. Open the instrument settings file in the InstrumentControl Panel.
2. Select Print Instrument Settings from the File menu.
The instrument settings file prints.
5-12 Applied Biosystems

Loading, Modifying, and Saving Instrument Settings
5
5.1.6 Setting Instrument SettingsFiles to “Read-Only” Status
Standard instrument settings files are “read-only” files.Read-only files cannot be changed and saved. However, theycan be changed temporarily and used without saving them, orsaved with a new name.
You can set any instrument settings file to “read-only” status.
To set an instrument settings file to read-only status:
1. Display the Windows NT Explorer.
2. Select the instrument settings (.BIC) file you want to set toread-only status.
3. Select Properties from the File menu. The Propertiesdialog box is displayed.
4. Select Read-only from the Attributes section.
5. Click OK.
The file is listed with “r” next to the file name in theAttributes column.
NOTE: If attributes are not displayed, select Detailsfrom the View menu.
Saving“read-only”instrument
settings files
To save changes to a “read-only” instrument settings file, youmust save the file with a new name. Select Save InstrumentSettings As from the File menu, enter a new name, and savethe file.
Voyager™ Biospectrometry™ Workstation User’s Guide 5-13
Chapter 5 Optimizing Instrument Settings
5
5.2 Instrument SettingsParameter Descriptions
This section describes the parameters on the InstrumentSettings control page and associated dialog boxes that arestored in a .BIC file. The following control pages or dialogboxes are available from the View menu or Instrument menuin the Instrument Control Panel:
• Instrument Settings Page• Mode/Digitizer dialog box• Automatic Control dialog box
NOTE: For a description of PSD acquisition settings, seeChapter 8, PSD Analysis.
5-14 Applied Biosystems

Instrument Settings Parameter Descriptions
5
5.2.1 Instrument Settings Page
Select Instrument Settings from the View menu to displaythe Instrument Settings page (Figure 5-3).
Figure 5-3 Instrument Settings Page
Voyager™ Biospectrometry™ Workstation User’s Guide 5-15
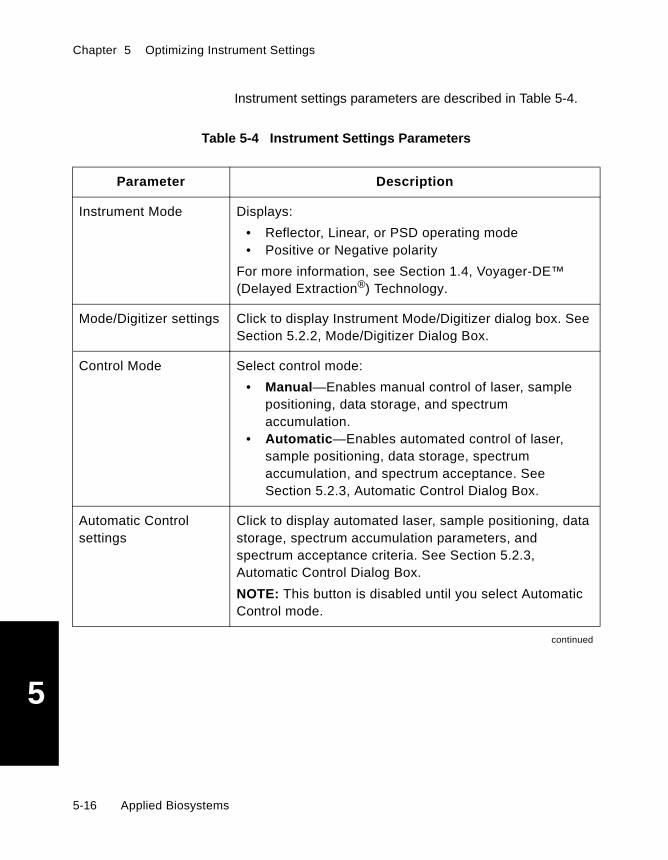
Chapter 5 Optimizing Instrument Settings
5
Instrument settings parameters are described in Table 5-4.
Table 5-4 Instrument Settings Parameters
Parameter Description
Instrument Mode Displays:
• Reflector, Linear, or PSD operating mode• Positive or Negative polarity
For more information, see Section 1.4, Voyager-DE™(Delayed Extraction®) Technology.
Mode/Digitizer settings Click to display Instrument Mode/Digitizer dialog box. SeeSection 5.2.2, Mode/Digitizer Dialog Box.
Control Mode Select control mode:
• Manual—Enables manual control of laser, samplepositioning, data storage, and spectrumaccumulation.
• Automatic—Enables automated control of laser,sample positioning, data storage, spectrumaccumulation, and spectrum acceptance. SeeSection 5.2.3, Automatic Control Dialog Box.
Automatic Controlsettings
Click to display automated laser, sample positioning, datastorage, spectrum accumulation parameters, andspectrum acceptance criteria. See Section 5.2.3,Automatic Control Dialog Box.
NOTE: This button is disabled until you select AutomaticControl mode.
continued
5-16 Applied Biosystems

Instrument Settings Parameter Descriptions
5
Voltages
Accelerating Voltage Voltage applied to the first stage ion source. Valid range is0 to 25,000 V.
For information on settings for different mass ranges, seeSection 5.4.4.2, Setting Accelerating Voltage.
NOTE: The calibration of the mass scale changessignificantly when you change the Accelerating Voltage.Default calibration adjusts for these changes. However,you will observe more accurate calibration if you use anexternal calibration (.CAL) file generated with the sameAccelerating Voltage. See the Data Explorer SoftwareUser’s Guide, Section 5.3.2, Manually Calibrating, formore information.
Grid Voltage% Voltage applied to the grid above the sample plate. Validrange is determined by the Accelerating Voltage. Optimizein conjunction with Delay Time (described on page 5-18).
See Section 5.3.2, Understanding Grid Voltage%, andSection 5.4.3.5, Optimizing Grid Voltage%, for moreinformation.
continued
Table 5-4 Instrument Settings Parameters (Continued)
Parameter Description
Voyager™ Biospectrometry™ Workstation User’s Guide 5-17

Chapter 5 Optimizing Instrument Settings
5
Guide Wire Voltage%
NOTE: Guide WireVoltage% is notavailable onVoyager-DE STRmodels with serialnumber 4154 and later.
Voltage applied to the beam guide wire. Overcomes thedispersion effect from the source and refocuses ions on thedetector.
The valid range for Guide Wire Voltage% is 0.000 to 0.300%of the Accelerating Voltage:
• Linear mode—Use 0.05 to 0.3% as suggested by thestandard instrument settings, and increase the GridVoltage% with increasing mass.
• Reflector mode—Use 0.00 to 0.050% as suggestedby the standard methods.
• In PSD mode—Use settings ≤0.02%. Higher settingsmay compromise the selectivity of the Precursor IonSelector.
See Section 5.3.4, Understanding Guide Wire Voltage%,and Section 5.4.3.3, Optimizing Guide Wire Voltage%, formore information.
Delay Time (nsec) Works in conjunction with the Delayed Extractionparameter. Time in nanoseconds (after the laser ionizesthe sample) at which full Accelerating Voltage is applied,creating the potential gradient that accelerates ions.Recommended range is 0 to 3,000 nsec. Optimize inconjunction with Grid Voltage% (described onpage 5-17).
See Section 5.3.3, Understanding Delay Time, andSection 5.4.3.4, Optimizing Delay Time, for information.
continued
Table 5-4 Instrument Settings Parameters (Continued)
Parameter Description
5-18 Applied Biosystems

Instrument Settings Parameter Descriptions
5
Shots/Spectrum Determines the number of laser shots that each spectrumwill contain. For more information, see Section 5.4.4.4,Setting Shots/Spectrum.
The maximum number of Shots per Spectrum for eachdigitizer are as follows:
• Signatec—10,000• LeCroy—1,000• Acqiris—10,000• Tektronix—10,000
NOTE: The actual number of times the laser fires may begreater than the number of Shots/Spectrum specified, dueto the limited averaging speed of the digitizer. Forexample, if 250,000 data points are recorded, every otherlaser shot is skipped by the digitizer. In any case, thespecified number of Shots/Spectrum will be stored in thedata file.
NOTE: This parameter is dimmed if the system is set toSingle Shot mode. For information, see page 2-44.
Spectrum Acquisition
Mass Range (Da) Determines the mass range collected.
Valid ranges are:
• Start Mass—0 to End Mass.
• End Mass—Start Mass to End Mass.
Mass Range can affect optimized laser rate (described onpage 5-26).
continued
Table 5-4 Instrument Settings Parameters (Continued)
Parameter Description
Voyager™ Biospectrometry™ Workstation User’s Guide 5-19
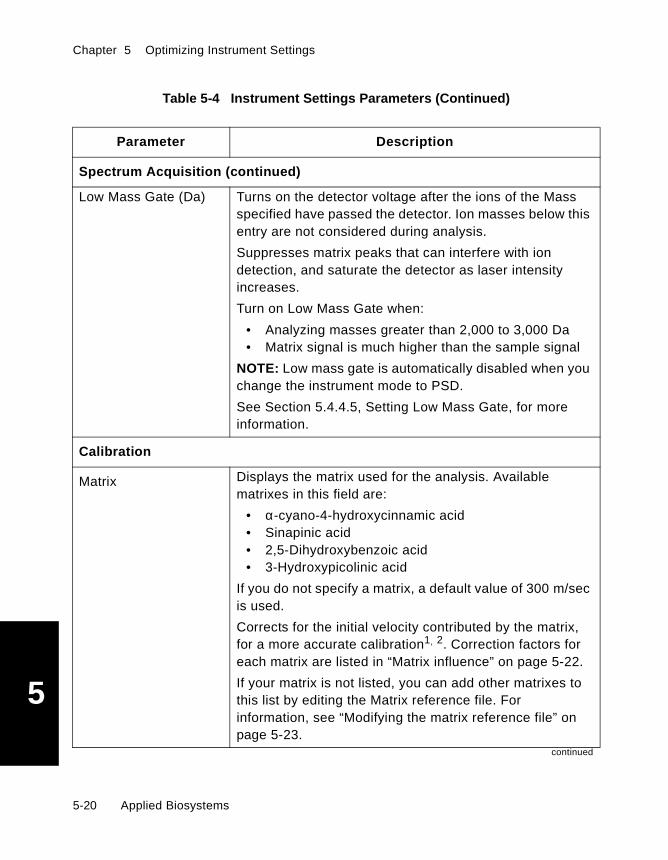
Chapter 5 Optimizing Instrument Settings
5
Spectrum Acquisition (continued)
Low Mass Gate (Da) Turns on the detector voltage after the ions of the Massspecified have passed the detector. Ion masses below thisentry are not considered during analysis.
Suppresses matrix peaks that can interfere with iondetection, and saturate the detector as laser intensityincreases.
Turn on Low Mass Gate when:
• Analyzing masses greater than 2,000 to 3,000 Da• Matrix signal is much higher than the sample signal
NOTE: Low mass gate is automatically disabled when youchange the instrument mode to PSD.
See Section 5.4.4.5, Setting Low Mass Gate, for moreinformation.
Calibration
Matrix Displays the matrix used for the analysis. Availablematrixes in this field are:
• α-cyano-4-hydroxycinnamic acid• Sinapinic acid• 2,5-Dihydroxybenzoic acid• 3-Hydroxypicolinic acid
If you do not specify a matrix, a default value of 300 m/secis used.
Corrects for the initial velocity contributed by the matrix,for a more accurate calibration1, 2. Correction factors foreach matrix are listed in “Matrix influence” on page 5-22.
If your matrix is not listed, you can add other matrixes tothis list by editing the Matrix reference file. Forinformation, see “Modifying the matrix reference file” onpage 5-23.
continued
Table 5-4 Instrument Settings Parameters (Continued)
Parameter Description
5-20 Applied Biosystems
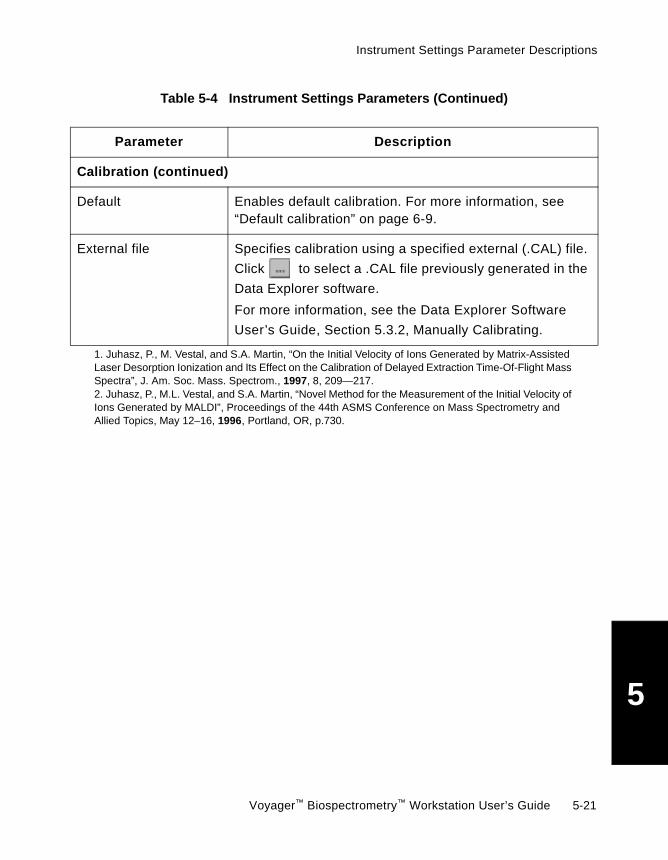
Instrument Settings Parameter Descriptions
5
Calibration (continued)
Default Enables default calibration. For more information, see“Default calibration” on page 6-9.
External file Specifies calibration using a specified external (.CAL) file.
Click to select a .CAL file previously generated in the
Data Explorer software.
For more information, see the Data Explorer Software
User’s Guide, Section 5.3.2, Manually Calibrating.
1. Juhasz, P., M. Vestal, and S.A. Martin, “On the Initial Velocity of Ions Generated by Matrix-AssistedLaser Desorption Ionization and Its Effect on the Calibration of Delayed Extraction Time-Of-Flight MassSpectra”, J. Am. Soc. Mass. Spectrom., 1997, 8, 209—217.2. Juhasz, P., M.L. Vestal, and S.A. Martin, “Novel Method for the Measurement of the Initial Velocity ofIons Generated by MALDI”, Proceedings of the 44th ASMS Conference on Mass Spectrometry andAllied Topics, May 12–16, 1996, Portland, OR, p.730.
Table 5-4 Instrument Settings Parameters (Continued)
Parameter Description
Voyager™ Biospectrometry™ Workstation User’s Guide 5-21

Chapter 5 Optimizing Instrument Settings
5
Matrix influence The initial velocity is the average speed at which matrix ionsdesorb. The initial velocity of matrix contributes to the higherorder terms in the calibration equation (see Figure 6-1 onpage 6-9). The software allows you to correct the calibrationequation for matrix initial velocity by selecting a matrix ininstrument settings (see page 5-20).
Table 5-5 Matrix Initial Velocity Settings
MatrixInitial Velocity
(m/sec)1,2
α-cyano-4-hydroxycinnamic acid 300
Sinapinic acid 350
DHB 500
3-hydroxypicolinic acid 550
1. Juhasz, P., M. Vestal, and S.A. Martin, “On the Initial Velocity of IonsGenerated by Matrix-Assisted Laser Desorption Ionization and Its Effect onthe Calibration of Delayed Extraction Time-Of-Flight Mass Spectra”, J. Am.Soc. Mass. Spectrom., 1996, 8, 209–217.2. Juhasz, P., M. Vestal, and S.A. Martin, “Novel Method for the Measurementof the Initial Velocity of Ions Generated by MALDI”, presented at the 44thASMS Conference on Mass Spectrometry and Allied Topics, May 12–16,1996, Portland, OR, p.730.
5-22 Applied Biosystems

Instrument Settings Parameter Descriptions
5
Modifying thematrix reference
file
Matrix options are located in the Matrix field in the InstrumentSettings control page. You can add or delete information in thematrix reference file using Microsoft Notepad Editor.
You can add information to the matrix reference file by doingthe following:
1. Open the Microsoft Windows NT Notepad text editor.See the Microsoft Windows NT User’s Guide if youneed help using Notepad.
2. Navigate to the C:\VOYAGER directory.
3. Open the file named MATRIX.TXT.
The following text file appears:
4. Type new matrix and velocity information by using theformat above.
If you do not have a velocity value for a matrix, use300 m/sec (α-cyano-4-hydroxycinnamic acid value).
5. Save the modified .TXT file.
Voyager™ Biospectrometry™ Workstation User’s Guide 5-23
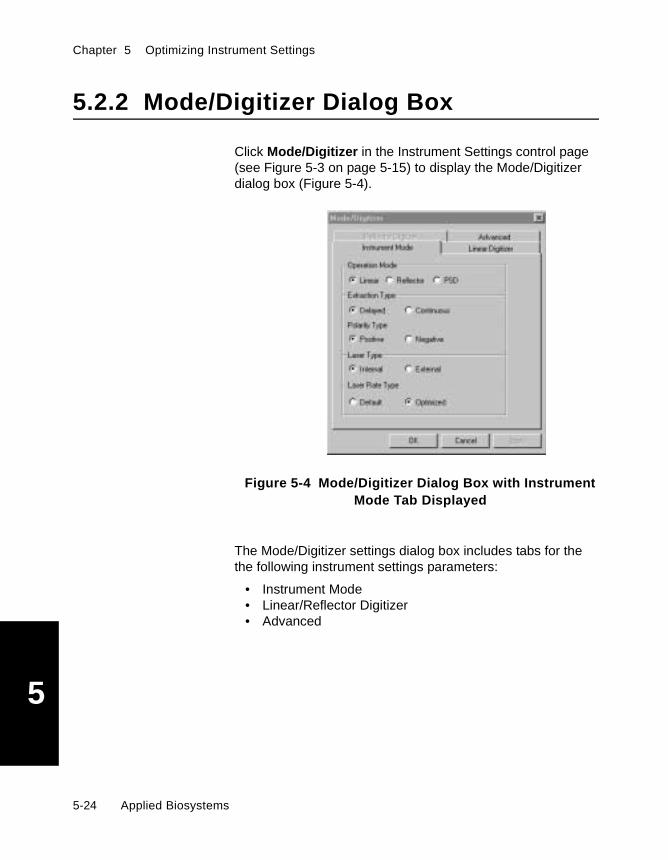
Chapter 5 Optimizing Instrument Settings
5
5.2.2 Mode/Digitizer Dialog Box
Click Mode/Digitizer in the Instrument Settings control page(see Figure 5-3 on page 5-15) to display the Mode/Digitizerdialog box (Figure 5-4).
Figure 5-4 Mode/Digitizer Dialog Box with InstrumentMode Tab Displayed
The Mode/Digitizer settings dialog box includes tabs for thethe following instrument settings parameters:
• Instrument Mode• Linear/Reflector Digitizer• Advanced
5-24 Applied Biosystems

Instrument Settings Parameter Descriptions
5
Instrument Modeparameters
Click the Instrument Mode tab to display the InstrumentMode page (Figure 5-4).
Instrument Mode parameters are described in Table 5-6.
Table 5-6 Instrument Mode Parameters
Parameter Description
Operation Mode Specifies the Operation Mode:
• Linear—Uses Linear detector only. Most sensitivemode due to shorter flight path. Also more sensitivebecause fragments, neutrals, and molecular ionsarrive at the detector at the same time. Less samplefragmentation is observed.
• Reflector—Uses Reflector detector only. Higherresolution, greater mass accuracy due to longer flightpath and action of reflector.
• PSD—For PSD Analysis, allows you to createcomposite spectra from fragment ion spectra. Usesthe reflector detector. See Chapter 8, PSD Analysis,for more information.
NOTE: Reflector and PSD modes are not available on theVoyager-DE system. If you have a Voyager-DE system,buttons for these two modes are not displayed.
Extraction Type Specifies the type of extraction to use:
• Delayed—Use for normal operation. Described inSection 1.4, Voyager-DE™ (Delayed Extraction®)Technology.
• Continuous—Use for diagnostic purposes. For moreinformation, see Appendix H, Continuous ExtractionMode.
Polarity Type Specifies the polarity of spectra to acquire:
• Positive• Negative
continued
Voyager™ Biospectrometry™ Workstation User’s Guide 5-25

Chapter 5 Optimizing Instrument Settings
5
Laser Type Specifies the type of installed laser:
• Internal• External (optional)
NOTE: When you switch from the internal laser to theexternal laser, you must manually reset the external laserbefore acquiring data. See Section 2.9, Resetting theOptional External Laser.
NOTE: When you save or load a .BIC file with the externallaser specified, a message prompts you to reset theexternal laser, the Manual Laser/Sample Position controlpage (see Figure 4-8 on page 4-27) displays “External”, andthe laser intensity range is reset to the 0 to 4,000 range forthe external laser.
Laser Rate
NOTE: This parameteris available only onsystems with theappropriate hardware.For more information,contact AppliedBiosystems.
Specifies the laser firing rate:
• Default—The default firing rate (3 Hz).
• Optimized—Fastest possible firing rate for:
• Digitizer used on the system• Mass Range (described on page 5-19)• Bin Size setting (described on page 5-29)
Acqiris digitizers allow a laser firing rate of 20 Hz and areindependent of Mass Range and Bin Size settings.
To operate at the fastest laser firing rate when using otherdigitizers, increase the Bin Size or decrease the MassRange. These parameters affect the Number of Data PointsDigitized, which in turn affects the laser firing rate.
If you switch to faster optimized laser firing rates, you mayneed to increase or decrease the laser intensity. Laserfiring rate does not affect resolution. For optimum massaccuracy, use the same laser setting (optimized or default)for calibrants and unknowns.
continued
Table 5-6 Instrument Mode Parameters (Continued)
Parameter Description
5-26 Applied Biosystems

Instrument Settings Parameter Descriptions
5
Laser Rate
(continued)
NOTE: Laser firing rate does not have a linear relationshipto Bin Size. For example, if an acquisition of100 Shots/Spectrum takes 5 seconds with a Bin Size of2 nsec, an acquisition of 100 Shots/Spectrum may notnecessarily take 10 seconds with a Bin Size of 1 nsec.Changes in mass in the low mass range has a greaterimpact on laser firing rate than changes in mass in thehigh mass range.
For additional information on laser firing rates anddigitizers, see Figure A-1 on page A-12.
Table 5-6 Instrument Mode Parameters (Continued)
Parameter Description
Voyager™ Biospectrometry™ Workstation User’s Guide 5-27

Chapter 5 Optimizing Instrument Settings
5
Linear/ReflectorDigitizer
parameters
Click the Linear or Reflector Digitizer tab to display theLinear Digitizer or Reflector Digitizer page (Figure 5-5).
NOTE: The Reflector Digitizer tab is not displayed on theVoyager-DE system.
.
Figure 5-5 Mode/Digitizer Settings Dialog Box withLinear Digitizer Tab Displayed
Linear and Reflector Digitizer parameters are described inTable 5-7.
5-28 Applied Biosystems
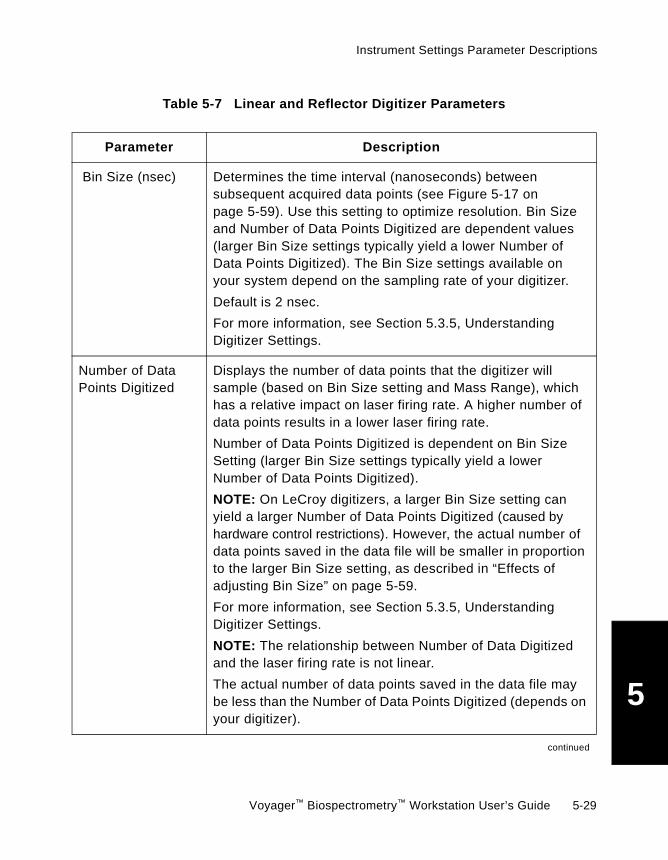
Instrument Settings Parameter Descriptions
5
Table 5-7 Linear and Reflector Digitizer Parameters
Parameter Description
Bin Size (nsec) Determines the time interval (nanoseconds) betweensubsequent acquired data points (see Figure 5-17 onpage 5-59). Use this setting to optimize resolution. Bin Sizeand Number of Data Points Digitized are dependent values(larger Bin Size settings typically yield a lower Number ofData Points Digitized). The Bin Size settings available onyour system depend on the sampling rate of your digitizer.
Default is 2 nsec.
For more information, see Section 5.3.5, UnderstandingDigitizer Settings.
Number of DataPoints Digitized
Displays the number of data points that the digitizer willsample (based on Bin Size setting and Mass Range), whichhas a relative impact on laser firing rate. A higher number ofdata points results in a lower laser firing rate.
Number of Data Points Digitized is dependent on Bin SizeSetting (larger Bin Size settings typically yield a lowerNumber of Data Points Digitized).
NOTE: On LeCroy digitizers, a larger Bin Size setting canyield a larger Number of Data Points Digitized (caused byhardware control restrictions). However, the actual number ofdata points saved in the data file will be smaller in proportionto the larger Bin Size setting, as described in “Effects ofadjusting Bin Size” on page 5-59.
For more information, see Section 5.3.5, UnderstandingDigitizer Settings.
NOTE: The relationship between Number of Data Digitizedand the laser firing rate is not linear.
The actual number of data points saved in the data file maybe less than the Number of Data Points Digitized (depends onyour digitizer).
continued
Voyager™ Biospectrometry™ Workstation User’s Guide 5-29
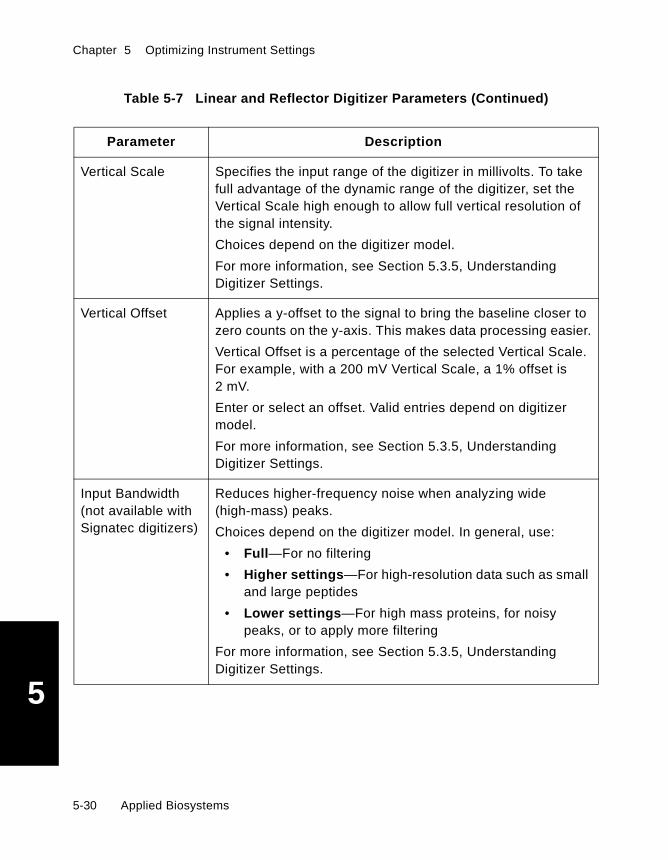
Chapter 5 Optimizing Instrument Settings
5
Vertical Scale Specifies the input range of the digitizer in millivolts. To takefull advantage of the dynamic range of the digitizer, set theVertical Scale high enough to allow full vertical resolution ofthe signal intensity.
Choices depend on the digitizer model.
For more information, see Section 5.3.5, UnderstandingDigitizer Settings.
Vertical Offset Applies a y-offset to the signal to bring the baseline closer tozero counts on the y-axis. This makes data processing easier.
Vertical Offset is a percentage of the selected Vertical Scale.For example, with a 200 mV Vertical Scale, a 1% offset is2 mV.
Enter or select an offset. Valid entries depend on digitizermodel.
For more information, see Section 5.3.5, UnderstandingDigitizer Settings.
Input Bandwidth(not available withSignatec digitizers)
Reduces higher-frequency noise when analyzing wide(high-mass) peaks.
Choices depend on the digitizer model. In general, use:
• Full—For no filtering
• Higher settings—For high-resolution data such as smalland large peptides
• Lower settings—For high mass proteins, for noisypeaks, or to apply more filtering
For more information, see Section 5.3.5, UnderstandingDigitizer Settings.
Table 5-7 Linear and Reflector Digitizer Parameters (Continued)
Parameter Description
5-30 Applied Biosystems
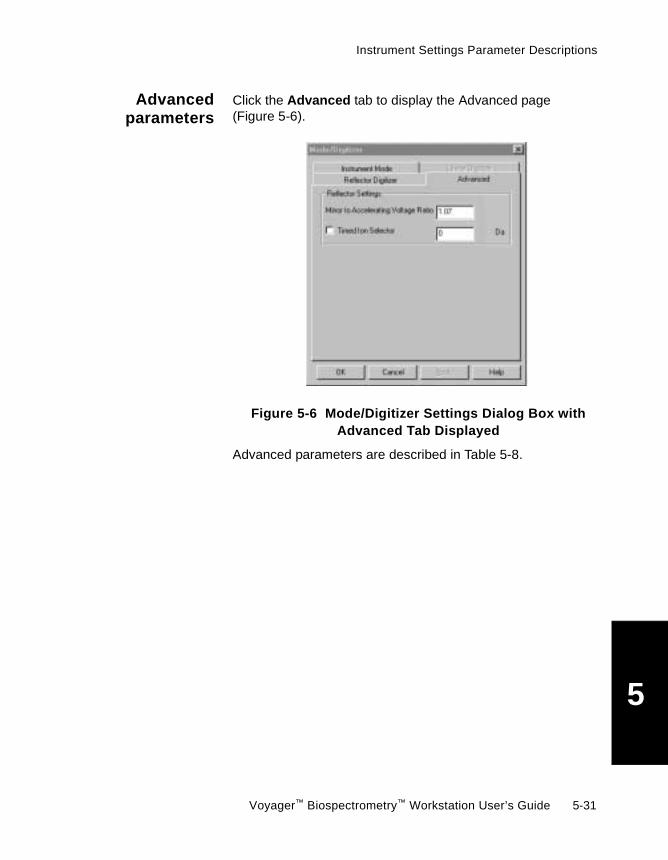
Instrument Settings Parameter Descriptions
5
Advancedparameters
Click the Advanced tab to display the Advanced page(Figure 5-6).
Figure 5-6 Mode/Digitizer Settings Dialog Box withAdvanced Tab Displayed
Advanced parameters are described in Table 5-8.
Voyager™ Biospectrometry™ Workstation User’s Guide 5-31
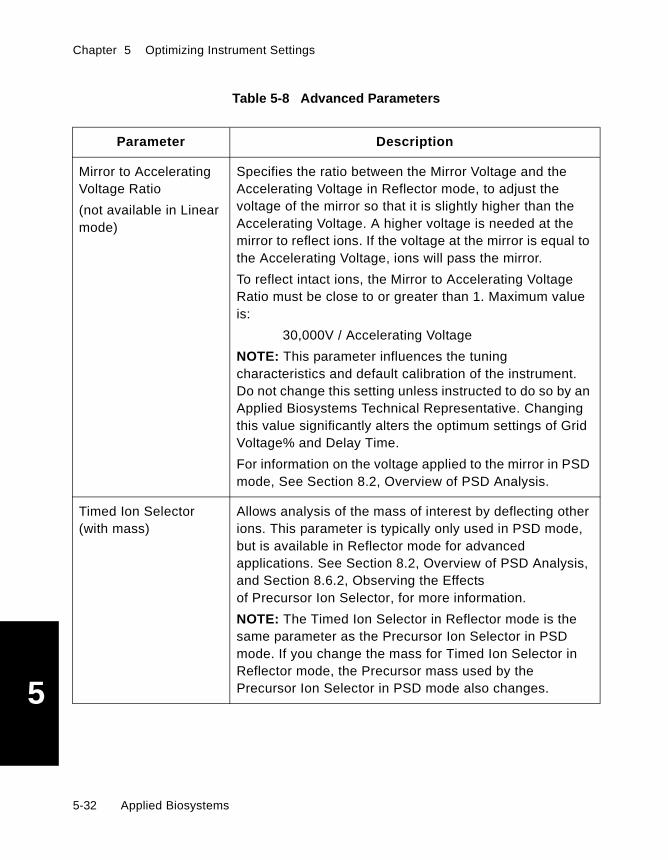
Chapter 5 Optimizing Instrument Settings
5
Table 5-8 Advanced Parameters
Parameter Description
Mirror to AcceleratingVoltage Ratio
(not available in Linearmode)
Specifies the ratio between the Mirror Voltage and theAccelerating Voltage in Reflector mode, to adjust thevoltage of the mirror so that it is slightly higher than theAccelerating Voltage. A higher voltage is needed at themirror to reflect ions. If the voltage at the mirror is equal tothe Accelerating Voltage, ions will pass the mirror.
To reflect intact ions, the Mirror to Accelerating VoltageRatio must be close to or greater than 1. Maximum valueis:
30,000V / Accelerating Voltage
NOTE: This parameter influences the tuningcharacteristics and default calibration of the instrument.Do not change this setting unless instructed to do so by anApplied Biosystems Technical Representative. Changingthis value significantly alters the optimum settings of GridVoltage% and Delay Time.
For information on the voltage applied to the mirror in PSDmode, See Section 8.2, Overview of PSD Analysis.
Timed Ion Selector(with mass)
Allows analysis of the mass of interest by deflecting otherions. This parameter is typically only used in PSD mode,but is available in Reflector mode for advancedapplications. See Section 8.2, Overview of PSD Analysis,and Section 8.6.2, Observing the Effectsof Precursor Ion Selector, for more information.
NOTE: The Timed Ion Selector in Reflector mode is thesame parameter as the Precursor Ion Selector in PSDmode. If you change the mass for Timed Ion Selector inReflector mode, the Precursor mass used by thePrecursor Ion Selector in PSD mode also changes.
5-32 Applied Biosystems

Instrument Settings Parameter Descriptions
5
5.2.3 Automatic Control Dialog Box
On the Instrument Settings control page (see Figure 5-3 onpage 5-15), select Automatic Control mode, then click theAutomatic Control button to display the Automatic Controldialog box (Figure 5-7).
NOTE: The Automatic Control button is dimmed ifAutomatic Control mode is not selected.
Figure 5-7 Automatic Control Dialog Box
Voyager™ Biospectrometry™ Workstation User’s Guide 5-33

Chapter 5 Optimizing Instrument Settings
5
Automatic Control parameters are described in Table 5-9through Table 5-11. For information on setting InstrumentSettings for Automatic Control mode, see Section 6.6.2,Setting Instrument Settings for Automatic Control Mode.
Table 5-9 Automatic Control Parameters—Laser
Parameter Description
Laser Intensity Adjustment
Use Automated LaserIntensity Adjustment
Enables or disables automated laser intensity adjustment.
For more information, see “Laser” on page 6-39.
Minimum andMaximum
Controls the minimum and maximum laser intensity whenAutomated Laser Intensity Adjustment is enabled. Tospecify a fixed setting, use the same values for Min andMax.
NOTE: To automate laser adjustment, you must specifyadjustment criteria as described in “Setting spectrumacceptance and laser adjustment criteria” on page 6-42. Ifyou do not specify adjustment criteria, the laser is notadjusted. The mid-range setting between the minimumand maximum is used.
Step Size Sets the size of the increments the system uses whenautomatically adjusting the laser intensity. Maximum stepsize cannot exceed the difference between the minimumand maximum laser intensity settings.
Use Prescan Enables or disables Prescan mode. Prescan modedetermines the laser setting (within the specified range)needed to meet the Signal Intensity criteria. There are twoPrescan options:
• First Search Pattern Position Only
• Each Search Pattern Position
For more information, see “Prescan mode” on page 6-58.
5-34 Applied Biosystems

Instrument Settings Parameter Descriptions
5
Table 5-10 Automatic Control Parameters—Spectrum Accumulation
Parameter Description
Spectrum Accumulation
Number to Acquire Specifies the number of spectra to save or accumulate.This field is dependent on the selected SpectrumAccumulation option (described on page 5-39).
If you select Save First Spectrum to Pass AcceptanceCriteria, the number to acquire is restricted to 1.
If you select Save All Spectra or Save All Spectra thatPass Acceptance Criteria Save Conditions (which saveindividual multiple spectra in one data file as describedbelow), the recommended maximum Number to Acquire is500. Acquiring more than 500 individual spectra in one filegenerates a very large data file that can be slow to openand process.
SpectrumAccumulation
The following Spectrum Accumulation conditions createone data file that contains multiple spectra:
• Save all spectra• Save all spectra that pass acceptance criteria
If you select either of these conditions, the recommendedmaximum Number of spectra to acquire is 500. Acquiringmore than 500 individual spectra in one file generates avery large data file that can be slow to open and process.
You can display the Chromatogram window in the DataExplorer software for .DAT files containing multiplespectra.
For more information, see Section 5.2.4, Description ofSpectrum Accumulation Options.
continued
Voyager™ Biospectrometry™ Workstation User’s Guide 5-35
Chapter 5 Optimizing Instrument Settings
5
SpectrumAccumulation
(continued)
The following Spectrum Accumulation conditions createone data file that contains one spectrum:
• Save the first spectrum to pass acceptance criteria
• Save the best spectrum
• Accumulate all
• Accumulate all passing
For more information, see Section 5.2.4, Description ofSpectrum Accumulation Options.
Spectrum AcceptanceCriteria
Click to display Spectrum Acceptance Criteriaparameters. See “Setting spectrum acceptance and laseradjustment criteria” on page 6-42.
Table 5-10 Automatic Control Parameters—Spectrum Accumulation (Continued)
Parameter Description
5-36 Applied Biosystems
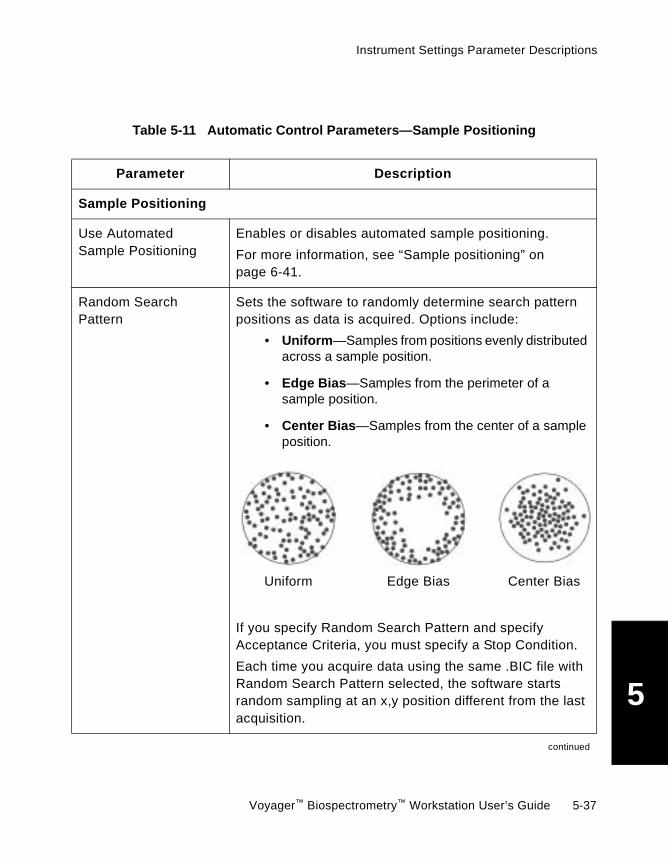
Instrument Settings Parameter Descriptions
5
Table 5-11 Automatic Control Parameters—Sample Positioning
Parameter Description
Sample Positioning
Use AutomatedSample Positioning
Enables or disables automated sample positioning.
For more information, see “Sample positioning” onpage 6-41.
Random SearchPattern
Sets the software to randomly determine search patternpositions as data is acquired. Options include:
• Uniform—Samples from positions evenly distributedacross a sample position.
• Edge Bias—Samples from the perimeter of asample position.
• Center Bias—Samples from the center of a sampleposition.
If you specify Random Search Pattern and specifyAcceptance Criteria, you must specify a Stop Condition.
Each time you acquire data using the same .BIC file withRandom Search Pattern selected, the software startsrandom sampling at an x,y position different from the lastacquisition.
continued
Uniform Edge Bias Center Bias
Voyager™ Biospectrometry™ Workstation User’s Guide 5-37
Chapter 5 Optimizing Instrument Settings
5
Search Pattern File Determines the search pattern used when Use AutomatedSample Positioning is enabled. See Section 6.6.4, SearchPatterns, for more information.
NOTE: Before using search pattern files created inversion 4 software, convert to version 5 format.See Section 5.5, Converting Version 4 Methodsand Search Pattern Files.
Number of Positions Displays the number of positions to be collected in thecurrently selected search pattern file.
Stop Conditions Enable Stop Conditions if you want acquisition to stopafter a specified consecutive number of:
• Acquisitions fail acceptance criteria
• Laser adjustments do not yield acceptable data
NOTE: You must specify a Stop Condition if you haveselected Resolution in Spectrum Acceptance Criteriaparameters (described on page 6-42).
Table 5-11 Automatic Control Parameters—Sample Positioning (Continued)
Parameter Description
5-38 Applied Biosystems

Instrument Settings Parameter Descriptions
5
5.2.4 Description ofSpectrum Accumulation Options
This section describes the following Spectrum Accumulationoptions available in the Automatic Control dialog box(described on page 5-33):
• Save all spectra• Save all spectra that pass acceptance criteria• Save the first spectrum to pass acceptance criteria• Save the best spectrum• Accumulate all spectra• Accumulate all spectra that pass acceptance criteria
Save all spectra In Save All Spectra mode (Figure 5-8):
• All spectra are saved.
• One spectrum per search pattern position is acquired (ifthe Use Automated Sample Positioning option isdisabled, acquisition is performed on the positions youmanually select instead of search pattern positions).
• All search pattern positions may not be analyzed.
• Acceptance criteria are not used.
• One .DAT file containing multiple spectra is created.
Figure 5-8 Save All Spectra Mode—Automatic Control Dialog Box
Voyager™ Biospectrometry™ Workstation User’s Guide 5-39

Chapter 5 Optimizing Instrument Settings
5
Examples If Random search pattern is selected and Number to Acquireis 5, five positions are analyzed, and one .DAT file containingfive spectra is created.
If an .SP file with 20 positions is selected and Number toAcquire is 5, five positions are analyzed, and one .DAT filecontaining five spectra is created.
If an .SP file with 20 positions is selected and Number toAcquire is 25, 20 positions are analyzed, and one .DAT filecontaining 20 spectra is created.
Save all spectrathat pass
acceptancecriteria
In Save All Spectra That Pass Acceptance Criteria mode(Figure 5-9):
• Each spectrum that meets the specified acceptancecriteria is saved.
• Acquisition is performed on the same search patternposition until Acceptance Criteria fail (if the UseAutomated Sample Positioning option is disabled,acquisition is performed on the positions you manuallyselect instead of search pattern positions).
• Acquisition continues until the Number of Spectra toAcquire have been acquired, or the end of the searchpattern is reached.
• All search pattern positions may not be analyzed.
• One .DAT file containing one or more spectra is created.If no spectra pass acceptance criteria, no data file issaved.
NOTE: In this mode, acquisition moves to the next searchpattern position only if acceptance criteria fail.
5-40 Applied Biosystems
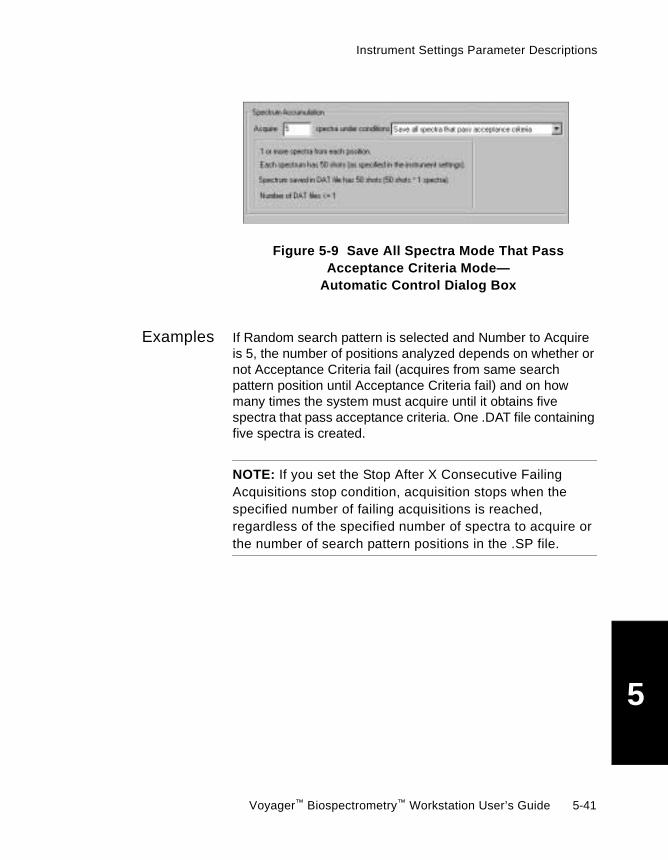
Instrument Settings Parameter Descriptions
5
Figure 5-9 Save All Spectra Mode That PassAcceptance Criteria Mode—
Automatic Control Dialog Box
Examples If Random search pattern is selected and Number to Acquireis 5, the number of positions analyzed depends on whether ornot Acceptance Criteria fail (acquires from same searchpattern position until Acceptance Criteria fail) and on howmany times the system must acquire until it obtains fivespectra that pass acceptance criteria. One .DAT file containingfive spectra is created.
NOTE: If you set the Stop After X Consecutive FailingAcquisitions stop condition, acquisition stops when thespecified number of failing acquisitions is reached,regardless of the specified number of spectra to acquire orthe number of search pattern positions in the .SP file.
Voyager™ Biospectrometry™ Workstation User’s Guide 5-41

Chapter 5 Optimizing Instrument Settings
5
If an .SP file with 7 positions is selected and the Number toAcquire is 5, the number of positions analyzed is determinedby whether or not acceptance criteria fail:
• If all fail, seven positions are analyzed (total number ofpositions in the .SP file) and no .DAT file is created.
• If the first position fails, but all remaining pass, the firsttwo positions are analyzed, and one .DAT file containingfive spectra is created.
• If the first and second positions fail, but all remainingpass, the first three positions are analyzed, one .DAT filecontaining five spectra is created, and so on.
• If acceptance criteria never fail, only the first position isanalyzed, and one .DAT file containing five spectra iscreated.
NOTE: If you set the Stop After X Consecutive FailingAcquisitions stop condition, acquisition stops when thespecified number of failing acquisitions is reached,regardless of the specified number of spectra to acquire orthe number of search pattern positions in the .SP file.
Save the firstspectrum to pass
acceptancecriteria
In Save the First Spectrum To Pass Acceptance Criteria mode(Figure 5-10):
• The first spectrum that meets the selected acceptancecriteria is saved.
• Acquisition is performed on each search pattern positionuntil a spectrum passes or until the end of the searchpattern is reached (if the Use Automated SamplePositioning option is disabled, acquisition is performed onthe positions you manually select instead of searchpattern positions).
• All search pattern positions may not be analyzed.
• One .DAT file containing one spectrum is created. If nospectra pass acceptance criteria, no data file is saved.
5-42 Applied Biosystems

Instrument Settings Parameter Descriptions
5
Figure 5-10 Save the First Spectrum To PassAcceptance Criteria Mode—
Automatic Control Dialog Box
Example If Random search pattern or an .SP file is selected, theNumber to Acquire is automatically set to 1, and the number ofpositions analyzed is equal to the position number in which thefirst passing spectrum is found. One .DAT file containing onespectrum is created. If no spectra meet criteria, no .DAT file iscreated.
NOTE: If you set the Stop After X Consecutive FailingAcquisitions stop condition, acquisition stops when thespecified number of failing acquisitions is reached,regardless of the specified number of spectra to acquire orthe number of search pattern positions in the .SP file.
Voyager™ Biospectrometry™ Workstation User’s Guide 5-43
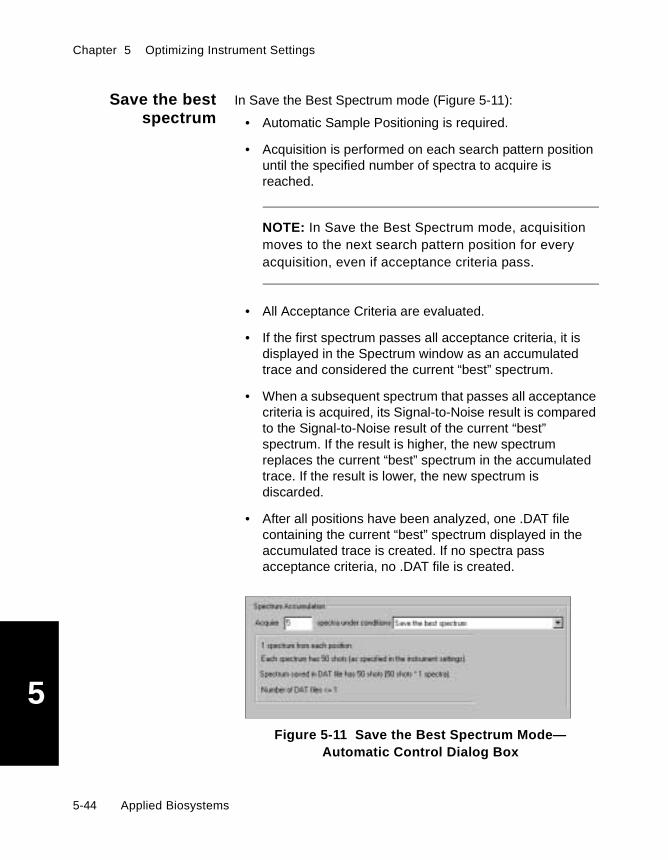
Chapter 5 Optimizing Instrument Settings
5
Save the bestspectrum
In Save the Best Spectrum mode (Figure 5-11):
• Automatic Sample Positioning is required.
• Acquisition is performed on each search pattern positionuntil the specified number of spectra to acquire isreached.
NOTE: In Save the Best Spectrum mode, acquisitionmoves to the next search pattern position for everyacquisition, even if acceptance criteria pass.
• All Acceptance Criteria are evaluated.
• If the first spectrum passes all acceptance criteria, it isdisplayed in the Spectrum window as an accumulatedtrace and considered the current “best” spectrum.
• When a subsequent spectrum that passes all acceptancecriteria is acquired, its Signal-to-Noise result is comparedto the Signal-to-Noise result of the current “best”spectrum. If the result is higher, the new spectrumreplaces the current “best” spectrum in the accumulatedtrace. If the result is lower, the new spectrum isdiscarded.
• After all positions have been analyzed, one .DAT filecontaining the current “best” spectrum displayed in theaccumulated trace is created. If no spectra passacceptance criteria, no .DAT file is created.
Figure 5-11 Save the Best Spectrum Mode—Automatic Control Dialog Box
5-44 Applied Biosystems
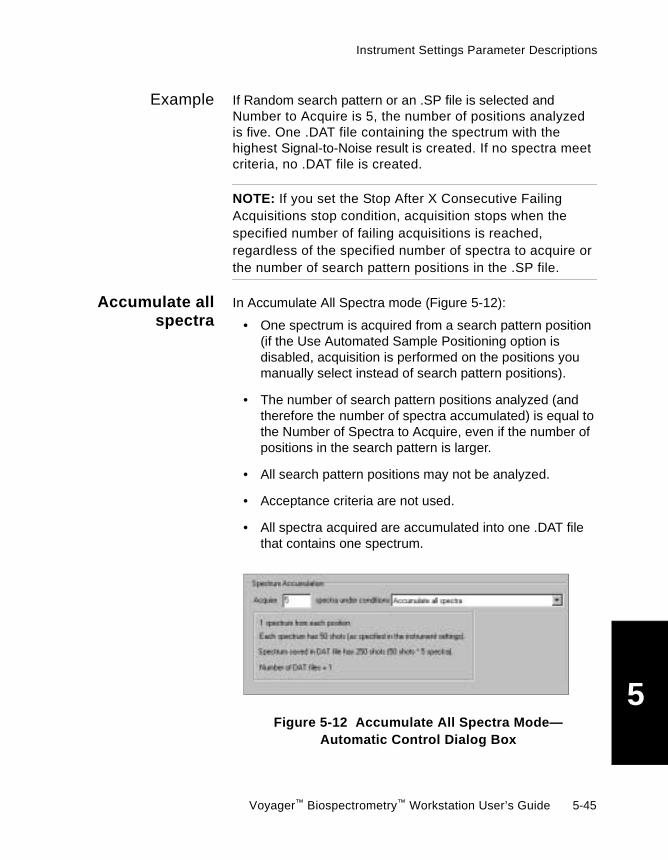
Instrument Settings Parameter Descriptions
5
Example If Random search pattern or an .SP file is selected andNumber to Acquire is 5, the number of positions analyzedis five. One .DAT file containing the spectrum with thehighest Signal-to-Noise result is created. If no spectra meetcriteria, no .DAT file is created.
NOTE: If you set the Stop After X Consecutive FailingAcquisitions stop condition, acquisition stops when thespecified number of failing acquisitions is reached,regardless of the specified number of spectra to acquire orthe number of search pattern positions in the .SP file.
Accumulate allspectra
In Accumulate All Spectra mode (Figure 5-12):
• One spectrum is acquired from a search pattern position(if the Use Automated Sample Positioning option isdisabled, acquisition is performed on the positions youmanually select instead of search pattern positions).
• The number of search pattern positions analyzed (andtherefore the number of spectra accumulated) is equal tothe Number of Spectra to Acquire, even if the number ofpositions in the search pattern is larger.
• All search pattern positions may not be analyzed.
• Acceptance criteria are not used.
• All spectra acquired are accumulated into one .DAT filethat contains one spectrum.
Figure 5-12 Accumulate All Spectra Mode—Automatic Control Dialog Box
Voyager™ Biospectrometry™ Workstation User’s Guide 5-45
Chapter 5 Optimizing Instrument Settings
5
Examples If Random search pattern is selected and the Number toAcquire is 5, five positions are analyzed, and one .DAT filecontaining one accumulated spectrum is created.
If an .SP file with 20 positions is selected and Number toAcquire is 25, 20 positions are analyzed, and one .DAT filecontaining one accumulated spectrum is created.
For more information, see Section 6.6.7, Process thatOccurs when Accumulating Spectra from Multiple SearchPattern Positions.
Accumulate allspectra that pass
acceptancecriteria
In Accumulate All Spectra That Pass Acceptance Criteriamode (Figure 5-13):
• Acquisition is performed on the same search patternposition until Acceptance Criteria fail (if the UseAutomated Sample Positioning option is disabled,acquisition is performed on the positions you manuallyselect instead of search pattern positions).
• Acquisition continues until the Number of Spectra toAcquire have been acquired.
• All search pattern positions may not be analyzed.
• Each spectrum that meets the specified acceptancecriteria is accumulated into one .DAT file that containsone spectrum. If no spectra pass acceptance criteria, no.DAT file is created.
NOTE: In this mode, acquisition moves to the next searchpattern position only if acceptance criteria fail.
5-46 Applied Biosystems

Instrument Settings Parameter Descriptions
5
Figure 5-13 Accumulate All Spectra That PassAcceptance Criteria Mode—
Automatic Control Dialog Box
Example If Random search pattern is selected and Number to Acquireis 5, the number of positions analyzed depends on whether ornot Acceptance Criteria fail (acquires from same searchpattern position until Acceptance Criteria fail) and on howmany times the system must acquire until it obtains fivespectra that pass acceptance criteria. One .DAT file containingone accumulated spectrum is created.
NOTE: If you set the Stop After X Consecutive FailingAcquisitions stop condition, acquisition stops when thespecified number of failing acquisitions is reached,regardless of the specified number of spectra to acquire orthe number of search pattern positions in the .SP file.
Voyager™ Biospectrometry™ Workstation User’s Guide 5-47

Chapter 5 Optimizing Instrument Settings
5
If an .SP file with 7 positions is selected and Number toAcquire is 5, the number of positions analyzed is determinedby whether or not acceptance criteria fail:
• If all fail, seven positions are analyzed (total number ofpositions in .SP), no .DAT file is created.
• If the first position fails, but all remaining pass, the firsttwo positions are analyzed, one .DAT file containing oneaccumulated spectrum is created.
• If the first and second positions fail, but all remainingpass, the first three positions are analyzed, one .DAT filecontaining one accumulated spectrum is created, andso on.
• If acceptance criteria never fail, the first search patternposition is analyzed and one .DAT file containing oneaccumulated spectrum is created.
NOTE: If you set the Stop After X Consecutive FailingAcquisitions stop condition, acquisition stops when thespecified number of failing acquisitions is reached,regardless of the specified number of spectra to acquire orthe number of search pattern positions in the .SP file.
For more information, see Section 6.6.7, Process thatOccurs when Accumulating Spectra from Multiple SearchPattern Positions.
5-48 Applied Biosystems
Impact of Changing Instrument Settings Parameters
5
5.3 Impact of ChangingInstrument Settings Parameters
This section includes:
• Summary of parameters• Understanding Grid Voltage%• Understanding Delay Time• Understanding Guide Wire Voltage%• Understanding Digitizer settings
5.3.1 Summary of Parameters
Optimizingparameters in a
specific order
Changing instrument settings parameters can impact thesensitivity, resolution, or signal-to noise ratio in different ways.For optimum performance, optimize parameters in the orderlisted in:
• Section 5.4.3, Optimizing Resolution• Section 5.4.4, Optimizing Signal-to-Noise Ratio
List of parameters The following table lists the impact of changing theseparameters.
Parameter Mode Impact
Delay Time
(nanoseconds)
Linear/Reflector
Impact dependent on Grid Voltage%.Performance drops off if set too high ortoo low for corresponding Grid Voltage%.
May vary with matrix.
Critical parameter with optimum valuesfor maximum resolution.
continued
Voyager™ Biospectrometry™ Workstation User’s Guide 5-49

Chapter 5 Optimizing Instrument Settings
5
Guide Wire Voltage%
NOTE: Guide WireVoltage% is notavailable onVoyager-DE STRmodels with serialnumber 4154 and later.
Linear/Reflector
Decreasing improves resolution.
Increasing improves sensitivity for highermass.
Grid Voltage% Linear/Reflector
Critical parameter with optimum value formaximum resolution.
Digitizer Bin Size(nanoseconds)
Linear/Reflector
Decreasing improves resolution.
NOTE: Decreasing Bin Size increases filesize.
Digitizer InputBandwidth (notavailable with Signatecdigitizers)
Linear/Reflector
Decreasing may improve signal-to-noiseratio.
Increasing may improve the resolution.
Accelerating Voltage Linear Increasing improves sensitivity andresolution, but is limited by other factorssuch as the digitization rate.
Reflector Decreasing to 10,000 to 15,000 V canimprove resolution for compounds<2,000 Da.
Laser intensity Linear/Reflector
Increasing improves signal-to-noise ratio.
Increasing too high increasesfragmentation, and resolution is sacrificeddue to saturation.
Decreasing too low decreases sensitivity.
Shots/
Spectrum
Linear/Reflector
Increasing improves signal-to-noise ratio.
Parameter Mode Impact
5-50 Applied Biosystems
Impact of Changing Instrument Settings Parameters
5
5.3.2 Understanding Grid Voltage%
NOTE: You must calibrate the mass scale for each GridVoltage% you use. See Data Explorer Software User’sGuide, Section 5.3.2, Manually Calibrating, for moreinformation.
Grid Voltage% works in conjunction with Accelerating Voltage(described in Section 5.4.4.2, Setting Accelerating Voltage) todefine an adjustable potential gradient or electric field in theionization region of the ion source. This adjustable potentialgradient can be fine-tuned to obtain optimum performance:
• In Delayed Extraction mode, you must fine-tune GridVoltage% in conjunction with Delay Time to optimizeresolution. See Section 5.4.3, Optimizing Resolution.
• In PSD mode, you can use higher Grid Voltage% settingsthan the optimum Reflector mode settings. Higher GridVoltage% improves fragment ion resolution and theresolution at the position of the Precursor Ion Selector(see Figure 8-20 on page 8-74). The standard .BIC filesprovided on your system for PSD mode include GridVoltage% settings that are approximately 5 percenthigher than the Grid Voltage% settings in the .BIC filesprovided for Reflector mode. For more information, seeChapter 8, PSD Analysis.
For more information on Grid Voltage%, see:
• Section 5.4.3.5, Optimizing Grid Voltage%• “Grid Voltage%” on page 5-17
Voyager™ Biospectrometry™ Workstation User’s Guide 5-51

Chapter 5 Optimizing Instrument Settings
5
Potential gradient The potential gradient in the ionization region (Figure 5-14) isdetermined by the voltages applied to the sample plate(Accelerating Voltage) and the variable-voltage grid (GridVoltage%).
Figure 5-14 Sample Plate and Grids
Sampleplate AcceleratingVoltage at 25,000 V
Variable-voltagegrid at % of Ground
grid
Ionizationregion
Potentialgradient
Accelerating Voltage
Ion source
2.8 mm
Potentialgradient =
Accelerating Voltage – Grid Voltage
Distance between plate and grid
Gridvoltage = (Grid Voltage%)(Accelerating Voltage)
5-52 Applied Biosystems

Impact of Changing Instrument Settings Parameters
5
For example (Figure 5-14), with a 25,000 V AcceleratingVoltage and a Grid Voltage of 56%, the potential gradient is:
Vary the potential gradient by varying the Grid Voltage% anduse the recommended Accelerating Voltage for the massrange. For more information, see Section 5.4.4.2, SettingAccelerating Voltage.
Maximum allowedpotential
difference
The Voyager Instrument Control Panel and electronics allow amaximum absolute potential difference of 10,000 V betweenthe Accelerating Voltage and the voltage applied to the grid(Grid Voltage%).
You can calculate the potential difference using the followingequation:
Accelerating Voltage × (100 – Grid Voltage% / 100)
Grid Voltage%, in conjunction with Delay Time, has a directimpact on resolution. See Section 5.1, Loading, Modifying,and Saving Instrument Settings, for more information.
Adjusting In general:
• A higher Grid Voltage with a lower potential difference,decreases ion fragmentation.
• Grid Voltage% has a large impact on the quality of dataobtained. For each Grid Voltage% setting, there is anoptimum Delay Time.
Potentialgradient =
25,000 – 14,000 V
2.8 mm
11,000 V /2.8 mm=
3,928 V /mm=
Voyager™ Biospectrometry™ Workstation User’s Guide 5-53
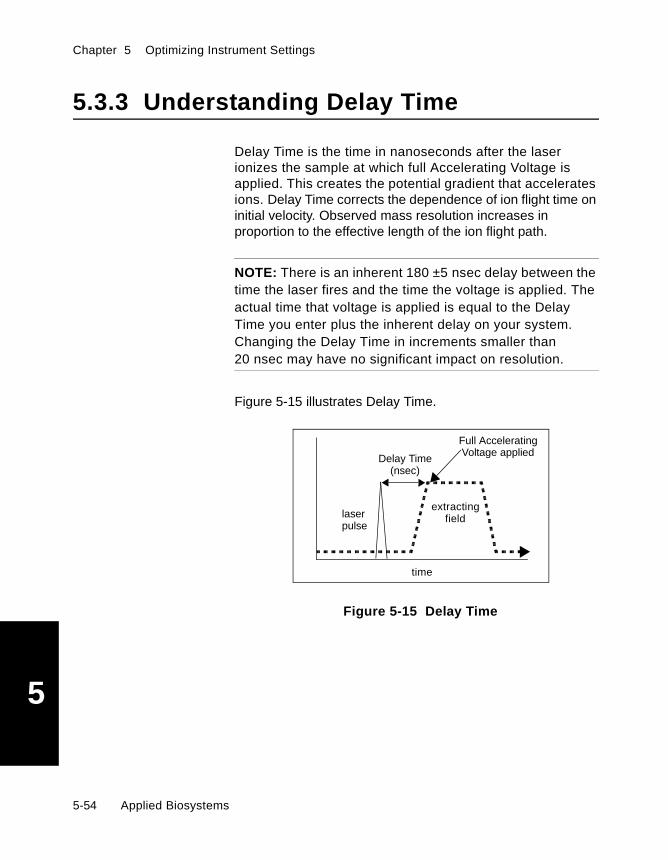
Chapter 5 Optimizing Instrument Settings
5
5.3.3 Understanding Delay Time
Delay Time is the time in nanoseconds after the laserionizes the sample at which full Accelerating Voltage isapplied. This creates the potential gradient that acceleratesions. Delay Time corrects the dependence of ion flight time oninitial velocity. Observed mass resolution increases inproportion to the effective length of the ion flight path.
NOTE: There is an inherent 180 ±5 nsec delay between thetime the laser fires and the time the voltage is applied. Theactual time that voltage is applied is equal to the DelayTime you enter plus the inherent delay on your system.Changing the Delay Time in increments smaller than20 nsec may have no significant impact on resolution.
Figure 5-15 illustrates Delay Time.
Figure 5-15 Delay Time
time
extractinglaser
Delay Time
pulsefield
(nsec)
Full AcceleratingVoltage applied
5-54 Applied Biosystems

Impact of Changing Instrument Settings Parameters
5
Relationship toGrid Voltage%
Delay Time and Grid Voltage% are interactive parameters. Foreach Grid Voltage% there is an optimum Delay Time, and foreach Delay Time there is an optimum Grid Voltage%.
The best approach for optimizing Delay Time is to leave theGrid Voltage% at a fixed value, and optimize Delay Time untilyou obtain optimum resolution. For more information, seeSection 5.4.3.4, Optimizing Delay Time.
Adjusting In general:
• Higher masses require a longer Delay Time• Delay Time is affected by matrix
For more information on Delay Time, see:
• Section 5.4.3.4, Optimizing Delay Time• “Delay Time (nsec)” on page 5-18
Voyager™ Biospectrometry™ Workstation User’s Guide 5-55

Chapter 5 Optimizing Instrument Settings
5
5.3.4 Understanding Guide Wire Voltage%
NOTE: Guide Wire Voltage% is not available onVoyager-DE STR models with serial number 4154 and later.
By applying voltage to the beam guide wire (Figure 5-16), youcan overcome the dispersion effect from the source andrefocus ions on the detector.
Figure 5-16 Beam Guide Wire
All models In general:
• Increase Guide Wire Voltage to increase sensitivity.
• Decrease Guide Wire Voltage to increase resolution. Ahigher Beam Guide Wire voltage can negatively impactresolution, because it is focusing ions that would nototherwise be reaching the detector.
For more information, see “Guide Wire Voltage%” onpage 5-18.
Linear mode • For Linear mode analysis of peptides in the 1,000 to2,000 Da range, a setting of 0.05 to 0.1 percent isadequate.
• For Linear mode analysis of ions over 20,000 Da range,start with a setting of 0.3 percent and decrease asneeded.
• Settings below 0.02 percent may not give adequatesensitivity.
Guide Wire Voltage applied,ions focused on detector
De
tecto
r
5-56 Applied Biosystems

Impact of Changing Instrument Settings Parameters
5
Reflector mode • To obtain maximum resolution in Reflector mode forisotopically resolved species, set the Guide Wire% to 0.
• To increase sensitivity in Reflector mode, increase theGuide Wire Voltage% to:
• Up to 0.02% for <5,000 Da• Up to 0.05% for >10,000 Da
PSD mode In PSD mode, use settings between 0.005 and 0.02 percent.For more information, see Chapter 8, PSD Analysis.
5.3.5 Understanding Digitizer Settings
This section describes:
• Bin Size• Vertical digitizer settings
For more information on default digitizer settings, see“Mode/Digitizer Dialog Box” on page 5-24.
5.3.5.1 Bin Size
The Bin Size (nanoseconds) parameter is the sampling rate ofthe digitizer, which is equal to the time interval betweensubsequent data points. For information, see “Effects ofadjusting Bin Size” on page 5-59.
The default Bin Size is 2 nsec.
Decreasing forimproved
resolution
To decrease the Bin Size:
1. In the Instrument Settings control page, clickMode/Digitizer.
2. Click Linear or Reflector Digitizer.
Voyager™ Biospectrometry™ Workstation User’s Guide 5-57
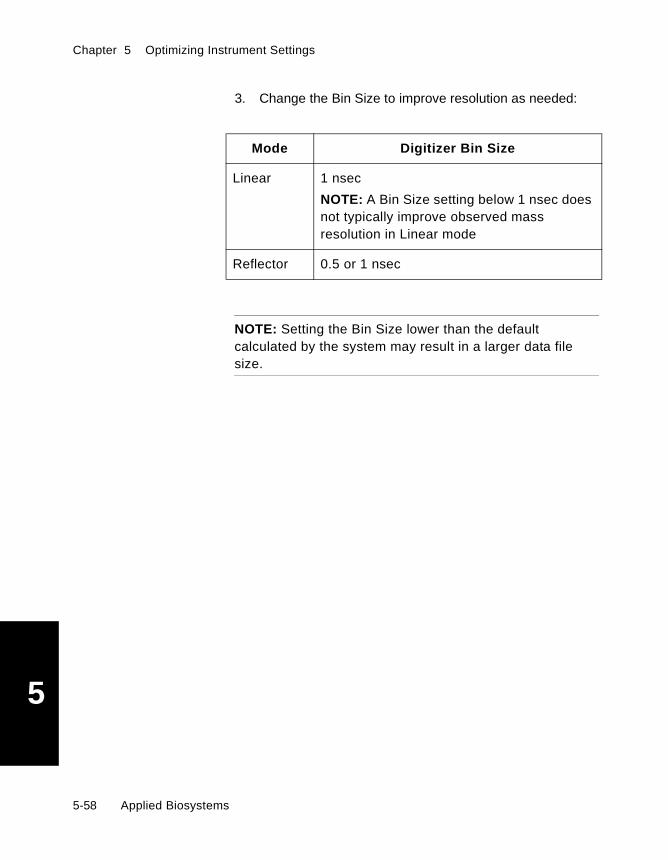
Chapter 5 Optimizing Instrument Settings
5
3. Change the Bin Size to improve resolution as needed:
NOTE: Setting the Bin Size lower than the defaultcalculated by the system may result in a larger data filesize.
Mode Digitizer Bin Size
Linear 1 nsec
NOTE: A Bin Size setting below 1 nsec doesnot typically improve observed massresolution in Linear mode
Reflector 0.5 or 1 nsec
5-58 Applied Biosystems
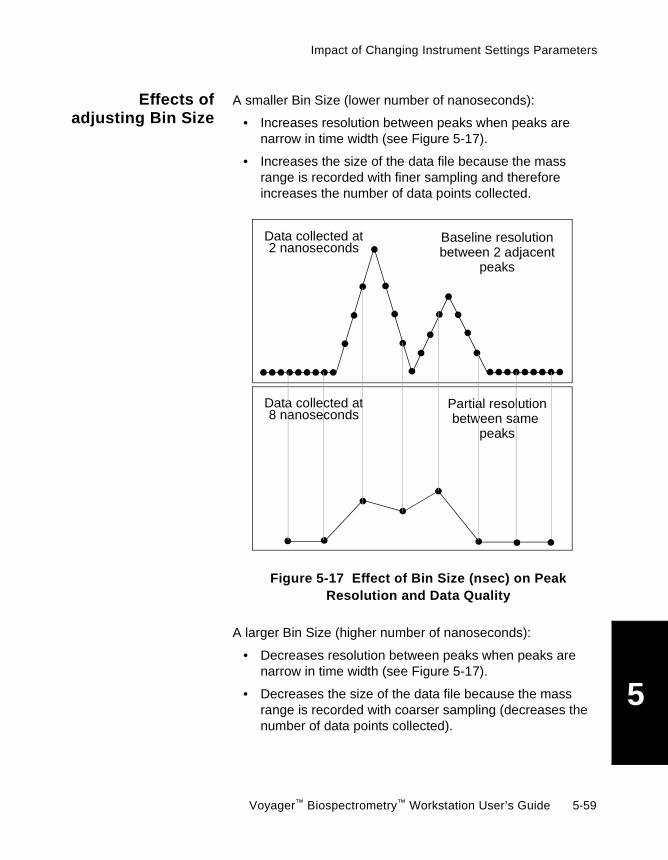
Impact of Changing Instrument Settings Parameters
5
Effects ofadjusting Bin Size
A smaller Bin Size (lower number of nanoseconds):
• Increases resolution between peaks when peaks arenarrow in time width (see Figure 5-17).
• Increases the size of the data file because the massrange is recorded with finer sampling and thereforeincreases the number of data points collected.
Figure 5-17 Effect of Bin Size (nsec) on PeakResolution and Data Quality
A larger Bin Size (higher number of nanoseconds):
• Decreases resolution between peaks when peaks arenarrow in time width (see Figure 5-17).
• Decreases the size of the data file because the massrange is recorded with coarser sampling (decreases thenumber of data points collected).
Data collected at2 nanoseconds
Data collected at8 nanoseconds
Baseline resolutionbetween 2 adjacent
peaks
Partial resolutionbetween same
peaks
Voyager™ Biospectrometry™ Workstation User’s Guide 5-59

Chapter 5 Optimizing Instrument Settings
5
5.3.5.2 Vertical Digitizer Settings
This section describes:
• Vertical settings• Vertical Scale• Vertical Offset• Input Bandwidth
Vertical settings The digitizer settings include three vertical parameters thataffect the signal acquired:
• Vertical Scale—Adjusts the dynamic range of thedigitizer scale to accommodate the signal you areacquiring. For more information, see:
• “Vertical Scale” on page 5-30• “Vertical Scale” on page 5-60
• Vertical Offset—Applies a Y-Offset to the signal. Formore information, see:
• “Vertical Offset” on page 5-30• “Vertical Offset” on page 5-62
• Input Bandwidth (not available with Signatecdigitizers)—Reduces higher frequency noise. For moreinformation, see:
• “Input Bandwidth (not available with Signatecdigitizers)” on page 5-30
• “Input Bandwidth (not available with Signatecdigitizers)” on page 5-63
Vertical Scale A correct Vertical Scale setting ensures optimum verticaldynamic range for the acquired data (Figure 5-18). If theVertical Scale is set incorrectly, the following occurs:
• Too high—Decreases the dynamic range of the data.
• Too low—Truncates the tops of peaks, decreasesobserved mass resolution, and distorts the relativedistribution of ion abundances in multicomponentmixtures.
5-60 Applied Biosystems
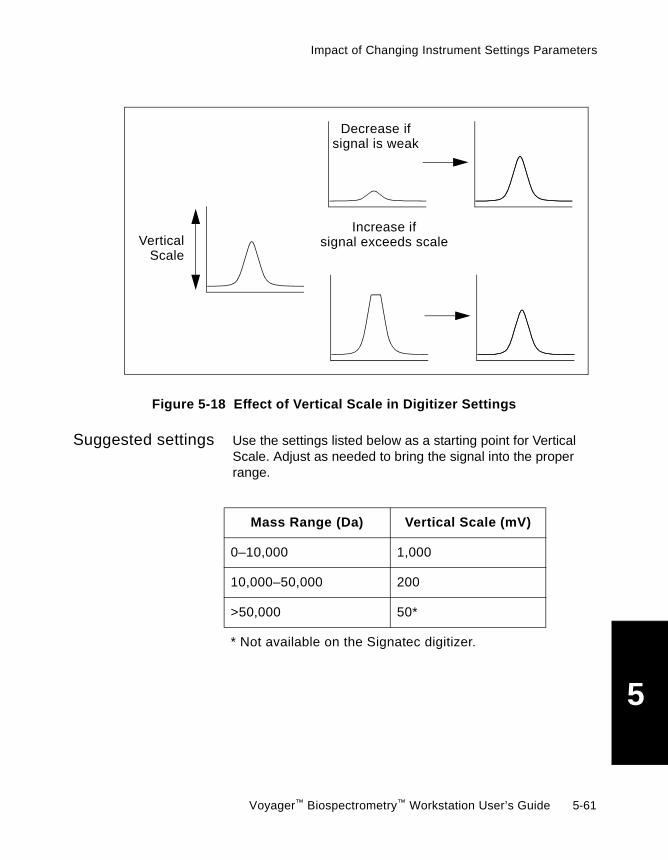
Impact of Changing Instrument Settings Parameters
5
Figure 5-18 Effect of Vertical Scale in Digitizer Settings
Suggested settings Use the settings listed below as a starting point for VerticalScale. Adjust as needed to bring the signal into the properrange.
VerticalScale
Decrease ifsignal is weak
Increase ifsignal exceeds scale
Mass Range (Da) Vertical Scale (mV)
0–10,000 1,000
10,000–50,000 200
>50,000 50*
* Not available on the Signatec digitizer.
Voyager™ Biospectrometry™ Workstation User’s Guide 5-61
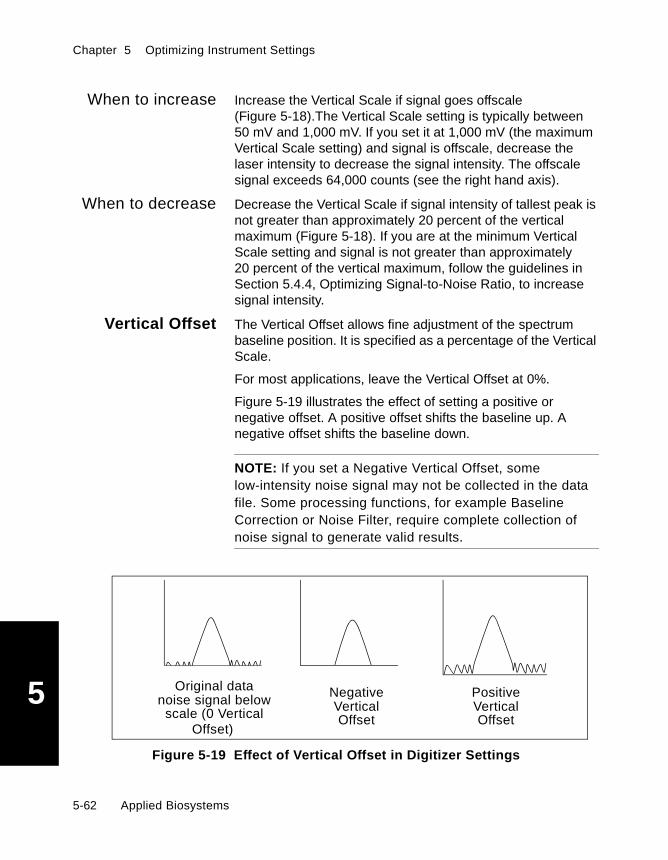
Chapter 5 Optimizing Instrument Settings
5
When to increase Increase the Vertical Scale if signal goes offscale(Figure 5-18).The Vertical Scale setting is typically between50 mV and 1,000 mV. If you set it at 1,000 mV (the maximumVertical Scale setting) and signal is offscale, decrease thelaser intensity to decrease the signal intensity. The offscalesignal exceeds 64,000 counts (see the right hand axis).
When to decrease Decrease the Vertical Scale if signal intensity of tallest peak isnot greater than approximately 20 percent of the verticalmaximum (Figure 5-18). If you are at the minimum VerticalScale setting and signal is not greater than approximately20 percent of the vertical maximum, follow the guidelines inSection 5.4.4, Optimizing Signal-to-Noise Ratio, to increasesignal intensity.
Vertical Offset The Vertical Offset allows fine adjustment of the spectrumbaseline position. It is specified as a percentage of the VerticalScale.
For most applications, leave the Vertical Offset at 0%.
Figure 5-19 illustrates the effect of setting a positive ornegative offset. A positive offset shifts the baseline up. Anegative offset shifts the baseline down.
NOTE: If you set a Negative Vertical Offset, somelow-intensity noise signal may not be collected in the datafile. Some processing functions, for example BaselineCorrection or Noise Filter, require complete collection ofnoise signal to generate valid results.
Figure 5-19 Effect of Vertical Offset in Digitizer Settings
Negative
OffsetVertical
Positive
OffsetVertical
Original data
scale (0 Verticalnoise signal below
Offset)
5-62 Applied Biosystems

Impact of Changing Instrument Settings Parameters
5
Input Bandwidth(not available with
Signatecdigitizers)
Decreasing the Input Bandwidth decreases the response timeof the detector, and can reduce higher frequency noise. Alower setting can improve resolution and smooth out abaseline, but may also decrease signal-to-noise ratio.
Because the Input Bandwidth is an electronic analog filter, itmay slightly shift peak centroids toward higher masses relativeto peaks recorded with Full Bandwidth.
Suggested settings Use the settings listed below as a starting point for InputBandwidth. Adjust as needed to eliminate noise.
NOTE: To maintain signal-to-noise ratio, use a lower InputBandwidth setting.
NOTE: Settings below 200 in Linear mode may not allowresolution of isotopes.
Mass Range(Da)
Input Bandwidth
Linear Mode Reflector Mode PSD Mode
0–500 Full Full 200–250 MHz
or 20–25 MHzon PSDsegmentsbelow 0.3Mirror Ratio
500–6,000 200–250 MHz Full
6,000–50,000 200–250 MHz 200–250 MHz
>50,000 20–25 MHz 20–25 MHz
Voyager™ Biospectrometry™ Workstation User’s Guide 5-63
Chapter 5 Optimizing Instrument Settings
5
5.4 Optimizing InstrumentSettings Parameters
In this section This section describes:
• Optimization strategy• Determining the laser setting• Optimizing resolution• Optimizing signal-to-noise ratio
Before you begin Before optimizing instrument settings parameters, be familiarwith the information in:
• Data Explorer Software User’s Guide, Appendix B,Overview of Isotopes
• Section 5.1.2, Standard Instrument Settings (.BIC) FilesProvided
• Section 5.1.3, Opening and Viewing Instrument Settings
• Section 5.1.5, Saving and Printing Instrument Settings
• Section 6.1, Before You Begin
• Section 6.3, Obtaining Good Spectra in DelayedExtraction Mode
5-64 Applied Biosystems

Optimizing Instrument Settings Parameters
5
5.4.1 Optimization Strategy
This section gives a suggested approach for optimizinginstrument settings. For details on changing instrumentsettings, see Section 5.1.4, Modifying anInstrument Settings File (.BIC).
Figure 5-20 Strategy for Optimizing Instrument Settings
Standard .BIC File
Signal intensity
Laser intensity
Signal-to-Noise Ratio
Accelerating VoltageGuide Wire Voltage%Shots/SpectrumLow Mass Gate
To Optimize:
Resolution
Adjust:
Delay TimeGuide Wire Voltage%Grid Voltage%
Voyager™ Biospectrometry™ Workstation User’s Guide 5-65
Chapter 5 Optimizing Instrument Settings
5
Strategy To optimize instrument settings, do the following:
1. Open a .BIC file for the mass range you are analyzing.For information on mass ranges in .BIC files, seeSection 5.1.2, Standard InstrumentSettings (.BIC) Files Provided.
If a .BIC file for the mass range you are analyzing doesnot exist, open a standard .BIC file with the closesthigher mass.
Hint: To optimize a wide mass range, select a .BIC filewith the mass of the highest component in the range.
2. Find an adequate laser setting. See Section 5.4.2,Determining the Laser Setting.
3. Optimize resolution. See Section 5.4.3, OptimizingResolution.
4. Optimize signal-to-noise ratio. See Section 5.4.4,Optimizing Signal-to-Noise Ratio.
Remaining parameters in the standard instrument settingsprovided are optimized for your workstation and should notrequire adjustment.
For more information on the remaining instrument settingsparameters, see Section 5.2, Instrument SettingsParameter Descriptions.
5-66 Applied Biosystems
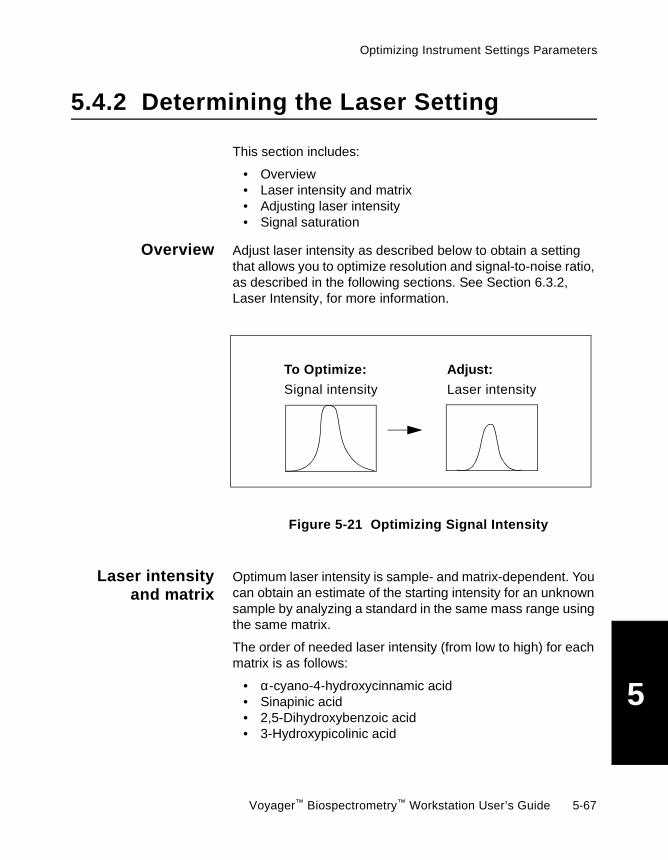
Optimizing Instrument Settings Parameters
5
5.4.2 Determining the Laser Setting
This section includes:
• Overview• Laser intensity and matrix• Adjusting laser intensity• Signal saturation
Overview Adjust laser intensity as described below to obtain a settingthat allows you to optimize resolution and signal-to-noise ratio,as described in the following sections. See Section 6.3.2,Laser Intensity, for more information.
Figure 5-21 Optimizing Signal Intensity
Laser intensityand matrix
Optimum laser intensity is sample- and matrix-dependent. Youcan obtain an estimate of the starting intensity for an unknownsample by analyzing a standard in the same mass range usingthe same matrix.
The order of needed laser intensity (from low to high) for eachmatrix is as follows:
• α-cyano-4-hydroxycinnamic acid• Sinapinic acid• 2,5-Dihydroxybenzoic acid• 3-Hydroxypicolinic acid
To Optimize:
Signal intensity
Adjust:
Laser intensity
Voyager™ Biospectrometry™ Workstation User’s Guide 5-67

Chapter 5 Optimizing Instrument Settings
5
Adjusting laserintensity
To efficiently optimize the laser setting, increase or decreasethe laser settings to the mid-setting of a continuouslydecreasing laser window. To adjust the laser settings,click-drag the slider bar on the Manual Laser Intensity/SamplePositioning control page. For more information, see “Manuallyadjusting laser intensity” on page 4-28.
Adjusting laser intensity depends on the following:
General strategy As a general strategy for adjusting laser intensity:
• Start at the default setting for your system(approximately 1,800), or the setting in the loaded.BIC file.
• If the spectrum you obtain is not acceptable,increase or decrease the laser in 50 to 100-stepincrements or decrements and reacquire. Formore information on acceptable laser signal, see“Signal saturation” on page 5-69.
If you are using... Then...
A .BIC file for the same massrange and matrix.
Laser intensity may require only minoradjustments.
A .BIC file for the same mass range,but different matrix.
Increase or decrease the laser in 50 to100-step increments (or decrements) followingthe strategy described below. For moreinformation, see “Selecting a .BIC file” onpage 5-8, and “Laser intensity and matrix” onpage 5-67.
Default Instrument Control Panelsettings. The mid-range default lasersetting (if a .BIC file is not loaded) isapproximately 1,800.
This setting is typically too high for manysamples and matrix. Decrease the laser in 50to 100-step decrements, following the strategydescribed below. For more information, see“Laser intensity and matrix” on page 5-67.
5-68 Applied Biosystems
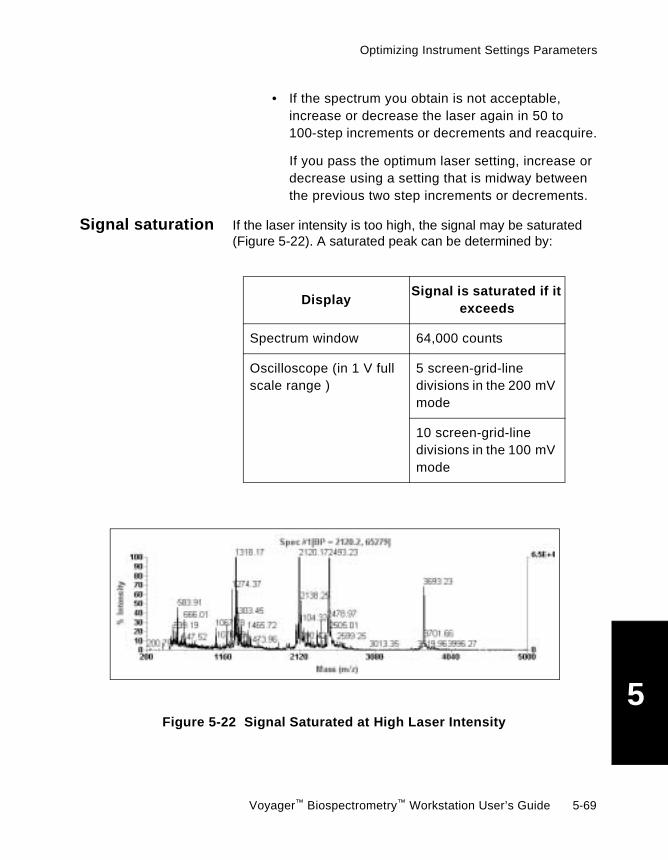
Optimizing Instrument Settings Parameters
5
• If the spectrum you obtain is not acceptable,increase or decrease the laser again in 50 to100-step increments or decrements and reacquire.
If you pass the optimum laser setting, increase ordecrease using a setting that is midway betweenthe previous two step increments or decrements.
Signal saturation If the laser intensity is too high, the signal may be saturated(Figure 5-22). A saturated peak can be determined by:
Figure 5-22 Signal Saturated at High Laser Intensity
DisplaySignal is saturated if it
exceeds
Spectrum window 64,000 counts
Oscilloscope (in 1 V fullscale range )
5 screen-grid-linedivisions in the 200 mVmode
10 screen-grid-linedivisions in the 100 mVmode
Voyager™ Biospectrometry™ Workstation User’s Guide 5-69
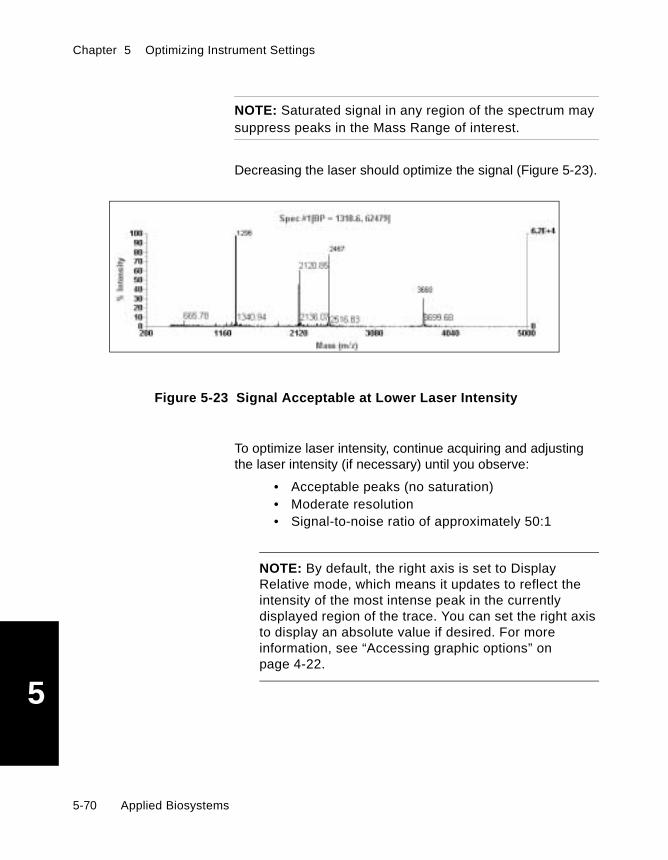
Chapter 5 Optimizing Instrument Settings
5
NOTE: Saturated signal in any region of the spectrum maysuppress peaks in the Mass Range of interest.
Decreasing the laser should optimize the signal (Figure 5-23).
Figure 5-23 Signal Acceptable at Lower Laser Intensity
To optimize laser intensity, continue acquiring and adjustingthe laser intensity (if necessary) until you observe:
• Acceptable peaks (no saturation)• Moderate resolution• Signal-to-noise ratio of approximately 50:1
NOTE: By default, the right axis is set to DisplayRelative mode, which means it updates to reflect theintensity of the most intense peak in the currentlydisplayed region of the trace. You can set the right axisto display an absolute value if desired. For moreinformation, see “Accessing graphic options” onpage 4-22.
5-70 Applied Biosystems
Optimizing Instrument Settings Parameters
5
5.4.3 Optimizing Resolution
This section includes:
• Overview• Acceptable resolution in Delayed Extraction Mode• Optimizing Guide Wire Voltage%• Optimizing Delay Time• Optimizing Grid Voltage%
For information on measuring resolution, see Section 6.5.2,Calculating Mass Resolution, and Data Explorer SoftwareUser’s Guide, Section 6.3, Using theMass Resolution Calculator.
Manuallyaccumulating
spectra toimprove
resolution
The manual accumulation feature of the Voyager systemallows you to acquire a spectrum, examine the spectrum forsignal quality (visually, or using the Resolution orSignal-to-Noise Ratio calculator), and then accumulate thespectrum with other previously examined spectra, or discardthe spectrum. This process of accumulating only acceptablespectra allows you to improve the resolution of the finalspectrum you save. For more information on manuallyaccumulating spectra, see Section 6.2.2, ManuallyAccumulating Spectra from Multiple Acquisitions.
Voyager™ Biospectrometry™ Workstation User’s Guide 5-71

Chapter 5 Optimizing Instrument Settings
5
5.4.3.1 Overview
This section includes:
• Parameters to adjust• DE parameters• Relationship between DE parameters• Readjusting the laser after optimization
Parameters toadjust
You can set the following parameters to optimize resolution(Figure 5-24):
• Guide Wire Voltage%• Delay Time• Grid Voltage%
The following sections give guidelines for setting theseparameters.
Figure 5-24 Optimizing Resolution
To Optimize:
Resolution
Adjust:
Delay TimeGuide Wire Voltage%
Grid Voltage%
5-72 Applied Biosystems

Optimizing Instrument Settings Parameters
5
DE parameters Improved resolution in Delayed Extraction technology isachieved by velocity-focusing ions. See “Velocity focusing” onpage 1-15, for more information.
Two instrument settings parameters affect thevelocity-focusing of ions in Delayed Extraction:
• Delay Time—Time in nanoseconds (after the laserionizes the sample) at which full Accelerating Voltage isapplied, creating the potential gradient that acceleratesions.
• Grid Voltage%—Voltage applied to the variable-voltagegrid located above the sample plate. Grid Voltage is apercentage of Accelerating Voltage.
For a list of Delay Time and Grid Voltage% pairs, seeAppendix E, Grid Voltage% and Delay Time Settings.Optimum resolution for a given mass range is obtained byfinding the ideal Delay Time and Grid Voltage% combinationfor the mass range.
NOTE: Although Guide Wire Voltage% does not affect velocityfocusing of ions, it has a strong impact on resolution inReflector mode and sensitivity in all modes. SeeSection 5.4.3.3, Optimizing Guide Wire Voltage%.
Relationshipbetween DEparameters
Delay Time and Grid Voltage% are interactive parameters. Foreach Delay Time there is an optimum Grid Voltage%, and foreach Grid Voltage% there is an optimum Delay Time.
Linear mode For each optimum Delay Time and Grid Voltage%combination, there is a sharp optimum in Linear modeperformance. Over a wider mass range, performance is lessoptimized.
Reflector mode For each optimum Delay Time and Grid Voltage%combination, the mass range across which resolution isoptimized is wider in Reflector mode.
Voyager™ Biospectrometry™ Workstation User’s Guide 5-73

Chapter 5 Optimizing Instrument Settings
5
Effects of massand matrix
Note the following:
• At a fixed Delay Time, higher masses require a lower GridVoltage%. See Appendix E, Grid Voltage% and DelayTime Settings, for a graphic representation of therelationship between mass, Grid Voltage%, and DelayTime.
• At a fixed Grid Voltage%, higher masses require a higherDelay Time. See Appendix E, Grid Voltage% and DelayTime Settings, for a graphic representation of therelationship between mass, Grid Voltage%, and DelayTime.
• Optimum tuning of Delay Time and Grid Voltage% isslightly dependent on matrix due to the different initialvelocities associated with different matrixes. Theoptimum Delay Time may be different, within 100 nsec atthe same Grid Voltage%, for the same sample in differentmatrixes.
NOTE: The Grid Voltage% setting in Reflector mode istypically significantly lower than the setting in Linear modefor the same mass range. For example, if Grid Voltage% inLinear mode is 94%, Grid Voltage% in Reflector mode maybe 70%. (These values are used as an example they maynot be optimal for your system.)
Readjusting thelaser after
optimization
After you have optimized Guide Wire Voltage%, Delay Time,and Grid Voltage for optimum resolution, you can furtherfine-tune by adjusting the laser intensity. For information onadjusting the laser intensity, see “Adjusting laser intensity” onpage 5-68.
5-74 Applied Biosystems

Optimizing Instrument Settings Parameters
5
5.4.3.2 Acceptable Resolution inDelayed Extraction Mode
Isotope resolution You should be able to partially resolve isotopes up to thefollowing masses:
• Linear mode—Approximately 2,000 Da• Reflector mode—Approximately 6,000 Da
Guidelines foracceptableresolution
Acceptable resolution is determined by the mass range youare analyzing. Refer to the following tables for the typicalresolution at a given signal-to-noise ratio for different massranges:
Mass Range Typical Resolution* in Linear ModeSignal-to-Noise
Ratio**
1,000–2,000 2,000 or greater 50:1 or greater
2,000–20,000 Determined by width of isotopic envelope 50:1 or greater
>20,000 Sample-dependent 20:1 or greater
* On Voyager-DE STR models, resolution is approximately 30 percent higher than the values listed.
** Required signal-to-noise ratio to obtain the resolution stated.
Mass Range Typical Resolution* in Reflector ModeSignal-to-Noise
Ratio**
500–1,500 5,000 or greater 50:1 or greater
1,500–6,000 7,000 or greater 50:1 or greater
6,000–15,000 Determined by width of isotopic envelope 20:1 or greater
>15,000 Sample-dependent 20:1 or greater
* On Voyager-DE STR models, resolution is approximately 30 percent higher than the values listed.
** Required signal-to-noise ratio to obtain the resolution stated.
Voyager™ Biospectrometry™ Workstation User’s Guide 5-75

Chapter 5 Optimizing Instrument Settings
5
If you cannot obtain the resolution listed for the mass range ofinterest, consider the following possible causes:
• Laser intensity is too high• Sample oxidized, fresh sample needed• Sample does not ionize well in the matrix• Sample is too dilute or too concentrated• Impurities are suppressing ionization of sample• There are heterogeneous components in the peak
5.4.3.3 Optimizing Guide Wire Voltage%
NOTE: Guide Wire Voltage% is not available onVoyager-DE STR models with serial number 4154 and later.
Start with the .BIC file in which you optimized Delay Time orGrid Voltage%.
Use the following Guide Wire% settings to optimize resolution:
NOTE: Decreasing Guide Wire% to these suggested valuesmay decrease signal-to-noise ratio.
For moreinformation
For more information, see:
• Section 5.4.4.3, Setting Guide Wire Voltage%• Section 5.3.4, Understanding Guide Wire Voltage%
Mode Guide Wire Voltage% Setting
Linear Peptides (<10,000 Da)—0.05%
Proteins—0.1% or higher for best sensitivity
Reflector 0–0.005%, or as low as possible
5-76 Applied Biosystems

Optimizing Instrument Settings Parameters
5
5.4.3.4 Optimizing Delay Time
This section includes:
• Overview• Inherent Delay Time offset• Optimizing Delay Time• Setting Delay Time to resolve isotopes across a broad
mass range
Overview Use this procedure when operating in Linear mode orReflector mode. Start with a standard .BIC file, optimize theDelay Time, and leave the Grid Voltage% unchanged.
Before optimizing, read “Setting Delay Time to resolveisotopes across a broad mass range” on page 5-81.
NOTE: You can alternatively follow the procedure inSection 5.4.3.5, Optimizing Grid Voltage%. However,optimizing Delay Time is a simpler procedure.
For moreinformation
For more information, see Section 5.3.3, UnderstandingDelay Time.
Inherent DelayTime offset
There is an inherent 180±5 nsec delay between the time thelaser fires and the time the voltage is applied. The actual timethat voltage is applied is equal to the Delay Time you enterplus the inherent delay on your system. Changing the DelayTime in increments smaller than 20 nsec may have nosignificant impact on resolution.
Voyager™ Biospectrometry™ Workstation User’s Guide 5-77

Chapter 5 Optimizing Instrument Settings
5
Optimizing DelayTime
NOTE: If you are analyzing a broad mass range and needoptimum resolution in all mass regions, you may need toacquire smaller portions of the mass range and set theDelay Time to optimize resolution for each mass range.
To optimize Delay Time:
1. Open a standard .BIC file for the mass range you areacquiring. For more information, see “Selecting a .BICfile” on page 5-8.
2. Acquire a spectrum and observe the resolution. Forinformation, see Section 6.5.2, Calculating MassResolution.
If the resolution is not acceptable, increase the DelayTime by 100 nsec (Linear mode) or 50 nsec (Reflectormode), acquire a spectrum and observe. Leave the GridVoltage% setting unchanged.
If the signal is saturated at the higher Delay Timesetting, decrease the laser intensity and acquire a newspectrum. If the signal decreases at the higher DelayTime setting, increase the laser and acquire a newspectrum.
Hint: If you are analyzing a mixture and the resolutionof the peak of interest is not acceptable, observe theresolution of a higher mass peak and a lower masspeak. If resolution is better on the higher mass peak,decrease the Delay Time (by 100 nsec for Linear mode or50 nsec for Reflector mode). If resolution is better on thelower mass peak, increase the Delay Time (by 100 nsecfor Linear mode or 50 nsec for Reflector mode). Collect aspectrum and observe. Leave the Grid Voltage% settingunchanged.
5-78 Applied Biosystems

Optimizing Instrument Settings Parameters
5
3. If the resolution improves by at least 20 percent(±10 percent), continue increasing the Delay Time in100 nsec for Linear mode, or 50 nsec for Reflector modeincrements. Table 5-12 through Table 5-14 list valid DelayTime settings for different systems and mass ranges.
If the resolution does not improve, decrease the DelayTime (by 100 nsec for Linear mode, or 50 nsec forReflector mode), acquire a new spectrum and observe.
Table 5-12 Voyager-DE, Voyager-DE PRO, andVoyager-DE STR Linear Mode—Delay Time and Grid
Voltage% Values
Mass Range (Da)
Linear Mode
Delay Time(nsec)
GridVoltage%
500–2,000 50–150 90–95
2,000–10,000 50–400 90–95
10,000–20,000 200–500 90–95
20,000–100,000 400–1,000 90–95
>100,000 1,000–2,000 90–95
Table 5-13 Voyager-DE PRO Reflector Mode—DelayTime and Grid Voltage% Values
Mass Range (Da)
Reflector Mode
Delay Time(nsec)
GridVoltage%
500–2,000 50–200 72–78
Voyager™ Biospectrometry™ Workstation User’s Guide 5-79

Chapter 5 Optimizing Instrument Settings
5
NOTE: Changing the Delay Time in increments smallerthan 20 nsec may have no significant impact onresolution. For information, see “Inherent Delay Timeoffset” on page 5-77.2,000–10,000 100–500 72–78
10,000–100,000 300–600 72–78
>100,000 No dataavailable
No dataavailable
Table 5-13 Voyager-DE PRO Reflector Mode—DelayTime and Grid Voltage% Values (Continued)
Mass Range (Da)
Reflector Mode
Delay Time(nsec)
GridVoltage%
Table 5-14 Voyager-DE STR Reflector Mode—DelayTime and Grid Voltage% Values
Mass Range (Da)
Reflector Mode
Delay Time(nsec)
GridVoltage%
500–2,000 50–100 62–72
2,000–10,000 50–500 62–72
10,000–20,000 200–700 62–72
20,000–100,000 500–1,000 62–72
>100,000 No dataavailable
No dataavailable
5-80 Applied Biosystems

Optimizing Instrument Settings Parameters
5
4. Continue increasing (or decreasing) the Delay Time in100 nsec for Linear mode, or 50 nsec for Reflector modeincrements (or decrements) until optimum resolution isobtained.
Hint: If you obtain close to acceptable resolution at onesetting, but less acceptable resolution at the nextsetting, you may have adjusted the Delay Time too far.Increase or decrease in smaller increments until youobtain optimum resolution.
5. If resolution is still not optimized after you adjust the DelayTime setting, adjust the Grid Voltage% as described inSection 5.4.3.5, Optimizing Grid Voltage%. Reload thestandard .BIC file you started with, and use the DelayTime value provided in the .BIC file.
6. If you are analyzing samples below 2,000 Da, you may beable to improve resolution by adjusting the AcceleratingVoltage:
• Linear mode—Decrease from 20,000 V to15,000 V to increase flight times.
• Reflector mode—Decrease to 15,000 V,10,000 V, or 5,000 V. However, these lowersettings will compromise sensitivity.
7. Save the .BIC file.
Setting DelayTime to resolve
isotopes across abroad mass range
To resolve isotopes across a broad mass range, select aDelay Time setting that yields optimum resolution at the higherend of the mass range. Isotopes at lower masses can beresolved at lower resolution. Selecting a Delay Time thatmaximizes resolution at lower masses may not resolveisotopes at higher masses.
When selecting a Delay Time to resolve isotopes across abroad mass range, resolution and signal intensity at the lowerend of the mass range may be compromised, but you shouldobserve isotopic resolution across the entire mass range.
Voyager™ Biospectrometry™ Workstation User’s Guide 5-81
Chapter 5 Optimizing Instrument Settings
5
5.4.3.5 Optimizing Grid Voltage%
Overview You can use this procedure as an alternative to the procedurein Section 5.4.3.4, Optimizing Delay Time. However,optimizing Delay Time is the recommended procedure.Optimizing the Delay Time ensures maximum stability of thehigh voltage power supplies, and therefore results in bettermass accuracy.
You can use this procedure when operating in Linear mode orReflector mode. Start with a standard .BIC file, optimize theGrid Voltage%, and leave the Delay Time unchanged.
NOTE: The Grid Voltage% setting in Reflector mode istypically significantly lower than the setting in Linear modefor the same mass range. For example, if Grid Voltage% inLinear mode is 94%, Grid Voltage% in Reflector mode maybe 70%. (These values are used as an example they maynot be optimal for your system.)
For moreinformation
For more information, see Section 5.3.2, Understanding GridVoltage%.
5-82 Applied Biosystems

Optimizing Instrument Settings Parameters
5
Optimizing GridVoltage%
To optimize Grid Voltage%:
1. Open a standard .BIC file for the mass range you areacquiring. For more information, see “Selecting a .BICfile” on page 5-8.
2. Acquire a spectrum and observe the resolution. For moreinformation, see Section 6.5.2, Calculating MassResolution.
If the resolution is not acceptable, increase the GridVoltage% (by 0.25 percent for Linear mode, or 0.5 percentfor Reflector mode), acquire a spectrum and observe.Leave the Delay Time setting unchanged.
If the signal is saturated at the higher Grid Voltage%setting, decrease the laser and acquire a newspectrum. If the signal decreases at the higher GridVoltage% setting, increase the laser and acquire a newspectrum.
Hint: If you are analyzing a mixture and the resolutionon the peak of interest is not acceptable, observe theresolution of a higher mass peak and a lower masspeak. If resolution is better on the higher mass peak,increase the Grid Voltage% setting (by 0.25 percent forLinear mode, or 0.5 percent for Reflector mode). Ifresolution is better on the lower mass peak, decreasethe Grid Voltage% setting (by 0.25 percent for Linearmode, or 0.5 percent for Reflector mode). Collect aspectrum and observe. Leave the Delay Time settingunchanged.
3. If the resolution improves by at least 20 percent (you cansee fluctuations in resolution of up to 10 percent with thesame settings), continue increasing the Grid Voltage% (in0.25 percent for Linear mode, or 0.5 percent for Reflectormode) increments. Table 5-12 on page 5-79 throughTable 5-14 on page 5-80 list valid Grid Voltage% settingsfor different systems and mass ranges.
Voyager™ Biospectrometry™ Workstation User’s Guide 5-83

Chapter 5 Optimizing Instrument Settings
5
If the resolution does not improve, decrease the GridVoltage% (by 0.25 percent for Linear mode, or 0.5 percentfor Reflector mode), acquire a new spectrum and observe.
4. Continue increasing (or decreasing) the Grid Voltage% inincrements (or decrements) of 0.25 percent (Linear mode)or 0.5 percent (Reflector mode) until optimum resolution isobtained.
Hint: If you obtain close to acceptable resolution at onesetting, but less acceptable resolution at the nextsetting, you may have adjusted the Grid Voltage% toofar. Increase or decrease in small increments until youobtain optimum resolution.
5. Adjust the Guide Wire Voltage as needed:
• Increase the setting to increase sensitivity forhigher masses.
• For Voyager-DE PRO, and Voyager-DE STR modelsin Reflector mode, adjust the Guide Wire between0 and 0.04 percent.
NOTE: Guide Wire Voltage% is not available onVoyager-DE STR models with serial number 4154and later.
6. If you are analyzing peptides below 2,000 Da, you may beable to improve resolution by adjusting the AcceleratingVoltage:
• Linear mode—Decrease from 20,000 V to15,000 V to increase flight times.
• Reflector mode—Decrease to 15,000 V,10,000 V, or 5,000 V. However, these lowersettings will compromise sensitivity.
7. Save the .BIC file.
5-84 Applied Biosystems

Optimizing Instrument Settings Parameters
5
5.4.4 Optimizing Signal-to-Noise Ratio
This section includes:
• Overview• Setting Accelerating Voltage• Setting Guide Wire Voltage%• Setting Shots/Spectrum• Setting Low Mass Gate
For more information on measuring Signal-to-Noise, seeSection 6.5.3, Calculating Signal-to-Noise Ratio, and the DataExplorer Software User’s Guide, Section 6.4, Using theSignal-to-Noise Ratio Calculator.
Manuallyaccumulating
spectra toimprove
signal-to-noiseratio
The manual accumulation feature of the Voyager systemallows you to acquire a spectrum, examine the spectrum forsignal quality (visually, or using the Resolution orSignal-to-Noise Ratio calculator), and then accumulate thespectrum with other previously examined spectra, or discardthe spectrum. This process of accumulating only acceptablespectra allows you to improve the signal-to noise ratio of thefinal spectrum you save. For more information on manuallyaccumulating spectra, see Section 6.2.2, ManuallyAccumulating Spectra from Multiple Acquisitions.
Voyager™ Biospectrometry™ Workstation User’s Guide 5-85

Chapter 5 Optimizing Instrument Settings
5
5.4.4.1 Overview
You can set the following parameters to optimizesignal-to-noise ratio (Figure 5-25):
• Accelerating Voltage• Guide Wire Voltage%• Shots per Spectrum• Low Mass Gate
The following sections give guidelines for setting theseparameters.
.
Figure 5-25 Optimizing Signal-to-Noise Ratio
Readjusting thelaser after
optimization
After you have optimized Accelerating Voltage, Guide WireVoltage%, and Shots/Spectrum for optimum signal-to-noise,you can further fine-tune by adjusting the laser intensity. Forinformation on adjusting the laser intensity, see “Adjustinglaser intensity” on page 5-68.
Signal-to-Noise Ratio Accelerating VoltageGuide Wire Voltage%Shots/SpectrumLow Mass Gate
To Optimize: Adjust:
5-86 Applied Biosystems
Optimizing Instrument Settings Parameters
5
5.4.4.2 Setting Accelerating Voltage
Overview Accelerating Voltage defines the energy of ions as they travelin the flight tube and reach the detector. Efficiency ofdetection, particularly for high mass ions, increases withhigher ion energy. Therefore, the maximum AcceleratingVoltage typically yields optimum performance when analyzingmasses above 10,000 Da. However, a lower AcceleratingVoltage can increase flight times, and can improve resolutionin spectra.
NOTE: The calibration of the mass scale changessignificantly when you change the Accelerating Voltage.Default calibration adjusts for these changes. However, youwill observe more accurate calibration if you use anexternal calibration (.CAL) file generated with the sameAccelerating Voltage. See the Data Explorer SoftwareUser’s Guide, Section 5.3.2, Manually Calibrating, for moreinformation.
Recommendedsetting
Higher masses decrease detector sensitivity. To overcome thiseffect, set the Accelerating Voltage appropriate for the massrange you are analyzing:
If you are analyzing very dilute samples, or a sample thationizes poorly, use a setting of 25,000 V.
Mass Range (Da) Accelerating Voltage (V)
<1,000 15,000
1,000 to 10,000 20,000
>10,000 25,000
Voyager™ Biospectrometry™ Workstation User’s Guide 5-87

Chapter 5 Optimizing Instrument Settings
5
A lower Accelerating Voltage setting does the following:
• Provides more data points across a peak for better peakdefinition when analyzing low mass ions (Linear modeonly).
• Improves resolution when analyzing compounds below2,000 Da, and the resolution is limited by the digitizationrate of the system (Reflector mode).
5.4.4.3 Setting Guide Wire Voltage%
NOTE: Guide Wire Voltage% is not available onVoyager-DE STR models with serial number 4154 and later.
To optimize sensitivity, you can adjust the Guide WireVoltage%:
• Linear mode—Increase in increments of 0.01 percentuntil you see signal-to-noise ratio start to decrease.
• Reflector mode—Increase in increments of0.002 percent. Settings above 0.05 percent do nottypically improve signal-to-noise ratio.
NOTE: In Reflector mode, Guide Wire Voltage% also affectsmass resolution. To fine tune signal-to-noise ratio andresolution at the same time, adjust the Guide Wire Voltage%in increments smaller than 0.01 percent.
For moreinformation
For more information, see:
• Section 5.4.3.3, Optimizing Guide Wire Voltage%• Section 5.3.4, Understanding Guide Wire Voltage%
5-88 Applied Biosystems

Optimizing Instrument Settings Parameters
5
5.4.4.4 Setting Shots/Spectrum
NOTE: This parameter is dimmed if the system is set toSingle Shot mode. For information, see page 2-44.
Overview A higher number of Shots/Spectrum can improvesignal-to-noise ratio, and also improve the dynamic range ofthe acquisition. However, acquiring a higher number ofShots/Spectrum increases acquisition time.
When random noise is present in a spectrum, theimprovement in signal-to-noise ratio is approximatelyproportional to the square root of the number ofShots/Spectrum taken.
Manuallyaccumulating to
override limit
The maximum number of Shots/Spectrum is determined bythe digitizer on your system (see “Shots/Spectrum” onpage 5-19). You can acquire a greater number ofShots/Spectrum than the maximum number ofShots/Spectrum noted above by manually accumulatingspectra. For more information, see Section 6.2.2, ManuallyAccumulating Spectra from Multiple Acquisitions.
5.4.4.5 Setting Low Mass Gate
Description Low Mass Gate suppresses matrix peaks that can interferewith ion detection which can saturate the detector as laserintensity increases. This saturation effect is less pronouncedon systems with Linear High Current Detectors. For serialnumbers of systems that include High Current Detectors, seepage 1-23 and page 1-35.
The detector is not turned on until ions greater in mass thanthe mass you enter pass the detector.
Voyager™ Biospectrometry™ Workstation User’s Guide 5-89

Chapter 5 Optimizing Instrument Settings
5
NOTE: When Low Mass Gate is enabled, the mass rangebelow the Low Mass Gate starting mass is still detected, butdetector sensitivity below this mass is decreased by 100 to1,000 fold. If strong matrix signal is present below the LowMass Gate, you can use it for calibration if desired.
When to use Turn on Low Mass Gate when:
• Analyzing masses greater than 2,000–3,000 Da• Matrix signal is more intense than the sample signal
Optimum settingfor starting mass
You will need to experiment with the optimum setting for thestarting mass (threshold) for Low Mass Gate. As a generalguideline:
• If you are analyzing peptides in the 400 to 2,000 Darange, set the Low Mass Gate ~350 Da
• If you are analyzing peptides in the 2,000 to 8,000 Darange, set the Low Mass Gate ~500 Da
• If you are analyzing samples in the 10,000 to 30,000 Darange, set the Low Mass Gate ~3,000 Da
When not to use Do not use Low Mass Gate if:
• You are analyzing peaks in the same mass range asmatrix peaks
• You are using a matrix peak to calibrate
NOTE: Low mass gate is automatically disabled when youchange the instrument mode to PSD.
5-90 Applied Biosystems
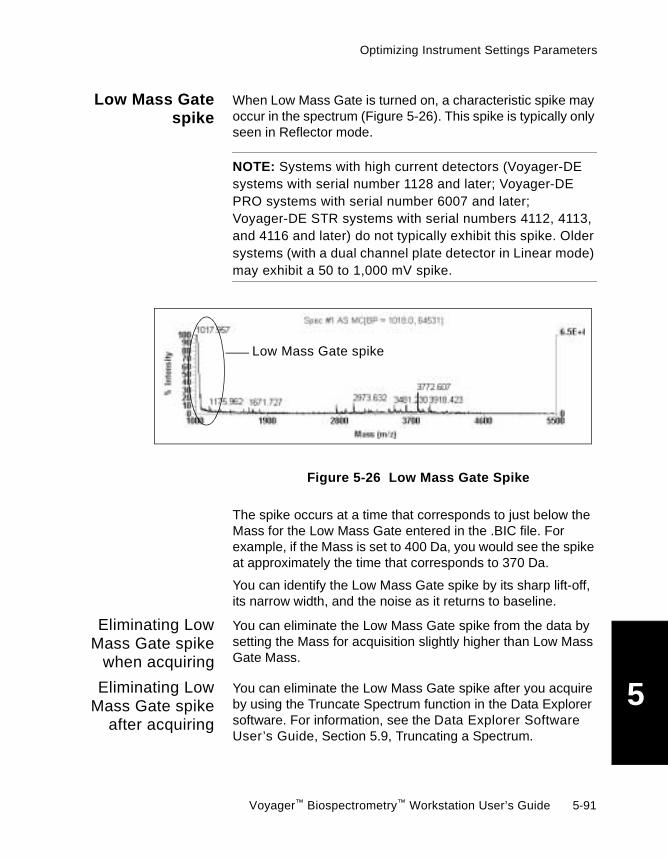
Optimizing Instrument Settings Parameters
5
Low Mass Gatespike
When Low Mass Gate is turned on, a characteristic spike mayoccur in the spectrum (Figure 5-26). This spike is typically onlyseen in Reflector mode.
NOTE: Systems with high current detectors (Voyager-DEsystems with serial number 1128 and later; Voyager-DEPRO systems with serial number 6007 and later;Voyager-DE STR systems with serial numbers 4112, 4113,and 4116 and later) do not typically exhibit this spike. Oldersystems (with a dual channel plate detector in Linear mode)may exhibit a 50 to 1,000 mV spike.
Figure 5-26 Low Mass Gate Spike
The spike occurs at a time that corresponds to just below theMass for the Low Mass Gate entered in the .BIC file. Forexample, if the Mass is set to 400 Da, you would see the spikeat approximately the time that corresponds to 370 Da.
You can identify the Low Mass Gate spike by its sharp lift-off,its narrow width, and the noise as it returns to baseline.
Eliminating LowMass Gate spike
when acquiring
You can eliminate the Low Mass Gate spike from the data bysetting the Mass for acquisition slightly higher than Low MassGate Mass.
Eliminating LowMass Gate spike
after acquiring
You can eliminate the Low Mass Gate spike after you acquireby using the Truncate Spectrum function in the Data Explorersoftware. For information, see the Data Explorer SoftwareUser’s Guide, Section 5.9, Truncating a Spectrum.
Low Mass Gate spike
Voyager™ Biospectrometry™ Workstation User’s Guide 5-91
Chapter 5 Optimizing Instrument Settings
5
5.5 Converting Version 4 Methodsand Search Pattern Files
To use method (.MNU) files and search pattern (.SP) filescreated in version 4.x of the Voyager software, convert themfor use with the current version 5.x software using the Voyager4.x File Converter. This utility:
• Converts .MNU files to instrument settings (.BIC) files.
• Inserts a Units=1 line in search pattern (.SP) files toindicate that units are Steps.
NOTE: The convert function does not change values inthe .SP file from step values to micron values. It insertsa line in the .SP file that identifies the values as stepvalues.
When the system runs a search pattern file, it checks for thepresence of the Units=1 line:
• If the line is present, the software converts the stepvalues to micron values, and displays position informationin microns.
• If the line is not present, the software assumes the valuesare micron values, and uses the values as is.
NOTE: If you use a search pattern file that contains stepvalues, but has not been converted (that is, it does notinclude the Units=1 line) the software assumes the valuesin the file are microns, and a smaller area than expected inthe sample position will be analyzed(1 step=3.175 microns).
5-92 Applied Biosystems

Converting Version 4 Methods and Search Pattern Files
5
Methodinformation that
is converted
Autosampler parameters, Data Acquisition parameters,Digitizer/Laser parameters, and PSD parameters areconverted from .MNU files to .BIC files. However, someversion 4.x parameters have been renamed or relocated, andsome parameters are not supported in Version 5.x.
Table 5-15 Method Information That Is Not Converted
Version 4.xMethod
ParameterLocation
Parameter Changes in Version 5.x
Version 5.xInstrument
SettingsParameterLocation
Described in
Autosamplertab
Scans per position is replaced by Number ofSpectra To Acquire.
AutomaticControl Modedialog box
Section 5.2.3,Automatic ControlDialog Box
Total Scans is replaced by Shots/Spectrum. InstrumentSettings page
Section 5.2.1,Instrument SettingsPage
Acceptance Criteria Mass Range is replacedby Criteria Evaluation Mass Range.
SpectrumAcceptanceCriteria dialogbox
“Setting spectrumacceptance and laseradjustment criteria” onpage 6-42
DataAcquisitiontab
Instrument Range is replaced by Mass Range.
Data File Range is replaced by Mass Range.
Total Scans is replaced by Shots/Spectrum.
Method Description is not supported.
InstrumentSettings page
Section 5.2.1,Instrument SettingsPage
Instrument Mode is replaced by OperationMode.
Timed Ion Selector moved (same function asPrecursor Ion Selector in PSD AcquisitionSettings).
Polarity moved.
Extraction mode moved.
Mode/DigitizerSettings dialogbox
Section 5.2.2,Mode/Digitizer DialogBox
Precursor Ion Selector now present (samefunction as Timed Ion Selector inMode/Digitizer Settings).
Precursor Ion Mass moved.
PSDAcquisitionSettings page
Section 8.4.3, SettingPSDAcquisition Parametersfor Manual Mode
continued
Voyager™ Biospectrometry™ Workstation User’s Guide 5-93

Chapter 5 Optimizing Instrument Settings
5
NOTE: All methods are converted to Manual Control mode.If you are converting an autosampler method, you must setthe control mode to automatic, and respecify the .SP fileafter you convert the.MNU file to a .BIC file.Digitizer/Laser tab
All parameters moved. Mode/DigitizerSettings dialogbox
Section 5.2.2,Mode/Digitizer DialogBox
Step size is replaced by Small Manual IntensityAdjustment. This parameter is not part ofInstrument Settings.
HardwareConfiguration
Section 2.6, HardwareConfiguration
Calibrationtab
Automatically set to Default.
If a matrix is specified in the .MNU, checks thematrix file during conversion, and if it is presentin the matrix file, retains the matrix in the BIC.If the matrix specified in the .MNU is notpresent in the matrix file, the matrix in the .BICis set to alpha-cyano.
InstrumentSettings page
Section 5.2.1,Instrument SettingsPage
Automatic Calibration not supported within.BIC.
SequenceControl Panel,not in .BIC
Chapter 7, AcquiringSpectra fromthe Sequence ControlPanel
DataProcessingtab
Parameters not supported in instrumentsettings. Peak detection parameters set inData Explorer software and stored in .SET file.
-------- --------
PSD tab C1, C3, C4 Calibration Constants notsupported. Values are calculated using thePSD calibration specified in PSD AcquisitionSettings.
PSDAcquisitionSettings page
Section 8.4.3, SettingPSDAcquisition Parametersfor Manual Mode
Table 5-15 Method Information That Is Not Converted (Continued)
Version 4.xMethod
ParameterLocation
Parameter Changes in Version 5.x
Version 5.xInstrument
SettingsParameterLocation
Described in
5-94 Applied Biosystems

Converting Version 4 Methods and Search Pattern Files
5
Information thatis not converted
Control mode is set to Manual for all files. The path for searchpattern files is not maintained. Automatic Calibrationparameters are not converted from .MNU files to .BIC files.
Calibration mode is automatically set to Default.
Data Processing parameters are not supported.
New parameter A new parameter called Mirror To Accelerating Voltage Ratio isincluded on the Advanced tab of the Mode/Digitizer Settingsdialog box in the .BIC file. This parameter was previouslycalled HV Tune Ratio, and was not part of the .MNU file. Youaccessed this parameter in Tune Mode from the version 4.xControl Panel.
The following default values are set for Mirror To AcceleratingVoltage Ratio:
• DE RP—1.06• Elite—1.06• DE STR—1.12• DE PRO—1.2
NOTE: This parameter influences the tuning characteristicsand default calibration of the instrument. Do not change thissetting unless instructed to do so by an Applied BiosystemsTechnical Representative. Changing this value significantlyalters the optimum settings of Grid Voltage% and DelayTime.
Before converting Before converting, determine the methods and search patternfiles that you want to convert. It is good practice to move thefiles you want to convert to a new directory (for example, adirectory called “Converted”) for easy access. All convertedfiles are placed in the same directory as the original files.Because converted search pattern files are given the samename as the original search pattern files, it is important to keeptrack of which search pattern files you have converted.
Voyager™ Biospectrometry™ Workstation User’s Guide 5-95

Chapter 5 Optimizing Instrument Settings
5
Converting 1. From the Tools menu, select Voyager 4.x FileConverter. The Voyager 4.x File Converter dialog boxis displayed (Figure 5-27).
2. Click Add and select the .MNU files to convert.
3. Click Add and select the .SP files to convert.
4. Click Convert.
5. If you are converting an autosampler .MNU file, open theconverted .BIC file and:
• On the Instrument Settings page, set the Controlmode to Automatic.
• In the Automatic Control mode dialog box,respecify the .SP file to ensure that the correctpath is used for the .SP file.
NOTE: No path is retained for the .SP file duringconversion. If the .SP file specified is located in theVoyager program directory, the software can use thefile during acquisition. If the .SP file is not in theVoyager program directory, an error message isdisplayed when the .BIC file is run.
It is good practice to move .SP files to a specificdirectory before converting, and to respecify the .SP filein the .BIC after converting.
5-96 Applied Biosystems
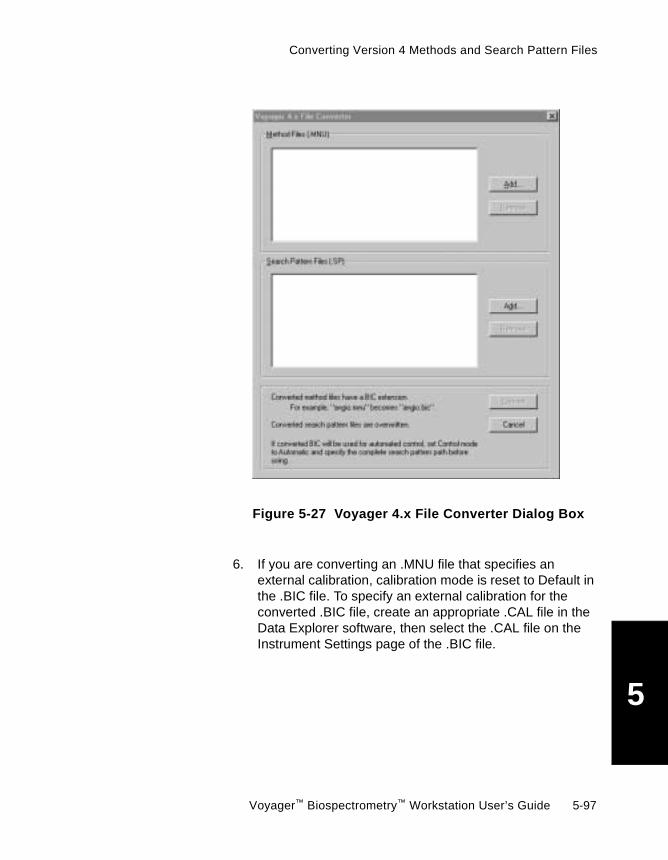
Converting Version 4 Methods and Search Pattern Files
5
Figure 5-27 Voyager 4.x File Converter Dialog Box
6. If you are converting an .MNU file that specifies anexternal calibration, calibration mode is reset to Default inthe .BIC file. To specify an external calibration for theconverted .BIC file, create an appropriate .CAL file in theData Explorer software, then select the .CAL file on theInstrument Settings page of the .BIC file.
Voyager™ Biospectrometry™ Workstation User’s Guide 5-97
Chapter 5 Optimizing Instrument Settings
5
5-98 Applied Biosystems
6Chapter
6 Acquiring Spectrafrom the InstrumentControl Panel
This chapter contains the following sections:
6.1 Before You Begin ............................................. 6-2
6.2 Acquiring in Manual Mode from theInstrument Control Panel ............................... 6-11
6.3 Obtaining Good Spectra inDelayed Extraction Mode............................... 6-21
6.4 Making Accurate Mass Measurements........... 6-26
6.5 Evaluating Datain the Instrument Control Panel ..................... 6-28
6.6 Acquiring in Automatic Modefrom the Instrument Control Panel ................. 6-35
Voyager™ Biospectrometry™ Workstation User’s Guide 6-1

Chapter 6 Acquiring Spectra from the Instrument Control Panel
6
6.1 Before You BeginThis section includes:
• Overview of acquisition options• Guidelines for acquiring• Calibrating the mass scale
6.1.1 Overview of Acquisition Options
NOTE: You cannot operate the mass spectrometer with thefront or side panels off. Safety interlocks prevent operationwhen panels are not in place.
The Voyager system provides the following options foracquiring data:
Table 6-1 Voyager Acquisition Options
AcquisitionOption
DescriptionFor more
information, see
Manual Controlmode inInstrumentControl Panel
• Single sample
• Manual control of laserintensity, sample position,data accumulation, datastorage
• Manual data evaluation
• Default or externalcalibration
Section 6.2, Acquiring inManual Mode from theInstrument Control Panel
continued
6-2 Applied Biosystems

Before You Begin
6
AutomaticControl mode inInstrumentControl Panel
• Single sample
• Automatic/manual control oflaser intensity or sampleposition
• Automatic control of dataaccumulation and datastorage
• Automatic data evaluationbased on acceptancecriteria you specify
• Default or externalcalibration
Section 6.6, Acquiring inAutomatic Mode from theInstrument Control Panel
Batch mode inSequenceControl Panel
• Multiple samples
• Uses instrument settingspreviously optimized forAutomatic Control inInstrument Control Panel
• Default, external, internal,and internal/updatecalibration
• Optional macro functionsthat can be applied beforeand after calibration
Chapter 7, AcquiringSpectra fromthe Sequence ControlPanel
Table 6-1 Voyager Acquisition Options (Continued)
AcquisitionOption
DescriptionFor more
information, see
Voyager™ Biospectrometry™ Workstation User’s Guide 6-3

Chapter 6 Acquiring Spectra from the Instrument Control Panel
6
6.1.2 Guidelines for AcquiringThis section includes:
• High voltage warmup for improved mass accuracy• Initial laser setting• Using optimized instrument settings• When acquiring a spectrum• Obtaining acceptable data• Obtaining maximum mass accuracy
High voltagewarmup for
improved massaccuracy
For maximum mass accuracy, allow the high voltage powersupplies to warm up for a short period of time beforeacquisition. This reduces variability in accelerating voltages,and yields more reproducible ion flight times.
To turn on the high voltage power supplies, click in thetoolbar.
NOTE: The high voltage power supplies are automaticallyturned off after 60 minutes if the mass spectrometer is notused. To change the Idle Time, see “High VoltageConfiguration” on page 2-38.
Initial lasersetting
After starting the software, the laser intensity is set to themid-range default laser setting (approximately 1,800). Whenyou load a .BIC file, the laser intensity that was stored in the.BIC file is loaded in the Instrument Control Panel. See“Adjusting laser intensity” on page 5-68, for more information.
Using optimizedinstrument
settings
Before analyzing samples in the Instrument Control Panel,open and optimize instrument settings in a .BIC file. You canoptimize more than one .BIC file to cover mass ranges orcompounds of interest.
For more information, see Section 5.4, Optimizing InstrumentSettings Parameters.
6-4 Applied Biosystems
Before You Begin
6
When acquiring aspectrumWhen acquiring a spectrum, note the following:
• For the first spectrum you acquire, the laser setting savedin the .BIC file selected is applied. If the laser intensity inthe .BIC is not optimized for the mass range, you may notsee a signal.
• Make subsequent laser adjustments as described in“Adjusting laser intensity” on page 5-68.
• To locate an acceptable signal, click-drag the scroll barson the Manual Laser/Sample Position control page to aimthe laser at different parts of the sample position.Samples often contain “hot spots” (areas of high ionintensity) and “cold spots” (areas of low ion intensity).When you locate a hot spot, stop acquiring and restart.
• When acquiring actual data, do not move the sampleposition. You observe the best resolution and massaccuracy when you collect ions produced from onelocation.
NOTE: When analyzing high masses or samples of lowconcentration, or when using thin-film matrices (forexample, in polymer analysis or in PSD mode), youmay run out of sample if you acquire from the samearea in the sample position. You may need to movearound on the sample position when acquiring to buildup adequate signal-to-noise ratio.
• Before adjusting laser intensity for subsequent spectra,stop acquisition. The laser setting recorded with the datafile is the last laser setting used.
NOTE: It is good practice to use one laser setting toacquire a spectrum, but you may need to adjust thelaser intensity to maintain adequate signal intensity.However, varying the laser intensity during acquisitionmay affect mass accuracy.
Voyager™ Biospectrometry™ Workstation User’s Guide 6-5
Chapter 6 Acquiring Spectra from the Instrument Control Panel
6
• Observe the Spectrum window or Oscilloscope screen todetermine if data is acceptable. See Section 4.3, Usingthe Spectrum Window, or Appendix I, Using theOscilloscope and Control Stick, for more information.
Obtainingacceptable data
The quality of the data you acquire is directly affected by:
• Ionization properties of the sample
• Sample preparation, discussed in Section 3.1, PreparingSamples
• Laser intensity
• Laser position on the sample
• Acquisition instrument settings
It may take some practice before you observe spectra that areacceptable for your analyses.
For examples of acceptable data and guidelines for obtainingacceptable data, refer to Section 6.3, Obtaining Good Spectrain Delayed Extraction Mode.
Obtainingmaximum mass
accuracy
For maximum mass accuracy, note the following:
• Use the Mass Accuracy Optimization option whenacquiring. For information, see Section 3.4.2, Using theMass Accuracy Optimization Option.
• Acquire at least six replicates of each sample for astatistically significant sampling of data.
• Collect at least 50 shots of data (determined by theShots/Spectrum parameter in the Instrument Settingscontrol page).
• Set %Centroid at 50% for most applications. Centroid% isdescribed in the Data Explorer Software User’s Guide.
6-6 Applied Biosystems
Before You Begin
6
6.1.3 Calibrating the Mass ScaleThis section describes:
• Types of calibration• When to calibrate• Calibration equations• Default calibration• Generated calibration• Acquiring calibration standards
Types ofcalibration
The Voyager software includes a default calibration routinethat provides adequate mass accuracy for many applications.
If you require optimum mass accuracy, you can generate acalibration based on the observed time of flight of the knownmasses of calibration standards. The Calibration function inthe Voyager system allows you to generate four types ofcalibration:
• Default calibration—Provides typically 0.1% accuracyin Linear mode, and typically 0.01% or better accuracyin Reflector mode.
• External calibration—Provides 0.05% accuracy inLinear mode, and 0.01% or better accuracy in Reflectormode. To perform external calibration, you create acalibration (.CAL) file in the Data Explorer softwareusing standards of known mass. You then specify thefile in the Instrument Control Panel when acquiringdata, or apply the file to existing data in the DataExplorer software.
• Internal calibration—Provides accuracy of 0.02% orbetter in Linear mode, and 0.002% (20 ppm) inReflector mode. See Appendix A, Specifications, for theinternal calibration mass accuracy specification for yoursystem type. To perform internal calibration, you includean internal standard in your sample. You then displaythe data file in the Data Explorer software and calibrateusing the internal standard.
Voyager™ Biospectrometry™ Workstation User’s Guide 6-7
Chapter 6 Acquiring Spectra from the Instrument Control Panel
6
• Sequence Control calibration–Provides external,internal, and internal with automatic updating calibrationoptions during acquisition from the Sequence ControlPanel. For more information, see Section 7.7.1,Calibration Options in a Sequence.
For the mass accuracy specifications for your instrument, referto Appendix A, Specifications.
NOTE: Mass accuracy for sample positions in the outerrows of a sample plate may be poorer than the massaccuracy of the sample positions in the inner rows.
When to calibrate Calibrate:
• At least once a day. You may want to include calibrationstandards on each sample plate.
• If the ambient temperature in your lab is fluctuatingmore than 5°C, check calibration, and recalibrate ifnecessary.
The calibration software compensates for changes ininstrument settings. However, if you require optimum massaccuracy, generate a calibration file with identical instrumentsettings or use internal calibration if possible.
6-8 Applied Biosystems

Before You Begin
6
CalibrationequationsThe general equation that the Voyager software uses forcalibration with a .CAL file is described in Figure 6-1.
Figure 6-1 Calibration Equation
Defaultcalibration
The default theoretical calibration is a multi-parameterequation that uses calculated values for t0 and A. Calculatedvalues are based on the configuration of the system, such asflight tube length and accelerating voltage.
t (nsec) = t0 + A
where:
t0 = Difference in time between the start time of the analysis
Effective Length (mm)
√ Accelerating Voltage (V)× √
m0
2e× 106A
where:
m0 = 1 dalton mass in SI units (1.66054 × 10⁻²⁷ kg)e = charge of electron in SI units (1.602177 × 10⁻¹⁹ Coulomb)Effective Length = Length of flight tube corrected for ion
acceleration through the stages ofthe source and flight tube, and for theimpact of the guide wire.
and the time of ion extraction in Delayed Extraction,or the time of ionization in Continuous Extraction.Also called Effective Delay.
+ (higher order terms) √m/z
m/z = mass-to-charge ratio
~~
t = Flight time of the ion
Voyager™ Biospectrometry™ Workstation User’s Guide 6-9
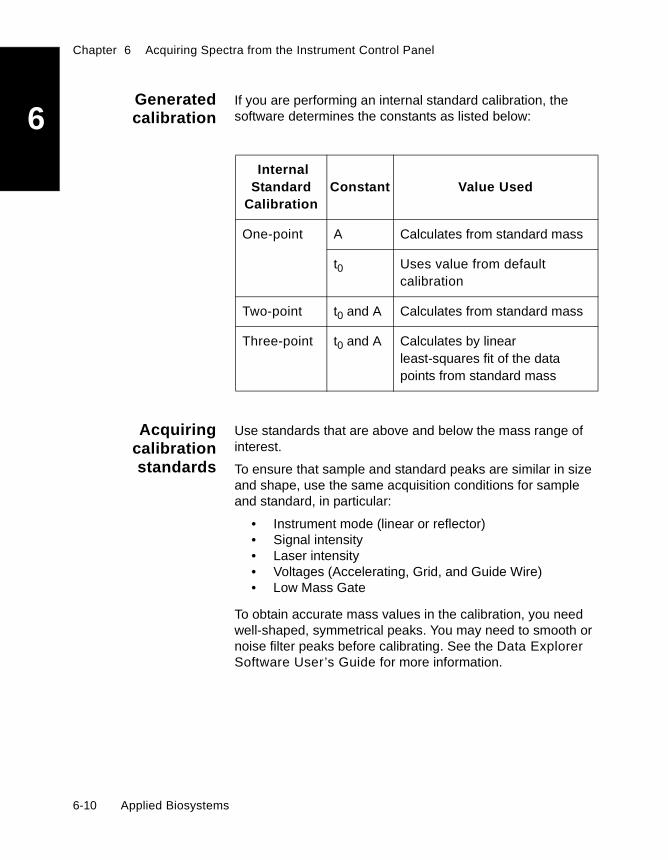
Chapter 6 Acquiring Spectra from the Instrument Control Panel
6
GeneratedcalibrationIf you are performing an internal standard calibration, thesoftware determines the constants as listed below:
Acquiringcalibrationstandards
Use standards that are above and below the mass range ofinterest.
To ensure that sample and standard peaks are similar in sizeand shape, use the same acquisition conditions for sampleand standard, in particular:
• Instrument mode (linear or reflector)• Signal intensity• Laser intensity• Voltages (Accelerating, Grid, and Guide Wire)• Low Mass Gate
To obtain accurate mass values in the calibration, you needwell-shaped, symmetrical peaks. You may need to smooth ornoise filter peaks before calibrating. See the Data ExplorerSoftware User’s Guide for more information.
InternalStandard
CalibrationConstant Value Used
One-point A Calculates from standard mass
t0 Uses value from defaultcalibration
Two-point t0 and A Calculates from standard mass
Three-point t0 and A Calculates by linearleast-squares fit of the datapoints from standard mass
6-10 Applied Biosystems
Acquiring in Manual Mode from the Instrument Control Panel
6
6.2 Acquiring in Manual Mode fromthe Instrument Control PanelThis section includes:
• Manually acquiring, evaluating, and saving spectra• Manually accumulating spectra from multiple acquisitions
Before acquiring spectra, become familiar with the informationin Section 6.1, Before You Begin.
6.2.1 Manually Acquiring,Evaluating, and Saving Spectra
This section describes the following manual mode procedures:
• Selecting instrument settings• Selecting sample position and laser intensity• Setting Data Storage• Starting acquisition• During acquisition• Evaluating data• Saving data• Saving the instrument settings (.BIC) file
Selectinginstrument
settings
To select instrument settings to manually acquire data:
1. In the Instrument Control Panel, open or create aninstrument settings (.BIC) file with the appropriateparameters. See Section 5.4, Optimizing InstrumentSettings Parameters, for information.
Voyager™ Biospectrometry™ Workstation User’s Guide 6-11
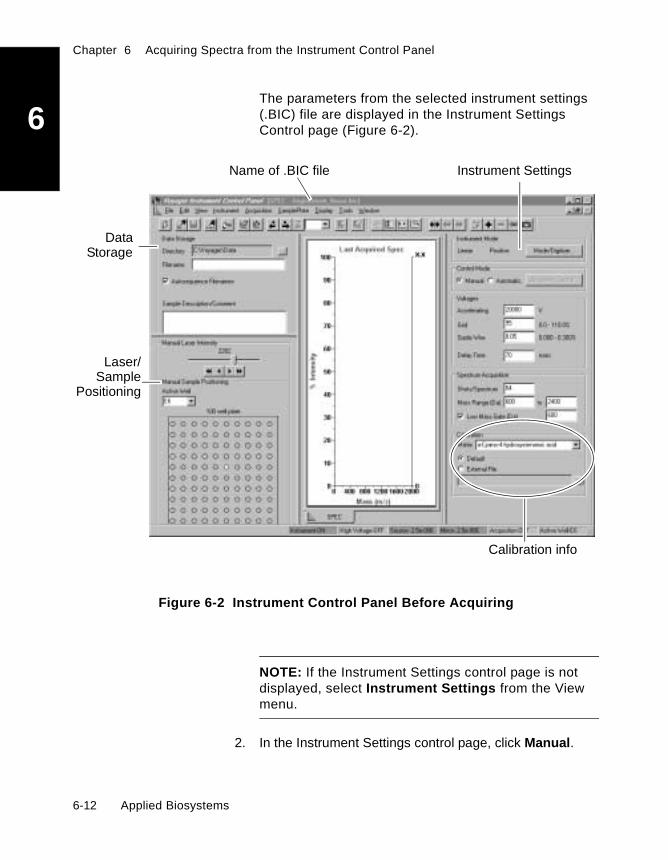
Chapter 6 Acquiring Spectra from the Instrument Control Panel
6
The parameters from the selected instrument settings(.BIC) file are displayed in the Instrument SettingsControl page (Figure 6-2).Figure 6-2 Instrument Control Panel Before Acquiring
NOTE: If the Instrument Settings control page is notdisplayed, select Instrument Settings from the Viewmenu.
2. In the Instrument Settings control page, click Manual.
Name of .BIC file
Data
Laser/Sample
Instrument Settings
Storage
Positioning
Calibration info
6-12 Applied Biosystems

Acquiring in Manual Mode from the Instrument Control Panel
6
3. Specify calibration information:• Calibration Matrix—Select the matrix used foryour application. For more information, see “Matrixinfluence” on page 5-22.
• Default or External—Select Default, or select anexternal .CAL file. For more information, see“Types of calibration” on page 6-7.
Selecting sampleposition and laser
intensity
To select sample position and laser intensity, do the followingin the Manual Laser/Sample Positioning control page (seeFigure 6-2 on page 6-12):
1. If the Manual Laser/Sample Positioning control page isnot displayed, select Manual Laser/Sample Positioningfrom the View menu.
2. Select the sample to analyze by doing any of the followingin the Active Position box:
• Type a position number• Select a position number from the drop-down list• Single-click on a sample position
Hint: You can also move to a sample position using thecontrol stick, by selecting Move to Sample Positionfrom the Sample Plate menu, or by clicking .
To zoom on the Active Sample Position, you can do anyof the following:
• Double-click on the sample position in the Plateview.
• Select Sample View from the Sample Plate menu.
• Right-click the mouse and select ToggleSample/Plate View.
Voyager™ Biospectrometry™ Workstation User’s Guide 6-13

Chapter 6 Acquiring Spectra from the Instrument Control Panel
6
Hint: You can double-click on the control page to“undock” it, and click-drag it to any location on thescreen. Double-click again to re-dock the page.3. Set the laser intensity by click-dragging the slider orclicking the arrows. For more information, seeSection 4.5.2, Adjusting Laser Intensity and SelectingSample Position, and Section 5.4.2, Determining theLaser Setting.
Hint: You can also set laser intensity by pressingCtrl+PgUp and Ctrl+PgDn on the keyboard.
Setting DataStorage
parameters
You can specify Data Storage parameters before or afteracquiring in Manual Control mode. To specify Data Storagelocation and file name:
1. If the Data Storage control page (Figure 6-3) is notdisplayed, select Data Storage from the View menu.
Figure 6-3 Data Storage Control Page
2. Click to select a directory in which all data files will bestored.
6-14 Applied Biosystems
Acquiring in Manual Mode from the Instrument Control Panel
6
3. Type a filename.4. Select Autosequence Filenames if you want thesoftware to determine the next available sequentialfilename.
NOTE: If you deselect Autosequence Filenames, thesoftware uses the name in the Filename field and willoverwrite an existing data file.
If Autosequence is enabled, a 4-digit suffix starting at0001 is automatically appended to the filenamespecified. For example, SAMPLE_0001.
Before acquiring, the software checks the directoryspecified in the Data Storage page for root file name,then appends the next available suffix. The softwaredoes not overwrite existing file names or reset the suffixto 0001.
If you want to reset the suffix to 0001, delete or moveexisting files from the directory, or use a different filename.
5. Enter comments that will be saved with the data file. Thisstep is optional.
Voyager™ Biospectrometry™ Workstation User’s Guide 6-15

Chapter 6 Acquiring Spectra from the Instrument Control Panel
6
StartingacquisitionTo start acquiring, select Start Acquisition from theAcquisition menu, or click .
CAUTION
If you do not save data before starting a new acquisition,the data in the Current trace is lost.
Acquisition starts and continues until the number ofShots/Spectrum specified in Spectrum Acquisition on theInstrument Settings control page is collected, or until youselect Stop Acquisition from the Acquisition menu or click
again.
Duringacquisition
During acquisition:
• The Live/Current Spectrum trace in the Spectrum windowupdates to display the spectrum that results from eachlaser shot, with the following exceptions:
• If you are acquiring a large number of data points,the Spectrum window is not updated with everylaser shot. The exact update rate depends on theMass Range setting and the Bin Size setting youare using.
• If your system includes an oscilloscope, theCurrent Spectrum does not display a trace untilacquisition is complete. The spectra that resultfrom each laser shot are displayed on theoscilloscope screen.
• The system averages all spectra acquired after you startacquisition.
NOTE: If the system is set to acquire in single-shotmode, spectra are not averaged. See page 2-44
When acquisition is complete, the software displays theaveraged spectrum in a Current trace in the Spectrum window.
6-16 Applied Biosystems
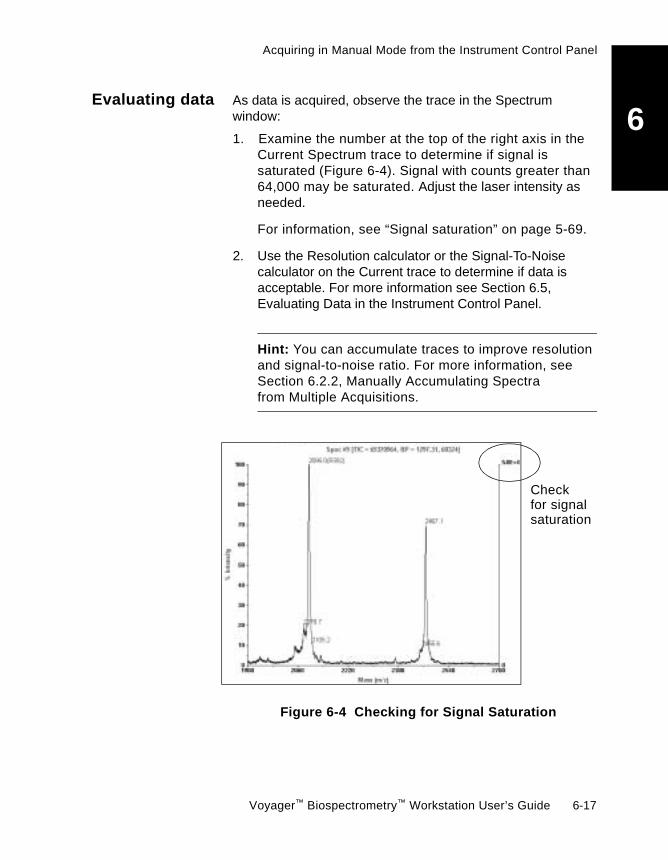
Acquiring in Manual Mode from the Instrument Control Panel
6
Evaluating data As data is acquired, observe the trace in the Spectrumwindow:
1. Examine the number at the top of the right axis in theCurrent Spectrum trace to determine if signal issaturated (Figure 6-4). Signal with counts greater than64,000 may be saturated. Adjust the laser intensity asneeded.
For information, see “Signal saturation” on page 5-69.
2. Use the Resolution calculator or the Signal-To-Noisecalculator on the Current trace to determine if data isacceptable. For more information see Section 6.5,Evaluating Data in the Instrument Control Panel.
Hint: You can accumulate traces to improve resolutionand signal-to-noise ratio. For more information, seeSection 6.2.2, Manually Accumulating Spectrafrom Multiple Acquisitions.
Figure 6-4 Checking for Signal Saturation
Checkfor signalsaturation
Voyager™ Biospectrometry™ Workstation User’s Guide 6-17
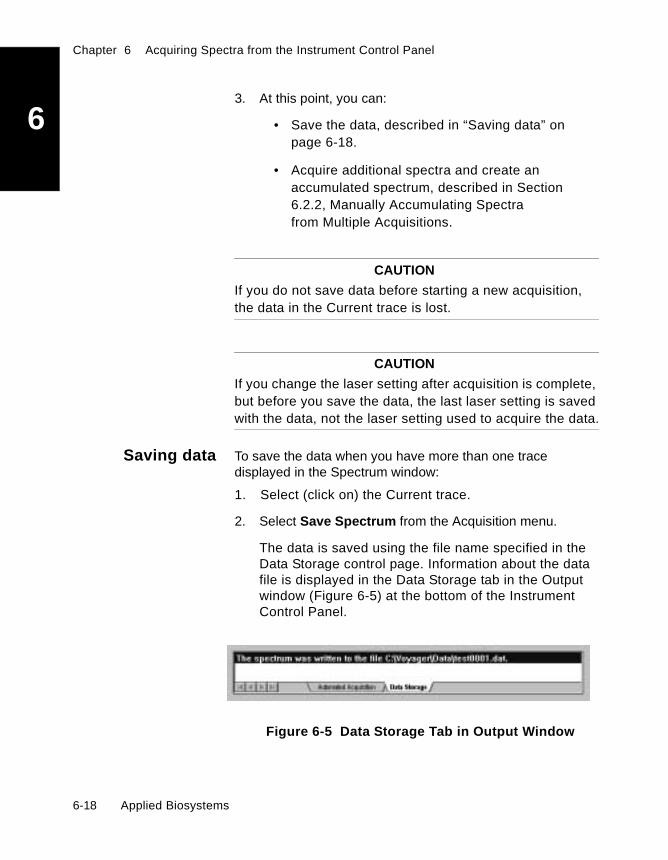
Chapter 6 Acquiring Spectra from the Instrument Control Panel
6
3. At this point, you can:• Save the data, described in “Saving data” onpage 6-18.
• Acquire additional spectra and create anaccumulated spectrum, described in Section6.2.2, Manually Accumulating Spectrafrom Multiple Acquisitions.
CAUTION
If you do not save data before starting a new acquisition,the data in the Current trace is lost.
CAUTION
If you change the laser setting after acquisition is complete,but before you save the data, the last laser setting is savedwith the data, not the laser setting used to acquire the data.
Saving data To save the data when you have more than one tracedisplayed in the Spectrum window:
1. Select (click on) the Current trace.
2. Select Save Spectrum from the Acquisition menu.
The data is saved using the file name specified in theData Storage control page. Information about the datafile is displayed in the Data Storage tab in the Outputwindow (Figure 6-5) at the bottom of the InstrumentControl Panel.
Figure 6-5 Data Storage Tab in Output Window
6-18 Applied Biosystems

Acquiring in Manual Mode from the Instrument Control Panel
6
Saving theinstrumentsettings (.BIC) file
When acquisition is complete, save the instrument settings(.BIC) file used to acquire the data if you want to store theoptimized laser intensity used during this acquisition. Forinformation on saving a .BIC file, see Section 5.1.5, Savingand Printing Instrument Settings.
NOTE: You can export instrument settings from a .DAT filethat has been saved in Data Explorer. For more information,see the Data Explorer User’s Guide.
6.2.2 Manually Accumulating Spectrafrom Multiple Acquisitions
You can manually accumulate spectra from differentacquisitions to improve resolution and signal-to-noise ratio ofyour data.
Accumulating To manually accumulate spectra from multiple acquisitions:
1. Acquire a spectrum and evaluate the data as describedin Section 6.2.1, Manually Acquiring,Evaluating, and Saving Spectra.
2. When acquisition is complete, do not save the data.
3. If the spectrum is acceptable, select AccumulateSpectrum from the Acquisition menu or click toaccumulate the spectrum.
The software adds an Accumulated trace to theSpectrum window and copies the Current trace in theAccumulated trace.
If the spectrum is not acceptable, start a newacquisition. The Current trace will be overwritten by thenew acquisition.
Voyager™ Biospectrometry™ Workstation User’s Guide 6-19
Chapter 6 Acquiring Spectra from the Instrument Control Panel
6
CAUTIONIf you change any instrument settings, with theexception of Shots/Spectrum and laser intensity, theAccumulated trace is automatically cleared before thenext acquisition.
4. Repeat step 1 though step 3 to acquire and accumulateadditional spectra. Each spectrum you accumulate isaveraged with the existing Accumulated trace.
NOTE: If needed, select Clear Accumulated tracefrom the Acquisition menu or click .
5. When the data is acceptable, select (click on) theAccumulated trace.
6. Select Save Spectrum from the Acquisition menu.
6-20 Applied Biosystems

Obtaining Good Spectra in Delayed Extraction Mode
6
6.3 Obtaining Good Spectrain Delayed Extraction ModeThis section describes:
• What is a good spectrum?• Laser intensity• Parameters affecting resolution and signal-to-noise ratio
6.3.1 What Is a Good Spectrum?
A good spectrum is one that is acceptable for your analysis. Ingeneral, it:
• Contains sharp, symmetrical, well-defined peaks• Has acceptable resolution• Has acceptable signal-to-noise ratio
For some applications (for example, when you are looking fordetailed structural information), you may require verywell-separated isotope peaks and the maximum resolutionpossible. For other applications (for example, when looking foran estimate of molecular weight), your requirements may beless strict.
Figure 6-6 through Figure 6-9 are examples of poor and goodspectra.
NOTE: Masses are typically accurate in Delayed Extractionmode, even at high laser power.
NOTE: Dimers in a spectrum may indicate that themolecular ion is saturated, or that sample is tooconcentrated. Decrease laser intensity or sampleconcentration to minimize the dimer.
Voyager™ Biospectrometry™ Workstation User’s Guide 6-21
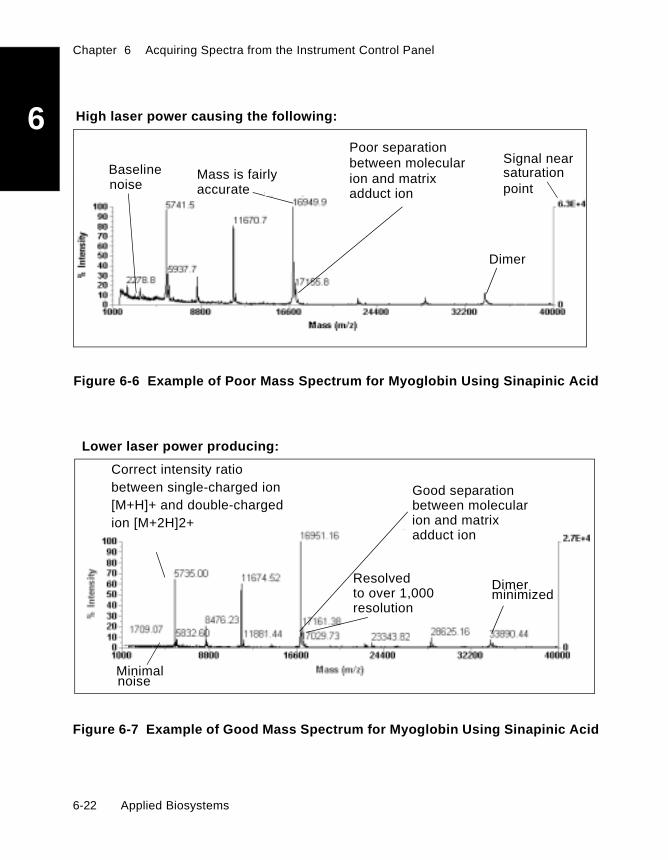
Chapter 6 Acquiring Spectra from the Instrument Control Panel
6
Figure 6-6 Example of Poor Mass Spectrum for Myoglobin Using Sinapinic Acid
Figure 6-7 Example of Good Mass Spectrum for Myoglobin Using Sinapinic Acid
High laser power causing the following:
noiseMass is fairlyaccurate
Dimer
Poor separationbetween molecularion and matrixadduct ion
Signal nearsaturationpoint
Baseline
Lower laser power producing:
Minimalnoise
Good separationbetween molecularion and matrixadduct ion
Resolvedto over 1,000resolution
Dimerminimized
Correct intensity ratiobetween single-charged ion[M+H]+ and double-chargedion [M+2H]2+
6-22 Applied Biosystems

Obtaining Good Spectra in Delayed Extraction Mode
6
Figure 6-8 Example of Poor Mass Spectrum for Angiotensin
Figure 6-9 Example of Good Mass Spectrum for Angiotensin
High laser power causing the following:
Matrix peaks and sample saturated
Broad peakPoor resolution
Mass isaccurate
Minor componentsor fragments of majorcomponents ionized
Signal issaturated
Baseline noise
Peak not saturatedSharp, narrow peakresolved to isotopesMatrix peaks minimized
No minorcomponentsor fragments
Lower laser power producing:
Voyager™ Biospectrometry™ Workstation User’s Guide 6-23

Chapter 6 Acquiring Spectra from the Instrument Control Panel
6
6.3.2 Laser IntensityOverview Laser intensity does not have a major impact on resolution orsignal-to-noise ratio. You need to find the laser setting thatgives you an acceptable signal-to-noise ratio and acceptableresolution (optimum is not necessary), and then fine-tune. Ifadjusting Grid Voltage% and Delay Time causes the signal tosaturate, you may need to make additional laser adjustments.For more information on adjusting the laser, see Section 5.4.2,Determining the Laser Setting.
Continue acquiring and decreasing the laser intensity until youobserved a moderate resolution and a signal-to-noise ratio ofapproximately 50:1.
Fragment ionsgenerated athigher laser
intensity
Higher laser power can cause two types of fragment ions toform:
• Prompt (fast) fragments—Form in the ion source beforeion acceleration, detected in Linear and Reflector mode.
• PSD (slow) fragments—Form in the flight tube after ionacceleration, detected in Reflector mode.
Figure 6-10 shows a partial spectrum of Angiotensin Iobtained at high laser intensity in Reflector mode. The highlaser intensity has generated fragments.
Figure 6-10 Fragment Ions in Reflector Mode
Prompt
PSD
PSD
Prompt Prompt
PSD
Mixture ofPromptand PSD
6-24 Applied Biosystems

Obtaining Good Spectra in Delayed Extraction Mode
6
Prompt fragments Prompt fragments appear in the spectrum at masses thatcorrespond to the theoretical masses of the fragments,because they are formed in the source.
PSD fragments PSD fragments appear in the spectrum at masses slightlyhigher than the theoretical masses of the fragments becausethey are formed after the source, but travel at the same speedas the precursor until they reach the reflector. Because theyhave lower kinetic energy than the precursor, they separate inmass from the precursor in the reflector.
6.3.3 Parameters AffectingResolution and Signal-to-Noise Ratio
Parametersaffecting
resolution
These parameters have a primary impact on resolution:
• Delay Time• Guide Wire Voltage%• Grid Voltage%• Digitizer Bin size and Input Bandwidth
NOTE: Guide Wire Voltage% is not available onVoyager-DE STR models with serial number 4154 and later.
For more information on optimizing resolution, Section 5.4.3,Optimizing Resolution.
Parametersaffecting
signal-to-noiseratio
These parameters have a primary impact on signal-to-noiseratio:
• Accelerating Voltage• Guide Wire Voltage%• Shots/Spectrum• Digitizer Input Bandwidth• Low Mass Gate
NOTE: Guide Wire Voltage% is not available onVoyager-DE STR models with serial number 4154 and later.
For more information on optimizing signal-to-noise, seeSection 5.4.4, Optimizing Signal-to-Noise Ratio.
Voyager™ Biospectrometry™ Workstation User’s Guide 6-25
Chapter 6 Acquiring Spectra from the Instrument Control Panel
6
6.4 Making AccurateMass MeasurementsOverview Accurate mass measurements are typically made by includingreference compounds (internal standards) in the samespectrum as the analyte, and then recalibrating the spectrum.
In Reflector mode (Voyager-DE PRO and Voyager-DE STR),internal calibration provides mass spectra with a massaccuracy of 10 to 20 ppm routinely.
This section describes the factors that influence massaccuracy at this level.
Duringacquisition
When acquiring data, the following factors contribute to theaccuracy of mass measurements:
• Symmetrical peak shape—Depending on the m/z inquestion, the spacing between data points canrepresent a change in mass from 10 or 20 ppm to morethan 100 ppm. When determining the position of an ionin terms of m/z, the software interpolates between datapoints to make a mass assignment at the 10 ppm level.Therefore, a skewed peak shape can have a strongimpact on the observed mass accuracy.
• Signal-to-noise ratio as high as possible withoutskewing peak shape—Peak position can be affectedby noise. On Voyager instruments, avoid full scalesignals (64,000 counts) which may be saturated. Toavoid the saturation problem, accumulate spectra withappropriate evaluation criteria. See “Setting spectrumacceptance and laser adjustment criteria” on page 6-42for more information.
• Signal intensity of reference and analyte peaksabove 1,000 counts—Signal intensity above1,000 counts with a Shots/Spectrum setting of 50 orgreater ensures adequate peak statistics needed foraccurate assignment of peak position.
6-26 Applied Biosystems

Making Accurate Mass Measurements
6
• Signal intensity of reference and analyte peaks is inthe same range—Signal intensity of reference andanalyte peaks should be of similar magnitude. If theyare not in the same range, you may see weak analytepeaks with poor signal-to-noise ratio while the internalstandard is adequate, or saturated internal standardpeaks with adequate analyte peaks.
• No contaminants present—Unresolved contaminantscan affect peak shape.
• Two internal reference masses that bracket themass range of interest—Best results are obtainedwhen masses above and below the mass of interest arecorrectly identified.
NOTE: Although not required, using more than tworeference masses can help to minimize the effects ofan asymmetrical reference peak.
• Internal reference masses are within the samerange as analyte masses—Best results are obtainedwhen masses are in the same range. For example,reference masses of 904 and 1,570 are adequate whenevaluating an analyte mass of 1,296 Da.
During masscalibration andpeak detection
When calibrating mass (described in the Data ExplorerSoftware User’s Guide) and detecting peaks (described inthe Data Explorer Software User’s Guide), the followingfactors contribute to the accuracy of mass measurements:
• Use Centroid mass instead of Apex mass—Beforecalibrating, set peak labels to Centroid. Centroid massis the best representation of peak position. Apex massrepresents the highest data point.
• Set Centroid Percent to 50%—Lower settings caninclude noise or contaminant peaks. Higher settingsmay not include adequate data to ensure accuratemass assignment.
Voyager™ Biospectrometry™ Workstation User’s Guide 6-27

Chapter 6 Acquiring Spectra from the Instrument Control Panel
6
6.5 Evaluating Data in theInstrument Control PanelThis section describes:
• Detecting, integrating, and labeling peaks• Calculating mass resolution• Calculating signal-to-noise ratio
6.5.1 Detecting,Integrating, and Labeling Peaks
Detecting peaks Peaks are not detected in the Spectrum window untilacquisition is complete.
To adjust peak detection when acquisition is complete
1. From the Tools menu, select Peak Detection.
The Peak Detection dialog box is displayed(Figure 6-11).
Figure 6-11 Peak Detection Dialog Box
6-28 Applied Biosystems
Evaluating Data in the Instrument Control Panel
6
NOTE: The parameters in this dialog box correspond tothe Advanced Settings tab in the Peak Detection dialogbox in the Data Explorer software.2. Select a detection range and set parameters as describedin the Data Explorer Software User’s Guide.
3. Click Apply to accept the parameters and leave the dialogbox open, or click OK to accept the parameters and closethe dialog box. If peaks are not labeled, enable labels asdescribed in the next section.
NOTE: The Instrument Control Panel uses many of thesame parameters, detection, and integration algorithmsas the Data Explorer software. For information, see theData Explorer Software User’s Guide.
Labelingspectrum peaks
Labeling spectrum peaks in the Instrument Control Panel issimilar to labeling spectrum peaks in the Data Explorersoftware.
Activate the trace to label, select Peak Label from the Displaymenu, enable and select labels, and set the number ofdecimal points to display. For information, see the DataExplorer Software User’s Guide.
Disabling spectrumpeak labels
To disable, select Peak Label from the Display menu, anddisable labels as needed.
Voyager™ Biospectrometry™ Workstation User’s Guide 6-29

Chapter 6 Acquiring Spectra from the Instrument Control Panel
6
6.5.2 Calculating Mass ResolutionYou can calculate mass resolution for up to four peaks in thespectrum currently being acquired. The resolution values aredisplayed in the trace next to the mass value for the peak.
Calculatingresolution for live
data
To calculate mass resolution:
1. When acquisition is complete, select the Currentspectrum.
2. From the Tools menu, select Resolution Calculator.
3. In the Resolution Calculator dialog box (Figure 6-12), setthe percentage of peak height at which to calculateresolution. The default is 50%, which calculates theresolution at the full width/half maximum of the peakheight (FWHM).
NOTE: Measuring resolution at the full width/halfmaximum is the industry standard. Use 50% PeakHeight for most applications.
4. Set Minimum Peak Intensity. Signals below this intensity(absolute counts) are not included in the calculation.
Figure 6-12 Resolution Calculator
FWHM=50% peak height
6-30 Applied Biosystems

Evaluating Data in the Instrument Control Panel
6
5. Type in up to four Mass/Charge values for which tocalculate resolution.
6. For each Mass/Charge, enter the window for calculation(± AMU).
NOTE: To label isotopes, set the ± AMU value lowenough to prevent the calculation windows for eachisotope peak from overlapping. If the calculationwindows overlap, only the highest peak is labeled. Ifyou set too low, the peak of interest may not be labeled.However, if you set ± AMU too low, the peak of interestmay not appear in the window, and resolution will notbe calculated.
7. Click OK.
The peaks are labeled with (RXXXX) next to the peakmass, where XXXX is the resolution (Figure 6-13). Toturn off resolution labels, see “Labeling spectrumpeaks” on page 6-29.
NOTE: If you do not apply peak detection parametersafter acquisition is complete, resolution labels are notdisplayed.
Voyager™ Biospectrometry™ Workstation User’s Guide 6-31

Chapter 6 Acquiring Spectra from the Instrument Control Panel
6
Figure 6-13 Resolution Calculator Results
The table below lists a general rating scale for resolution andmolecular weight ranges for compounds acquired in Linearmode.
Resolutionresult
Table 6-2 Resolution Rating Scale
Compounds<2,000 Da
Compounds 2,000to 5,000 Da
Compounds 5,000to 25,000 Da
Compounds>25,000 Da
Resolution Rating Resolution Rating Resolution Rating Resolution Rating
500 Notacceptable
250 Notacceptable
500 Notacceptable
50 Acceptable
1,500 Acceptable 400 Acceptable 700 Acceptable 100 Good
2,000 Good 500 Good 900 Good >200 Very good
2,500 Very good >600 Very good 1,000 Very good ____ ____
6-32 Applied Biosystems

Evaluating Data in the Instrument Control Panel
6
6.5.3 Calculating Signal-to-Noise RatioOverview A signal-to-noise ratio is typically used to describe how well amass of interest in a spectrum is distinguished frombackground chemical and electronic noise.
The Control Panel software measures the signal-to-RMSnoise ratio in a user-defined region of a mass spectrum.
Calculatingsignal-to-RMS
noise ratio
To calculate a signal-to-RMS noise ratio:
1. When acquisition is complete, select the Currentspectrum of interest.
2. From the Tools menu, select Signal-to-Noise Calculator.
3. In the Signal to Noise Calculator dialog box (Figure 6-14),set the Baseline Region by doing one of the following:
• Type in From and To values
• In the Spectrum window, right-click-drag over thebaseline area you want to use in calculatingsignal-to-noise ratio. For accurate results, specify aflat (non-rising) region of baseline that does notinclude peaks.
Figure 6-14 Signal to Noise Calculator
Voyager™ Biospectrometry™ Workstation User’s Guide 6-33

Chapter 6 Acquiring Spectra from the Instrument Control Panel
6
4. For each Mass/Charge, enter the window for calculation(± AMU).
NOTE: To label peaks, set the ± AMU value low enoughto prevent the calculation windows for each peak fromoverlapping. If the calculation windows overlap, onlythe first peak is labeled. However, if you set ± AMU toolow, the peak of interest may not appear in the window,and signal-to-noise will not be calculated.
5. Click OK.
The peaks are labeled with (SXXX) next to the peakmass, where XXX is the signal-to-noise ratio.
NOTE: If you do not apply peak detection parametersafter acquisition is complete, signal-to-noise labels arenot displayed.
6-34 Applied Biosystems
Acquiring in Automatic Mode from the Instrument Control Panel
6
6.6 Acquiring inAutomatic Mode from theInstrument Control PanelThis section includes:
• Before acquiring in Automatic Control mode
• Setting Instrument Settings for Automatic Control mode
• Automatically acquiring, evaluating, and saving spectra
• Search patterns
• Process that occurs during acquisition in AutomaticControl mode
• Process that occurs when accumulating spectra frommultiple search pattern positions
PSD analysis inAutomatic mode
For information on performing PSD analysis in automaticmode, see Section 8.5, Acquiring PSD Data with Standard.BIC Files in Automatic Control Mode.
Voyager™ Biospectrometry™ Workstation User’s Guide 6-35

Chapter 6 Acquiring Spectra from the Instrument Control Panel
6
6.6.1 Before Acquiring inAutomatic Control Mode
Backgroundinformation
Before acquiring spectra in Automatic Control mode, becomefamiliar with the information in:
• Section 6.1, Before You Begin• Section 6.2, Acquiring in Manual Mode from the
Instrument Control Panel
Aligning thesample plate
Sample plate alignment is necessary for automated samplepositioning in Automatic Control mode if the laser is notstriking the center position of the sample position.
Sample plate alignment may not be necessary on yoursystem, particularly if you use the SPIRAL.SP search patternfile provided with the system.
See Section 2.7, Aligning the Sample Plate, to determine ifsample plate alignment is necessary.
Using MassAccuracy
Optimization
In a typical analysis run that requires optimum mass accuracy,you include samples interspersed with many calibrationstandards, and externally calibrate the samples using theclosest calibration standard.
By using the Mass Accuracy Optimization feature in theVoyager software, you can obtain optimum mass accuracyusing fewer calibration standards. For information, seeSection 3.4.2, Using the Mass Accuracy Optimization Option,and Section 2.8, Running OptiPlate to Optimize MassAccuracy.
6-36 Applied Biosystems

Acquiring in Automatic Mode from the Instrument Control Panel
6
6.6.2 Setting Instrument Settings forAutomatic Control Mode
This section includes:
• Specifying Automatic Control settings
• Setting spectrum acceptance and laser adjustmentcriteria
• Saving the instrument settings (.BIC) file
SpecifyingAutomatic
Control settings
After you optimize an instrument settings file for ManualControl mode and ensure that parameters are adjusted foroptimum performance, you can adjust the instrument settingsfor Automatic Control mode, if desired. For information onoptimizing for Manual Control mode, see Chapter 5,Optimizing Instrument Settings.
You can set parameters to control the following in AutomaticControl mode:
• Laser intensity adjustment• Spectrum accumulation and saving• Sample positioning• Stop conditions
To set instrument settings for Automatic Control mode:
1. In the Instrument Control Panel, open or create aninstrument settings (.BIC) file with the appropriateparameters. For more information, see Section 5.4,Optimizing Instrument Settings Parameters.
NOTE: Make sure the instrument settings yieldacceptable results in Manual Control mode beforesetting to Automatic Control mode.
2. In the Instrument Settings control page, select AutomaticControl mode.
Voyager™ Biospectrometry™ Workstation User’s Guide 6-37
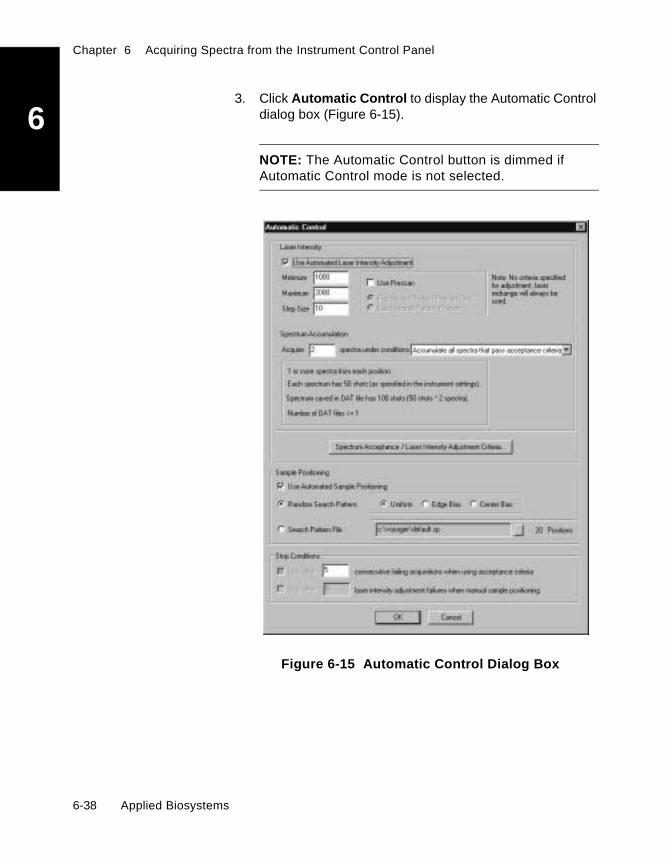
Chapter 6 Acquiring Spectra from the Instrument Control Panel
6
3. Click Automatic Control to display the Automatic Controldialog box (Figure 6-15).
NOTE: The Automatic Control button is dimmed ifAutomatic Control mode is not selected.
Figure 6-15 Automatic Control Dialog Box
6-38 Applied Biosystems
Acquiring in Automatic Mode from the Instrument Control Panel
6
Laser 4. Select Use Automated Laser Intensity Adjustment.NOTE: To manually control the laser intensity whenacquiring in Automatic Control mode, deselect UseAutomated Laser Intensity Adjustment. For moreinformation, see Section 4.5.2, Adjusting LaserIntensity and Selecting Sample Position.
5. If you enable Use Automated Laser Intensity Adjustment,specify the Minimum and Maximum Laser Intensity andthe Step Size to use. For more information, see “LaserIntensity Adjustment” on page 5-34.
6. If you enable Use Automated Laser Intensity Adjustmentand Use Automated Sample Positioning (described instep 10 on page 6-41), select Use PreScan if desired,then select an option:
• First Search Pattern Position Only• Each Search Pattern Position
NOTE: Prescan options are not available unless youselect Use Automated Laser Intensity Adjustment andUse Automated Sample Positioning.
For more information on the Prescan process, see“Prescan mode” on page 6-58.
7. If you enable Use Automated Laser Intensity Adjustment,set adjustment criteria as described in “Setting spectrumacceptance and laser adjustment criteria” on page 6-42.
NOTE: If you do not specify laser adjustment criteria,the laser is not adjusted. The mid-range laser settingbetween the minimum and maximum specified in step 5is used.
Voyager™ Biospectrometry™ Workstation User’s Guide 6-39

Chapter 6 Acquiring Spectra from the Instrument Control Panel
6
Spectrumaccumulation andsaving
8. Specify Spectrum Accumulation parameters:
• Acquire X Spectra—Specifies the number ofspectra to acquire. The software compares thevalue you enter with the possible number ofpositions in the selected search pattern anddisplays a message if you enter a value greaterthan the number of positions.
• Under Conditions—Determines if spectra aresaved individually or accumulated, and if spectraare evaluated against Acceptance Criteria.
NOTE: If you select Save All Spectra or Save AllSpectra that Pass Acceptance Criteria SaveConditions (which save individual multiple spectrain one data file), the recommended maximumnumber of spectra to acquire is 500. Acquiringmore than 500 individual spectra in one filegenerates a very large data file that can be slow toopen and process.
When you select conditions, the software displays theinformation about the number of data files and spectrathat will be acquired and saved.
For more information, see “Spectrum Accumulation” onpage 5-35.
9. If you selected saving or accumulation conditions instep 8 that specify acceptance criteria, set SpectrumAcceptance Criteria as described in “Setting spectrumacceptance and laser adjustment criteria” onpage 6-42. Saving or accumulation conditions thatspecify acceptance criteria are:
• Save all spectra that pass acceptance criteria• Save first spectrum to pass acceptance criteria• Save best spectrum• Accumulate all spectra that pass acceptance
criteria
6-40 Applied Biosystems

Acquiring in Automatic Mode from the Instrument Control Panel
6
Sample positioning 10. Select Use Automated Sample Positioning.NOTE: To manually adjust sample positioning whenacquiring in Automatic Control mode, deselect UseAutomated Sample Positioning. For more information,see Section 4.5.2, Adjusting Laser Intensity andSelecting Sample Position.
11. If you enabled Use Automated Sample Positioning,select Random Search Pattern or Search pattern file,then select an .SP file.
For information on search pattern files, see Section6.6.4, Search Patterns.
NOTE: Before using search pattern files created inversion 4 software, convert to version 5 format.See Section 5.5, Converting Version 4 Methodsand Search Pattern Files.
Stop conditions 12. Select Stop Conditions if you want to stop theacquisition when a specified number of:
• Consecutive acquisitions fail acceptance criteria
• Laser adjustments within a search pattern positiondo not yield acceptable data when using manualsample positioning
For more information, see “Stop Conditions” onpage 5-38.
13. Click OK.
For more information on Automatic Control parameters,see Section 5.2.3, Automatic Control Dialog Box.
Voyager™ Biospectrometry™ Workstation User’s Guide 6-41

Chapter 6 Acquiring Spectra from the Instrument Control Panel
6
Setting spectrumacceptance andlaser adjustment
criteria
If you selected an accumulation condition that usesacceptance criteria (see step 9 on page 6-40):
1. In the Automatic Control dialog box (see Figure 6-15 onpage 6-38), click the Spectrum Acceptance Criteriabutton.
The Spectrum Acceptance Criteria dialog box(Figure 6-16) is displayed.
Figure 6-16 Spectrum Acceptance Criteria Dialog Box
2. Set Spectrum acceptance and Laser adjustment criteriaparameters as described in Table 6-3.
6-42 Applied Biosystems
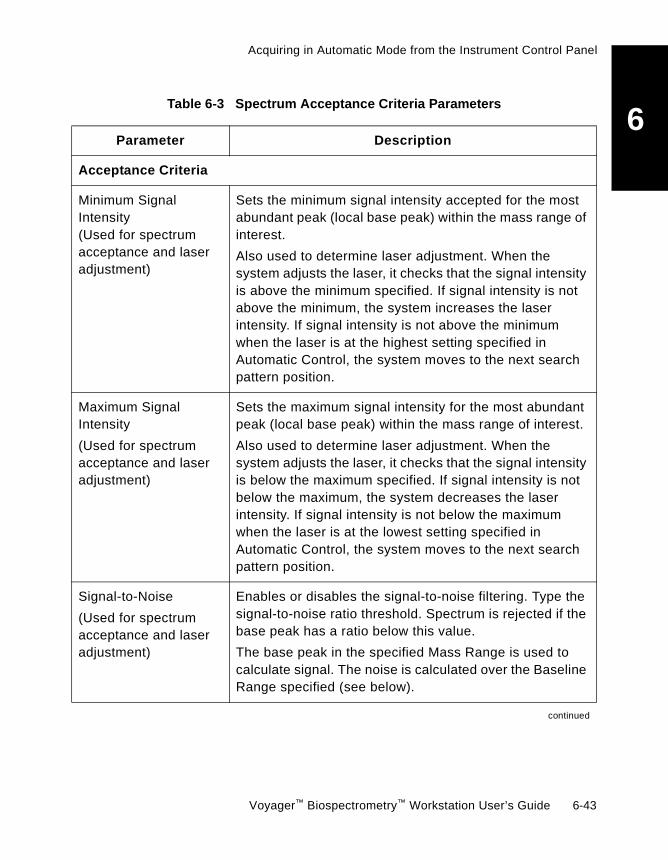
Acquiring in Automatic Mode from the Instrument Control Panel
6
Table 6-3 Spectrum Acceptance Criteria ParametersParameter Description
Acceptance Criteria
Minimum SignalIntensity(Used for spectrumacceptance and laseradjustment)
Sets the minimum signal intensity accepted for the mostabundant peak (local base peak) within the mass range ofinterest.
Also used to determine laser adjustment. When thesystem adjusts the laser, it checks that the signal intensityis above the minimum specified. If signal intensity is notabove the minimum, the system increases the laserintensity. If signal intensity is not above the minimumwhen the laser is at the highest setting specified inAutomatic Control, the system moves to the next searchpattern position.
Maximum SignalIntensity
(Used for spectrumacceptance and laseradjustment)
Sets the maximum signal intensity for the most abundantpeak (local base peak) within the mass range of interest.
Also used to determine laser adjustment. When thesystem adjusts the laser, it checks that the signal intensityis below the maximum specified. If signal intensity is notbelow the maximum, the system decreases the laserintensity. If signal intensity is not below the maximumwhen the laser is at the lowest setting specified inAutomatic Control, the system moves to the next searchpattern position.
Signal-to-Noise
(Used for spectrumacceptance and laseradjustment)
Enables or disables the signal-to-noise filtering. Type thesignal-to-noise ratio threshold. Spectrum is rejected if thebase peak has a ratio below this value.
The base peak in the specified Mass Range is used tocalculate signal. The noise is calculated over the BaselineRange specified (see below).
continued
Voyager™ Biospectrometry™ Workstation User’s Guide 6-43

Chapter 6 Acquiring Spectra from the Instrument Control Panel
6
3. Click OK to close the Spectrum Acceptance Criteriadialog box.
4. Click OK to close the Automatic Control dialog box.
Saving theinstrument
settings (.BIC) file
From the File menu in the Instrument Control Panel, selectSave Instrument Settings.
All instrument settings, including Automatic Control modesetting, Spectrum Acceptance Criteria, and Laser IntensityAdjustment Criteria are saved.
Signal-to-Noise
(Used for spectrumacceptance and laseradjustment)
(continued)
Also used to determine laser adjustment. When thesystem adjusts the laser, it checks that the signal-to-noiseratio is above the value entered. If it is not, the systemincreases the laser intensity. If signal-to-noise ratio is notabove the specified value when the laser is at the highestsetting specified in Automatic Control, the system movesto the next search pattern position.
Resolution Enables or disables the resolution filtering. Type theresolution threshold. Spectrum is rejected if the basepeak has a resolution below this value.
Resolution is measured at 50 percent of the most intensepeak in the specified mass range.
Criteria EvaluationMass Range
Specifies the mass range to evaluate.
Signal-to-NoiseBaseline Range
Mass range in which to calculate noise, if Signal-to-Noiseis enabled above.
Table 6-3 Spectrum Acceptance Criteria Parameters (Continued)
Parameter Description
6-44 Applied Biosystems

Acquiring in Automatic Mode from the Instrument Control Panel
6
6.6.3 Automatically Acquiring,Evaluating, and Saving Spectra
To automatically acquire a spectrum:
1. In the Instrument Control Panel, open or create aninstrument settings file with the appropriate parameters.See Section 6.6.2, Setting Instrument Settings forAutomatic Control Mode, for information.
2. Set Data Storage parameters as described in “SettingData Storage parameters” on page 6-14.
NOTE: You must specify a file name in the DataStorage control page before acquiring in AutomaticControl mode.
3. In the Manual Laser/Sample Positioning control page,select the Active Position to analyze.
4. To start acquiring, select Start Acquisition from theAcquisition menu, or click .
Duringacquisition
During acquisition:
• Laser is adjusted, sample position is adjusted, andSpectrum Acceptance Criteria are applied to each searchpattern position in a spectrum. For more information, see“Spectrum Accumulation” on page 5-35, andSection 6.6.6, Process that Occurs During Acquisition inAutomatic Mode.
• Each spectrum is saved or accumulated as determinedby the conditions selected in Spectrum Accumulation inthe Automatic Control dialog box. For more information,see, Section 5.2.4, Description of SpectrumAccumulation Options.
• Information about the acquisition is displayed in theAutomated Control tab of the Output window.
Voyager™ Biospectrometry™ Workstation User’s Guide 6-45

Chapter 6 Acquiring Spectra from the Instrument Control Panel
6
6.6.4 Search PatternsThis section describes:
• Search patterns• Search pattern (.SP) files• Units in search pattern files• Default search pattern file• Spiral search pattern file• Search pattern for custom plates
Search patterns A search pattern determines the path that the laser followswhen scanning the selected Active Position using AutomaticControl Mode. You have two options for search patterns:
• Random—The software randomly determines searchpattern positions as data is acquired (see page 5-37).
• Search pattern (.SP) file—The software analyzespositions that correspond to specific x,y coordinatesdefined in the .SP file. For more information, see “Searchpattern (.SP) files” below.
You specify the search pattern option in the Automatic ControlSettings of the Instrument Settings control page. SeeSection 5.2.3, Automatic Control Dialog Box, for moreinformation.
NOTE: Before using search pattern files created inversion 4 software, convert to version 5 format.See Section 5.5, Converting Version 4 Methodsand Search Pattern Files.
Search pattern(.SP) files
You can create customized search pattern files or use theDEFAULT.SP or SPIRAL.SP files provided (for 100-positionplates). For details, see “Creating and Editing .SP Files Usingthe Search Pattern Editor” on page 6-50.
6-46 Applied Biosystems

Acquiring in Automatic Mode from the Instrument Control Panel
6
A search pattern file is an ASCII text file that contains a list ofrelative X,Y position pairs with respect to the center of thecurrent sample position measured in microns, that representpoints in the sample position.On a 100-position plate, a sample position is 2,540 µm indiameter with the origin (0,0) at the center of the position. Thecenters of the sample positions are 5,080 µm apart.Figure 6-17 illustrates the location of different coordinates.
The system sequentially reads each entry in the searchpattern file as it analyzes a sample. The first entry in the file isthe first position analyzed, the second entry is the secondposition analyzed, and so on.
Figure 6-17 Location of Coordinates in a SamplePosition on a 100-Position Plate
Y
X0,0 1270,0–1270,0
0,1270
0,–1270
Voyager™ Biospectrometry™ Workstation User’s Guide 6-47
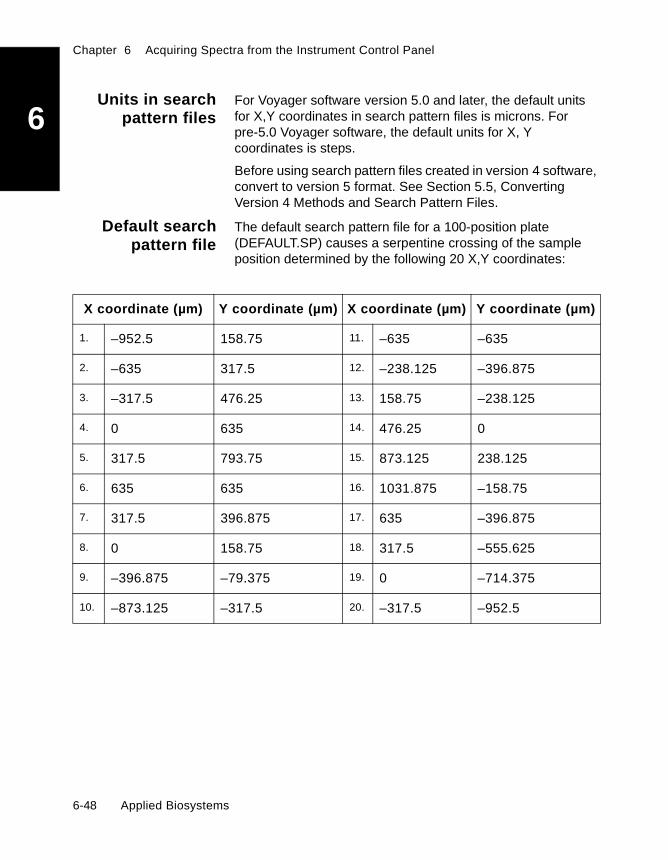
Chapter 6 Acquiring Spectra from the Instrument Control Panel
6
Units in searchpattern filesFor Voyager software version 5.0 and later, the default unitsfor X,Y coordinates in search pattern files is microns. Forpre-5.0 Voyager software, the default units for X, Ycoordinates is steps.
Before using search pattern files created in version 4 software,convert to version 5 format. See Section 5.5, ConvertingVersion 4 Methods and Search Pattern Files.
Default searchpattern file
The default search pattern file for a 100-position plate(DEFAULT.SP) causes a serpentine crossing of the sampleposition determined by the following 20 X,Y coordinates:
X coordinate (µm) Y coordinate (µm) X coordinate (µm) Y coordinate (µm)
1. –952.5 158.75 11. –635 –635
2. –635 317.5 12. –238.125 –396.875
3. –317.5 476.25 13. 158.75 –238.125
4. 0 635 14. 476.25 0
5. 317.5 793.75 15. 873.125 238.125
6. 635 635 16. 1031.875 –158.75
7. 317.5 396.875 17. 635 –396.875
8. 0 158.75 18. 317.5 –555.625
9. –396.875 –79.375 19. 0 –714.375
10. –873.125 –317.5 20. –317.5 –952.5
6-48 Applied Biosystems

Acquiring in Automatic Mode from the Instrument Control Panel
6
Spiral searchpattern fileThe SPIRAL.SP file provided is a 20-point search pattern thatbegins searching at the center of the sample position andspirals outward. This is the best search pattern for unevenmatrix crystals.
Search pattern forcustom plates
If you create a custom plate type for a plate withoutlaser-etched sample position or wells, with position diameterlarger or smaller than 2,540 microns, create an .SP file foranalysis of the plate. The DEFAULT.SP file is set to analyze2,540-micron diameter positions, corresponding to standardsample positions.
For more information, see “Guidelines for creating .SP files”on page 3-73.
Voyager™ Biospectrometry™ Workstation User’s Guide 6-49
Chapter 6 Acquiring Spectra from the Instrument Control Panel
6
6.6.5 Creating and Editing .SP FilesUsing the Search Pattern Editor
This section includes:
• Creating or editing an .SP file• Using the Search Pattern Generator• Drawing a search pattern• Setting x, y coordinates
Creating orediting an .SP file
To create or edit an .SP file:
1. In the Instrument Control Panel:
• Select Select Sample Plate from the SamplePlate menu.
• Select the Plate ID associated with the .PLT file forwhich you are creating the .SP file, then click OK.
2. From the Tools menu, select Search Pattern Editor.The Search Pattern Editor opens (Figure 6-18) displaying:
• Pathname of the .PLT file (selected in theInstrument Control Panel) in the title bar.
• Sample position area (size and shape defined bythe .PLT file).
• Coordinates of the cursor position.
6-50 Applied Biosystems

Acquiring in Automatic Mode from the Instrument Control Panel
6
Figure 6-18 Search Pattern Editor
3. If you are creating a new .SP file, skip to step 4.
If you are editing an .SP file, click Menu, select Open,then select an .SP file.
NOTE: Instead of clicking Menu, you can right-click todisplay the list of available commands.
4. Create or edit the search pattern in any of the followingways:
• Use the Search Pattern Generator toautomatically generate a search pattern. See“Using the Search Pattern Generator” onpage 6-52.
• Draw a new search pattern using the mouse. See“Drawing a search pattern” on page 6-56.
• Edit or add spots by setting x,y coordinates. See“Setting x, y coordinates” on page 6-57.
5. To add and store descriptive comments in the new .SPfile, click Menu, then select Properties. Type text thatdescribes or identifies this particular search pattern.
Title bar
Sample position area
Menu button displays
(size and shapedefined by .PLT)
Cursorcoordinates
.PLT name
Voyager™ Biospectrometry™ Workstation User’s Guide 6-51
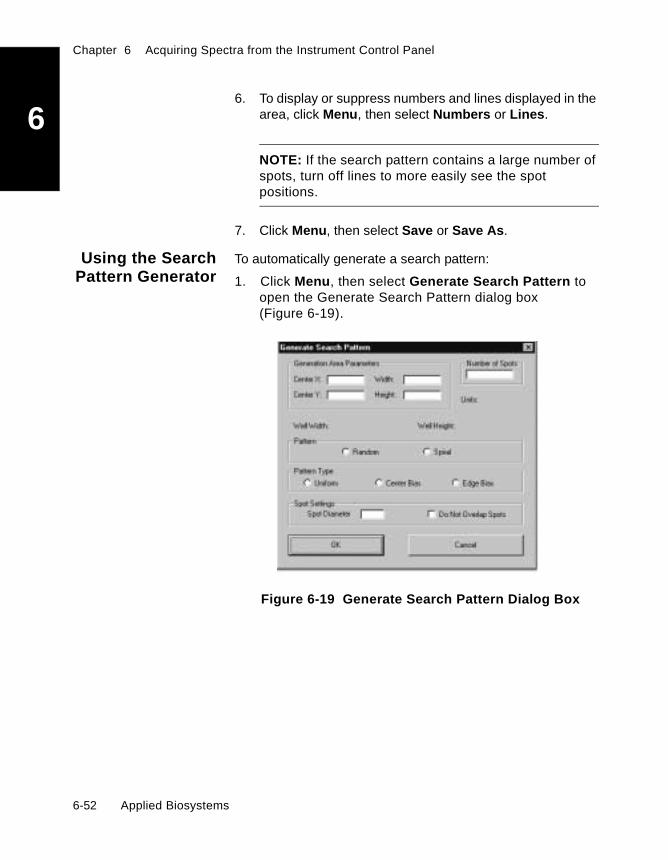
Chapter 6 Acquiring Spectra from the Instrument Control Panel
6
6. To display or suppress numbers and lines displayed in thearea, click Menu, then select Numbers or Lines.
NOTE: If the search pattern contains a large number ofspots, turn off lines to more easily see the spotpositions.
7. Click Menu, then select Save or Save As.
Using the SearchPattern Generator
To automatically generate a search pattern:
1. Click Menu, then select Generate Search Pattern toopen the Generate Search Pattern dialog box(Figure 6-19).
Figure 6-19 Generate Search Pattern Dialog Box
6-52 Applied Biosystems

Acquiring in Automatic Mode from the Instrument Control Panel
6
2. Enter the following parameters:Table 6-4 Search Pattern Generator Parameters
Parameter Description
Generation AreaParameters
Type values for the parameters that define the centercoordinate of the search pattern and the area in which thesearch pattern is generated (generation area):
• Center X and Center Y—Coordinates that define thecenter of the search pattern. The default values of 0 setthe center of the generation area to the center of thesample position area.
• Width and Height—Set the width and height of thegeneration area. If you are creating a new .SP file, unitsare in microns. If you are editing an .SP file, units arebased on the units in the existing .SP file. Defaultvalues are the width and height of the sample positionas defined in the .PLT file.
If you set Center X, Center Y, Width, and Height values sothat any part of the generation area falls outside the sampleposition area (defined in the .PLT file), an error message isdisplayed when you generate the pattern, and spots that falloutside the sample position area are not created (seeFigure 6-20).
NOTE: Center X,Y and generation area are not shown onthe screen.
continued
Voyager™ Biospectrometry™ Workstation User’s Guide 6-53
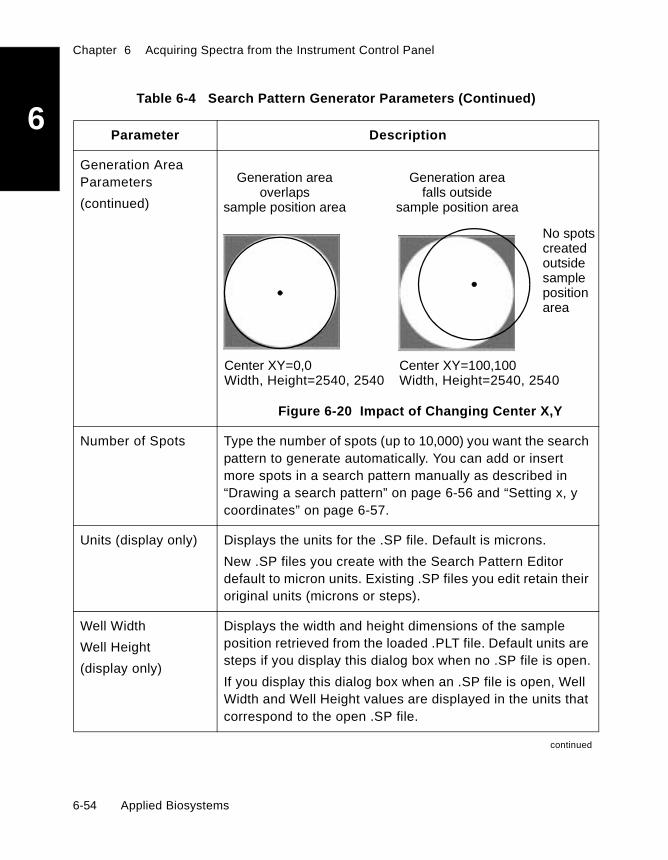
Chapter 6 Acquiring Spectra from the Instrument Control Panel
6
Generation AreaParameters(continued)
Figure 6-20 Impact of Changing Center X,Y
Number of Spots Type the number of spots (up to 10,000) you want the searchpattern to generate automatically. You can add or insertmore spots in a search pattern manually as described in“Drawing a search pattern” on page 6-56 and “Setting x, ycoordinates” on page 6-57.
Units (display only) Displays the units for the .SP file. Default is microns.
New .SP files you create with the Search Pattern Editordefault to micron units. Existing .SP files you edit retain theiroriginal units (microns or steps).
Well Width
Well Height
(display only)
Displays the width and height dimensions of the sampleposition retrieved from the loaded .PLT file. Default units aresteps if you display this dialog box when no .SP file is open.
If you display this dialog box when an .SP file is open, WellWidth and Well Height values are displayed in the units thatcorrespond to the open .SP file.
continued
Table 6-4 Search Pattern Generator Parameters (Continued)
Parameter Description
Center XY=0,0Width, Height=2540, 2540
Center XY=100,100Width, Height=2540, 2540
No spotscreatedoutsidesamplepositionarea
Generation areaoverlaps
sample position area
Generation areafalls outside
sample position area
6-54 Applied Biosystems

Acquiring in Automatic Mode from the Instrument Control Panel
6
3. Click OK. The search pattern spots are displayed in thesample position area.
4. Use the drawing tools to adjust and refine the searchpattern if necessary. For details, see “Drawing a searchpattern” on page 6-56.
Pattern Select a generation method:
• Random—Generates randomly placed spots within thegeneration area.
• Spiral—Generates spots within the generation areathat spiral out from the Center X, Y coordinatesspecified.
Pattern Type Select a distribution method:
• Uniform—Evenly distributes spots in the generationarea.
• Center Bias—Clusters spots around the center of thegeneration area.
• Edge Bias—Clusters spots around the edge of thegeneration area.
continued
Spot Settings Determines whether or not spots overlap:
• Spot Diameter—Defines the size of the spots. Defaultvalue is 50 microns (30 steps).
• Do Not Overlap Spots—When enabled, preventsspots from overlapping. If the Number of Spotsspecified of the size specified by the Laser SpotDiameter cannot fit in the generation area when thisoption is enabled, an error message is displayed whenyou generate the pattern, and only the spots that fit inthe generation area without overlapping are created.
Table 6-4 Search Pattern Generator Parameters (Continued)
Parameter Description
Voyager™ Biospectrometry™ Workstation User’s Guide 6-55

Chapter 6 Acquiring Spectra from the Instrument Control Panel
6
Drawing a searchpatternUse the drawing tools in the sample position area to add,insert, edit, or delete a spot.
When you select a drawing tool, it remains selected and activeuntil you select another tool or another menu item.
ToClick Menu,then select
Cursorchanges to
Then
Add a spot Add spot
Click on the sample position at thelocation where you want to add a spot.If you click and hold when you add, youcan adjust the position of the spotbefore it is added.
Insert a spot Insert spot Move the cursor to the location withinthe existing chain of spots where youwant to insert another spot, thenright-click.
Move a spot Edit spot Place the cursor on the spot you wantto move, then click and drag the spot toits new location within the sampleposition area.
Delete a spot Delete spot Right-click the mouse button on thespot you want to delete.
Delete allspots
Delete allspots
______ All spots are deleted.
6-56 Applied Biosystems

Acquiring in Automatic Mode from the Instrument Control Panel
6
Setting x, ycoordinatesTo set x, y coordinates for a spot:
1. Click Menu, then select X,Y. The Set X,Y dialog box isdisplayed (Figure 6-21).
Figure 6-21 Set X,Y Dialog Box
The x,y values displayed correspond to the location ofthe cursor in the sample position area when you selectthe X,Y command, not to the spot number displayed inthe Spot field.
2. In the Spot field, type a number:
• If you type a spot number that exists, the spot isedited.
• If you type a new spot number, the spot is added.
3. Type x and y coordinates for the spot.
Valid x and y coordinate values correspond toapproximately one-half the dimensions of the sampleposition of the currently loaded or selected plate. Forexample, the maximum x or y value for a 2540H by2540W sample position is approximately ±1270.
4. Click OK.
Voyager™ Biospectrometry™ Workstation User’s Guide 6-57

Chapter 6 Acquiring Spectra from the Instrument Control Panel
6
6.6.6 Process that Occurs DuringAcquisition in Automatic Mode
NOTE: This process occurs when you acquire using a .BICfile that has Use Automated Laser Intensity Adjustmentenabled.
Checking diskspace
Before starting a run that uses automated data evaluation(described on “Setting spectrum acceptance and laseradjustment criteria” on page 6-42), the system checks that atleast 100 MB of disk space is available.
NOTE: If the run requires more than 100 MB for data filestorage, a message is displayed during the run when freedisk space is no longer available.
Prescan mode Prescan mode allows the system to determine the appropriatelaser setting for a sample position before acquiring spectra.This feature minimizes sample loss. Prescan mode does notconsider signal-to-noise ratio or resolution when determininglaser setting.
You can select one of the following Prescan mode choices:
• At First Search Pattern Position Only• At Each Search Pattern Position
NOTE: If Prescan is not selected, the system operates inAcquisition mode. See “Acquisition mode” on page 6-61.
Shots/Spectrum inPrescan mode
Each time the system begins acquiring in Prescan mode, itacquires five Shots/Spectrum, or the number ofShots/Spectrum specified in the Instrument Settings controlpage, if less than five.
6-58 Applied Biosystems

Acquiring in Automatic Mode from the Instrument Control Panel
6
During Prescan In Prescan mode, the system does the following:1. The system sets the laser to the maximum settingspecified in the Automatic Control dialog box andacquires a spectrum (see “Shots/Spectrum in Prescanmode” on page 6-58) at the first point specified in thesearch pattern.
If the signal intensity is:
• Too low (lower than the minimum signal intensityset in the Spectrum Acceptance Criteria dialogbox) with the laser at maximum—The systemmoves to the next position specified in the searchpattern and acquires again.
• Too high (higher than the maximum signalintensity set in the Spectrum Acceptance Criteriadialog box) with the laser at maximum—Thesystem continues with step 2.
• Within range—The system begins acquiring inAcquisition mode. See “Acquisition mode” onpage 6-61.
NOTE: If Use Automated Sample Positioning isdisabled, the system always uses the center of thesample position.
NOTE: If no minimum or maximum signal intensitycriteria is specified, the laser is not adjusted. Themid-range laser setting specified in the AutomaticControl dialog box is used.
Voyager™ Biospectrometry™ Workstation User’s Guide 6-59

Chapter 6 Acquiring Spectra from the Instrument Control Panel
6
2. The system sets the laser to the minimum settingspecified in the Automatic Control dialog box andacquires a spectrum (see “Shots/Spectrum in Prescanmode” on page 6-58).
If the signal intensity is:
• Too low with the laser at minimum—The systemcontinues with step 3.
• Too high with the laser at minimum—Thesystem begins acquiring in Acquisition mode.
• Within range—The system begins acquiring inAcquisition mode.
3. The system sets the laser halfway between the minimumand maximum and acquires a spectrum (see“Shots/Spectrum in Prescan mode” on page 6-58).
For the first spectrum, minimum and maximum lasersettings are taken from the Automatic Control dialogbox.
For subsequent spectra, minimum and maximum lasersettings are determined as described below:
• If the signal is too low, the current setting is usedas the new minimum setting.
• If the signal is too high, the current setting is usedas the new maximum setting.
4. The system repeats step 3 until either:
• The signal falls between the specified maximumand minimum values.
• The difference between the maximum andminimum laser intensity in step 3 is smaller than2 times the laser step size specified in theAutomatic Control dialog box.
6-60 Applied Biosystems

Acquiring in Automatic Mode from the Instrument Control Panel
6
Acquisition mode Acquisition mode starts after Prescan mode determines thelaser setting, or immediately if Prescan mode is disabled.
NOTE: Each time the system begins acquiring inAcquisition mode, it acquires the number ofShots/Spectrum specified in the Instrument Settings controlpage.
In Acquisition mode, the system does the following:
1. The system sets the laser to one of the following andacquires spectra:
• If Prescan At First Search Pattern PositionOnly is enabled—Uses the laser setting andsearch pattern position determined in “Prescanmode” on page 6-58 and acquires spectra.
• If Prescan At Each Search Pattern Position isenabled—Uses the laser setting and searchpattern position determined in “Prescan mode” onpage 6-58 and acquires spectra.
• If Prescan mode is not enabled—Sets the laserhalfway between the minimum and maximumspecified in the Automatic Control Settings dialogbox. Starts acquiring data at the first positionspecified in the search pattern.
If the signal intensity is:
• Too high—The system decreases the lasersetting one laser step as specified in AutomaticControl dialog box, and acquires a new spectrum.
• Too low—The system increases the laser settingone laser step as specified in Automatic Controldialog box, and acquires a new spectrum.
Voyager™ Biospectrometry™ Workstation User’s Guide 6-61
Chapter 6 Acquiring Spectra from the Instrument Control Panel
6
NOTE: If no minimum or maximum signal intensitycriteria is specified, the laser is not adjusted. Themid-range laser setting specified in the AutomaticControl dialog box is used.• Within range—The system saves the data file ifSignal-to-Noise is not enabled, or continues withstep 2 if Signal-to-Noise is enabled.
2. If Signal-to-Noise is enabled in the Spectrum AcceptanceCriteria dialog box, the system evaluates thesignal-to-noise ratio for each spectrum.
If the signal-to-noise ratio is:
• Equal to or greater than the ratio set in theSpectrum Acceptance Criteria dialog box—Thesystem checks resolution as described in step 3, ifit is enabled. If resolution is not enabled, thesystem saves the data file.
• Less than the ratio set in the SpectrumAcceptance Criteria dialog box—The systemincreases the laser setting one laser step asspecified in instrument settings, and acquires anew spectrum.
3. If Resolution is enabled in the Spectrum AcceptanceCriteria dialog box, the system evaluates the resolution foreach spectrum.
If the resolution is:
• Equal to or greater than the resolution set inthe Spectrum Acceptance Criteria dialog box—The system saves the data file.
• Less than the resolution set in the SpectrumAcceptance Criteria dialog box—The systemacquires a new spectrum.
6-62 Applied Biosystems

Acquiring in Automatic Mode from the Instrument Control Panel
6
4. If Save All or Accumulate All is selected for accumulation,the system moves to the next search pattern position.
For all other accumulation conditions, the systemrepeats step 1 through step 3 until one of the followingis true:
• Acceptance criteria selected are met (the signal isin range, the minimum Signal-to-Noise ratio andresolution are achieved).
• The specified Number of Spectra to Acquire areacquired.
• The difference between the maximum andminimum laser intensity is smaller than the laserstep size specified in Automatic Control dialogbox, and the laser can no longer be adjusted.
• Any stop conditions are met.
• The end of the search pattern file is reached.
NOTE: If the number of positions in the searchpattern file is lower than the specified number ofspectra to acquire, acquisition stops before thetotal number of spectra specified are acquired. Forexample, if you specify 5 spectra to acquire, butthe search pattern file specifies 4 positions,acquisition stops after the fourth position issampled, even if 5 spectra have not yet beenacquired.
Voyager™ Biospectrometry™ Workstation User’s Guide 6-63

Chapter 6 Acquiring Spectra from the Instrument Control Panel
6
5. The system saves data files based on the SpectrumAccumulation conditions selected. Acceptance criteriamust be met for all collection modes except Save All andAccumulate All. See Section 5.2.4, Description ofSpectrum Accumulation Options, for a description of thefiles saved in each Spectrum Accumulation condition.
6. If an accumulation condition that uses Acceptance Criteriais selected, and Acceptance Criteria are met, the systembegins a new acquisition from the current searchpattern position.
If Acceptance Criteria are not met, if an accumulationcondition that does not use Acceptance Criteria isselected, or if the laser can no longer be adjusted, thesystem begins a new acquisition from the next searchpattern position, depending on the SpectrumAccumulation conditions and Spectrum AcceptanceCriteria. Acceptance criteria are defined in “Settingspectrum acceptance and laser adjustment criteria” onpage 6-42.
• If collection mode is set to Save First Passing andan acceptable spectrum is collected, the systemsaves the data file, and the run is complete.
• If acceptance criteria are not met, or collectionmode is set to Save All, Save All Passing, or SaveBest, the acquisition sequence is repeated at thenext position specified in the random searchpattern or the search pattern file.
7. If the system moves across an entire sample position anddoes not find an acceptable signal, it:
• Logs the error in the Automatic Control tab in theOutput window of the Instrument Control Panel.
• Does not create a data file.
6-64 Applied Biosystems

Acquiring in Automatic Mode from the Instrument Control Panel
6
6.6.7 Process that Occurswhen Accumulating Spectra fromMultiple Search Pattern Positions
NOTE: These processes occur when you acquire using a.BIC file that has Use Automated Sample Positioningenabled.
You can obtain a single spectrum from multiple positionswithin a single sample position by specifying a search pattern.To do so, enable the Automatic Control mode in InstrumentSettings control page and select one of the SpectrumAccumulation conditions described below.
For information on the Automatic Laser/SamplePositioning/Spectrum Accumulation function, see:
• Section 5.2.3, Automatic Control Dialog Box
• Section 6.6, Acquiring in Automatic Mode from theInstrument Control Panel
For a description of a search pattern file, see Section 6.6.4,Search Patterns.
Two options are available for accumulating spectra frommultiple search pattern positions:
• Accumulate all—Averages the acquired spectraregardless of their quality. A single spectrum is created.See Section 5.2.3, Automatic Control Dialog Box, formore information.
• Accumulate all passing—Evaluates the acquiredspectra against the Acceptance Criteria specified, thenaverages only passing spectra. See Section 5.2.3,Automatic Control Dialog Box, for more information.
NOTE: If no Acceptance Criteria are specified, allspectra are averaged.
Voyager™ Biospectrometry™ Workstation User’s Guide 6-65

Chapter 6 Acquiring Spectra from the Instrument Control Panel
6
6.6.7.1 Process that Occurs whenAccumulating All Spectra
When accumulating all spectra (Accumulation mode isdetermined by the Spectrum Accumulation conditionsdescribed in Section 5.2.3, Automatic Control Dialog Box), thesystem does the following during acquisition:
1. Sets the laser intensity as described in Section 6.6.6,Process that Occurs During Acquisition in AutomaticMode.
2. Starts firing the laser.
3. Acquires the specified number of Shots/Spectrum at thefirst search pattern position.
4. Stops firing the laser.
5. Holds the data in memory, and averages current data withprevious data.
6. Moves to the next search pattern position.
7. Repeats step 2 through step 6 in subsequent searchpattern positions until any of the following is true:
• Number of spectra to acquire that you select in theAutomatic Control settings is reached
• All search pattern positions have been scanned
• Stop conditions are met
8. Saves the averaged spectrum to disk in the directorydesignated in the Data Storage control page, described onpage 6-14.
6-66 Applied Biosystems

Acquiring in Automatic Mode from the Instrument Control Panel
6
6.6.7.2 Process that Occurs whenAccumulating Passing Spectra
When accumulating only the spectra that meet theAcceptance Criteria (Accumulation mode is determined by theSpectrum Accumulation conditions described in Section 5.2.3,Automatic Control Dialog Box), the system does the followingduring acquisition:
1. Sets the laser intensity as described in Section 6.6.6,Process that Occurs During Acquisition in AutomaticMode.
2. Starts firing the laser.
3. Acquires the number of Shots/Spectrum at the first searchpattern position.
4. Stops firing the laser.
5. Evaluates the data against the Acceptance Criteria inSection 5.2.3, Automatic Control Dialog Box.
6. If the data meets the Acceptance Criteria, holds the datain memory and averages current data with previous data.If it fails, the system displays an error message in theOutput window describing which spectrum failed, andwhich acceptance criteria specified have failed. The datais discarded.
7. If the data meets the Acceptance Criteria, stays on thesame search pattern position.
If the data fails the Acceptance Criteria, moves to thenext search pattern position.
Voyager™ Biospectrometry™ Workstation User’s Guide 6-67

Chapter 6 Acquiring Spectra from the Instrument Control Panel
6
8. Repeats step 2 through step 7 in subsequent searchpattern positions until any of the following is true:
• Number of spectra to acquire that you select in theAutomatic Control dialog box is reached
• All search pattern positions have been scanned
• Stop conditions are met
9. Saves the averaged spectrum to disk in the directorydesignated in the Data Storage control page, described in“Setting Data Storage parameters” on page 6-14.
6-68 Applied Biosystems

7Chapter
7 Acquiring Spectrafrom the SequenceControl Panel
This chapter contains the following sections:
7.1 Overview ......................................................... 7-2
7.2 Understanding Settings, Macros, andCalibration ....................................................... 7-3
7.3 Before Creating a Sequence............................ 7-7
7.4 Creating a Sequence ..................................... 7-13
7.5 Preparing to Run a Sequence ........................ 7-24
7.6 Running a Sequence ..................................... 7-25
7.7 Automatic Calibration During aSequence Run ............................................... 7-32
7.8 Customizing the Sequence Control Panel ...... 7-43
Voyager™ Biospectrometry™ Workstation User’s Guide 7-1

Chapter 7 Acquiring Spectra from the Sequence Control Panel
7
7.1 Overview
The Voyager Sequence Control Panel (Figure 7-1) allows:
• Acquisition of multiple samples using different instrumentsettings (.BIC) files
• Selection of macros for advanced processing to applybefore or after calibration. You can use the macrossupplied or create your own in the Data Explorersoftware.
• External, internal, and internal-update calibration options,described in Section 7.7, Automatic CalibrationDuring a Sequence Run.
Before you begin Before you begin, read:
• “Starting Sequence Control Panel” on page 2-33
• Section 4.6, Sequence Control Panel
• Section 4.7, How the Instrument and SequenceControl Panels Interact
Figure 7-1 Sequence Control Panel
7-2 Applied Biosystems

Understanding Settings, Macros, and Calibration
7
7.2 Understanding Settings,Macros, and Calibration
This section includes:
• Types of files and calibration you specify in the SequenceControl Panel
• How files and calibration you specify affect the dataduring a sequence run
Types of files andcalibration
You select the following types of files and the Calibration Typein the Sequence Control Panel to specify how data isdetected, calibrated, and processed:
File Type Description For information see
DataExplorer.SET
Contains peak detection parameters,monoisotopic peak filtering, and thereference masses needed for Internalor Internal-update calibration. Optionalif you are not calibrating, or areperforming External calibration.
• “Creating ProcessingSettings (.SET) Files” onpage 7-12
• “Data Explorer .SET File”on page 7-17
Macro Optional selections that allow you tospecify processing before and aftercalibration.
• “Creating Macros” onpage 7-8
• “Pre-Macro” onpage 7-17
• “Post-Macro” onpage 7-20
CalibrationType
Specifies External, Internal, orInternal-Update calibration.
“Internal/External Calibration”on page 7-18
Continued
Voyager™ Biospectrometry™ Workstation User’s Guide 7-3

Chapter 7 Acquiring Spectra from the Sequence Control Panel
7
.CAL Contain calibration constants usedaccording to specifiedCalibration Type:
• External calibration—Constantsare applied and saved in a .DATfile.*
• Internal calibration (.CALoptional)—If a .CAL file isspecified (and it exists), constantsare applied to the .DAT file*before the reference masses inthe .SET file are matched. Newcalibration constants aregenerated using the referencemasses specified in the .SET file,and applied to the data. Constantsare then updated within the .DATfile after calibration.
• Internal-Update calibration—If a.CAL file is specified (and itexists), constants are applied tothe .DAT file* before the referencemasses in the .SET file arematched. New calibrationconstants are generated using thereference masses specified in the.SET file, and applied to the data.Constants are then updated withinthe .DAT file after calibration. Thespecified .CAL file is updated orcreated and contains newcalibration constants aftercalibration.
• “Creating Calibration(.CAL) Files” onpage 7-11
• “Calibration File” onpage 7-19
* NOTE: If the .DAT file contains multiple spectra generated using the Save All or the Save All Passingoption in Automatic Control, the .CAL file is applied to all spectra in the .DAT file.
File Type Description For information see
7-4 Applied Biosystems

Understanding Settings, Macros, and Calibration
7
How file typesand calibration
you specify affectthe data
Figure 7-2 and Figure 7-3 illustrate how the type of calibrationand the files you specify affect the data that is acquired in asequence run.
Figure 7-2 How Settings, Macros, and Calibration Are Applied During aSequence Run—Part 1
NoCalibration
Data
External
.DAT file* with:
Calibration
DataCalibration constantssettings from .CAL
.DAT file with:Peak detectionsettings from .SET
Prem
acro
optio
nal
Internal .DAT file* with:Calibration
Data
.SETpeak
detection
Peak detectionsettings from .SET
Calibration constantsgenerated after.SET
referencemasses
then calibration withreference masses in.SET
•
•
•
calibration constantsfrom .CAL applied,
Post m
acro
optio
nal
Prem
acro
optio
nal
.CAL
optio
nal
Post m
acro
optio
nal
Acquisition calibrationspecified in .BIC
•
•
.CALcalibrationconstants
Autocal
.SET
optio
nal
or defaults if no .SET
.SET
optio
nal
Peak detectionsettings from .SET
•
or defaults if no .SET
* NOTE: If the .DAT file contains multiple spectra generated using the Save All or the Save All Passingoption in Automatic Control, the .CAL file is applied to all spectra in the .DAT file.
If you specify this These .SET, .CAL, and macrosare applied (if specified)
And a data fileCalibration Type:
in the order shown:is created with:
.CAL
from
.BIC
(ifpr
esen
t)
.CAL
from
.BIC
(ifpr
esen
t)
.CAL
from
.BIC
(ifpr
esen
t)
Voyager™ Biospectrometry™ Workstation User’s Guide 7-5
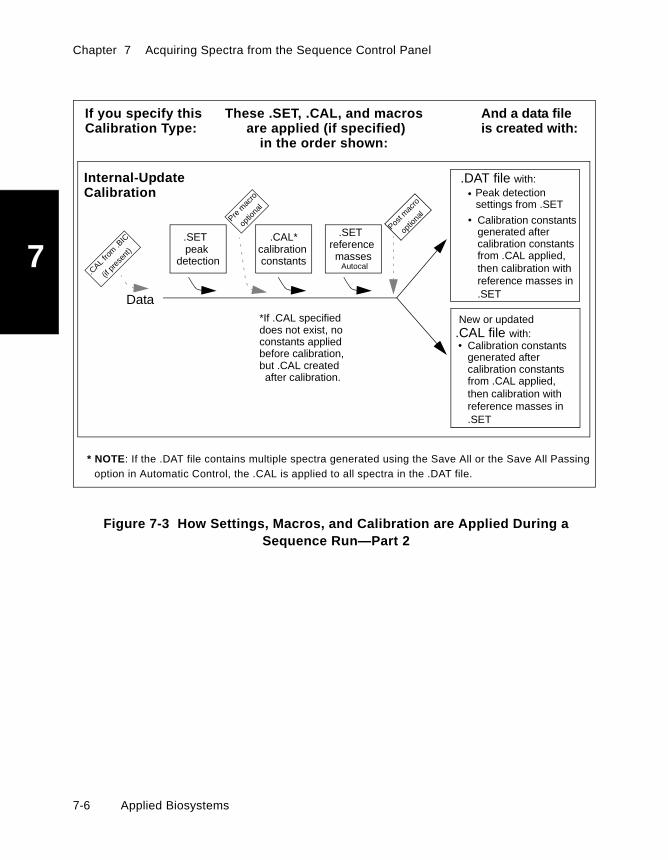
Chapter 7 Acquiring Spectra from the Sequence Control Panel
7
Figure 7-3 How Settings, Macros, and Calibration are Applied During aSequence Run—Part 2
Internal-Update .DAT file with:Calibration
Data
.SETpeak
detection
Peak detectionsettings from .SET
Calibration constantsgenerated after
then calibration withreference masses in.SET
•
•
calibration constantsfrom .CAL applied,
Prem
acro
optio
nal
.CAL file with:Calibration constantsgenerated after
then calibration withreference masses in.SET
•
calibration constantsfrom .CAL applied,
.CAL*calibrationconstants
*If .CAL specifieddoes not exist, noconstants appliedbefore calibration,but .CAL createdafter calibration.
.SETreferencemasses
Post m
acro
optio
nal
Autocal
* NOTE: If the .DAT file contains multiple spectra generated using the Save All or the Save All Passingoption in Automatic Control, the .CAL is applied to all spectra in the .DAT file.
If you specify this These .SET, .CAL, and macrosare applied (if specified)
And a data fileCalibration Type:
in the order shown:is created with:
New or updated
.CAL
from
.BIC
(ifpr
esen
t)
7-6 Applied Biosystems

Before Creating a Sequence
7
7.3 Before Creating a Sequence
This section describes:
• Optimizing instrument settings (.BIC) files for asequence run
• Creating macros
• Creating calibration (.CAL) files
• Creating settings (.SET) files
7.3.1 Optimizing Instrument Settings (.BIC)Files for a Sequence Run
Select .BIC files based on the compound type and mass rangeyou are analyzing. See Section 5.1.2, Standard InstrumentSettings (.BIC) Files Provided.
You can use more than one .BIC file in your sequence run ifyou are analyzing a wide mass range, for example, whenanalyzing a mixture of protein and peptide samples. As ageneral guideline, you may need separate .BIC files fordifferent mass ranges, for example:
• 1,000 to 6,000 Da• 5,000 to 12,000 Da• 10,000 to 30,000 Da
Voyager™ Biospectrometry™ Workstation User’s Guide 7-7

Chapter 7 Acquiring Spectra from the Sequence Control Panel
7
.BIC requirements Optimize the instrument settings for Automatic Control mode.All .BIC files used in the Sequence Control Panel mustspecify:
• Automatic Control mode
• Linear or reflector Operation mode (PSD mode is notallowed)
• The same laser type (internal or external). You can notswitch between internal and external lasers whenrunning a sequence.
For more information see Section 6.6.2, Setting InstrumentSettings for Automatic Control Mode.
Note the following:
• If Use Automated Laser Intensity Adjustment is disabledin the .BIC file, the laser intensity is not automaticallyadjusted. Instead, the intensity set in the InstrumentControl Panel is used for the analysis. You can manuallyadjust the laser intensity by pressing Ctrl+PageUp orCtrl+PageDn.
• If Use Automated Sample Positioning is disabled in the.BIC file, the sample does not automatically move and theanalysis is performed on the center of the sample positionunless you manually adjust the position using the controlstick.
7.3.2 Creating Macros
You can specify macros that execute before and aftercalibration. You can use the macros supplied with the systemor create your own.
For information on using the Visual Basic Editor, refer to theonline help available within the Visual Basic Editor.
7-8 Applied Biosystems
Before Creating a Sequence
7
Creating a macro To create a macro for the Sequence Control Panel:
1. Open the Data Explorer software.
2. Create a macro as described in the Data ExplorerSoftware User’s Guide, Section 6.7.2, Recording aMacro.
NOTE: If you create a macro to apply a SET file, thereare two variables you can use:RestorePreferences2, which applies eitherprocessing or graphic settings (syntax:ActiveDocument.RestorePreferences2 "path and nameof SET file", deProcessingSettings (ordeGraphicsSettings).RestorePreferences, which applies both processingand graphic settings (syntax:ActiveDocument.RestorePreferences2 "path and nameof SET file".If you use RestorePreferences, make sure the SET fileyou apply contains both processing and graphicsettings. If it does not, the system applies defaultgraphic settings (black background with yellow traces)when the macro runs.
3. If desired, assign the macro to a button as described inthe Data Explorer Software User’s Guide,Section 6.7.3, Assigning Macros to Buttons.
The button number to which you assign the macro isthe number that you select in the Sequence ControlPanel.
NOTE: Assigning a macro to a button is not required.You can select a macro by name or number in thesample list.
Voyager™ Biospectrometry™ Workstation User’s Guide 7-9

Chapter 7 Acquiring Spectra from the Sequence Control Panel
7
Selecting a macroin a sequence
NOTE: Do not select in the Sequence Control Panelmacros that require user action (macros in which you mustenter or select values, then click OK to execute). If youselect macros that require user action, the sequence stopswhen the macro is activated by the Sequence ControlPanel, and waits for you to enter values and click OK.
To select a macro in the sample list:
1. Create a sequence as described in Section 7.4,Creating a Sequence.
2. In the macro field for each row, select a macro by doingeither of the following:
• Click the field and select the macro name from thelist. All macros and scripts you have created in theData Explorer software are listed.
• Type the button number to which you assigned themacro.
Hint: To determine the macro assigned to the buttonnumber, display the Data Explorer software. Place thecursor over the macro button to display the macroname. Macro buttons are numbered sequentially fromleft to right. If the Macro toolbar is not displayed in theData Explorer software, select Toolbar from the Viewmenu, select Macros, then click Close.
3. Save the sequence file by selecting Save Sequence fromthe File menu.
RecommendedPre-Macro
To ensure that the correct peak is identified as themonoisotopic peak before peak matching/calibration, create amacro that performs peak deisotoping. Specify this macro inthe Pre-Macro column in the Sequence. For more information,see the Data Explorer Software User’s Guide, Section 3.4,Deisotoping a Spectrum.
7-10 Applied Biosystems

Before Creating a Sequence
7
Macros formultispectrum
data files
To perform processing on data files that contain multipleVoyager spectra, you must create advanced macros.Figure 7-4 is an example macro that deisotopes and prints allspectra in a multispectrum Voyager data file. Standard macroscreated with the macro recorder process only the firstspectrum in a data file.
Figure 7-4 Example Macro to Deisotope and Print aData File Containing Multiple Voyager Spectra
7.3.3 Creating Calibration (.CAL) Files
Create calibration (.CAL) files in the Data Explorer software ifyou plan to specify calibration in the Sequence Control Panel:
• External calibration—.CAL file required.
• Internal calibration—.CAL file optional.
• Internal-Update calibration—.CAL file name required,but .CAL file does not have to exist. If the specified .CALfile exists, constants are applied before the referencemasses in the .SET file are matched. If the specified.CAL file does not exist, no constants are applied. Newcalibration constants are generated using the referencemasses specified in the .SET file and applied to thedata file. Constants are updated within the .DAT file.The specified .CAL file is updated or created andcontains new calibration constants after calibration.
For information, see the Data Explorer Software User’sGuide, Section 5.3.2, Manually Calibrating.
Sub MultiSpecProcessing()
Dim NumSpectra As Long
NumSpectra = ActiveDocument.SpecView.TotalSpectrumDim J As LongFor J = 1 To NumSpectra
ActiveDocument.SpecView.ActiveSpectrum = J
Insert ActiveDocument.SpecSetup.DeisotopeAdductFormula = "H"
ActiveDocument.SpecSetup.DeisotopeBaseFormula = "C6H5NO"
ActiveDocument.SpecView.DeisotopeSpectrum
ActiveDocument.SpecView.PrintTraceNext J
End Sub
processingper spectrum
here
Voyager™ Biospectrometry™ Workstation User’s Guide 7-11

Chapter 7 Acquiring Spectra from the Sequence Control Panel
7
7.3.4 CreatingProcessing Settings (.SET) Files
Overview Create processing settings (.SET) files in the Data Explorersoftware if you plan to specify Internal or Internal-Updatecalibration, or if you want peak detection settings other thandefault settings stored with the data file.
The .SET file can also apply monoisotopic peak filtering.
NOTE: If you do not specify a Pre-Macro that performspeak deisotoping, or you do not set monoisotopic peakfiltering, set the Mass Tolerance for Reference Matching inAutocalibration settings narrow enough to ensure that themonoisotopic peak is correctly identified before calibration.
Processingsettings only
When you create the .SET file, save processing settings only.Graphic settings are not applied in the Sequence ControlPanel, even if they are present in the .SET file.
For moreinformation
For more information on .SET files, see the Data ExplorerSoftware User’s Guide:
• Section 1.4.2, Customizing Processingand Graphic Settings (.SET)
• Section 3.2.3, Setting Peak Detection Parameters
• Section 3.3.4, Sorting, Filtering, and Printing the PeakList
• Section 5.4.2, Importing and SpecifyingAutomatic Calibration Settings
7-12 Applied Biosystems

Creating a Sequence
7
7.4 Creating a Sequence
This section includes:
• Setting General Sequence parameters• Creating a run list
Parts of asequence
A sequence includes:
• General sequence parameters—Apply to all entries inthe run list, described in Section 7.4.1, Setting GeneralSequence Parameters.
• Run list parameters—Apply to individual entries in therun list, described in Section 7.4.2, Creating a Run List.
7.4.1 Setting General Sequence Parameters
Set parameters as needed:
1. From the View menu, select General SequenceParameters.
The General Sequence Parameters dialog box isdisplayed (Figure 7-5).
Figure 7-5 General Sequence Parameters Dialog Box
Voyager™ Biospectrometry™ Workstation User’s Guide 7-13

Chapter 7 Acquiring Spectra from the Sequence Control Panel
7
2. Type or select the Directory name in which to store thedata files.
3. Enter text as needed for Author and Comments. Thisinformation is stored with the sequence (.SEQ) file.
4. Specify the Run Log file name (the default name is takenfrom the sequence name). If you want to store the run login a directory other that the Directory specified above,click and select a directory for the file.
The run log file contains the list of lines from the run listthat were executed during the sequence, and anyerrors that occurred. If a line in the run list generatedmore than one data file, the log lines are duplicated andfile names are incremented accordingly.
5. Click OK.
7.4.2 Creating a Run List
This section includes:
• Sample order in the run list• Creating a run list• Modifying and customizing the run list• Filling down the sample position• Importing and exporting the run list
Sample order inthe run list
The type of calibration you perform may require a specificsample order in the run list:
• Internal or external calibration—List samples in anyorder.
• Close external calibration (internal-update)—Listsamples and standards as described in Section 7.7.3,Performing Close External Calibration.
7-14 Applied Biosystems

Creating a Sequence
7
Creating a run list To create a new run list:
1. Select New Sequence from the File menu.
A new sequence run list grid opens (Figure 7-6).
Figure 7-6 Sequence Run List
Hint: You can show and hide columns by selecting acolumn, then selecting Show/Hide from theView menu.
2. Click the scroll bar at the bottom of the grid to displaycolumns in the grid that are not in view.
3. Click a cell to activate it, then enter Run List parametersas described in Table 7-1.
You can also import parameters into the run list. Seepage 7-22.
Run list
Voyager™ Biospectrometry™ Workstation User’s Guide 7-15

Chapter 7 Acquiring Spectra from the Sequence Control Panel
7
Table 7-1 Run List Parameters
Field Description
Sample Position
(required entry)
Position from which to acquire data.
Data File
(required entry)
Base name of the data file to acquire. During acquisition, thesoftware appends to the base name a 4-digit suffix starting at0001. For example, if you specify a base name of SAMPLE, thefinal data file name is SAMPLE_0001.DAT.
By default, the position name/number is also appended andprecedes the 4-digit suffix. For example, if you specify a basename of SAMPLE, the final data file name isSAMPLE_A1_0001.DAT for the data file acquired fromposition A1. To suppress the position name/number in the filename, deselect Append Sample Position to File Name inPreferences (described on page 7-45).
InstrumentSettings File
(required entry)
.BIC file to use for the current row. Click the down arrow andselect an instrument settings (.BIC) file that you have optimizedfor Automatic Control mode. For more information, seeSection 6.6.2, Setting Instrument Settings for Automatic ControlMode.
NOTE: If you are editing a .BIC file, save it before selecting it inthe Sequence Control Panel. If you make changes to the .BIC fileafter you select it in the Sequence Control Panel, the SequenceControl Panel does not recognize the changes.
NOTE: All .BIC files specified in a sequence must specify eitherthe internal laser or the external laser. You cannot switchbetween internal and external lasers when running a sequence.If you specify an internal laser .BIC file, then specify an externallaser .BIC, the second .BIC is flagged as invalid when you try torun the sequence.
continued
7-16 Applied Biosystems

Creating a Sequence
7
Data Explorer.SET File
(required entryfor Internal andInternal-Updatecalibration)
.SET file to use to detect peaks, apply monoisotopic peakfiltering (if specified), and calibrate (if specified) the data fileacquired in the row. The .SET file contains peak detectionparameters and the reference masses needed for calibration.Click the down arrow and select a .SET file.
If you do not specify a .SET file for rows that specify External orno calibration, the peak detection settings from the default .SETfile (VOYAGERLINEAR.SET or VOYAGERREFLECTOR.SET)are stored in the data file.
For information, see:
• Section 7.2, Understanding Settings, Macros, andCalibration
• “Creating Processing Settings (.SET) Files” on page 7-12
Pre-Macro Macro to execute before calibration. Select a macro by doingeither of the following:
• Click the field and select the macro name from the list. Allmacros and scripts you created in the Data Explorersoftware are listed.
• Type the button number to which you assigned the macro.
For more information, see “Creating Macros” on page 7-8.
Hint: To display the macro name assigned to the button, displaythe Data Explorer software, then place the cursor over a macrobutton. Macro buttons are numbered sequentially from left toright. If the Macro toolbar is not displayed in the Data Explorersoftware, select Toolbar from the View menu, select Macros,then click Close.
continued
Table 7-1 Run List Parameters (Continued)
Field Description
Voyager™ Biospectrometry™ Workstation User’s Guide 7-17

Chapter 7 Acquiring Spectra from the Sequence Control Panel
7
Internal/ExternalCalibration
Calibration type to use for the row. Click the down arrow andselect one of the following:
• Blank—No calibration is applied during processing.Acquisition calibration (calibration specified in the .BIC fileused to acquire) is maintained.
• External—Applies the constants in the specified .CAL file tothe data file acquired in the row.
• Internal—If a .CAL file is specified (and it exists), constantsare applied to the .DAT file before the reference masses inthe .SET file are matched. New calibration constants aregenerated using the reference masses specified in the .SETfile, and applied to the data. Constants are then updatedwithin the .DAT file after calibration. For more information,see Section 7.7.4, Internal Standard CalibrationConsiderations.
• Internal-Update—If a .CAL file is specified (and it exists),constants are applied to the .DAT file before the referencemasses in the .SET file are matched. New calibrationconstants are generated using the reference massesspecified in the .SET file, and applied to the data. Constantsare then updated within the .DAT file after calibration. Thespecified .CAL file is updated or created and contains newcalibration constants after calibration. For more information,see Section 7.7.3, Performing Close External Calibration.
For information on .CAL files, see:
• Section 7.2, Understanding Settings, Macros, andCalibration
• “Creating Calibration (.CAL) Files” on page 7-11
NOTE: The calibration specified in the Sequence Control Panelis performed after the calibration performed by the .BIC file usedto acquire the data file, and the data file is updated with thecalibration performed in the Sequence Control Panel.
continued
Table 7-1 Run List Parameters (Continued)
Field Description
7-18 Applied Biosystems

Creating a Sequence
7
Internal/ExternalCalibration
(continued)
NOTE: If the .DAT file contains multiple spectra generated usingthe Save All or the Save All Passing option in Automatic Control,the calibration is applied to all spectra in the .DAT file.
Calibration File
(required entryfor External andInternal-Updatecalibration;optional entryfor Internalcalibration)
.CAL file to use to calibrate the data file acquired in the row. Ifyou specify External or Internal-Update, a .CAL file name isrequired, even if a corresponding .CAL file with constants doesnot exist (see below for further explanation).
You can specify an existing .CAL file or the name of a .CAL filethat will be created by a previous line in the Sequence.
The way the .CAL file is used depends on the calibration type:
• External—Constants are applied.
• Internal—If a .CAL file is specified, constants are applied.
• Internal-update—If the specified .CAL file exists, constantsare applied before calibration, then the .CAL file is updatedwith new constants after calibration.
If the specified .CAL file does not exist, no constants areapplied before calibration, and the .CAL file is createdcontaining new constants after calibration.
NOTE: If the specified.CAL file for Internal-Update does notexist, the software creates the .CAL file during processing in thepath you specify. If you do not specify a path, the softwarecreates the .CAL file in the C:\VOYAGER directory.
NOTE: If the .BIC file specifies a .CAL file, the .CAL file in the.BIC file is not updated, unless it is the same .CAL file specifiedin the Sequence Control Panel.
For information on how .CAL files are used in the SequenceControl Panel, see Section 7.2, Understanding Settings, Macros,and Calibration.
continued
Table 7-1 Run List Parameters (Continued)
Field Description
Voyager™ Biospectrometry™ Workstation User’s Guide 7-19
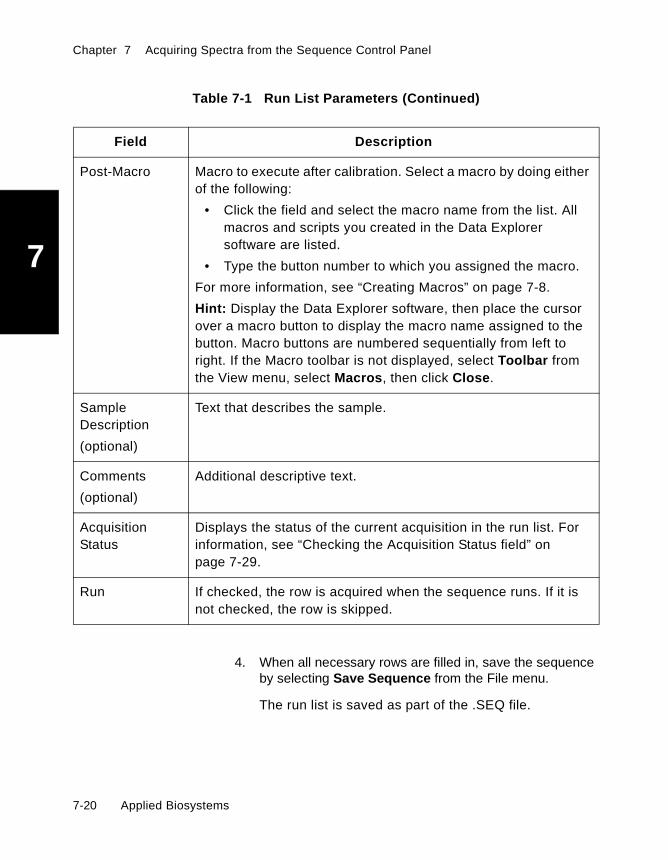
Chapter 7 Acquiring Spectra from the Sequence Control Panel
7
4. When all necessary rows are filled in, save the sequenceby selecting Save Sequence from the File menu.
The run list is saved as part of the .SEQ file.
Post-Macro Macro to execute after calibration. Select a macro by doing eitherof the following:
• Click the field and select the macro name from the list. Allmacros and scripts you created in the Data Explorersoftware are listed.
• Type the button number to which you assigned the macro.
For more information, see “Creating Macros” on page 7-8.
Hint: Display the Data Explorer software, then place the cursorover a macro button to display the macro name assigned to thebutton. Macro buttons are numbered sequentially from left toright. If the Macro toolbar is not displayed, select Toolbar fromthe View menu, select Macros, then click Close.
SampleDescription
(optional)
Text that describes the sample.
Comments
(optional)
Additional descriptive text.
AcquisitionStatus
Displays the status of the current acquisition in the run list. Forinformation, see “Checking the Acquisition Status field” onpage 7-29.
Run If checked, the row is acquired when the sequence runs. If it isnot checked, the row is skipped.
Table 7-1 Run List Parameters (Continued)
Field Description
7-20 Applied Biosystems

Creating a Sequence
7
Modifying andcustomizing the
run list
You can modify and customize the run list using the followingcommands on the Edit menu:
• Cut, Copy, Paste—Use to cut, copy, and pasteinformation.
• Insert Row, Insert Multiple Rows, Delete Row—Use toinsert and delete rows.
• Fill Down—Use to automatically fill in run list grid entries.Click-drag to select the rows to fill then select Fill Downfrom the Edit menu. The first entry selected is copied toall selected rows below.
Filling down thesample position
You can set the Sample Position field to fill down in two ways:
• Copy the first sample position to all selected rows below,by click-dragging to select the rows to fill, then selectingFill Down from the Edit menu.
• Increment sample positions in all selected rows belowbased on the type of sample plate loaded in theInstrument Control Panel, as described below.
Incrementingsample positions
To increment sample positions when filling down:
1. In the Instrument Control Panel, select Select SamplePlate from the Sample Plate menu, then select theSample Plate you will use for the sequence. For moreinformation, see Section 3.4.4, Loading Sample Plates.
2. In the Sequence Control Panel, select Preferences fromthe View menu. In the Preference dialog box:
• Select Fill Down Sample Position SequentiallyBased on PLT File.
• Type the number of positions contained on theloaded sample plate in the Default Number ofRows in the Grid field.
• Click OK.
For more information, see Section 7.8.2, SettingSequence Control Panel Preferences.
Voyager™ Biospectrometry™ Workstation User’s Guide 7-21

Chapter 7 Acquiring Spectra from the Sequence Control Panel
7
3. In the Run list, type the starting sample position to filldown.
NOTE: If you want to fill down all positions on the plate,you must start at row 1.
4. Select the rows to fill down.
NOTE: To fill down all positions on the plate, click onthe Sample Position column header to select all rows.
5. From the Edit menu, select Fill Down.
Selected rows are filled with the incremented sampleposition number.
Importing andexporting the run
list
You can import and export the following file types for use in theSequence Control Panel:
• Text files (.TXT), tab- or comma-delimited• Excel Worksheet files (.XLS)
File requirementsfor importing
A file that you import into the run list must meet the followingconditions:
• Must contain 11 columns of information (to correspond toall columns in the grid except the Acquisition Statuscolumn). If you do not have information for a column,leave a blank in that column.
• Columns must be in the same order as the columns in therun list (see Table 7-1, “Run List Parameters,” onpage 16).
• The Run column must include a 1 (equal to the Run fieldbeing checked) or 0 (equal to the Run field beingunchecked)
• .BIC, .SET, or .CAL file columns must specify a full pathfor the file.
7-22 Applied Biosystems

Creating a Sequence
7
NOTE: If you do not specify a path, the softwareassumes a path of C:\VOYAGER.
• Does not contain blank lines. Any lines following a blankline are ignored and not imported.
Importing To import a .TXT or .XLS file:
1. Select Import from the File menu.
2. Select a file or type in a file name.
3. Click Import.
Information is imported into all columns, even ifcolumns are hidden.
Exporting To export a .TXT or .XLS file:
1. Select Export from the File menu.
2. Type in a file name.
3. Select .TXT or .XLS from the Save As Type drop-downlist.
4. Click Save.
NOTE: The Acquisition Status column is not exported.The exported Run column contains 0 if Run isunchecked and 1 if Run is checked.
Voyager™ Biospectrometry™ Workstation User’s Guide 7-23

Chapter 7 Acquiring Spectra from the Sequence Control Panel
7
7.5 Preparing to Run a Sequence
This section describes:
• Aligning the sample plate• High voltage warmup for improved mass accuracy• Before acquiring
Aligning thesample plate
Sample plate alignment is necessary for a sequence run if thelaser is not striking the center of the sample position.
Sample plate alignment may not be necessary on yoursystem, particularly if you use 100-well plates and theSPIRAL.SP search pattern file provided with the system.
See Section 2.7, Aligning the Sample Plate, to determine ifsample plate alignment is necessary. If you do need to alignthe sample plate, you must do so for each sample plate youuse.
High voltagewarmup for
improved massaccuracy
For maximum mass accuracy, allow the high voltage powersupplies to warm up for a short period of time beforeacquisition. This reduces variability in accelerating voltages,and yields more reproducible ion flight times.
To turn on the high voltage power supplies, click in thetoolbar.
NOTE: The high voltage power supplies are automaticallyturned off after 60 minutes if the mass spectrometer is notused. To change the Idle Time, see “High VoltageConfiguration” on page 2-38.
Before acquiring Before acquiring a sequence:
1. Load a sequence by doing one of the following:
• Create a new sequence. See Section 7.3, BeforeCreating a Sequence.
• Open an existing sequence by clicking in thetoolbar and selecting an .SEQ file.
2. Check system status. See Section 2.11, Checking SystemStatus and Pressures.
7-24 Applied Biosystems

Running a Sequence
7
7.6 Running a Sequence
This section includes:
• Starting a sequence• What the system checks when you start a sequence• During and after acquiring a sequence• Stopping a sequence• Checking sequence status
7.6.1 Starting a Sequence
CAUTION
After you start a sequence, do not change instrumentsettings or any other parameters in the sequence.Changing settings while a sequence is running may causethe sequence to stop.
Checking diskspace
Before starting a sequence run, the system checks that atleast 150 MB of disk space is available if you have enabled theLow Disk space message in Preferences (described inSection 7.8.2, Setting Sequence Control Panel Preferences).
NOTE: If the run requires more than 150 MB for data filestorage, a message is displayed during the run when freedisk space is no longer available.
Acquiringsequence data
To acquire sequence data:
1. Perform the steps in Section 7.3, Before Creating aSequence.
2. Create a sequence as described in Section 7.4, Creatinga Sequence, or open an existing sequence.
Voyager™ Biospectrometry™ Workstation User’s Guide 7-25

Chapter 7 Acquiring Spectra from the Sequence Control Panel
7
NOTE: You can have more than one sequence open atthe same time. However, only one sequence can beactive. For example, you cannot edit one sequencewhile another sequence is running.
3. Select the rows to run by clicking the check box in the Runcolumn. Only rows with a check in the Run column areacquired when the sequence runs.
Hint: You can select Run Column State from the Editmenu then select Set All or Clear All to quickly checkor uncheck all rows.
4. To start the sequence, click in the toolbar, or selectStart Sequence from the Control menu.
7.6.2 What the System ChecksWhen You Start a Sequence
What the systemchecks
When you start a sequence, the software examines thecontents of all selected rows (checked in the Run column) tomake sure specified files exist and entries are valid.
If the systemfinds invalidparameters
If the system finds invalid parameters, it:
• Unchecks all rows containing invalid parameters
• Changes the color of the invalid parameter to red
• Displays an error message indicating that invalidparameters have been found, and allows you to run rowsthat do not contain errors
7-26 Applied Biosystems

Running a Sequence
7
If error isdisplayed
If an error is displayed, check the following and correct asneeded:
• Sample positions correspond to the type of .PLT fileloaded in the Instrument Control Panel
• All directories specified for data files exist
• All specified .BIC, .SET, and .CAL files exist
NOTE: If a .CAL file specified for an External calibrationline does not exist, the software checks preceding rowsin the sequence to see if an Internal-Update calibrationrow will create the .CAL file. For more information, see“Types of files and calibration” on page 7-3.
• All .BIC files specify Automatic Control mode
• All .BIC files specify Linear or Reflector Operation mode(PSD mode is not allowed)
• All .BIC files specify the same laser type (internal orexternal). You cannot switch between internal andexternal lasers when running a sequence. If youspecify an internal laser .BIC file, then an externallaser .BIC file, the second .BIC file is flagged as invalidwhen you try to run the sequence.
Voyager™ Biospectrometry™ Workstation User’s Guide 7-27

Chapter 7 Acquiring Spectra from the Sequence Control Panel
7
7.6.3 During and AfterAcquiring a Sequence
Pausing andresuming a
sequence
To pause a sequence, click .
The sequence pauses after the current entry is acquired andprocessed, and Sequence Acquisition Status is Paused.
To resume the sequence, click again. The sequenceresumes with the next row selected to run.
Skipping a line To skip a row in the sequence, select Skip Line from theControl menu.
NOTE: The log file does not contain any information forrows you skip.
Modifying the runlist during
acquisition
To modify the run list after you start the sequence, click topause the sequence. You can modify lines below the line atwhich the sequence has paused.
Process thatoccurs
During the sequence run:
• After each data file is acquired, it is processed.
• Sequence status is displayed in the locations listed in“Checking Sequence Status” on page 7-29.
After the sequence run:
• The run log is created in the location specified inSection 7.4.1, Setting General Sequence Parameters.The run log contains all errors that are logged and a list offiles that are acquired.
• The last .BIC file that was executed remains loaded in theInstrument Control Panel.
7-28 Applied Biosystems
Running a Sequence
7
7.6.4 Stopping a Sequence
To stop a sequence, click .
The sequence stops as soon as the current processingfunction can safely stop. You cannot resume a stoppedsequence. You must restart at the beginning.
7.6.5 Checking Sequence Status
You can check sequence status in three places:
• Acquisition Status field in the run list• Sequence Status control page (general status of run)• Instrument Control Panel
Checking theAcquisitionStatus field
The Acquisition Status field in the run list displays the status ofeach spectrum as it is acquired. Possible states are:
• Acquiring—Acquiring a sample.
• Processing—Applying macros or calibrating the data file.
• Acq Error—Error occurred during acquisition.
• Proc Error—Error occurred during processing.
• Success—Sample processing successful.
NOTE: The Acquisition Status field is updated each time aspectrum is acquired and processed for a line in thesequence. When acquisition and processing is complete forthe line, the status reflects the status for the last spectrumacquired and processed. It does not reflect the overallstatus of all acquisitions performed by the line.
Voyager™ Biospectrometry™ Workstation User’s Guide 7-29

Chapter 7 Acquiring Spectra from the Sequence Control Panel
7
Checking theSequence Status
panel
Select Status Panel from the View menu to check the statusof a sequence. The Sequence Status panel (Figure 7-7) isdisplayed.
Figure 7-7 Sequence Status Panel
Sequence status parameters include:
Field Description
Sequence File Name Displays the name of the .SEQ file currently running.
Overall Run Status Displays overall run status.
Possible states are:
• Off—Not running.• Running—Acquiring a sample.• Pausing/Paused—Pause button clicked.• Stopping/Stopped—Stop button clicked.• Finished—Sample acquired and processed.• Error—Error occurred during acquisition that
terminated the sequence.
Elapsed Time Displays the time that has elapsed during sequenceacquisition.
Current Entry Index Displays the row number that is being acquired.
Remaining Entries Displays the remaining number of rows selected foracquisition.
7-30 Applied Biosystems

Running a Sequence
7
Checking statusin the Instrument
Control Panel
You can monitor the following parameters in the InstrumentControl Panel during a sequence run:
Parameter Where to check
Laser intensity Status bar of Instrument Control Panel
Search Pattern Position Automatic Control tab in Output window
Data file name Data Storage tab in Output window
Current Peak Intensity Spectrum window
Signal-to-Noise ofprevious peak
Automatic Control tab in Output window
Voyager™ Biospectrometry™ Workstation User’s Guide 7-31

Chapter 7 Acquiring Spectra from the Sequence Control Panel
7
7.7 Automatic CalibrationDuring a Sequence Run
This section includes:
• Calibration options in a sequence• External calibration standard requirements• Performing close external calibration• Internal standard calibration considerations
7.7.1 Calibration Options in a Sequence
The Sequence Control Panel allows three types of automaticcalibration:
Type Function
External • Applies calibration constants in a specified .CAL file.
Internal • Applies calibration constants if a .CAL file is specified
• Generates new calibration constants using standard referencemasses specified by a .SET file.
• Applies the constants.
Internal-Update
• Applies calibration constants if a .CAL file is specified
• Generates new calibration constants using standard referencemasses specified by a .SET file.
• Applies the constants.
• Updates the specified .CAL file, or creates a new .CAL file ifthe specified file does not exist.
Use this option to perform a close external calibration, described inSection 7.7.3, Performing Close External Calibration.
7-32 Applied Biosystems

Automatic Calibration During a Sequence Run
7
NOTE: If the .DAT file contains multiple spectra generatedusing the Save All or the Save All Passing option inAutomatic Control, the calibration is applied to all spectra inthe .DAT file.
For the mass accuracy provided by each calibration type, see“Types of calibration” on page 6-7.
7.7.2 External CalibrationStandard Requirements
Mass calibrationstandards
The requirements for mass calibration standards aredetermined by your application. The following are generalguidelines:
• To improve external calibration mass accuracy (seeAppendix A, Specifications, for external calibrationspecifications for your system), perform plate optimizationbefore acquiring data. For more information, seeSection 3.4.2, Using the Mass Accuracy OptimizationOption.
• Mass calibrate on the same sample plate you will use toanalyze samples.
If you do not use the Optimize Mass Accuracy option, note thefollowing:
• For rapid screening in which high mass accuracy is notneeded, one calibration standard located in the center ofthe plate is adequate.
• For applications requiring higher mass accuracy, morecalibration standards are needed. You must experimentto determine the number and location of standardsrequired to provide the mass accuracy you require.
• For optimum mass accuracy, place samples in samplepositions adjacent to standards.
Voyager™ Biospectrometry™ Workstation User’s Guide 7-33

Chapter 7 Acquiring Spectra from the Sequence Control Panel
7
• For maximum mass accuracy, spot sample and standardas close to each other as possible (within 1 mm). This isreferred to as close external calibration. For moreinformation, see Section 7.7.3, Performing Close ExternalCalibration.
7.7.3 Performing Close External Calibration
NOTE: The Mass Accuracy Optimization feature providesmass accuracy comparable to close external calibration,and requires fewer calibration standards. For information,see Section 3.4.2, Using the Mass Accuracy OptimizationOption.
Overview You have two options for close external calibration:
• Sample and standard in separate sample positions• Sample and standard in the same sample position
NOTE: The closer the locations of sample and standard,the better the mass accuracy.
Sample andstandard in
separate samplepositions
If you are acquiring samples and standards from differentsample positions, enter the standards in the run list precedingthe unknowns that use the calibration.
For optimum mass accuracy, place samples in samplepositions adjacent to standards. See the example inFigure 7-8.
7-34 Applied Biosystems

Automatic Calibration During a Sequence Run
7
Figure 7-8 Sample and Standard Locations for Optimum Mass Accuracy(Without Using the Optimize Mass Accuracy Option)
To run samples spotted on a 100-well plate as illustrated inFigure 7-8, set up the run list as shown in the following table.
= Empty
44 45 46
54 55 56
34 35 36
43
53
33
47
57
37
= Sample
= Standard
100-well plate
1 2 3 4 5 6
A
B
96 × 2-position plate
1 2 3 4 5 6 7
400-position plate
AB
8
100-wellPosition
Base FileName
InstrumentSettings File
Calibration TypeCalibration
File
45 STD1 STD.BIC INTERNAL-UPDATE STD.CAL
34 SAMP1 SAMP.BIC EXTERNAL STD.CAL
35 SAMP2 STD.BIC EXTERNAL STD.CAL
36 SAMP3 SAMP.BIC EXTERNAL STD.CAL
44 SAMP4 STD.BIC EXTERNAL STD.CAL
46 SAMP5 SAMP.BIC EXTERNAL STD.CAL
54...56 SAMP6...8 STD.BIC EXTERNAL STD.CAL
Voyager™ Biospectrometry™ Workstation User’s Guide 7-35

Chapter 7 Acquiring Spectra from the Sequence Control Panel
7
To run samples spotted on a 400-position or 96 × 2-positionplate as illustrated in Figure 7-8, set up the run list as shown inthe following table.
The number and placement of standards needed depend onyour application. See “Mass calibration standards” onpage 7-33.
Hint: You can use the same calibration file more than oncein a sequence run.
Sample andstandard in the
same sampleposition
You may see improved mass accuracy by spotting sample andstandard in as close together as possible within a sampleposition (Figure 7-9). A standard spot within 1 mm of a samplespot can yield mass accuracy close to that expected forinternal calibration.
400-wellPosition
96×2-wellPosition
Base FileName
InstrumentSettings File
Calibration TypeCalibration
File
A1 A1_a STD1 STD.BIC INTERNAL-UPDATE STD.CAL
A2 A1_b SAMP1 SAMP.BIC EXTERNAL STD.CAL
A3 A2_a STD2 STD.BIC INTERNAL-UPDATE STD.CAL
A4 A2_b SAMP2 SAMP.BIC EXTERNAL STD.CAL
A5 A3_a STD3 STD.BIC INTERNAL-UPDATE STD.CAL
A6 A3_b SAMP3 SAMP.BIC EXTERNAL STD.CAL
A7 A4_a STD4 STD.BIC INTERNAL-UPDATE STD.CAL
A8 A4_b SAMP4 SAMP.BIC EXTERNAL STD.CAL
7-36 Applied Biosystems

Automatic Calibration During a Sequence Run
7
NOTE: This method is useful for plates with larger samplepositions. If you are using a 400-position or 92×2-positionplate, follow the procedure in “Sample and standard inseparate sample positions” on page 7-34.
NOTE: Use plates without laser-etched sample positions orwells if you spot standard and sample as shown below.
Figure 7-9 Location of Sample and External Standardfor Maximum Mass Accuracy (Without Using the
Optimize Mass Accuracy Option)
Sample
Standard
Logicalcoordinates (microns)
Voyager™ Biospectrometry™ Workstation User’s Guide 7-37
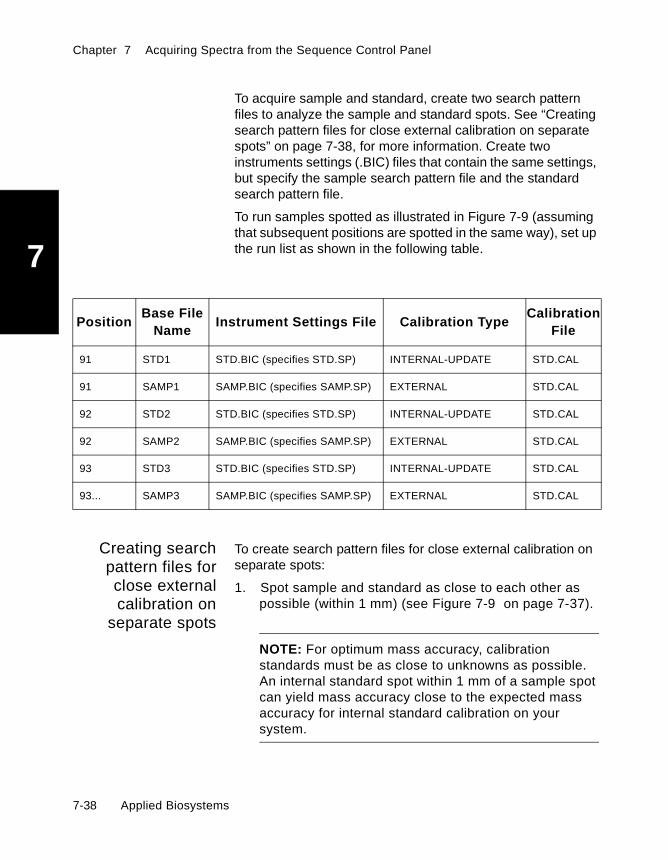
Chapter 7 Acquiring Spectra from the Sequence Control Panel
7
To acquire sample and standard, create two search patternfiles to analyze the sample and standard spots. See “Creatingsearch pattern files for close external calibration on separatespots” on page 7-38, for more information. Create twoinstruments settings (.BIC) files that contain the same settings,but specify the sample search pattern file and the standardsearch pattern file.
To run samples spotted as illustrated in Figure 7-9 (assumingthat subsequent positions are spotted in the same way), set upthe run list as shown in the following table.
Creating searchpattern files forclose externalcalibration on
separate spots
To create search pattern files for close external calibration onseparate spots:
1. Spot sample and standard as close to each other aspossible (within 1 mm) (see Figure 7-9 on page 7-37).
NOTE: For optimum mass accuracy, calibrationstandards must be as close to unknowns as possible.An internal standard spot within 1 mm of a sample spotcan yield mass accuracy close to the expected massaccuracy for internal standard calibration on yoursystem.
PositionBase File
NameInstrument Settings File Calibration Type
CalibrationFile
91 STD1 STD.BIC (specifies STD.SP) INTERNAL-UPDATE STD.CAL
91 SAMP1 SAMP.BIC (specifies SAMP.SP) EXTERNAL STD.CAL
92 STD2 STD.BIC (specifies STD.SP) INTERNAL-UPDATE STD.CAL
92 SAMP2 SAMP.BIC (specifies SAMP.SP) EXTERNAL STD.CAL
93 STD3 STD.BIC (specifies STD.SP) INTERNAL-UPDATE STD.CAL
93... SAMP3 SAMP.BIC (specifies SAMP.SP) EXTERNAL STD.CAL
7-38 Applied Biosystems

Automatic Calibration During a Sequence Run
7
NOTE: Use plates without laser-etched samplepositions if you spot standard and sample as shown inFigure 7-9.
2. Load the sample plate, select the position containingsample and standard, and display the Sample View.
3. Note the logical x and y coordinates for a minimum ofthree positions on the standard spot and a minimum of sixpositions on the sample spot.
4. Create the two search pattern files using WindowsNotepad as described in “Creating and Editing .SP FilesUsing the Search Pattern Editor” on page 6-50.
7.7.4 Internal StandardCalibration Considerations
This section includes:
• Optimizing unknown and standard concentration
• Determining if standard suppresses signal from unknown
• Creating a search pattern file for internal calibration onseparate spots
• Performing internal standard calibration with an externalcalibration “backup”
Optimizingunknown and
standardconcentration
Before combining sample and internal standard, determine theconcentration of each that yields optimum signal intensitywithout saturation.
To optimize relative peak intensities, determine the peakintensity of the sample, and adjust the concentration of thestandard to bring the standard peak intensity into the samerange.
Voyager™ Biospectrometry™ Workstation User’s Guide 7-39
Chapter 7 Acquiring Spectra from the Sequence Control Panel
7
Determining ifstandard
suppressessignal from
unknown
In some cases, standard signal can suppress unknown signal.Mix optimized concentrations of standard and unknown andanalyze to determine if you see adequate signal for allcompounds.
If standard signal suppresses unknown signal, you have twooptions for analysis:
• Perform internal calibration using separate spots—Spot standard and sample as close to each other aspossible. Create a search pattern file that analyzes bothspots. Create an instrument settings file that generates asingle spectrum (Accumulate All data collection mode)and specify internal calibration in Sequence Control. See“Creating a search pattern file for internal calibration onseparate spots” on page 7-40.
NOTE: To use this strategy, make sure standard andsample are compatible with the laser intensity andacceptance criteria in the instrument settings, and thatthe standard and sample peaks do not overlap.
• Perform close external calibration—Spot standard andsample as close to each other as possible and performclose external calibration as described in Section 7.7.3,Performing Close External Calibration.
Creating a searchpattern file for
internalcalibration on
separate spots
To create a search pattern file for internal calibration onseparate spots:
1. Spot sample and standard as close to each other aspossible (within 1 mm) (see Figure 7-9 on page 7-37).
NOTE: For optimum mass accuracy, calibrationstandards must be as close to unknowns as possible.An internal standard spot within 1 mm of a sample spotcan yield mass accuracy close to the expected massaccuracy for internal standard calibration on yoursystem.
7-40 Applied Biosystems
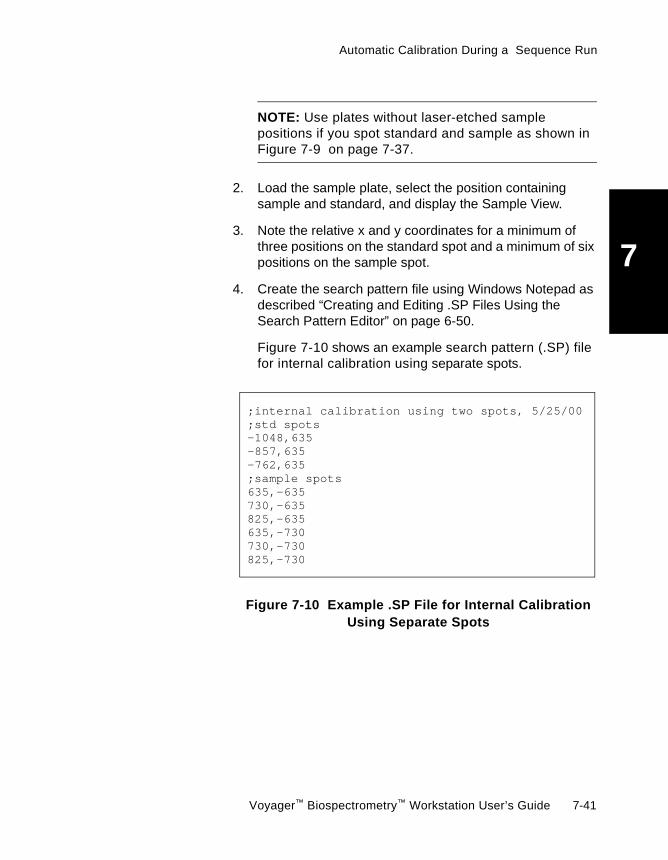
Automatic Calibration During a Sequence Run
7
NOTE: Use plates without laser-etched samplepositions if you spot standard and sample as shown inFigure 7-9 on page 7-37.
2. Load the sample plate, select the position containingsample and standard, and display the Sample View.
3. Note the relative x and y coordinates for a minimum ofthree positions on the standard spot and a minimum of sixpositions on the sample spot.
4. Create the search pattern file using Windows Notepad asdescribed “Creating and Editing .SP Files Using theSearch Pattern Editor” on page 6-50.
Figure 7-10 shows an example search pattern (.SP) filefor internal calibration using separate spots.
Figure 7-10 Example .SP File for Internal CalibrationUsing Separate Spots
;internal calibration using two spots, 5/25/00
-1048,635-857,635-762,635;sample spots
;std spots
635,-635730,-635825,-635635,-730730,-730825,-730
Voyager™ Biospectrometry™ Workstation User’s Guide 7-41

Chapter 7 Acquiring Spectra from the Sequence Control Panel
7
Performinginternal standard
calibration withan externalcalibration
“backup”
For applications in which the concentration of internalstandard to sample varies, you can set the sequence toperform an external and an internal calibration. This providesa certain level of mass accuracy, even if the internal standardpeak is suppressed, and the internal calibration fails. Anexample of this application is analysis of proteolytic digestswhich use autolytic enzyme peaks as internal standards.
Set up the run list as shown in the following table.
During the run, the external calibration (.CAL) file is applied,then the internal calibration is performed.
PositionBase File
NameInstrument
Settings FileCalibration Type
CalibrationFile
91 STD1 STD.BIC INTERNAL-UPDATE STD.CAL
92 SAMP1 SAMP.BIC INTERNAL STD.CAL
93 STD2 STD.BIC INTERNAL-UPDATE STD.CAL
94 SAMP2 SAMP.BIC INTERNAL STD.CAL
95 STD3 STD.BIC INTERNAL-UPDATE STD.CAL
96... SAMP3 SAMP.BIC INTERNAL STD.CAL
7-42 Applied Biosystems

Customizing the Sequence Control Panel
7
7.8 Customizing theSequence Control Panel
This section includes:
• Customizing the sequence display• Setting Sequence Control Preferences
7.8.1 Customizing the Sequence Display
Using Workbookmode
Workbook mode displays the run list (contains sampleinformation and conditions for acquisition and processing) intabbed, framed format.
To use Workbook mode:
1. Open or create a sequence run list.
2. Open or create another sequence run list.
3. Select Workbook mode from the View menu.
Figure 7-11 displays the Sequence Control Panel inWorkbook mode (two tabs at bottom of run list).
Voyager™ Biospectrometry™ Workstation User’s Guide 7-43

Chapter 7 Acquiring Spectra from the Sequence Control Panel
7
Figure 7-11 Sequence Control Panel in Workbook Mode
4. Switch between the run lists by clicking the appropriatetab.
Showing or hidingcolumns
You can select Grid Columns from the View menu, thenselect the columns that are displayed. Checked columns aredisplayed. Hidden columns that require an entry areautomatically displayed if you select a row to run and it doesnot contain the necessary entry.
If you import information into the run list, entries are importedinto hidden columns.
Positioningwindows
To arrange the Sequence Control Panel and InstrumentControl Panel on the desktop, select a command from theDesktop menu:
• Tile Horizontal—Places the Sequence Control Panel atthe top or bottom of the desktop, and the InstrumentControl Panel in the opposite location.
• Tile Vertical—Places the Sequence Control Panel at theleft or right of the desktop, and the Instrument ControlPanel in the opposite location.
Workbook tabs
7-44 Applied Biosystems
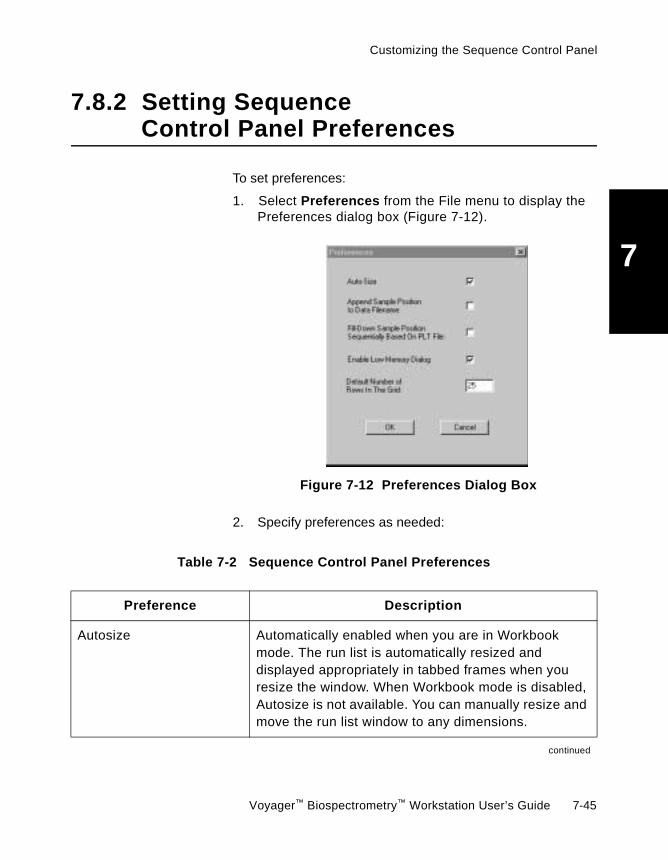
Customizing the Sequence Control Panel
7
7.8.2 Setting SequenceControl Panel Preferences
To set preferences:
1. Select Preferences from the File menu to display thePreferences dialog box (Figure 7-12).
Figure 7-12 Preferences Dialog Box
2. Specify preferences as needed:
Table 7-2 Sequence Control Panel Preferences
Preference Description
Autosize Automatically enabled when you are in Workbookmode. The run list is automatically resized anddisplayed appropriately in tabbed frames when youresize the window. When Workbook mode is disabled,Autosize is not available. You can manually resize andmove the run list window to any dimensions.
continued
Voyager™ Biospectrometry™ Workstation User’s Guide 7-45

Chapter 7 Acquiring Spectra from the Sequence Control Panel
7
3. Click OK.
Append Sample Positionto Data File Name
Includes position number in the data file name suffix.For example, if you specify a base name of SAMPLE,the final data file name is SAMPLE_A1_0001.DAT forthe data file acquired from position A1.
Fill Down Sample PositionBased on PLT File
When you use the fill down function, increments samplepositions in all selected rows below based on the type ofsample plate loaded in the Instrument Control Panel. See“Incrementing sample positions” on page 7-21.
Enable Low MemoryDialog
Verifies before each acquisition step that at least150 MB of disk space are available on the destinationdrive.
Default number of rows Determines the number of rows displayed when youcreate a new sequence. You can override the defaultand add or delete rows as needed.
Table 7-2 Sequence Control Panel Preferences (Continued)
Preference Description
7-46 Applied Biosystems

8Chapter
8 PSD Analysis
This chapter contains the following sections:8.1 PSD Quick Start............................................... 8-2
8.2 Overview of PSD Analysis ............................. 8-20
8.3 Enhancing Fragmentation with CID................ 8-31
8.4 Acquiring PSD Data with Standard .BIC Filesin Manual Control Mode ................................. 8-37
8.5 Acquiring PSD Data with Standard .BIC Filesin Automatic Control Mode............................. 8-57
8.6 Exploring PSD Mode...................................... 8-65
8.7 Viewing PSD Data ......................................... 8-77
Voyager™ Biospectrometry™ Workstation User’s Guide 8-1

Chapter 8 PSD Analysis
8
8.1 PSD Quick Start
This section gives a quick overview of how to perform aPSD acquisition of angiotensin and an unknown in manualmode.
For detailed PSD information, refer to the sections that followthis PSD Quick Start.
Before you begin Before starting this PDS Quick Start, be familiar with theinformation in:
• Section 8.2.1, Post-Source Decay Analysis
• Section 8.6.1, Observing the Effects of Laser Intensity
• Section 5.1, Loading, Modifying, and Saving InstrumentSettings
• Section 6.2, Acquiring in Manual Mode from theInstrument Control Panel
• Section 6.4, Making Accurate Mass Measurements
• Data Explorer User’s Guide, the sections that describeexamining spectra and manual calibration
Two types ofcalibration in PSD
analysis
When you perform PSD analysis, you generate two types ofmass calibration:
• External calibration applied to precursor ion mass—Normal mass calibration applied to a reflector modespectrum, to ensure accurate mass of the precursor ion(described in Section 6.1.3, Calibrating the Mass Scale).
• PSD calibration applied to fragment ion masses—Special PSD calibration that optimizes fragment ion massbased on precursor ion mass and Mirror Ratio setting(described in Section 8.2.5, Mass Calculation forFragment Ions).
Steps to performPSD analysis
The steps to perform PSD analysis on angiotensin and on anunknown are summarized in Table 8-1 and Table 8-2.
8-2 Applied Biosystems

PSD Quick Start
8
Table 8-1 Steps to Perform PSD Analysis of Angiotensin
Step ResultSeepage
1. Generate a Reflector mode precursorspectrum (use PSD_Precursor.BIC provided).
8-7
2. Generate a normal single-point externalcalibration using the spectrum acquired instep 1. You use this single-point externalcalibration in PSD analysis to obtain maximummass accuracy for the precursor ion.
8-7
3. Set PSD Acquisition/Instrument Settingsparameters—Open Angiotensin_PSD.BICprovided, and:
• In Instrument Settings—Type theangiotensin precursor mass and selectAngio.CAL generated above (forprecursor).
• In PSD Acquisition Settings—Selectdefault PSD calibration (for fragments).
8-7
4. Acquire PSD segments (precursor andfragment spectra).
8-9
5. Generate a PSD multi-point externalcalibration using the spectrum acquired instep 4. You use this multi-point externalcalibration in PSD analysis to obtain maximummass accuracy for the fragment ions.
8-13
PrecursorAngiotensin Reflector spectrum
1296.6853
Angio.CAL
Normal external calibrationfor precursor ion mass accuracy
Angiotensin_PSD.BIC with:
Default PSD calibrationAngio.CAL
Angiotensin PSD Composite spectrum
109.
5
512.
9
Angio_PSD.CAL
PSD calibrationfor fragment ion mass accuracy
Voyager™ Biospectrometry™ Workstation User’s Guide 8-3

Chapter 8 PSD Analysis
8
6. To verify that the Angio_PSD.CAL yieldsacceptable mass accuracy:
• Add the PSD calibration generated instep 5 to PSD Acquisition parameters—Open Angiotensin_PSD.BIC, selectExternal PSD Calibration File, thenselect Angio_PSD.CAL (for fragments)
8-14
• Acquire PSD segments (precursor andfragment spectra) with PSD calibration
8-14
Table 8-1 Steps to Perform PSD Analysis of Angiotensin (Continued)
Step ResultSeepage
Angiotensin_PSD.BIC with:
Angio_PSD.CALAngio.CAL
Recalibrated angiotensin PSDComposite spectrum with optimum
fragment ion mass accuracy
110.
1
513.
3
8-4 Applied Biosystems

PSD Quick Start
8
Table 8-2 Steps to Perform PSD Analysis of an Unknown
Step ResultSeepage
1. Generate a PSD calibration on angiotensin byperforming step 1 through step 6 in “Steps toPerform PSD Analysis of Angiotensin” onpage 8-3.
8-3
2. Generate a precursor spectrum on theunknown in Reflector mode (usePSD_Precursor.BIC provided).
NOTE: This step assumes that you havealready determined an accurate mass for theprecursor ion using reflector modehigh-resolution analysis with internal orexternal calibration.
8-7
3. Generate a normal single-point externalcalibration using the spectrum acquired instep 2. You use this single-point externalcalibration in PSD analysis to obtain maximummass accuracy for the unknown precursor ion.
8-7
4. Set PSD Acquisition/Instrument Settingsparameters—Open Angiotensin_PSD.BICprovided, and:
• In Instrument Settings—Type theprecursor mass and selectPrecursor.CAL generated in step 3 (forprecursor).
• In PSD Acquisition Settings—SelectAngio_PSD.CAL generated in step 1 (forfragments).
8-7
5. Acquire unknown PSD segments (precursorand fragment spectra) with Angio_PSDcalibration.
8-14
PSD calibrationfor fragment ion mass accuracy
Angio_PSD.CAL
PrecursorUnknown Reflector spectrum
??
Precursor.CAL
Normal external calibrationfor precursor ion mass accuracy
Angiotensin_PSD.BIC with:
Angio_PSD.CALPrecursor.CAL
Unknown PSD Composite spectrumwith optimum fragment ion
mass accuracy
Voyager™ Biospectrometry™ Workstation User’s Guide 8-5

Chapter 8 PSD Analysis
8
6. Optionally, confirm or investigate fragment ionidentity using the Ion Fragment calculator orthe Peptide Fragmentation macro.
8-19
Table 8-2 Steps to Perform PSD Analysis of an Unknown (Continued)
Step ResultSee
page
Unknown PSD Composite spectrumwith fragment ion labels
Hy2 b3
–17
a5 b6
8-6 Applied Biosystems

PSD Quick Start
8
8.1.1 PSD Analysis of Angiotensin
Generating theReflector mode
precursorspectrum
1. Open the PSD_Precursor.BIC file provided with thesoftware. This is a reflector mode instrument settings(.BIC) file. All other instrument settings should beidentical to the settings in the PSD modeAngiotensin_PSD.BIC you use later to acquiresegments.
2. Acquire using a laser intensity that does not saturate thereflector spectrum.
3. Save the precursor ion .DAT file by clicking in thetoolbar.
Generating anexternal
calibration for theprecursor ion
To obtain maximum mass accuracy for the precursor ion,follow the steps below to generate a single-point externalcalibration file to use when you perform the PSD acquisition.
NOTE: This is not a PSD calibration that affects fragmention masses. It ensures accurate mass of the precursor.
1. Click in the Instrument Control Panel toolbar toopen the precursor ion data file in the Data Explorersoftware.
2. Create a single-point calibration using the precursor ionmass, then save the calibration file as ANGIO.CAL byexporting the calibration constants from the data file. Formore information, see the Data Explorer Software User’sGuide, Section 5.3.2, Manually Calibrating.
Setting PSDacquisitionparameters
1. Open the Angiotensin_PSD.BIC file provided with thesoftware. This is a PSD mode .BIC file.
The PSD Acquisition Settings control page (Figure 8-1)is automatically displayed in the Instrument ControlPanel if you open a .BIC file set to PSD mode.
Voyager™ Biospectrometry™ Workstation User’s Guide 8-7

Chapter 8 PSD Analysis
8
Figure 8-1 PSD Instrument Control Panel with Acquisition Settings Control Page
2. In the Calibration section of the Instrument Settingscontrol page, select:
• The matrix you are using.
• External File, then select the ANGIO.CAL file youcreated in “Generating an external calibration forthe precursor ion” on page 8-7.
External.CAL file forprecursor
Default PSDcalibration for
fragments
PSDacquisition
settings
8-8 Applied Biosystems

PSD Quick Start
8
3. In the PSD Acquisition Settings control page, type theangiotensin Precursor mass.
NOTE: Precursor mass is used for PSD calibration.Type in an accurate value with appropriate precision(for example, type 1296.68, not 1297).
4. Ensure that PSD calibration is set to Default.
5. Select Save Instrument Settings As from the File menu,then save the instrument settings file with a new name.
NOTE: The instrument settings files provided with yoursystem (PSD_Precursor.BIC andAngiotensin_PSD.BIC) are read-only. You cannot savechanges to these files unless you assign a new name.
Acquiring PSDsegments
1. In the Manual Laser Intensity/Sample Positioningcontrol page, select the same sample position fromwhich you acquired the precursor spectrum.
2. From the View menu, select Data Storage. Setparameters as needed. See “Setting Data Storageparameters” on page 6-14 for information.
Hint: Include a _PSD suffix when you name PSD datafiles to help you distinguish them from non-PSD datafiles. For example, if you type in Experiment1_PSD asthe file name, the complete data file name will beExperiment1_PSD.DAT orExperiment1_PSD_0001.DAT (if Autosequence FileNames is enabled).
Voyager™ Biospectrometry™ Workstation User’s Guide 8-9
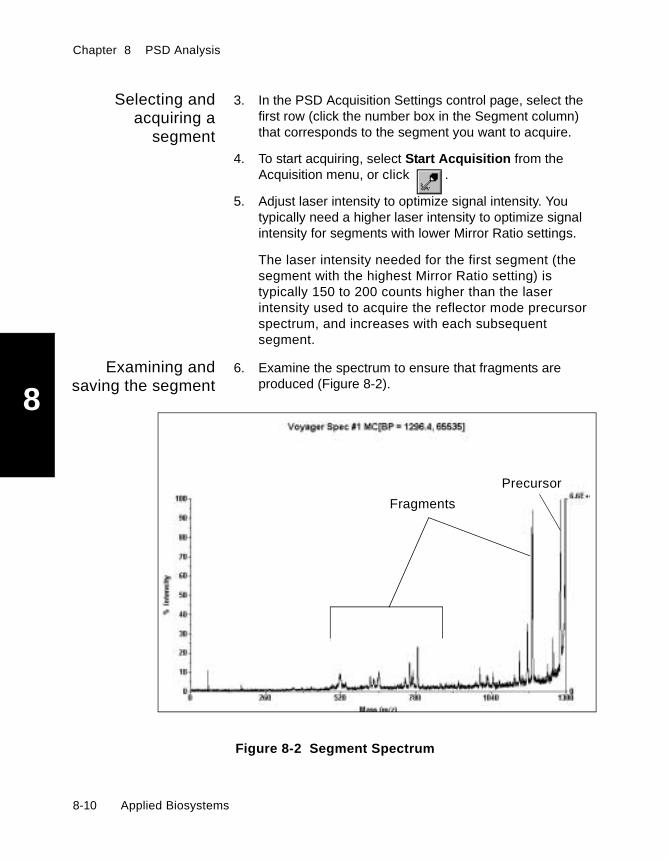
Chapter 8 PSD Analysis
8
Selecting andacquiring a
segment
3. In the PSD Acquisition Settings control page, select thefirst row (click the number box in the Segment column)that corresponds to the segment you want to acquire.
4. To start acquiring, select Start Acquisition from theAcquisition menu, or click .
5. Adjust laser intensity to optimize signal intensity. Youtypically need a higher laser intensity to optimize signalintensity for segments with lower Mirror Ratio settings.
The laser intensity needed for the first segment (thesegment with the highest Mirror Ratio setting) istypically 150 to 200 counts higher than the laserintensity used to acquire the reflector mode precursorspectrum, and increases with each subsequentsegment.
Examining andsaving the segment
6. Examine the spectrum to ensure that fragments areproduced (Figure 8-2).
Figure 8-2 Segment Spectrum
Fragments
Precursor
8-10 Applied Biosystems

PSD Quick Start
8
7. If fragments are present and data is acceptable(Figure 8-2), click in the toolbar to save the segmentto the .DAT file. After you save the segment, the Savedcheck box in the segment list is checked.
If the current spectrum does not contain significantfragment ion signal and you do not want to save thespectrum, reselect the row and reacquire the spectrum,or select a new row.
CAUTION
Save the current segment (if the data is acceptable)before starting to acquire the next segment. If you donot, you will lose the data for the current segment.
Selecting andacquiring
remainingsegments
8. Repeat step 3 through step 7 to collect remainingsegments.
NOTE: Segments are listed in the Data Explorersoftware in the order in which they are acquired. Ifsegments with duplicate Mirror Ratios are contained inthe file, the software uses the last acquired segmentwhen it generates the composite spectrum.
Stopping theexperiment
9. After you acquire all necessary segments, select StopExperiment from the Acquisition menu. The PSD data fileis closed.
You cannot view the PSD data file in the Data Explorersoftware until you stop the experiment.
CAUTION
If you stop an experiment without saving any segments,no .DAT file is created.
Voyager™ Biospectrometry™ Workstation User’s Guide 8-11

Chapter 8 PSD Analysis
8
Determining if PSDcalibration is
needed
1. Click in the Instrument Control Panel toolbar toopen the PSD data file in the Data Explorer. Thesoftware “stitches” together portions of the fragmentspectra and displays a composite spectrum (seeFigure 8-6 on page 8-26 for an explanation of how thesoftware generates the composite spectrum).
Your angiotensin composite spectrum should be similarto the spectrum shown in Figure 8-3.
Figure 8-3 Angiotensin Spectrum
2. Examine the masses in the stitched spectrum andcompare them to the expected masses listed in Table 8-3.
1181.6
8-12 Applied Biosystems

PSD Quick Start
8
If masses are not within ±0.2 Da (STR models) or ±0.3 Da(PRO models) of the expected masses, generate a PSDcalibration, and reacquire the PSD segments with the PSDcalibration.Generating a PSDcalibration
This section gives a brief description of how to generate aPSD calibration. For more information, see the Data ExplorerUser’s Guide, Section 8.3.3, Creating PSD Calibration (.CAL)Files and Applying to Other Data Files.
NOTE: This is a PSD calibration that affects fragment ionmasses.
1. In the Data Explorer software, open the PSD data fileacquired in the previous section, if it is not alreadyopen.
2. From the Process menu, select Mass Calibration, thenselect PSD Calibration.
3. Select the Angiotensin_Fragments.REF file providedwith the software.
Table 8-3 Expected Masses in Angiotensin Spectrum
Expected Mass Ion Type
110.08 His
255.16 b2–17
269.16 y2
354.20 b3–17
513.08 y4
619.36 a5
784.41 b6
1,181.6 y9
Voyager™ Biospectrometry™ Workstation User’s Guide 8-13

Chapter 8 PSD Analysis
8
4. Select the peaks listed in Table 8-3 as reference massesfor calibration by right-click-dragging on a peak, thenselect the correct mass for the peak in the ReferencePeak dialog box.
For best mass accuracy:
• Select a minimum of seven reference masses.
• Select peaks from different regions of thespectrum to ensure that high and low Mirror Ratiosare represented.
5. Click Solve and Plot to generate the calibration, thenclick Apply Calibration to save the calibration constantsin the data file. Click Close.
6. Save the calibration file as ANGIO_PSD.CAL by selectingExport from the File menu, then selecting Calibration.
Adding PSDcalibration
1. Open the Angiotensin_PSD.BIC file that you renamedin “Setting PSD acquisition parameters” on page 8-7.
2. In the PSD calibration section of the PSD Acquisitionsettings control page (see Figure 8-1 on page 8-8), selectthe ANGIO_PSD.CAL file you created in the previoussection.
3. Select Save Instrument Settings from the File menu.
Acquiring PSDsegments with
PSD calibration
Reacquire PSD segments with PSD calibration as describedin “Acquiring PSD segments” on page 8-9. Check thefragment ion masses to make sure they are within acceptableerror.
8-14 Applied Biosystems

PSD Quick Start
8
8.1.2 PSD Analysis of an Unknown
Generating theReflector mode
precursorspectrum
This step assumes that you have already determined anaccurate mass for the precursor ion using reflector modehigh-resolution analysis with internal or external calibration(this analysis requires conditions that differ from PSD analysisconditions). You acquire the precursor ion again (using thesame conditions you will use for PSD analysis) to generate aspectrum from which you can generate an external calibration.The external calibration you generate from the precursor ion isused to obtain maximum mass accuracy for the precursor ionduring the PSD analysis, which helps ensure maximum massaccuracy for the fragment ions.
1. Open the PSD_Precursor.BIC file provided with thesoftware. This is a reflector mode instrument settings(.BIC) file. All other instrument settings are identical tothe settings in the PSD mode Angiotensin_PSD.BIC fileyou use to acquire segments.
2. Acquire using a laser intensity that does not saturate thereflector spectrum.
3. Save the precursor ion .DAT file by clicking in thetoolbar.
Generating anexternal
calibration for theunknown
precursor ion
To obtain maximum mass accuracy for the precursor ion,generate an external calibration file using the spectrumacquired in the previous section. You will use this externalcalibration when you perform the PSD acquisition. If you donot obtain maximum mass accuracy for the precursor ionduring the PSD analysis, you will not obtain maximum massaccuracy for the fragment ions.
NOTE: This is not a PSD calibration that affects fragmention masses. It is an external calibration that is appliedbefore PSD analysis to ensure accurate mass of theprecursor.
Voyager™ Biospectrometry™ Workstation User’s Guide 8-15
Chapter 8 PSD Analysis
8
1. Click in the Instrument Control Panel toolbar to openthe precursor ion data file in the Data Explorersoftware.
2. Create a single-point calibration using the precursor ionmass and save the calibration file asPRECURSOR_UNKNOWN.CAL by exporting thecalibration constants from the data file.
You may need to add the mass for the unknown to yourcalibration reference file before creating thesingle-point calibration.
For more information, see the Data Explorer SoftwareUser’s Guide, Section 5.3.2, Manually Calibrating.
Setting PSDAcquisitionparameters
1. Open the Angiotensin_PSD.BIC file provided with thesoftware. This is a PSD mode .BIC file.
2. In the Calibration section of the Instrument Settingscontrol page, select:
• The matrix you are using.
• External File, then select thePRECURSOR_UNKNOWN.CAL file you createdfor the unknown in “Generating an externalcalibration for the unknown precursor ion” onpage 8-15.
3. In the PSD Acquisition Settings control page:
• Type the accurate Precursor mass.
• In the Calibration section, select External File,then select the he ANGIO_PSD.CAL file youcreated in “Generating a PSD calibration” onpage 8-13.
4. Select Save Instrument Settings As from the File menu,then save the instrument setting file with a new name.
8-16 Applied Biosystems
PSD Quick Start
8
Acquiring PSDsegments
1. In the Manual Laser Intensity/Sample Positioningcontrol page, select the same sample position fromwhich you acquired the precursor spectrum.
2. From the View menu, select Data Storage. Setparameters as needed. See “Setting Data Storageparameters” on page 6-14, for information.
Hint: Include a _PSD suffix when you name PSD datafiles to help you distinguish them from non-PSD datafiles. For example, if you type in Experiment1_PSD asthe file name, the complete data file name will beExperiment1_PSD.DAT orExperiment1_PSD_0001.DAT (if Autosequence FileNames is enabled).
Selecting andacquiring a
segment
3. In the PSD Acquisition Settings control page, select therow (click the number box in the Segment column) thatcorresponds to the segment you want to acquire.
4. To start acquiring, select Start Acquisition from theAcquisition menu, or click .
5. Adjust laser intensity to optimize signal intensity. Youtypically need a higher laser intensity to optimize signalintensity for segments with lower Mirror Ratio settings.
The laser intensity needed for the first segment (thesegment with the highest Mirror Ratio setting) istypically 150 to 200 counts higher than the laserintensity used to acquire the reflector mode precursorspectrum, and increases with each segment.
Voyager™ Biospectrometry™ Workstation User’s Guide 8-17

Chapter 8 PSD Analysis
8
Examining andsaving the segment
6. Examine the spectrum to ensure that fragments areproduced.
7. If fragments are present, click in the toolbar to addthe segment to the .DAT file. After you save the segment,the Saved check box in the segment list is checked.
If the current spectrum does not contain significantfragment ion signal and you do not want to save thespectrum, reselect the row and reacquire the spectrum,or select a new row.
CAUTION
Save the current segment (if the data is acceptable)before starting to acquire the next segment. If you donot, you will lose the data for the current segment.
Selecting andacquiring
remainingsegments
8. Repeat step 3 through step 7 to collect remainingsegments.
NOTE: Segments are listed in the Data Explorersoftware in the order in which they are acquired. Ifsegments with duplicate Mirror Ratios are contained inthe file, the software uses the last acquired segmentwhen it generates the composite spectrum.
Stopping theexperiment
9. After you acquire all necessary segments, select StopExperiment from the Acquisition menu. The PSD data fileis closed.
You cannot view the PSD data file in the Data Explorersoftware until you stop the experiment.
CAUTION
If you stop an experiment without saving any segments,no .DAT file is created.
8-18 Applied Biosystems

PSD Quick Start
8
Confirming orinvestigatingfragment ion
identity
To confirm or investigate fragment ion identity, you can use thefollowing tools:
• If the peptide sequence is known—Use the IonFragmentation calculator in the Data Explorer software toapply fragment labels to the unknown compositespectrum.
For information, see the Data Explorer Software User’sGuide, Section 8.2, Applying Fragment Labels.
• If the peptide sequence is not known—Use thePeptide Fragmentation macro provided with the DataExplorer software to investigate the sequence in theunknown composite spectrum.
For information, see the Data Explorer Software User’sGuide, Appendix C, Data Explorer Toolbox (Visual BasicMacros).
Voyager™ Biospectrometry™ Workstation User’s Guide 8-19
Chapter 8 PSD Analysis
8
8.2 Overview of PSD Analysis
This section includes:
• Post-source decay analysis• Differences from regular analysis• Segments and composite spectra• PSD data files• Mass calculation for fragment ions• Optimizing the Precursor Ion Selector
NOTE: Analysis of post-source decay is available onVoyager-DE PRO and Voyager-DE STR workstations only.
Before you begin For successful analysis of post-source decay, you must befamiliar with the information in:
• Chapter 5, Optimizing Instrument Settings• Chapter 6, Acquiring Spectra from the Instrument Control
Panel
8.2.1 Post-Source Decay Analysis
What ispost-source
decay analysis?
You can obtain valuable structural information about a sampleby analyzing the fragment ions generated from the originalions in the flight tube. On a MALDI-TOF system, this is knownas post-source decay (PSD) analysis.
PSD analysis on the Voyager system is an acquisition methodtailored to the analysis of fragment ions. PSD mode allows youto better analyze ions that fragment in the flight tube byoptimizing the following settings:
• Mirror Ratio setting—Brings different mass ranges offragment ions into focus.
• Precursor Ion Selector—Selectively analyzes the ion ofinterest, without interference from other compounds.Specificity of ion selection is determined by the resolutionof the Precursor Ion Selector (also called Timed IonSelector) on your system. See Appendix A,Specifications, for more information.
8-20 Applied Biosystems
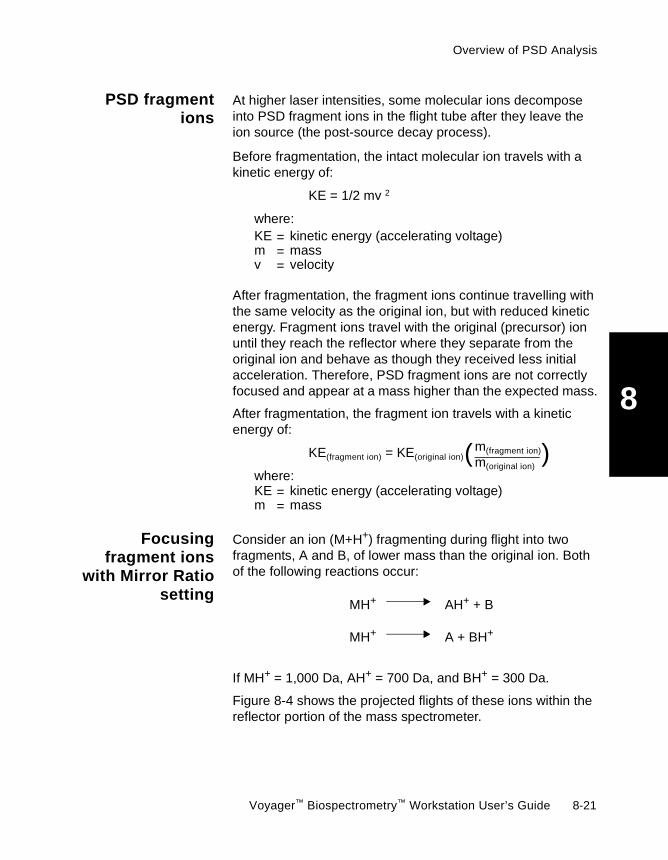
Overview of PSD Analysis
8
PSD fragmentions
At higher laser intensities, some molecular ions decomposeinto PSD fragment ions in the flight tube after they leave theion source (the post-source decay process).
Before fragmentation, the intact molecular ion travels with akinetic energy of:
After fragmentation, the fragment ions continue travelling withthe same velocity as the original ion, but with reduced kineticenergy. Fragment ions travel with the original (precursor) ionuntil they reach the reflector where they separate from theoriginal ion and behave as though they received less initialacceleration. Therefore, PSD fragment ions are not correctlyfocused and appear at a mass higher than the expected mass.
After fragmentation, the fragment ion travels with a kineticenergy of:
Focusingfragment ions
with Mirror Ratiosetting
Consider an ion (M+H+) fragmenting during flight into twofragments, A and B, of lower mass than the original ion. Bothof the following reactions occur:
If MH+ = 1,000 Da, AH+ = 700 Da, and BH+ = 300 Da.
Figure 8-4 shows the projected flights of these ions within thereflector portion of the mass spectrometer.
KE = 1/2 mv 2
where:KE = kinetic energy (accelerating voltage)m = massv = velocity
KE(fragment ion) = KE(original ion)
where:KE = kinetic energy (accelerating voltage)m = mass
m(fragment ion)
m(original ion)( )
MH+
MH+
AH+ + B
A + BH+
Voyager™ Biospectrometry™ Workstation User’s Guide 8-21

Chapter 8 PSD Analysis
8
Figure 8-4 Molecular and Fragment Ion Flight in the Reflector
The AH+ fragment has 70 percent of the kinetic energy of theMH+ ion and the BH+ ion has 30 percent. With a Mirror Ratiosetting of 1.0000, ions with lower kinetic energy are reflectedquickly and are not focused by the mirror.
Fragment ions with a lower energy than that of the precursorion can be focused by adjusting the voltage applied to themirror. Mirror Voltage is equal to:
You adjust the Mirror Voltage by decreasing the Mirror Ratio.This adjusts the field strength of the mirror, and allows lowerenergy ions to travel farther into the reflector portion of themass spectrometer and be better focused (Figure 8-5).
Reflector
fromion
Mirror Ratio = 1.00MH+ (MW 1,000) correctly focusedAH+ (MW 700) poorly focusedBH+ (MW 300) poorly focused
MH+
AH+
BH+
source
= MirrorRatio
Mirror to AcceleratingVoltage Ratio
AcceleratingVoltage
xxMirrorVoltage
where:
Mirror Ratio is the value you set in PSD Acquisition Settings to focus
Mirror to Accelerating Voltage Ratio is a value set in the Advanced tab
unless instructed to do so by Applied Biosystems.
Accelerating Voltage is the value you set in Instrument Settings.
fragment ions.
of Mode/Digitizer settings in Instrument Settings to adjust thevoltage of the mirror to reflect intact ions. Do not change this value
8-22 Applied Biosystems
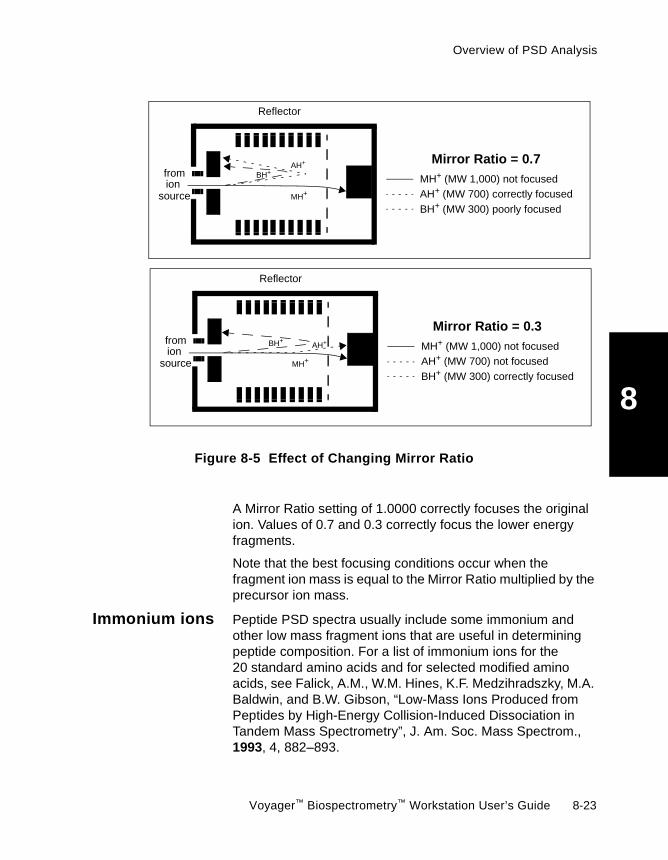
Overview of PSD Analysis
8
Figure 8-5 Effect of Changing Mirror Ratio
A Mirror Ratio setting of 1.0000 correctly focuses the originalion. Values of 0.7 and 0.3 correctly focus the lower energyfragments.
Note that the best focusing conditions occur when thefragment ion mass is equal to the Mirror Ratio multiplied by theprecursor ion mass.
Immonium ions Peptide PSD spectra usually include some immonium andother low mass fragment ions that are useful in determiningpeptide composition. For a list of immonium ions for the20 standard amino acids and for selected modified aminoacids, see Falick, A.M., W.M. Hines, K.F. Medzihradszky, M.A.Baldwin, and B.W. Gibson, “Low-Mass Ions Produced fromPeptides by High-Energy Collision-Induced Dissociation inTandem Mass Spectrometry”, J. Am. Soc. Mass Spectrom.,1993, 4, 882–893.
Reflector
fromion
Mirror Ratio = 0.7MH+ (MW 1,000) not focusedAH+ (MW 700) correctly focusedBH+ (MW 300) poorly focused
MH+
AH+
BH+
source
Reflector
fromion
Mirror Ratio = 0.3MH+ (MW 1,000) not focusedAH+ (MW 700) not focusedBH+ (MW 300) correctly focused
MH+
AH+BH+
source
Voyager™ Biospectrometry™ Workstation User’s Guide 8-23

Chapter 8 PSD Analysis
8
8.2.2 Differences From Regular Analysis
When operating in PSD mode, note the following differencesfrom analysis in non-PSD mode:
• Higher laser intensity—In non-PSD mode, you use alaser intensity that yields acceptable performance withoutfragmentation. You need a higher laser intensity togenerate PSD fragments.
• Higher Grid Voltage% and shorter Delay Time—Ahigher Grid Voltage% and shorter Delay Time generatesa sharper ion packet at the position of the Precursor IonSelector, and improves fragment ion resolution.
• Sample consumed more quickly—Higher laserintensities ionize and consume sample more quickly thanlower laser intensities used in non-PSD mode.
• Different calibration used—PSD analysis uses adifferent calibration function to correctly determine themasses of PSD fragment ions. For information, seeSection 8.2.5, Mass Calculation for Fragment Ions.
• Acquisition of multiple spectra at different MirrorRatio settings to create a single compositespectrum—To correctly focus fragments with differentmass ranges, collect PSD segment spectra with differentMirror Ratio settings. The Data Explorer software“stitches” the segments together to create a compositespectrum. For information, see the Data ExplorerSoftware User’s Guide, Chapter 8, ViewingVoyager PSD Data.
8-24 Applied Biosystems
Overview of PSD Analysis
8
8.2.3 Segments and Composite Spectra
Overview To obtain the most information about an ion, collect fragmention spectra across a molecular weight range from the mass ofthe original precursor ion down to 50 Da (determined by thedesire to see immonium ions that indicate the presence ofindividual amino acids).
Each fragment ion spectrum is referred to as a segment, andis collected with a discrete focusing region (controlled by theMirror Ratio setting). Segments are combined to generate acomposite spectrum.
Number ofsegments
The number of PSD segments you must collect depends onthe quality of data needed. The PSD software allows you tocollect any number of segments. A larger number of fragmentspectra generally yield better resolution in the compositespectrum. For more information, see Section 8.4.2,Determining the Number of Segments to Acquirefor a Complete Composite Spectrum.
Compositespectrum
When you view the PSD data in the Data Explorer software,the software automatically assembles or “stitches” togetherthe best portions of fragment ion spectra (referred to as PSDsegments) to generate the full composite PSD spectrum.
Voyager™ Biospectrometry™ Workstation User’s Guide 8-25
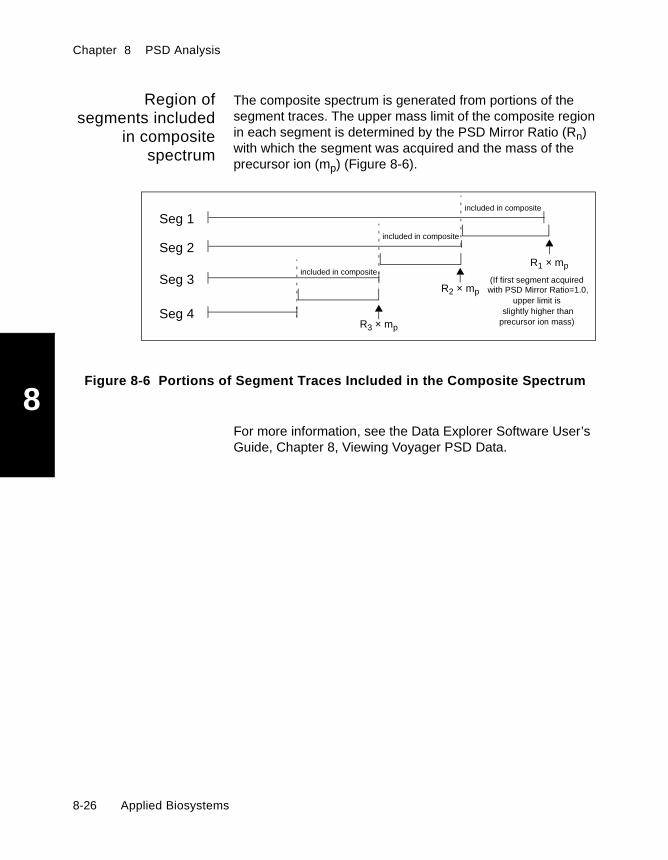
Chapter 8 PSD Analysis
8
Region ofsegments included
in compositespectrum
The composite spectrum is generated from portions of thesegment traces. The upper mass limit of the composite regionin each segment is determined by the PSD Mirror Ratio (Rn)with which the segment was acquired and the mass of theprecursor ion (mp) (Figure 8-6).
Figure 8-6 Portions of Segment Traces Included in the Composite Spectrum
For more information, see the Data Explorer Software User’sGuide, Chapter 8, Viewing Voyager PSD Data.
Seg 1
Seg 2
Seg 3
Seg 4
R1 × mp
included in composite
R2 × mp
included in composite
R3 × mp
included in composite(If first segment acquired
with PSD Mirror Ratio=1.0,upper limit is
slightly higher thanprecursor ion mass)
8-26 Applied Biosystems

Overview of PSD Analysis
8
8.2.4 PSD Data Files
PSD data (.DAT) files (Figure 8-7) include:
• Precursor ion mass• All segments acquired during a PSD experiment• Composite spectrum
Segments are stored in the data file in the order in which theyare collected.
Figure 8-7 PSD .DAT File Structure
Results
PSD Segment 1
PSD Segment 2
PSD Segment 3
PSD Composite
Raw data
PSD .DAT File
Precursor ion mass
Voyager™ Biospectrometry™ Workstation User’s Guide 8-27

Chapter 8 PSD Analysis
8
8.2.5 Mass Calculation for Fragment Ions
PSD calibrationequation
PSD calibration specifies the mass of a fragment ion as afunction of:
• Mass and flight time of the precursor ion• Mirror Ratio setting• α, β, and γ calibration constants
The equation that the Voyager software uses to calculate themass for fragment ions is shown below:
Default PSDcalibration
If you select default PSD calibration, the Voyager softwareuses the calibration equation above and substitutes thefollowing values for calibration constants:
• α —Calculates from instrument geometry• β and γ—Uses zero (0)
where:
tp
mp
α, β, γ
tf Fragment ion flight time
mf Fragment ion mass
Calibration constants=
=
=
=
Ri = Mirror Ratio
=
mf = (α Ri + β) [(tf – tp) + γ (tf – tp)2] +α Ri + βα + β mp
Precursor mass entered in Instrument Settings (see page 8-45)
Precursor ion flight time (at Ri = 1), calculated using the standardcalibration equation (described on page 6-9)
8-28 Applied Biosystems

Overview of PSD Analysis
8
8.2.6 Optimizing the Precursor Ion Selector
The Precursor Ion Selector (called Timed Ion Selector inReflector mode) allows you to analyze the ion of interest bydeflecting ions until the time that corresponds to the mass ofthe ion of interest. At the time that corresponds to the mass ofthe ion of interest, the Precursor Ion Selector voltage is turnedoff, and the ion of interest passes to the reflector. After the ionpasses through, voltage is turned on again in the ion selector.
NOTE: Leave the Precursor Ion Selector enabled whenperforming PSD analysis. The only time you may want todisable the Precursor Ion Selector is to determine if it isworking.
The width of the mass window in which the Precursor IonSelector voltage is turned off is determined by the DeflectorGate Width parameter. The Deflector Gate Width is optimizedfor your system when your system is installed. However, youcan increase or decrease the selectivity of the Precursor IonSelector by decreasing or increasing the Deflector Gate Widthsetting.
CAUTION
Do not alter the Timed Ion Selector parameters unlessinstructed to do so by an Applied Biosystems TechnicalRepresentative. Altering these settings may cause yourVoyager Biospectrometry Workstation to functionimproperly. Before changing the Deflector Gate Widthsetting, write down the current setting. This setting hasbeen optimized for your system and you may want to resetto the optimized value.
Smaller width values provide narrower Precursor Ion Selectorresolution. If you set the width too low, fragment ion yield iscompromised due to product ion dispersion that occurs asions travel down the flight tube.
Voyager™ Biospectrometry™ Workstation User’s Guide 8-29

Chapter 8 PSD Analysis
8
To change the width setting, select Hardware Configurationfrom the Instrument menu in the Instrument Control Panel,then click the Timed Ion Selector tab (Figure 8-8).
Figure 8-8 Timed Ion Selector Tab in HardwareConfiguration Dialog Box
Set the Deflector Gate Width as needed. A lower settingincreases specificity, but may decrease sensitivity.
CAUTION
Do not change the Flight Length to Deflector parameter.This parameter is optimized for your system.
8-30 Applied Biosystems

Enhancing Fragmentation with CID
8
8.3 EnhancingFragmentation with CID
Overview Collision-induced dissociation (CID) is a technology thatenhances fragmentation in Post-Source Decay (PSD)analysis. CID is available as an option on theVoyager-DE PRO and Voyager-DE STR workstations.
The CID option includes:
• A 0.5 cc cylindrical cell (collision cell) in the ion sourceregion connected to the grounded aperture
• External CID box with valves to control CID gas flow
Figure 8-9 shows the plumbing of the CID option.
Figure 8-9 CID Option Plumbing
When supplied with gas, the collision cell has a higherpressure than the source. As ions leave the source, they passthrough the collision cell and interact with the collision gasmolecules. Energy is transferred to the ions and fragmentationis enhanced.
Mainsource
(high-vacuum)
Turbopump 1
chamber External gas sourceor atmosphere
Gridsin source
Collisioncell
CIDbox
To Fore pump
Flight tube
3-way
Meteringvalve
valve
Purge line
Gas inletline
Voyager™ Biospectrometry™ Workstation User’s Guide 8-31

Chapter 8 PSD Analysis
8
Benefits The benefits provided by CID include:
• Fragmentation of ions that does not occur under normalPSD conditions
• Side chain fragmentation that may allow you todistinguish between Leucine and Isoleucine isomers
• Greater number of immonium ions generated for peptideanalysis
Figure 8-10 and Figure 8-11 are sample spectra from low andmid mass ranges that illustrate the impact of CID gas.
Figure 8-10 Low Masses—Impact of CID (Angiotensin I)
In the top trace (CID off), typical fragments are seen andlabeled.
In the bottom trace (CID on), fragments not seen without CID,or fragments that are significantly enhanced with CID, arelabeled.
CID off
CID on, enhanced peakslabeled
8-32 Applied Biosystems

Enhancing Fragmentation with CID
8
Figure 8-11 Mid Masses—Impact of CID (Glu-1-Fibrinopeptide)In the top trace (CID off), typical fragments are seen andlabeled.
In the bottom trace (CID on), w fragments1 not seen withoutCID are labeled.
Gas requirements You can use room air, helium, argon, or xenon as the collisiongas.
If you are using a compressed gas source, regulate the gassource between 2 and 5 psi.
CID off
CID on, enhanced peaks labeled
1. Meth. Enzymol., McCloskey, J.A, ed., 1990, 193, 886.
Voyager™ Biospectrometry™ Workstation User’s Guide 8-33

Chapter 8 PSD Analysis
8
Purging collisiongas lines
Before turning on the collision gas, purge the lines to preventdisruption of the vacuum.
CAUTION
If you do not purge the lines, the CID gas introduction mayincrease the pressure in the vacuum and cause an Interlockerror.
Perform the following procedure if the CID gas has been off formore than 15 minutes:
1. Observe the vacuum gauge, and allow the pressure onBA1 (Source Chamber pressure) to reach the typicalpressure listed below:
2. Turn the top 3-way valve on the CID box to the Purge Cellposition for 1 to 2 seconds.
3. Turn the top 3-way valve to the Gas Inlet position for1 second, then turn immediately to the Purge Cellposition.
4. Observe BA1 on the vacuum gauge panel.
5. When BA1 reads approximately 1 × 10⁻⁶ Torr, turn the top3-way valve to the Gas Inlet position for 2 seconds, thenturn immediately to the Purge Cell position.
6. Observe BA1 on the vacuum gauge panel.
7. When BA1 reads approximately 1 × 10⁻⁶ Torr, turn the top3-way valve to the Gas Inlet position for 3 seconds, thenturn immediately to the Purge Cell position.
At this point, the lines should be purged. If pressure isgreater than 2 × 10⁻⁶ Torr, repeat step 7.
8. Turn the top 3-way valve to the Gas Inlet position, thenturn on the collision gas as described on page 8-35.
Model Pressure
Voyager-DE PRO ~8×10⁻⁷ Torr
Voyager-DE STR ~2×10⁻⁷ Torr
8-34 Applied Biosystems
Enhancing Fragmentation with CID
8
Turning oncollision gas
To turn on the collision gas after purging:
1. If the metering valve on the side of the CID box is set atzero, turn the metering valve approximately 1/4 turn.
If the metering valve is not set at zero, do not turn thevalve.
2. Wait 1 to 2 minutes for BA1 on the vacuum gauge panel tostabilize at 3 × 10⁻⁶ Torr, or at the optimum pressure forCID operation that you have determined and recorded foryour system.
3. If the pressure is lower than the optimum, turn themetering valve one notch clockwise to a higher setting.Wait for BA1 to stabilize at the optimum pressure.
If the pressure is higher than the optimum, turn themetering valve one notch counterclockwise to a lowersetting. Turn the top 3-way valve to the Purge Cellposition, then to the Gas Inlet position. Wait for BA1 tostabilize at the optimum pressure.
4. Continue adjusting the metering valve until BA1 is stableat the optimum pressure.
NOTE: If BA1 is below the optimum pressure whenusing a compressed gas supply, and you cannotincrease the pressure by turning the metering valveclockwise to a higher setting, make sure the gas supplyis regulated to 2 to 5 psi.
Voyager™ Biospectrometry™ Workstation User’s Guide 8-35
Chapter 8 PSD Analysis
8
Turning offcollision gas
To turn off the collision gas:
1. Turn the top 3-way valve on the CID box to the PurgeCell position.
2. Wait approximately 20 seconds for the gas to evacuate.
3. Turn the top 3-way valve on the CID box to the Offposition.
Adjustingcollision gas
To optimize fragmentation, adjust the flow of the collision gas.Turn the metering valve on the CID box until you observe thedesired fragmentation.
If gas pressure is too high, signal is suppressed. If gaspressure is too low, you will not obtain the desiredfragmentation.
Adjusting GuideWire Voltage%
When using the CID option, you may observe enhancedperformance by increasing the Guide Wire Voltage% abovethe setting used for PSD analysis without CID.
NOTE: Guide Wire Voltage% is not available onVoyager-DE STR models with serial number 4154 and later.
8-36 Applied Biosystems
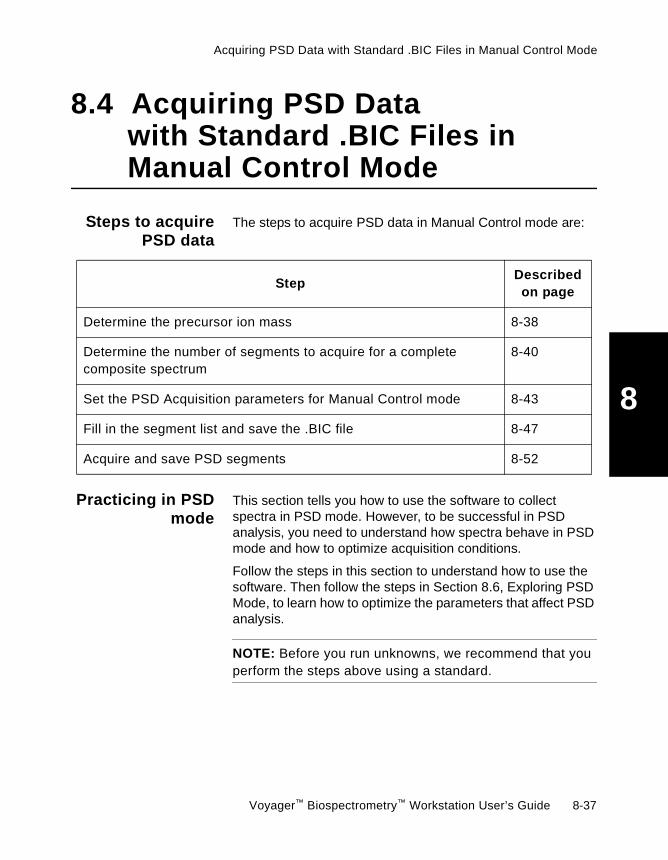
Acquiring PSD Data with Standard .BIC Files in Manual Control Mode
8
8.4 Acquiring PSD Datawith Standard .BIC Files inManual Control Mode
Steps to acquirePSD data
The steps to acquire PSD data in Manual Control mode are:
Practicing in PSDmode
This section tells you how to use the software to collectspectra in PSD mode. However, to be successful in PSDanalysis, you need to understand how spectra behave in PSDmode and how to optimize acquisition conditions.
Follow the steps in this section to understand how to use thesoftware. Then follow the steps in Section 8.6, Exploring PSDMode, to learn how to optimize the parameters that affect PSDanalysis.
NOTE: Before you run unknowns, we recommend that youperform the steps above using a standard.
StepDescribedon page
Determine the precursor ion mass 8-38
Determine the number of segments to acquire for a completecomposite spectrum
8-40
Set the PSD Acquisition parameters for Manual Control mode 8-43
Fill in the segment list and save the .BIC file 8-47
Acquire and save PSD segments 8-52
Voyager™ Biospectrometry™ Workstation User’s Guide 8-37

Chapter 8 PSD Analysis
8
8.4.1 Determining the Precursor Ion Mass
Overview Before beginning an analysis in PSD mode:
• Generate a precursor spectrum in Reflector mode todetermine the mass of the precursor ion. A Reflectormode analysis provides optimum resolution and massaccuracy.
• Generate an external calibration for the precursor ion touse during the PSD acquisition.
Generating theprecursorspectrum
To generate the precursor spectrum:
1. Open the PSD_Precursor.BIC file provided with thesoftware. This is a reflector mode instrument settings(.BIC) file. All other settings should be identical to thesettings in the PSD mode .BIC you will use to acquiresegments.
2. Modify the mass range and optimize other parameters asneeded. See Chapter 5, Optimizing Instrument Settings.
3. In the Calibration section of the Instrument Settingscontrol page, select the matrix you are using. See“Calibration” on page 5-20.
4. From the View menu, select Data Storage. Setparameters as needed. See “Setting Data Storageparameters” on page 6-14.
5. In the Manual Laser Intensity/Sample Positioning Controlpage, select the sample to acquire. See “Selecting sampleposition and laser intensity” on page 6-13.
6. To start acquiring, select Start Acquisition from theAcquisition menu, or click .
7. Acquire the spectrum using a laser intensity that does notgenerate fragments.
8. Save the data file by clicking .
8-38 Applied Biosystems

Acquiring PSD Data with Standard .BIC Files in Manual Control Mode
8
The precursor spectrum is displayed in the Currenttrace in the Spectrum window, and the .DAT file issaved in the directory specified.
Generating anexternal
calibration for theprecursor ion
To obtain maximum mass accuracy for the precursor ion,generate an external calibration file that you will use when youperform the PSD acquisition. This external calibration is usedto determine the tp value (precursor ion flight time) needed forthe PSD calibration equation (described on page 8-28). The tpvalue is determined using the standard calibration equation(“t” in the standard equation described on page 6-9).
NOTE: The calibration you specify on the Instrument SettingsControl page is used to determine the tp value (precursor ionflight time) needed for the PSD calibration equation (describedon page 8-28). The tp value is determined using the standardcalibration equation (“t” in the standard equation describedon page 6-9). You will also specify an external PSDcalibration below, which is used to determine the values forα , β , and γ needed for the PSD calibration equation.
To generate the calibration:
1. Open the precursor spectrum data file in the DataExplorer software.
2. Create a single-point calibration using the precursor ionmass. For more information, see the Data ExplorerSoftware User’s Guide, Chapter 5.3.2, ManuallyCalibrating.
3. Save the calibration file (.CAL) by exporting the calibrationconstants from the data file. For more information, see theData Explorer Software User’s Guide, “Exporting .BIC,.MSM, and .CAL files” on page 1-36.
Voyager™ Biospectrometry™ Workstation User’s Guide 8-39

Chapter 8 PSD Analysis
8
8.4.2 Determining theNumber of Segments to Acquirefor a Complete Composite Spectrum
This section includes:
• Resolution and the number of segments• Decrement ratio• Default Mirror Ratio settings• Size of segments• Default number of segments• Acquiring only select segments
Resolution andthe number of
segments
If you are interested in a complete composite spectrum, thenumber of segments you need to acquire is determined by:
• Resolution you require• Mass range of interest
You see better resolution in the composite spectrum with moresegments.
NOTE: If you are interested in selected fragment massesonly (instead of a complete composite spectrum), see“Acquiring only select segments” on page 8-42.
Use the following equation to determine the number ofsegments to acquire:
where:
D
mf Fragment ion mass of the lowest mass of interest
Decrement Ratio, which determines the size of the segment=
=
n = Number of segmentsmp Precursor ion mass=
n ≈ ln (mf / mp)
lnD
8-40 Applied Biosystems
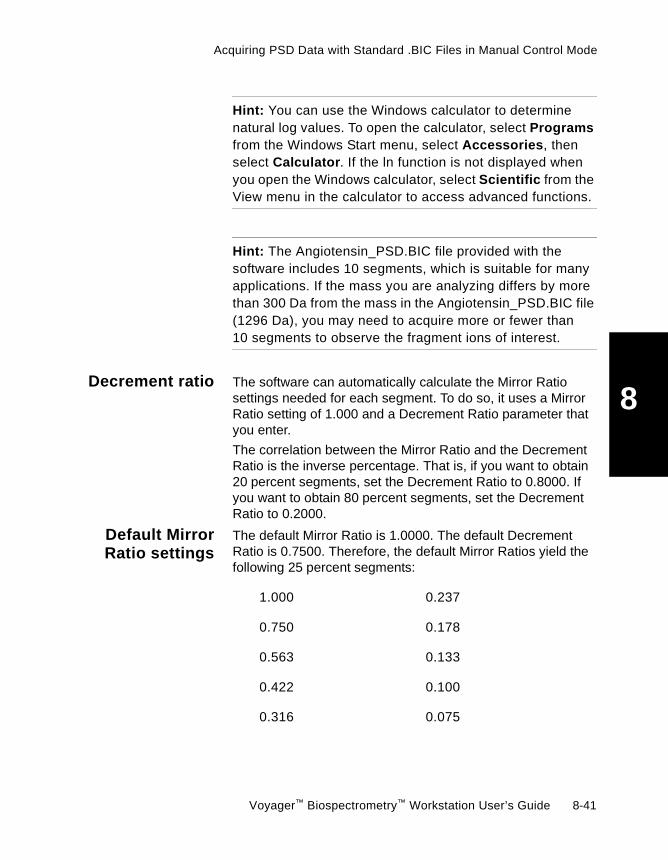
Acquiring PSD Data with Standard .BIC Files in Manual Control Mode
8
Hint: You can use the Windows calculator to determinenatural log values. To open the calculator, select Programsfrom the Windows Start menu, select Accessories, thenselect Calculator. If the ln function is not displayed whenyou open the Windows calculator, select Scientific from theView menu in the calculator to access advanced functions.
Hint: The Angiotensin_PSD.BIC file provided with thesoftware includes 10 segments, which is suitable for manyapplications. If the mass you are analyzing differs by morethan 300 Da from the mass in the Angiotensin_PSD.BIC file(1296 Da), you may need to acquire more or fewer than10 segments to observe the fragment ions of interest.
Decrement ratio The software can automatically calculate the Mirror Ratiosettings needed for each segment. To do so, it uses a MirrorRatio setting of 1.000 and a Decrement Ratio parameter thatyou enter.
The correlation between the Mirror Ratio and the DecrementRatio is the inverse percentage. That is, if you want to obtain20 percent segments, set the Decrement Ratio to 0.8000. Ifyou want to obtain 80 percent segments, set the DecrementRatio to 0.2000.
Default MirrorRatio settings
The default Mirror Ratio is 1.0000. The default DecrementRatio is 0.7500. Therefore, the default Mirror Ratios yield thefollowing 25 percent segments:
1.000 0.237
0.750 0.178
0.563 0.133
0.422 0.100
0.316 0.075
Voyager™ Biospectrometry™ Workstation User’s Guide 8-41

Chapter 8 PSD Analysis
8
Increase the Decrement Ratio to collect smaller segments.Decrease the Decrement Ratio to collect larger segments.
Size of segments You can acquire segments of different sizes by varying theMirror Ratio setting. For example, you can set the first MirrorRatio to collect a 20 percent segment, then set the next MirrorRatio to collect a 10 percent segment. If you change thedefault Decrement Ratio, fill-down subsequent existing rows,and the Mirror Ratio values are automatically recalculated.Fill-down is described in “Using the Fill Down function” onpage 8-50.
Default number ofsegments
The standard instrument settings (.BIC) file provided with thesoftware, Angiotensin_PSD.BIC, is set to acquire10 segments with the Mirror Ratios listed in “Default MirrorRatio settings” on page 8-41. These settings are adequatefor many applications.
You can add or delete segments, or change the Mirror Ratiofor a segment as needed.
Acquiring onlyselect segments
The PSD software allows complete flexibility in the way youacquire and process PSD data. You are not required toacquire a complete set of PSD segments. If you are interestedin specific fragment masses only, you can acquire only thenumber of segments you are interested in by using MirrorRatio settings that focus the fragment ion masses of interest.
Hint: The best focusing conditions occur when the fragmention mass is equal to the Mirror Ratio multiplied by theprecursor ion mass (equal to the Max Stitch Mass).
When you type in a Mirror Ratio (described in Section 8.4.4,Filling in the Segment List and Saving the .BIC File), observethe Max Stitch Mass displayed. This value reflects themaximum mass of the segment that will be included in thecomposite spectrum. (The mass range included in thesegment is approximately 15 percent higher than the MaxStitch Mass.)
8-42 Applied Biosystems
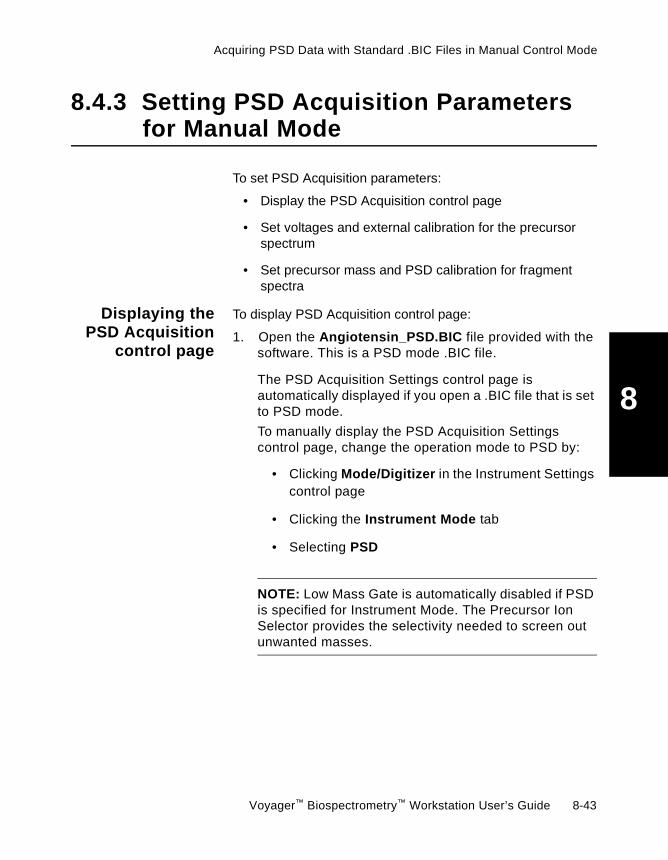
Acquiring PSD Data with Standard .BIC Files in Manual Control Mode
8
8.4.3 Setting PSD Acquisition Parametersfor Manual Mode
To set PSD Acquisition parameters:
• Display the PSD Acquisition control page
• Set voltages and external calibration for the precursorspectrum
• Set precursor mass and PSD calibration for fragmentspectra
Displaying thePSD Acquisition
control page
To display PSD Acquisition control page:
1. Open the Angiotensin_PSD.BIC file provided with thesoftware. This is a PSD mode .BIC file.
The PSD Acquisition Settings control page isautomatically displayed if you open a .BIC file that is setto PSD mode.
To manually display the PSD Acquisition Settingscontrol page, change the operation mode to PSD by:
• Clicking Mode/Digitizer in the Instrument Settingscontrol page
• Clicking the Instrument Mode tab
• Selecting PSD
NOTE: Low Mass Gate is automatically disabled if PSDis specified for Instrument Mode. The Precursor IonSelector provides the selectivity needed to screen outunwanted masses.
Voyager™ Biospectrometry™ Workstation User’s Guide 8-43

Chapter 8 PSD Analysis
8
2. If the PSD Acquisition Settings control page (Figure 8-12)is not displayed, select PSD Acquisition from the Viewmenu.
Figure 8-12 PSD Acquisition Settings Control Page—Manual Mode
NOTE: The Precursor Ion Selector in PSD mode is thesame parameter as the Timed Ion Selector in Reflectormode. If you change the Precursor mass used by thePrecursor Ion Selector in PSD mode, the massspecified for the Timed Ion Selector in Reflector modealso changes.
Setting voltagesand external
calibration for theprecursorspectrum
3. For optimum mass accuracy, change the AcceleratingVoltage and Grid Voltage% (on the Instrument Settingscontrol page) to the values you used to acquire theprecursor spectrum and to generate the calibration.
NOTE: If you use different voltage settings(Accelerating Voltage, Grid Voltage, or Delay Time) toacquire the precursor spectrum, generate thecalibration, and acquire the fragment spectra, thesoftware compensates for the different settings.However, using different voltage settings may not yieldoptimum mass accuracy.
8-44 Applied Biosystems

Acquiring PSD Data with Standard .BIC Files in Manual Control Mode
8
4. In the Calibration section of the Instrument Settingscontrol page, select the matrix you are using and the .CALfile you created in “Generating an external calibration forthe precursor ion” on page 8-39.
NOTE: The calibration you specify on the InstrumentSettings control page is used to determine the tp value(precursor ion flight time) needed for the PSD calibrationequation (described on page 8-28).The tp value isdetermined using the standard calibration equation (“t”in the standard equation described on page 6-9). Youwill also specify an external PSD calibration below,which is used to determine the values for α , β , and γneeded for the PSD calibration equation.
NOTE: If default calibration yields acceptable massaccuracy for your application, an external calibration isnot required.
Setting precursormass and PSDcalibration for
fragment spectra
5. In the PSD Acquisition Settings control page, type thePrecursor mass.
NOTE: Precursor mass is used for PSD calibration.Type in an accurate value with appropriate precision(for example, type 1296.68, not 1297).
6. Select Precursor Ion Selector if it is not alreadyselected.
NOTE: Leave the Precursor Ion Selector enabled whenperforming PSD analysis. The only time you may wantto disable the Precursor Ion Selector is to determine if itis working.
Voyager™ Biospectrometry™ Workstation User’s Guide 8-45
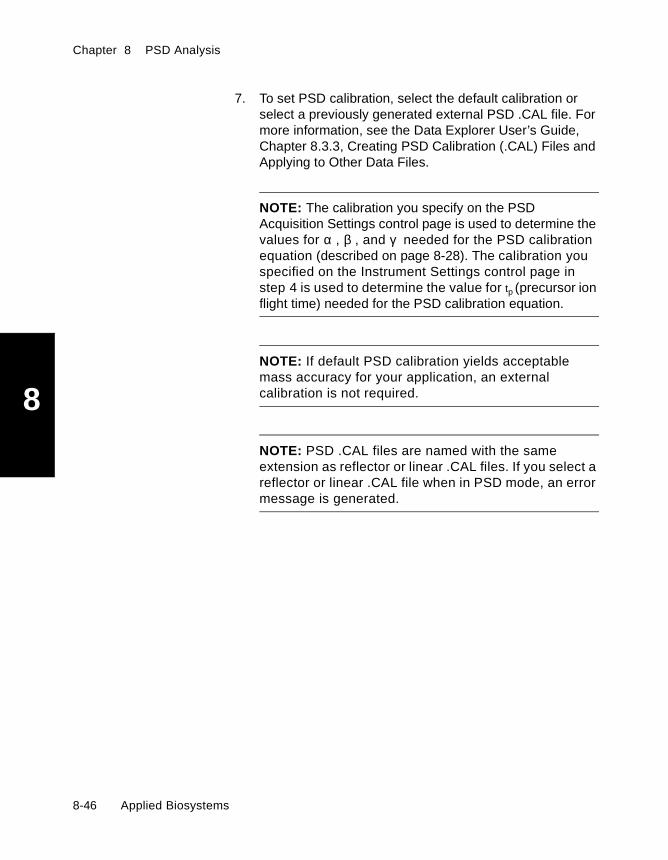
Chapter 8 PSD Analysis
8
7. To set PSD calibration, select the default calibration orselect a previously generated external PSD .CAL file. Formore information, see the Data Explorer User’s Guide,Chapter 8.3.3, Creating PSD Calibration (.CAL) Files andApplying to Other Data Files.
NOTE: The calibration you specify on the PSDAcquisition Settings control page is used to determine thevalues for α , β , and γ needed for the PSD calibrationequation (described on page 8-28). The calibration youspecified on the Instrument Settings control page instep 4 is used to determine the value for tp (precursor ionflight time) needed for the PSD calibration equation.
NOTE: If default PSD calibration yields acceptablemass accuracy for your application, an externalcalibration is not required.
NOTE: PSD .CAL files are named with the sameextension as reflector or linear .CAL files. If you select areflector or linear .CAL file when in PSD mode, an errormessage is generated.
8-46 Applied Biosystems

Acquiring PSD Data with Standard .BIC Files in Manual Control Mode
8
8.4.4 Filling in the Segment Listand Saving the .BIC File
This section describes:
• Filling in the list• Typing or selecting new values• Using the Fill Down command• Adding or deleting rows• Saving the .BIC file
Filling in the list To fill in the segment list:
If you are usingAngiotensin_PSD.
BIC
1. If you are using the standard instrument settings (.BIC)file provided with the software, Angiotensin_PSD.BIC,the segment list contains 10 segments with the MirrorRatio settings listed in “Default Mirror Ratio settings” onpage 8-41.
If the precursor ion mass you are analyzing differs bymore than 300 Da from the mass in theAngiotensin_PSD.BIC (1296 Da), you may need toacquire more or fewer than 10 segments to observe thefragment ions of interest. You can add or deletesegments, or change the Mirror Ratio for a segment asneeded.
If you are creatinga new .BIC file
If you are creating a new .BIC file, click to add therequired number of rows for the number or segments toacquire. For more information, see Section 8.4.2,Determining the Number of Segments to Acquirefor a Complete Composite Spectrum.
Rows are added with the default values listed inTable 8-4 for all columns.
Voyager™ Biospectrometry™ Workstation User’s Guide 8-47
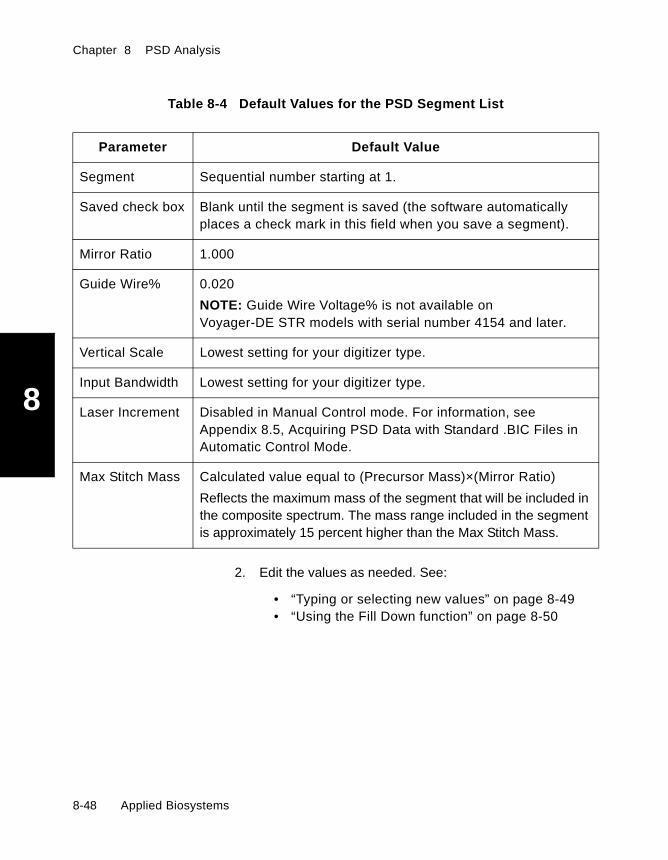
Chapter 8 PSD Analysis
8
2. Edit the values as needed. See:
• “Typing or selecting new values” on page 8-49• “Using the Fill Down function” on page 8-50
Table 8-4 Default Values for the PSD Segment List
Parameter Default Value
Segment Sequential number starting at 1.
Saved check box Blank until the segment is saved (the software automaticallyplaces a check mark in this field when you save a segment).
Mirror Ratio 1.000
Guide Wire% 0.020
NOTE: Guide Wire Voltage% is not available onVoyager-DE STR models with serial number 4154 and later.
Vertical Scale Lowest setting for your digitizer type.
Input Bandwidth Lowest setting for your digitizer type.
Laser Increment Disabled in Manual Control mode. For information, seeAppendix 8.5, Acquiring PSD Data with Standard .BIC Files inAutomatic Control Mode.
Max Stitch Mass Calculated value equal to (Precursor Mass)×(Mirror Ratio)
Reflects the maximum mass of the segment that will be included inthe composite spectrum. The mass range included in the segmentis approximately 15 percent higher than the Max Stitch Mass.
8-48 Applied Biosystems

Acquiring PSD Data with Standard .BIC Files in Manual Control Mode
8
Guidelines forGuide Wire
Voltage%, VerticalScale, and Input
Bandwidth
As a general guideline when setting Guide WireVoltage%, Vertical Scale, and Input Bandwidth, usedecreasing values to compensate for decreasing ionenergy seen at lower Mirror Ratios. You need toexperiment to determine the optimum values for thesesettings at lower Mirror Ratios.
NOTE: Guide Wire Voltage% is not available onVoyager-DE STR models with serial number 4154 andlater.
Typing orselecting new
values
To type or select new values in the segment list:
1. Type in new values for Mirror Ratio or Guide Wire% inany row in the table. You can specify Mirror Ratios inany order in the table.
NOTE: When you click the Mirror Ratio field, the entryis displayed with more than 3-digit precision, which isthe precision used to calculate the mass range for thesegment during the analysis.
You can specify the same Mirror Ratio for multiplesegments if needed. When the composite spectrum isgenerated, the software uses the most recentlyacquired segment if duplicate Mirror Ratios are present.
Observe the Max Stitch Mass when you type a MirrorRatio. Optimum focus and resolution is achieved forfragment ions close to this mass.
2. To select new values for Vertical Scale or InputBandwidth, click the cell.
A drop-down list of values appropriate for your systemis displayed. Select a value.
Voyager™ Biospectrometry™ Workstation User’s Guide 8-49

Chapter 8 PSD Analysis
8
Using the FillDown function
To use the Fill Down function:
1. If you want the Fill Down function to calculate values forMirror Ratio and Guide Wire% (instead of copying thevalue from the first row), set the following in the MirrorRatio/Guide Wire% Fill Down section:
• Decrement Ratio—To calculate the needed MirrorRatios. For more information, see “Decrementratio” on page 8-41. Increase this value to createsmaller segments. Decrease this value to createlarger segments.
• Guide Wire% Tracks Mirror Ratio (not availableon Voyager-DE STR models with serial number4154 and later)—If you want to automaticallyadjust the Guide Wire% settings according to theMirror Ratio setting.
NOTE: Do not select Guide Wire% Tracks MirrorRatio option on Voyager-DE PRO or Voyager-DESTR systems. This parameter is for use with oldersystems only.
2. Type in values in any row that you want to fill down intoselected rows.
3. Click on the Segment number to select the rowcontaining the values to fill down.
4. Click . The following occurs:
• The Mirror Ratio is calculated and entered in allrows below. If no Decrement Ratio is specified, thevalue from the first cell is copied to selected cellsbelow.
NOTE: If you selected Guide Wire% Tracks MirrorRatio, Guide Wire% is also calculated and filled in.
8-50 Applied Biosystems

Acquiring PSD Data with Standard .BIC Files in Manual Control Mode
8
• The information in the first row of remainingcolumns is copied to all rows below.
• The Max Stitch Mass is calculated and displayedfor each row.
• Any rows for segments that have already beensaved are skipped.
Adding ordeleting rows
To add rows, select any existing row, then click . A row isadded to the end of the list, and the settings from the selectedrow (or the first row if no row is selected) are copied to theadded row. Change settings as needed.
To delete rows, select the rows to delete and click . Youcannot delete a row if the segment has been saved.
Saving the .BICfile
To save the instrument settings (.BIC) file, select SaveInstrument Settings As from the File menu, then save the.BIC file with a new name.
Voyager™ Biospectrometry™ Workstation User’s Guide 8-51

Chapter 8 PSD Analysis
8
8.4.5 Acquiring and SavingPSD Segments in Manual Mode
This section includes:
• Overview• Acquiring PSD segments• Selecting and acquiring a segment• During acquisition• Changing settings• Accumulating or saving the segment• Selecting and acquiring remaining segments• Reacquring a segment• Stopping the experiment
Overview When you start acquiring in PSD mode, the softwareautomatically opens a PSD experiment. When a PSDexperiment is open:
• You cannot change instrument settings. This ensures thatall PSD segments are acquired under the sameconditions.
• All spectra that you save are placed in one .DAT file (no.DAT file is created until you save a segment).
When you save the first PSD segment, the software creates aPSD .DAT file. During a PSD acquisition, the PSD .DAT fileremains open and you can acquire multiple segment traces,accumulate or discard traces, and save traces. Each time yousave a trace, it is appended to the currently open PSD .DATfile. At the end of the acquisition, you stop the experiment,which closes the PSD .DAT file and makes it available forviewing in the Data Explorer software.
After an experiment is closed and the .DAT file is closed, youcannot reopen the .DAT file to append additional segments.
8-52 Applied Biosystems

Acquiring PSD Data with Standard .BIC Files in Manual Control Mode
8
NOTE: In the Data Explorer software, you cannot view thePSD .DAT file you are currently acquiring until you stop theexperiment. The PSD .DAT file is open and not available forviewing while the experiment is running.
NOTE: If you stop an experiment without saving anysegments, no .DAT file is created.
NOTE: All instrument settings except Shots/Spectrum aredisabled as soon as you start acquisition in PSD mode, untilyou stop the experiment. Make sure instrument settings arecorrect before starting acquisition.
Acquiring PSDsegments
To acquire PSD segments:
1. In the Manual Laser Intensity/Sample Positioningcontrol page, select the same sample position fromwhich you acquired the precursor spectrum.
2. From the View menu, select Data Storage. Setparameters as needed. See “Setting Data Storageparameters” on page 6-14, for information.
Hint: Include a _PSD suffix when you name PSD datafiles to help you distinguish them from non-PSD datafiles. For example, if you type in Experiment1_PSD asthe file name, the complete data file name will beExperiment1_PSD.DAT orExperiment1_PSD_0001.DAT (if AutosequenceFilenames is enabled).
Voyager™ Biospectrometry™ Workstation User’s Guide 8-53

Chapter 8 PSD Analysis
8
Selecting andacquiring a
segment
3. In the PSD Acquisition Settings control page, select (clickon) the row that corresponds to the segment you want toacquire.
4. To start acquiring, select Start Acquisition from theAcquisition menu, or click .
5. Adjust laser intensity to optimize signal intensity. Youtypically need a higher laser intensity to optimize signalintensity for segments with lower Mirror Ratio settings.
Duringacquisition
The following occurs:
• Mass range for the segment is set to:
• Acquisition starts.
• All instrument settings except Shots/Spectrum aredisabled. Settings remain inactive until you stopthe PSD experiment after you acquire allsegments of interest.
• Acquisition of the segment continues until thenumber of Shots/Spectrum specified in SpectrumAcquisition on the Instrument Settings controlpage is collected, or until you select StopAcquisition from the Acquisition menu.
• The spectrum is displayed in the Current Trace inthe Spectrum window.
Mass Equivalent to
Start (Precursor mass/4) which is equal to
(Precursor flight time/2)
End (Mirror to Accelerating Voltage Ratio2 ×Precursor mass) which is equal to
(Mirror to Accelerating Voltage Ratio ×Precursor flight time)
8-54 Applied Biosystems
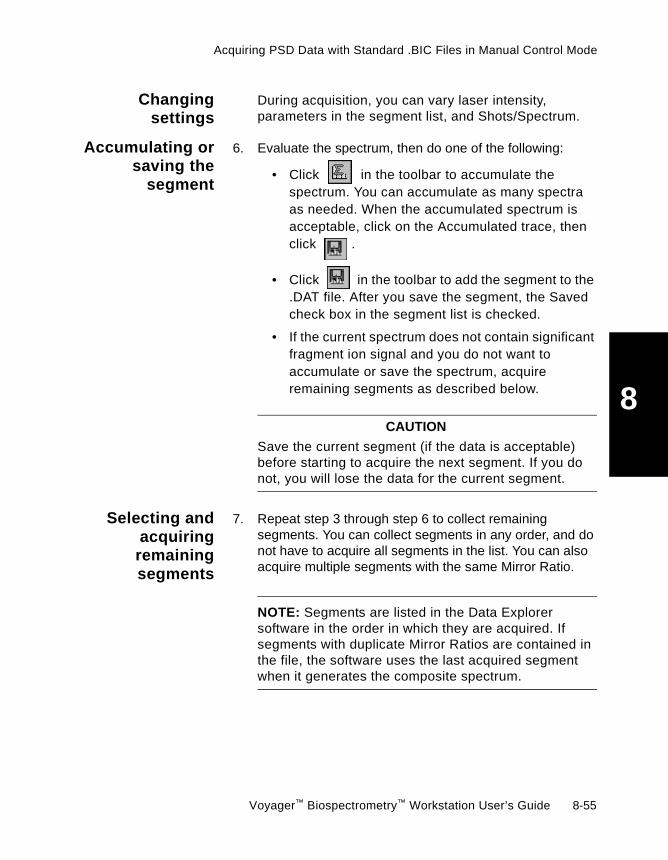
Acquiring PSD Data with Standard .BIC Files in Manual Control Mode
8
Changingsettings
During acquisition, you can vary laser intensity,parameters in the segment list, and Shots/Spectrum.
Accumulating orsaving the
segment
6. Evaluate the spectrum, then do one of the following:
• Click in the toolbar to accumulate thespectrum. You can accumulate as many spectraas needed. When the accumulated spectrum isacceptable, click on the Accumulated trace, thenclick .
• Click in the toolbar to add the segment to the.DAT file. After you save the segment, the Savedcheck box in the segment list is checked.
• If the current spectrum does not contain significantfragment ion signal and you do not want toaccumulate or save the spectrum, acquireremaining segments as described below.
CAUTION
Save the current segment (if the data is acceptable)before starting to acquire the next segment. If you donot, you will lose the data for the current segment.
Selecting andacquiring
remainingsegments
7. Repeat step 3 through step 6 to collect remainingsegments. You can collect segments in any order, and donot have to acquire all segments in the list. You can alsoacquire multiple segments with the same Mirror Ratio.
NOTE: Segments are listed in the Data Explorersoftware in the order in which they are acquired. Ifsegments with duplicate Mirror Ratios are contained inthe file, the software uses the last acquired segmentwhen it generates the composite spectrum.
Voyager™ Biospectrometry™ Workstation User’s Guide 8-55

Chapter 8 PSD Analysis
8
Reacquring asegment
8. To reacquire a segment:
• Select the segment to reacquire.
• Click . A new row is added to the end of thesegment list and contains the settings from theselected segment.
• Set parameters as needed.
• Repeat step 3 through step 6.
Stopping theexperiment
9. When you have acquired all necessary segments, selectStop Experiment from the Acquisition menu. ThePSD data file is closed.
CAUTION
If you stop an experiment without saving any segments,no .DAT file is created.
8-56 Applied Biosystems

Acquiring PSD Data with Standard .BIC Files in Automatic Control Mode
8
8.5 Acquiring PSD Datawith Standard .BIC Files inAutomatic Control Mode
During PSD analysis in Automatic Control mode:
• The laser is automatically adjusted for PSD segmentswith different Mirror Ratios.
• All selected segments are automatically acquired andappended to the currently open PSD .DAT file.
• The experiment is automatically closed when all selectedsegments are acquired and saved.
Before you begin Before acquiring PSD spectra in Automatic Control mode,become familiar with the information in Section 8.4, AcquiringPSD Data with Standard .BIC Files in Manual Control Mode.
Steps to acquirePSD data
The steps to acquire PSD data in Automatic Control mode are:
StepDescribedon page
Determine the precursor ion mass (same procedure as in ManualControl mode).
8-38
Determine the number of segments to acquire for a completecomposite spectrum (same procedure as in Manual Control mode).
8-40
Set the PSD Acquisition parameters for Automatic Control mode. 8-58
Fill in the segment list (same procedure as in Manual Control mode). 8-47
Set laser increment and save the .BIC file. 8-62
Acquire PSD segments in Automatic mode. 8-63
Voyager™ Biospectrometry™ Workstation User’s Guide 8-57
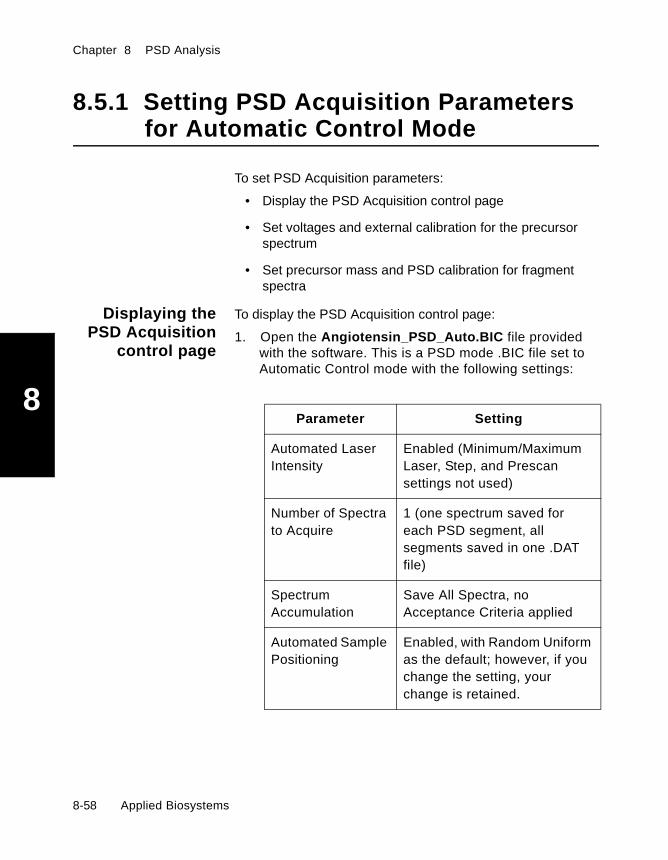
Chapter 8 PSD Analysis
8
8.5.1 Setting PSD Acquisition Parametersfor Automatic Control Mode
To set PSD Acquisition parameters:
• Display the PSD Acquisition control page
• Set voltages and external calibration for the precursorspectrum
• Set precursor mass and PSD calibration for fragmentspectra
Displaying thePSD Acquisition
control page
To display the PSD Acquisition control page:
1. Open the Angiotensin_PSD_Auto.BIC file providedwith the software. This is a PSD mode .BIC file set toAutomatic Control mode with the following settings:
Parameter Setting
Automated LaserIntensity
Enabled (Minimum/MaximumLaser, Step, and Prescansettings not used)
Number of Spectrato Acquire
1 (one spectrum saved foreach PSD segment, allsegments saved in one .DATfile)
SpectrumAccumulation
Save All Spectra, noAcceptance Criteria applied
Automated SamplePositioning
Enabled, with Random Uniformas the default; however, if youchange the setting, yourchange is retained.
8-58 Applied Biosystems

Acquiring PSD Data with Standard .BIC Files in Automatic Control Mode
8
NOTE: If you start with a .BIC file that is not set asindicated in the table above, and you change toAutomatic Control mode and PSD Operation mode, thesoftware automatically changes the settings in the .BICfile to those in the table above. These changes are notstored permanently in the .BIC file unless you save it.
2. If Control mode is not set to Automatic, click Automatic.
3. If the PSD Acquisition Settings control page (Figure 8-13)is not displayed, select PSD Acquisition from the Viewmenu.
Figure 8-13 PSD Acquisition Settings Control Page—Automatic Mode
Setting voltagesand external
calibration for theprecursorspectrum
4. For optimum mass accuracy, change the AcceleratingVoltage and Grid Voltage% (on the Instrument Settingscontrol page) to the values you used to acquire theprecursor spectrum and to generate the calibration.
NOTE: If you use different voltage settings(Accelerating Voltage, Grid Voltage, or Delay Time) toacquire the precursor spectrum, generate thecalibration, and acquire the fragment spectra, thesoftware compensates for the different settings.However, using different voltage settings may not yieldoptimum mass accuracy.
Voyager™ Biospectrometry™ Workstation User’s Guide 8-59
Chapter 8 PSD Analysis
8
5. In the Calibration section of the Instrument Settingscontrol page, select the matrix you are using and the .CALfile you created in “Generating an external calibration forthe precursor ion” on page 8-39.
NOTE: The calibration you specify on the InstrumentSettings control page is used to determine the tp value(precursor ion flight time) needed for the PSD calibrationequation (described on page 8-28).The tp value isdetermined using the standard calibration equation (“t”in the standard equation described on page 6-9). Youwill also specify an external PSD calibration below,which is used to determine the values for α , β , and γneeded for the PSD calibration equation.
NOTE: If default calibration yields acceptable massaccuracy for your application, an external calibration isnot required.
Setting precursormass and PSDcalibration for
fragment spectra
6. In the PSD Acquisition Settings control page, type thePrecursor mass.
NOTE: Precursor mass is used for PSD calibration.Type in an accurate value with appropriate precision(for example, type 1296.68, not 1297).
7. Select Precursor Ion Selector if it is not alreadyselected.
8. To set PSD calibration, select the default calibration orselect a previously generated external PSD .CAL file. Formore information, see the Data Explorer User’s Guide,Chapter 8.3.3, Creating PSD Calibration (.CAL) Files andApplying to Other Data Files.
8-60 Applied Biosystems
Acquiring PSD Data with Standard .BIC Files in Automatic Control Mode
8
NOTE: The calibration you specify on the PSDAcquisition Settings control page is used to determine thevalues for α, β, and γ needed for the PSD calibrationequation (described on page 8-28). The calibration youspecify on the Instrument Settings control page instep 4 is used to determine the value for tp (precursor ionflight time) needed for the PSD calibration equation.
NOTE: If default PSD calibration yields acceptablemass accuracy for your application, an externalcalibration is not required.
NOTE: PSD .CAL files are named with the sameextension as reflector or linear .CAL files. If you select areflector or linear .CAL file when in PSD mode, an errormessage is generated.
Filling in thesegment list
9. Fill in the segment list as described in Section 8.4.4,Filling in the Segment List and Saving the .BIC File.
Voyager™ Biospectrometry™ Workstation User’s Guide 8-61
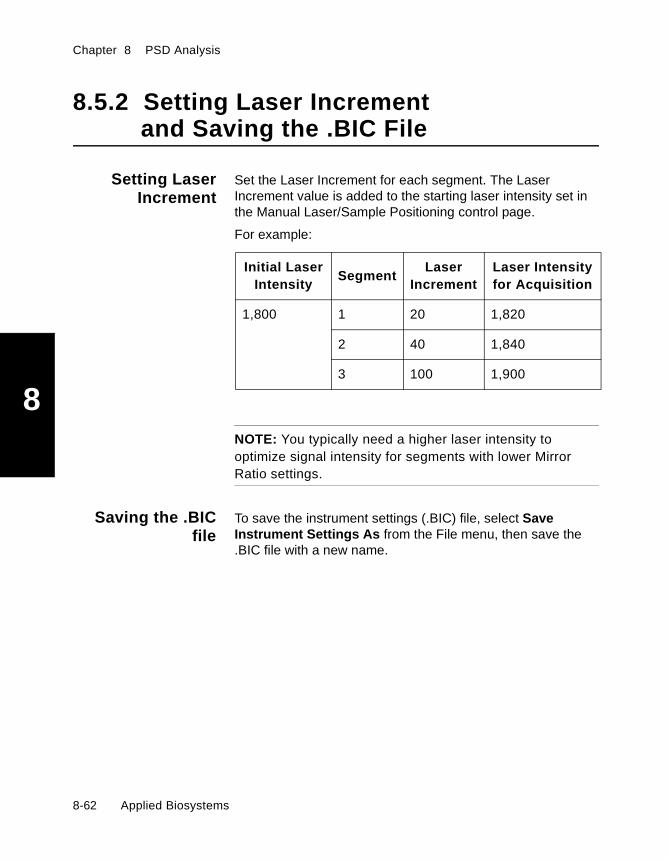
Chapter 8 PSD Analysis
8
8.5.2 Setting Laser Incrementand Saving the .BIC File
Setting LaserIncrement
Set the Laser Increment for each segment. The LaserIncrement value is added to the starting laser intensity set inthe Manual Laser/Sample Positioning control page.
For example:
NOTE: You typically need a higher laser intensity tooptimize signal intensity for segments with lower MirrorRatio settings.
Saving the .BICfile
To save the instrument settings (.BIC) file, select SaveInstrument Settings As from the File menu, then save the.BIC file with a new name.
Initial LaserIntensity
SegmentLaser
IncrementLaser Intensityfor Acquisition
1,800 1 20 1,820
2 40 1,840
3 100 1,900
8-62 Applied Biosystems

Acquiring PSD Data with Standard .BIC Files in Automatic Control Mode
8
8.5.3 Acquiring PSD Segmentsin Automatic Control Mode
Acquiring PSDsegments
To acquire PSD segments in Automatic mode:
1. In the Manual Laser Intensity/Sample Positioningcontrol page, select the same sample position fromwhich you acquired the precursor spectrum.
2. From the View menu, select Data Storage. Setparameters as needed. See “Setting Data Storageparameters” on page 6-14, for information.
Hint: Include a _PSD suffix when you name PSD datafiles to help you distinguish them from non-PSD datafiles. For example, if you type in Experiment1_PSD asthe file name, the complete data file name will beExperiment1_PSD.DAT orExperiment1_PSD_0001.DAT (if Autosequence FileNames is enabled).
Selecting andacquiring a
segment
3. In the PSD Acquisition Settings control page, press andhold the Control key and click all rows that correspond tothe segments you want to acquire.
NOTE: All instrument settings are disabled as soon asyou start acquisition in PSD mode, until you stop theexperiment. Make sure instrument settings are correctbefore starting acquisition.
Voyager™ Biospectrometry™ Workstation User’s Guide 8-63

Chapter 8 PSD Analysis
8
CAUTION
Select all necessary segments before continuing. Youcannot acquire additional segments into the currentdata file after you start acquisition. When acquisition iscomplete, the data file is automatically closed. If youwant to acquire additional segments as part of thesame data file, you must repeat the acquisition with allnecessary segments selected.
4. To start acquiring, select Start Acquisition from theAcquisition menu, or click .
Duringacquisition
The following occurs for each segment spectrum as it isacquired:
• Mass range for the segment is set to:
• All instrument settings are disabled. Settings remaininactive until you stop the PSD experiment or allsegments are acquired.
• Acquisition of the segment continues until the number ofShots/Spectrum specified in Spectrum Acquisition on theInstrument Settings control page is collected, or until youselect Stop Acquisition from the Acquisition menu.
• The segment spectrum is displayed in the Current Tracein the Spectrum window and saved to the data file.
After all segments are acquired, the software automaticallystops the experiment, then closes and saves the PSD datafile.
Mass Equivalent to
Start (Precursor mass/4) which is equal to
(Precursor flight time/2)
End (Mirror to Accelerating Voltage Ratio2 ×Precursor mass) which is equal to
(Mirror to Accelerating Voltage Ratio ×Precursor flight time)
8-64 Applied Biosystems

Exploring PSD Mode
8
8.6 Exploring PSD Mode
To be successful in PSD analysis, you need to understandhow ions behave in PSD mode, and how to optimizeacquisition conditions. Before running samples, spend sometime practicing with standards.
In this section, you will observe the effects of:
• Laser intensity on fragment ion production and signalintensity
• Precursor Ion Selector on prompt fragments
• Grid Voltage% on resolution
This section assumes that you are familiar with the informationin Section 8.4, Acquiring PSD Data with Standard .BIC Files inManual Control Mode.
Preparing thepractice standard
WARNING
CHEMICAL HAZARD. Please read the MSDS beforehandling any chemical mentioned below, and follow thehandling instructions. Wear appropriate protective eyewear,clothing, and gloves.Angiotensin may cause an allergic skin and respiratoryreaction. Exposure may cause eye, skin, and respiratorytract irritation.Alpha-cyano-4-hydroxycinnamic acid (CHCA) maycause eye, skin, and respiratory tract irritation.
To prepare the practice standard:
1. Prepare a 50 pmol/µl solution of angiotensin I.
2. Prepare α-cyano-4-hydroxycinnamic acid matrix asdescribed in Section 3.1.2, Preparing Matrix.
3. Mix 1 µl of angiotensin I with 24 µl of matrix for a finalconcentration of 2 pmol/µl.
4. Apply 1 µl of angiotensin/matrix to a sample plate.
Voyager™ Biospectrometry™ Workstation User’s Guide 8-65

Chapter 8 PSD Analysis
8
8.6.1 Observing theEffects of Laser Intensity
Adjusting laser intensity affects fragment ion production andsignal intensity.
In this section In this section, you will:
• Observe the effects of setting the laser intensity too highand too low
• Determine the laser intensity for your system that yieldsthe best signal for PSD spectra
Observing effectsof high and low
laser intensity
To observe the effects of laser intensity:
1. Open the Angiotensin_PSD.BIC file provided with thesoftware.
2. In the PSD segment list, select the first row with a MirrorRatio setting of 1.0.
3. Acquire a spectrum.
4. Observe the 1,180 to 1,190 Da mass region for thefragment ion cluster typically seen for angiotensin I(Figure 8-14).
Figure 8-14 Angiotensin I Fragment Ions (Precursor Ion Selector On)
8-66 Applied Biosystems

Exploring PSD Mode
8
5. Note the behavior of the signal intensity for the first fewspectra and subsequent continued samplings at a givenlaser power.
NOTE: Sample preparations that contain high saltcontamination or other impurities often yield increasedsignal intensity after an initial period of low intensity asthe top layer of sample is consumed.
You typically see signal intensity reach maximum anddecrease more quickly than in non-PSD mode assample is consumed. You may need to move around onthe sample spot to maintain signal intensity.
6. Continue increasing the laser intensity and observing thesignal. Figure 8-15 shows the effect of higher laserintensity on the angiotensin I spectrum.
Figure 8-15 Angiotensin I Fragment Ions at High Laser Intensity
Voyager™ Biospectrometry™ Workstation User’s Guide 8-67
Chapter 8 PSD Analysis
8
Hint: As you initially experiment, adjust the laser inlarge steps, for example 100 counts. As you begin tofine-tune the laser, use smaller steps.
Fragment ion yield initially increases with higher laserintensities, and then decreases at very high settings. Tomake sure that the signal decrease is not due tosample exhaustion, move around in the sampleposition.
7. Decrease the laser intensity and observe the signal.Signal intensity decreases with lower laser intensities.When laser intensity is too low, signal intensity is weak.
8. Continue decreasing the laser intensity until signal is nolonger visible.
9. Continue experimenting with laser settings until you arefamiliar with the appearance of a spectrum acquired whenthe laser intensity is set too high or too low.
Determiningoptimum laser
intensity forfragments
Fine-tune the laser setting until you find a laser intensity thatprovides a signal strength for the angiotensin I fragment ionsobserved between 1,180 and 1,190 Da that is around 20,000to 40,000 counts in the Spectrum window.
Record this laser setting.
NOTE: The precursor ion peak will be saturated at a laserintensity that yields adequate intensity for fragment ions.
8-68 Applied Biosystems

Exploring PSD Mode
8
8.6.2 Observing the Effectsof Precursor Ion Selector
Turning on the Precursor Ion Selector eliminates promptfragments in a spectrum.
In this section In this section, you will:
• Turn off the Precursor Ion Selector (called Timed IonSelector in Reflector mode) and observe the spectrum
• Distinguish between the two types of fragments, promptand PSD
• Understand the impact of the Precursor Ion Selector onprompt fragments
Turning offPrecursor Ion
Selector
To observe the effects of the Precursor Ion Selector (calledTimed Ion Selector in Reflector mode):
1. In the PSD Acquisition Settings control page, deselectPrecursor Ion Selector.
2. Acquire a spectrum.
3. Observe the 1,180 to 1,190 Da mass region. Note theadditional peaks that appear below 1,185 Da when thePrecursor Ion Selector is turned off (Figure 8-16).
Figure 8-16 Angiotensin I Fragment Ions (Precursor Ion Selector Off)
Additional peaks appear whenPrecursor Ion Selector is turned off
Voyager™ Biospectrometry™ Workstation User’s Guide 8-69

Chapter 8 PSD Analysis
8
Figure 8-17 compares the spectrum above with the spectrumacquired in the previous section so you can more easily seethe peaks that appear when the Precursor Ion Selector isturned off. Figure 8-17 also identifies the two types offragments seen when the Precursor Ion Selector is turned off.
Figure 8-17 Comparison of Spectra with Precursor Ion Selector Off and On
Precursor Ion Selector on
y9 y9b9 + H2O
Precursor Ion Selector off
Promptfragments
PSDfragments
PSDfragments
8-70 Applied Biosystems

Exploring PSD Mode
8
Observing promptand PSD
fragments
When operating under conditions that yield high resolution forangiotensin I, and when the Precursor Ion Selector is turnedoff, you should observe the following:
• Prompt fragments—Well-resolved fragment ionsgenerated in the source before acceleration. The sharppeak at 1,181.7 Da is the y9 ion.
Prompt fragments appear at the expected mass inreflector mode because their flight time is the same as amolecular ion of the same mass accelerated from thesource. They do not appear at the expected mass in PSDmode.
• PSD fragments—A poorly resolved peak cluster that is amixture of the y9 fragment (1,181.7 Da) and the b9+H2Ofragment (1,183.6 Da). PSD fragments are generated inthe flight tube after acceleration.
PSD fragments appear at a higher mass than expected ina reflector-calibrated spectrum. They appear at theexpected mass in PSD mode. See “PSD fragment ions”on page 8-21. These higher than expected masses arecorrected in PSD calibration when you generate thecomposite spectrum.
Effect ofPrecursor Ion
Selector onprompt and PSD
fragments
Even if prompt and PSD fragments are identical in chemicalstructure, they will travel down the flight tube at different times(Figure 8-18):
• Prompt fragments—Accelerated based on their initialfragment mass, and reach the reflector sooner than theircorresponding PSD fragments.
• PSD fragments—Accelerated based on the mass of themolecular ion from which they form, and reach thereflector later than the prompt fragments.
Because of this difference in flight times, the Precursor IonSelector can screen out prompt fragments while allowing PSDfragments to pass into the reflector.
Voyager™ Biospectrometry™ Workstation User’s Guide 8-71
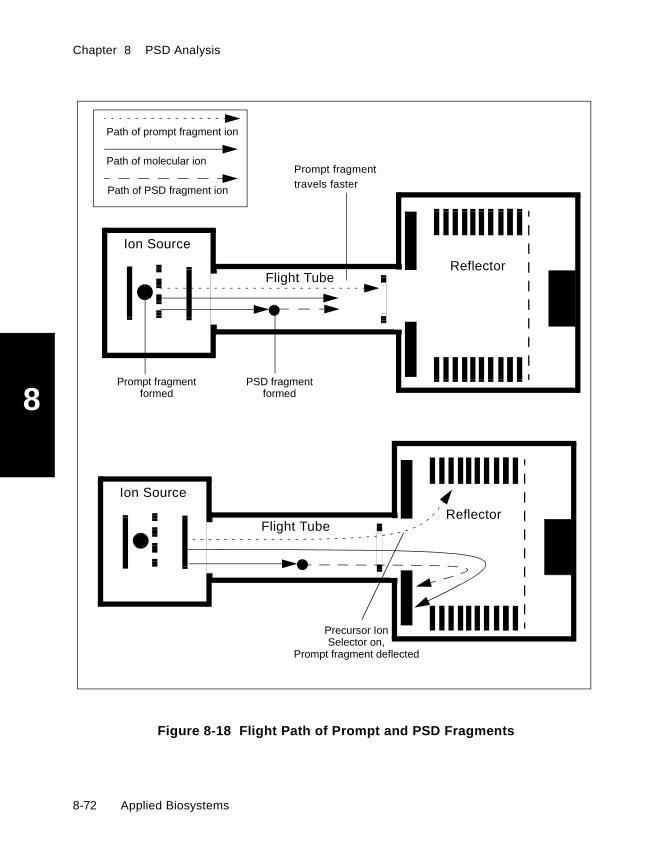
Chapter 8 PSD Analysis
8
Figure 8-18 Flight Path of Prompt and PSD Fragments
Path of prompt fragment ion
Path of molecular ion
Ion Source
Flight TubeReflector
Path of PSD fragment ion
Prompt fragmentformed
PSD fragmentformed
Ion Source
Flight TubeReflector
Precursor IonSelector on,
Prompt fragment deflected
Prompt fragmenttravels faster
8-72 Applied Biosystems
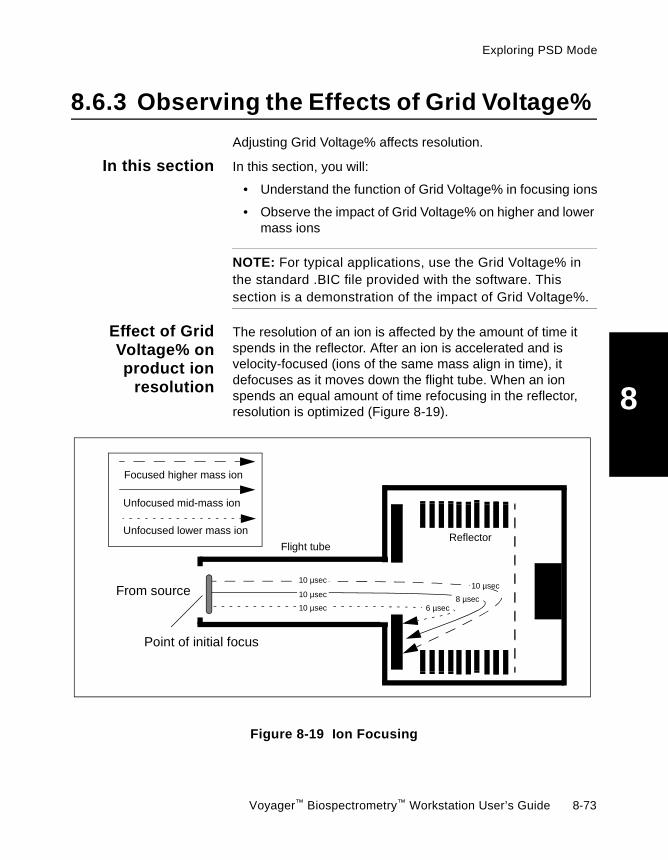
Exploring PSD Mode
8
8.6.3 Observing the Effects of Grid Voltage%
Adjusting Grid Voltage% affects resolution.
In this section In this section, you will:
• Understand the function of Grid Voltage% in focusing ions
• Observe the impact of Grid Voltage% on higher and lowermass ions
NOTE: For typical applications, use the Grid Voltage% inthe standard .BIC file provided with the software. Thissection is a demonstration of the impact of Grid Voltage%.
Effect of GridVoltage% onproduct ion
resolution
The resolution of an ion is affected by the amount of time itspends in the reflector. After an ion is accelerated and isvelocity-focused (ions of the same mass align in time), itdefocuses as it moves down the flight tube. When an ionspends an equal amount of time refocusing in the reflector,resolution is optimized (Figure 8-19).
Figure 8-19 Ion Focusing
From source
Point of initial focus
Focused higher mass ion
Unfocused lower mass ion
Unfocused mid-mass ion
6 µsec8 µsec
10 µsec
10 µsec
10 µsec
Flight tubeReflector
10 µsec
Voyager™ Biospectrometry™ Workstation User’s Guide 8-73
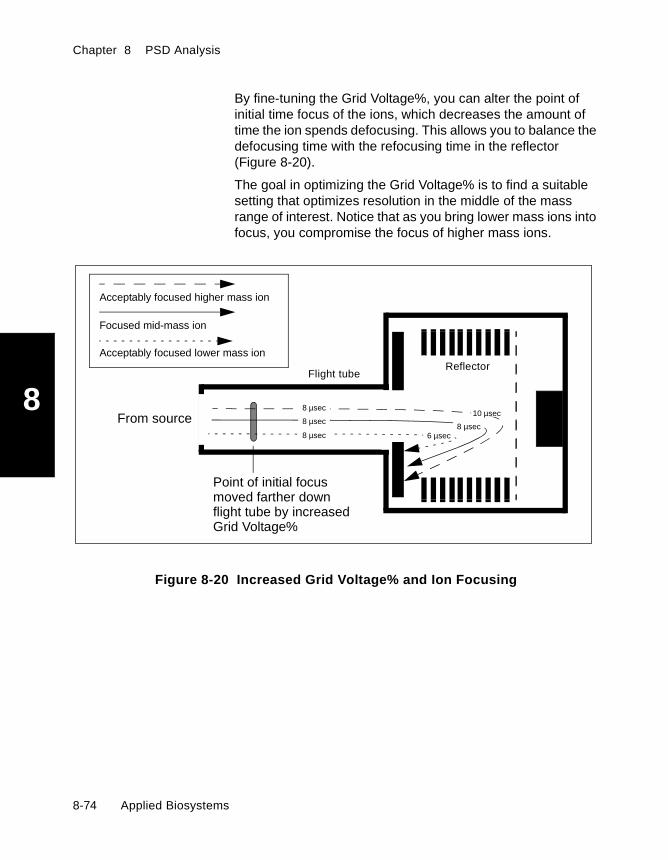
Chapter 8 PSD Analysis
8
By fine-tuning the Grid Voltage%, you can alter the point ofinitial time focus of the ions, which decreases the amount oftime the ion spends defocusing. This allows you to balance thedefocusing time with the refocusing time in the reflector(Figure 8-20).
The goal in optimizing the Grid Voltage% is to find a suitablesetting that optimizes resolution in the middle of the massrange of interest. Notice that as you bring lower mass ions intofocus, you compromise the focus of higher mass ions.
Figure 8-20 Increased Grid Voltage% and Ion Focusing
Point of initial focusmoved farther downflight tube by increasedGrid Voltage%
From source
Acceptably focused higher mass ion
Acceptably focused lower mass ion
Focused mid-mass ion
6 µsec8 µsec
8 µsec
8 µsec
10 µsec8 µsec
Flight tubeReflector
8-74 Applied Biosystems

Exploring PSD Mode
8
Acquiring NOTE: In this exercise, you will observe the impact of theGrid Voltage% on the precursor ion at 1,297 Da and thefragment ion at 1,181 Da. At the laser intensity youoptimized for the fragment ion, the precursor ion will besaturated. To allow you to observe precursor and fragmentions in the spectrum, change the Vertical Scale setting inthe .BIC file (Digitizer/Mode dialog box) to 1,000 mVfull scale.
1. Enable the Precursor Ion Selector if it is disabled.
2. Acquire a spectrum to make sure the precursor is notsaturated.
Hint: If the precursor ion peak is still saturated but thepeak valleys are noticeable, you can estimate theresolution at the +2 isotopic peak.
3. Make a note of the resolution of the fragment ions and theprecursor ion.
NOTE: You may need to switch between Vertical Scalesettings of 1,000 mV and 200 mV and reacquire spectrato see the resolution on the precursor and fragmentpeaks.
4. From the Acquisition menu, select Stop Experiment, toallow you to change the Grid Voltage in the InstrumentSettings control page.
5. Decrease the Grid Voltage% value in 5 percentincrements and observe the spectrum. For example, if thesetting in the .BIC file is 80%, decrease to 75%, then 70%.
At lower Grid Voltage% settings:
• Lower mass ion resolution degrades• Higher mass ion resolution improves
Voyager™ Biospectrometry™ Workstation User’s Guide 8-75
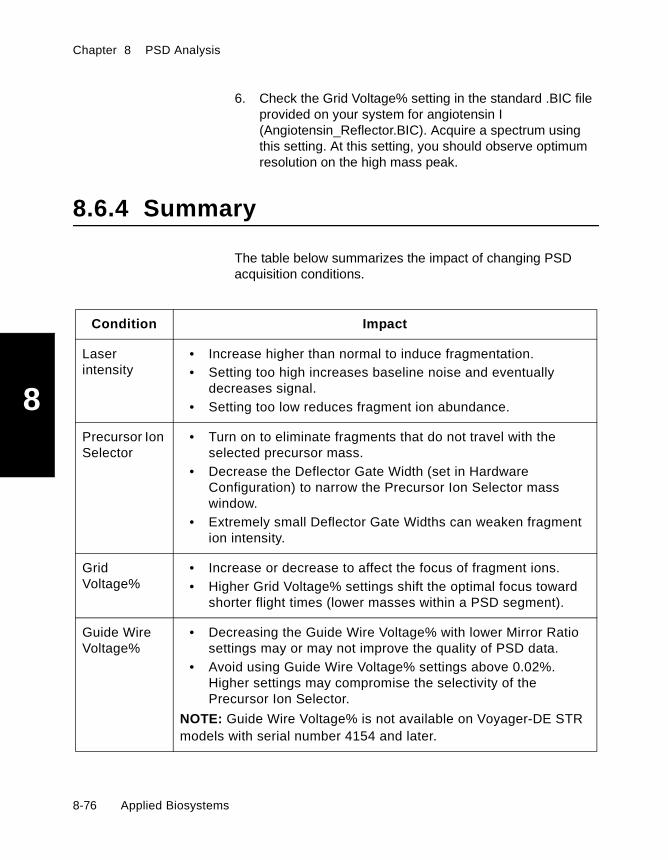
Chapter 8 PSD Analysis
8
6. Check the Grid Voltage% setting in the standard .BIC fileprovided on your system for angiotensin I(Angiotensin_Reflector.BIC). Acquire a spectrum usingthis setting. At this setting, you should observe optimumresolution on the high mass peak.
8.6.4 Summary
The table below summarizes the impact of changing PSDacquisition conditions.
Condition Impact
Laserintensity
• Increase higher than normal to induce fragmentation.• Setting too high increases baseline noise and eventually
decreases signal.• Setting too low reduces fragment ion abundance.
Precursor IonSelector
• Turn on to eliminate fragments that do not travel with theselected precursor mass.
• Decrease the Deflector Gate Width (set in HardwareConfiguration) to narrow the Precursor Ion Selector masswindow.
• Extremely small Deflector Gate Widths can weaken fragmention intensity.
GridVoltage%
• Increase or decrease to affect the focus of fragment ions.• Higher Grid Voltage% settings shift the optimal focus toward
shorter flight times (lower masses within a PSD segment).
Guide WireVoltage%
• Decreasing the Guide Wire Voltage% with lower Mirror Ratiosettings may or may not improve the quality of PSD data.
• Avoid using Guide Wire Voltage% settings above 0.02%.Higher settings may compromise the selectivity of thePrecursor Ion Selector.
NOTE: Guide Wire Voltage% is not available on Voyager-DE STRmodels with serial number 4154 and later.
8-76 Applied Biosystems
Viewing PSD Data
8
8.7 Viewing PSD Data
For information on viewing PSD data, see the Data ExplorerSoftware User’s Guide, Chapter 8, Viewing Voyager PSDData.
Voyager™ Biospectrometry™ Workstation User’s Guide 8-77
Chapter 8 PSD Analysis
8
8-78 Applied Biosystems

9Chapter
39 Maintenance andTroubleshooting
This chapter contains the following sections:9.1 Maintenance .................................................... 9-2
9.1.1 Maintenance Schedule ....................9-2
9.1.2 Hardware Maintenance ....................9-3
9.1.3 Backing Up and Archiving Data ........9-6
9.2 Troubleshooting ............................................... 9-7
9.2.1 Spectrum Troubleshooting ...............9-7
9.2.2 Software Troubleshooting ..............9-19
9.2.3 Hardware Troubleshooting .............9-23
Voyager™ Biospectrometry™ Workstation User’s Guide 9-1

Chapter 9 Maintenance and Troubleshooting
9
9.1 Maintenance
This section describes:
• Maintenance schedule• Hardware maintenance• Backing up and archiving data
9.1.1 Maintenance Schedule
Maintenanceschedule
Regular preventative maintenance will help keep yourVoyager system functioning properly. Perform the followingprocedures as indicated:
Maintenance log Appendix G, Maintenance Log, includes a log sheet that youcan copy and use to keep track of maintenance on yourVoyager system.
When to perform Task Page
Weekly Back up or archive data page 9-6
Yearly Hardware maintenance performed byApplied Biosystems engineer
page 9-3
9-2 Applied Biosystems
Maintenance
9
9.1.2 Hardware Maintenance
WARNING
ELECTRICAL SHOCK HAZARD. Severe electrical shockcan result by operating the instrument without panels inplace. Do not remove instrument panels. High voltagecontacts are exposed with panels removed. Wear propereye protection if panels are removed for service.
WARNING
LASER HAZARD. The laser emits ultraviolet radiation.Lasers can burn the retina and leave permanent blindspots. Do not remove instrument panels or look directly intothe laser beam or allow a reflection of the beam to enteryour eyes. Wear proper eye protection if panels areremoved for service.
Yearlypreventativemaintenance
The Voyager Biospectrometry Workstation requires minimalpreventative maintenance. Preventative maintenanceprocedures should be performed by an Applied Biosystemstechnical representative.
Please contact Applied Biosystems for information on servicecontracts for yearly preventative maintenance.
The following preventative maintenance is needed on a yearlybasis:
• Replace rotary pump oil
• Inspect molecular sieve, oil mist filter, and vent line dryerfilter
• Clean filters and fans
• Lubricate X/Y feedthroughs
• Inspect flap valve 1, flap valve 2, linear actuator o-rings
Voyager™ Biospectrometry™ Workstation User’s Guide 9-3

Chapter 9 Maintenance and Troubleshooting
9
• Clean optics and air lines
• Inspect grids, compressor, air pressure, turbo pump, andlaser power
• Adjust laser flash rate, load offsets, sample offsets,detector gain and voltage, and instrument covers
• Inspect load and eject cycles, high voltage powersupplies, and computer
• Calibrate thermocouple gauges
• Check that the instrument meets specifications
Changing fuses This procedure is required for Voyager-DE andVoyager-DE PRO systems only (the Voyager-DE STR doesnot require power fuses). Extra fuses for different voltagesettings are supplied with the system.
To change the main power fuse:
1. Exit the Voyager software.
2. Power down the mass spectrometer.
3. Remove the power cord from the mass spectrometer.
4. Carefully remove the voltage selector/fuse holder from thesystem (Figure 9-1) using a small flat-blade screw driver.
5. Carefully remove the voltage selector from the holder andinsert the selector with the proper voltage displayed in thewindow of the holder.
CAUTION
The plastic tabs that hold the voltage selector in place arefragile. Do not exert force when removing this piece.
9-4 Applied Biosystems
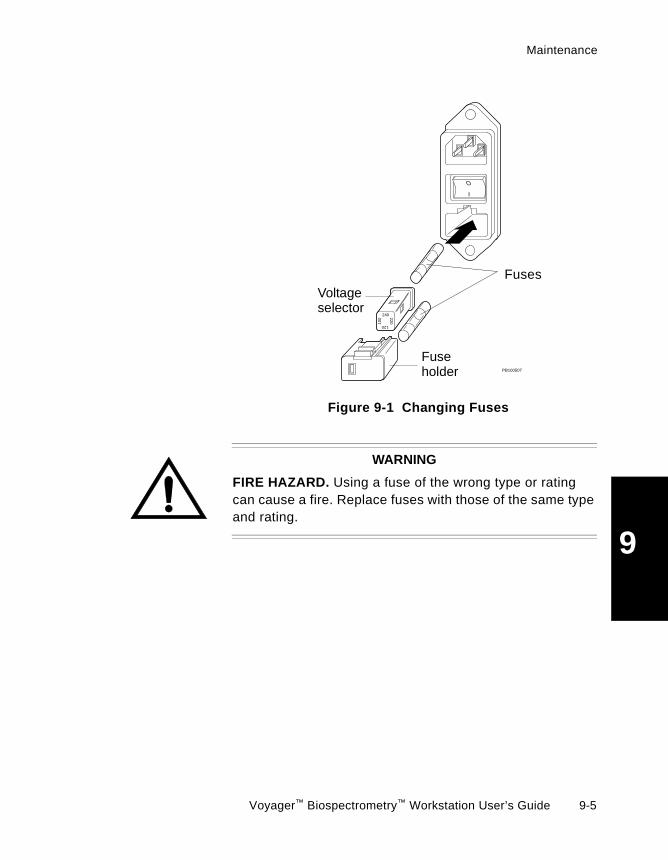
Maintenance
9
Figure 9-1 Changing Fuses
WARNING
FIRE HAZARD. Using a fuse of the wrong type or ratingcan cause a fire. Replace fuses with those of the same typeand rating.
PB100507
I
O
240 220100
120
FusesVoltageselector
Fuseholder
Voyager™ Biospectrometry™ Workstation User’s Guide 9-5
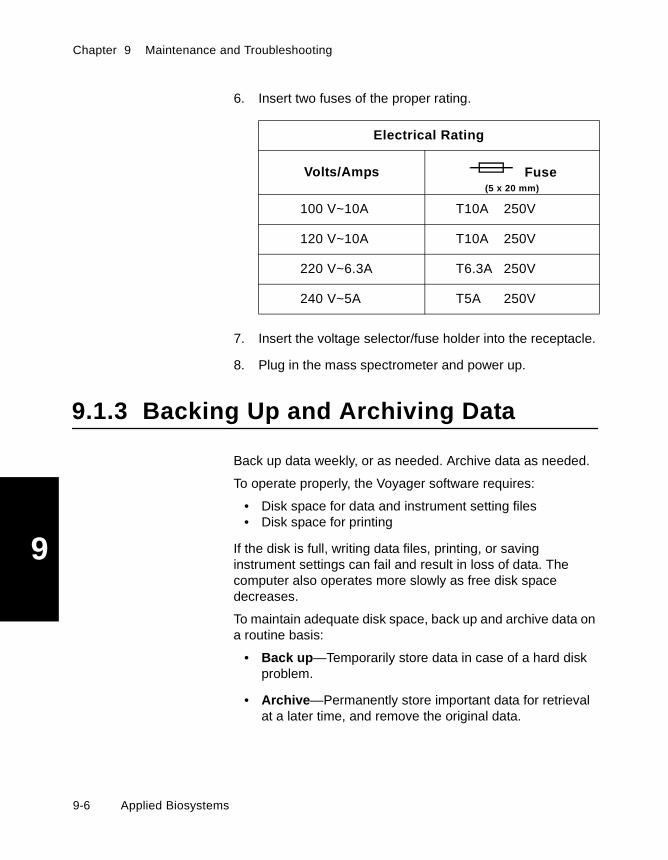
Chapter 9 Maintenance and Troubleshooting
9
6. Insert two fuses of the proper rating.
7. Insert the voltage selector/fuse holder into the receptacle.
8. Plug in the mass spectrometer and power up.
9.1.3 Backing Up and Archiving Data
Back up data weekly, or as needed. Archive data as needed.
To operate properly, the Voyager software requires:
• Disk space for data and instrument setting files• Disk space for printing
If the disk is full, writing data files, printing, or savinginstrument settings can fail and result in loss of data. Thecomputer also operates more slowly as free disk spacedecreases.
To maintain adequate disk space, back up and archive data ona routine basis:
• Back up—Temporarily store data in case of a hard diskproblem.
• Archive—Permanently store important data for retrievalat a later time, and remove the original data.
Electrical Rating
Volts/Amps Fuse(5 x 20 mm)
100 V~10A T10A 250V
120 V~10A T10A 250V
220 V~6.3A T6.3A 250V
240 V~5A T5A 250V
9-6 Applied Biosystems
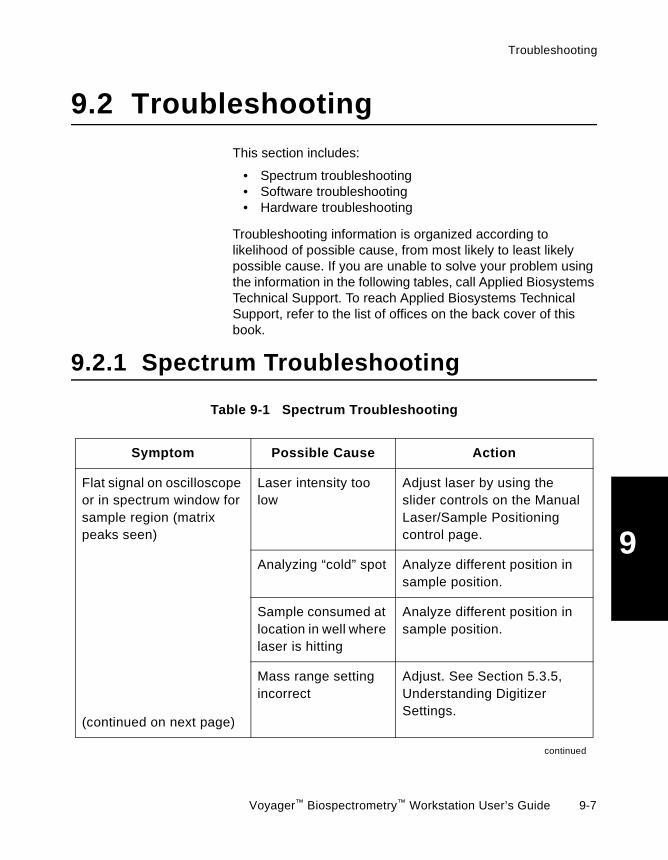
Troubleshooting
9
9.2 Troubleshooting
This section includes:
• Spectrum troubleshooting• Software troubleshooting• Hardware troubleshooting
Troubleshooting information is organized according tolikelihood of possible cause, from most likely to least likelypossible cause. If you are unable to solve your problem usingthe information in the following tables, call Applied BiosystemsTechnical Support. To reach Applied Biosystems TechnicalSupport, refer to the list of offices on the back cover of thisbook.
9.2.1 Spectrum Troubleshooting
Table 9-1 Spectrum Troubleshooting
Symptom Possible Cause Action
Flat signal on oscilloscopeor in spectrum window forsample region (matrixpeaks seen)
(continued on next page)
Laser intensity toolow
Adjust laser by using theslider controls on the ManualLaser/Sample Positioningcontrol page.
Analyzing “cold” spot Analyze different position insample position.
Sample consumed atlocation in well wherelaser is hitting
Analyze different position insample position.
Mass range settingincorrect
Adjust. See Section 5.3.5,Understanding DigitizerSettings.
continued
Voyager™ Biospectrometry™ Workstation User’s Guide 9-7

Chapter 9 Maintenance and Troubleshooting
9
Flat signal on oscilloscopeor in spectrum window forsample region (matrixpeaks seen)
(continued)
Accelerating Voltagetoo low
Adjust. See Section 5.4.4.2,Setting Accelerating Voltage.
Sample does notionize
Analyze in negative ion mode.
Before mixing with matrix,chemically derivatize samplewith amino-containingchemical group.
Use different matrix. SeeSection 3.1.1, Selecting aMatrix.
Sample notwell-dissolved beforeapplying to sampleplate
Prepare new sample, makingsure sample is well-dissolved,then apply to sample plate.
Sample and matrixnot well-mixed beforeapplying to sampleplate
Prepare new sample andmatrix. Mix well beforeapplying to sample plate.
Sampleconcentration toohigh or too low
Prepare sample/matrix with afinal sample concentrationappropriate for sample andmatrix. See Section 3.1.3,Matrix Information.
Dilute or concentrate sample5× and run again.
continued
Table 9-1 Spectrum Troubleshooting (Continued)
Symptom Possible Cause Action
9-8 Applied Biosystems
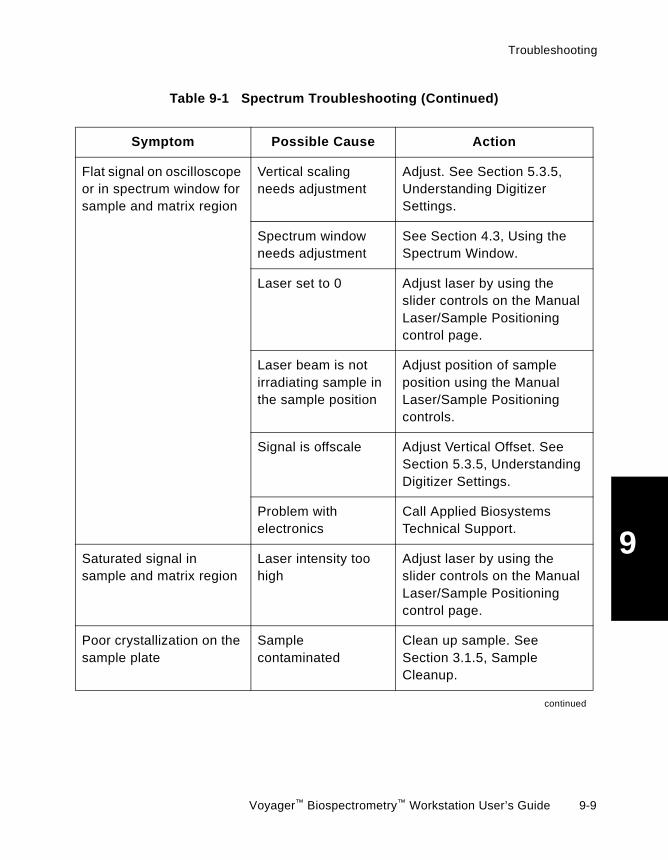
Troubleshooting
9
Flat signal on oscilloscopeor in spectrum window forsample and matrix region
Vertical scalingneeds adjustment
Adjust. See Section 5.3.5,Understanding DigitizerSettings.
Spectrum windowneeds adjustment
See Section 4.3, Using theSpectrum Window.
Laser set to 0 Adjust laser by using theslider controls on the ManualLaser/Sample Positioningcontrol page.
Laser beam is notirradiating sample inthe sample position
Adjust position of sampleposition using the ManualLaser/Sample Positioningcontrols.
Signal is offscale Adjust Vertical Offset. SeeSection 5.3.5, UnderstandingDigitizer Settings.
Problem withelectronics
Call Applied BiosystemsTechnical Support.
Saturated signal insample and matrix region
Laser intensity toohigh
Adjust laser by using theslider controls on the ManualLaser/Sample Positioningcontrol page.
Poor crystallization on thesample plate
Samplecontaminated
Clean up sample. SeeSection 3.1.5, SampleCleanup.
continued
Table 9-1 Spectrum Troubleshooting (Continued)
Symptom Possible Cause Action
Voyager™ Biospectrometry™ Workstation User’s Guide 9-9
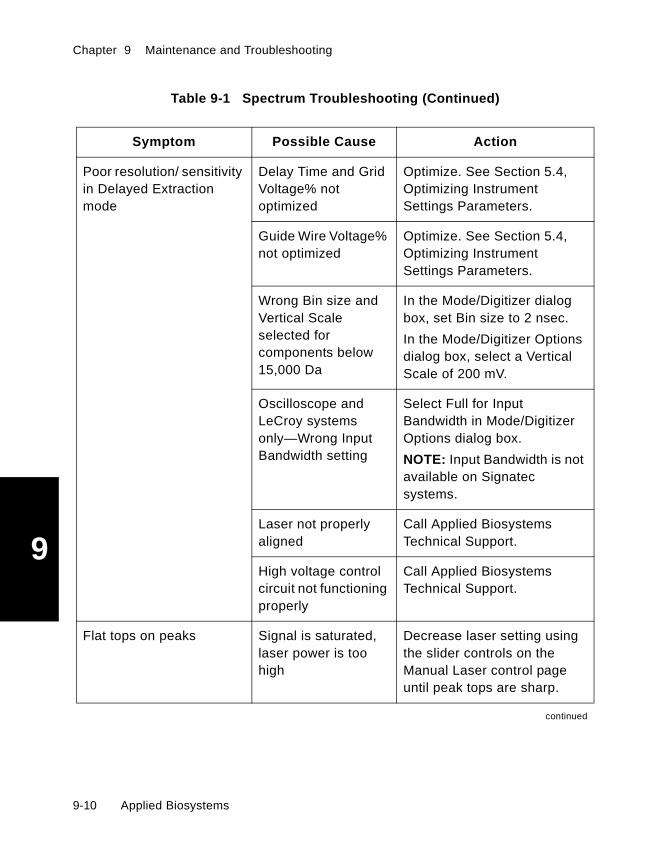
Chapter 9 Maintenance and Troubleshooting
9
Poor resolution/ sensitivityin Delayed Extractionmode
Delay Time and GridVoltage% notoptimized
Optimize. See Section 5.4,Optimizing InstrumentSettings Parameters.
Guide Wire Voltage%not optimized
Optimize. See Section 5.4,Optimizing InstrumentSettings Parameters.
Wrong Bin size andVertical Scaleselected forcomponents below15,000 Da
In the Mode/Digitizer dialogbox, set Bin size to 2 nsec.
In the Mode/Digitizer Optionsdialog box, select a VerticalScale of 200 mV.
Oscilloscope andLeCroy systemsonly—Wrong InputBandwidth setting
Select Full for InputBandwidth in Mode/DigitizerOptions dialog box.
NOTE: Input Bandwidth is notavailable on Signatecsystems.
Laser not properlyaligned
Call Applied BiosystemsTechnical Support.
High voltage controlcircuit not functioningproperly
Call Applied BiosystemsTechnical Support.
Flat tops on peaks Signal is saturated,laser power is toohigh
Decrease laser setting usingthe slider controls on theManual Laser control pageuntil peak tops are sharp.
continued
Table 9-1 Spectrum Troubleshooting (Continued)
Symptom Possible Cause Action
9-10 Applied Biosystems

Troubleshooting
9
Round tops on peaks Saturated (flat top)and unsaturated(sharp top) scansaveraged
Decrease laser setting byusing the slider controls onthe Manual Laser/SamplePositioning control page untilpeak tops are sharp.
While acquiring,laser powerchanged. Averagedscan includessaturated (flat top)and unsaturated(sharp top) scans.
Reacquire using one lasersetting that gives sharppeaks.
NOTE: Data acquired usingdifferent laser settings mayhave poor mass accuracy.
Poor mass accuracy inDelayed Extraction mode
(external calibration only)
High voltage powersupplies not warmedup
Start high voltages by clicking
on the toolbar
before calibration.
Mass AccuracyOptimization optionnot used
Enable Mass AccuracyOptimization. See page 3-52.
Standard and sampleof interest not inadjacent sampleposition
Calibrate using standard thatis in a sample positionadjacent to the sample ofinterest.
Correct initial velocitynot specified
Specify Initial Velocity in .BICfile before acquisition byselecting matrix. For moreinformation, see “Matrixinfluence” on page 5-22.
continued
Table 9-1 Spectrum Troubleshooting (Continued)
Symptom Possible Cause Action
Voyager™ Biospectrometry™ Workstation User’s Guide 9-11
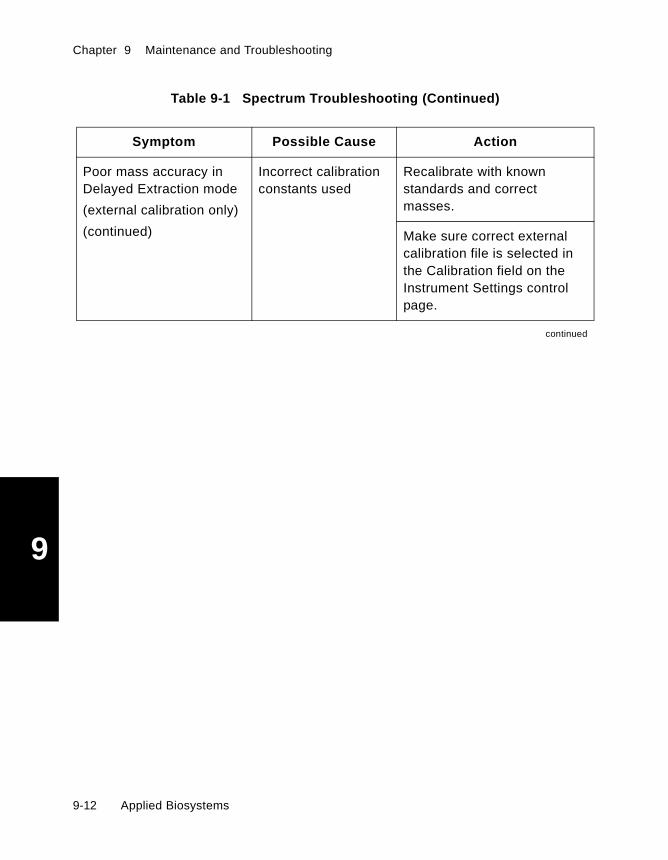
Chapter 9 Maintenance and Troubleshooting
9
Poor mass accuracy inDelayed Extraction mode
(external calibration only)
(continued)
Incorrect calibrationconstants used
Recalibrate with knownstandards and correctmasses.
Make sure correct externalcalibration file is selected inthe Calibration field on theInstrument Settings controlpage.
continued
Table 9-1 Spectrum Troubleshooting (Continued)
Symptom Possible Cause Action
9-12 Applied Biosystems

Troubleshooting
9
Poor signal-to-noise ratioor sensitivity
Laser intensity toohigh
Decrease laser intensity tothreshold by using the slidercontrols in the ManualLaser/Sample Positioningcontrol page (see page 4-27).
Laser intensity toolow
Increase laser intensity byusing the slider controls in theManual Laser/SamplePositioning control page (seepage 4-27).
Samplecontaminated
To test, mix the sample with astandard of known sensitivity.If the standard no longerexhibits the expectedsensitivity, a contaminant inthe sample is affectingsensitivity. Clean up sample.See Section 3.1.5, SampleCleanup.
Not averagingenough spectra
Average more spectra:
• Manual Control mode—Collect more spectra(shots/spectra) beforestopping acquisition
• Automatic Controlmode—Increase numberof spectra to acquire
continued
Table 9-1 Spectrum Troubleshooting (Continued)
Symptom Possible Cause Action
Voyager™ Biospectrometry™ Workstation User’s Guide 9-13
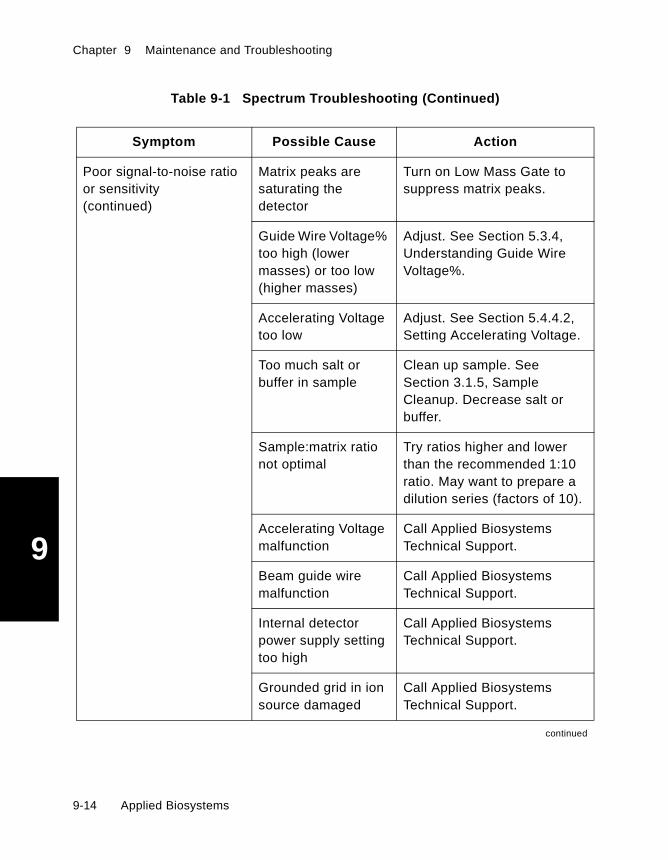
Chapter 9 Maintenance and Troubleshooting
9
Poor signal-to-noise ratioor sensitivity(continued)
Matrix peaks aresaturating thedetector
Turn on Low Mass Gate tosuppress matrix peaks.
Guide Wire Voltage%too high (lowermasses) or too low(higher masses)
Adjust. See Section 5.3.4,Understanding Guide WireVoltage%.
Accelerating Voltagetoo low
Adjust. See Section 5.4.4.2,Setting Accelerating Voltage.
Too much salt orbuffer in sample
Clean up sample. SeeSection 3.1.5, SampleCleanup. Decrease salt orbuffer.
Sample:matrix rationot optimal
Try ratios higher and lowerthan the recommended 1:10ratio. May want to prepare adilution series (factors of 10).
Accelerating Voltagemalfunction
Call Applied BiosystemsTechnical Support.
Beam guide wiremalfunction
Call Applied BiosystemsTechnical Support.
Internal detectorpower supply settingtoo high
Call Applied BiosystemsTechnical Support.
Grounded grid in ionsource damaged
Call Applied BiosystemsTechnical Support.
continued
Table 9-1 Spectrum Troubleshooting (Continued)
Symptom Possible Cause Action
9-14 Applied Biosystems
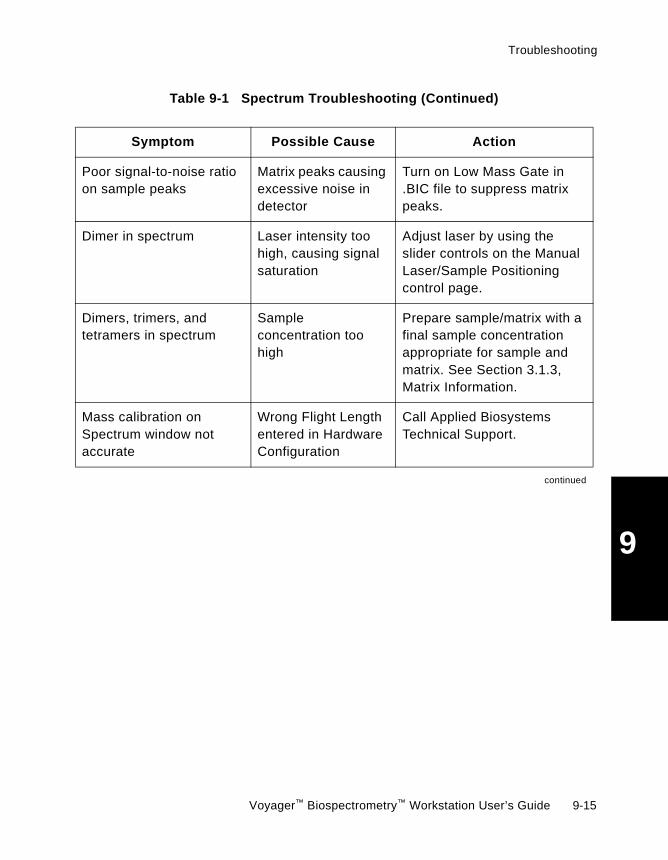
Troubleshooting
9
Poor signal-to-noise ratioon sample peaks
Matrix peaks causingexcessive noise indetector
Turn on Low Mass Gate in.BIC file to suppress matrixpeaks.
Dimer in spectrum Laser intensity toohigh, causing signalsaturation
Adjust laser by using theslider controls on the ManualLaser/Sample Positioningcontrol page.
Dimers, trimers, andtetramers in spectrum
Sampleconcentration toohigh
Prepare sample/matrix with afinal sample concentrationappropriate for sample andmatrix. See Section 3.1.3,Matrix Information.
Mass calibration onSpectrum window notaccurate
Wrong Flight Lengthentered in HardwareConfiguration
Call Applied BiosystemsTechnical Support.
continued
Table 9-1 Spectrum Troubleshooting (Continued)
Symptom Possible Cause Action
Voyager™ Biospectrometry™ Workstation User’s Guide 9-15

Chapter 9 Maintenance and Troubleshooting
9
Peaks not symmetrical Laser intensity toohigh
Decrease laser intensity byusing the slider controls onthe Manual Laser/SamplePositioning control page.
Sample containsmore than onecomponent
Purify sample beforeanalyzing.
On Voyager-DE PROand Voyager-DESTR systems,isotopes are onlypartially separated,because you areusing a setting veryclose to laserthreshold
Increase laser intensity byusing the slider controls onthe Manual Laser controlpage to improve symmetry,but data is accurate as is.
NOTE: Increasing the laserintensity may decreaseresolution.
Signal is saturatingdetector
Decrease laser intensity byusing the slider controls onthe Manual Laser controlpage.
continued
Table 9-1 Spectrum Troubleshooting (Continued)
Symptom Possible Cause Action
9-16 Applied Biosystems
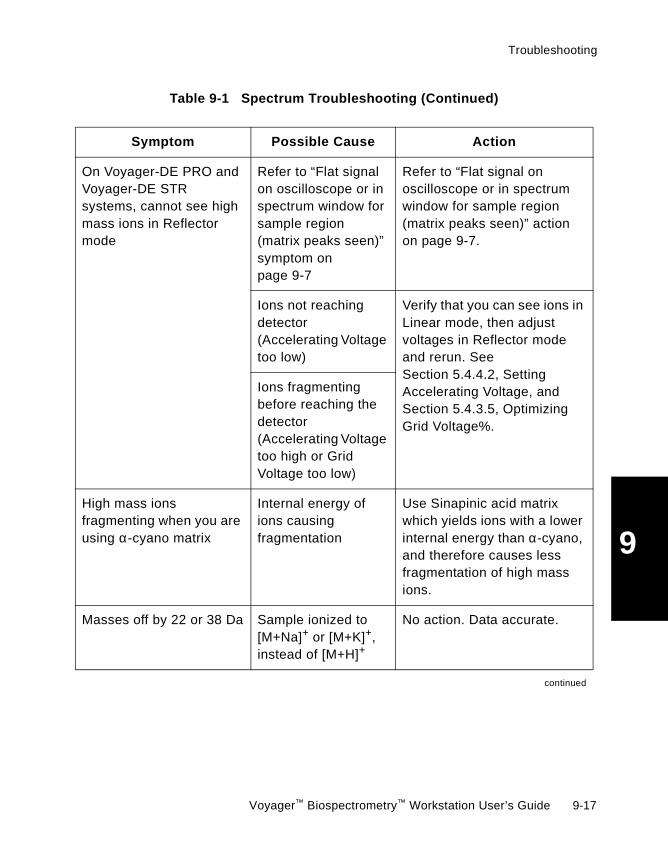
Troubleshooting
9
On Voyager-DE PRO andVoyager-DE STRsystems, cannot see highmass ions in Reflectormode
Refer to “Flat signalon oscilloscope or inspectrum window forsample region(matrix peaks seen)”symptom onpage 9-7
Refer to “Flat signal onoscilloscope or in spectrumwindow for sample region(matrix peaks seen)” actionon page 9-7.
Ions not reachingdetector(Accelerating Voltagetoo low)
Verify that you can see ions inLinear mode, then adjustvoltages in Reflector modeand rerun. SeeSection 5.4.4.2, SettingAccelerating Voltage, andSection 5.4.3.5, OptimizingGrid Voltage%.
Ions fragmentingbefore reaching thedetector(Accelerating Voltagetoo high or GridVoltage too low)
High mass ionsfragmenting when you areusing α-cyano matrix
Internal energy ofions causingfragmentation
Use Sinapinic acid matrixwhich yields ions with a lowerinternal energy than α-cyano,and therefore causes lessfragmentation of high massions.
Masses off by 22 or 38 Da Sample ionized to[M+Na]+ or [M+K]+,instead of [M+H]+
No action. Data accurate.
continued
Table 9-1 Spectrum Troubleshooting (Continued)
Symptom Possible Cause Action
Voyager™ Biospectrometry™ Workstation User’s Guide 9-17
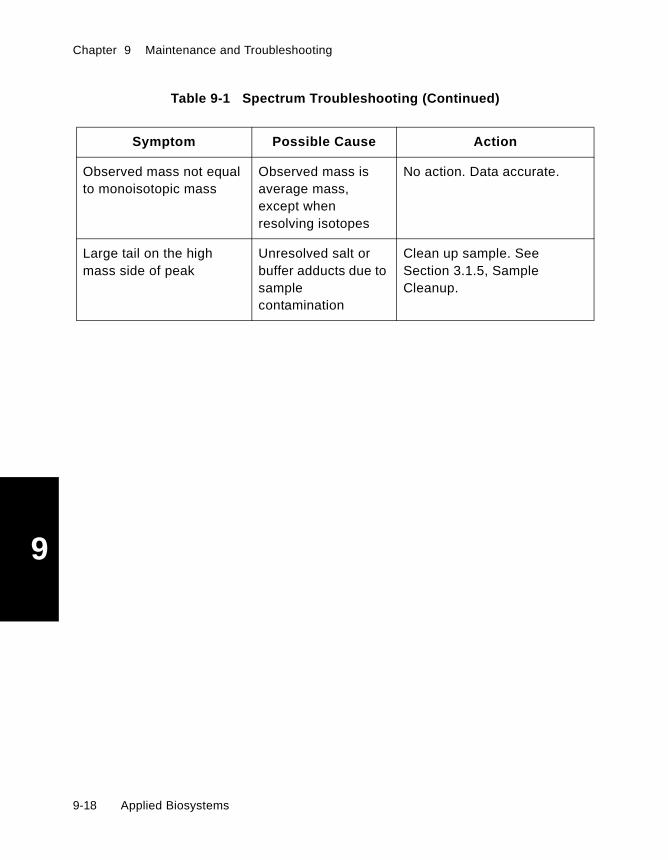
Chapter 9 Maintenance and Troubleshooting
9
Observed mass not equalto monoisotopic mass
Observed mass isaverage mass,except whenresolving isotopes
No action. Data accurate.
Large tail on the highmass side of peak
Unresolved salt orbuffer adducts due tosamplecontamination
Clean up sample. SeeSection 3.1.5, SampleCleanup.
Table 9-1 Spectrum Troubleshooting (Continued)
Symptom Possible Cause Action
9-18 Applied Biosystems

Troubleshooting
9
9.2.2 Software Troubleshooting
This section includes:
• Instrument Control Panel troubleshooting• Sequence Control Panel troubleshooting• PSD troubleshooting• Checking the Windows NT Event Log
Table 9-2 Instrument Control Panel Troubleshooting
Symptom Possible Cause Action
Load/Eject button orcommand dimmed
Communication problembetween sample loaderand software
Select Reinitialize fromthe Instrument menu.
Acquisition timeoutmessage displayed
Communication problembetween digitizer andsoftware
1. Make sure all cablesbetween digitizer andmass spectrometer issecurely connected(see Figure 2-4 onpage 2-11).
If your system includesa LeCroy digitizer,check networkconnections betweenthe digitizer and thecomputer.
2. Select Reinitialize fromthe Instrument menu.
3. If the problemcontinues, call AppliedBiosystems.
continued
Voyager™ Biospectrometry™ Workstation User’s Guide 9-19
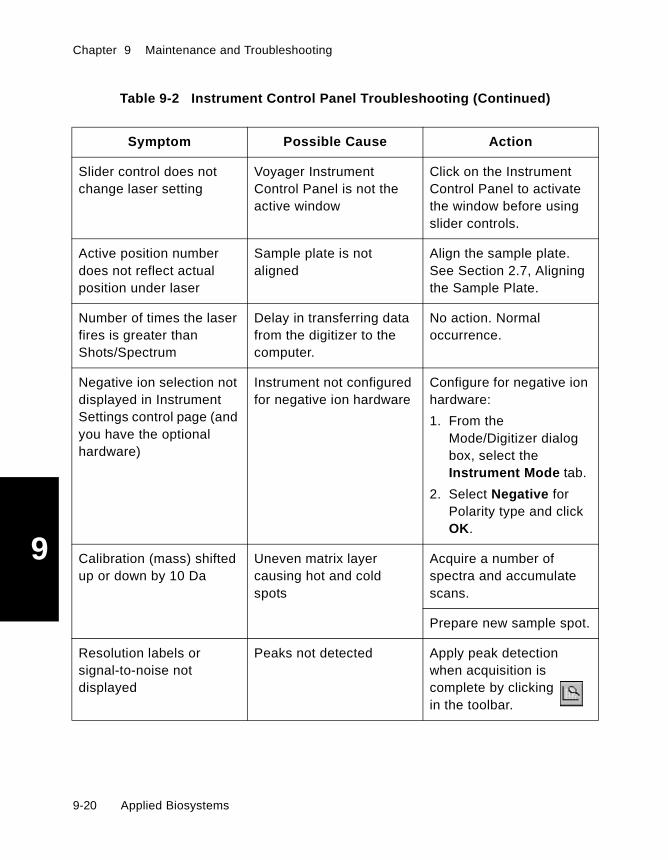
Chapter 9 Maintenance and Troubleshooting
9
Slider control does notchange laser setting
Voyager InstrumentControl Panel is not theactive window
Click on the InstrumentControl Panel to activatethe window before usingslider controls.
Active position numberdoes not reflect actualposition under laser
Sample plate is notaligned
Align the sample plate.See Section 2.7, Aligningthe Sample Plate.
Number of times the laserfires is greater thanShots/Spectrum
Delay in transferring datafrom the digitizer to thecomputer.
No action. Normaloccurrence.
Negative ion selection notdisplayed in InstrumentSettings control page (andyou have the optionalhardware)
Instrument not configuredfor negative ion hardware
Configure for negative ionhardware:
1. From theMode/Digitizer dialogbox, select theInstrument Mode tab.
2. Select Negative forPolarity type and clickOK.
Calibration (mass) shiftedup or down by 10 Da
Uneven matrix layercausing hot and coldspots
Acquire a number ofspectra and accumulatescans.
Prepare new sample spot.
Resolution labels orsignal-to-noise notdisplayed
Peaks not detected Apply peak detectionwhen acquisition iscomplete by clickingin the toolbar.
Table 9-2 Instrument Control Panel Troubleshooting (Continued)
Symptom Possible Cause Action
9-20 Applied Biosystems
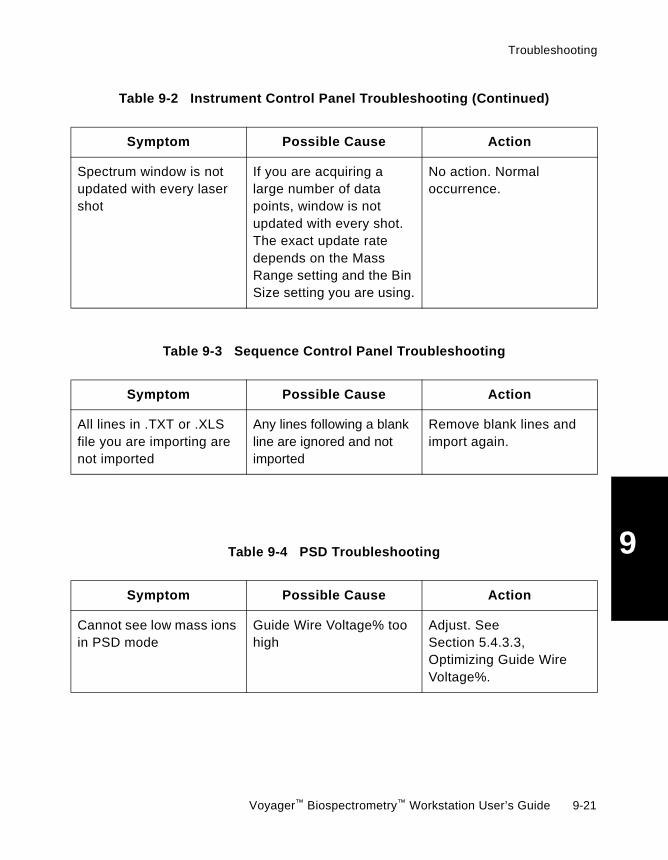
Troubleshooting
9
Spectrum window is notupdated with every lasershot
If you are acquiring alarge number of datapoints, window is notupdated with every shot.The exact update ratedepends on the MassRange setting and the BinSize setting you are using.
No action. Normaloccurrence.
Table 9-2 Instrument Control Panel Troubleshooting (Continued)
Symptom Possible Cause Action
Table 9-3 Sequence Control Panel Troubleshooting
Symptom Possible Cause Action
All lines in .TXT or .XLSfile you are importing arenot imported
Any lines following a blankline are ignored and notimported
Remove blank lines andimport again.
Table 9-4 PSD Troubleshooting
Symptom Possible Cause Action
Cannot see low mass ionsin PSD mode
Guide Wire Voltage% toohigh
Adjust. SeeSection 5.4.3.3,Optimizing Guide WireVoltage%.
Voyager™ Biospectrometry™ Workstation User’s Guide 9-21

Chapter 9 Maintenance and Troubleshooting
9
Checking theWindows NT
Event Log
The Windows NT Event Log is a running list of events thatautomatically starts when you run Windows NT. An event isconsidered any significant occurrence in the system orapplication that requires the user to be notified.
You can use Event Viewer to monitor the events that occur inyour system. You must be logged in with an account that hasadministrator rights. To display Event Viewer:
1. Select Administrative Tools from the Program folderon the Windows Start taskbar.
2. Click Event Viewer.
The Event Viewer - System Log displays a running logof the events on your system. Critical event messagesare displayed on your screen. Events that do notrequire immediate attention are logged in the Event Logto provide information without disturbing your work.
3. If desired, clear the Event Log:
• Select Save As from the Log menu and save theevent log before clearing.
• Select Clear All Events from the Log menu.
4. Select Exit to return to the Window NT desktop.
Peak selected withPrecursor Ion Selector notappearing, or notappearing at expectedmass (single-stage mirroronly)
Timed ion selector notworking, due to invalidFlight Length value orGate Width value
Call Applied BiosystemsTechnical Support.
Table 9-4 PSD Troubleshooting
Symptom Possible Cause Action
9-22 Applied Biosystems
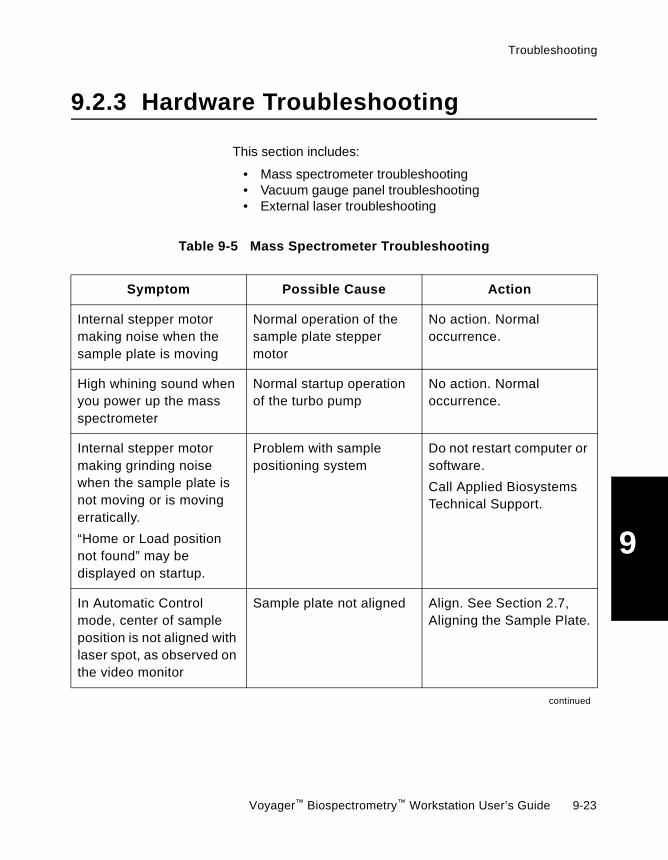
Troubleshooting
9
9.2.3 Hardware Troubleshooting
This section includes:
• Mass spectrometer troubleshooting• Vacuum gauge panel troubleshooting• External laser troubleshooting
Table 9-5 Mass Spectrometer Troubleshooting
Symptom Possible Cause Action
Internal stepper motormaking noise when thesample plate is moving
Normal operation of thesample plate steppermotor
No action. Normaloccurrence.
High whining sound whenyou power up the massspectrometer
Normal startup operationof the turbo pump
No action. Normaloccurrence.
Internal stepper motormaking grinding noisewhen the sample plate isnot moving or is movingerratically.
“Home or Load positionnot found” may bedisplayed on startup.
Problem with samplepositioning system
Do not restart computer orsoftware.
Call Applied BiosystemsTechnical Support.
In Automatic Controlmode, center of sampleposition is not aligned withlaser spot, as observed onthe video monitor
Sample plate not aligned Align. See Section 2.7,Aligning the Sample Plate.
continued
Voyager™ Biospectrometry™ Workstation User’s Guide 9-23
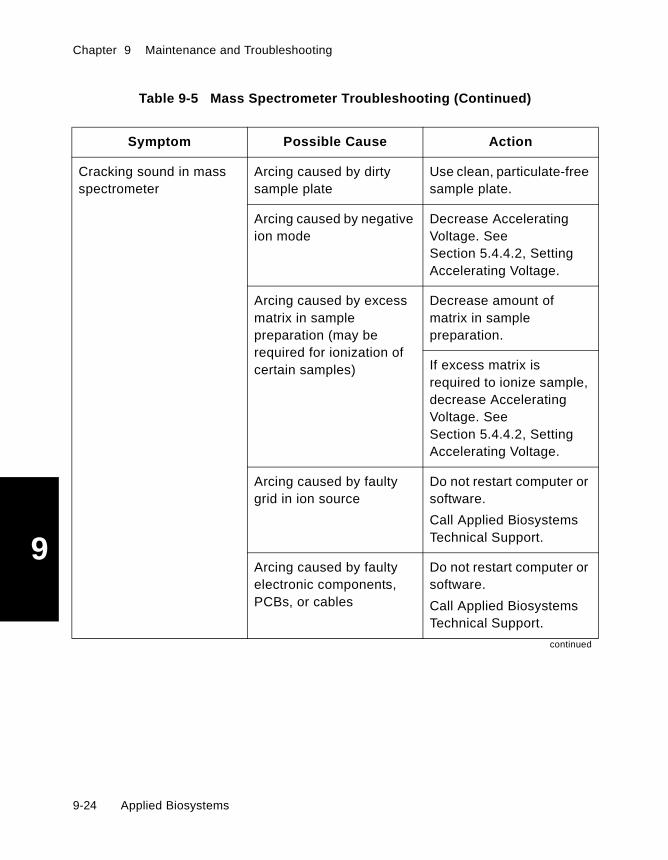
Chapter 9 Maintenance and Troubleshooting
9
Cracking sound in massspectrometer
Arcing caused by dirtysample plate
Use clean, particulate-freesample plate.
Arcing caused by negativeion mode
Decrease AcceleratingVoltage. SeeSection 5.4.4.2, SettingAccelerating Voltage.
Arcing caused by excessmatrix in samplepreparation (may berequired for ionization ofcertain samples)
Decrease amount ofmatrix in samplepreparation.
If excess matrix isrequired to ionize sample,decrease AcceleratingVoltage. SeeSection 5.4.4.2, SettingAccelerating Voltage.
Arcing caused by faultygrid in ion source
Do not restart computer orsoftware.
Call Applied BiosystemsTechnical Support.
Arcing caused by faultyelectronic components,PCBs, or cables
Do not restart computer orsoftware.
Call Applied BiosystemsTechnical Support.
continued
Table 9-5 Mass Spectrometer Troubleshooting (Continued)
Symptom Possible Cause Action
9-24 Applied Biosystems

Troubleshooting
9
Vacuum gaugepanel
The Vacuum Gauge Panel (Figure 9-2) is located on:
• Voyager-DE and Voyager-DE PRO—On the right frontof the mass spectrometer cabinet.
• Voyager-DE STR—On the front lower left of the massspectrometer cabinet.
NOTE: The vacuum gauge panel is located behind the frontpanel of the mass spectrometer cabinet.
Figure 9-2 Vacuum Gauge Panel
Sample holder emptywhen you click Eject
CAUTION: Do not loadanother plate if the sampleholder is empty when youeject.
Problem with sampleejecting mechanism
Call Applied BiosystemsTechnical Support.
Sample plate jammed insystem
Call Applied BiosystemsTechnical Support.
Table 9-5 Mass Spectrometer Troubleshooting (Continued)
Symptom Possible Cause Action
1.2 -7Chan
EMS
TORR
BA 1
.001
.11.0
ATM
EMIS
TC1
PB100270
Voyager™ Biospectrometry™ Workstation User’s Guide 9-25

Chapter 9 Maintenance and Troubleshooting
9
CAUTION
Do not press any other buttons on the panel. Pressingbuttons other than the Chan and EMIS buttons canrecalibrate the pressure scale of the system.
You use two buttons on the pressure gauge panel:
• Chan—Toggles through readings for:
• EMIS—Turns BA1 and BA2 on or off. Used duringtroubleshooting only.
Gauge Measures Expected Pressure
BA1 Pressure in mainsource chamber
• Voyager-DE and Voyager-DE PRO—Less than 10–6
• Voyager-DE STR—Less than 5 × 10⁻⁷
BA2 Pressure in mirrorchamber(Voyager-DE PROonly)
• Voyager-DE and Voyager-DE PRO—Less than 2x10⁻⁷
• Voyager-DE STR—Less than 5 × 10⁻⁸
TC2 Pressure insample loadingchamber
Less than 5 × 10⁻² during operation. Higherwhen loading or
ejecting sample plate.
TC1,TC3,TC4
Not used, displaysE03 (indicatesgauge notconnected)
______
9-26 Applied Biosystems

Troubleshooting
9
Table 9-6 Vacuum Gauge Panel Troubleshooting
Symptom Possible Cause Action
E02 error messagedisplayed on gaugecontroller
BA1 or BA2 shut downdue to sudden surge ofhigh pressure, forexample, when a wetsample plate is inserted
Press the EMIS button onPressure Gauge ControlPanel to turn off. Pressagain to turn on.
Call Applied BiosystemsTechnical Support if erroroccurs again.
E03 error messagedisplayed on gaugecontroller
Ion gauge connectionbroken or disconnected
Call Applied BiosystemsTechnical Support.
E05 error messagedisplayed on gaugecontroller
E09 error messagedisplayed on gaugecontroller for BA1 or BA2
BA1 or BA2 gauges shutdown due to highpressure. May be causedby:
• Sudden increase inpressure whensample plate inserted
• Vacuum leak
Press the EMIS button onPressure Gauge ControlPanel to turn off. Pressagain to turn on.
Call Applied BiosystemsTechnical Support if erroroccurs again.
E08 error messagedisplayed on gaugecontroller
Vacuum gauge boardfailed
Power down the massspectrometer and thenpower up.
Call Applied BiosystemsTechnical Support if erroroccurs again.
Voyager™ Biospectrometry™ Workstation User’s Guide 9-27

Chapter 9 Maintenance and Troubleshooting
9
Table 9-7 External Laser Troubleshooting
Symptom Possible Cause Action
Laser does not fire whenyou start acquisition
External laser not set afterswitching from internal toexternal laser
Reset. See Section 2.9,Resetting theOptional External Laser.
Laser position on thesample drifts
If the laser is left on forlong periods of time,position may drift
Press Stop then Start, orReset.
9-28 Applied Biosystems

Appendix
AA Specifications
This appendix contains the following sections:A.1 Voyager-DE Specifications ...................... A-2
A.2 Voyager-DE PRO Specifications .......... A-5
A.3 Voyager-DE STR Specifications ........... A-8
A.4 Digitizer Specifications .......................... A-11
NOTE: The specifications for this instrument are subject tochange without notice.
Voyager™ Biospectrometry™ Workstation User’s Guide A-1
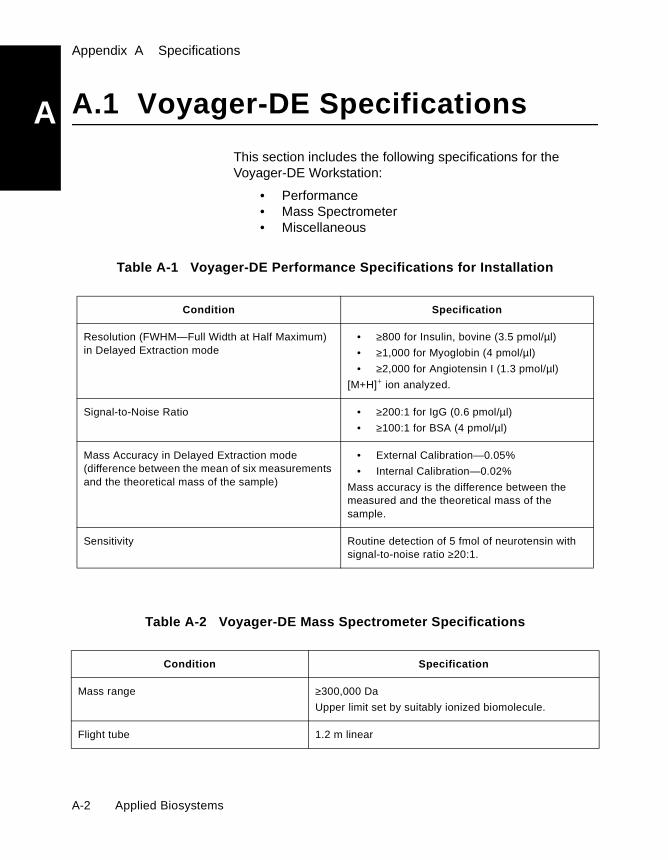
Appendix A Specifications
A
A.1 Voyager-DE SpecificationsThis section includes the following specifications for theVoyager-DE Workstation:
• Performance• Mass Spectrometer• Miscellaneous
Table A-1 Voyager-DE Performance Specifications for Installation
Condition Specification
Resolution (FWHM—Full Width at Half Maximum)in Delayed Extraction mode
• ≥800 for Insulin, bovine (3.5 pmol/µl)
• ≥1,000 for Myoglobin (4 pmol/µl)
• ≥2,000 for Angiotensin I (1.3 pmol/µl)
[M+H]+ ion analyzed.
Signal-to-Noise Ratio • ≥200:1 for IgG (0.6 pmol/µl)
• ≥100:1 for BSA (4 pmol/µl)
Mass Accuracy in Delayed Extraction mode(difference between the mean of six measurementsand the theoretical mass of the sample)
• External Calibration—0.05%
• Internal Calibration—0.02%
Mass accuracy is the difference between themeasured and the theoretical mass of thesample.
Sensitivity Routine detection of 5 fmol of neurotensin withsignal-to-noise ratio ≥20:1.
Table A-2 Voyager-DE Mass Spectrometer Specifications
Condition Specification
Mass range ≥300,000 Da
Upper limit set by suitably ionized biomolecule.
Flight tube 1.2 m linear
A-2 Applied Biosystems
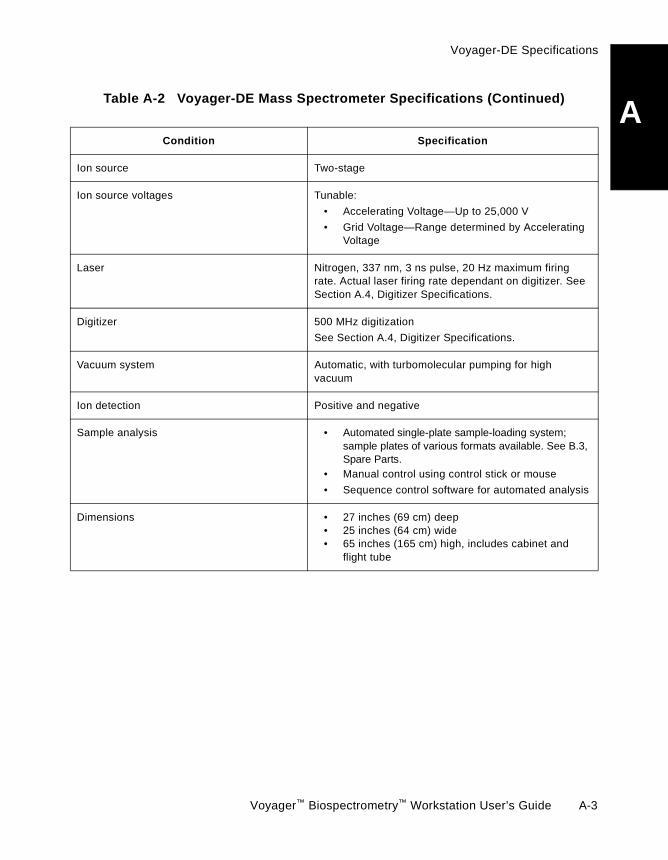
Voyager-DE Specifications
A
Ion source Two-stage
Ion source voltages Tunable:
• Accelerating Voltage—Up to 25,000 V
• Grid Voltage—Range determined by AcceleratingVoltage
Laser Nitrogen, 337 nm, 3 ns pulse, 20 Hz maximum firingrate. Actual laser firing rate dependant on digitizer. SeeSection A.4, Digitizer Specifications.
Digitizer 500 MHz digitization
See Section A.4, Digitizer Specifications.
Vacuum system Automatic, with turbomolecular pumping for highvacuum
Ion detection Positive and negative
Sample analysis • Automated single-plate sample-loading system;sample plates of various formats available. See B.3,Spare Parts.
• Manual control using control stick or mouse
• Sequence control software for automated analysis
Dimensions • 27 inches (69 cm) deep• 25 inches (64 cm) wide• 65 inches (165 cm) high, includes cabinet and
flight tube
Table A-2 Voyager-DE Mass Spectrometer Specifications (Continued)
Condition Specification
Voyager™ Biospectrometry™ Workstation User’s Guide A-3
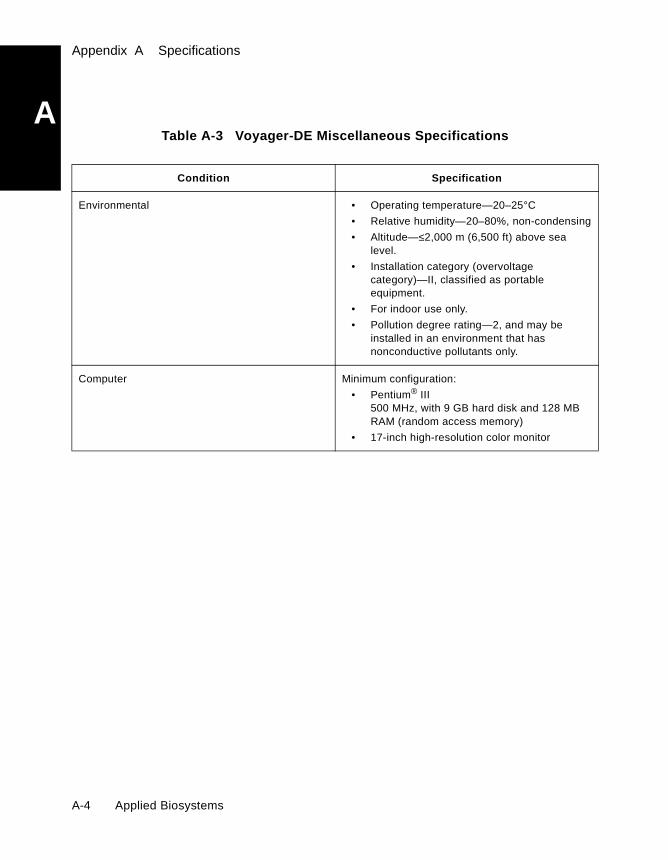
Appendix A Specifications
A
Table A-3 Voyager-DE Miscellaneous SpecificationsCondition Specification
Environmental • Operating temperature—20–25°C
• Relative humidity—20–80%, non-condensing
• Altitude—≤2,000 m (6,500 ft) above sealevel.
• Installation category (overvoltagecategory)—II, classified as portableequipment.
• For indoor use only.
• Pollution degree rating—2, and may beinstalled in an environment that hasnonconductive pollutants only.
Computer Minimum configuration:
• Pentium® III500 MHz, with 9 GB hard disk and 128 MBRAM (random access memory)
• 17-inch high-resolution color monitor
A-4 Applied Biosystems

Voyager-DE PRO Specifications
A
A.2 Voyager-DE PRO SpecificationsThis section includes the following specifications for theVoyager-DE PRO Workstation:
• Performance• Mass Spectrometer• Miscellaneous
Table A-4 Voyager-DE PRO Performance Specifications for Installation
Condition Specification
Resolution (FWHM—Full Widthat Half Maximum) in DelayedExtraction mode
Linear mode:• ≥1,000 for Myoglobin (4 pmol/µl)• ≥2,500 for Angiotensin I (1.3 pmol/µl)
Reflector mode:• ≥10,000 for bovine insulin (3.5 pmol/µl)• ≥1,200 for E. coli Thioredoxin (2.75 pmol/µl)• ≥7,000 for Angiotensin (2.0 pmol/µl)• ≥7,000 for ACTH Clips
• ACTH 1-17 (2.0 pmol/µl)• ACTH 18-39 (1.5 pmol/µl)• ACTH 7-38 (3.0 pmol/µl)
[M+H]+ ion analyzed.
Signal-to-Noise Ratio • ≥200:1 for IgG (0.6 pmol/µl)
• ≥100:1 for BSA (4 pmol/µl)
Mass Accuracy in DelayedExtraction mode (differencebetween the mean of sixmeasurements and thetheoretical mass of the sample)
Linear mode:• External Calibration—0.05%• Internal Calibration—0.02%
Reflector mode:• External Calibration—0.01%• Internal Calibration—0.002%
Sensitivity Routine detection of 5 fmol of neurotensin with signal-to-noise ratio:
• ≥20:1 in Linear mode• ≥10:1 in Reflector mode
Mass Accuracy of FragmentIons
+/- 1 Da
Resolution of PSD Precursor(Timed) Ion Selection
80
Voyager™ Biospectrometry™ Workstation User’s Guide A-5

Appendix A Specifications
A
Table A-5 Voyager-DE PRO Mass Spectrometer SpecificationsCondition Specification
Mass range ≥300,000 DaUpper limit set by suitably ionized biomolecule.
Reflector Single-stage with optimized optics for PSD Analysis
Flight tube (horizontal) • Linear mode—1.3 m• Reflector mode—2.0 m
Ion source Two-stage
Ion source voltages Tunable:• Accelerating Voltage—Up to 25,000 V• Grid Voltage—Range determined by Accelerating Voltage
Laser Nitrogen, 337 nm, 3 ns pulse, 20 Hz maximum firing rate. Actuallaser firing rate dependant on digitizer. See Section A.4, DigitizerSpecifications.
Digitizer 2 GHz digitization for enhanced resolution
See Section A.4, Digitizer Specifications.
Vacuum system • Dual differential turbomolecular pumping for high vacuum• Multi-vacuum gauge capability for independent monitoring of
source and analyzer regions
Ion detection Positive and negative
Sample analysis • Automated single-plate sample-loading system; sample plates ofvarious formats currently available. See B.3, Spare Parts.
• Manual control using control stick or mouse• Sequence control software for automated analysis
Dimensions • 27 inches (69 cm) deep• 25 inches (64 cm) wide• 65 inches (165 cm) high, includes cabinet and flight tube
A-6 Applied Biosystems
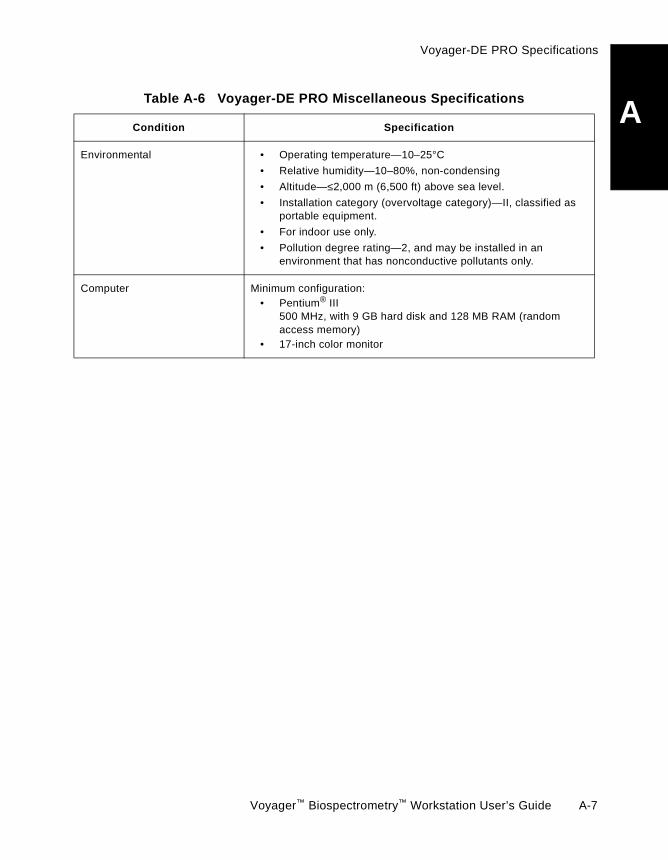
Voyager-DE PRO Specifications
A
Table A-6 Voyager-DE PRO Miscellaneous SpecificationsCondition Specification
Environmental • Operating temperature—10–25°C
• Relative humidity—10–80%, non-condensing
• Altitude—≤2,000 m (6,500 ft) above sea level.
• Installation category (overvoltage category)—II, classified asportable equipment.
• For indoor use only.
• Pollution degree rating—2, and may be installed in anenvironment that has nonconductive pollutants only.
Computer Minimum configuration:• Pentium® III
500 MHz, with 9 GB hard disk and 128 MB RAM (randomaccess memory)
• 17-inch color monitor
Voyager™ Biospectrometry™ Workstation User’s Guide A-7
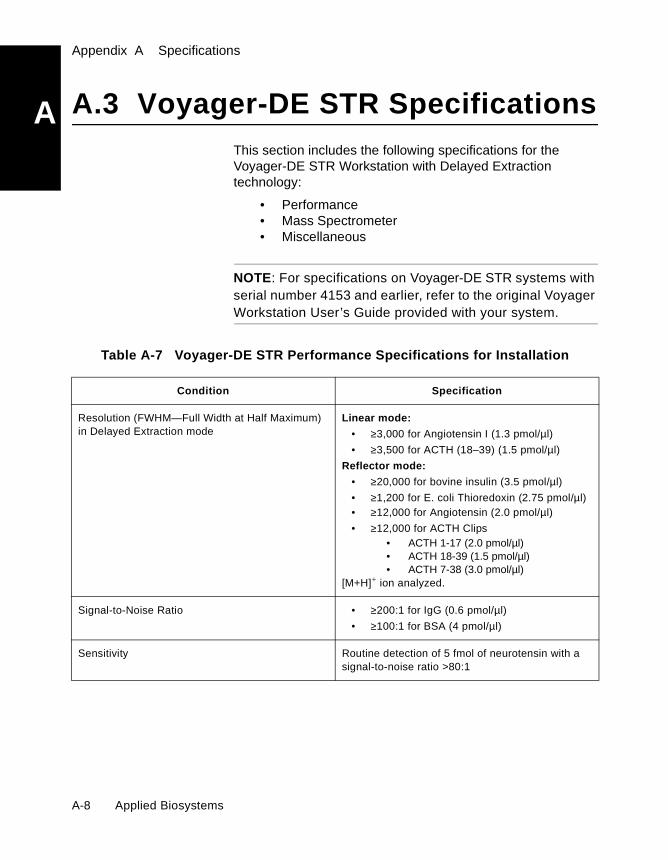
Appendix A Specifications
A
A.3 Voyager-DE STR SpecificationsThis section includes the following specifications for theVoyager-DE STR Workstation with Delayed Extractiontechnology:• Performance• Mass Spectrometer• Miscellaneous
NOTE: For specifications on Voyager-DE STR systems withserial number 4153 and earlier, refer to the original VoyagerWorkstation User’s Guide provided with your system.
Table A-7 Voyager-DE STR Performance Specifications for Installation
Condition Specification
Resolution (FWHM—Full Width at Half Maximum)in Delayed Extraction mode
Linear mode:
• ≥3,000 for Angiotensin I (1.3 pmol/µl)
• ≥3,500 for ACTH (18–39) (1.5 pmol/µl)
Reflector mode:
• ≥20,000 for bovine insulin (3.5 pmol/µl)
• ≥1,200 for E. coli Thioredoxin (2.75 pmol/µl)• ≥12,000 for Angiotensin (2.0 pmol/µl)
• ≥12,000 for ACTH Clips• ACTH 1-17 (2.0 pmol/µl)• ACTH 18-39 (1.5 pmol/µl)• ACTH 7-38 (3.0 pmol/µl)
[M+H]+ ion analyzed.
Signal-to-Noise Ratio • ≥200:1 for IgG (0.6 pmol/µl)
• ≥100:1 for BSA (4 pmol/µl)
Sensitivity Routine detection of 5 fmol of neurotensin with asignal-to-noise ratio >80:1
A-8 Applied Biosystems
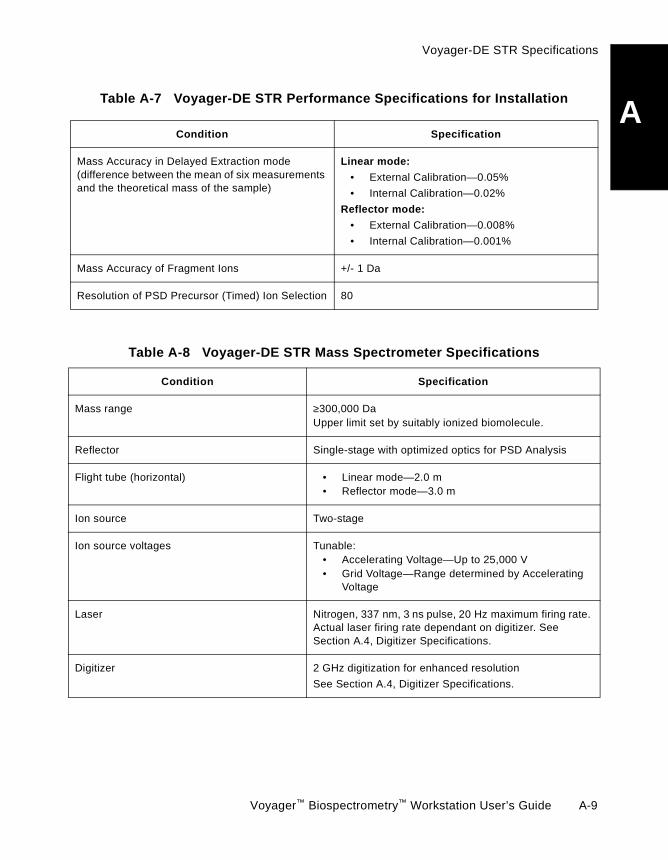
Voyager-DE STR Specifications
A
Mass Accuracy in Delayed Extraction mode(difference between the mean of six measurementsand the theoretical mass of the sample)Linear mode:
• External Calibration—0.05%
• Internal Calibration—0.02%
Reflector mode:
• External Calibration—0.008%
• Internal Calibration—0.001%
Mass Accuracy of Fragment Ions +/- 1 Da
Resolution of PSD Precursor (Timed) Ion Selection 80
Table A-7 Voyager-DE STR Performance Specifications for Installation
Condition Specification
Table A-8 Voyager-DE STR Mass Spectrometer Specifications
Condition Specification
Mass range ≥300,000 DaUpper limit set by suitably ionized biomolecule.
Reflector Single-stage with optimized optics for PSD Analysis
Flight tube (horizontal) • Linear mode—2.0 m• Reflector mode—3.0 m
Ion source Two-stage
Ion source voltages Tunable:• Accelerating Voltage—Up to 25,000 V• Grid Voltage—Range determined by Accelerating
Voltage
Laser Nitrogen, 337 nm, 3 ns pulse, 20 Hz maximum firing rate.Actual laser firing rate dependant on digitizer. SeeSection A.4, Digitizer Specifications.
Digitizer 2 GHz digitization for enhanced resolution
See Section A.4, Digitizer Specifications.
Voyager™ Biospectrometry™ Workstation User’s Guide A-9

Appendix A Specifications
A
Vacuum system • Dual differential turbomolecular pumping for ultra-high vacuum• Multi-vacuum gauge capability for independent
monitoring of source and analyzer regions
Ion detection Positive and negative
Sample analysis • Automated single-plate sample-loading system;sample plates of various formats currently available.See B.3, Spare Parts.
• Manual control using control stick or mouse• Sequence Control software for automated analysis
Dimensions • 34 inches (87 cm) deep• 94 inches (239 cm) wide• 46 inches (117 cm) high
Table A-8 Voyager-DE STR Mass Spectrometer Specifications (Continued)
Condition Specification
Table A-9 Voyager-DE STR Miscellaneous Specifications
Condition Specification
Environmental • Operating temperature—10–25°C
• Relative humidity—10–80%, non-condensing
• Altitude—≤2,000 m (6,500 ft) above sealevel.
• Installation category (overvoltagecategory)—II, classified as portableequipment.
• For indoor use only.
• Pollution degree rating—2, and may beinstalled in an environment that hasnonconductive pollutants only.
Computer Minimum configuration:• Pentium® III
500 MHz, with 9 GB hard disk and 128 MBRAM (random access memory)
• 17-inch color monitor
A-10 Applied Biosystems
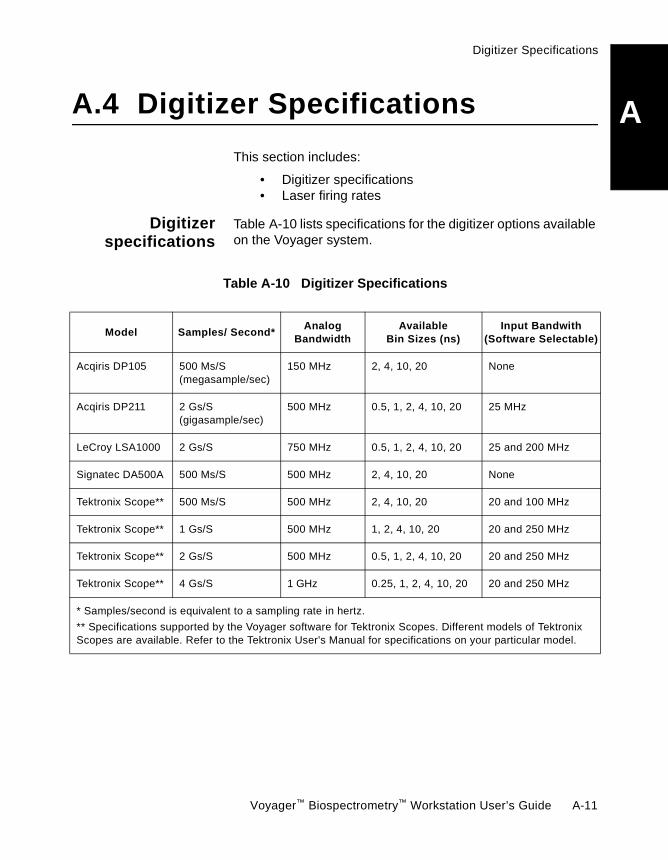
Digitizer Specifications
A
A.4 Digitizer SpecificationsThis section includes:
• Digitizer specifications• Laser firing rates
Digitizerspecifications
Table A-10 lists specifications for the digitizer options availableon the Voyager system.
Table A-10 Digitizer Specifications
Model Samples/ Second*Analog
BandwidthAvailable
Bin Sizes (ns)Input Bandwith
(Software Selectable)
Acqiris DP105 500 Ms/S(megasample/sec)
150 MHz 2, 4, 10, 20 None
Acqiris DP211 2 Gs/S(gigasample/sec)
500 MHz 0.5, 1, 2, 4, 10, 20 25 MHz
LeCroy LSA1000 2 Gs/S 750 MHz 0.5, 1, 2, 4, 10, 20 25 and 200 MHz
Signatec DA500A 500 Ms/S 500 MHz 2, 4, 10, 20 None
Tektronix Scope** 500 Ms/S 500 MHz 2, 4, 10, 20 20 and 100 MHz
Tektronix Scope** 1 Gs/S 500 MHz 1, 2, 4, 10, 20 20 and 250 MHz
Tektronix Scope** 2 Gs/S 500 MHz 0.5, 1, 2, 4, 10, 20 20 and 250 MHz
Tektronix Scope** 4 Gs/S 1 GHz 0.25, 1, 2, 4, 10, 20 20 and 250 MHz
* Samples/second is equivalent to a sampling rate in hertz.
** Specifications supported by the Voyager software for Tektronix Scopes. Different models of TektronixScopes are available. Refer to the Tektronix User's Manual for specifications on your particular model.
Voyager™ Biospectrometry™ Workstation User’s Guide A-11

Appendix A Specifications
A
Laser firing rates Figure A-1 shows the estimated laser firing rates for differentdigitizer models.Figure A-1 Estimated Laser Firing Rates Supported by Different Digitizer Models
A-12 Applied Biosystems

Bppendix
AB Warranty/ServiceInformation
This appendix contains the following sections:B.1 Limited Product Warranty ..................... B-2
B.2 Damages, Claims, Returns ................... B-5
B.3 Spare Parts....................................... B-6
Applied Biosystems supplies or recommends certain configurations of computerhardware, software, and peripherals for use with its instrumentation. AppliedBiosystems reserves the right to decline support for or impose charges forsupporting non-standard computer configurations that have not been supplied orrecommended by Applied Biosystems. Applied Biosystems also reserves the rightto require that computer hardware and software be restored to the standardconfiguration prior to providing service or technical support.
Voyager™ Biospectrometry™ Workstation User’s Guide B-1

Appendix B Warranty/Service Information
B
B.1 Limited Product Warranty
Limited warranty Applied Biosystems warrants that all standard components ofits Voyager™ Biospectrometry™ Workstations (the “Product”)purchased new will be free of defects in materials andworkmanship for a period of one (1) year. Applied Biosystemswill repair or replace, at its discretion, all defective componentsduring this warranty period. After this warranty period, repairsand replacement components may be purchased from AppliedBiosystems at its published rates. Applied Biosystems alsoprovides service agreements for post-warranty coverage.Applied Biosystems reserves the right to use new, repaired, orrefurbished instruments or components for warranty andpost-warranty replacements. Repair or replacement ofproducts or components under warranty does not extend theoriginal warranty period.
Applied Biosystems warrants that all optional accessoriessupplied with the Product, such as cameras, peripherals,printers, and special monitors, will be free of defects inmaterials and workmanship for a period of ninety (90) days.Applied Biosystems will repair or replace, at its discretion,defective accessories during this warranty period. After thiswarranty period, Applied Biosystems will pass on to the buyer,to the extent that it is permitted to do so, the warranty of theoriginal manufacturer for such accessories.
With the exception of chemicals and other consumableproducts, replaceable products or components that areobtained from Applied Biosystems and are used on theProduct are themselves warranted to be free of defects inmaterials and workmanship for ninety (90) days. AppliedBiosystems warrants that chemicals and other consumableproducts obtained from Applied Biosystems will be free ofdefects in materials and workmanship when received by thebuyer, but not thereafter, unless otherwise specified indocumentation accompanying the product.
B-2 Applied Biosystems
Limited Product Warranty
B
Applied Biosystems warrants that for a period of ninety (90)days the software designated for use with the Product willperform substantially in accordance with the function andfeatures described in its accompanying documentation whenproperly installed on the Product. Applied Biosystems doesnot warrant that the operation of the instrument or software willbe uninterrupted or error free. Applied Biosystems will provideany software corrections or “bug-fixes”, if and when theybecome available, for a period of ninety (90) days afterinstallation.
Warranty periodeffective date
Any applicable warranty period under these sections will beginon the date of installation for hardware and software installedby Applied Biosystems personnel, unless that date has beendelayed at the buyer's request, but in no event later than thirty(30) days after shipment. In that case, and for all hardwareand software installed by the buyer, and for all other products,the applicable warranty period begins the date the product orcomponent is delivered to the buyer.
Warranty claims Warranty claims must be made within the applicable warrantyperiod or, for chemicals or other consumable products, withinthirty (30) days after receipt by the buyer.
Warrantyexceptions
The foregoing warranties do not apply to defects resultingfrom misuse, neglect, or accident, including without limitation:operation with incompatible solvents or samples in the system;operation outside of the environmental or use specifications ornot in conformance with the instructions for the product oraccessories; performance of improper or inadequatemaintenance by the user; installation of software or interfacingnot supplied by Applied Biosystems; and modification or repairof the product or the software not authorized by AppliedBiosystems.
THE ABOVE PROVISIONS SET FORTH APPLIEDBIOSYSTEMS SOLE AND EXCLUSIVEREPRESENTATIONS, WARRANTIES, AND OBLIGATIONSWITH RESPECT TO ITS PRODUCTS, AND APPLIEDBIOSYSTEMS MAKES NO OTHER WARRANTY OF ANYKIND WHATSOEVER, EXPRESSED OR IMPLIED,INCLUDING WITHOUT LIMITATION, WARRANTIES OF
Voyager™ Biospectrometry™ Workstation User’s Guide B-3

Appendix B Warranty/Service Information
B
MERCHANTABILITY AND FITNESS FOR A PARTICULARPURPOSE, WHETHER ARISING FROM A STATUTE OROTHERWISE IN LAW OR FROM A COURSE OF DEALINGOR USAGE OF TRADE, ALL OF WHICH ARE EXPRESSLYDISCLAIMED.
Warrantylimitations
THE REMEDIES PROVIDED HEREIN ARE BUYER'S SOLEAND EXCLUSIVE REMEDIES. WITHOUT LIMITING THEGENERALITY OF THE FOREGOING, IN NO EVENT SHALLAPPLIED BIOSYSTEMS BE LIABLE, WHETHER INCONTRACT, TORT, WARRANTY, OR UNDER ANY STATUTE(INCLUDING WITHOUT LIMITATION, ANY TRADEPRACTICE, UNFAIR COMPETITION, OR OTHER STATUTEOF SIMILAR IMPORT) OR ON ANY OTHER BASIS, FORDIRECT, INDIRECT, PUNITIVE, INCIDENTAL, MULTIPLE,CONSEQUENTIAL, OR SPECIAL DAMAGES SUSTAINEDBY THE BUYER OR ANY OTHER PERSON, WHETHER ORNOT FORESEEABLE AND WHETHER OR NOT APPLIEDBIOSYSTEMS IS ADVISED OF THE POSSIBILITY OF SUCHDAMAGE, INCLUDING WITHOUT LIMITATION, DAMAGEARISING FROM OR RELATED TO LOSS OF USE, LOSS OFDATA, FAILURE OR INTERRUPTION IN THE OPERATIONOF ANY EQUIPMENT OR SOFTWARE, DELAY IN REPAIROR REPLACEMENT, OR FOR LOSS OF REVENUE ORPROFITS, LOSS OF GOOD WILL, LOSS OF BUSINESS OROTHER FINANCIAL LOSS OR PERSONAL INJURY ORPROPERTY DAMAGE.
NO AGENT, EMPLOYEE, OR REPRESENTATIVE OFAPPLIED BIOSYSTEMS HAS ANY AUTHORITY TO BINDAPPLIED BIOSYSTEMS TO ANY AFFIRMATION,REPRESENTATION, OR WARRANTY CONCERNING THEPRODUCT THAT IS NOT CONTAINED IN THIS LIMITEDWARRANTY STATEMENT. ANY SUCH AFFIRMATION,REPRESENTATION, OR WARRANTY MADE BY ANYAGENT, EMPLOYEE, OR REPRESENTATIVE OF APPLIEDBIOSYSTEMS WILL NOT BE BINDING ON APPLIEDBIOSYSTEMS.
THIS WARRANTY IS LIMITED TO THE BUYER OF THEPRODUCT FROM APPLIED BIOSYSTEMS AND IS NOTTRANSFERABLE.
B-4 Applied Biosystems
Damages, Claims, Returns
B
Limited Warrantyfor refurbished
units
The limited warranty period for refurbished units that are lessthan one (1) year old, is one (1) year for parts, labor and travel.The limited warranty period for refurbished units that are morethan one (1) year old is ninety (90) days for parts, labor andtravel. All of the foregoing terms, obligations and exclusionsregarding the purchase of new products shall apply torefurbished units.
B.2 Damages, Claims, Returns
Damages Please examine any shipments promptly after receipt to checkfor damage. Contact Applied Biosystems Service Departmentif you have questions about checking for damage.
If you discover damage, stop unpacking. Contact the shippingcarrier and request inspection by a local agent. Secure awritten report of the findings to support any claim. Do notreturn damaged goods to Applied Biosystems without firstsecuring an inspection report, and contacting AppliedBiosystems Technical Support for a Return Authorization (RA)number.
Claims After a damage inspection report is secured, claims should beprocessed through Applied Biosystems unless otherinstructions are provided.
Returns Please do not return any material without prior notification andauthorization.
If, for any reason, it becomes necessary to return material toApplied Biosystems, please contact Applied BiosystemsTechnical Support, or your nearest Applied Biosystemssubsidiary or distributor for:
• Return Authorization (RA) number• Forwarding address• Decontamination instructions• Packing and shipping instructions
Place the RA number in a prominent location on the outside ofthe shipping container, and return the material to the addressdesignated by the Applied Biosystems representative.
Voyager™ Biospectrometry™ Workstation User’s Guide B-5

Appendix B Warranty/Service Information
B
B.3 Spare Parts
Standards andmatrixes
The following compounds are available from the listedvendors. Part numbers are listed for your convenience andmay change without our knowledge.
Compound VendorVendor Part
Number
Sequazyme™ Peptide Mass Standards InstallKit includes:
AppliedBiosystems
4316866
• Sequazyme Mass Standards Kit P2-3143-00
• Voyager IgG1 Mass Standard GEN602151
• Sequazyme BSA Test Standard 2-2158-00
Sequazyme Pinpoint SNP Assay Kit AppliedBiosystems
4315924
Adrenocorticotropic hormone (ACTH) 7–38 Sigma A-1527
Adrenocorticotropic hormone (ACTH) 18–39 Sigma A-0673
Angiotensin I (human) Sigma A9650
Bradykinin Sigma B3259
Insulin Sigma I-5500
Myoglobin (horse heart) Sigma M-1882
α-cyano-4-hydroxycinnamic acid (CHCA) Sigma C-2020
Sinapinic acid (3, 5-dimethoxy-4-hydroxycinnamic acid)
Aldrich D13,460-0
B-6 Applied Biosystems

Spare Parts
B
Sample plates The following sample plates are available from AppliedBiosystems:
Description Part Number
Welled Sample Plates
Gold, 100-well V700401
Gold, 100-well (no pin, for Voyager Workstationsmanufactured in 1995 or earlier
V700208
Flat Sample Plates (Laser Etched)
Stainless steel, 100-position (indicated by numbers only) V700664
Stainless steel, 100-position (indicated by numbers only,no pin, for Voyager Workstations manufactured in 1995 orearlier)
V700665
Stainless steel, 100-position (indicated by numbers andcircles)
V700666
Stainless steel, 100-position (indicated by numbers andcircles, no pin, for Voyager Workstations manufactured in1995 or earlier)
V700667
Special Sample Plates
Stainless steel, polished blank surface V700668
Stainless steel, polished blank surface (no pin, for VoyagerWorkstations manufactured in 1995 or earlier)
V700669
Gold, 64-well, disposable, for use with disposable sampleplate holder (part number V700314)
V503476
Disposable sample plate holder, for use with gold, 64-well,disposable plate (part number V503476)
V700314
Biacore® Chip (holds 4 biochips) V700697
Voyager™ Biospectrometry™ Workstation User’s Guide B-7

Appendix B Warranty/Service Information
B
Membrane, Gels V700698
Hydrophobic plastic surface, flat, 400-position V700699
96 × 2-position, flat, hydrophobic plastic surface plate V700813
Description Part Number
B-8 Applied Biosystems
CAppendix
C Matrixes
This appendix provides information for commonly usedmatrixes. The information includes (see Table C-1 onpage C-6):
• Matrix mass spectra• Chemical structure• Applications• Description of physical appearance• Suggested solution concentration• Characteristic matrix ions
Refer to Figure C-1 through Figure C-9 for characteristicpeaks patterns and masses.
For additional matrix information, refer to the bibliography.
WARNING
CHEMICAL HAZARD. Refer to the Material Safety DataSheet (MSDS) provided by the chemical manufacturerbefore handling solvents or matrixes.
Voyager™ Biospectrometry™ Workstation User’s Guide C-1

Appendix C Matrixes
C
Figure C-1 Sinapinic Acid Matrix Spectrum
Figure C-2 α-cyano-4-hydroxycinnamic acid (CHCA) Matrix Spectrum
C-2 Applied Biosystems
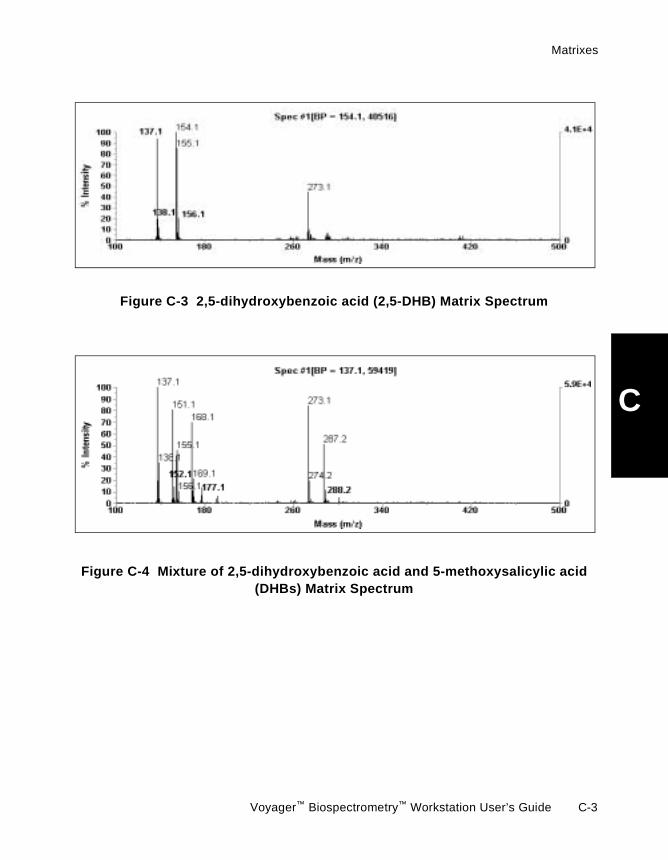
Matrixes
C
Figure C-3 2,5-dihydroxybenzoic acid (2,5-DHB) Matrix Spectrum
Figure C-4 Mixture of 2,5-dihydroxybenzoic acid and 5-methoxysalicylic acid(DHBs) Matrix Spectrum
Voyager™ Biospectrometry™ Workstation User’s Guide C-3
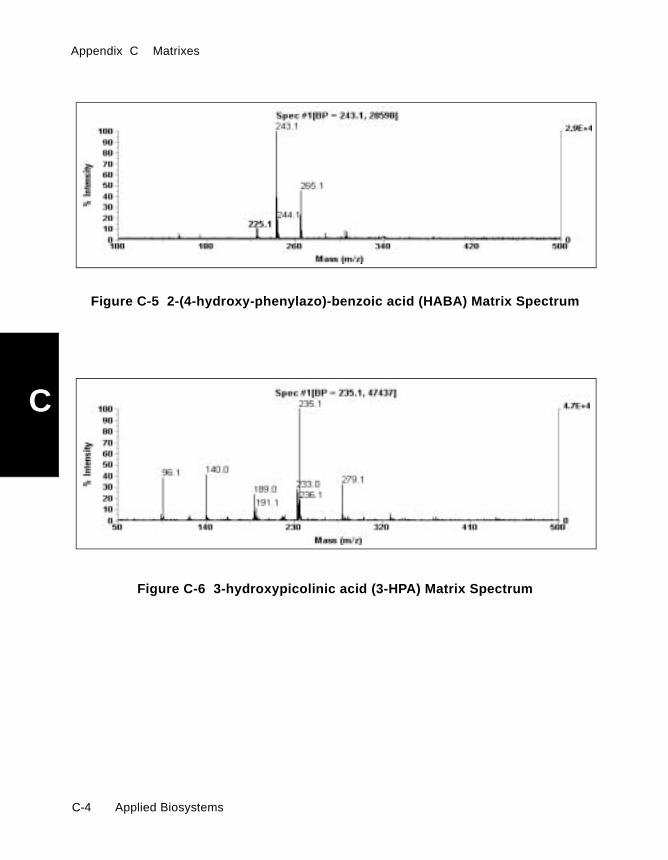
Appendix C Matrixes
C
Figure C-5 2-(4-hydroxy-phenylazo)-benzoic acid (HABA) Matrix Spectrum
Figure C-6 3-hydroxypicolinic acid (3-HPA) Matrix Spectrum
C-4 Applied Biosystems

Matrixes
C
Figure C-7 Dithranol Matrix Spectrum
Figure C-8 2,4,6 trihydroxyacetophenone (THAP) Spectrum
Voyager™ Biospectrometry™ Workstation User’s Guide C-5

Appendix C Matrixes
C
Figure C-9 trans-3-indoleacrylic acid (IAA) Matrix Spectrum
Table C-1 Matrix Information
Matrix Applications/ColorMatrix SolutionConcentration
CharacteristicMatrix Ions
(monoisotopic)
Sinapinic acid
(see massspectrum onpage C-2)
MW 224.07 Da
Applications:
• Peptides
• Proteins
Color of crystals/solution:
White
NOTE: Matrixpowder may alsocontain orangecrystals. Do not usecrystals whenpreparing solutions.
• 10 mg/ml in 70:30water/acetonitrile(0.1% TFA finalconc.)
• 10 mg/ml in 50:50water/acetonitrile(0.1% TFA finalconc.) if samplecontaminated
• 225.076
• 224.068
• 207.066
• 431.134
CH CHCOOH
OCH3
OH
CH3O PB100251
C-6 Applied Biosystems
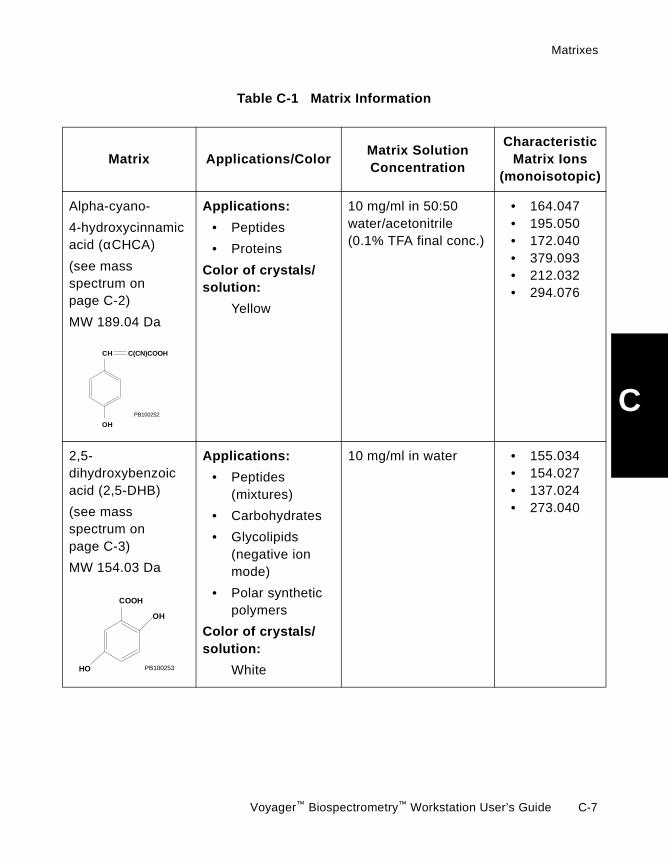
Matrixes
C
Alpha-cyano-
4-hydroxycinnamicacid (αCHCA)
(see massspectrum onpage C-2)
MW 189.04 Da
Applications:
• Peptides
• Proteins
Color of crystals/solution:
Yellow
10 mg/ml in 50:50water/acetonitrile(0.1% TFA final conc.)
• 164.047• 195.050• 172.040• 379.093• 212.032• 294.076
2,5-dihydroxybenzoicacid (2,5-DHB)
(see massspectrum onpage C-3)
MW 154.03 Da
Applications:
• Peptides(mixtures)
• Carbohydrates
• Glycolipids(negative ionmode)
• Polar syntheticpolymers
Color of crystals/solution:
White
10 mg/ml in water • 155.034• 154.027• 137.024• 273.040
Table C-1 Matrix Information
Matrix Applications/ColorMatrix SolutionConcentration
CharacteristicMatrix Ions
(monoisotopic)
CH
OH
PB100252
C(CN)COOH
COOH
OH
PB100253HO
Voyager™ Biospectrometry™ Workstation User’s Guide C-7
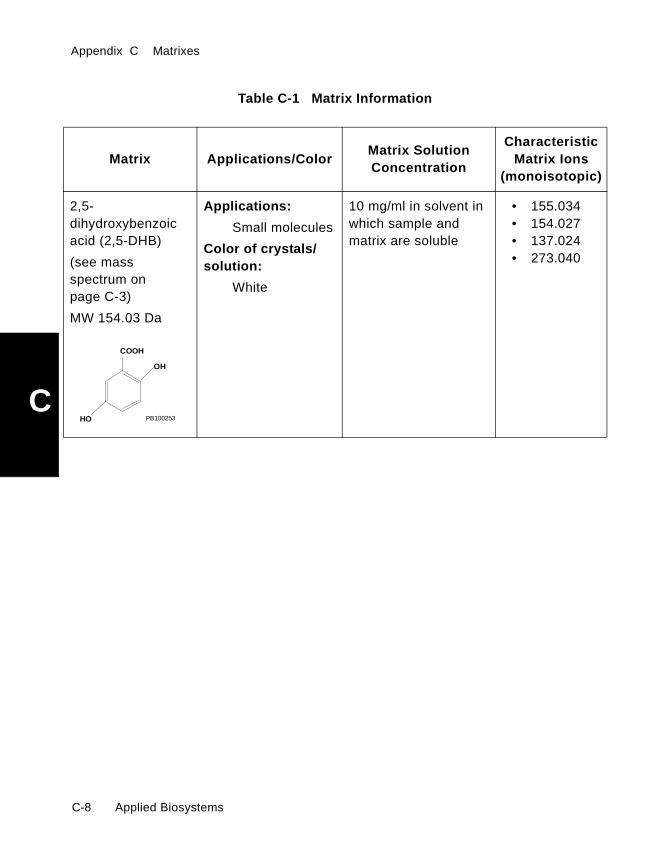
Appendix C Matrixes
C
2,5-dihydroxybenzoicacid (2,5-DHB)
(see massspectrum onpage C-3)
MW 154.03 Da
Applications:
Small molecules
Color of crystals/solution:
White
10 mg/ml in solvent inwhich sample andmatrix are soluble
• 155.034• 154.027• 137.024• 273.040
Table C-1 Matrix Information
Matrix Applications/ColorMatrix SolutionConcentration
CharacteristicMatrix Ions
(monoisotopic)
COOH
OH
PB100253HO
C-8 Applied Biosystems

Matrixes
C
Mixture of 2,5-
dihydroxybenzoicacid and5-methoxysalicylicacid (DHBs)
(see massspectrum onpage C-3)
MW 154.03 Da +
MW 168 Da
Mixture MW =
322.03 Da
Applications:
Large proteins
Color of crystals/solution:
White
10 mg/ml in solvent inwhich sample andmatrix are soluble
• 155.034• 154.027• 137.024• 273.040• 151.040• 168.042• 169.050
Table C-1 Matrix Information
Matrix Applications/ColorMatrix SolutionConcentration
CharacteristicMatrix Ions
(monoisotopic)
COOH
OH
PB100253HO
COOH
OH
CH3OPB100775
Voyager™ Biospectrometry™ Workstation User’s Guide C-9
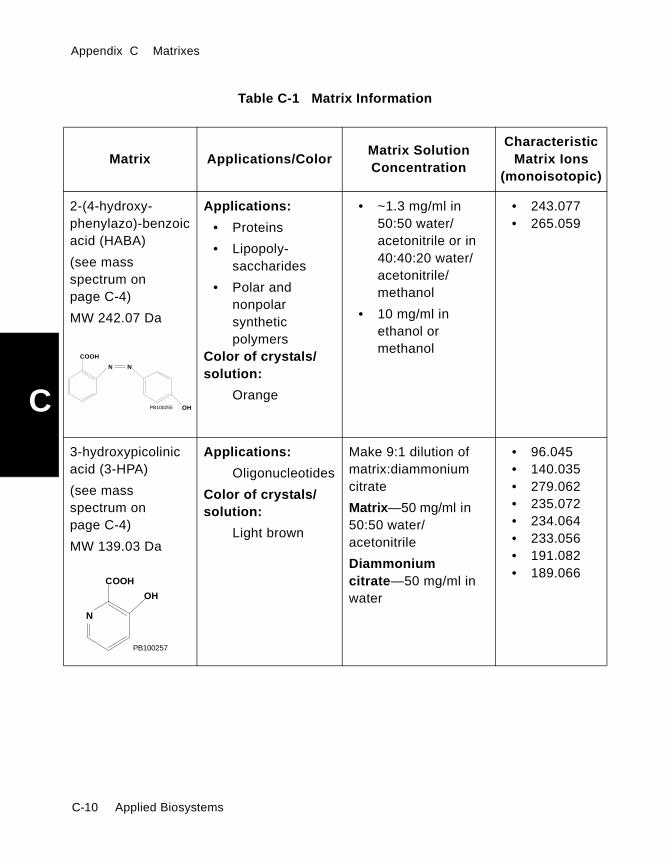
Appendix C Matrixes
C
2-(4-hydroxy-phenylazo)-benzoicacid (HABA)
(see massspectrum onpage C-4)
MW 242.07 Da
Applications:
• Proteins
• Lipopoly-saccharides
• Polar andnonpolarsyntheticpolymers
Color of crystals/solution:
Orange
• ~1.3 mg/ml in50:50 water/acetonitrile or in40:40:20 water/acetonitrile/methanol
• 10 mg/ml inethanol ormethanol
• 243.077• 265.059
3-hydroxypicolinicacid (3-HPA)
(see massspectrum onpage C-4)
MW 139.03 Da
Applications:
Oligonucleotides
Color of crystals/solution:
Light brown
Make 9:1 dilution ofmatrix:diammoniumcitrate
Matrix—50 mg/ml in50:50 water/acetonitrile
Diammoniumcitrate—50 mg/ml inwater
• 96.045• 140.035• 279.062• 235.072• 234.064• 233.056• 191.082• 189.066
Table C-1 Matrix Information
Matrix Applications/ColorMatrix SolutionConcentration
CharacteristicMatrix Ions
(monoisotopic)
COOH
PB100255
N
OH
N
COOH
PB100257
OH
N
C-10 Applied Biosystems

Matrixes
C
Dithranol
(see massspectrum onpage C-5)
MW 226.06 Da
Applications:
Nonpolarsyntheticpolymers
Color of crystals/solution:
Yellow
10 mg/ml intetrahydrofuran
+ silver trifluoroacetateto minimize Na+ andK+ adduct formation
• 225.055• 226.063• 227.071• 211.076
2,4,6 trihydroxyacetophenone(THAP)
(see massspectrum onpage C-5)
MW 168.04 Da
Applications:
SmallOligonucleotides
Color of crystals/solution:
White
Make 9:1 dilution ofmatrix:diammoniumcitrate
Matrix—10 mg/ml in50:50 water/acetonitrile
Diammoniumcitrate— 50 mg/ml inwater
• 169.050
Table C-1 Matrix Information
Matrix Applications/ColorMatrix SolutionConcentration
CharacteristicMatrix Ions
(monoisotopic)
PB100258
OH OHO
COCH3
OH
PB100261
HO
OH
Voyager™ Biospectrometry™ Workstation User’s Guide C-11
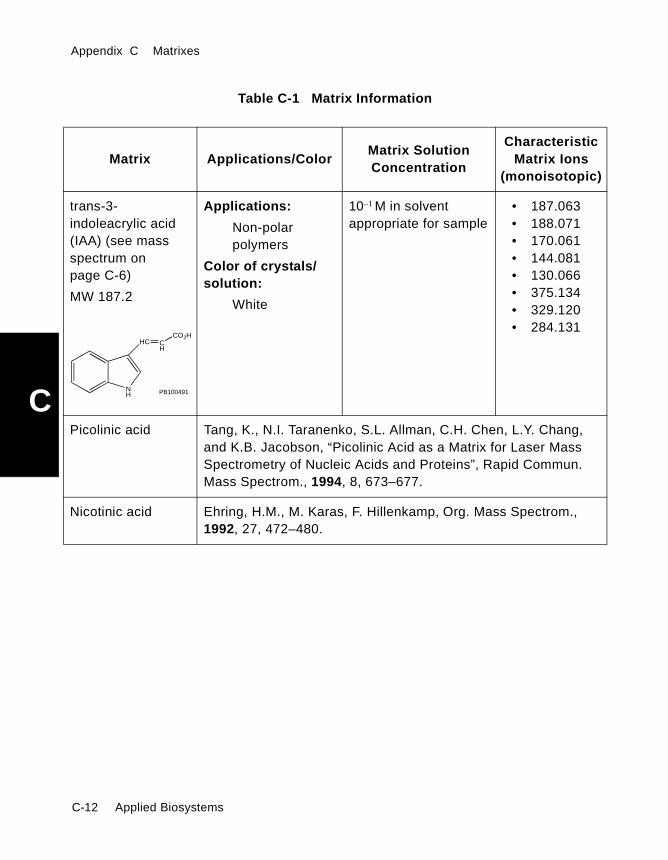
Appendix C Matrixes
C
trans-3-indoleacrylic acid(IAA) (see massspectrum onpage C-6)
MW 187.2
Applications:
Non-polarpolymers
Color of crystals/solution:
White
10–1 M in solventappropriate for sample
• 187.063• 188.071• 170.061• 144.081• 130.066• 375.134• 329.120• 284.131
Picolinic acid Tang, K., N.I. Taranenko, S.L. Allman, C.H. Chen, L.Y. Chang,and K.B. Jacobson, “Picolinic Acid as a Matrix for Laser MassSpectrometry of Nucleic Acids and Proteins”, Rapid Commun.Mass Spectrom., 1994, 8, 673–677.
Nicotinic acid Ehring, H.M., M. Karas, F. Hillenkamp, Org. Mass Spectrom.,1992, 27, 472–480.
Table C-1 Matrix Information
Matrix Applications/ColorMatrix SolutionConcentration
CharacteristicMatrix Ions
(monoisotopic)
NH
HC CH
PB100491
CO2H
C-12 Applied Biosystems
DAppendix
D Log Sheets
This appendix includes log sheets you can copy and use to logsamples before loading.
Voyager™ Biospectrometry™ Workstation User’s Guide D-1
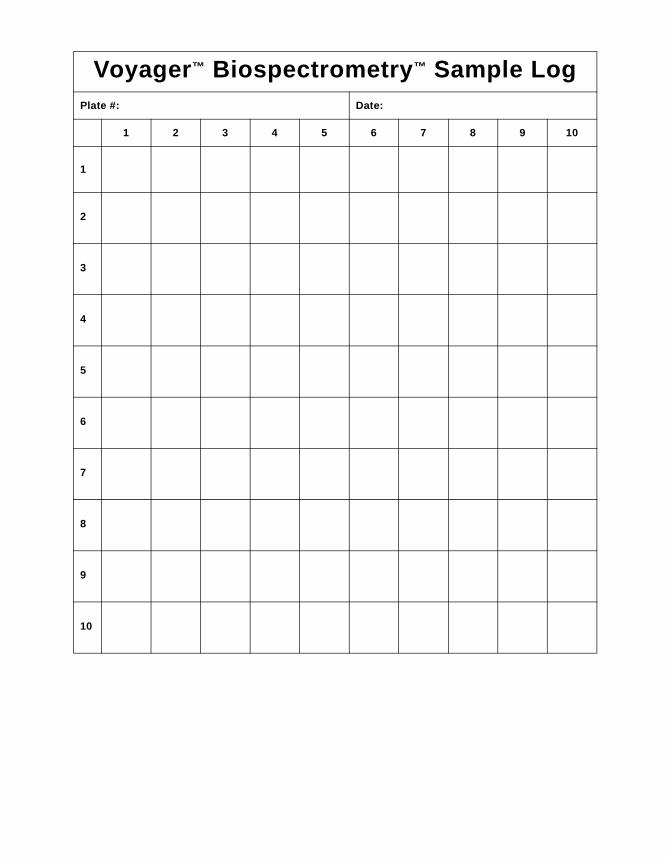
A
Voyager™ Biospectrometry™ Sample LogPlate #: Date:1 2 3 4 5 6 7 8 9 10
1
2
3
4
5
6
7
8
9
10

A
.Voyager™ Biospectrometry™ Sample LogPlate: Date: Page of Path and File Name
Samp # Matrix Sample Linear Reflector
1.
2.
3.
4.
5.
6.
7.
8.
9.
10.
11.
12.
13.
14.
15.
16.
17.
18.
19.
20.
21.
22.
23.
24.
25.

A
26.
27.
28.
29.
30.
31.
32.
33.
34.
35.
36.
37.
38.
39.
40.
41.
42.
43.
44.
45.
46.
47.
48.
49.
50.
Voyager™ Biospectrometry™ Sample LogPlate: Date: Page of Path and File Name
Samp # Matrix Sample Linear Reflector

A
51.
52.
53.
54.
55.
56.
57.
58.
59.
60.
61.
62.
63.
64.
65.
66.
67.
68.
69.
70.
71.
72.
73.
74.
75.
Voyager™ Biospectrometry™ Sample LogPlate: Date: Page of Path and File Name
Samp # Matrix Sample Linear Reflector

A
76.
77.
78.
79.
80.
81.
82.
83.
84.
85.
86.
87.
88.
89.
90.
91.
92.
93.
94.
95.
96.
97.
98.
99.
100.
Voyager™ Biospectrometry™ Sample LogPlate: Date: Page of Path and File Name
Samp # Matrix Sample Linear Reflector

A
Voyager™ Biospectrometry™ Sample LogPlate: Date: Page of Path and File NameSamp # Matrix Sample Linear Reflector

Appendix D Log Sheets
D
D-8 Applied Biosystems

Eppendix
AE Grid Voltage%and DelayTime Settings
The following figures illustrate the relationship between GridVoltage% and Delay Time parameters. These values are notabsolute values for all systems. Optimum settings may beslightly different for each system.
87 88 89 90 91 92 93 94 95 960
200
400
600
Grid Voltage (%)
Pulse Delay (nsec)
m/z=1000
m/z=2000m/z=5000m/z=15000
m/z=25000
m/z=50000
RP, linearVoyager-DE and Voyager-DE PRO, Linear Mode
Voyager™ Biospectrometry™ Workstation User’s Guide E-1

Appendix E Grid Voltage% and Delay Time Settings
E
88 90 92 94 960
200
400
600
Grid Voltage (%)
Pulse Delay (nsec)
m/z=1000
m/z=2000m/z=5000
m/z=15000
m/z=25000
m/z=50000
Elite, linearVoyager-DE STR, Linear Mode
E-2 Applied Biosystems

Fppendix
AF ReferenceStandardInformation
This appendix contains the following sections:F.1 Calibration Compounds...................... F-2
F.2 Conversion of Mass to Time forTypical Standards ............................. F-4
F.3 Theoretical Cleavages for Angiotensin .... F-6
F.4 ObservedPSD Fragments in Angiotensin ............... F-7
Voyager™ Biospectrometry™ Workstation User’s Guide F-1
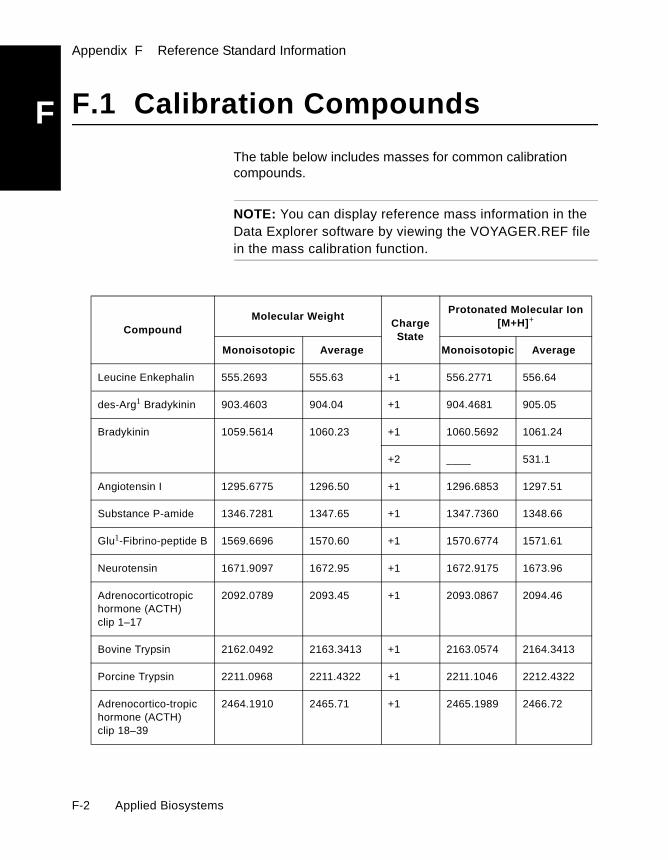
Appendix F Reference Standard Information
F
F.1 Calibration CompoundsThe table below includes masses for common calibrationcompounds.
NOTE: You can display reference mass information in theData Explorer software by viewing the VOYAGER.REF filein the mass calibration function.
CompoundMolecular Weight
ChargeState
Protonated Molecular Ion[M+H]+
Monoisotopic Average Monoisotopic Average
Leucine Enkephalin 555.2693 555.63 +1 556.2771 556.64
des-Arg1 Bradykinin 903.4603 904.04 +1 904.4681 905.05
Bradykinin 1059.5614 1060.23 +1 1060.5692 1061.24
+2 ____ 531.1
Angiotensin I 1295.6775 1296.50 +1 1296.6853 1297.51
Substance P-amide 1346.7281 1347.65 +1 1347.7360 1348.66
Glu1-Fibrino-peptide B 1569.6696 1570.60 +1 1570.6774 1571.61
Neurotensin 1671.9097 1672.95 +1 1672.9175 1673.96
Adrenocorticotropichormone (ACTH)clip 1–17
2092.0789 2093.45 +1 2093.0867 2094.46
Bovine Trypsin 2162.0492 2163.3413 +1 2163.0574 2164.3413
Porcine Trypsin 2211.0968 2211.4322 +1 2211.1046 2212.4322
Adrenocortico-tropichormone (ACTH)clip 18–39
2464.1910 2465.71 +1 2465.1989 2466.72
F-2 Applied Biosystems

Calibration Compounds
F
Insulin B chain,oxidized
3493.6435 3495.95 +1 3494.6513 3496.96
Adrenocorticotropichormone (ACTH)clip 7–38
3656.9216 3659.18 +1 3657.9294 3660.19
Insulin, bovine ____ 5733.58 +1 5730.6087 5734.59
+2 2865.8083 2867.80
Thioredoxin (E. coli,oxidized)
____ 11673.47 +1 ____ 11674.48
+2 ____ 5837.74
Cytochrome C (horseheart)
____ 12360.5 +1 ____ 12361.5
+2 ____ 6181.25
Myoglobin (horseheart)
____ 16951.55 +1 ____ 16952.56
+2 ____ 8476.78
Trypsinogen ____ 23980 +1 ____ 23981
Carbonic anhydrase ____ 29023 +1 ____ 29024
Enolase (Baker’syeast)
____ 46671 +1 ____ 46672
+2 ____ 23336
Bovine serum albumin(BSA)
____ 66430 +1 ____ 66431
+2 ____ 33216
CompoundMolecular Weight
ChargeState
Protonated Molecular Ion[M+H]+
Monoisotopic Average Monoisotopic Average
Voyager™ Biospectrometry™ Workstation User’s Guide F-3

Appendix F Reference Standard Information
F
F.2 Conversion of Mass toTime for Typical StandardsThe table below includes mass and time values for standardsunder different acquisition conditions (Accelerating Voltageand flight tube length). You can use this information whenobserving the signal on the oscilloscope to determine if thepeaks you are seeing are at the correct mass.
NOTE: These values are not exact. Use them as a guide.
Standards ZAverage MW
[M+H]+
Time (seconds)
25,000 V1.3 m
10,000 V1.3 m
28,000 V2.0 m
15,000 V2.0 m
10,000 V2.0 m
LeucineEnkephalin
1 556.61 1.40E-05 2.21E-05 2.03E-05 2.77E-05 3.40E-05
MethionineEnkephalin
1 574.65 1.42E-05 2.24E-05 2.06E-05 2.82E-05 3.45E-05
Bradykinin 1 1061.2 1.93E-05 3.05E-05 2.80E-05 3.83E-05 4.69E-05
2 531.1 1.36E-05 2.16E-05 1.98E-05 2.71E-05 3.32E-05
Angiotensin II(human)
1 1047.18 1.92E-05 3.03E-05 2.78E-05 3.80E-05 4.66E-05
2 524.09 1.35E-05 2.14E-05 1.97E-05 2.69E-05 3.30E-05
Angiotensin I(human)
1 1297.48 2.13E-05 3.37E-05 3.10E-05 4.23E-05 5.19E-05
2 649.24 1.51E-05 2.38E-05 2.19E-05 3.00E-05 3.67E-05
Melittin 1 2847.5 3.16E-05 4.99E-05 4.59E-05 6.27E-05 7.68E-05
2 1424.25 2.23E-05 3.53E-05 3.25E-05 4.44E-05 5.43E-05
F-4 Applied Biosystems

Conversion of Mass to Time for Typical Standards
F
Bovine Insulin B,Oxidized
1 3496.9 3.50E-05 5.53E-05 5.09E-05 6.95E-05 8.51E-05
2 1748.95 2.48E-05 3.91E-05 3.60E-05 4.92E-05 6.02E-05
Bovine Insulin 1 5734.5 4.48E-05 7.09E-05 6.52E-05 8.90E-05 1.09E-04
2 2867.75 3.17E-05 5.01E-05 4.61E-05 6.30E-05 7.71E-05
Insulin-likeGrowth Factor(IgF)
1 7650.76 5.18E-05 8.19E-05 7.53E-05 1.03E-04 1.26E-04
2 3825.88 3.66E-05 5.79E-05 5.32E-05 7.27E-05 8.91E-05
Cytochrome C(horse heart)
1 12361.5 6.58E-05 1.04E-04 9.57E-05 1.31E-04 1.60E-04
2 6181.25 4.65E-05 7.36E-05 6.76E-05 9.24E-05 1.13E-04
3 4121.17 3.80E-05 6.01E-05 5.52E-05 7.55E-05 9.24E-05
4 3091.12 3.29E-05 5.20E-05 4.78E-05 6.54E-05 8.00E-05
Myoglobin(horse heart)
1 16952.5 7.71E-05 1.22E-04 1.12E-04 1.53E-04 1.87E-04
2 8476.75 5.45E-05 8.62E-05 7.92E-05 1.08E-04 1.33E-04
3 5651.5 4.45E-05 7.03E-05 6.47E-05 8.84E-05 1.08E-04
4 4238.76 3.85E-05 6.09E-05 5.60E-05 7.65E-05 9.37E-05
Bovine SerumAlbumin (BSA)
1 66431 1.53E-04 2.41E-04 2.22E-04 3.03E-04 3.71E-04
2 33216 1.08E-04 1.71E-04 1.57E-04 2.14E-04 2.62E-04
3 22144.3 8.81E-05 1.39E-04 1.28E-04 1.75E-04 2.14E-04
4 16608.5 7.63E-05 1.21E-04 1.11E-04 1.51E-04 1.86E-04
Standards ZAverage MW
[M+H]+
Time (seconds)
25,000 V1.3 m
10,000 V1.3 m
28,000 V2.0 m
15,000 V2.0 m
10,000 V2.0 m
Voyager™ Biospectrometry™ Workstation User’s Guide F-5
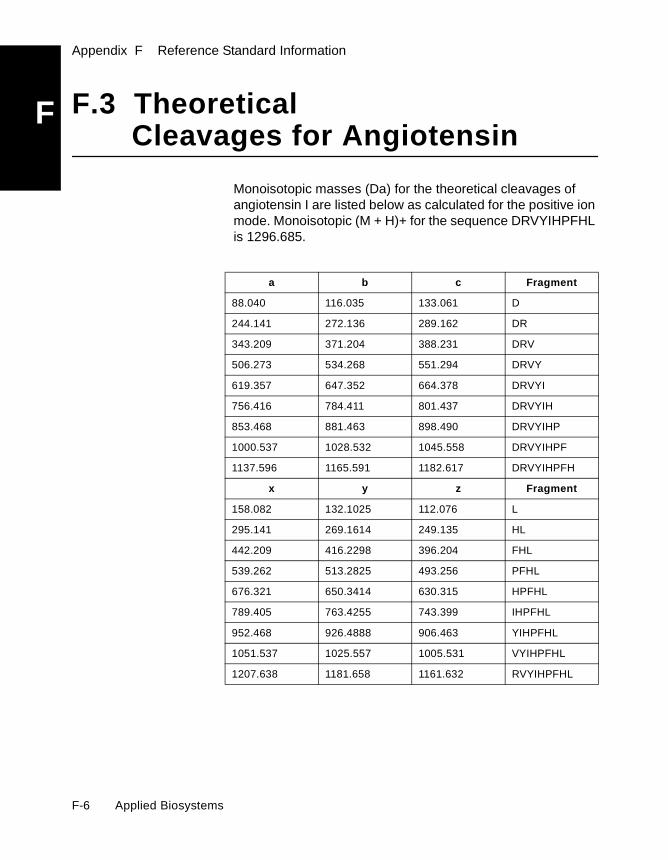
Appendix F Reference Standard Information
F
F.3 TheoreticalCleavages for AngiotensinMonoisotopic masses (Da) for the theoretical cleavages ofangiotensin I are listed below as calculated for the positive ionmode. Monoisotopic (M + H)+ for the sequence DRVYIHPFHLis 1296.685.
a b c Fragment
88.040 116.035 133.061 D
244.141 272.136 289.162 DR
343.209 371.204 388.231 DRV
506.273 534.268 551.294 DRVY
619.357 647.352 664.378 DRVYI
756.416 784.411 801.437 DRVYIH
853.468 881.463 898.490 DRVYIHP
1000.537 1028.532 1045.558 DRVYIHPF
1137.596 1165.591 1182.617 DRVYIHPFH
x y z Fragment
158.082 132.1025 112.076 L
295.141 269.1614 249.135 HL
442.209 416.2298 396.204 FHL
539.262 513.2825 493.256 PFHL
676.321 650.3414 630.315 HPFHL
789.405 763.4255 743.399 IHPFHL
952.468 926.4888 906.463 YIHPFHL
1051.537 1025.557 1005.531 VYIHPFHL
1207.638 1181.658 1161.632 RVYIHPFHL
F-6 Applied Biosystems

Observed PSD Fragments in Angiotensin
F
F.4 ObservedPSD Fragments in AngiotensinThe masses listed below are fragment ions of the (M+H)+
percursor ion.
Fragment MassDesignation
Fragment MassDesignation
(monoisotopic) (average) (monoisotopic) (average)
70.066 70.1 P, R ~426.2 426.5 ?
72.081 72.1 V 489.246 489.6 a4-17
86.097 86.1 I, L ~492.2 492.6 ?
110.072 110.1 H 506.273 506.6 a4
136.076 136.2 Y 513.283 513.6 y4
156.101 156.2 R? 517.241 517.6 b4-17
166.062 166.2 H 534.268 534.6 b4
207.125 207.3 HP-28 619.357 619.7 a5
217.134 217.3 PF-28 630.325 630.8 b5-17
223.156 223.3 IH-28 632.331 632.8 IHPFH
~230.1 230.3 ? 647.352 647.8 b5
235.120,235.145
235.3 HP, VY-28 650.341 650.8 y5
251.151 251.3 IH 739.389 739.9 a6-17
255.109 255.3 b2-17 756.416 756.9 a6
263.140 263.3 VY 767.384 767.9 b6-17
269.161 269.3 y2 784.411 784.9 b6
Voyager™ Biospectrometry™ Workstation User’s Guide F-7

Appendix F Reference Standard Information
F
272.136 272.3 b2 1000.537 1001.2 a8285.135 285.3 FH 1046.542 1047.2 b8+H2O
326.183 326.4 a3-17 ~1068.6 1069.2 ?
354.178 354.4 b3-17 1137.596 1138.3 a9
~364.2 364.4 ? 1165.591 1166.3 b9
371.204 371.4 b3 1181.658 1182.3 y9
382.188 382.4 PFH 1183.601 1184.3 b9+H2O
~400.2 400.5 ? 1296.685 1297.5 MH+
416.230 416.5 y3
Fragment MassDesignation
Fragment MassDesignation
(monoisotopic) (average) (monoisotopic) (average)
F-8 Applied Biosystems

Gppendix
AG Maintenance Log
The following page includes a log sheet listing maintenanceprocedures.
Copy this page and keep it by your Voyager system.
Instructions for performing maintenance procedures are listed inChapter 9, Maintenance and Troubleshooting.
Voyager™ Biospectrometry™ Workstation User’s Guide G-1
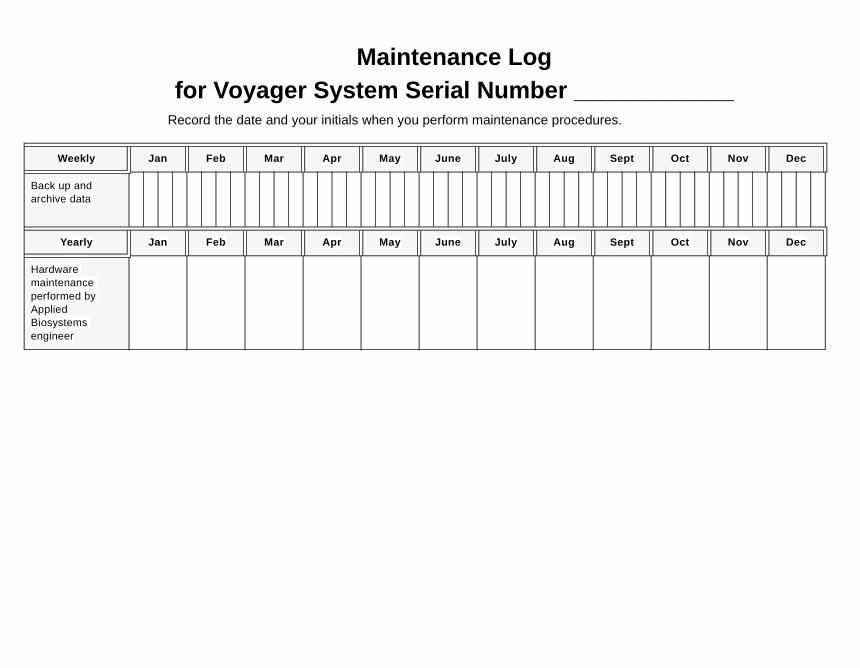
______
Oct Nov Dec
Bar
Oct Nov Dec
HmpeABen
Maintenance Logfor Voyager System Serial Number ______
Record the date and your initials when you perform maintenance procedures.
Weekly Jan Feb Mar Apr May June July Aug Sept
ack up andchive data
Yearly Jan Feb Mar Apr May June July Aug Sept
ardwareaintenancerformed by
ppliediosystemsgineer
Hppendix
AH ContinuousExtraction Mode
This appendix contains the following sections:H.1 Optimizing a Continuous Extraction
Standard Instrument (.BIC) Setting ...........H-2
H.2 Obtaining Good Spectrain Continuous Extraction Mode ............... H-8
H.3 Troubleshooting in ContinuousExtraction Mode .................................... H-19
Voyager™ Biospectrometry™ Workstation User’s Guide H-1
Appendix H Continuous Extraction Mode
H
H.1 Optimizing a ContinuousExtraction Standard Instrument(.BIC) Setting
Before you begin NOTE: Due to the superior results obtained during DelayedExtraction (DE) mode, use Continuous Extraction mode fordiagnostic purposes only.
Before optimizing a Continuous Extraction .BIC file, be familiarwith the following information:
• The Data Explorer Software User’s Guide,Appendix B, Overview of Isotopes
• “Opening and Viewing Instrument Settings” on page 5-7
• “List of standard instrument settings files” on page H-3
• “Saving and Printing Instrument Settings” on page 5-11
• “Acquiring in Manual Mode from the Instrument ControlPanel” on page 6-11
• Section H.2, Obtaining Good Spectra in ContinuousExtraction Mode
• “Determining Laser Threshold” on page H-12
• Section H.2.3, Checking Resolution
• Section H.2.4, Fine-Tuning the Laser Setting
• Section 5.1, Loading, Modifying, and Saving InstrumentSettings
Instrumentsettings
parameters
Most instrument settings parameters are optimized for yoursystem and should not require adjustment. Change only theparameters listed in the following procedure.
For more information on remaining instrument settings, seeSection 5.2, Instrument Settings Parameter Descriptions.
H-2 Applied Biosystems

Optimizing a Continuous Extraction Standard Instrument (.BIC) Setting
H
List of standardinstrument
settings files
This section lists standard instrument settings (.BIC) files forContinuous Extraction in the following modes:
• Linear mode• Reflector mode• PSD mode
Standard instrument settings files are located in theC:\VOYAGER\DATA\FACTORY directory.
Table H-1 Continuous Extraction Linear ModeStandard Instrument Settings (.BIC) Files
.BIC File Sample Test Mass Range (Da)
L1000 Low mass peptide mix Calibration and resolution 100–2,000
L1001 Insulin Resolution 5,000–7,000
L1002 Myoglobin Resolution 10,000–20,000
L1003 BSA Resolution 60,000–70,000
L1004 High mass peptide mix Calibration (ACTH 7-38) 2,000–6,000
L1005 Neurotensin in mix Sensitivity 1,000–2,000
L1008 Low mass peptide mix Negative ion mode 100–2,000
Voyager™ Biospectrometry™ Workstation User’s Guide H-3

Appendix H Continuous Extraction Mode
H
Table H-2 Continuous Extraction Reflector Mode Standard Instrument Settings(.BIC) Files
.BIC File Sample Test Mass Range (Da)
R1000 Angiotensin I Resolution at 20,000 V 100–2,000
R1001 Angiotensin I Resolution at 10,000 V 100–2,000
R1002 Insulin Resolution 5,000–7,000
R1003 E. coli Thioredoxin Resolution 10,000–14,000
R1004 Low mass peptide mix Calibration (angiotensin I) 100–2,000
R1005 Neurotensin in mix Sensitivity 1,000–2,000
R1006 High mass peptide mix Calibration (ACTH 7-38) 2,000–6,000
R1008 Low mass peptide mix Negative ion mode 100–2,000
R1012 Substance-P mix Timed Ion Selector 1,348–1,388
Table H-3 Continuous Extraction PSD Mode Standard Instrument Settings Files
.BIC File Sample Test Mass Range (Da)
P1000 to1009
Low mass peptide mixor angiotensin I alone
Mirror ratio varies for PSDanalysis
PSD ions for precursormass 1,297
H-4 Applied Biosystems
Optimizing a Continuous Extraction Standard Instrument (.BIC) Setting
H
Optimizationstrategy
When optimizing a Continuous Extraction instrument settingsfile, you:
• Start with a standard instrument settings file
• Fine-tune laser setting for major improvement inperformance
• Optionally adjust Grid Voltage% and Guide WireVoltage% for slight improvement in performance
Optimizing 1. Open a standard instrument settings file for the massrange you are analyzing.
If an instrument settings file for the mass range you areanalyzing does not exist, open a standard instrumentsettings file with the closest higher mass.
2. Save the instrument settings file under a new name.Standard instrument settings files are read-only andcannot be saved.
3. Select a calibration (.CAL) file. If you are screeningsamples, use the default calibration.
4. If the mass range needs adjusting, change the digitizersetting. See Section 5.3.5, Understanding DigitizerSettings.
5. To include matrix peaks in the spectrum for calibration,deselect the Low Mass Gate field, or set the Starting Massto a mass below the matrix peak mass.
Voyager™ Biospectrometry™ Workstation User’s Guide H-5

Appendix H Continuous Extraction Mode
H
6. Set the Grid Voltage% appropriate for the matrix andmass:
7. Save the instrument settings (.BIC) file.
8. Determine the laser threshold for the sample and adjustthe laser setting until you obtain the resolution needed foryour application.
Laser position and laser intensity are the primaryfactors affecting the quality of spectra. However, youmay slightly improve the quality of data by fine-tuning:
• Grid Voltage% within the ranges listed above• Guide Wire Voltage% within the ranges listed
below
Table H-4 Grid Voltage% Settings for ContinuousExtraction Mode
Matrix Mass (Da) Grid Voltage%*
α-cyano-4-hydroxycinnamic acid
<5,000 50–70
>5,000 70–90
Sinapinic acid <5,000 80–85
>5,000 85–90
DHB3-HPA
<5,000 85–90
>5,000
* In Reflector mode, lower Grid Voltage% settings mayyield greater resolution, but may compromise sensitivity.
H-6 Applied Biosystems

Optimizing a Continuous Extraction Standard Instrument (.BIC) Setting
H
Table H-5 Guide Wire Voltage% Settings forContinuous Extraction Mode
Mass Range (Da) Guide Wire Voltage
<1,500 0.05%
1,500–4,00 0.1%
4,000–15,000 0.2%
>15,000 0.3%
Voyager™ Biospectrometry™ Workstation User’s Guide H-7

Appendix H Continuous Extraction Mode
H
H.2 Obtaining Good Spectrain Continuous Extraction Mode
This section describes:
• Spectra, resolution, signal-to-noise ratio, and laserthreshold
• Determining laser threshold• Checking Resolution• Fine-Tuning the Laser Setting
H.2.1 Spectra, Resolution, Signal-to-NoiseRatio, and Laser Threshold
What is a goodspectrum?
A good spectrum is one that is acceptable for your purposes.In general, it:
• Contains sharp, symmetrical, well-defined peaks• Has acceptable resolution• Has acceptable signal-to-noise ratio
For some applications (for example, when you are looking fordetailed structural information), you may require verywell-separated peaks and the maximum resolution possible.For other applications (for example, when looking for anestimate of molecular weight), your requirements may be lessstrict.
Resolution andsignal-to-noise
ratio
There is a balance between good resolution and a goodsignal-to-noise ratio. To achieve maximum resolution, you maya see lower signal-to-noise ratio. Conversely, to maximize thesignal-to-noise ratio, you may see less than maximumresolution.
Figure H-1 through Figure H-4 are examples of poor and goodspectra.
NOTE: Dimer in a spectrum may indicate that the molecularion is saturated, or that sample is too concentrated.Decrease laser intensity or sample concentration tominimize the dimer.
H-8 Applied Biosystems
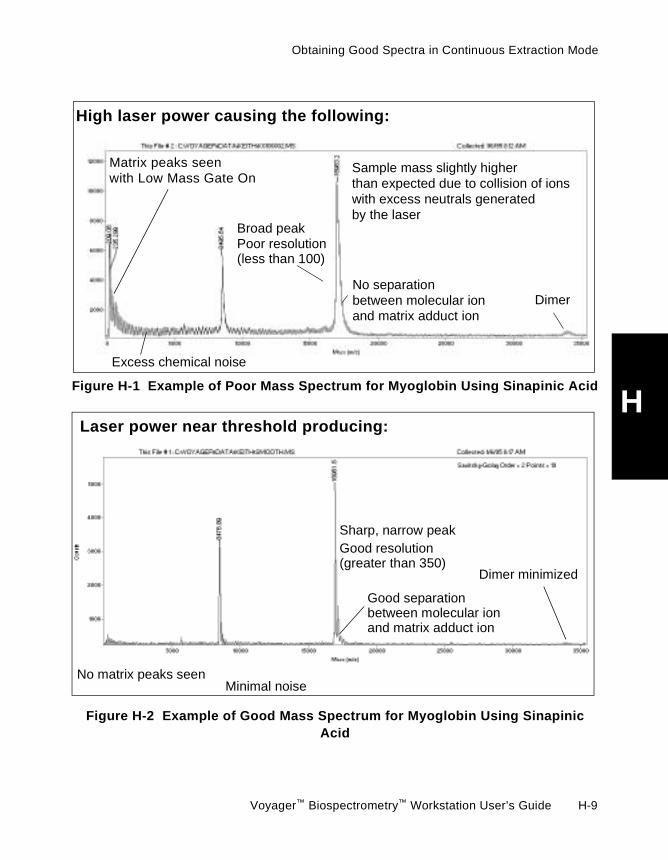
Obtaining Good Spectra in Continuous Extraction Mode
H
Figure H-1 Example of Poor Mass Spectrum for Myoglobin Using Sinapinic AcidFigure H-2 Example of Good Mass Spectrum for Myoglobin Using SinapinicAcid
High laser power causing the following:
Matrix peaks seenwith Low Mass Gate On
Sample mass slightly higherthan expected due to collision of ionswith excess neutrals generatedby the laser
DimerNo separationbetween molecular ionand matrix adduct ion
Broad peakPoor resolution
Excess chemical noise
(less than 100)
Laser power near threshold producing:
No matrix peaks seenMinimal noise
Sharp, narrow peak
Dimer minimized
Good resolution
Good separationbetween molecular ionand matrix adduct ion
(greater than 350)
Voyager™ Biospectrometry™ Workstation User’s Guide H-9

Appendix H Continuous Extraction Mode
H
Figure H-3 Example of Poor Mass Spectrum for AngiotensinFigure H-4 Example of Good Mass Spectrum for Angiotensin
High laser power causing the following:Matrix and sample peaks saturated(flat-topped)
Minor componentsExcess chemical noiseor fragments of major components ionized
Broad peakPoor resolution
Sample mass slightly higherthan expected due to collision of ionswith excess neutrals generatedby the laser
Laser power near threshold producing:Well-resolved matrix peaksat 172, 190, and 379 Da
Correct mass ofsample peak
No minorGood resolution
Sharp, narrow peak
Minimal noise
Peaks not saturated
(greater than 400)components
H-10 Applied Biosystems
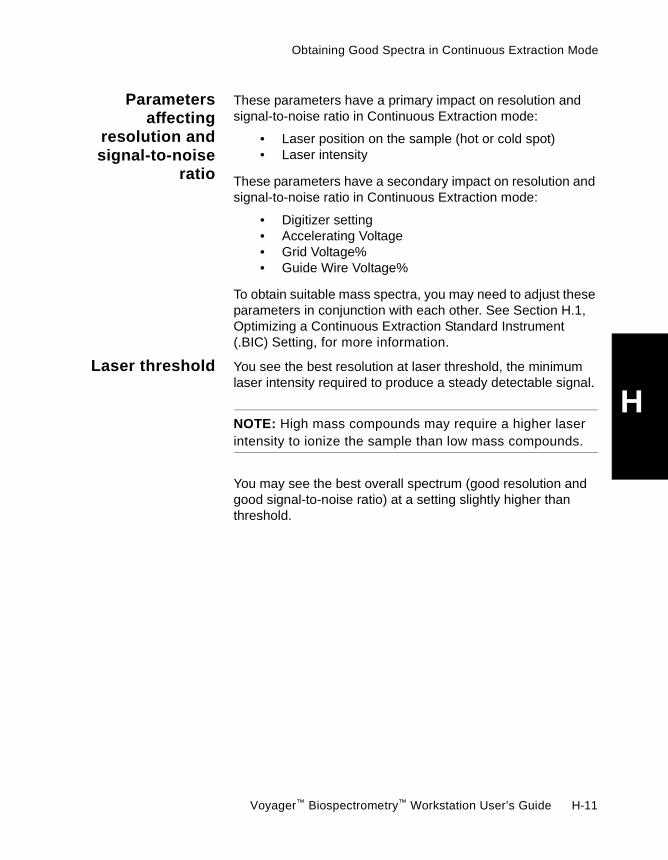
Obtaining Good Spectra in Continuous Extraction Mode
H
Parametersaffecting
resolution andsignal-to-noise
ratio
These parameters have a primary impact on resolution andsignal-to-noise ratio in Continuous Extraction mode:
• Laser position on the sample (hot or cold spot)• Laser intensity
These parameters have a secondary impact on resolution andsignal-to-noise ratio in Continuous Extraction mode:
• Digitizer setting• Accelerating Voltage• Grid Voltage%• Guide Wire Voltage%
To obtain suitable mass spectra, you may need to adjust theseparameters in conjunction with each other. See Section H.1,Optimizing a Continuous Extraction Standard Instrument(.BIC) Setting, for more information.
Laser threshold You see the best resolution at laser threshold, the minimumlaser intensity required to produce a steady detectable signal.
NOTE: High mass compounds may require a higher laserintensity to ionize the sample than low mass compounds.
You may see the best overall spectrum (good resolution andgood signal-to-noise ratio) at a setting slightly higher thanthreshold.
Voyager™ Biospectrometry™ Workstation User’s Guide H-11

Appendix H Continuous Extraction Mode
H
H.2.2 Determining Laser Threshold
This section describes:
• Overview• Adjusting the laser intensity• Verifying threshold setting
H.2.2.1 Overview
Definition Laser threshold is the minimum laser intensity required toproduce a steady detectable signal. Laser intensities abovethreshold generate a dense plume of desorbed neutralswhich cause energy loss during acceleration. The observedimpact of higher laser intensity is a decrease in resolutionand mass accuracy, and a possible increase infragmentation.
Factors affectingthreshold
Laser threshold is affected by sample preparation. The mostsignificant factors affecting threshold are:
• Matrix—Absorption coefficient of matrix affects thelaser intensity needed to ionize sample.
• Molecular weight of sample—Higher massesrequire a higher laser intensity to generate anacceptable signal.
• Sample characteristics—Different classes ofcompounds in the same matrix may require differentlaser intensities. For example, carbohydrates in DHBrequire a higher laser intensity than peptides.
• Sample contaminants—Buffers, salts, anddetergents in sample can substantially increase thelaser intensity needed.
• Sample exposure—Fresh sample surfaces ionizebetter than surfaces that have been exposed toirradiation. The significance of sample exposurevaries widely between matrices and changes acrossthe sample surface.
H-12 Applied Biosystems
Obtaining Good Spectra in Continuous Extraction Mode
H
Determiningthreshold
Determining laser threshold becomes easier withexperience. Sample is consumed when exposed to thelaser, so minimize the number of spectra you acquire todetermine threshold.
H.2.2.2 Adjusting the Laser Intensity
This section describes:
• Adjusting the laser• Fine-tuning threshold
Adjusting thelaser
NOTE: If settings are not listed for the matrix, set the laserto the lowest “high setting” listed for another matrix andstart at step 2.
1. Set the laser to the high laser setting for your system.
2. Start an acquisition and acquire about 10 spectra. At thishigh laser setting, you may see a saturated spectrumwhere peaks are full scale and may be truncated(Figure H-5).
NOTE: A saturated spectrum has flat-topped peaks. If thespectrum goes off the screen, adjust the position of thespectrum to see if the top is flat.
Voyager™ Biospectrometry™ Workstation User’s Guide H-13

Appendix H Continuous Extraction Mode
H
Figure H-5 Saturated Spectrum
3. Check the spectrum for the peak of interest. Zoom in onthe spectrum as needed. See Section 4.3, Using theSpectrum Window.
4. Zoom in on the appropriate mass range to check for thepeak of interest.
If peak of interest ispresent
5. If the peak of interest is present, the current laser intensityis the high setting for the sample class/matrix you areanalyzing.
Decrease the laser intensity by 10 percent and acquireanother 10 spectra. Continue decreasing the laserintensity by 10 percent until the signal disappears.
When signal disappears, the current laser intensity is thelow setting for the sample class/matrix you are analyzing.
If peak of interest isnot present
6. If the peak of interest is not present, the current laserintensity is the low setting for the sample class/matrix youare analyzing.
Increase the laser intensity by 10 percent and acquireanother 10 spectra. Continue increasing the laserintensity by 10 percent until the signal appears.
When signal appears, the current laser intensity is thehigh setting for the sample class/matrix you are analyzing.
H-14 Applied Biosystems

Obtaining Good Spectra in Continuous Extraction Mode
H
Fine-tuningthreshold
When you determine the high and low setting for the sampleclass/matrix you are analyzing, you can fine-tune the thresholdby setting the laser intensity midway between the highsetting and low setting determined above.
If signal is present when you decrease the laser, assumethat this is the new high setting. If signal is not presentwhen you decrease the laser, assume that this is the newlow setting.
Continue adjusting until the difference between high andlow settings is less than 10 laser counts.
NOTE: If the difference between the high and low setting isequal to the laser step size, decrease the laser step size inthe Hardware Configuration by a factor of 2.
Figure H-6 shows a spectrum generated with an acceptablelaser intensity.
Figure H-6 Spectrum at Lower Laser Setting
Voyager™ Biospectrometry™ Workstation User’s Guide H-15

Appendix H Continuous Extraction Mode
H
H.2.2.3 Verifying Threshold Setting
Move to a new area of the sample well that contains the samesample. Acquire a spectrum to verify that the setting is validfor the laser power selected, and not caused by:
• Sample surface excitement caused by the previoushigher laser power setting
• Sample consumption
If the setting is valid, you see a spectrum similar to the one justacquired. You may need to adjust the laser slightly (5 to10 counts). Examine several spots in the sample well to makesure you have not tuned the laser intensity on a “cold spot”.You can further fine-tune the laser setting by setting a smallerlaser step size in Hardware Configuration. For example,instead of a step size of 10, change the step size to 2.
Make sure peak shape and resolution are acceptable. SeeSection H.2.3, Checking Resolution. If you do not see a signalat the current setting, increase the laser power.
NOTE: If peak intensity of the final scan is near maximumintensity, it is very possible that some scans averaged intothe final scan are saturated. Reacquire using a lower laserpower.
H-16 Applied Biosystems

Obtaining Good Spectra in Continuous Extraction Mode
H
H.2.3 Checking Resolution
After you determine laser threshold, calculate the resolution.Determine if the resolution is acceptable for your application.See Section 6.5.2, Calculating Mass Resolution.
Table H-6 lists a general rating scale for resolution andmolecular weight ranges for compounds acquired in Linearmode.
Table H-6 Continuous Extraction Mode Resolution Rating Scale
Compounds <10,000 Da* Compounds 10,000 to 20,000 Da Compounds >20,000 Da
Resolution Rating Resolution Rating Resolution Rating
250 Acceptable 200 Acceptable 60 Acceptable
350 Fair 250 Fair 100 Good
500 Good 400 Good ____ ____
600 Very good 600 Very good ____ ____
* You may see better resolution than indicated when analyzing compounds below 1,000 Da due toisotope separation.
Voyager™ Biospectrometry™ Workstation User’s Guide H-17
Appendix H Continuous Extraction Mode
H
H.2.4 Fine-Tuning the Laser Setting
When you find the laser threshold, whether you need tofine-tune the setting depends on your needs:
• If you are looking for an estimate of molecularweight, a laser setting slightly higher than the laserthreshold setting may be sufficient.
• If you need good peak shapes, you may need toincrease the laser setting to improve signal-to-noiseratio.
• If you need maximum resolution to differentiatebetween compounds, you may need to operateclose to the laser threshold setting to improveresolution.
H-18 Applied Biosystems

Troubleshooting in Continuous Extraction Mode
H
H.3 Troubleshooting inContinuous Extraction Mode
This section includes:
• Laser threshold troubleshooting• Spectrum troubleshooting
Refer to Table H-7 if you are having trouble determining laserthreshold:
Table H-7 Laser Threshold Troubleshooting
Symptom Action
Signal fades very quickly Increase the laser intensity by 1 to 2 percent whileacquisition is occurring.If signal does not increase, move to a new point inthe sample well while acquisition is occurring.If signal does not increase, increase the laser settingfurther, 2 to 3 percent at a time.
Signal increases quickly thensaturates
Stop acquisition. Decrease the laser setting by onestep (use the slider controls on the Manual Laserpage). Acquire again.
Hysteretic signal behavior(lag in response). Forexample, you observe signalat a laser intensity of 300,signal disappears when youdecrease to 290, signal doesnot reappear when youincrease intensity backto 300.
Move to new spot in sample well if this problemprevents you from generating a signal that is at least10 percent of full scale. If the signal is below10 percent of full scale, sample may be consumed.
Voyager™ Biospectrometry™ Workstation User’s Guide H-19

Appendix H Continuous Extraction Mode
H
Refer to Table H-8 if you are having spectrum trouble:Signal is flat Laser setting may be too low, increase.Sample may be consumed, move to a new positionin sample well.Sample may not be present, try new position.Sample may not ionize well, use different matrix.
Cannot see ions in Reflectormode
Check that you can see ions in Linear mode:• If you can see ions in Linear mode, it indicates
that voltages or laser power need adjusting.• If you cannot see ions in Linear mode, refer to
Section 9.2, Troubleshooting.
Table H-7 Laser Threshold Troubleshooting (Continued)
Symptom Action
Table H-8 Spectrum Troubleshooting
Symptom Possible Cause Action
Very wide peaks Refer to “Poor resolutionin Continuous Extractionmode” symptom onpage H-21
Refer to “Poor resolutionin Continuous Extractionmode” action onpage H-21.
H-20 Applied Biosystems
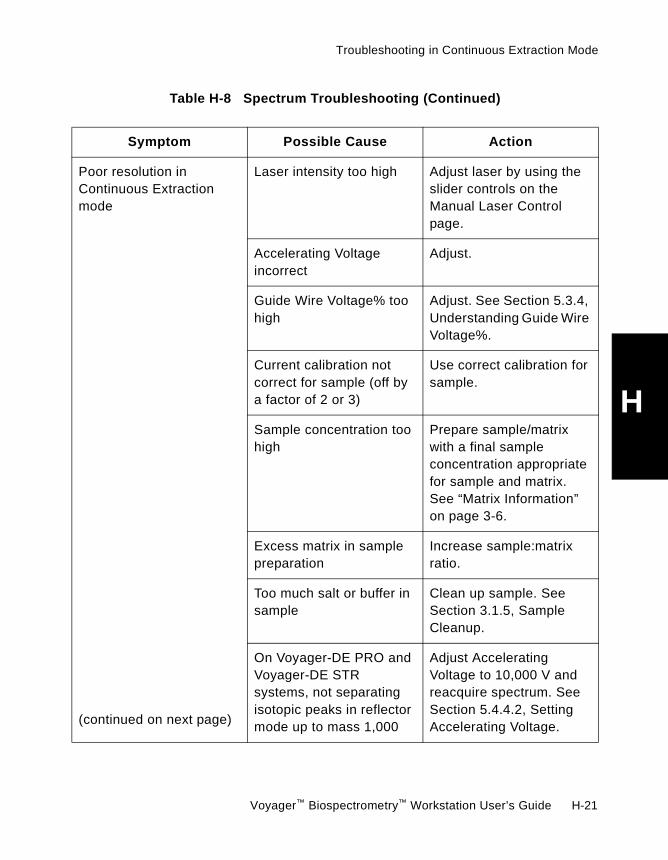
Troubleshooting in Continuous Extraction Mode
H
Poor resolution inContinuous Extractionmode
(continued on next page)
Laser intensity too high Adjust laser by using theslider controls on theManual Laser Controlpage.
Accelerating Voltageincorrect
Adjust.
Guide Wire Voltage% toohigh
Adjust. See Section 5.3.4,Understanding Guide WireVoltage%.
Current calibration notcorrect for sample (off bya factor of 2 or 3)
Use correct calibration forsample.
Sample concentration toohigh
Prepare sample/matrixwith a final sampleconcentration appropriatefor sample and matrix.See “Matrix Information”on page 3-6.
Excess matrix in samplepreparation
Increase sample:matrixratio.
Too much salt or buffer insample
Clean up sample. SeeSection 3.1.5, SampleCleanup.
On Voyager-DE PRO andVoyager-DE STRsystems, not separatingisotopic peaks in reflectormode up to mass 1,000
Adjust AcceleratingVoltage to 10,000 V andreacquire spectrum. SeeSection 5.4.4.2, SettingAccelerating Voltage.
Table H-8 Spectrum Troubleshooting (Continued)
Symptom Possible Cause Action
Voyager™ Biospectrometry™ Workstation User’s Guide H-21
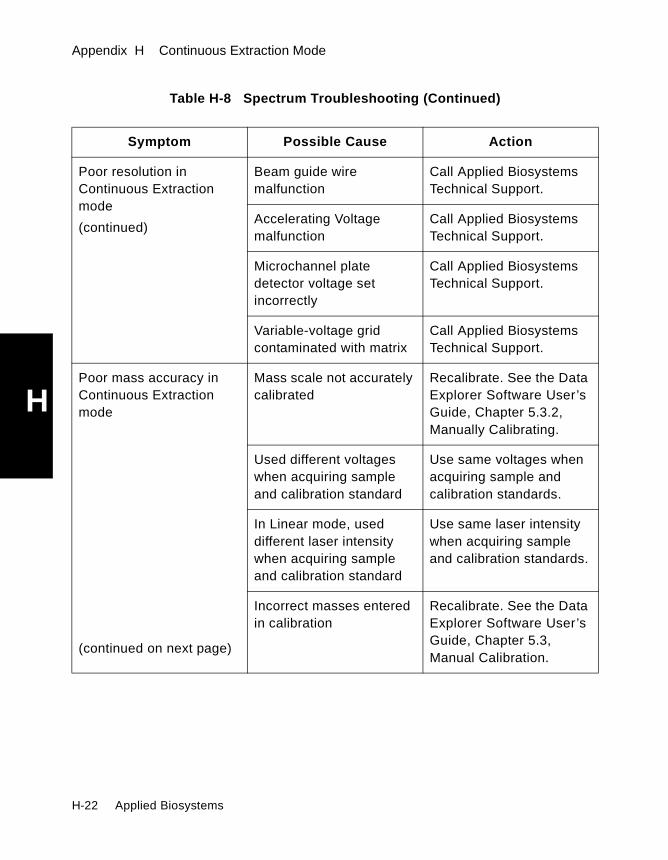
Appendix H Continuous Extraction Mode
H
Poor resolution inContinuous Extractionmode
(continued)
Beam guide wiremalfunction
Call Applied BiosystemsTechnical Support.
Accelerating Voltagemalfunction
Call Applied BiosystemsTechnical Support.
Microchannel platedetector voltage setincorrectly
Call Applied BiosystemsTechnical Support.
Variable-voltage gridcontaminated with matrix
Call Applied BiosystemsTechnical Support.
Poor mass accuracy inContinuous Extractionmode
Mass scale not accuratelycalibrated
Recalibrate. See the DataExplorer Software User’sGuide, Chapter 5.3.2,Manually Calibrating.
Used different voltageswhen acquiring sampleand calibration standard
Use same voltages whenacquiring sample andcalibration standards.
In Linear mode, useddifferent laser intensitywhen acquiring sampleand calibration standard
Use same laser intensitywhen acquiring sampleand calibration standards.
(continued on next page)
Incorrect masses enteredin calibration
Recalibrate. See the DataExplorer Software User’sGuide, Chapter 5.3,Manual Calibration.
Table H-8 Spectrum Troubleshooting (Continued)
Symptom Possible Cause Action
H-22 Applied Biosystems
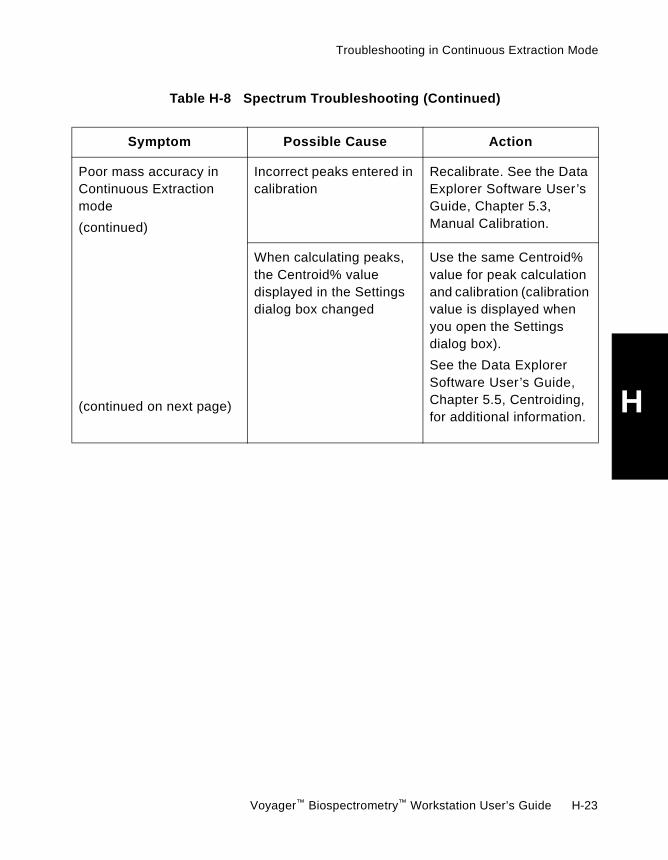
Troubleshooting in Continuous Extraction Mode
H
Poor mass accuracy inContinuous Extractionmode
(continued)
Incorrect peaks entered incalibration
Recalibrate. See the DataExplorer Software User’sGuide, Chapter 5.3,Manual Calibration.
(continued on next page)
When calculating peaks,the Centroid% valuedisplayed in the Settingsdialog box changed
Use the same Centroid%value for peak calculationand calibration (calibrationvalue is displayed whenyou open the Settingsdialog box).
See the Data ExplorerSoftware User’s Guide,Chapter 5.5, Centroiding,for additional information.
Table H-8 Spectrum Troubleshooting (Continued)
Symptom Possible Cause Action
Voyager™ Biospectrometry™ Workstation User’s Guide H-23
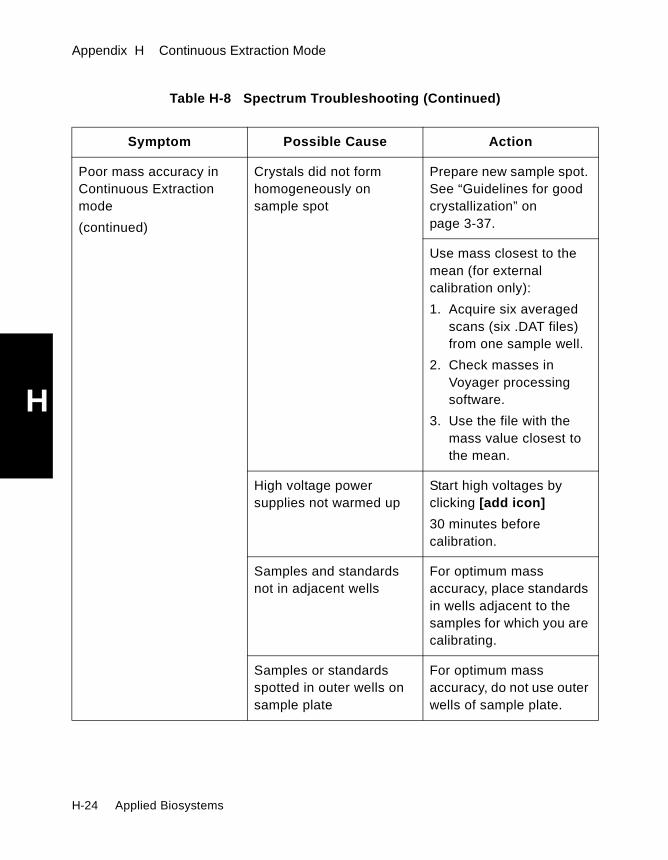
Appendix H Continuous Extraction Mode
H
Poor mass accuracy inContinuous Extractionmode
(continued)
Crystals did not formhomogeneously onsample spot
Prepare new sample spot.See “Guidelines for goodcrystallization” onpage 3-37.
Use mass closest to themean (for externalcalibration only):
1. Acquire six averagedscans (six .DAT files)from one sample well.
2. Check masses inVoyager processingsoftware.
3. Use the file with themass value closest tothe mean.
High voltage powersupplies not warmed up
Start high voltages byclicking [add icon]
30 minutes beforecalibration.
Samples and standardsnot in adjacent wells
For optimum massaccuracy, place standardsin wells adjacent to thesamples for which you arecalibrating.
Samples or standardsspotted in outer wells onsample plate
For optimum massaccuracy, do not use outerwells of sample plate.
Table H-8 Spectrum Troubleshooting (Continued)
Symptom Possible Cause Action
H-24 Applied Biosystems
Ippendix
AI Using theOscilloscope andControl Stick
This appendix contains the following sections:I.1 Guidelines for Acquiring ........................... I-3
I.2 Scaling ..................................................... I-4
I.3 Using the Control Stick ............................. I-7
NOTE: If your system includes an internal digitizer board or an external digitizerinstead of an external oscilloscope, refer to Section 4.3, Using theSpectrum Window.
Voyager™ Biospectrometry™ Workstation User’s Guide I-1

Appendix I Using the Oscilloscope and Control Stick
I
OscilloscopeoverviewAn external oscilloscope (instead of the internal digitizer boardor the LeCroy digitizer) is available as an option on Voyagersystems.
The oscilloscope converts the signal from the massspectrometer to a signal that the computer can use. Theoscilloscope has its own screen to display the averaged ionsignal in real-time. For instrument configurations containing anoscilloscope, the software does not refresh the spectrum viewuntil averaging is finished. Unlike the “real-time” update in thespectrum view, the oscilloscope screen displays the detectorsignal on a time scale and the signal is inverted on the screen.Following acquisition, the signal is inverted and calibrated ontothe mass scale in the spectrum view.
Figure I-1 shows the front panel of the oscilloscope. Only theknobs you use to adjust the signal while acquiring spectra arelabeled. Other knobs are not used for general operation.
Figure I-1 Front Panel of Oscilloscope
PB100276
VERTICALPOSITION
HORIZONTALPOSITION
SCALESCALE
SELECT
Vertical Position Horizontal Position Select Cursor Control
Vertical Scale Horizontal ScaleReset Button
I-2 Applied Biosystems

Guidelines for Acquiring
I
I.1 Guidelines for AcquiringConsider the following as you acquire a spectrum and use theoscilloscope:
• When you start acquiring, you should see a signal thatcontains matrix peaks and sample peaks.
• Make sure the full range of the signal is displayed.Brackets must overlap the end range markers (seeFigure I-3). If brackets do not overlap, turn theHorizontal Scale and Horizontal Position knobs until theleft bracket overlays the left marker.
• Start with a high laser power to saturate the initialsignal. This is a good starting point from which you candetermine the laser threshold or the appropriate lasersetting for your application.
You may need to move the signal up using the VerticalPosition or the Vertical Scale knobs so that you can seethe tops of the peaks.
• If peak intensity of the final scan is near maximumintensity (Input range 50, 200, or 1000 mV), it is verypossible that some scans averaged in to the final scanare saturated. Reacquire using a lower laser power.
Voyager™ Biospectrometry™ Workstation User’s Guide I-3

Appendix I Using the Oscilloscope and Control Stick
I
I.2 ScalingInitial scaling Initial scaling of the oscilloscope is determined by the settingsin the Mode/Digitizer dialog box. See Section 5.2.2,Mode/Digitizer Dialog Box for more information.
You can adjust the initial scaling after acquisition starts byusing the knobs on the front panel of the oscilloscope(Figure I-2).
Figure I-2 Front Panel of Oscilloscope
PB100276
VERTICALPOSITION
HORIZONTALPOSITION
SCALESCALE
SELECT
Vertical Position Horizontal Position Select Cursor Control
Vertical Scale Horizontal ScaleReset Button
I-4 Applied Biosystems

Scaling
I
Use these knobs to adjust the signal on the oscilloscope:• Vertical position—Moves the signal up and down• Vertical scale—Adjusts the amplitude of the signal• Horizontal scale—Adjusts the width of the signal• Horizontal position—Moves the signal left and right• Select—Activates the right or left cursor• Cursor Control—Moves the active cursor• Reset button—Resets the oscilloscope screen
For information on using other controls on the oscilloscope,refer to the manual shipped with the oscilloscope.
The spectrum you see on the oscilloscope is inverted(Figure I-3).
NOTE: The oscilloscope displays an intensity versus timespectrum.
Figure I-3 Example of Signal on Oscilloscope
Ch 1 10 mV
0 Acqs
∆ XX.XX ns@ XX.XX µs
PB100506
Ch 1
Brackets indicate
Position ofactive
(solid line)
Differencebetweencursors
time range shownNumber of
scans averaged
Early, low massmatrix peaks
Later, higher masssample peak
Activecursor
(solid line)
Inactivecursor
(dotted line)
Inte
nsity
Marker indicatesbaseline position
Time
∆
@
# mV/gridline(changes as scale
is adjusted)
cursor
Voyager™ Biospectrometry™ Workstation User’s Guide I-5

Appendix I Using the Oscilloscope and Control Stick
I
The Channel indicator (Ch1 in Figure I-3) displays Ch1 inLinear mode. On Voyager-DE PRO and Voyager-DE STRsystems, the Channel indicator displays Ch2 in Reflectormode.The top of the screen also displays:
• Average—During acquisition• Stop—When acquisition is complete
CAUTION
The oscilloscope does not save spectra. If you acquire anew spectrum before downloading to the Voyagerprocessing software, you lose the previous spectrum.
Adjusting thedisplay
To adjust the display:
• Center the signal vertically on the screen using theVertical Position knob.
• Adjust the amplitude of the signal using the VerticalScale knob. Make sure the peak of interest is on scale.
• Widen peaks using the Horizontal Scale knob.
I-6 Applied Biosystems

Using the Control Stick
I
I.3 Using the Control StickStartingacquisition
After you load samples on the sample plate, and load the plateinto the system, start acquiring.
To start acquiring, press the left button on the base of thecontrol stick (Figure I-4).
Figure I-4 Control Stick
NOTE: You can also start acquisition by clicking in the
toolbar. Acquisition continues until the number
of Shots/Spectrum in the instrument setting is acquired, or
until you press the start/stop (left) button on the control stick
or the toolbar button again.
To stop acquiring, press the left button on the base of thecontrol stick (Figure I-4).
PB100474
Start/stopdata acquisition
Stop data acquisition/save spectrum
Move stickup and down,left and rightto adjust sampleposition underlaser beam
Voyager™ Biospectrometry™ Workstation User’s Guide I-7

Appendix I Using the Oscilloscope and Control Stick
I
CAUTIONCheck to see if acquisition has already stoppedautomatically before pressing the control stick button. Ifacquisition has stopped, the Instrument Control Panelstatus bar is blank (it displays an “Acquiring Data” messageduring acquisition).
If acquisition has stopped and you press a control stickbutton, you will begin a new acquisition and overwrite thecurrent spectrum.
NOTE: To move the sample under the laser beam, deflectthe control stick in the appropriate direction. Longerdeflection will result in faster movement of the sample plate.
I-8 Applied Biosystems

B
BLI
I
OGRAPHY
Bibliography
General Mass Spectrometry
Beavis, R.C. and B.T. Chait, Chem. Phys. Lett., 1991, 181, 479.
Cotter, R.J., Time-of-Flight Mass Spectrometry: Instrumentation and Applications inBiological Research (ACS Professional Reference Book), 1997, Amer. Chem. Society.
Feigl, P, B. Schueler, and F. Hillenkamp, Int. J. Mass Spectrom. Ion Phys., 1983, 47, 15.
Mamyrin, B. A., V. J. Karatajev, D. V. Smikk, and V. A. Zagulin, Soviet Phys. JETP, 1973,37, 45–48.
Middleditch, B., Practical Mass Spectrometry, Plenum Press, New York, 1979.
Watson, J. Throck, Introduction to Mass Spectrometry, Raven Press, New York, 1985.
Wiley, W.C. and I.H. McLaren, Rev. Sci. Instrum., 1953, 26, 1150–1157.
Zhou, J., W. Ens, K. Standing, and A. Verentchikov, Rapid Commun. Mass Spectrom.,1992, 6, 671–678.
Introduction to MALDI
Hillenkamp, F. and M. Karas, Methods in Enzymol., 1990, 193, 280–295.
Karas, M., D. Bachmann, U. Bahr, and F. Hillenkamp, Int. J. Mass Spectrom. IonProcesses, 1987, 78, 53–68.
Tanaka, K., H. Waki, Y. Ido, and S. Akita, Rapid Commun. Mass Spectrom., 1988, 3,151–153.
Matrixes
Beavis, R.C., B.T. Chait, Anal. Chem., 1990, 60, 1836–1840.
Beavis, R.C., B.T. Chait, Rapid Commun. Mass Spectrom., 1989, 3, 432–435.
Beavis, R.C., B.T. Chait, Org. Mass Spectrom., 1992, 27, 156–158.
Chen, C.H., et al., Rapid Commun. Mass Spectrom., 1994, 8, 673–677.
Juhasz, P., C.E. Costello, K. Biemann, J. Am. Soc. Mass Spectrom., 1993, 4, 399–409.
Juhasz, P., C.E. Costello, Rapid Commun. Mass Spectrom., 1993, 7, 343–351.
Karas, M., U. Bahr, K. Strupat, F. Hillenkamp, A. Tsourbopoulos, and B.N. Pamanik,Anal. Chem., 1995, 67, 675–679.
Voyager™ Biospectrometry™ Workstation User’s Guide Bibliography-1

B
BLI
I
OGRAPHY
Bibliography
Karas, M., U. Bahr, F. Hillenkamp, Int. J. Mass Spectrom. Ion Proc., 1989, 92, 231–242.
Nordhoff, E. et al., Rapid Commun. Mass Spectrom., 1992, 6, 771–776.
Papac, D.I., A. Wong, A.J.S. Jones, Anal. Chem., 1996, 68, 3215–3223.
Pieles, U., W. Zurcher, M. Schar, and H. E. Moser, Nucl. Acids Res., 1993, 21,3191–3196.
Russel D., J. Am. Soc. Mass. Spectrom. 1996, 7, 995–1001.
Shevchenko, A., M. Wilm, O. Vorm, M. Mann, Anal. Chem., 1996, 68, 850–858.
Strupat, K., M. Karas, F. Hillenkamp, Int. J. Mass Spectrom. Ion Proc., 1991, 111,89–102.
Wu, K.J., A. Steding, C.H. Becker, Rapid Commun. Mass Spectrom., 1993, 7, 142–146.
Delayed Extraction
Brown, R.S., and J.J. Lennon, Anal. Chem., 1995, 67, 1998–2003.
Brown, R.S., J.J. Lennon, and D. Christie, Desorption ‘94—Mass Spectrometry of LargeOrganic Ions by Particle and Photon Induced Desorption, March 27–31, 1994, Sunriver,OR, USA, p.63.
Colby, S. M., T. B. King, and J. P. Reilly, Rapid. Commun. Mass Spectrom., 1994, 8,865–868.
Juhasz, P., M. Vestal, and S.A. Martin, “On the Initial Velocity of Ions Generated by Matrix-Assisted Laser Desorption Ionization and Its Effect on the Calibration of DelayedExtraction Time-Of-Flight Mass Spectra”, J. Am. Soc. Mass. Spectrom., 1997, 8,209–217.
Takach, E.J., W.M. Hines, D.H. Patterson, P. Juhasz, A.M. Falick, M.L. Vestal, and S.A.Martin, “Accurate Mass Measurements Using MALDI-TOF with Delayed Extraction”,Journal of Protein Chemistry, 1997, 16, 363.
Vestal, M.L. and P. Juhasz, “Resolution and Mass Accuracy in Matrix-Assisted LaserDesorption Ionization Time-of-Flight”, J. Am. Soc. Mass. Spectrom., 1998, 9, 892–911.
Vestal, M.L., P. Juhasz, and S.A. Martin, Rapid. Commun. Mass Spectrom., 1995, 9,1044–1050.
Whittal, R.M. and L. Li, Anal. Chem., 1995, 67, 1950–1954.
MALDI Applications
Brockman, A.H. and Orlando R. Anal. Chem. 1995, 67, 4581–4585.
Dogruel, D., Williams P. and Nelson R.W. Anal. Chem. 1995, 67, 4343–4348.
Bibliography-2 Applied Biosystems
Bibliography
B
BLI
I
OGRAPHY
Fitzgerald, M.C., L. Zhu, and L.M. Smith, “The Analysis of Mock DNA SequencingReactions Using Matrix-assisted Laser Desorption/Ionization Mass Spectrometry”, RapidCommun. Mass Spectrom., 1993, 7, 895–897.
Hillenkamp, F., M. Karas, R.C. Beavis, B.T. Chait, “Matrix-Assisted Laser Desorption/Ionization Mass Spectrometry of Biopolymers”, Anal. Chem. 1991, 63, 1193–1203.
Huberty, M.C., J.E. Vath, W. Yu, and S.A. Martin, “Site-Specific Carbohydrate Identificationin Recombinant Proteins Using MALDI-TOF MS”, Anal. Chem., 1993, 65, 2791–2800.
Hutchens, T.W., and T. Yip, “New Desorption Strategies for the Mass SpectrometricAnalysis of Macromolecules”, Rapid Commun. Mass Spectrom., 1993, 7, 576–580.
Krone, et. al., Anal. Biochem. 1997, 244, 124–132.
Standing, K.G. and W. Ens, Methods and Mechanisms for Producing Ions from LargeMolecules, Plenum Press, New York, 1991.
Youngquist, R.S., G.R. Fuentes, M.P. Lacey, and T. Keough, “Matrix-assisted LaserDesorption Ionization for Rapid Determination of the Sequences of Biologically ActivePeptides Isolated from Support-bound Combinatorial Peptide Libraries”, Rapid Commun.Mass Spectrom., 1994, 8, 77–81.
MS/MS Interpretation
Falick, A.M., W.M. Hines, K.F. Medzihradszky, M.A. Baldwin, and B.W. Gibson, “Low-MassIons Produced from Peptides by High-Energy Collision-Induced Dissociation in TandemMass Spectrometry”, J. Am. Soc. Mass. Spectrom., 1993, 4, 882–893.
Hines, W.M., A.M. Falick, A.L. Burlingame, and B.W. Gibson, “Pattern-Based Algorithm forPeptide Sequencing from Tandem High Energy Collision-Induced Dissociation MassSpectra”, J. Am. Soc. Mass Spectrom., 1992, 3, 326–336.
Kaufman, R., B. Spengler, and F. Lützenkirchen, “Mass Spectrometric Sequencing ofLinear Peptides by Product-ion Analysis in a Reflectron Time-of-flight Mass SpectrometerUsing Matrix-assisted Laser Desorption Ionization”, Rapid Commun. Mass Spectrom.1993, 7, 902–910.
McCloskey, J.A, ed., Meth. Enzymol., 1990, 193, 886.
Papayannopoulos, I., “The Interpretation of Collision-Induced Dissociation Tandem MassSpectra of Peptides”, Mass Spectrometry Reviews, 1995, 14, 49–73.
Voyager™ Biospectrometry™ Workstation User’s Guide Bibliography-3

B
BLI
I
OGRAPHY
Bibliography
Peptide/Protein Applications
Bieman, K., “Mass Spectrometry of Peptides and Proteins”, Annu. Rev. Biochem. 1992,61, 977–1010.
Bieman, K., “Sequencing of Peptides by Tandem Mass Spectrometry and High-EnergyCollision-Induced Dissociation”, Meth. Enzymol., 1990, 193, 455.
Billeci, T.M., J.T. Stults, “Tryptic Mapping of Recombinant Proteins by Matrix-AssistedLaser Desorption/Ionization Mass Spectrometry”, Anal. Chem., 1993, 65, 1709–1716.
Binz, P., M. Muller, D. Walther, W.V. Bienvenut, R. Gras, C. Hoogland, G. Bouchet, E.Gasteiger, R. Fabbretti, S. Gay, P. Palagi, M.R. Wilkins, V. Rouge, L. Tonella, S. Paesano,G. Rossellat, A. Karmime, A. Bairoch, J. Sanchez, R.D. Appel, and D.F. Hochstrasser, “AMolecular Scanner To Automate Proteomic Research and To Display Proteome Images”,Anal. Chem., 1999, 71, 4981–4988.
Chait, B.T., R. Wang, R.C. Beavis, S.B.H. Kent, “Protein Ladder Sequencing”, Science,1993, 262, 89–92.
Chaurand, P., and F. Luetzenkirchen, “Peptide and Protein Identification byMatrix-Assisted Laser Desorption Ionization (MALDI) and MALDI-Post-Source DecayTime-of-Flight Mass Spectrometry”, J. Am. Soc. Mass. Spectrom., 1999, 10, 91–103.
Henzel, W.J., T.M. Billeci, J.T. Stults, S.C. Wong, C. Grimley, and C. Watanabe,“Identifying Proteins from Two-dimensional Gels by Molecular Mass Searching of PeptideFragments in Protein Sequencing Database”, Proc. Natl. Acad. Sci. USA, 1993, 90, 5011–5015.
Clauser, K.R., P. Baker, and A.L. Burlingame, “Role of Accurate Mass Measurement(±10 ppm) in Protein Identification Strategies Employing MS or MS/MS and DatabaseSearching”, Anal. Chem., 1999, 71, 2871–2882.
Patterson, D.H., G.E. Tarr, F.E. Regnier, and S.A. Martin, “C-Terminal Ladder Sequencingvia Matrix-Assisted Laser Desorption Mass Spectrometry Coupled with CarboxypeptidaseY Time-Dependent and Concentration-Dependent Digestions”,Anal. Chem., 1995, 67, 3971.
DNA Applications
Ehring, H.M., M. Karas, F. Hillenkamp, Org. Mass Spectrom., 1992, 27, 472–480.
Kirpekar, F.E. Nordhoff, K. Kristiansen, P. Roepstorff, A. Lezius, S. Hahner, M. Karas, andF. Hillenkamp, “Matrix Assisted Laser Desorption/ionization Mass Spectrometry ofEnzymatically Synthesized RNA up to 140 kDa”, Nucleic Acids Research, 1994, 22, 3866–3870.
Bibliography-4 Applied Biosystems

Bibliography
B
BLI
I
OGRAPHY
Juhasz, P., M.T. Roskey, I.P. Smirnov, L.A. Haff, M.L. Vestal, and S.A. Martin, “Applicationsof Delayed Extraction Matrix-Assisted Laser Desorption Ionization Time-of-Flight MassSpectrometry to Oligonucleotide Analysis”, Anal. Chem., 1996, 68, 941–946.
Pieles, U., W. Zürcher, M. Schär, and H.E. Moser, “Matrix-Assisted Laser DesorptionIonization Time-of-flight Mass Spectrometry: a Powerful Tool for The Mass and SequenceAnalysis Of Natural And Modified Oligonucleotides”, Nucleic Acids Research, 1993, 21,3191–3196.
Smirnov, I.P., M.T.Roskey, P. Juhasz, E.J. Takach, S.A. Martin, and L.A. Haff, “SequencingOligonucleotides by Exonuclease Digestion and Delayed Extraction Matrix-Assisted LaserDesorption Ionization Time-of-Flight Mass Spectrometry”, Anal. Biochem., 1996, 238,19–25.
Tang, K., N.I. Taranenko, S.L. Allman, C.H. Chen, L.Y. Chang, and K.B. Jacobson,“Picolinic Acid as a Matrix for Laser Mass Spectrometry of Nucleic Acids and Proteins”,Rapid Commun. Mass Spectrom., 1994, 8, 673–677.
Wu, K.J., A. Steding, and C.H. Becker, “Matrix-assisted Laser Desorption Time-of-flightMass Spectrometry of Oligonucleotides Using 3-Hydroxypicolinic Acid as anUltraviolet-sensitive Matrix”, Rapid Commun. Mass Spectrom., 1993, 7, 142–146.
In-Gel Digestion
UCSF In-Gel Digest Procedure, 2/2/00, http://donatello.ucsf.edu/ingel.html
Rosenfeld, et al., Anal. Biochem., 1992, 203, 173–179.
Hellman, et al., Anal. Biochem., 1995, 224, 451–455.
Lipooligosaccharides
Gibson, B.W., J.J. Engstrom, C.M. John, W. Hines, and A.M. Falick, “Characterization ofBacterial Lipooligosaccharides by Delayed Extraction Matrix-Assisted Laser DesorptionIonization Time-of-Flight Mass Spectrometry”, J. Am. Soc. Mass. Spectrom., 1997, 8, 645–658.
Genespectrometry
Haff, L., P. Juhasz, S. Martin, M. Roskey, I. Smirnov, W. Stanick, M. Vestal, and K.Waddell, “Oligonucleotide Analysis by MALDI-MS”, Analusis Magazine, 1998, 28–32.
Haff, L.A., and I.P. Smirnov, “DNA Sequence Analysis by Matrix-assisted Laser DesorptionIonization MS”, Biochemical Society Transactions, 1996, 901–903.
Voyager™ Biospectrometry™ Workstation User’s Guide Bibliography-5

B
BLI
I
OGRAPHY
Bibliography
Haff, L.A., and I.P. Smirnov, “Multiplex Genotyping of PCR Products withMassTag-Labeled Primers”, Nucleic Acids Research 25, 1997, 18, 3749–3750.
Haff, L.A., and I.P. Smirnov, “Single-Nucleotide Polymorphism Identification Assays usinga Thermostable DNA Polymerase and Delayed Extraction MALDI-TOF MassSpectrometry”, Genome Methods, 1997, 7, 378–388.
Griffin, T.J., and L.M. Smith, “Single-nucleotide polymorphism analysis by MADLI-TOFmass spectrometry”, Trends in Biotechnology, February, 2000, 18, 77–84.
Juhasz, P., M.T. Roskey, I.P. Smirnov, L.A. Haff, M.L. Vestal, and S.A. Martin, “IonizationTime-of-flight Mass Spectrometry to Oligonucleotide Analysis Applications of DelayedExtraction Matrix-Assisted Desorption”, Anal. Chem., 1996, 68, 941–946.
Roskey, M.T., P. Juhasz, I.P. Smirnov, E.J. Takach, S.A. Martin, and L.A. Haff, “DNASequencing by Delayed Extraction-MALDI TOF Mass Spectrometry”, Proc. Natl. Acad. SciUSA, 1996, 93, 4724–4729.
Ross, P.L., P.A. Davis, and P. Belgrader, “Analysis of DNA Fragments from Conventionaland Microfabricated PCR Devices using Delayed Extraction MALDI-TOF MassSpectrometry”, Anal. Chem., 1998, 70, 2067–2073.
Ross, P., L. Hall, I. Smirnov, and L.Haff, “High Level Multiplex Genotyping by MALDI-TOFMass Spectrometry”, Nature Biotechnology, 1998, 16, 1347–1351.
Ross, P.L., K. Lee, and P. Belgrader, “Discrimination of Single-Nucleotide Polymorphismsin Human DNA Using Peptide Nucleic Acid Probes Detected by MALDI-TOF MassSpectrometry”, Anal. Chem., 1997, 69, 4197–4202.
Smirnov, I.P., M.T. Roskey, P. Juhasz, E.J. Takach, S.A. Martin, and Lawrence A. Haff,”Sequencing Oligonucleotides by Exonuclease Digestion and Delayed ExtractionMALDI-TOF Mass Spectrometry”, Anal. Biochem., 1996, 238, 19–25.
Taranenko, N.I., C.N. Chung, Y.F. Zhu, S.L. Allman, V.V. Golovlev, N.R. Isola, S.A. Martin,L.A. Haff, and C.H. Chen, “Matrix-assisted laser desorption/ionization for SequencingSingle-stranded and Double-stranded DNA”, Rapid Comm. Mass Spectrom., 1997, 11,386–392.
Taranenko, N.I., K.J. Matteson, C.N. Chung, Y.F. Zhu, L.Y. Chang, S.L. Allman, L.A. Haff,S.A. Martin, and C.H. Chen, “Laser Desorption Mass Spectrometry for Point MutationDetection”, Genetic Analysis; Biomolecular Engineering, 1997.
Taranenko, N.I., K. J. Matteson, C. N. Chung, Y.F. Zhu, L.Y. Chang, S.L. Allman, L. Haff, S.A. Martin, and C.H. Chen, “Laser Desorption Mass Spectrometry for Point MutationDetection”, Genet. Anal. (Netherlands), Oct. 1996, 13, 87–94.
Timofeev, E.N., I.P. Smirnov, L.A. Haff, E.I. Tishchenko, A. D. Mirzabekov, and V. L.Florentiev, “Methidium Intercalator Inserted into Synthetic Oligonucleotides”, TetrahedronLetters, 1996.
Bibliography-6 Applied Biosystems
Bibliography
B
BLI
I
OGRAPHY
Vestal, M.L., P. Juhasz, and S.A. Martin, “Delayed Extraction Matrix-assisted laserdesorption time-of-flight mass spectrometry”, Rapid Commun. Mass Spectrom., 1995, 9,1044–1050.
Zhu, Y.F., C.N. Chung, N.I. Tarenenko, S.L. Allman, S.A. Martin, L.A. Haff, and C.H. Chen,“The Study of 2,3,4-Trihydroxyacetophenone and 2,4,6-Trihydroxyacetophenone asMatrices for DNA Detection in Matrix-assisted Laser Desorption/Ionization Time of FlightMass Spectrometry”, Rapid Comm. Mass Spectrometry, 1996, 10, 383–388.
Zhu, Y.F., N.I. Taranenko, S.L. Allman, N.V. Taranenko, S.A. Martin, and L. A. Haff,“Oligonucleotide Sequencing by Fragmentation in matrix-assisted laser desorption/ionization time-of-flight mass spectrometry”, Rapid Comm. Mass Spectrometry, 1997, 11,897–903.
Voyager™ Biospectrometry™ Workstation User’s Guide Bibliography-7
B
BLI
I
OGRAPHY
Bibliography
Bibliography-8 Applied Biosystems

Glossary G
OSS
L
ARY
a, b, and c ions —Genericdescription of potential ions that areformed by fragmentation of a parentpeptide/protein. a, b, and c ions arefragments that retain the charge at theamino end (n-terminus) of the molecule.See also x, y, z ions.
ASCII —American Standard Code forInformation Interchange. A file formatthat contains codes that constitute the128-character ASCII set, and allowsexchange of data between informationprocessing systems, communicationsystems, and associated equipment.
Accelerating voltage —Potential difference between the ionsource and ground, used to accelerateions. Actual acceleration in a TOFinstrument usually occurs in the first 1 to2 cm of the flight tube. Ions then drift theremaining flight tube distance.
Arcing —Electrical dischargebetween two points. Usually occurswhen a high potential difference existsbetween two points.
BA1 and BA2 (Bayard-Alpert vacuum gauges) —Pressure gauges that operate below1 millitorr by measuring a positive ioncurrent produced by electrons from ahot filament. Voyager-DE systemsinclude BA1 only.
Beam Guide Wire —See GuideWire Voltage.
Centroid% —Percentage of thepeak height examined during peakidentification. For example, with aCentroid% of 10, the software examinesthe top 10 percent of the signal.
CID—Collision-induced dissociation—A technology that enhancesfragmentation for PSD analysis. As ionsleave the source, they pass through acollision cell, interact with collision gasmolecules, and energy is transferred tothe ions. This transfer of energyenhances fragmentation.
Continuous Extraction—Formation of ions in a strong electricalfield, with immediate acceleration. Usedfor diagnostic purposes.
Daughter ion —See Product ion.
Delayed Extraction—Formation of ions in a weak electricalfield, with subsequent acceleration byapplication of a high voltage pulse aftera predetermined time delay.
CH—CO—NH—CH
Rn Rn+1
an bn cn
Voyager™ Biospectrometry™ Workstation User’s Guide Glossary-1

G
OSS
L
ARY
Glossary
Delay Time —Used in DelayedExtraction mode. Time in nanoseconds(after the laser ionizes the sample) atwhich full Accelerating Voltage isapplied, creating the potential gradientthat accelerates ions.
Digitizer —A device that convertsan analog signal to a digital word andstores the result in memory. This allowsthe transfer of the digitized signal to acomputer for additional processing.
Dimer —A species that results from aassociation between two identicalmolecules. Expressed as [2M+H]+.Appears in a mass spectrum at 2 timesthe protonated molecular ion mass,minus one mass unit.
Edman degradationtechnique —An approach toamino-end-group determinationinvolving the use of a reagent,phenylisothiocyanate, that can beapplied to the liberation of a derivativeof the amino-terminal residue withouthydrolysis of the remainder of thepeptide chain.
Flight tube —Vacuum chamber inwhich ions drift from the source to thedetector.
Fore pump —Rotary pump thatmaintains vacuum in the sample loadingchamber, creates the low-vacuumcondition needed by the turbo pump,and provides backing pressure to theturbo pump.
Fragment —Ion dissociated fromprecursor ion.
FWHM —Full width at half maximum.
GPMAW —General Protein/MassAnalysis for Windows software, asoftware program used to identifyprotein sequences.
Grid voltage —Secondary voltageused to fine-tune ion acceleration, on avariable-voltage grid above the sampleplate.
Guide Wire voltage —Voltageapplied to beam guide wire to focus ionson detector. Particularly useful forenhancing analysis of high mass ions.
Immonium ion —In PSD, lowmolecular weight fragment ions derivedfrom amino acids.
Initial velocity —The velocityassociated with an ion when it isreleased from the sample plate, beforeacceleration. Voyager software allowscorrection for matrix-dependent initialvelocities.
Intensity (signal or ion) —Amplitude of signal shown onoscilloscope screen or spectrumwindow.
Intensity (laser) —Amount oflaser-generated light reaching thesample spot. Controlled by adjusting thelaser attenuator using laser step setting.
Ion —An isolated electron or proton oran atom or molecule which, by loss orgain of one or more electrons, hasacquired a net electric charge.
Glossary-2 Applied Biosystems

Glossary
G
OSS
L
ARY
Ionization —Conversion of samplein solid, gaseous, or liquid phase toions.
Ion intensity —See Intensity.
Ion source —Device that producesions. In a TOF instrument, it refers tothe surface of the sample plate, thevariable-voltage grid above the plate,and the grounded grid and apertureabove the variable-voltage grid.
Isomers —Compounds that havethe same molecular weight but differentstructures.
Isotopes —One of two or moreatoms with the same atomic number buta different mass. For example, carbonisotopes 12C, 13C, and 14C.
Laser —Energy source for sampleionization in MALDI technology. TheVoyager Biospectrometry Workstationuses a Nitrogen laser at 337 nm thatprovides 3-nanosecond-wide pulses.
Laser attenuator —Device thatcontrols laser intensity. Controlled bylaser step setting.
Laser intensity —See Intensity.
Laser step —Unit of movement oflaser attenuator. The size of the laserstep is set in Laser Configuration. Thenumber of laser steps is controlled byusing the slider controls on the ManualLaser Control page.
Low Mass Gate —Mechanismfor suppressing low mass ions. Thevoltage in the detector is not turned onuntil ions below the specified startingmass have passed.
Ladder sequencing —Peptideor DNA sequencing in which amino acidsequence is read from one of the endsof the peptide chain.
[M+H] +—Molecular ion.
[M+2H] 2+—Doubly-charged ion.Appears in spectrum at approximatelyhalf the molecular weight of the ion.
[M+3H] 3+—Triply-charged ion.Appears in spectrum at approximatelyone third the molecular weight of theion.
MALDI —Matrix-assisted laserdesorption ionization. Described inSection 1.3, MALDI-TOF MSTechnology Overview.
Mass accuracy —The errorbetween the observed mass and thecalculated mass from atomiccomposition. Can be expressed asmass units or the ratio of massassignment error divided by ion mass inpercent terms.
Mass resolution —Describesthe separation between adjacent masspeaks. Expressed as the mass (m) ofthe ion signal, divided by the width ofthe peak at half-height (∆ m).
Voyager™ Biospectrometry™ Workstation User’s Guide Glossary-3

G
OSS
L
ARY
Glossary
Matrix —Low-mass, UV-absorbingsubstance used in MALDI technology toenable sample ionization. Commonmatrices include sinapinic acid,dihydroxy benzoic acid, and α-cyano 4-hydroxy cinnamic acid. SeeAppendix C, Matrixes, for moreinformation.
Metastable ion analysis —See MS/MS analysis.
Mirror —A single plate at highvoltage. Commonly used to refer to thereflector in a TOF instrument.
Mirror voltage ratio —Ratio ofthe mirror high voltage supply to theacceleration high voltage supply. MirrorVoltage = ratio x accelerating voltage.
MS/MS analysis —Selection ofa precursor ion for fragmentation, andthe collection of the fragment ions.MS/MS analysis can yield sequencinginformation for a peptide.
By acquiring data using different mirrorvoltages, you can focus on differentsegments of the fragment population.After acquisition, you can piece togetherthe segments to examine a compositePSD spectrum.
Multiply charged ions —See[M+2H]2+ and [M+3H]3+.
m/z —Mass-to-charge ratio.
Parent ion —See Precursor ion.
Post-Source Decay(PSD) —Fragmentation of an ionduring flight, after it leaves the ionsource region.
Post-translationalmodification —Non-amino acidmodifications made to a peptide orprotein by chemical or enzymaticmeans. Examples include deamidation,acetylation, oxidation, glycosylation,phosphorylation, and sulfation.
Pulsed Source—Ion source in aDelayed Extraction system.
Precursor ion —Used in PSDAnalysis software. Original ion fromwhich fragments dissociate.
Precursor Ion Selector —See Timed Ion Selector.
Product ion —Used in PSDAnalysis software. Fragment ion thatdissociates from precursor ion.
Sensitivity —Measure of theamount of sample required to generatean acceptable mass spectrum. Usuallyexpressed in terms of strength of signalrelative to noise.
Signal intensity —See Intensity.
Source —See Ion source.
Stitch —Segment of a PSDcomposite spectrum.
Tandem massspectrometry —See MS/MSAnalysis.
Glossary-4 Applied Biosystems

Glossary
G
OSS
L
ARY
TC2 (Thermocouplevacuum gauge) —Pressuregauge that operates from 1 millitorr tonear atmospheric pressure bymeasuring the temperature of a heatedthermocouple junction. As the pressurerises, more heat is removed, loweringthe temperature.
Timed Ion Selector —Mechanism for suppressing all but theion of interest, used in PSD analysis.Voltage is applied to ion selector platesin the flight tube before and after the ionof interest passes the selector plates.
Time-of-flight (TOF) MassAnalyzer —A mass analyzer thatmeasures mass by measuring drifttimes. If a packet of ions leaves the ionsource at the same time and with thesame energy, then their flight timethrough a field-free drift region willdepend on their mass. Time-of-flightmass analyzers have the advantagethat they have no upper mass limit andare well suited to the analysis of largemolecules.
Torr —A unit of pressure equal to onemillimeter of mercury.
Turbo pump —A vacuum pumpthat operates in the pressure rangewhere the mean free path is largecompared to the chamber dimensions.Molecules that diffuse into the throat areknocked to the bottom by a fanoperating at supersonic speeds. Thecollected gas is further compressed toatmospheric pressure by a mechanicalfore pump. Turbo pumps operate wellup to about 10-10 Torr.
Velocity focusing —In DelayedExtraction, the tuning of the GridVoltage% and Delay Time to account forthe different initial velocities of ions asthey are released from the sampleplate. Velocity focusing providesimproved resolution. See “Velocityfocusing” on page 1-15.
V —Volt.
x, y, and z ions —Genericdescription of potential ions that areformed by fragmentation of a parentpeptide/protein. x, y, and z ions arefragments that retain the charge at thecarboxy end (c-terminus) of themolecule. See also a, b, c ions.
CH—CO—NH—CH
Rn Rn+1
xn yn zn
Voyager™ Biospectrometry™ Workstation User’s Guide Glossary-5

G
OSS
L
ARY
Glossary
Glossary-6 Applied Biosystems

IndexI
DEX
N
Numerics100 well plate
number of cal standardsneeded 3-39
PLT file 3-67types of 3-62, 3-63
384 well platenumber of cal standards
needed 3-39PLT file 3-67position/row diagram 3-66types of 3-63
3-HPAchemical structure and molecular
weight C-10concentration 3-15crystals 3-15, 3-46initial velocity setting 5-22laser intensity, relative 5-67mass spectrum C-4preparing 3-15sample concentration 3-15stability 3-15when to use 3-3
400 well platenumber of cal standards
needed 3-39PLT file 3-67types of 3-62, 3-63
64 well platenumber of cal standards
needed 3-39PLT file 3-67
96x2 well plateone calibration standard
needed 3-39PLT file 3-67position/row diagram 3-66types of 3-64
Aa, b, c ions, angiotensin F-6Absolute counts
displaying on right axis 5-70scaling signal to 4-12
Accelerating Voltagechanges compensated for by
system 5-17, 5-87description 5-87effect on calibration 5-17, 5-87effect on resolution 5-50, 5-88effect on signal-to-noise 5-50impact on ion acceleration 5-87in Continuous Extraction
mode H-11in PSD mode 8-44, 8-59maximum, configuring 2-38peptides 5-84range, DE systems 5-17recommended settings 5-87
Acceptance criteria, see SpectrumAcceptance Criteria
Accumulate All Spectra data collectionmode
description 5-45process that occurs during 6-66selecting 5-36
Voyager™ Biospectrometry™ Workstation User’s Guide Index-1

I
DEX
N
Index
Accumulate All Spectra That PassAcceptance Criteria datacollection mode
description 5-46process that occurs during 6-67selecting 5-36
Accumulation, spectra, automaticenabling 6-40number of spectra to acquire 5-35process that occurs during 6-65
Accumulation, spectra, manualclearing trace 6-20overriding maximum number of
Shots/Spectrum 5-89procedure 4-26, 6-19PSD 8-55resolution, improving 5-71signal-to-noise ratio,
improving 5-85Accuracy, see Mass accuracyAccurate mass measurements 6-26Acqiris digitizer, see DigitizerAcquiring data, Instrument Control
Panelsee also Automatic Control mode;
Manual Control mode; PSDacquisition; PSD mode
accumulating spectra 6-19, 8-55Automatic Control mode 6-36, 8-57data, saving 6-18Data Storage, setting 6-14evaluating data automatically 6-42evaluating data manually 6-17guidelines 6-4laser intensity, setting
automatically 6-39laser intensity, setting
manually 6-14Manual Control mode 6-11moving position on sample spot 6-5multiple spectra in one data
file 5-35, 5-39
Acquiring data, Instrument ControlPanel (continued)
multiple spectra, recommendedmaximum in one datafile 5-35
obtaining maximum massaccuracy 6-6
options 6-2overview 4-6, 6-2PSD, automatic mode 8-57PSD, manual mode 8-37resolution, calculating during 6-30sample position, selecting
automatically 6-41sample position, selecting
manually 6-13saving .BIC after acquisition to
store laser intensity 6-19signal-to-noise ratio, calculating
during 6-33single shot mode 2-45starting 4-25, 6-16status 2-78, 4-5, 4-25stopping 4-25, 6-16stopping before adjusting laser 6-5
Acquiring data, Sequence ControlPanel
see also Acquiring data, InstrumentControl Panel
see also Sequence Control Panellist of data files acquired 7-14multiple data files with different
instrument settings 1-44,4-32
pausing 7-28process that occurs during 7-28sample plate, aligning 7-24Sequence parameters 7-14starting 7-25status 7-20, 7-29stopping 7-28
Index-2 Applied Biosystems
Index
I
DEX
N
Acquisitionbatch 6-3, 7-2checking resolution in Continuous
Extraction mode H-17Current Spectrum trace
displayed 6-16determining laser threshold in
Continuous Extractionmode H-12
Live Spectrum trace displayed 6-16mass range in Spectrum window
does not update with everylaser shot 6-16, 9-21
multiple spectra in one datafile 5-35, 5-39
multiple spectra, recommendedmaximum in one datafile 5-35
process that occurs in AutomaticControl mode 6-58
process that occurs in ManualControl mode 6-16
PSD, automatic mode 8-63PSD, manual mode 8-53single shot mode 2-45starting 4-25, 6-16status, Sequence Control
Panel 7-20, 7-29stopping 4-25, 6-16, I-7with low number of Scans To
Average I-8Acquisition mode, description 6-61Acrobat, see Adobe AcrobatACTH
BIC file 5-4, 5-5molecular weight F-2, F-3
Active positiondisplayed in status bar 4-5incorrect number 9-20selecting automatically 6-41selecting manually 4-25, 4-29,
4-30, 6-13troubleshooting 9-20
Adding traces 4-14Adduct peaks 3-24Adobe Acrobat Reader
installing from Voyager CD 2-31opening PDF Voyager files 2-31
Advanced parameters, PSDPSD Mirror to Accelerating Voltage
Ratio 5-32Alpha-cyano-4-hydroxycinnamic acid
chemical structure and molecularweight C-7
concentration 3-3, 3-9, 3-11crystals 3-3, 3-9, 3-11, 3-45initial velocity setting 5-22laser intensity, relative 5-67mass spectrum C-2organic concentration 3-8organic concentration, dried droplet
application 3-10preparing, dried droplet
application 3-3, 3-5, 3-9preparing, thin layer
application 3-3, 3-5, 3-11sample concentration, dried droplet
application 3-3, 3-9sample concentration, thin layer
application 3-3, 3-11stability 3-10, 3-12when to use 3-3
Amino acids, immonium ions 8-23Angiotensin
BIC file 5-4, 5-5BIC files 5-6expected masses and ion
types 8-13mass to time conversion F-4molecular weight F-2PSD analysis of 8-3PSD fragments, observed F-7theoretical cleavages F-6
Voyager™ Biospectrometry™ Workstation User’s Guide Index-3

I
DEX
N
Index
Annotating tracesadding text 4-16changing font and color 4-21deleting text 4-17text from previous trace
displayed 4-16with ASCII text 4-16with results 4-16
Applied Biosystems TechnicalSupport 9-7
Archivingdefinition 9-6when to perform 9-6
Arcing 9-24ASCII text, annotating traces with 4-16Attenuator, see LaserAutomated Laser Intensity Adjustment
enabling 5-34Automated Sample Positioning
enabling 5-37Search Pattern file 5-38
Automatic Control modesee also Automatic Control mode
parameters; Acquiringdata; Laser IntensityAdjustment Criteria;Spectrum AccumulationCriteria
accumulating spectra 6-65accumulation conditions 6-40Acquisition mode 6-61Automatic Control tab 4-5, 6-45before you begin 6-36checking disk space 6-58enabling 6-38evaluating data 6-42laser intensity adjustment
criteria 6-42laser intensity, setting 6-39laser not aligned with sample
position 2-48, 9-23number of spectra to acquire 6-40
Automatic Control mode (continued)optimizing BIC for Sequence
run 7-7optimizing BIC in Manual Control
mode before using 6-37overview 4-6, 6-3Prescan mode, description 6-58process that occurs during
acquisition 6-58PSD analysis 8-57resolution filtering 6-44resolution filtering, peak height
used 6-44sample plate, aligning 2-46, 6-36sample plate required 3-41sample position, selecting 6-41saving conditions 6-40search pattern (.SP) file 6-46signal-to-noise filtering 6-43spectrum acceptance criteria 6-42
Automatic Control mode parametersaccessing 5-16, 5-33Automated Laser Intensity
Adjustment 5-34Automated Sample
Positioning 5-37Laser Intensity Adjustment Criteria,
see Laser IntensityAdjustment Criteria
Minimum and Maximum LaserIntensity 5-34
Number of spectra to acquire 5-35Prescan 5-34random search pattern 5-37Search Pattern file 5-38Spectrum Acceptance Criteria, see
Spectrum AcceptanceCriteria
Step Size, laser 5-34Stop Conditions 5-38
Index-4 Applied Biosystems

Index
I
DEX
N
Automatic Control tabdescription 4-5displayed during acquisition 6-45maximum number of lines
displayed 4-6Axes
changing scale on right axis 5-70customizing 4-21right, changing scale 5-70right, turning on and off 4-21scalingturning off right axis 4-11
BBA1, Voyager-DE
description 1-27E09 error 9-27maximum operating pressure 2-36pressure, displaying 2-77, 4-5pressure range 9-26wait time 2-37
BA1, Voyager-DE PROdescription 1-29E09 error 9-27maximum operating pressure 2-36pressure, displaying 2-77, 4-5pressure range 9-26wait time 2-37
BA1, Voyager-DE STRdescription 1-39E09 error 9-27maximum operating pressure 2-36pressure, displaying 2-77, 4-5pressure range 9-26wait time 2-37
BA2, Voyager-DEdescription 1-29pressure, displaying 2-78, 4-5pressure range 9-26
BA2, Voyager-DE PROdescription 1-29E09 error 9-27pressure, displaying 2-78, 4-5pressure range 9-26
BA2, Voyager-DE STRdescription 1-39E09 error 9-27pressure, displaying 2-78, 4-5pressure range 9-26
Back panel, see Rear panelBacking up 9-6Bandwidth, see Input BandwidthBase peak intensity
scaling to 4-11, 4-12Basics
Instrument Control Panel 4-2Sequence Control Panel 4-32
Batch acquisition 6-3, 7-2Beam guide wire
function 1-23, 5-18, 5-56replaced by Ion focusing lens on
STR models with serialnumber 4154 andlater 1-33, 1-35
voltage 5-18Bench space requirements
peripherals 2-3Voyager-DE and
Voyager-DE PRO 2-2Voyager-DE STR 2-7, A-10
Biacore Chip sample plate 3-63BIC files
see also Instrument Settings files(BIC)
Linear mode 5-4list of 5-3location 5-3opening 5-7opening from DAT file 5-7parameters saved in 5-2
Voyager™ Biospectrometry™ Workstation User’s Guide Index-5

I
DEX
N
Index
BIC files (continued)provided with system 2-30, 5-3PSD mode 5-6Reflector mode 5-5saving after acquisition to store
laser intensity 6-19Sequence Control Panel,
requirements 7-8, 7-27Sequence Control Panel,
selecting 7-16Bin size, digitizer
default 5-57description 5-29, 5-57impact on data resolution 5-50,
5-59impact on file size 5-59
Biospectrometry, definition 1-3, 1-6BLANK.PLT 3-77Bovine Trypsin, molecular weight F-2Bradykinin
mass to time conversion F-4molecular weight F-2
BSABIC file 5-4buffers 9-14, H-21mass to time conversion F-5molecular weight F-3
CC18, sample cleanup 3-31Cables required 2-12CAL file
creating 6-7PSD, selecting 8-46, 8-60selecting 6-13
CAL file, Sequence Control Panelcreating 7-11description 7-4selecting 7-19
Calibrationaccurate mass 6-26automatic, see Calibration,
automaticcorrection factors to improve mass
accuracy 2-53default, see Calibration, defaultdeisotoping to improve mass
accuracy 7-10equation 6-9external, see Calibration, externalhigh voltage warmup before
calibration 2-56, 6-4, 7-24impact of changing Grid
Voltage% 5-51impact of Low Mass Gate 5-89increasing accuracy 3-24, 3-38internal, see Calibration, internalmanual, see Calibration, manualmass accuracy 3-24, 3-38, 6-7,
6-10mass accuracy, optimizing 2-53matrix reference file,
modifying 5-23matrix, selecting 5-20, 6-13overview 6-7PSD, see Calibration, PSDSequence Control Panel 7-5, 7-6,
7-18smoothing spectra 6-10standards, see Calibration
standardstypes of 6-7updating, see Calibration, Internal-
update, Sequence ControlPanel
when to calibrate 6-8Calibration, automatic
external, see Calibration, externalinternal, see Calibration, internalSequence Control Panel 7-32
Index-6 Applied Biosystems

Index
I
DEX
N
Calibration, defaultdescription 6-7equation 6-9PSD, description 8-28PSD, selecting 8-46, 8-60selecting 5-10, 6-13
Calibration, externalclose external, performing 7-32mass accuracy, optimizing 2-53multiple spectra in one data file 7-4overview 6-7selecting 5-10, 6-13standards placement for optimum
mass accuracy 7-33Calibration, external, Sequence Control
Panelclose external, performing 7-34description 7-32overview 7-5, 7-6selecting 7-18
Calibration, internaland accurate mass
measurements 6-26concentration, optimizing
unknowns andstandard 7-39
description 6-7determining if standard suppresses
signal from unknown 7-40if concentration of standard
varies 7-42internal standard 6-26mass accuracy, optimizing 2-53multiple spectra in one data file 7-4overview 6-7search pattern file, example 7-41search pattern file for separate
spots, creating 7-38, 7-40
Calibration, internal, Sequence ControlPanel
description 7-32overview 7-5, 7-6selecting 7-18with external cal "backup" 7-42
Calibration, Internal-update, SequenceControl Panel
description 7-11how to program every X
minutes 3-39Calibration, internal-update, Sequence
Control Paneloverview 7-5, 7-6selecting 7-18selecting for close external
calibration 7-32Calibration, PSD
default 8-28default, selecting 8-46, 8-60equation 8-28in Instrument Settings 8-45, 8-60in PSD Acquisition Settings 8-46,
8-60two types 8-2
Calibration, Sequence Control Panelclose external, enhanced by Mass
AccuracyOptimization 7-34
Calibration standardssee also Internal standardsee also Standard compoundsfewer needed with Mass Accuracy
Optimization 3-39internal, if concentration
varies 7-42location on plate 3-38, H-24molecular weights F-2number and location required 3-38ordering information B-6reducing number needed 3-52requirements 6-10
Voyager™ Biospectrometry™ Workstation User’s Guide Index-7

I
DEX
N
Index
Calibration standards (continued)requirements for a sequence
run 7-33Voyager mass standards kit B-6with optimized plate 3-39with unoptimized plate 3-40
Camera, see Video cameraCarbohydrates, matrix for 3-3, C-7Carbonic anhydrase, molecular
weight F-3Cation exchange, sample cleanup 3-29Cautions
Deflector Gate Width in PSD,changing the setting 8-29
exiting Voyager Controlsoftware 2-34
Flight Length to Deflector, do notchange 8-30
internal jumpers, setting in STRmodels 2-8
vacuum disruption in CID 8-34voltage selector, plastic tabs
fragile 2-4Center bias search pattern 5-37Centroid mass, shift caused by Input
Bandwidth setting 5-63Centroid% for maximum mass
accuracy 6-6Ch1 and Ch2 on oscilloscope I-6CHCA matrix, see Alpha-cyano-4-
hyroxycinnamic acidChemical hazards 2-49Chemical structure of matrices C-1Child ion, see PSD precursor spectrumCID
adjusting 8-36benefits 8-32description 8-31enhancing fragmentation with 8-31gas pressure 8-36gas too high or too low 8-36
CID (continued)Guide Wire Voltage% 8-36interlock error 8-34plumbing 8-31purging 8-34sample spectra 8-32, 8-33troubleshooting 8-36turning off 8-36turning on 8-35vacuum gauges, pressure 8-34
Cleaningsample plates 3-47samples, see Sample cleanup
Clearing accumulated spectrum 4-26Close external calibration, see
calibration, external, SequenceControl Panel
Collision-induced dissociation, see CIDColors
changing Instrument ControlPanel 4-21
changing to black beforeprinting 4-18
OptiPlate results 2-69Comment, Sequence Control
Panel 4-32Composite spectrum, see PSD
composite spectrumComputer
archiving 9-6configuration requirement B-1connecting devices to 2-12, 2-16,
2-20hard disk size 1-30, 1-41maintenance 9-6memory 1-30, 1-41minimum configuration 1-30, 1-41,
A-4, A-7, A-10monitor, connecting, Voyager-DE
STR 2-28rear panel, Voyager-DE and
Voyager-DE PRO 2-10
Index-8 Applied Biosystems

Index
I
DEX
N
Computer (continued)screen savers, do not use 1-30,
1-41shutting down 2-75technical support for altered
configuration B-1troubleshooting 9-6with Signatec 500 MHz
digitizer 2-11with Tektronix oscilloscope 2-11
Concentration, see Sampleconcentration
Conditions, environmental A-4, A-7,A-10
ConfiguringDeflector Gate Width 8-30digitizer 2-44hardware 2-35high voltage 2-38instrument 2-40instrument type 2-41laser 2-42Precursor Ion Selector 8-30sample plate alignment 2-46Timed Ion Selector 2-39, 8-30vacuum 2-35
Continuous Extractionsee also Instrument Settings
parametersacceptable spectra H-8description 1-12, 1-13Grid Voltage% setting H-6Guide Wire Voltage% setting H-6instrument setting parameters that
affect H-11instrument settings, changing H-2Instrument settings optimized
for H-4instrument settings optimized
for H-3laser intensity H-6, H-12
Continuous Extraction (continued)mass accuracy
troubleshooting H-23optimizing parameters H-5resolution H-17resolution compared to delayed
mode 1-13resolution troubleshooting H-21setting mode 5-25standard Instrument Settings H-4standard instrument settings H-3troubleshooting H-21, H-23when to use 1-12
Control buttons 4-3, 4-24Control Mode
description 4-2, 4-6overview 6-2status 4-5
Control pagesdisplaying 4-8docked 4-9floating 4-9Instrument Settings 5-9, 5-15layout, changing 4-8layout, default 4-8Manual Laser/Sample
Positioning 4-27overview 4-4PSD Acquisition settings,
automatic mode 8-59PSD Acquisition settings, manual
mode 8-44System Status 2-76
Control stickconnecting, Voyager-DE and
Voyager-DE PRO 2-22connecting, Voyager-DE STR 2-25diagram I-7moving position on sample spot I-7starting acquisition I-7stopping acquisition I-7
Voyager™ Biospectrometry™ Workstation User’s Guide Index-9
I
DEX
N
Index
Converting version 4 methods (.MNU)and search pattern (.SP) files
before converting 5-95Data Processing parameters not
supported 5-95external calibration set to
default 5-95HV Tune Ratio replaced by new
parameter 5-95information that is converted 5-93manual control mode set 5-95new parameter 5-95overview 5-92path for SP not retained 5-95procedure 5-96
Coordinates, determining x,y for PLTfile positions 3-83
Counts, absolute, see Absolute countsCreate PLT File
parameters 3-81using 3-79
Crystallization3-HPA 3-46alpha-cyano 3-45desired pattern 3-45DHB 3-46DHBs 3-46examining 3-45guidelines for 3-37sinapinic acid
3-45THAP 3-46troubleshooting 9-9uneven, recommended search
pattern for 6-49Current Spectrum trace
definition 4-14during acquisition 6-16evaluating 6-17
CursorInstrument Control Panel, enabling
4-21oscilloscope, moving I-5
CustomizingInstrument Control Panel 4-21toolbars 4-21
Cytochrome cmass to time conversion F-5molecular weight F-3
DDamage, reporting B-5DAT format
extracting information from 1-44opening BIC from 5-7overview 1-44
Dataacceptable spectra in Continuous
Extraction mode H-8acceptable spectra in Delayed
Extraction mode 6-21Data Explorer .SET file, see SET file,
Sequence Control PanelData Explorer software
accessing from Instrument ControlPanel 4-7
overview 1-45Data file
directory, setting 6-14including position number in
name 7-16, 7-46multiple spectra, recommended
maximum 5-35multiple spectra, saving 5-35naming 6-14opening BIC from 5-7PSD, contains multiple
spectra 8-27
Index-10 Applied Biosystems

Index
I
DEX
N
Data file (continued)PSD, not available for viewing until
experiment closed 8-52saving 6-18saving automatically 6-40saving multiple spectra in 5-39Sequence Control Panel 7-16size, parameter affecting 5-58
Data pointsdecreasing number collected 5-59determining number in peak 4-22impact on laser firing rate 5-27increasing number collected 5-59,
5-88number digitized 5-29
Data Storageinformation displayed in Output
window duringacquisition 6-18
maximum number of linesdisplayed in Outputwindow 4-6
parameters 6-14setting 6-14status 2-78
Daughter ion, see PSD precursorspectrum
DE technology, see Delayed ExtractionDecrement Ratio, PSD
correlation with PSD MirrorRatio 8-41
default settings 8-41setting 8-50setting and segment size in
PSD 8-41Default calibration
description 6-7equation 6-9PSD 8-28selecting 5-10
Default layout, Instrument ControlPanel 4-8
DEFAULT.SP 6-48Deflector Gate Width
impact on systemperformance 2-40
setting 2-40Deflector Gate Width, setting 8-30Deisotoping before calibration to
ensure monoisotopic peak isidentified 7-10
Delay Timeaffected by matrix 5-55, 5-74and Grid Voltage% 5-55, 5-73, E-1description 5-18, 5-54effect on resolution 5-49impact on fragmentation 5-49impact on sensitivity 5-49isotope resolution 5-81minimum increments needed 5-54,
5-77, 5-80optimizing 5-77settings for mass ranges 5-79
Delayed Extractionacceptable spectra 6-21advantages 1-14comparison to Continuous
Extraction 1-13Delay Time setting 5-79, E-1description 1-12determining if hardware
installed 2-41Grid Voltage% and Delay Time,
relationship between 5-55,5-73
Grid Voltage% setting E-1Guide Wire Voltage% 5-84Instrument Settings
parameters 5-73isotope resolution 1-13, 5-75laser intensity 6-24
Voyager™ Biospectrometry™ Workstation User’s Guide Index-11

I
DEX
N
Index
Delayed Extraction (continued)mass accuracy
troubleshooting 9-11, 9-12optimizing parameters 5-73overview 1-11parameters with primary
impact 5-73, 6-25resolution 6-32resolution, acceptable 5-75resolution compared to continuous
mode 1-13resolution troubleshooting 9-10setting mode 5-25troubleshooting 9-10, 9-11, 9-12
Deleting text annotation 4-17des-Arg Bradykinin, molecular
weight F-2Detector
high current 1-23, 1-35linear 1-23, 1-35reflector 1-36
DHBchemical structure and molecular
weight C-7, C-8concentration 3-16, 3-17, 3-19crystals 3-16, 3-17, 3-19, 3-46initial velocity setting 5-22laser intensity, relative 5-67mass spectrum C-3preparing for neutral
carbohydrates 3-16preparing for polymers 3-19preparing for small molecules 3-17sample concentration 3-16, 3-17,
3-19stability 3-16when to use 3-3
DHBschemical structure and molecular
weight C-9concentration 3-18crystals 3-18, 3-46
DHBs (continued)mass spectrum C-3preparing 3-18sample concentration 3-18stability 3-18when to use 3-3
Dialysis, sample cleanup 3-27Digitizer
see also Oscilloscopeconfiguring 2-44description 1-19, 1-32options, connecting to
computer 2-11Signatec, connecting 2-13Single shot mode 2-45specifications A-11type, determining 2-44
Digitizer, Acqirisconnecting to Voyager-DE and
Voyager-DE PRO 2-17connecting to Voyager-DE
STR 2-26optimized laser rate
supported 5-26, A-12Digitizer, LeCroy LSA 1000
connecting 2-15optimized laser rate
supported 5-26, A-12Digitizer settings
adjusting 5-57Bin size 5-29description 5-57impact on resolution and
signal-to-noise 5-50Input Bandwidth 5-30Number of Data Points
Digitized 5-29Vertical Offset 5-30Vertical Scale 5-30
Digitizer, Signatecconnecting 2-13optimized laser rate
supported 5-26, A-12
Index-12 Applied Biosystems

Index
I
DEX
N
Digitizer, Tektronix oscilloscopeconnecting to Voyager-DE and
Voyager-DE PRO 2-19connecting to Voyager-DE
STR 2-26optimized laser rate
supported 5-26, A-12Dihydroxybenzoic acid mixture, see
DHBsDihydroxybenzoic acid, see DHBDimensions
Voyager-DE STR 2-7Voyager-DE and
Voyager-DE PRO 2-2, A-3,A-6
Voyager-DE STR A-10Dimers
caused by 6-21, H-8troubleshooting 9-15
Directory for data fileInstrument Control Panel 6-14Sequence Control Panel 7-14
Disk spacecheck in Automatic Control
mode 6-58check in Sequence Control 7-25clearing 9-6required to run software 2-29, 9-6swap file 9-6
Display rangescaling 4-11x range, expanding 4-10y range, expanding 4-10
Disposable plate, see Sample plate,types of
Dithranolchemical structure and molecular
weight C-11concentration 3-19crystals 3-19
Dithranol (continued)mass spectrum C-5preparing 3-19sample concentration 3-19when to use 3-3
Docked control pages 4-9Dried droplet sample application, see
Sample loadingDrift time
and molecular weight 1-8, 1-10equation for multiply charged
ions 1-10equation for singly-charged
ions 1-10fragments 8-71
Drying sample platesconsequence of loading wet
plate 3-43, 3-50time needed 3-43
Dynamic range, adjusting 5-60
EEdge Bias search pattern 5-37Ejecting sample plates, Instrument
Control Panel 4-25Electromagnetic compliance xxivEMC standards xxivEMIS button on vacuum gauge
panel 9-26Energy
kinetic 1-10, 1-24, 1-36, 8-21minimizing spread of 1-11, 1-24,
1-36, 5-54spread of ions, reducing 1-11, 5-18,
5-54, 5-56Enolase, molecular weight F-3Environmental conditions A-4, A-7,
A-10
Voyager™ Biospectrometry™ Workstation User’s Guide Index-13

I
DEX
N
Index
Equationscalibration 6-9default theoretical calibration 6-9drift time for multiply charged
ions 1-10drift time for singly-charged
ions 1-10PSD calibration 8-28
Error codes, vacuum gauge panel 9-27Evaluating data
see also Data Explorer SoftwareUser’s Guide
automatically 6-42manually 6-17spectrum acceptance criteria 6-42
Event log, see NT Event logExiting software 2-34Expanding traces 4-13Experiment, PSD
starting 8-52, 8-54, 8-64stopping 8-56, 8-64
Exporting Sequence run list 7-22External laser, see Laser, external
(optional)Extraction Correction 2-53Extraction Type, description 5-25
FFactor (IGF-1), mass to time
conversion F-5Fast fragments, see Prompt fragmentsFeatures
Voyager-DE system 1-4Voyager-DE PRO system 1-4Voyager-DE STR system 1-6
File namein Instrument Control Panel 4-4,
6-14in Sequence Control Panel 7-16including position number in 7-16,
7-46
File sizeand Bin size setting 5-59impact on resolution and
signal-to-noise 5-50Fill Down, Sequence Control
Panel 7-21Filtering peaks, monoisotopic 7-3,
7-12, 7-17Firing rate, laser 5-26Flight Length to Detector
impact on systemperformance 2-40
setting 2-40Flight tube
description 1-23, 1-35height, Voyager-DE and
Voyager-DE PRO 2-2, A-3,A-6
length, Voyager-DE 1-4length, Voyager-DE PRO 1-4length, Voyager-DE STR 1-6
Floating control pages 4-9Focusing, velocity, see Velocity
focusingFonts, changing Instrument Control
Panel 4-21Fore pump, Voyager-DE
function 1-27vacuum gauge 1-27
Fore pump, Voyager-DE PROfunction 1-29vacuum gauge 1-29
Fore pump, Voyager-DE STRfunction 1-37vacuum gauge 1-39
Foreline valve location 1-26, 1-28, 1-38Fragment ions
see also PSD fragments; PSDsegments; Promptfragments
and Grid Voltage% 8-73
Index-14 Applied Biosystems

Index
I
DEX
N
Fragment ions (continued)and laser intensity 8-68and Precursor Ion Selector 8-69calibration 8-28fast, see Prompt fragmentsinvestigating identity 8-19kinetic energy 8-22optimum resolution observed near
Max Stitch Mass 8-23, 8-42poor yield 8-29prompt 6-24, 8-70, 8-71PSD 6-24, 8-21, 8-70, 8-71PSD, kinetic energy 8-21
Fragmentationand Delay Time 5-49and Grid Voltage% 5-50, 5-53and laser intensity 5-50causing with higher laser
intensity 6-24enhancing with CID 8-31fragment types 6-24
Front panel description 1-39, 9-25Fuse, Voyager-DE and
Voyager-DE PROchanging 2-4, 9-4rating 2-4, 2-6, 9-6
FWHM 6-30
GGas, CID 8-33Gauge, vacuum
see BA1 and BA2see IG1 and IG2see TC2see Vacuum gauge
Gels, sample plate to use 3-63Glu1-Fibrinopeptide B, molecular
weight F-2Glycolipids, matrix for C-7Glycopeptides, matrix for 3-3
GPC MALDI, sample plate type 3-62Graphic options
accessing 4-22customizing the display with 4-21setting trace colors with 4-18turning off right axis 4-11
Grid, displaying in Spectrumwindow 4-21
Grid Voltage%see also Grid Voltage% effectsadjusting 5-55, 5-73affected by matrix 5-74and Delay Time 5-55, 5-73, E-1description 5-17, 5-51for higher masses 5-74impact of changing 5-53, 5-55in Continuous Extraction
mode H-6, H-11in Delayed Extraction mode 5-74in Linear and Reflector
modes 5-74, 5-82in PSD mode 8-73, 8-76optimizing 5-82optimizing setting 5-83PSD mode 5-51range 5-17
Grid Voltage%, effects onfragment ions in PSD mode 8-73fragmentation 5-50, 5-53ion acceleration 5-51resolution 5-50, 5-51, 6-25resolution and signal-to-noise in
PSD mode 8-76resolution in PSD mode 8-74
Grids in ion source 1-22, 1-34, 5-52Guide wire, see Beam guide wireGuide Wire Voltage%
see also Guide Wire Voltage%effects
adjusting for CID 8-36description 5-18, 5-56effect of changing 5-56
Voyager™ Biospectrometry™ Workstation User’s Guide Index-15

I
DEX
N
Index
Guide Wire Voltage% (continued)effect on signal-to-noise ratio 6-25in Continuous Extraction
mode H-6, H-11in Delayed Extraction mode 5-84in PSD mode 8-48, 8-76not available on STR models with
serial number 4154 andlater 5-18
optimizing resolution 5-76optimizing signal-to-noise
ratio 5-88range 5-18
Guide Wire Voltage%, effects onresolution 5-50, 5-56, 5-57, 6-25sensitivity 5-50, 5-56, 5-84, 5-88signal-to-noise ratio 5-88
Guidelines for acquiring 6-4
HHABA 3-4
chemical structure and molecularweight C-10
mass spectrum C-4Hard disk drive
backing up 9-6maintenance 9-6size 1-30, 1-41space required 2-29
Hardwareconfiguring 2-35initialized when computer is shut
down 2-75initialized when software
starts 2-74not initialized when you log on as
new user 2-75reinitializing 2-74
Help, see PerSeptive BiosystemsTechnical Support
High current detector, starting serialnumber 1-23, 1-35, 5-91
High mass ionsacceptable resolution 6-32, H-17cannot see in Reflector mode 9-17Delay Time recommendation 5-55fragmenting in alpha-cyano 9-17Grid Voltage%
recommendation 5-74Guide Wire Voltage%
recommendation 5-56Input Bandwidth setting 5-30laser intensity required in
Continuous Extractionmode H-11
moving on sample position 6-5using Low Mass Gate 5-90
High organic sample concentration,sample plate to use 3-62
High voltage, Instrument Control Panelautomatically turned off 4-25configuring 2-38idle time 2-39On/Off state displayed in status
bar 4-5polarity switch delay 2-38standby mode time 2-39, 6-4, 7-24status 2-77turning high voltage on/off 4-25warmup before calibration 2-56,
6-4, 7-24Horizontal position, oscilloscope I-5Horizontal scale, oscilloscope I-5Hot spots in signal intensity 6-5How to use this guide xxviiHPA, see 3-HPAHPLC-grade water, use of 3-5, 3-13,
3-15Humidity, operating A-4, A-7, A-10HV Tune Ratio replaced by new
parameter 5-95Hydroxypicolinic acid, see 3-HPA
Index-16 Applied Biosystems
Index
I
DEX
N
IIAAchemical structure and molecularweight C-12
concentration 3-19crystals 3-19mass spectrum C-6preparing 3-19sample concentration 3-19when to use 3-3
Idle Power 2-39IgG BIC file 5-4Immonium ions
common 8-23in PSD mode 8-25
Importing into Sequence run list 7-22Indoleacrylic acid, see IAAInitial Velocity
correction factors for eachmatrix 5-20
definition 5-22overcoming effects of 1-15selecting for matrix in Instrument
Settings 6-13values for matrices 5-22
Initializing hardware 2-74Input Bandwidth, digitizer
impact of changing 5-63impact on resolution and
signal-to-noise 5-50PSD 8-48setting 5-30suggested settings 5-63
Installationcables 2-12computer, Voyager-DE and
Voyager-DE PRO 2-10,2-16, 2-20
computer, with Signatec 500 MHzdigitizer 2-11
Installation (continued)computer, with Tektronix
oscilloscope 2-11digitizer, Acqiris, Voyager-DE and
Voyager-DE PRO 2-17digitizer, Acqiris, Voyager-DE
STR 2-26digitizer, Lecroy LSA 2-15digitizer, Signatec 2-13initial 2-2mass spectrometer, Voyager-DE
and Voyager-DE PRO 2-12mass spectrometer, Voyager-DE
STR 2-23oscilloscope, Voyager-DE and
Voyager-DE PRO 2-19oscilloscope,
Voyager-DE STR 2-26,2-28
video monitor, Voyager-DE andVoyager-DE PRO 2-21
video monitor, Voyager-DESTR 2-27
Instrumentconfiguration 2-40name, specifying 2-41serial number, displaying 2-41status, displaying 2-76type, displaying 2-41
Instrument Control Panelbasics 4-1BIC loaded at end of Sequence
run 7-28control buttons 4-24cursor and grid, displaying 4-21customizing 4-21Data Explorer, accessing from 4-7high voltage, turning on/off 4-25interaction with Sequence Control
Panel 1-44, 4-33layout, changing 4-8layout, default 4-8loading sample plates 3-54
Voyager™ Biospectrometry™ Workstation User’s Guide Index-17

I
DEX
N
Index
Instrument Control Panel (continued)Output window 4-5overview 1-43, 4-2parts of 4-2peak detection 6-28pressures, displaying 2-76Sequence Control Panel,
accessing from 4-7software, exiting 2-75software, starting 2-74status bar 4-5toolbar 4-3, 4-24traces do not print 4-19traces, previewing 4-18traces, printing 4-18troubleshooting 9-19zooming 4-13
Instrument modedetermining 5-16displayed in status bar 4-5setting 5-25
Instrument Settings files (BIC)see also BIC filessee also Instrument Settings
parametersAutomatic Control mode,
setting 5-10, 6-37cannot save 5-11definition 5-2exporting from DAT file 6-19Linear mode 5-4loading 5-7location 5-3Manual Control mode, setting 5-9name displayed 5-8opening 5-7opening from DAT file 5-7preventing changes 5-13protecting 5-13provided with system 2-30, 5-3PSD mode 5-6, 8-43, 8-58read-only 5-3, 5-13Reflector mode 5-5
Instrument Settings files (BIC)(continued)
requirements for Sequencerun 7-8, 7-27
saving 5-11saving after acquisition to store
laser intensity 6-19selecting standard 5-8setting to read-only 5-13
Instrument Settings parameterssee also Automatic Control mode
parameterssee also Instrument Settings files
(BIC)see also Instrument Settings
parameters, optimizingsee also Mode/Digitizer parameterssee also Spectrum Acceptance
CriteriaAccelerating Voltage 5-17, 5-50Automatic Control mode 5-33, 6-37Calibration 5-20Continuous Extraction
parameters H-2Control mode 5-16Delay Time 5-18, 5-49, 5-54, E-1Delayed Extraction
parameters 5-73Digitizer settings 5-57displaying 5-9, 6-12Grid Voltage%, Continuous
Extraction H-6Grid Voltage%, Delayed
Extraction 5-17, 5-50, 5-51,E-1
Guide Wire Voltage%, ContinuousExtraction H-6
Guide Wire Voltage%, DelayedExtraction 5-18, 5-50, 5-56
impact of changing, Linear andReflector mode 5-49
impact of changing, PSDmode 8-76
Index-18 Applied Biosystems

Index
I
DEX
N
Instrument Settings parameters(continued)
Instrument mode 5-16Low Mass Gate 5-20Manual Control mode 5-9, 5-15mass range 5-19Matrix 5-20matrix and Initial Velocity 6-13optimizing for Sequence run 7-7parameters that affect Delayed
Extraction 5-73printing 5-12PSD mode 8-43, 8-58resolution 6-25Shots/Spectrum 5-19, 5-50signal-to-noise ratio 6-25Start and End Mass 5-19summary, Linear and Reflector
mode 5-49summary, PSD mode 8-76viewing all 5-8
Instrument Settings parameters,optimizing
see also Instrument Settingsparameters
Accelerating Voltage 5-84, 5-87before you begin 5-64Continuous Extraction H-2, H-5Delay Time 5-77Delayed Extraction
parameters 5-73for Sequence run 7-7Grid Voltage% 5-82, 5-83Guide Wire Voltage% 5-84, 5-88laser setting 5-67Low Mass Gate 5-89overview 5-65PSD mode 8-43, 8-58resolution 5-71Shots/Spectrum 5-89signal-to-noise ratio 5-85strategy 5-65
Instrument State in status bar 4-5
InsulinBIC file 5-4, 5-5mass to time conversion F-5molecular weight F-3
Insulin B, oxidizedmass to time conversion F-5molecular weight F-3
Integration, peak 6-29Intensity, laser, see Laser intensityIntensity, signal
see also Sensitivity 5-67see also Signal intensitydefinition 1-9finding hot spots 6-5peaks near maximum H-16, I-3
Interlock errordescription 1-40with CID 8-34
Internal jumper settings 2-7Internal standard
calibration 6-7, 6-26concentration 3-24if concentration varies 7-42mass range 3-24
Internal-Update calibration, seeCalibration, internal-update,Sequence Control Panel
Ion accelerationdescription 5-51impact of Accelerating Voltage 5-87impact of Grid Voltage% 5-51in Continuous Extraction
mode 1-12in Delayed Extraction mode 1-12in MALDI-TOF 1-8
Ion focusing lensfixed voltage applied 1-35function 1-35starting serial number 1-33
Ion Fragmentation calculator 8-19Ion, kinetic energy 1-10, 8-21
Voyager™ Biospectrometry™ Workstation User’s Guide Index-19

I
DEX
N
Index
Ion polarity, see PolarityIon source
description, Voyager-DE andVoyager-DE PRO 1-22
description, Voyager-DE STR 1-34second stage, voltage for 5-17warmup 2-56, 6-4, 7-24
Ionization, sampleby Na or K instead of H 9-17Delayed Extraction 1-12enhancing 3-23multiple charges on ion 1-10single charge on ion 1-10
Ionsmultiple charge 1-10single charge 1-10
Isotope resolutionDelay Time, setting 5-81guidelines for acceptable 5-75in Delayed Extraction mode 1-13labels not displayed for all
peaks 6-31
JJumper settings 2-7
KK adduct ion
effect on masses 9-17from buffer 3-24
Keyboardconnecting, Voyager-DE and
Voyager-DE PRO 2-22connecting, Voyager-DE STR 2-25
Kinetic energyfragment ions 8-21, 8-22molecular ions 1-10, 8-21
LLabeling peaks, see Peak labelsLaboratory Name, specifying 2-41Landscape printer orientation
setting permanently 4-20Large proteins, matrix for 3-3Laser
cannot run .BICs that specifyinternal and external laserin same sequence 7-8,7-16, 7-27
configuring 2-42custom plates, adjusting position
for 3-85description 1-22, 1-34external, see Laser, external
(optional)nitrogen 1-22, 1-34not aligned with sample
position 2-48, 9-23not responding to slider
controls 9-20pulse width 1-22, 1-34rate, see Laser ratesafety information xxvisingle shot mode 2-45stopping I-7threshold, see Laser thresholdtroubleshooting 9-20turning on and off 4-25type, setting 5-26UV radiation warning xxi, 9-3wavelength, pulse width, and
frequency 1-22, 1-34Laser adjustment buttons
description 4-28increments, setting 2-43
Laser attenuatoradjusting 2-43description 1-22, 1-34
Index-20 Applied Biosystems

Index
I
DEX
N
Laser, external (optional)cannot run .BICs that specify
internal and external laserin same sequence 7-8,7-16, 7-27
determining if installed 2-43indicated on Manual Laser/Sample
Position control page 5-26resetting 2-71specifying in .BIC 5-26troubleshooting 2-72, 9-28
Laser intensitysee also Laser intensity, Automatic
Control mode parametersadjusting manually 4-28adjustment criteria, automatic
mode 6-42displayed in Manual Laser/Sample
Position control page 4-27displayed in status bar 4-5external laser, range 5-26fine/coarse control 4-28guidelines for adjusting 5-67impact on data 6-6impact on resolution and
signal-to-noise 5-50in Continuous Extraction
mode H-6, H-11, H-12,H-18
in Delayed Extraction mode 6-24in PSD mode 8-66, 8-76no adjustment criteria
specified 6-39optimizing 5-67optimizing in Prescan mode 6-58relative settings for matrices 5-67saturating signal 5-69setting automatically 6-39setting, displayed 4-27setting manually 6-14signal intensity adjustment
criteria 6-43
Laser intensity (continued)signal-to-noise adjustment
criteria 6-43, 6-44stopping acquisition before
adjusting 6-5stored in .BIC 6-4, 6-19strategy if using .BIC 5-68strategy if using default 5-68
Laser Intensity Adjustment Criteriahow criteria are used during
acquisition in Automaticmode 6-58
parameters, accessing 5-36parameters, setting 6-43
Laser intensity, Automatic Controlmode parameters
adjustment criteria 6-42minimum and maximum 5-34Prescan mode 5-34step size 5-34
Laser position in Sample view 4-31Laser rate
default 5-26optimized 1-22, 1-34, 5-26optimized, affected by number of
data points A-12setting 5-26specifications A-12
Laser thresholddefinition H-11, H-12factors affecting H-12in Continuous Extraction
mode H-11, H-12troubleshooting H-19verifying in Continuous Extraction
mode H-16LeCroy digitizer, see DigitizerLeucine Enkephalin
mass to time conversion F-4molecular weight F-2
Line type 4-22
Voyager™ Biospectrometry™ Workstation User’s Guide Index-21

I
DEX
N
Index
Linear detectordescription 1-23, 1-35high current, starting serial
number 1-23, 1-35, 5-91Linear mode
BIC files 5-4path length, Voyager-DE PRO 1-4path length, Voyager-DE STR 1-6sensitivity 5-25setting 5-25when to use H-20
Linking traces 4-13Live Spectrum trace
definition 4-14during acquisition 6-16not displayed on oscilloscope
systems 6-16Load No Plate 3-57, 3-59Load/Eject dimmed 9-19Loading
sample plate in massspectrometer 3-50
sample plates, Instrument ControlPanel 4-25
samples on plates 3-35Log file, Sequence Control Panel 7-14Log sheet
maintenance G-1sample loading D-1
Logging on to Windows NTUsername and password 2-74without initializing hardware 2-75
Low Mass Gatedescription 5-20, 5-89function 5-89impact on calibration 5-89improving signal-to-noise ratio 5-89PSD mode, disabled in 8-43spike in Spectrum window 5-91starting mass
recommendations 5-90when to use 5-20, 5-89, 5-90
Low Mass Gate spikedescription 5-91eliminating 5-91
Low mass ionsacceptable resolution 6-32, H-17cannot see in PSD mode 9-21improving peak definition 5-88
LSA1000 LeCroy digitizer, see Digitizer
Mm/z 1-7Macros
example for multispectrum datafile 7-11
Macros, Sequence Control Panelcreating 7-8description 7-3selecting 7-17, 7-20
Maintenancearchiving 9-6computer 9-6hard disk 9-6log sheet G-1mass spectrometer hardware 9-3preventative 9-2schedule 9-2
MALDI-TOFadvantages 1-10definition 1-7description 1-8limitation of traditional 1-11
Manual Control modesee also Acquiring dataaccumulating spectra 6-19acquisition, PSD starting 8-38acquisition, starting 4-25, 6-16acquisition, stopping 4-25, 6-16data, saving 6-18Data Storage, setting 6-14evaluating data 6-17
Index-22 Applied Biosystems

Index
I
DEX
N
Manual Control mode (continued)instrument settings, selecting 6-11laser intensity, adjusting 4-28overview 4-6, 6-2, 6-11process that occurs during
acquisition 6-16sample position, selecting 6-13saving .BIC after acquisition to
store laser intensity 6-19Manual Laser/Sample Positioning
control pagedisplaying 4-27laser position 4-31location 4-27parameters 4-27shape of positions 3-69, 3-82using 4-27
Mass accuracyand location of standard 3-38, H-24calibration 6-7, 6-10effect of charges on 9-17effect of Na and K on 9-17factors affecting 6-26improving 1-14, 2-56, 3-38, 6-4,
6-5, 7-24, H-23, H-24improving by deisotoping before
calibration 7-10internal calibration 6-26maximizing 6-26obtaining maximum 6-6, 6-26troubleshooting 3-38, 9-11, 9-12,
9-17, H-23, H-24Mass accuracy optimization
see also OptiPlate softwarebenefits 3-52enabling 3-57, 3-60how it is applied 3-52if no optimization found 3-53if positions not optimized 3-53number and location of
standards 3-39using a different PLT file 3-53
Mass accuracy optimization(continued)
using an optimized plate 3-39using an unoptimized plate 3-40,
3-53Mass assignment precision 6-26Mass range
acquisition 5-19displaying full range on
oscilloscope I-3does not update with every laser
shot 6-16, 9-21in Instrument Settings 5-19PSD composite spectrum 8-25PSD segments 8-54, 8-64Voyager-DE 1-4Voyager-DE PRO 1-4Voyager-DE STR 1-6
Mass resolution, see Resolution, massMass spectrometer
maintenance 9-3parts of, Voyager-DE 1-20, 1-22parts of, Voyager-DE PRO 1-21,
1-22parts of, Voyager-DE STR 1-33rear panel, Voyager-DE STR 2-23side panel, Voyager-DE and
Voyager-DE PRO 2-9troubleshooting 9-23
Mass spectrometry, overview 1-7Mass standards kit B-6Mass to time conversion F-4Mass-to-charge ratio 1-7Matrix
3-HPA 3-3, 3-15, C-10see also Matrix, Initial Velocityalpha-cyano-4-hydroxycinnamic
acid 3-3, 3-9, 3-11, C-7and HPLC-grade water 3-5, 3-13,
3-15applications C-1
Voyager™ Biospectrometry™ Workstation User’s Guide Index-23
I
DEX
N
Index
Matrix (continued)chemical structures C-1crystallization, examples 3-45crystallization, troubleshooting 9-9DHB 3-3, 3-16, 3-17, 3-19, C-7, C-8DHBs 3-3, 3-18, C-9dithranol 3-3, 3-19, C-11HABA C-10IAA 3-3, 3-19, C-12nicotinic acid C-12ordering information B-6picolinic acid C-12premixing with sample, dried
droplet application 3-33preparing 3-4proteins 3-3reference file, modifying 5-23reference information C-1relative laser intensities 5-67role of 1-8salt contamination 3-5, 3-13, 3-15selecting 3-3, C-1selecting type in calibration 5-20sinapinic acid 3-3, 3-7, C-6solutions C-6stability 3-4storage conditions 3-4THAP 3-3, 3-13, C-11thin film 6-5
Matrix, example spectra3-HPA C-4alpha-cyano-4-hydroxycinnamic
acid C-2DHB C-3DHBs C-3dithranol C-5HABA C-4IAA C-6Sinapinic acid C-2THAP C-5
Matrix, Initial Velocitycorrecting for 5-20impact on tuning Grid Voltage%
and Delay Time 5-74in Instrument Settings 5-22selecting 6-13
Max Stitch Massdefinition 8-42, 8-48optimum focus and resolution
observed near thismass 8-49
Melittin, mass to time conversion F-4Membranes, sample plate to use 3-63Memory, computer 1-30, 1-41Methionine Enkephalin, mass to time
conversion F-4Methods
converting version 4 to version5 5-92
replaced by instrument settings 5-2Microsoft Windows NT version 1-30,
1-41Mirror
see also PSD Mirror Ratiosee also ReflectorVoltage, adjusting 8-22
Mirror Ratio, see PSD Mirror RatioMirror To Accelerating Voltage Ratio
default values for converted MNUfiles 5-95
Mirror to Accelerating Voltage Ratiosetting 5-32
MNU filesconverting version 4 to version
5 5-92replaced by .BIC files 5-2
Index-24 Applied Biosystems

Index
I
DEX
N
Mode/Digitizer parametersaccessing 5-16, 5-24Advanced 5-31Bin size 5-29, 5-50, 5-59Digitizer, Linear/Reflector 5-28Extraction Type 5-25Input Bandwidth 5-30, 5-50, 5-63Instrument Mode 5-25Laser Rate 5-26, 5-27Laser Type 5-26Linear, Reflector, PSD mode 5-25Mirror to Accelerating Voltage
Ratio 5-32Number of Data Points
Digitized 5-29Polarity 5-25Timed Ion Selector 5-32Vertical Offset 5-30, 5-62Vertical Scale 5-30, 5-60
Molecular ions, kinetic energy 1-10,8-21
Molecular weightsconversion to time for
standards F-4estimating H-18matrices C-7relationship to drift time 1-8, 1-10standard compound F-2
Monitor, see Video monitorMonoisotopic peak
creating macro to deisotope 7-10setting filtering in .SET file 7-3,
7-12, 7-17Mouse
connecting, Voyager-DE andVoyager-DE PRO 2-22
connecting, Voyager-DE STR 2-25Multiple spectra
calibrating in one data file 7-4recommended maximum in one
data file 5-35saving in one data file 5-35, 5-39
Multiply charged ions 1-10Myoglobin
BIC file 5-4mass to time conversion F-5molecular weight F-3
NNa adduct ion
effect on masses 9-17from buffer 3-24
Nameinstrument, specifying 2-41laboratory, specifying 2-41
Nd YAG laser, matrices C-12Negative ion mode
BIC file 5-4, 5-5selection not in BIC file 9-20setting 5-25Switch Delay Time 2-38
Neurotensin, molecular weight F-2Nicotinic acid C-12Nitrocellulose in matrix 3-11Noise, reducing higher frequency 5-30Nonpolar synthetic polymers, matrix
for C-11Not Used traces 4-14NT Event log
checking 9-22location 9-22
Number of Data Points Digitized,digitizer
description 5-29Number of Data Points, digitizer
impact on laser firing rate 5-27
Voyager™ Biospectrometry™ Workstation User’s Guide Index-25

I
DEX
N
Index
OOffsetting digitizer signal 5-30Oligonucleotides, matrix for 3-3, C-11Online user guides, accessing 2-31Operating temperature and
humidity A-4, A-7, A-10Operation mode, see Instrument modeOptimized laser rate 1-22, 1-34
affected by number of datapoints A-12
not available on all systems 5-26selecting 5-26
Optimized sample plates, see Optiplatesoftware; Mass accuracyoptimization
Optimizing Instrument Settingsparameters, see InstrumentSettings parameters,optimizing
OptiPlate softwareacceptance criteria required 2-60benefits 2-54BIC files provided 2-60color codes 2-69data files, deleting when run
complete 2-70display settings required for best
color results display 2-63during a run 2-67high-voltage warmup required 2-56how mass accuracy optimization is
applied 3-52if no optimization found 3-53if positions not optimized 3-53laser intensity, determining setting
needed for minimum signalintensity 2-61
matrix required 2-55number of positions to spot 2-59overview 2-53
OptiPlate software (continued)pausing and resuming a run 2-68PLT file requirements 2-57reference position location 2-59results, color codes 2-69results, evaluating 2-70results, saving 2-70running 2-63sample plate, preparing 2-59standards required 2-55system, preparing 2-60using unoptimized PLT 3-53
OptiPlate_Linear.BIC 2-60OptiPlate_Reflector.BIC 2-60Oscilloscope
activating cursors I-5adjusting display I-6Ch1 and Ch2 markers I-6connecting, Voyager-DE and
Voyager-DE PRO 2-19connecting, Voyager-DE STR 2-28description 1-19, 1-32displaying full range of data I-3front panel I-1grid line increments 5-69guidelines for acquiring I-3initialization 2-73intensity versus time spectrum I-5Live trace not displayed in
Spectrum window 6-16mass to time conversion for
standards F-4Output window
Automatic Control tab 4-5, 6-45closing 4-6Data Storage tab 6-18maximum number of lines
displayed 4-6
Index-26 Applied Biosystems
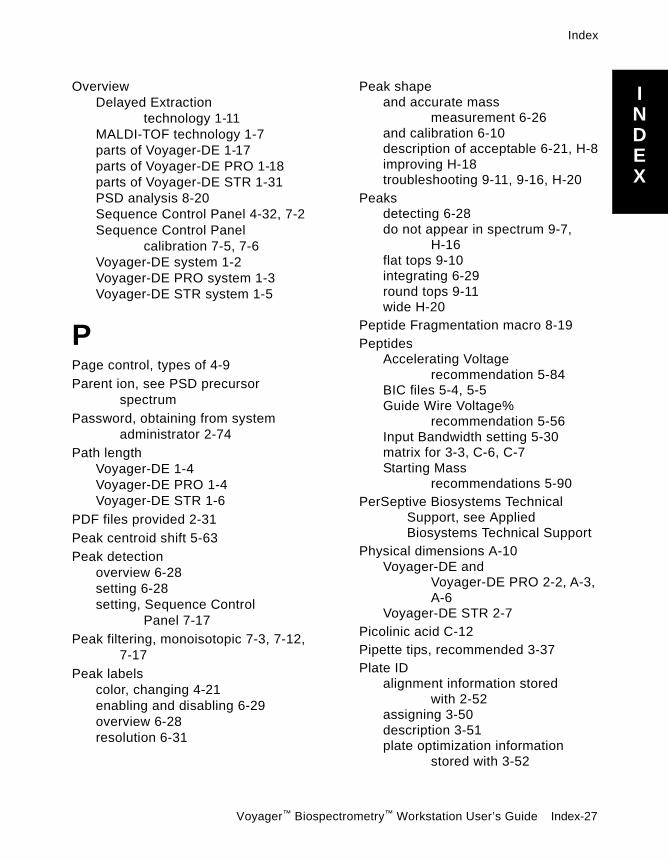
Index
I
DEX
N
OverviewDelayed Extraction
technology 1-11MALDI-TOF technology 1-7parts of Voyager-DE 1-17parts of Voyager-DE PRO 1-18parts of Voyager-DE STR 1-31PSD analysis 8-20Sequence Control Panel 4-32, 7-2Sequence Control Panel
calibration 7-5, 7-6Voyager-DE system 1-2Voyager-DE PRO system 1-3Voyager-DE STR system 1-5
PPage control, types of 4-9Parent ion, see PSD precursor
spectrumPassword, obtaining from system
administrator 2-74Path length
Voyager-DE 1-4Voyager-DE PRO 1-4Voyager-DE STR 1-6
PDF files provided 2-31Peak centroid shift 5-63Peak detection
overview 6-28setting 6-28setting, Sequence Control
Panel 7-17Peak filtering, monoisotopic 7-3, 7-12,
7-17Peak labels
color, changing 4-21enabling and disabling 6-29overview 6-28resolution 6-31
Peak shapeand accurate mass
measurement 6-26and calibration 6-10description of acceptable 6-21, H-8improving H-18troubleshooting 9-11, 9-16, H-20
Peaksdetecting 6-28do not appear in spectrum 9-7,
H-16flat tops 9-10integrating 6-29round tops 9-11wide H-20
Peptide Fragmentation macro 8-19Peptides
Accelerating Voltagerecommendation 5-84
BIC files 5-4, 5-5Guide Wire Voltage%
recommendation 5-56Input Bandwidth setting 5-30matrix for 3-3, C-6, C-7Starting Mass
recommendations 5-90PerSeptive Biosystems Technical
Support, see AppliedBiosystems Technical Support
Physical dimensions A-10Voyager-DE and
Voyager-DE PRO 2-2, A-3,A-6
Voyager-DE STR 2-7Picolinic acid C-12Pipette tips, recommended 3-37Plate ID
alignment information storedwith 2-52
assigning 3-50description 3-51plate optimization information
stored with 3-52
Voyager™ Biospectrometry™ Workstation User’s Guide Index-27

I
DEX
N
Index
Plate Maker 3-79Plate optimization, see OptiPlate
softwarePlate view, sample position
accessing Sample view 4-31zooming to Sample view 6-13
Plates, see Sample platePLT files
see also PLT files, creating100 well plate.PLT 3-67384 well plate.PLT 3-67400 well plate.PLT 3-6764 well disposable plate.PLT 3-6796x2.PLT 3-67alignment checking 3-73, 3-85contents 3-69corner positions, list of 2-50default units 3-79displaying name of PLT file
loaded 3-78editing 3-83format 3-68laser, adjusting position for
custom 3-85location 3-51name 3-83OptiPlate requirements 2-57position diameter 3-72provided 3-65sample plate, preparing before
creating PLT 3-77search pattern file for 3-73selecting 3-56, 3-59SymBiot plates, creating for 3-84x,y coordinates, determining 3-83
PLT files, creatingediting 3-83new 3-76non-grid positions 3-83using Create PLT File 3-79using Notepad 3-83
Plumbing, CID 8-31
Polaritysetting displayed in status bar 4-5setting Positive or Negative 5-25Switch Delay in configuration 2-38
Polymersmatrix for 3-3methods for sample loading 3-21nonpolar synthetic, matrix for C-10polar synthetic, matrix for C-7,
C-10sample plate to use 3-62
Porcine Trypsin, molecular weight F-2Position number, including in data file
name 7-16, 7-46Positional tolerance, of sample
plates 3-74Positive ion mode
setting 5-25Switch Delay Time 2-38
Post-source decay, see PSDPotassium adduct ion
effect on masses 9-17from buffer 3-24
Potential field gradientdefinition 5-51increasing 5-51maximum allowed 5-53
Power requirementsVoyager-DE and
Voyager-DE PRO 2-3Voyager-DE STR 2-7
Powering upmass spectrometer 2-73system components 2-73
Precursor Ion Selectorconfiguring 2-39, 8-30disabling to troubleshoot 8-29, 8-45effect of 8-69, 8-76enabling 8-45, 8-60function 8-20optimizing 8-29
Index-28 Applied Biosystems

Index
I
DEX
N
Precursor Ion Selector (continued)resolution 8-29, A-5, A-9screening out prompt
fragments 8-69see also Timed Ion Selectorsetting tracks Timed Ion
Selector 8-44width too small 8-29
Precursor massdetermining in Reflector mode 8-38entering in PSD setting 8-45, 8-60precision required 8-45, 8-60
Precursor spectrum, see PSDprecursor spectrum
Preface xxviiPrescan mode
description 6-58enabling 5-34, 6-39
Pressure ranges for vacuumgauges 8-34
time required 2-77Voyager-DE and Voyager-DE
PRO 2-76Voyager-DE and
Voyager-DE PRO 9-26Voyager-DE DTR 2-76Voyager-DE STR 9-26
Pressure, vacuum 2-76Pressures, displaying 2-77, 4-5Preventative maintenance 9-2Previewing traces before printing 4-18Print preview, Instrument Control
Panel 4-18Print Setup 4-20Printer
connecting, Voyager-DE andVoyager-DE PRO 2-22
connecting, Voyager-DE STR 2-25dedicating to landscape
orientation 4-20
Printingchanging colors to black
before 4-18instrument settings 5-12landscape orientation 4-20traces 4-18traces do not print 4-19, 4-22
Product spectrasee PSD modesee PSD segments
Prompt fragmentsacceleration and flight time 8-71description 6-24, 8-71example 8-70mass 8-71
ProteinsInput Bandwidth setting 5-30matrix for 3-3, C-6, C-10Starting Mass
recommendations 5-90PSD acquisition, automatic mode
see also PSD modeexperiment, automatically
closed 8-64fragment ion identity,
determining 8-19instrument settings disabled
during 8-63process that occurs during 8-64segment, selecting 8-63segments appended to .DAT 8-57settings 8-58starting 8-63stopping 8-64
PSD acquisition, manual modesee also PSD acquisition, Quick
Startsee also PSD modeaccumulating spectra 8-55acquiring segments in any
order 8-55experiment, stopping 8-56
Voyager™ Biospectrometry™ Workstation User’s Guide Index-29
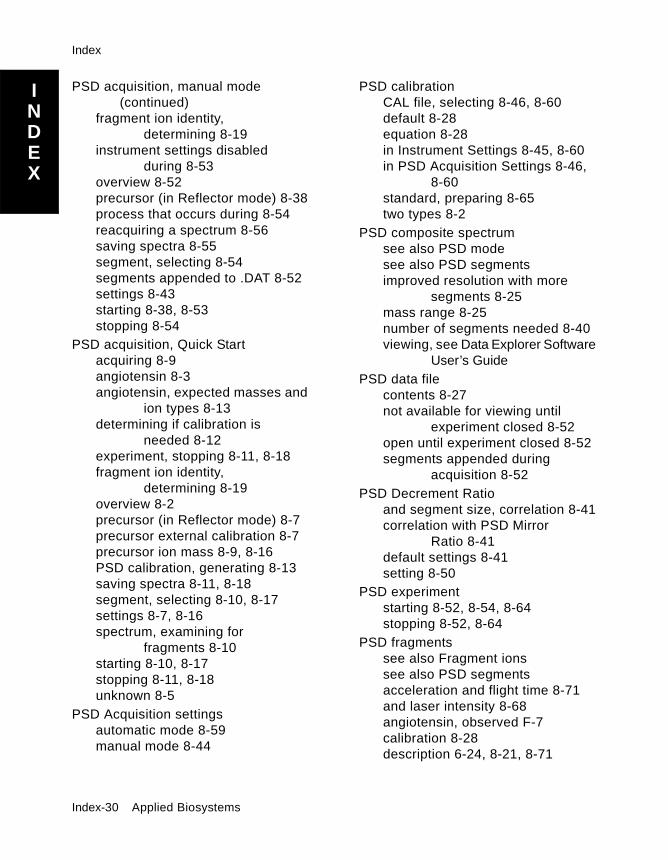
I
DEX
N
Index
PSD acquisition, manual mode(continued)
fragment ion identity,determining 8-19
instrument settings disabledduring 8-53
overview 8-52precursor (in Reflector mode) 8-38process that occurs during 8-54reacquiring a spectrum 8-56saving spectra 8-55segment, selecting 8-54segments appended to .DAT 8-52settings 8-43starting 8-38, 8-53stopping 8-54
PSD acquisition, Quick Startacquiring 8-9angiotensin 8-3angiotensin, expected masses and
ion types 8-13determining if calibration is
needed 8-12experiment, stopping 8-11, 8-18fragment ion identity,
determining 8-19overview 8-2precursor (in Reflector mode) 8-7precursor external calibration 8-7precursor ion mass 8-9, 8-16PSD calibration, generating 8-13saving spectra 8-11, 8-18segment, selecting 8-10, 8-17settings 8-7, 8-16spectrum, examining for
fragments 8-10starting 8-10, 8-17stopping 8-11, 8-18unknown 8-5
PSD Acquisition settingsautomatic mode 8-59manual mode 8-44
PSD calibrationCAL file, selecting 8-46, 8-60default 8-28equation 8-28in Instrument Settings 8-45, 8-60in PSD Acquisition Settings 8-46,
8-60standard, preparing 8-65two types 8-2
PSD composite spectrumsee also PSD modesee also PSD segmentsimproved resolution with more
segments 8-25mass range 8-25number of segments needed 8-40viewing, see Data Explorer Software
User’s GuidePSD data file
contents 8-27not available for viewing until
experiment closed 8-52open until experiment closed 8-52segments appended during
acquisition 8-52PSD Decrement Ratio
and segment size, correlation 8-41correlation with PSD Mirror
Ratio 8-41default settings 8-41setting 8-50
PSD experimentstarting 8-52, 8-54, 8-64stopping 8-52, 8-64
PSD fragmentssee also Fragment ionssee also PSD segmentsacceleration and flight time 8-71and laser intensity 8-68angiotensin, observed F-7calibration 8-28description 6-24, 8-21, 8-71
Index-30 Applied Biosystems

Index
I
DEX
N
PSD fragments (continued)example 8-70focusing 8-21mass 8-71
PSD Mirror Ratioacquiring multiple spectra with
same value 8-49and Guide Wire Voltage% 8-76calculating automatically 8-41,
8-50Decrement ratio 8-41, 8-50default settings 8-41, 8-48focusing ions 8-21function 8-20precision displayed when you click
on entry 8-49PSD mode
see also PSD acquisitionAccelerating Voltage, setting 8-44,
8-59accumulating spectra 8-55autofill list 8-50BIC files 5-6CID option 8-31comparison to Reflector mode 8-24constants 8-28data file not available for viewing
until experimentclosed 8-52
default values 8-48definition 8-20effect of Grid Voltage% 5-51enabling 5-25, 8-43exploring 8-65fill down list 8-50fragment ion yield, poor 8-29fragmentation, enhancing 8-31Grid Voltage%, observing effects
of 8-74Grid Voltage%, setting 8-44, 8-59Guide Wire Voltage%, setting 8-48Guide Wire% Tracks Mirror
Ratio 8-50
PSD mode (continued)guidelines for settings 8-49Input Bandwidth 8-48instrument settings optimized
for H-4ion selectivity, improving 8-29laser intensity, observing effects
of 8-66mass range for segments 8-54,
8-64Max Stitch Mass 8-42, 8-48Mirror Ratio, see PSD Mirror Rationo .DAT file created 8-53, 8-56optimum resolution observed near
Max Stitch Mass 8-49overview 8-20parameters 8-20, 8-43, 8-58practicing 8-37, 8-65Precursor Ion Selector, see
Precursor Ion Selectorprecursor, see PSD precursor
spectrumresolution, improving 8-29, 8-40,
8-73segments, see PSD segmentssetting 5-25signal intensity different from
regular analysis 8-67standard instrument settings H-4summary of parameters
affecting 8-76troubleshooting 8-29, 9-21Vertical Scale 8-48
PSD precursor spectrumsee also PSD modeacquiring 8-38BIC file 5-6CAL, generating from 8-39calibration 8-39mass, determining in Reflector
mode 8-38mass, entering in PSD mode 8-45,
8-60
Voyager™ Biospectrometry™ Workstation User’s Guide Index-31

I
DEX
N
Index
PSD segmentssee also PSD fragmentsaccumulating 8-55acquiring in any order 8-55acquiring selected 8-42appended to DAT file 8-52list, autofilling 8-50mass range 8-54, 8-64number of, and composite
spectrum resolution 8-25number to acquire 8-25, 8-40optimum resolution observed near
Max Stitch Mass 8-23,8-42, 8-49
reacquiring 8-56saving 8-55segment list, defaults 8-47selecting for acquisition 8-54, 8-63size and Decrement Ratio,
correlation 8-41size, collecting different 8-42size, default 8-42
Pulse width, laser 1-22, 1-34Pump
see Fore pumpsee Turbo pump
Pumping down, time required to reachpressure after venting 2-77
Purifying sample, see Sample cleanup
QQuality of data 6-6
RRA number B-5Random search pattern 5-37Range, display, see Display RangeRead-only instrument setting files
provided 5-3setting attributes 5-13
Rear panelcomputer, Voyager-DE and
Voyager-DE PRO 2-10mass spectrometer, Voyager-DE
STR 2-23Reflector
benefits of single-stage 1-24, 1-36description 1-24, 1-36detector, description 1-24, 1-36function 1-24, 1-36
Reflector modeBIC files 5-5cannot see ions in H-20improving resolution 5-88path length, Voyager-DE PRO 1-4path length, Voyager-DE STR 1-6setting 5-25
Related documents xxixRemoving traces 4-15Repetition (firing) rate, laser 5-26Resolution, mass
and laser threshold in ContinuousExtraction mode H-11
and signal-to-noise ratio H-8automatic spectrum
evaluation 6-44calculating during acquisition 6-30checking in Continuous Extraction
mode H-17comparison between delayed and
continuous modes 1-13filtering during acquisition 6-44impact of changing instrument
settings parameters 5-49,6-25
improving 1-14, 5-56, 5-59, 5-88improving by accumulating
spectra 5-71isotopes in Delayed Extraction
mode 5-75labels not displayed 6-31
Index-32 Applied Biosystems

Index
I
DEX
N
Resolution, mass (continued)obtaining maximum in Continuous
Extraction mode H-18parameters affecting in Continuous
Extraction mode H-11peak height used in Automatic
Control mode 6-44PSD mode 8-73PSD segment, optimum observed
near Max Stitch Mass 8-49rating scale for MW ranges 6-32,
H-17Reflector mode 5-25results 6-32troubleshooting 5-76, 9-10, H-21
Resolution, optimizingAccelerating Voltage 5-84, 5-88Delay Time 5-77for a mixture 5-78, 5-83Grid Voltage% 5-82, 5-83Guide Wire Voltage% 5-56, 5-84Input Bandwidth 5-63overview 5-71parameters affecting 5-72
ResultsOptiPlate 2-69resolution, mass 6-32signal-to-noise ratio 6-34
Return Authorization (RA) number B-5Returning damaged items B-5Right axis
changing scale 4-11, 5-70turning off 4-11turning on and off 4-21
Run list, see SequenceRun Log file, Sequence Control Panel
contents 7-14created 7-28specifying 7-14
SSafety information, laser xxviSafety standards xxivSalt concentration in sample 3-5, 3-13,
3-15, 3-24Sample
buffers, impact of 3-24diluting, recommended
solutions 3-23guidelines for good
crystallization 3-37high salt, impact of 3-24impact of ionization on data 6-6internal standard 3-24loss, minimizing 3-24mixing on sample plate, dried
droplet application 3-34premixing with matrix, dried droplet
application 3-33preparing 3-2preparing for dried droplet
application 3-22preparing for thin layer
application 3-24purifying, see Sample cleanupvolume to load on plate 3-43when to prepare 3-22
Sample cleanupC18 3-31cation exchange beads 3-29drop dialysis 3-27floating membrane dialysis 3-27washing 3-26when to do 3-25ZipTips 3-31
Voyager™ Biospectrometry™ Workstation User’s Guide Index-33

I
DEX
N
Index
Sample concentrationdried droplet application 3-22general 3-22in 3-HPA 3-15in alpha-cyano-4-hydroxycinnamic
acid, dried dropletapplication 3-3, 3-9
in alpha-cyano-4-hydroxycinnamicacid, thin layerapplication 3-11
in DHB 3-16, 3-17, 3-19in DHBs 3-18in Dithranol 3-19in IAA 3-19in sinapinic acid 3-7in THAP 3-13low concentration application
technique 3-22thin layer application 3-22
Sample holderejecting 3-54loading 3-54
Sample ionization, see Ionization,sample
Sample list, Sequence Control Panelsaving 7-20
Sample loadingdried droplet application 3-41in mass spectrometer 3-50techniques 3-35thin layer application 3-44
Sample loading chambermax load pressure 2-37wait time 2-37
Sample platesee also PLT filessee also Sample plate, aligningsee also Sample plate, loadingsee also Sample plate, types ofalignment, checking 3-73Automatic Control mode, type
required 3-41
Sample plate (continued)Biacore Chip 3-63cleaning 3-48, 3-49consequence of loading wet
plate 3-43corner position numbers, list
of 2-50crystallization, examining 3-45crystallization, poor 3-25custom plate types, guidelines for
defining 3-68drying time 3-43ejecting 3-54, 4-25handling 3-37load no plate 3-57, 3-59loading 4-25maximum number of spots, on
disposable 3-74moving position under laser I-7name of plate loaded 3-78optimization, see OptiPlate
softwareordering B-7proper orientation 3-55, 3-58provided, editable 3-65relative coordinates 3-78search pattern files for custom plate
types 3-72, 6-49selecting type 3-56, 3-59spotting sample and standard
location 3-38, H-24templates 3-61tolerance, positional 3-74types of physical plates 3-36user-defined 3-61using outer rows 3-38, H-24volume of sample to load 3-43well size 6-47wet, consequence of loading 3-50
Index-34 Applied Biosystems

Index
I
DEX
N
Sample plate, aligningcorner position numbers, list
of 2-50examples of good and bad
alignment 2-48how the system aligns 2-47if alignment fails 2-52multiple alignments supported 2-47PLT file, selecting before
starting 2-50procedure 2-50Sequence run 7-24what you need 2-49when to align 2-46
Sample plate, loadingdried droplet application 3-41in mass spectrometer 3-50overview 3-35techniques 3-35thin layer application 3-44
Sample plate, types of96x2, applications 3-6496x2, PLT file for 3-67applications for 3-62disposable, applications 3-63disposable, maximum number of
spots 3-74disposable, PLT file for 3-67gels 3-63gold, applications 3-62gold, cleaning 3-48membranes 3-63overview 3-62stainless steel, applications 3-62stainless steel, cleaning 3-48Teflon, applications 3-63Teflon, cleaning 3-47Teflon, PLT file for 3-67types supported (.PLT) 3-61
Sample positionincluding in data file name 7-16,
7-46random 5-37selecting automatically 6-41selecting manually 4-25, 4-29, 6-13Sequence Control Panel 7-16shape displayed in Manual Laser/
Sample Positioning controlpage 3-69, 3-82
uniform, edge bias, or centerbias 5-37
zooming 6-13Sample positioning, automated, see
Automated Sample PositioningSample preparation, see SampleSample spotting, see sample loadingSample throughput, increasing 3-52Sample view, sample position
accessing from Plate view 6-13accessing Plate view 4-31laser position 4-31
Save All Spectra data collection modedescription 5-39selecting 5-35
Save All Spectra That PassAcceptance Criteria datacollection mode
description 5-40selecting 5-35
Save the Best Spectrum data collectionmode
description 5-44selecting 5-36
Save the First Spectrum to PassAcceptance Criteria datacollection mode
description 5-42selecting 5-36
Voyager™ Biospectrometry™ Workstation User’s Guide Index-35

I
DEX
N
Index
Saving data, Instrument Control PanelLinear and Reflector mode 4-25PSD mode 8-55single shot mode 2-45
Scalingsee also Display Rangedigitizer signal 5-30to Absolute Value 4-12to Base Peak 4-11to Display window 4-11to minimum and maximum
counts 4-12Screen savers, do not use 1-30, 1-41Search Pattern Editor
automatically generatingspots 6-52
drawing a pattern 6-56Search Pattern Generator 6-52setting x,y coordinates 6-57using 6-50
Search pattern filesee also Search Pattern Editorsee also Search pattern, randomconverting version 4 to version
5 5-92DEFAULT.SP 6-48definition 6-46description 6-47difference between version 4 and
version 5 5-92example for internal
calibration 7-41for custom plates 3-72for PLT files 3-73internal calibration, creating for
separate spots 7-38, 7-40location 6-46maximum number of positions 6-47radius to ensure analysis of correct
sample 3-74specifying 5-38SPIRAL.SP 6-49units of measure 6-48
Search pattern, random 5-37Segments, PSD, see PSD segmentsSelect button on oscilloscope I-5Sensitivity
see also Intensity, signalsee also Signal-to-noiseimpact of changing instrument
setting parameters 5-49improving 5-30, 5-56Linear mode 5-25range, Voyager-DE 1-4range, Voyager-DE PRO 1-4range, Voyager-DE STR 1-6troubleshooting 9-10Vertical Scale parameter, effect
on 5-30SEQ files 7-20Sequence
see also Sequence Control Panelacquiring 7-25before creating 7-7BIC file loaded in Instrument
Control Panel 7-28cannot run .BICs that specify
internal and external laserin same sequence 7-16
creating 7-13general sequence parameters,
setting 7-13loading 7-24parameters 7-13parts of 7-13pausing and resuming 7-28run list, see Sequence run listsaving 7-20starting 7-25status 7-29stopping 7-29
Index-36 Applied Biosystems
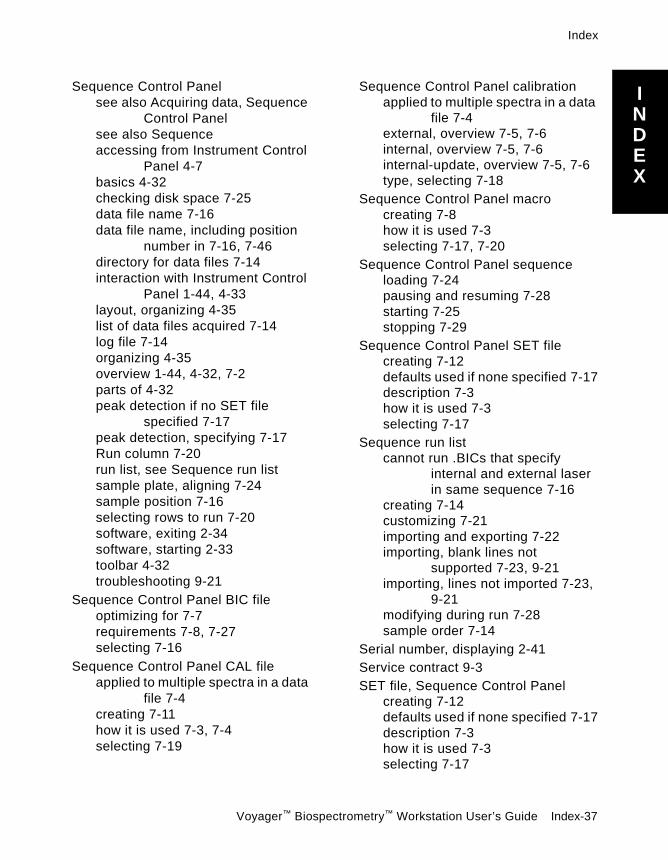
Index
I
DEX
N
Sequence Control Panelsee also Acquiring data, Sequence
Control Panelsee also Sequenceaccessing from Instrument Control
Panel 4-7basics 4-32checking disk space 7-25data file name 7-16data file name, including position
number in 7-16, 7-46directory for data files 7-14interaction with Instrument Control
Panel 1-44, 4-33layout, organizing 4-35list of data files acquired 7-14log file 7-14organizing 4-35overview 1-44, 4-32, 7-2parts of 4-32peak detection if no SET file
specified 7-17peak detection, specifying 7-17Run column 7-20run list, see Sequence run listsample plate, aligning 7-24sample position 7-16selecting rows to run 7-20software, exiting 2-34software, starting 2-33toolbar 4-32troubleshooting 9-21
Sequence Control Panel BIC fileoptimizing for 7-7requirements 7-8, 7-27selecting 7-16
Sequence Control Panel CAL fileapplied to multiple spectra in a data
file 7-4creating 7-11how it is used 7-3, 7-4selecting 7-19
Sequence Control Panel calibrationapplied to multiple spectra in a data
file 7-4external, overview 7-5, 7-6internal, overview 7-5, 7-6internal-update, overview 7-5, 7-6type, selecting 7-18
Sequence Control Panel macrocreating 7-8how it is used 7-3selecting 7-17, 7-20
Sequence Control Panel sequenceloading 7-24pausing and resuming 7-28starting 7-25stopping 7-29
Sequence Control Panel SET filecreating 7-12defaults used if none specified 7-17description 7-3how it is used 7-3selecting 7-17
Sequence run listcannot run .BICs that specify
internal and external laserin same sequence 7-16
creating 7-14customizing 7-21importing and exporting 7-22importing, blank lines not
supported 7-23, 9-21importing, lines not imported 7-23,
9-21modifying during run 7-28sample order 7-14
Serial number, displaying 2-41Service contract 9-3SET file, Sequence Control Panel
creating 7-12defaults used if none specified 7-17description 7-3how it is used 7-3selecting 7-17
Voyager™ Biospectrometry™ Workstation User’s Guide Index-37
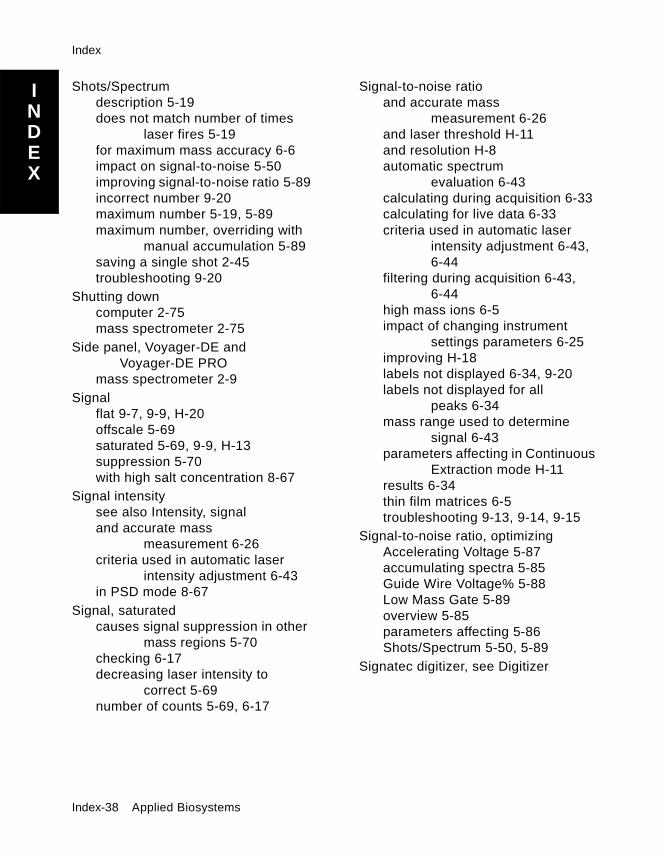
I
DEX
N
Index
Shots/Spectrumdescription 5-19does not match number of times
laser fires 5-19for maximum mass accuracy 6-6impact on signal-to-noise 5-50improving signal-to-noise ratio 5-89incorrect number 9-20maximum number 5-19, 5-89maximum number, overriding with
manual accumulation 5-89saving a single shot 2-45troubleshooting 9-20
Shutting downcomputer 2-75mass spectrometer 2-75
Side panel, Voyager-DE andVoyager-DE PRO
mass spectrometer 2-9Signal
flat 9-7, 9-9, H-20offscale 5-69saturated 5-69, 9-9, H-13suppression 5-70with high salt concentration 8-67
Signal intensitysee also Intensity, signaland accurate mass
measurement 6-26criteria used in automatic laser
intensity adjustment 6-43in PSD mode 8-67
Signal, saturatedcauses signal suppression in other
mass regions 5-70checking 6-17decreasing laser intensity to
correct 5-69number of counts 5-69, 6-17
Signal-to-noise ratioand accurate mass
measurement 6-26and laser threshold H-11and resolution H-8automatic spectrum
evaluation 6-43calculating during acquisition 6-33calculating for live data 6-33criteria used in automatic laser
intensity adjustment 6-43,6-44
filtering during acquisition 6-43,6-44
high mass ions 6-5impact of changing instrument
settings parameters 6-25improving H-18labels not displayed 6-34, 9-20labels not displayed for all
peaks 6-34mass range used to determine
signal 6-43parameters affecting in Continuous
Extraction mode H-11results 6-34thin film matrices 6-5troubleshooting 9-13, 9-14, 9-15
Signal-to-noise ratio, optimizingAccelerating Voltage 5-87accumulating spectra 5-85Guide Wire Voltage% 5-88Low Mass Gate 5-89overview 5-85parameters affecting 5-86Shots/Spectrum 5-50, 5-89
Signatec digitizer, see Digitizer
Index-38 Applied Biosystems

Index
I
DEX
N
Sinapinic acidchemical structure and molecular
weight C-6concentration 3-7crystals 3-7, 3-45initial velocity setting 5-22laser intensity, relative 5-67mass spectrum C-2organic concentration 3-7, 3-8preparing 3-5, 3-7sample concentration 3-7stability 3-8when to use 3-3
Single shot mode of acquisitionsetting 2-45when to use 2-45
Singly-charged ions, drift time 1-10Slow fragments, see PSD fragmentsSmall molecules, matrix for C-8Smoothing before calibration 6-10Sodium adduct ion
effect on masses 9-17from buffer 3-24
SoftwareControl Panels 4-1Data Explorer 1-45disk space required 2-29exiting 2-34included with system 1-30, 1-41installing 2-29, 2-30Instrument Control Panel 1-42interaction, Instrument and
Sequence ControlPanels 4-33
overview 1-42Sequence Control Panel 1-44, 4-32starting 2-32
Source chambermaximum operating pressure 2-36wait time 2-37
Source, see Ion source
SP filesee also Search pattern fileconverting version 4 to version
5 5-92definition 6-46difference between version 4 and
version 5 5-92location 6-46
Space requiredVoyager-DE and
Voyager-DE PRO 2-2Voyager-DE STR 2-7, A-10
Spare parts B-6Specifications A-1
Voyager-DE workstation A-2Voyager-DE PRO workstation A-5Voyager-DE STR workstation A-8
Spectraacceptable 6-6dimers or trimers 9-15examples of good and bad in
Continuous Extractionmode H-9, H-10
examples of good and bad inDelayed Extractionmode 6-22, 6-23
saturated H-13starting acquisition I-7stopping acquisition I-7troubleshooting 9-7
Spectral accumulation, seeAccumulation, spectra
Spectrum Acceptance Criteriaaccessing 5-36description 6-43resolution 6-44resolution filtering 6-44setting 6-42signal intensity 6-43signal-to-noise filtering 6-43, 6-44
Voyager™ Biospectrometry™ Workstation User’s Guide Index-39

I
DEX
N
Index
Spectrum Accumulation optionsdescription 5-39selecting 5-35
Spectrum, see SpectraSpectrum window
see also Instrument Control Panelsee also Tracesaccumulated spectrum data,
definition 4-14Current Spectrum trace, during
acquisition 6-16cursor, displaying 4-21description 4-5display range, adjusting 4-10does not update with every laser
shot 6-16, 9-21Grid, displaying 4-21live data, definition 4-14Live Spectrum trace, during
acquisition 6-16Low Mass Gate spike 5-91mass range in Spectrum window
does not update with everylaser shot 6-16, 9-21
mass scale not accurate 9-15peak detection parameters,
setting 6-29peak labels, enabling and
disabling 6-29resolution, calculating 6-30right axis, displaying Absolute
counts 5-70scalingsignal-to-noise ratio,
calculating 6-33trace, displaying as vertical
bars 4-22traces displayed 4-5traces do not print 4-19, 4-22traces, previewing and
printing 4-18using 4-10zooming 4-13
SPIRAL.SP 6-49Spotting sample, see sample loadingStandard compounds
see also Calibration standardsacquiring 6-10conversion of mass to time F-4molecular weights F-2ordering information B-6spotting next to sample 3-38, H-24Voyager mass standards kit B-6
Standard, internalsee also Calibration, internalconcentration 3-24mass range 3-24
Standby mode, high voltage powersupplies 6-4, 7-24
Standby time, high voltage 2-39Status
acquisition 2-78, 4-5, 4-25acquisition, Sequence Control
Panel 7-20, 7-29active position 4-5Control Mode 4-5data storage 2-78high voltage 2-77, 4-5instrument mode 4-5instrument state 2-77, 4-5laser intensity 4-5mirror chamber (BA2)
pressure 2-78, 4-5source chamber (BA1)
pressure 2-77, 4-5System Status, displaying control
page 2-76Status bar, Instrument Control Panel
description 4-5Step size, laser
Automatic Control modeparameters 5-34
configuring 2-43
Index-40 Applied Biosystems
Index
I
DEX
N
Stop Conditions, Automatic Controlmode 5-38
Stoppingacquisition 4-25, 6-16PSD experiment 8-56, 8-64software 2-34
Substance P BIC file 5-5, 5-6Substance P-amide, molecular
weight F-2Summary of Instrument Settings
parametersLinear and Reflector mode 5-49PSD mode 8-76
Swap file, required disk space 9-6SymBiot sample plate, creating PLT file
for 3-84System performance, improving
closing Sequence Control Panelwhen not in use 4-35
screen savers, do not use 1-30System Status
checking 2-76parameters 2-76status bar 4-5
TTC2, Voyager-DE
description 1-27max load pressure 2-37pressure range 9-26wait time 2-37
TC2, Voyager-DE PROdescription 1-29max load pressure 2-37pressure range 9-26wait time 2-37
TC2, Voyager-DE STRdescription 1-39max load pressure 2-37pressure range 9-26wait time 2-37
Technical supportcontacting 9-7for computers with altered
configuration B-1Teflon plates, see Sample plate, TeflonTektronix oscilloscope
see Digitizersee Oscilloscope
Temperature, operating A-4, A-7, A-10Templates, sample plate 3-61THAP
chemical structure and molecularweight C-11
concentration 3-13crystals 3-13, 3-46mass spectrum C-5preparing 3-13sample concentration 3-13stability 3-14when to use 3-3
Thermocouple gauge, see TC2Thin layer sample application
technique, see Sample loadingThioredoxin
BIC file 5-5molecular weight F-3
Time dispersion, correcting 1-24, 1-36Timed Ion Selector
BIC file to test 5-5configuring 2-39, 8-30enabling 5-32function 1-25, 1-36, 8-20impact on system
performance 2-40, 8-29resolution A-5, A-9see also Precursor Ion Selectorsetting tracks Precursor Ion
Selector 5-32Tips, pipette, see Pipette tipsTolerance of sample plates 3-73
Voyager™ Biospectrometry™ Workstation User’s Guide Index-41
I
DEX
N
Index
Toolbars, Instrument Control Panelcustomizing 4-21description 4-3moving 4-21
ToolTips 4-3Traces
adding 4-14annotating 4-16changing colors to black before
printing 4-18color 4-22Current 4-14displaying as vertical bars 4-22do not print 4-19, 4-22expanding 4-13labels, spectrum 6-29line type 4-22linking 4-13Live 4-14maximum number 4-14Not Used 4-14overview 4-13previewing 4-18printing 4-18removing 4-15scaling mode, setting 4-11, 4-12traces do not print 4-18types of 4-14white, does not print 4-18zooming 4-13
Trihydroxy acetophenone, see THAPTrimers, troubleshooting 9-15Troubleshooting
active position 9-20CID 8-36computer 9-6continuous mode spectrum H-20dimers/trimers in spectrum 9-15error codes, vacuum gauge
panel 9-27Instrument Control Panel 9-19laser 9-20
Troubleshooting (continued)laser, external 9-28laser threshold H-19Load/Eject dimmed 9-19mass accuracy 9-11, 9-12, 9-17,
H-23, H-24mass range in Spectrum window
does not update with everylaser shot 6-16, 9-21
mass spectrometer 9-23no matrix peaks 9-9no sample peaks 9-7peak shape 9-11, 9-16, H-20poor crystallization on sample
plate 3-25PSD mode 9-21resolution 5-76, 9-10, H-21sample plate crystallization 9-9saturated signal 9-9sensitivity 3-25, 9-10Sequence Control Panel 9-21Shots/Spectrum 9-20signal-to-noise 9-13, 9-14, 9-15spectrum 9-7Spectrum window is not updated
with every laser shot 9-21tail on spectrum 3-25
Trypsinogen, molecular weight F-3Turbo pump, Voyager-DE
function 1-27vacuum gauge 1-27
Turbo pump, Voyager-DE PROfunction 1-29vacuum gauge 1-29
Turbo pump, Voyager-DE STRfunction 1-37vacuum gauge 1-39
Index-42 Applied Biosystems
Index
I
DEX
N
UUniform search pattern 5-37Unzooming 4-13Update calibrationdescription 7-11how to program every X
minutes 3-39overview 7-5selecting 7-18
Username, obtaining from systemadministrator 2-74
Users guides, online 2-31
VVacuum
configuring 2-35pressure ranges 2-76pressure status 2-77, 4-5startup 2-73time required to reach operating
pressure 2-77Vacuum gauge panel, Voyager-DE and
Voyager-DE PRObuttons 9-26error codes 1-1, 9-27location 9-25pressure ranges 9-26
Vacuum gauge panel,Voyager-DE STR
buttons 9-26error codes 1-1, 9-27location 9-25pressure ranges 9-26
Vacuum gauges, CIDdisruption caused by unpurged
lines 8-34pressure ranges 8-34
Vacuum system, Voyager-DEsee also Vacuum gauge panelchambers 1-26diagram 1-26function 1-25gauges 1-27pumps 1-27
Vacuum system, Voyager-DE PROsee also Vacuum gauge panelchambers 1-26, 1-28diagram 1-28function 1-25gauges 1-29
Vacuum system, Voyager-DE STRsee also Vacuum gauge panelchambers 1-37diagram 1-38function 1-37gauges 1-39
Valves, vacuum 1-26, 1-28, 1-38Velocity focusing
description 1-15in PSD mode 8-74
Velocity, initial, see Initial velocityVertical bars
displaying traces as 4-22traces do not print 4-19, 4-22
Vertical Offset, digitizerimpact of changing 5-62setting 5-30suggested setting 5-62
Vertical position, oscilloscope I-5Vertical Scale, digitizer
impact of changing 5-60PSD 8-48setting 5-30setting on oscilloscope I-5suggested settings 5-61
Voyager™ Biospectrometry™ Workstation User’s Guide Index-43

I
DEX
N
Index
Video cameramagnification, Voyager-DE and
Voyager-DE PRO 1-22magnification,
Voyager-DE STR 1-35not aligned with sample
position 2-48, 9-23Video monitor
connecting, Voyager-DE andVoyager-DE PRO 2-21,2-27
connecting, Voyager-DE STR 2-28Views, sample plate
see Plate viewsee Sample view
Voltagesee also Accelerating Voltagesee also Grid Voltage%see also Guide Wire Voltage%see also High voltageinput, selecting 2-4setting operating,
Voyager-DE STR 2-7Voltage difference, see Potential
gradientVoyager control software
see also Instrument Control Panelsee Sequence Control Paneldisk space required 2-29
Voyager Mass Standards Kit B-6Voyager processing software
disk space required 2-29starting 2-32
Voyager-DE BiospectrometryWorkstation
digitizer, Acqiris 2-17digitizer, LeCroy 2-15digitizer, oscilloscope 2-19digitizer, Signatec 2-13features 1-4input voltage, selecting 2-4
Voyager-DE BiospectrometryWorkstation (continued)
mass spectrometer, parts of 1-20,1-22
overview 1-2parts of the system 1-17space required 2-2specifications A-2startup and shutdown 2-73weight 2-3
Voyager-DE PRO BiospectrometryWorkstation
digitizer, Acqiris 2-17digitizer, LeCroy 2-15digitizer, oscilloscope 2-19digitizer, Signatec 2-13features 1-4input voltage, selecting 2-4mass spectrometer, parts of 1-21,
1-22overview 1-3parts of the system 1-18space required 2-2specifications A-5startup and shutdown 2-73weight 2-3
Voyager-DE STR BiospectrometryWorkstation
Beam guide wire replaced by Ionfocusing lens on modelswith serial number 4154and later 1-33, 1-35
digitizer, Acqiris 2-26digitizer, oscilloscope 2-26features 1-6Guide Wire Voltage% not available
on STR models with serialnumber 4154 andlater 5-18
mass spectrometer, parts of 1-33overview 1-5parts of the system 1-31power requirements 2-7
Index-44 Applied Biosystems

Index
I
DEX
N
Voyager-DE STR BiospectrometryWorkstation (continued)
space required 2-7, A-10specifications A-8startup and shutdown 2-73weight 2-7
WWarnings, safety
CHCA matrix 2-49fire hazard and fuse ratings 2-5high voltage xxii, 9-3removing instrument covers xxii,
9-3sample holder retraction 3-56, 3-59symbols on system xvUV radiation from laser xxi, 9-3
Warrantydamages, claims, returns B-5exceptions B-3for computers with altered
configuration B-1period B-2
Washing, sample cleanup 3-26Wavelength, laser 1-22, 1-34Weight of system
Voyager-DE 2-3Voyager-DE PRO 2-3Voyager-DE STR 2-7
Well depth 3-70Windows NT
event log, see NT Event logversion 1-30, 1-41
XX axis, setting range 4-10x, y, z ions, angiotensin F-6XML files created by OptiPlate
software 2-70
YY axis
scaling 4-11, 4-12Y Offset
digitizer signal 5-30Y-axis
spectrum 4-11
ZZipTips, sample cleanup 3-31Zooming
sample position 6-13spectrum trace 4-13
Voyager™ Biospectrometry™ Workstation User’s Guide Index-45

I
DEX
N
Index
Index-46 Applied Biosystems