An Investigation of Alternative Methods for Item Mapping in the National Assessment of Educational...
11
to standariiized testing in music (Re- search Rep. No. 93-36). Princeton, NJ: Educational Testing Service, Powers, D. (1986). Academic demands re- lated to listening skills. Langua.qe Test- ing, 3, 1-38. Richards, 3. (1983). Listening comprehen- sion: Approach, design, procedure. TESOL Quarterty, < 219-240. Sharps, M., & Price, J. (1992). Auditory imagery and free recall. Journal of Gen- eral Psychotogg, 119, 81-87. Shermis, M., & Averitt, J. (2000, April). Where did all the data go? Internet se- curity for Webdased assessments. Pa- per presented at the annual meeting of the National Council on Measurement in Education, New Orleans. Turner, C., Ku, L., Rogers, S., Lindberg, L., & Pleck, J. (1998). Adolescent sexual behavior, drug use and violence: In- creased reporting with computer survey technology. Science, 280, 867-873. Vispoel, W. P., & Coffman, D. (1992). Com- puterized adaptive testing of music- related skills. Bulletin o f the Cauncit for Research in Music Education, 112, Vispoel, W. P., & Coffman, D. D. (1994). Computerized-adaptive and self- adaptive music-listening tests: Psycho- metric features and motivational 29-49. benefits. Applied Measurement in Edu- cation, 7 25-51. Vispoel, W. P., Wang, T., & Bleiler, T. (1997). Computerized adaptive and fixed-item testing of music listening skik A comparison of efficiency, preci- sion, and concurrent validity. Journal of Educational Measurement, 34, 43-63. Williams, V. S. L., Sweeny, S. F., & Bethke, A. D. (1999). The development and cog- nitive laborato y evaluation o f an au- dio-assisted computer-adaptive test for eight-grade mathematics. Paper pre- sented at the annual meeting of the Na- tional Council on Measurement in Education, Montreal, Canada. An Investigation of Alternative Methods for Item Mapping in the National Assessment of Educational Progress Rebecca Zwick, Deniz Senturk, and Joyce Wang University of California, Santa Barbara Susan Cooper Loomis, ACT, Inc. What is item mapping and how does it aid test score in- terpretation? Which item mapping technique produces the most consistent results and most closely matches expert opinion ? ow is a reader of the daily paper H to interpret a report stating that “the average eighth grader scored 270 in mathematics on the National As- sessment of Educational Progress?” Without further information, it is im- possible to make any inferences about the math skills possessed by the typi- cal eighth-grade student. In the last decade, the need for enhancing the interpretability of national student achievement results has received in- creasing attention (e.g., Forsyth, 1991; Hambleton & Slater, 1994; Jaeger, 1998). One way to make achievement reports more informative is to use test items to “anchor” achievement scales: Items that typify selected score values can serve to illustrate how much stu- dents with the score in question know and can do. Ebel (1962) was apparently the first to propose an item mapping approach for purposes of enhancing score inter- pretation, noting that “[ilt is not very useful to know that Johnny is superior to 84 per cent of his peers unless we know what it is that he can do better than they, and just how well he can do it!” (p. H).’ Ebel illustrated his pro- posed method of attaching meaning to scores through an application to the PSAT mathematics test. First, he cat- egorized all the test items into 10 con- tent categories, then he selected the most discriminating item in each cat- egory. The resulting 10 items consti- tuted a “scale book” of representative items which could serve as a supple- ment to an individual’s PSAT score. A test-taker’s score report would also in- clude a table indicating, for selected Rebecca Zwick i s Professor, Depart- ment o f Education, University of Califor- nia, Santa Barbara, Santa Barbara, CA 93106-9490. Her specializations are ap- plied statistics, psychometrics, and test fairness. Deniz Senturk is a Statistician at GE Corporate Research & Development, One Research Circle, Btdg Kl-46’41, Niska- yuna, NY 12309. Her specializations are structural equation modeling, measure- ment invariance, and i t d t e s t bias. Joyce Wang is a Research Scientist at American Institutes for Research, 1791 Arastradero Rd., Palo Alto, CA 94304. Her specializations are educational measure- ment and IRT applications. Susan Cooper Loonais is Senior, Re- search Associate, Policg Research,, ACT, Inc., 2201 N. Dodge Street, Iowa City, Iowa 52243. Her specializations are stan- dard setting, large-scaleassessments, and policy research. Summer 2001 15
-
Upload
independent -
Category
Documents
-
view
1 -
download
0
Transcript of An Investigation of Alternative Methods for Item Mapping in the National Assessment of Educational...
to standariiized testing in music (Re- search Rep. No. 93-36). Princeton, NJ: Educational Testing Service,
Powers, D. (1986). Academic demands re- lated to listening skills. Langua.qe Test- ing, 3, 1-38.
Richards, 3. (1983). Listening comprehen- sion: Approach, design, procedure. TESOL Quarterty, < 219-240.
Sharps, M., & Price, J. (1992). Auditory imagery and free recall. Journal of Gen- eral Psychotogg, 119, 81-87.
Shermis, M., & Averitt, J. (2000, April). Where did all the data go? Internet se- curity for Webdased assessments. Pa- per presented at the annual meeting of
the National Council on Measurement in Education, New Orleans.
Turner, C., Ku, L., Rogers, S., Lindberg, L., & Pleck, J. (1998). Adolescent sexual behavior, drug use and violence: In- creased reporting with computer survey technology. Science, 280, 867-873.
Vispoel, W. P., & Coffman, D. (1992). Com- puterized adaptive testing of music- related skills. Bulletin of the Cauncit for Research in Music Education, 112,
Vispoel, W. P., & Coffman, D. D. (1994). Computer ized-adapt ive and self- adaptive music-listening tests: Psycho- metric features and motivational
29-49.
benefits. Applied Measurement in Edu- cation, 7 25-51.
Vispoel, W. P., Wang, T., & Bleiler, T. (1997). Computerized adaptive and fixed-item testing of music listening skik A comparison of efficiency, preci- sion, and concurrent validity. Journal of Educational Measurement, 34, 43-63.
Williams, V. S. L., Sweeny, S. F., & Bethke, A. D. (1999). The development and cog- nitive laborato y evaluation of an au- dio-assisted computer-adaptive test for eight-grade mathematics. Paper pre- sented at the annual meeting of the Na- tional Council on Measurement in Education, Montreal, Canada.
An Investigation of Alternative Methods for Item Mapping in the National Assessment of Educational Progress Rebecca Zwick, Deniz Senturk, and Joyce Wang University of California, Santa Barbara Susan Cooper Loomis, ACT, Inc.
What is item mapping and how does it aid test score in- terpretation? Which item mapping technique produces the most consistent results and most closely matches expert opinion ?
ow is a reader of the daily paper H to interpret a report stating that “the average eighth grader scored 270 in mathematics on the National As- sessment of Educational Progress?” Without further information, it is im- possible to make any inferences about the math skills possessed by the typi- cal eighth-grade student. In the last decade, the need for enhancing the interpretability of national student achievement results has received in- creasing attention (e.g., Forsyth, 1991; Hambleton & Slater, 1994; Jaeger, 1998). One way to make achievement reports more informative is to use test items to “anchor” achievement scales: Items that typify selected score values can serve to illustrate how much stu-
dents with the score in question know and can do.
Ebel (1962) was apparently the first to propose an item mapping approach for purposes of enhancing score inter- pretation, noting that “[ilt is not very useful to know that Johnny is superior to 84 per cent of his peers unless we know what it is that he can do better than they, and just how well he can do it!” (p. H).’ Ebel illustrated his pro- posed method of attaching meaning to scores through an application to the PSAT mathematics test. First, he cat- egorized all the test items into 10 con- tent categories, then he selected the most discriminating item in each cat- egory. The resulting 10 items consti- tuted a “scale book” of representative
items which could serve as a supple- ment to an individual’s PSAT score. A test-taker’s score report would also in- clude a table indicating, for selected
Rebecca Zwick is Professor, Depart- ment of Education, University of Califor- nia, Santa Barbara, Santa Barbara, CA 93106-9490. Her specializations are ap- plied statistics, psychometrics, and test fairness.
Deniz Senturk is a Statistician at GE Corporate Research & Development, One Research Circle, Btdg Kl-46’41, Niska- yuna, NY 12309. Her specializations are structural equation modeling, measure- ment invariance, and i t d t e s t bias.
Joyce Wang is a Research Scientist at American Institutes for Research, 1791 Arastradero Rd., Palo Alto, CA 94304. Her specializations are educational measure- ment and IRT applications.
Susan Cooper Loonais is Senior, Re- search Associate, Policg Research,, ACT, Inc., 2201 N . Dodge Street, Iowa City, Iowa 52243. Her specializations are stan- dard setting, large-scale assessments, and policy research.
Summer 2001 15
PSAT scaled scores ranging from 250 to 800, the “most probable score” on the set of representative items. Ebel’s analysis, for example, showed that test-takers with scaled scores of 600 were most likely to answer 7 of the 10 representative items correctly.
Twenty years later, Bock, Mislevy, and Woodson (1982) outlined a proce- dure that could be considered a spe- cial case of Ebel’s, with only a single item in the “representative set.” They suggested that the mastery level for test items be defined as the scale point at which a correct response was likely, and that the scale could then “be interpreted by inferring the level of skill represented by the content of items with mastery thresholds in par- ticular regions of the scale” (Bock et al., p. 8).
The use of exemplar items to char- acterize particular score points, now typically called “item mapping,” has been applied to large-scale assessment data in several ways. First, it was used in the National Assessment of Educa- tional Progress (NAEP) scale anchor- ing procedures (originally called “behavioral anchoring”) developed at Educational Testing Service, the NAEP contractor since 1983 (see Beaton & Allen, 1992). Similar procedures were also applied to scales emerging from the National Adult Literacy Survey (see Kolstad, 1996). In addition, item map- ping is a component of the “bookmark” method of standard-setting developed at CTB/McGraw Hill (Lewis, Mitzel, & Green, 1996; Mitzel, Lewis, Patz, & Green, 2000) and now used by some states to set achievement standards.
An item mapping procedure is cur- rently used in one phase of the NAEP achievement-levels-setting (ALS) pro- cedures.2 The ALS enterprise, which is directed by the National Assessment Governing Board, has been conducted by ACT, Inc. since 1992. (The ALS con- tract is separate from the primary NAEP contract.) ALS procedures have been applied to NAEP assessments of mathematics, reading, geography, sci- ence, civics, U S . history, and writing. In the ALS process, a judgmental method, sometimes called the modi- fied Angoff method (see Reckase, 2000) is used to determine cutpoints that divide the achievement scale into four intervals, labeled below basic, ba- sic, proficient, and advanced. (The in- tervals of primary interest are basic, proficient, and advanced. Below basic
is not considered an official achieve- ment level; unlike the other levels, it is not associated with a description of skills.) Item mapping techniques are used as a first step in identifying “can- didate” items that best characterize the three achievement levels; expert judgments are then used to select the exemplars from among these candi- dates. Reports of ALS results typically include the percent of students at or above each of the achievement levels, along with the exemplar items, which are intended to illustrate the skills pos- sessed by students at each of these levels.
A major technical question that arises in item mapping is how to de- termine which items typify a particu- lar scale point. Clearly, we cannot require that 100% of test-takers an- swer the item correctly at that scale value, or we would never be able to find exemplars. What, then, is the ap- propriate percent? Bock, Mislevy, and Woodson (1982, p. 7) suggested 80%. Values ranging from 50% to 80% have been used in NAEP applications; Kolstad et al. (1998) provide a useful review. A variety of technical justifica- tions for particular “RP-values” (for “response probabilities” or “response percents”) have been put forth (e.g. see Huynh, 1998; Kolstad et al., 1998).‘ Fifty percent has been widely sup- ported, both on common-sense and theoretic grounds, and this is the value currently used in the NAEP ALS: To be considered a potential exemplar item, the item must have an average percent correct of at least 50 for the achievement level in question (ACT, 1997, p. 72). The common-sense argu- ment is that we are justified in saying that students at a particular scale level “can do” a task if the number of students who can do the task exceeds the number of students who cannot. The 50% point marks the dividing line between “cannot do” and “can do.” The technical argument is based on the concept of item information, which has its basis in item response theory (e.g., see Hambleton, Swami- nathan, & Rogers, 1993). Informally speaking, the item information at a particular scale point represents the degree to which the item can discrimi- nate between individuals just below the point from individuals just above the point. One argument in favor of RP-50 (e.g., Kolstad et al., 1998) is that item information is maximized when the probability of success is .5.
This is true, however, only when no guessing can take place. For multiple- choice items, success probabilities always exceed .5 at the point of maxi- mum information. Under the three- parameter logistic (3PL) model used in NAEP scaling, the probability of success at the maximum information point depends only on the item’s guessing parameter, c-the probabil- ity of guessing the correct answer for a test-taker of very low ability. When this probability is .25-certainly a re- alistic value-the probability of cor- rect response at the point of maximum information is ~ 8 . ~ In any case, al- though psychometricians may find it appealing to select a response prob- ability criterion based on maximum in- formation, there is no assurance that this choice will yield the most useful or interpretable results. In 1999, the National Center for Education Statis- tics reviewed the issue and decided not to attempt to impose a uniform RP-value on the NCES-sponsored as- sessments that make use of mapping methods.6
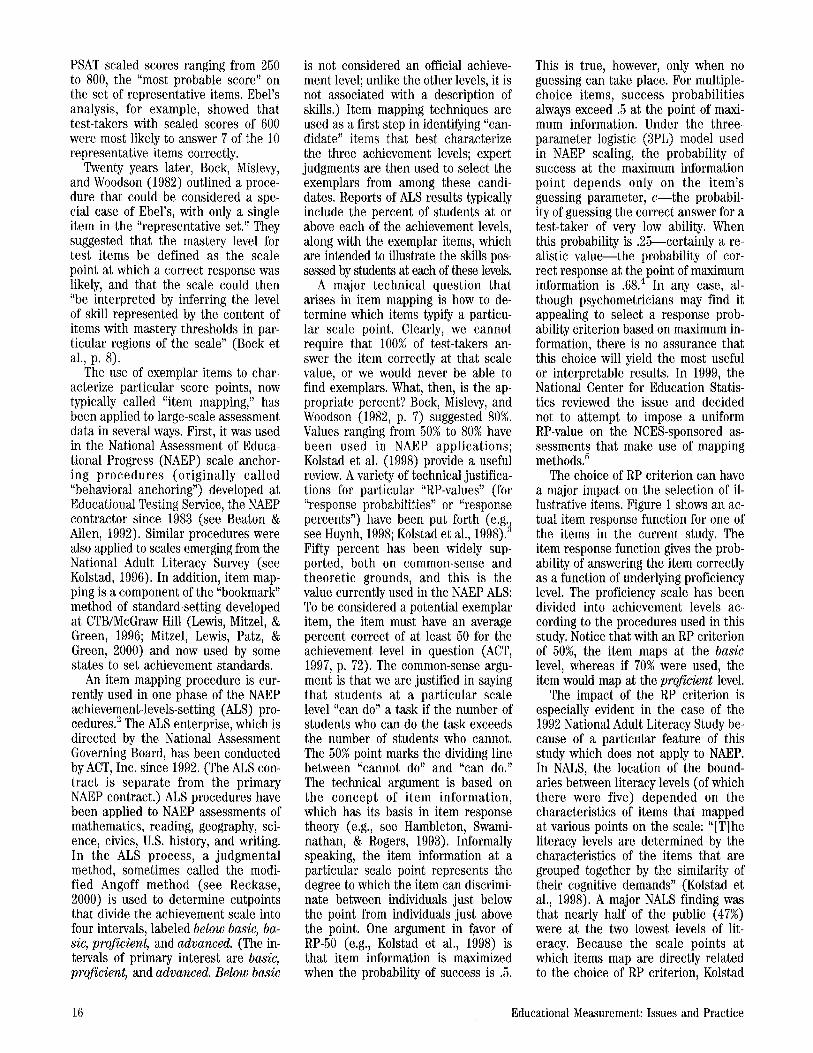
The choice of RP criterion can have a major impact on the selection of il- lustrative items. Figure l shows an ac- tual item response function for one of the items in the current study. The item response function gives the prob- ability of answering the item correctly as a function of underlying proficiency level. The proficiency scale has been divided into achievement levels ac- cording to the procedures used in this study. Notice that with an RP criterion of 50%, the item maps at the basic level, whereas if 70% were used, the item would map at the proficient level.
The impact of the RP criterion is especially evident in the case of the 1992 National Adult Literacy Study be- cause of a particular feature of this study which does not apply to NAEP. In NALS, the location of the bound- aries between literacy levels (of which there were five) depended on the characteristics of items that mapped at various points on the scale: “[Tlhe literacy levels are determined by the characteristics of the items that are grouped together by the similarity of their cognitive demands” (Kolstad et al., 1998). A major NALS finding was that nearly half of the public (47%) were at the two lowest levels of lit- eracy. Because the scale points at which items map are directly related to the choice of RP criterion, Kolstad
16 Educational Measurement: Issues and Practice
x I
n I ” Below Basic Basic Proficient Advanced
FIGURE 1 . Illustration of the influence of RP criterion on mapping results.
(1996) was able to demonstrate the effect of varying the criterion on the boundaries between levels, and ulti- mately on the percent of Americans found to be at each literacy level. If RP-SO had been substituted for RP-80, which was used in the actual study, only 22% of the American public would have been found to be at the two low- est levels.
Overview of the Current Study The study described here grew out of an ACT recommendation to the Na- tional Assessment Governing Board that a systematic study of mapping methods be conducted which would include a mail survey of experts in the subject area of the assessment (ACT, 1997). To implement this recommen- dation, which included few specifics, we proposed to compare various meth- ods of item mapping, focusing on those that had been applied or recom- mended in the past. Three criteria would be used: First, the various meth- ods were to be evaluated in terms of the degree to which the results were supported by expert judgments about item difficulty. Where applicable, we also investigated the consistency of the results over different random
samples and over NAEP “plausible val- ues” (see below). Clearly, more stable methods are preferable. Finally, to merit further consideration, a map- ping method would need to produce a reasonable number of exemplar items for each achievement level.
The study consisted of four phases, detailed in subsequent sections: Data Acquisition and Preparation:
We selected and obtained a NAEP data set to use for the comparison of mapping methods and prepared the data for the item mapping analyses.
Mapping Analyses: We applied the competing methods of item map- ping to the data, and then analyzed the results.
Survey Development and Administra- tion: In parallel with the mapping analyses, we developed and piloted the expert survey, and mailed it to 170 individuals with expertise in the sciences.
Analysis of Survey Findings: Finally, we analyzed the survey data and ex- amined the association between the expert responses and the mapping results. We then considered the im- plications of our findings for the se- lection of item mapping methods.
Data Acquisition and Preparation The demands of the study imposed certain requirements on the data. First, a large proportion of the items had to be ‘Lreleased” so that they could be included in the mail survey in which experts would be asked about their perceptions of the difficulty of the items. This constraint eliminated many sets of NAEP items, most of which are required by law to remain undisclosed. The second requirement was that the data be associated with a single unidimensional scale. Some NAEP scales are derived by forming a composite from several subscales, but mapping items onto a composite scale introduces complications that could have clouded the results of this study (see Donoghue, 1996, 1997). A final criterion for the data set was that item parameter estimates, which are needed for some of the mapping meth- ods, had to be available. We deter- mined through consultation with ETS, NAEP’s primary contractor, that the best data for our purposes were the item responses from the Grade 8 Physical Science subscale of the 1990 science assessment. This subscale has 38 items, 34 of which are released. Al- though the Physical Science subscale was combined with other subscales to form a science composite scale, item parameter estimates and student data were available for the subscale itself.
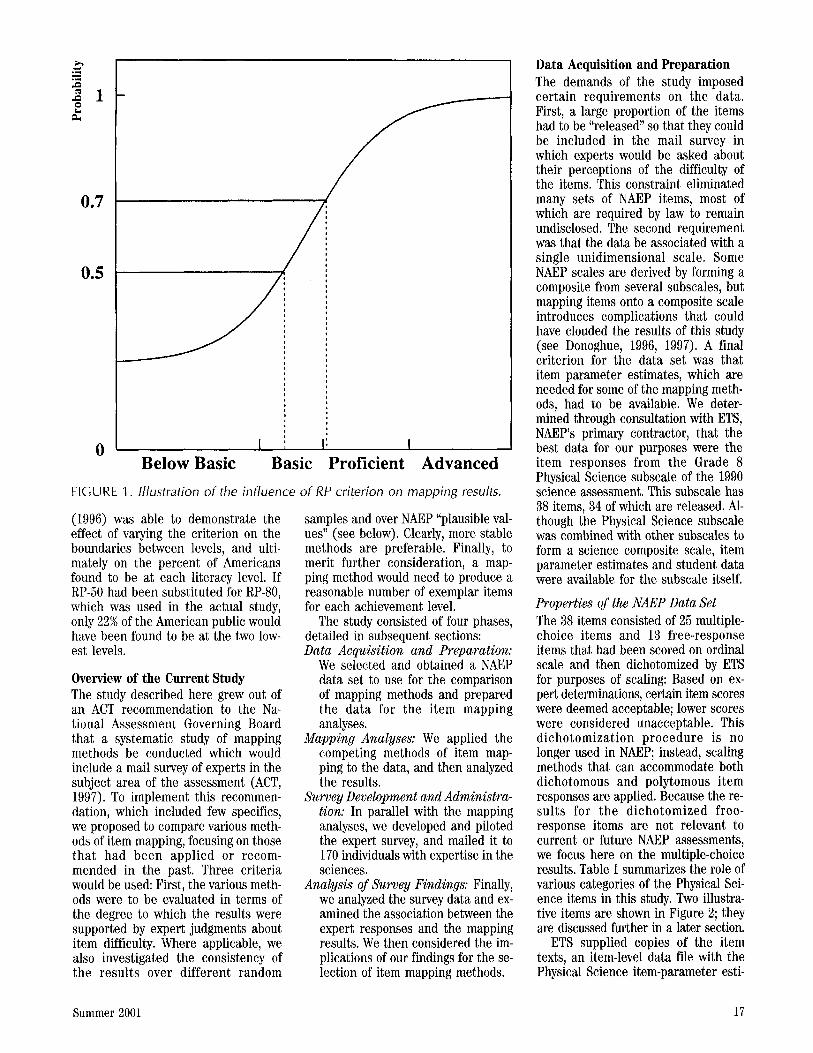
Properties of the NAEP Data Set The 38 items consisted of 25 multiple- choice items and 13 free-response items that had been scored on ordinal scale and then dichotomized by ETS for purposes of scaling: Based on ex- pert determinations, certain item scores were deemed acceptable; lower scores were considered unacceptable. This dichotomization procedure is no longer used in NAEP; instead, scaling methods that can accommodate both dichotomous and polytomous item responses are applied. Because the re- sults for the dichotomized free- response items are not relevant to current or future NAEP assessments, we focus here on the multiple-choice results. Table 1 summarizes the role of various categories of the Physical Sci- ence items in this study. Two illustra- tive items are shown in Figure 2; they are discussed further in a later section.
ETS supplied copies of the item texts, an item-level data file with the Physical Science item-parameter esti-
Summer 2001 17
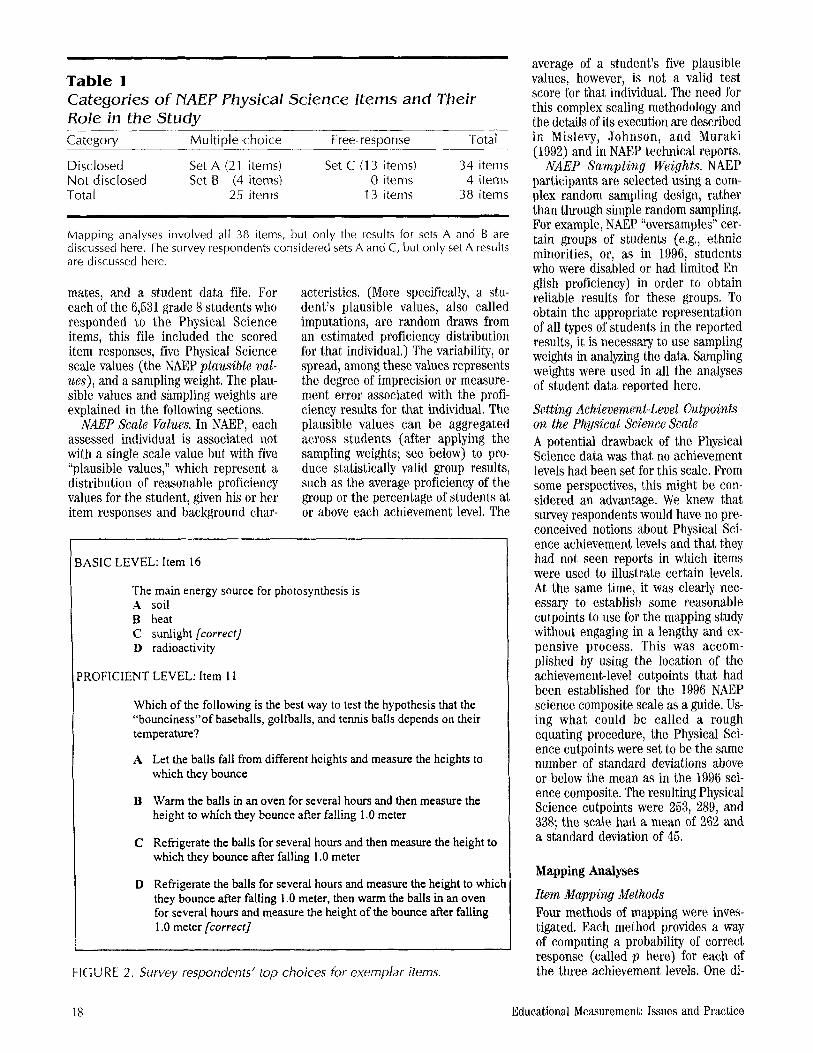
Table 1 Categories of PIAEP Physical Science Kerns and Their Role in the Study
BASIC LEVEL: Item I6
Category Mu I ti ple-c hoice Free-response Total
Disc I osed Set A (21 items) Set C (1 3 items) 34 items Not disclosed Set B (4 items) 0 items 4 items Total 25 items 13 items 38 items
B Warm the balls in an oven for several hours and then measure the height to which they bounce after falling 1.0 meter
C Refrigerate the balls for several hours and then measure the height to which they bounce after falling 1 .O meter
D Refrigerate the balls for several hours and measure the height to whicl they bounce after falling 1.0 meter, then warm the balls in an oven for several hours and measure the height of the bounce after falling
I
Mapping analyses involved all 38 items, but only the results for sets A and B are discussed here. The survey respondents considered sets A and C, but only set A results are discussed here.
mates, and a student data file. For each of the 6,531 grade 8 students who responded to the Physical Science items, this file included the scored item responses, five Physical Science scale values (the NAEP plausible val- ues), and a sampling weight. The plau- sible values and sampling weights are explained in the following sections.
N M P Scale Values. In NAEP, each assessed individual is associated not with a single scale value but with five “plausible values,” which represent a distribution of reasonable proficiency values for the student, given his or her item responses and background char-
acteristics. (More specifically, a stu- dent’s plausible values, also called imputations, are random draws from an estimated proficiency distribution for that individual.) The variability, or spread, among these values represents the degree of imprecision or measure- ment error associated with the profi- ciency results for that individual. The plausible values can be aggregated across students (after applying the sampling weights; see below) to pro- duce statistically valid group results, such as the average proficiency of the group or the percentage of students at or above each achievement level. The
The main energy source for photosynthesis is A soil B heat C sunlight (correct] D radioactivity
PROFICIENT LEVEL: Item 1 I
Which of the following is the best way to test the hypothesis that the “bounciness”of baseballs, golfballs, and tennis balls depends on their temperature?
A Let the balls fall from different heights and measure the heights to which they bounce
-
1 .O meter [correct] I FIGURE 2. Survey respondents’ top choices for exeinpiar items.
average of a student’s five plausible values, however, is not a valid test score for that individual. The need for this complex scaling methodology and the details of its execution are described in Mislevy, Johnson, and Muraki (1992) and in NAEP technical reports.
NAEP Sampling Weights. NAEP participants are selected using a com- plex random sampling design, rather than through simple random sampling. For example, NAEP “oversamples” cer- tain groups of students (e.g., ethnic minorities, or, as in 1996, students who were disabled or had limited En- glish proficiency) in order to obtain reliable results for these groups. To obtain the appropriate representation of all types of students in the reported results, it is necessary to use sampling weights in analyzing the data. Sampling weights were used in all the analyses of student data reported here.
Setting Achievement-Level Cutpoints on the Physical Science Scale A potential drawback of the Physical Science data was that no achievement levels had been set for this scale. From some perspectives, this might be con- sidered an advantage. We knew that survey respondents would have no pre- conceived notions about Physical Sci- ence achievement levels and that they had not seen reports in which items were used to illustrate certain levels. At the same time, it was clearly nec- essary to establish some reasonable cutpoints to use for the mapping study without engaging in a lengthy and ex- pensive process. This was accom- plished by using the location of the achievement-level cutpoints that had been established for the 1996 NAEP science composite scale as a guide. Us- ing what could be called a rough equating procedure, the Physical Sci- ence cutpoints were set to be the same number of standard deviations above or below the mean as in the 1996 sci- ence composite. The resulting Physical Science cutpoints were 253, 289, and 338, the scale had a mean of 262 and a standard deviation of 45.
Mapping Analyses
Item Mapping Methods Four methods of mapping were inves- tigated. Each method provides a way of computing a probability of correct response (called p here) for each of the three achievement levels. One di-
18 Educational Measurement: Issues and Practice
mension on which the four methods differed was whether the computation of t h e p values depended on the item response theory (IRT) model used to scale the items. The two “model” methods were based on the 3PL IRT model used in NAEP, whereas the two “empirical” methods did not rely on the IRT model. The model and empiri- cal methods correspond roughly to the “smoothing” and “direct” methods, respectively, described by Beaton and Allen (1992). Both of these ap- proaches have been used in NAEP scale anchoring.
The methods also differed in terms of whether the estimate of p was based on an entire achievement level interval or a point. In the two “inter- val” methods, the probability of cor- rect response was estimated for the entire interval corresponding to the achievement level; the “midpoint” methods used calculations based on the interval midpoint.
The four methods obtained by “crossing” these two factors are de- scribed in more detail below.
1. Model Interval Method. This is the approach that is currently used by ACT in its ALS procedures (ACT, 1997, page 72). The IRT model used in the NAEP scaling is relied upon to give the probability of correct response as a function of proficiency for each item. The item parameter estimates ob- tained by ETS in scaling the items are used. The model-based probability cor- rect is numerically integrated (aver- aged) over the entire achievement level, using a normal approximation to the proficiency distribution, as follows:
sI’p(x = l(O)f(0)d0
where P(x = 110) is the 3PL item re- sponse function, 0 represents profi- ciency, L and U are the lower and upper bounds of the achievement level, andf(0) is the normal distribu- tion with mean and variance that cor- respond to the NAEP proficiency scale.
2. Model Midpoint Method. We ex- plored the possibility of using an alter- native to the Model Interval Method which avoided the complexities of nu- merical integration and did not involve a normality assumption. Instead of av- eraging over the entire achievement level, this alternative approach makes
use of the model-based probability of correct response at the interval mid- point:
p = P(x = 110 = midpoint). We included the midpoint approach to see if it might function well as a sim- pler alternative to the interval ap- proachS6 (Model-based probabilities of correct response were used to anchor selected points on the 1984 NAEP reading scale.)
3. Empirical Interval Method. In this approach, p was defined as the proportion of correct item responses for all individuals whose plausible val- ues fell within the achievement level. (Only one plausible value per student was used. As described below, the pro- cess was later repeated with a second plausible value to assess measurement error.)
4. Empirical Midpoint Method. In this method, a very narrow interval around the midpoint was defined, and the proportion of correct item re- sponses for all individuals whose plau- sible values fell within this interval was obtained. ETS used a similar ap- proach to anchor selected points on NAEP scales for assessments occur- ring after 1984. Following the ETS precedent, we used an interval extend- ing from 12.5 scale points below the midpoint to 12.5 points above (Beaton & Allen, 1992, p, 195). Like method 3, method 4 was applied using one plau- sible value, and later repeated with a second.
Other Factors Studied in the Mapping Analgses In addition to considering the four mapping methods, we also examined the effects of varying the RP criterion and of incorporating an item discrimi- nation criterion. In addition, we inves- tigated the effects of sampling error and measurement error on the empiri- cal methods. Each of these analysis components is described below.
RP Criterion. The RP criterion is the percent correct that is required in order for the item to serve as an exemplar item. For multiple-choice items, we investigated three RP values: RP-50, RP-65, and RP-74. The RP-50 and RP-65 levels have been re- searched extensively (e.g., Kolstad, 1998) and RP-65 and RP-74 have both been used by ETS for scale anchoring. RP-50 is currently used in the NAEP ALS process.
Discrimination Criterion. In some item mapping efforts, including the NAEP ALS, it is considered desirable to insure that, not only can most students at the point or interval of in- terest respond correctly, but most stu- dents at lower proficiency levels cannot. To achieve this, a discrimina- tion criterion, as well as an RP crite- rion, is imposed.
In the ACT procedures, the item discrimination at a particular achieve- ment level is defined as the difference between the item’s p value for that achievement level and its p value for next lowest level. For example, if an item has a p of .6 at the proficient level (for a particular mapping method) and a p of .3 at the basic level, its discrimination at the proficient level is .6 - .3 = .3. An item therefore has three discrimination values per map- ping method. (Obtaining discrimina- tion values for the basic level requires that below basic be treated as an achievement level. Then the p for below basic is subtracted from thep for basic.)
To meet the ACT discrimination cri- terion at a particular achievement level, an item must have a discrimina- tion value that is at or above the 60th percentile of the distribution (across items) of discrimination values at that achievement level (ACT, 1997, page 72).7 (ETS scale anchoring procedures used somewhat different discrimi- ation criteria; see Beaton & Allen, 1992.) In this study, we evaluated the effect of using the ACT discrimination criterion versus the effect of imposing no discrimination criterion. It is im- portant to note that an item’s discrimi- nation values vary across mapping methods because the values of p differ across methods. When no discrimination criterion is used, all items that meet the RP criterion qualify as exemplars.
Efects of Measurement Error and Sampling Error on Empirical Meth- ods. For the two empirical mapping methods, we investigated the effects of measurement error and sampling er- ror by varying the respondents and plausible values included in the analy- sis. To investigate the effects of sam- pling error, we split the sample into two random halves; analyses were con- ducted on each half-sample, and the difference in results ascertained. To assess the effect of measurement error in the NAEP proficiency values, we analyzed each of the half-samples twice-once with one plausible value,
Summer 2001 19
once with another, and then compared the results. Thus, each application of one of the empirical mapping meth- ods involved four analyses-two half- samples by two plausible values. The model-based mapping methods do not vary over half-samples or plausible val- ues because they do not depend di- rectly on student data.
Overview of Mapping Analyses For each of the items in the study, the mapping analyses produced two types of data: Item p-value data consist of the item’sp values for each of the four mapping methods at each of the three achievement levels, computed as de- scribed earlier. M a p h o map data consist of binary variables indicating whether the item mapped. A value of 0 or 1 is assigned for each combination of achievement level, RP criterion, dis- crimination condition, and mapping method. For example, suppose we were considering the results at the ba- sic level for RP-65, with no discrimi- nation criterion. If a particular item’s estimated probability of correct re- sponse from the Empirical Midpoint method were .6, we would conclude that the item did not map, and a value of 0 would be assigned. A single appli- cation of each mapping method can produce map/no map results for all three RP criteria, yielding lists of items that map at each of the three RP values for that method. Application of the discrimination criterion does not have implications for the implementa- tion of the mapping methods; this cri- terion can be imposed afterward when compiling lists of items that satisfy various mapping criteria. Therefore, one application of the four mapping methods yields 24 sets of mapho map results at each of the three achieve- ment levels (4 mapping methods x 3 RP values x 2 discrimination condi- tions = 24).
The two types of item data resulting from the application of the mapping methods were subjected to further analyses to answer key research ques- tions:
1. The map/no map data were ex- amined to determine the num- ber of items mapping at each achievement level and to deter- mine the degree of agreement between the mapping methods.
2. Analyses of variance (ANOVAs) were applied to the item p-value data to determine which proper-
ties of the mapping methods in- fluence the resulting p values.
3. Additional ANOVAs were applied to the itemp-value data from the empirical mapping methods to study the impact of measure- ment error and sampling error on the mapping results.
Results of Mapping Analgses First, the analyses of the mapho map data are presented, followed by the analyses of the item p-value data.
Number of Items Mapping a t Each Achievement Level. For each combina- tion of mapping method, RP value, and discrimination condition, we imposed the following rule, which is consistent with ACT procedures: Items that met the mapping criterion at a particular achievement level, including below ba- sic, were not “allowed” to map at higher levels. This rule implies that (for a particular combination of meth- od, RP value, and discrimination con- dition) an item cannot map at more than one achievement level.
For every combination of mapping methods and mapping criteria, at least three multiple-choice items mapped at each of the three achievement levels. Of course, more items tended to map when the discrimination criterion was not implemented (‘(off’) than when it was imposed (“on”). It is interesting that the number of items mapping at RP-65 was, with one exception, at least as large as the number of items map- ping at RP-50. In addition, at the proficient and advanced levels, the number of items mapping at RP-74 was always at least as large as the number mapping at RP-50. This seems counterintuitive, because the RP-50 criterion is the least stringent. But, following the rule outlined above, items withp 2 .50 at the below basic or basic levels could not map at RP-50 at the proficient or advanced levels; this eliminated several items from contention.
Agreement Among Mapping Meth- ods. Analyses of the mapho map data were conducted to determine the degree of agreement between the mapping approaches. For each achievement level, RP criterion, dis- crimination condition, and mapping method, every item received a code of 1 if it mapped and 0 if it did not. Then the correlations over items of these codes were obtained for each pair of mapping approaches at each achieve-
ment level. This very large number of correlations produced only one strik- ing finding: The results for the Model Interval and Model Midpoint methods were nearly identical. In fact, when the discrimination criterion was used, agreement between these two meth- ods was perfect on all 25 multiple- choice items for all three RP criteria and all three achievement levels (a total of nine comparisons). With dis- crimination “off,” there was disagree- ment on one item in one of the nine comparisons (RP-65 at the basic level). This near-perfect agreement between the two methods is significant because the Model Midpoint method is much simpler to apply, does not involve nu- merical integration, and does not re- quire a normality assumption.
ANOVAs of Item p-Value Data. At every achievement level, each item has a p value for each mapping method and, within the empirical methods, for each half-sample and NAEP plausible value. Which proper- ties of the mapping methods influence these p values? This question was ad- dressed by conducting a series of re- peated measures ANOVAs on the logits of the i temp values.’ In these analy- ses, the items constituted the “sub- jects;” the set of logit@) values associated with each item constituted the set of observations for that item. Tables 2A and 2B each give the results of three ANOVAs-one for each of the three achievement levels. The table entries are the percents of within-item va.riability in the logit@) values that are attributable to each factor.’
Factors Affecting Item p Values a t Each Achievement Level. Table 2A shows the results of ANOVAs based on the four mapping methods: Model In- terval, Model Midpoint, Empirical In- terval, and Empirical Midpoint. (For the empirical methods, the observa- tions used in these ANOVAs consisted of the logit@) values for just one half- sample and one plausible value.) Most effects were small, with one exception: Model-based methods and empirical methods tended to produce different results at the proficient level, ac- counting for 11% of the within-item variability. The meanp for the model- based methods was .75, compared to .73 for the empirical methods. It is not clear why the model approaches tended to produce higher mean p val- ues or why this occurred only at the proficient level. One possibility is that
20 Educational Measurement: Issues and Practice
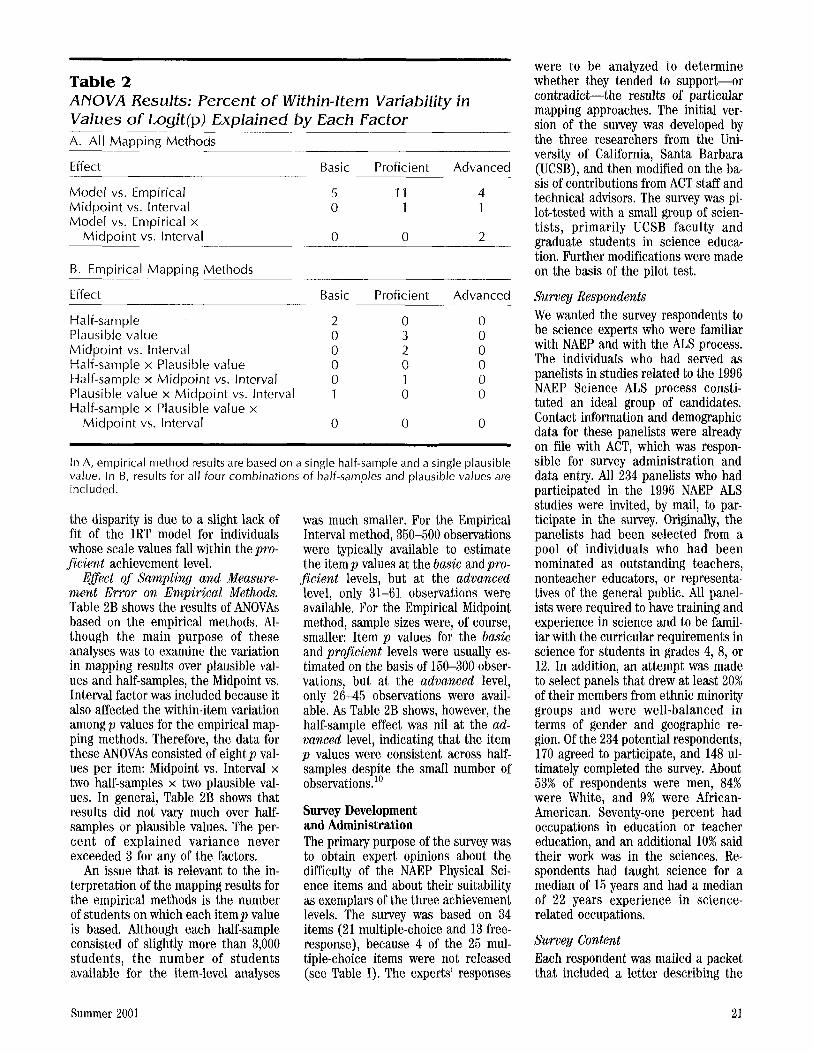
Table 2 ANOVA Results: Percent of Within-ltem Variability in Values of Logit(p) Explained b y Each Factor A. All Mapping Methods
Effect Basic Proficient Advanced
Model vs. Empirical Midpoint vs. Interval Model vs. Empirical x
Midpoint vs. Interval
5 11 4 0 1 1
0 0 2
B. Empirical Mapping Methods
Effect Basic Proficient Advanced
Ha I f-Sam p I e 2 0 0 Plausible value 0 3 0 Midpoint vs. Interval 0 2 0 Half-sample x Plausible value 0 0 0 Half-sample x Midpoint vs. Interval 0 1 0 Plausible value x Midpoint vs. Interval 1 0 0
Midpoint vs. Interval 0 0 0 Half-sample x Plausible value x
In A, empirical method results are based on a single half-sample and a single plausible value. In 6 . results for all four combinations of half-samples and plausible values are included.
the disparity is due to a slight lack of fit of the IRT model for individuals whose scale values fall within thepro- ficient achievement level.
Effect of Sampling and Measure- ment Error on Empirical Methods. Table 2B shows the results of ANOVAs based on the empirical methods. Al- though the main purpose of these analyses was to examine the variation in mapping results over plausible val- ues and half-samples, the Midpoint vs. Interval factor was included because it also affected the within-item variation amongp values for the empirical map- ping methods. Therefore, the data for these ANOVAs consisted of eight p val- ues per item: Midpoint vs. Interval x two half-samples x two plausible val- ues. In general, Table 2B shows that results did not vary much over half- samples or plausible values. The per- cent of explained variance never exceeded 3 for any of the factors.
An issue that is relevant to the in- terpretation of the mapping results for the empirical methods is the number of students on which each itemp value is based. Although each half-sample consisted of slightly more than 3,000 students, the number of students available for the item-level analyses
was much smaller. For the Empirical Interval method, 350-500 observations were typically available to estimate the itemp values at the basic andpro-
ficient levels, but at the advanced level, only 31-61 observations were available. For the Empirical Midpoint method, sample sizes were, of course, smaller: Item p values for the basic and proficient levels were usually es- timated on the basis of 150-300 obser- vations, but at the advanced level, only 26-45 observations were avail- able. As Table 2B shows, however, the half-sample effect was nil at the ad- vanced level, indicating that the item p values were consistent across half- samples despite the small number of observations."
Survey Development and Administration The primary purpose of the survey was to obtain expert opinions about the difficulty of the NAEP Physical Sci- ence items and about their suitability as exemplars of the three achievement levels. The survey was based on 34 items (21 multiple-choice and 13 free- response), because 4 of the 25 mul- tiple-choice items were not released (see Table I). The experts' responses
were to be analyzed to determine whether they tended to support-or contradict-the results of particular mapping approaches. The initial ver- sion of the survey was developed by the three researchers from the Uni- versity of California, Santa Barbara (UCSB), and then modified on the ba- sis of contributions from ACT staff and technical advisors. The survey was pi- lot-tested with a small group of scien- tists, primarily UCSB faculty and graduate students in science educa- tion. Further modifications were made on the basis of the pilot test.
Surveg Respondents We wanted the survey respondents to be science experts who were familiar with NAEP and with the ALS process. The individuals who had served as panelists in studies related to the 1996 NAEP Science ALS process consti- tuted an ideal group of candidates. Contact information and demographic data for these panelists were already on file with ACT, which was respon- sible for survey administration and data entry. All 234 panelists who had participated in the 1996 NAEP ALS studies were invited, by mail, to par- ticipate in the survey. Originally, the panelists had been selected from a pool of individuals who had been nominated as outstanding teachers, nonteacher educators, or representa- tives of the general public. All panel- ists were required to have training and experience in science and to be famil- iar with the curricular requirements in science for students in grades 4, 8, or 12. In addition, an attempt was made to select panels that drew at least 20% of their members from ethnic minority groups and were well-balanced in terms of gender and geographic re- gion. Of the 234 potential respondents, 170 agreed to participate, and 148 ul- timately completed the survey. About 53% of respondents were men, 84% were White, and 9% were African- American. Seventy-one percent had occupations in education or teacher education, and an additional 10% said their work was in the sciences. Re- spondents had taught science for a median of 15 years and had a median of 22 years experience in science- related occupations.
Survey Content Each respondent was mailed a packet that included a letter describing the
Summer 2001 21
project and offering telephone assistance, a survey and stamped return envelope, and a set of 34 cards on which the NAEP items and response choices were re- produced. The correct response ap- peared on the reverse side of the card.
The survey consisted of three main sections. In part I, respondents were asked to categorize the 34 NAEP items by difficulty. Specifically, they were asked to list the five easiest and the five hardest items (without providing any difficulty order within the sets of five). As described further in the see- tion on data analysis, this is, in effect, a partial ranking task: The respon- dents provide incomplete information about their difficulty rankings of the items. We decided against asking the respondents to rank all 34 items after the UCSB research team undertook this task and found it extremely ardu- ous and time-consuming.
In part 11, respondents were asked to indicate which, if any, of the three NAEP achievement levels each of the 34 items appeared to exemplify. If re- spondents did not think the item would be a good exemplar for any of the three levels, they had the option of stating that the item was below basic (i.e., too easy to qualify as a basic ex- emplar) or simply indicating that the item was “not a good example.” Be- cause no achievement levels had been established for the NAEP Physical Sci- ence assessment, respondents were pro- vided with the “generic” achievement level descriptions developed by the National Assessment Governing Board: Basic: This level denotes partial mas-
tery of prerequisite knowledge and skills that are fundamental for pro- ficient work at each grade.
Proficient: This level represents solid academic performance for each grade assessed. Students reaching this level have demonstrated com- petency over challenging subject matter, including subject-matter knowledge, application of such knowledge to realworld situations, and analytical skills appropriate to the subject matter.
Advanced: This level signifies superior performance beyond proficient. In part 111, respondents answered
questions about how they interpreted published statements indicating that students “can do” a particular kind of test item. Details on this portion of the survey are given in the data analysis section below.
22
Analysis of Survey Findings Expert D@%ulty Rankings As described above, respondents pro- vided only a partial ranking of item difficulty. They listed the five easiest and five most difficult items (with no ordering within these groups). Follow- ing the standard procedure for rank- based analysis methods, mid-ranks were assigned to ties. This means that, for each respondent, the five easiest items received the average of the ranks 1-5 (i.e., 3), the five hardest items received the average of the ranks 30-34 (i.e., 32), and the remain- ing 24 items received the average of the ranks 6-29 (i.e., 17.5). Despite this very coarse ranking system, with only three levels, the average rank of the items (over the 148 experts) had a Spearman correlation of -.65 with the proportions of eighth graders answer- ing the items correctly in the NAEP assessment, suggesting that the ex- perts’ rankings were substantially in line with the actual difficulty of the items. (The correlation is negative be- cause, for the proportions correct, lower numbers are associated with more difficult items, while for these rankings, the reverse was true.) Concordance Between Expert Rankings and Map/No Map Results If there is consistency between the ex- pert judgments and the analytically obtained mapping results, we should find that items identified as exemplars for the basic level are ranked as less
difficult than items identified as exem- plars for the proficient level, and that proficient exemplars are ranked as less difficult than advanced exem- plars. This is not a very stringent condition; it might be considered nec- essary but not sufficient for accep- tance of a mapping procedure. Results of the mapping methods were evalu- ated to determine how well they met this condition. For each combination of mapping methods (4), RP criteria (3), and discrimination conditions (a), average ranks were computed for each achievement level, and for below basic.
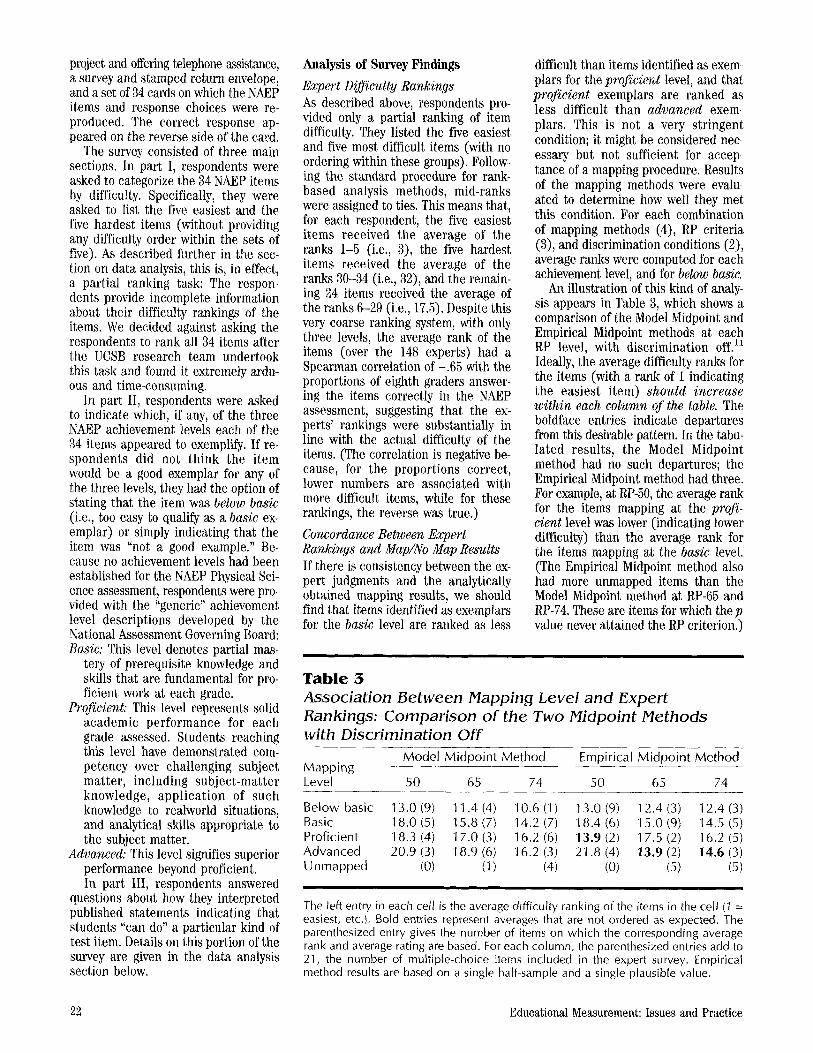
An illustration of this kind of analy- sis appears in Table 3, which shows a comparison of the Model Midpoint and Empirical Midpoint methods at each RP level, with discrimination off.” Ideally, the average difficulty ranks for the items (with a rank of 1 indicating the easiest item) should increase within each column of the table. The boldface entries indicate departures from this desirable pattern. In the tabu- lated results, the Model Midpoint method had no such departures; the Empirical Midpoint method had three. For example, at RP-50, the average rank for the items mapping at the profi- cient level was lower (indicating lower difficulty) than the average rank for the items mapping at the basic level. (The Empirical Midpoint method also had more unmapped items than the Model Midpoint method at RP-65 and RP-74. These are items for which thep value never attained the RP criterion.)
~~ ~~~
Table 3 Association Between Mapping Level and Expert Rankings: Comparison of the Two Midpoint Methods with Discrimination Off _________
Mode l Midpoint Method Empirical Midpoint Me thod Mapp ing Level 50 65 74 50 65 74
Below basic 13.0 (9) 11.4 (4) 10.6 (1 ) 13.0 (9) 12.4 (3) 12.4 (3) Basic 18.0 (5) 15.8 (7) 14.2 (7) 18.4 (6) 15.0 (9) 14.5 (5) Proficient 18.3 (4) 17.0 (3) 16.2 (6) 13.9 (2) 17.5 (2) 16.2 (5) Advanced 20.9 (3 ) 18.9 (6) 16.2 (3 ) 21.8 (4) 13.9 (2) 14.6 (3) U n mapped (0) (1 1 (4) (0) (5) (5)
The left entry in each cell is the average difficulty ranking of the items in the cell (1 = easiest, etc.). Bold entries represent averages that are not ordered as expected. The parenthesized entry gives the number of items on which the corresponding average rank and average rating are based. For each column, the parenthesized entries add to 21, the number of multiple-choice items included in the expert survey. Empirical method results are based on a single half-sample and a single plausible value.
Educational Measurement: Issues and Practice
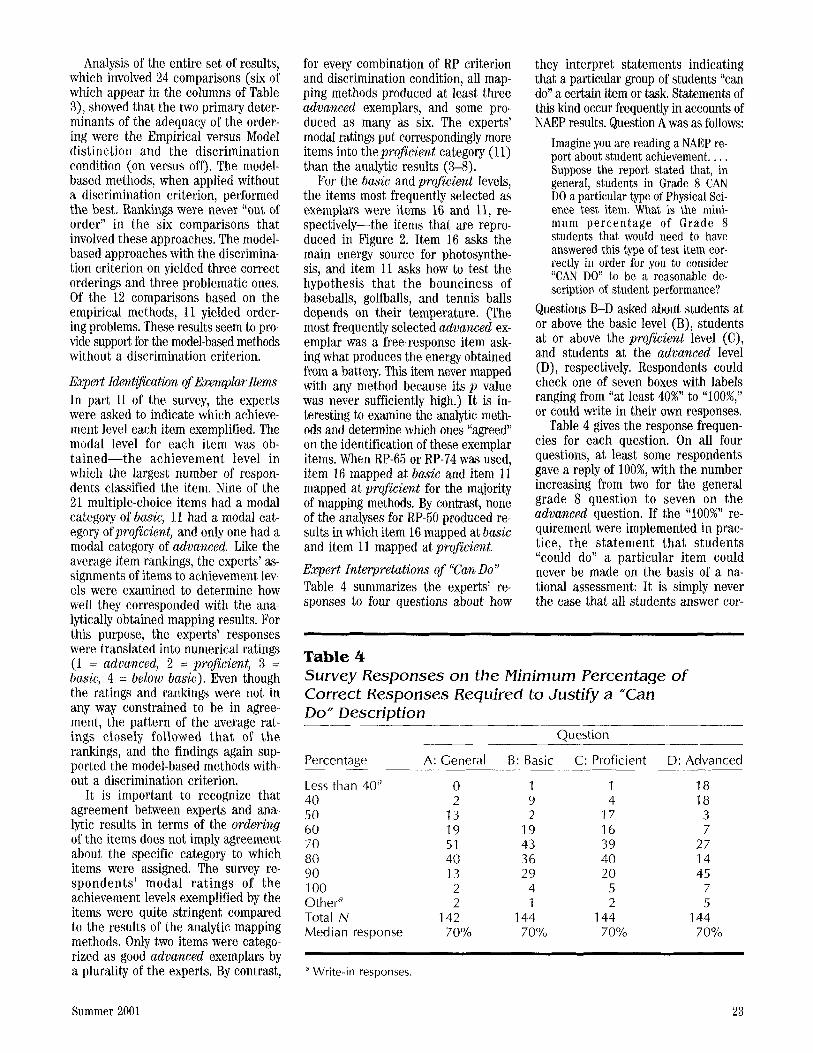
Analysis of the entire set of results, which involved 24 comparisons (six of which appear in the columns of Table 3), showed that the two primary deter- minants of the adequacy of the order- ing were the Empirical versus Model distinction and the discrimination condition (on versus off). The model- based methods, when applied without a discrimination criterion, performed the best. Rankings weye never “out of order” in the six comparisons that involved these approaches. The model- based approaches with the discrimina- tion criterion on yielded three correct orderings and three problematic ones. Of the 12 comparisons based on the empirical methods, 11 yielded order- ing problems. These results seem to pro- vide support for the model-based methods without a discrimination criterion.
Expert Identfkatkm of Exmplar Iteins In part I1 of the survey, the experts were asked to indicate which achieve- ment level each item exemplified. The modal level for each item was ob- tained-the achievement level in which the largest number of respon- dents classified the item. Nine of the 21 multiple-choice items had a modal category of basic, 11 had a modal cat- egory of proficient, and only one had a modal category of advanced. Like the average item rankings, the experts’ as- signments of items to achievement lev- els were examined to determine how well they corresponded with the ana- lytically obtained mapping results. For this purpose, the experts’ responses were translated into numerical ratings (1 = advnnced, 2 = proficient, 3 = hasic, 4 = below basic). Even though the ratings and rankings were not in any way constrained to be in agree- ment, the pattern of the average rat- ings closely followed that of the rankings, and the findings again sup- ported the model-based methods with- out a discrimination criterion.
It is important to recognize that agreement between experts and ana- lytic results in terms of the ordering of the items does not imply agreement about the specific category to which items were assigned. The survey re- spondents’ modal ratings of the achievement levels exemplified by the items were quite stringent compared to the results of the analytic mapping methods. Only two items were catego- rized as good advanced exemplars by a plurality of the experts. By contrast,
Summer 2001
for every combination of RP criterion and discrimination condition, all map- ping methods produced at least three advanced exemplars, and some pro- duced as many as six. The experts’ modal ratings put correspondingly more items into the proficient category (1 1) than the analytic results (3-8).
For the basic and proficient levels, the items most frequently selected as exemplars were items 16 and 11, re- spectively-the items that are repro- duced in Figure 2. Item 16 asks the main energy source for photosynthe- sis, and item 11 asks how to test the hypothesis that the bounciness of baseballs, golfballs, and tennis balls depends on their temperature. (The most frequently selected advanced ex- emplar was a free-response item ask- ing what produces the energy obtained from a battery. This item never mapped with any method because its p value was never sufficiently high.) It is in- teresting to examine the analytic meth- ods and determine which ones “agreed” on the identification of these exemplar items. When RP-65 or RP-74 was used, item 16 mapped at basic and item 11 mapped at proficient for the majority of mapping methods. By contrast, none of the analyses for RP-50 produced re- sults in which item 16 mapped at basic and item 11 mapped at proficient. E q e r t Interpretations of “Can Do” Table 4 summarizes the experts’ re- sponses to four questions about how
they interpret statements indicating that a particular group of students “can do’’ a certain item or task. Statements of this kind occur frequently in accounts of NAEP results. Question A was as follows:
Imagine you are reading a NAEP re- port about student achievement. , . , Suppose the report stated that, in general, students in Grade 8 CAN DO a particular type of Physical Sci- ence test item. What is the mini- mum p e r c e n t a g e of Grade 8 students that would need to have answered this type of test item cor- rectly in order for you to consider “CAN DO” to be a reasonable de- scription of student performance?
Questions B-D asked about students at or above the basic level (B), students at or above the proficient level (C), and students at the advanced level (D), respectively. Respondents could check one of seven boxes with labels ranging from “at least 40%” to “100%,” or could write in their own responses.
Table 4 gives the response frequen- cies for each question. On all four questions, at least some respondents gave a reply of loo%, with the number increasing from two for the general grade 8 question to seven on the advanced question. If the “100%” re- quirement were implemented in prac- tice, the statement that students “could do” a particular item could never be made on the basis of a na- tional assessment: It is simply never the case that all students answer cor-
Table 4 Survey Responses on the Minimum Percentage of Correct Responses Required to Justify a “Can Do” Description
Question
Percentage A: General B: Basic C: Proficient D: Advanced
Less than 40” 40 50 60 70 80 90 100 Other“ Total N Median response
0 2
13 19 51 40 13
2 2
142 70%
1 9 2
19 43 36 29 4 1
144 7 0 O/o
1 4
17 16 39 40 20
5 2
144 70%
18 18
3 7
27 14 45
7 5
144 70%
~
Write-in responses.
23
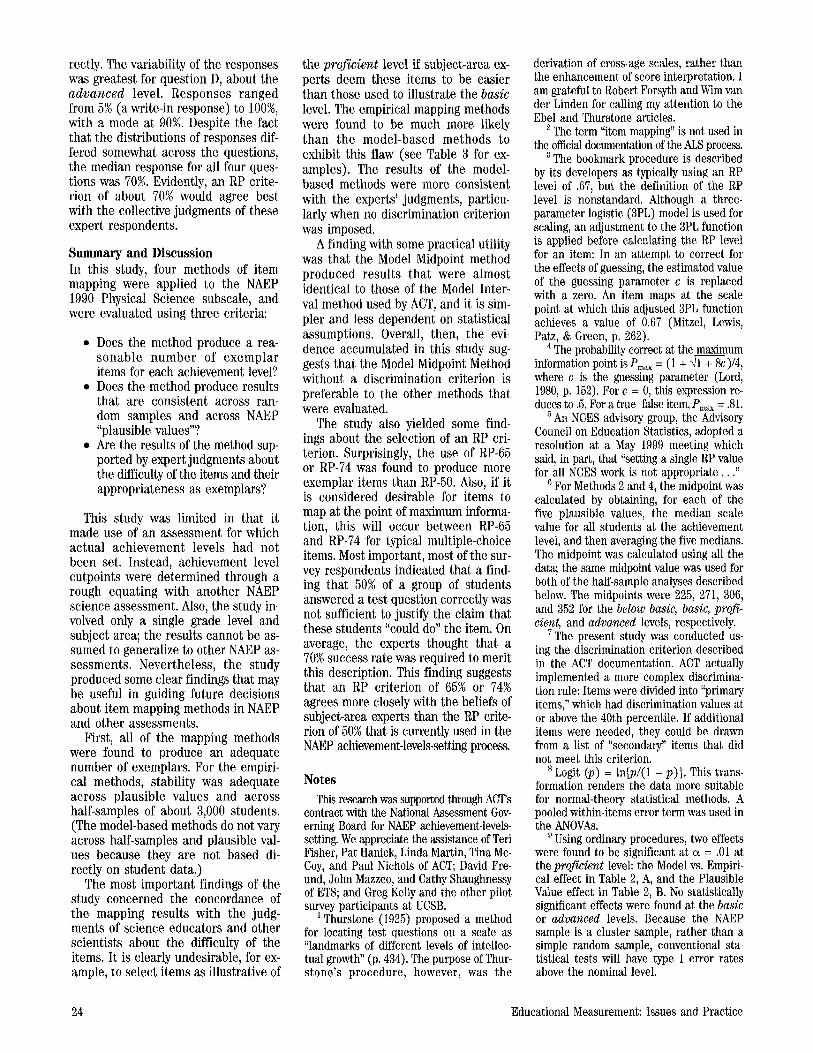
rectly. The variability of the responses was greatest for question D, about the advanced level. Responses ranged from 5% (a write-in response) to loo%, with a mode at 90%. Despite the fact that the distributions of responses dif- fered somewhat across the questions, the median response for all four ques- tions was 70%. Evidently, an RP crite- rion of about 70% would agree best with the collective judgments of these expert respondents.
Summary and Discussion In this study, four methods of item mapping were applied to the NAEP 1990 Physical Science subscale, and were evaluated using three criteria:
Does the method produce a rea- sonable number of exemplar items for each achievement level? Does the method produce results that are consistent across ran- dom samples and across NAEP “plausible values”? Are the results of the method sup- ported by expert judgments about the difficulty of the items and their appropriateness as exemplars?
This study was limited in that it made use of an assessment for which actual achievement levels had not been set. Instead, achievement level cutpoints were determined through a rough equating with another NAEP science assessment. Also, the study in- volved only a single grade level and subject area; the results cannot be as- sumed to generalize to other NAEP as- sessments. Nevertheless, the study produced some clear findings that may be useful in guiding future decisions about item mapping methods in NAEP and other assessments.
First, all of the mapping methods were found to produce an adequate number of exemplars. For the empiri- cal methods, stability was adequate across plausible values and across half-samples of about 3,000 students. (The model-based methods do not vary across half-samples and plausible val- ues because they are not based di- rectly on student data.)
The most important findings of the study concerned the concordance of the mapping results with the judg- ments of science educators and other scientists about the difficulty of the items. It is clearly undesirable, for ex- ample, to select items as illustrative of
the proficient level if subject-area ex- perts deem these items to be easier than those used to illustrate the basic level. The empirical mapping methods were found to be much more likely than the model-based methods to exhibit this flaw (see Table 3 for ex- amples). The results of the model- based methods were more consistent with the experts’ judgments, particu- larly when no discrimination criterion was imposed.
A finding with some practical utility was that the Model Midpoint method produced results that were almost identical to those of the Model Inter- val method used by ACT, and it is sim- pler and less dependent on statistical assumptions. Overall, then, the evi- dence accumulated in this study sug- gests that the Model Midpoint Method without a discrimination criterion is preferable to the other methods that were evaluated.
The study also yielded some find- ings about the selection of an RP cri- terion. Surprisingly, the use of RP-65 or RP-74 was found to produce more exemplar items than RP-50. Also, if it is considered desirable for items to map at the point of maximum informa- tion, this will occur between RP-65 and RP-74 for typical multiple-choice items. Most important, most of the sur- vey respondents indicated that a find- ing that 50% of a group of students answered a test question correctly was not sufficient to justify the claim that these students “could do” the item. On average, the experts thought that a 70% success rate was required to merit this description. This finding suggests that an RP criterion of 65% or 74% agrees more closely with the beliefs of subject-area experts than the RP crite- rion of 50% that is currently used in the NAEP achievement-levels-setting process.
Notes This research was supported through ACT’S
contract with the National Assessment Gov- erning Board for NAEP achievement-levels- setting. We appreciate the assistance of Teri Fisher, Pat Hanick, Linda Martin, Tina Mc- Coy, and Paul Nichols of ACT; David Fre- und, John Mazzeo, and Cathy Shaughnessy of ETS; and Greg Kelly and the other pilot survey participants at UCSB.
I Thurstone (1925) proposed a method for locating test questions on a scale as “landmarks of different levels of intellec- tual growth” (p. 434). The purpose of Thur- stone’s procedure, however, was the
derivation of cross-age scales, rather than the enhancement of score interpretation. I am grateful to Robert Forsyth and Wim van der Linden for calling my attention to the Ebel and Thurstone articles.
The term “item mapping” is not used in the official documentation of the ALS process.
The bookmark procedure is described by its developers as typically using an RP level of -67, but the definition of the RP level is nonstandard. Although a three- parameter logistic (3PL) model is used for scaling, an adjustment to the 3PL function is applied before calculating the RP level for an item: In an attempt to correct for the effects of guessing, the estimated value of the guessing parameter c is replaced with a zero. An item maps at the scale point at which this adjusted 3PL function achieves a value of 0.67 (Mitzel, Lewis, Patz, & Green, p. 262).
The probability correct at the maximum information point is P,, = (1 + l i l ) / 4 , where c is the guessing parameter (Lord, 1980, p. 152). For c = 0, this expression re- duces to .5. For a truefalse item, p,, = 31. ‘ An NCES advisory group, the Advisory Council on Education Statistics, adopted a resolution at a May 1999 meeting which said, in part, that “setting a single RP value for all NCES work is not appropriate. . .’I
For Methods 2 and 4, the midpoint was calculated by obtaining, for each of the five plausible values, the median scale value for all students at the achievement level, and then averaging the five medians. The midpoint was calculated using all the data; the same midpoint value was used for both of the half-sample analyses described below. The midpoints were 225, 271, 306, and 352 for the below basic, basic, prof- cient, and advanced levels, respectively.
The present study was conducted us- ing the discrimination criterion described in the ACT documentation. ACT actually implemented a more complex discrimina- tion rule: Items were divided into “primary items,” which had discrimination values at or above the 40th percentile. If additional items were needed, they could be drawn from a list of “secondary” items that did not meet this criterion.
* Logit (p) = ln[p/(l - p ) ] . This trans- formation renders the data more suitable for normal-theory statistical methods. A pooled within-items error term was used in the ANOVAs. ’ Using ordinary procedures, two effects were found to be significant at a = .01 at the proficient level: the Model vs. Empiri- cal effect in Table 2, A, and the Plausible Value effect in Table 2, B. No statistically significant effects were found at the basic or advanced levels. Because the NAEP sample is a cluster sample, rather than a simple random sample, conventional sta- tistical tests will have type I error rates above the nominal level.
24 Educational Measurement: Issues and Practice
lo Beaton and Allen (1992, p. 197) also found good agreement across half-samples for an empirical mapping method in which item p values were estimated using indi- viduals with plausible values within 12.5 scale points of the value of interest.
l 1 The Empirical Midpoint results are based on a single half-sample and a single plausible value.
References Advisory Council on Education Statistics.
(May, 1999). Statistics Committee Re- port, Statistics Committee Meeting, Washington DC, May 20-21, 1999.
ACT. (December 1997). Developing Achievement Levels on the 1998 NAEP Civics and Writing. Design Document. Iowa City: Author.
Beaton, A. E., & Allen, N. L. (1992). Inter- preting scales through scale anchoring. Journal of Educational Statistics, 17
Bock, R. D., Mislevy, R. J., & Woodson, C. E. M. (1982). The next stage in edu- cational assessment. Educational Re- searcher, 11(2), 4-11, 16.
Donoghue, J. R. (1996, April). Issues in item mapping: m e maximum category information criterion and item map- ping procedures for a composite scale. Paper presented at the annual meeting of the American Educational Research Association, Chicago.
Donoghue, J. R. (1997, March). Item map- ping to a weighted composite scale. Pa-
191-204.
per presented at the annual meeting of the American Educational Research As- sociation, Chicago.
Ebel, R. L. (1962). Content standard test scores. Educational and Psychological Measurement, 22, 15-25.
Forsyth, R.A. (1991). Do NAEP scales yield valid criterion-referenced inter- pretations? Educational Measurement: Issues and Practice, 10(3), 3-9, 16.
Hambleton, R. K., & Slater, S. (1994). Are NAEP Executive Summary Reports Un- derstandable to Policy Makers and Edu- cators? (Final report). Washington, DC: National Center for Education Statistics.
Hambleton, R. K., Swaminathan, H., & Rog- ers, H. J. (1993). Fundamentals of item response theory Newbury Park, CA Sage.
Huynh, H. (1998). On score locations of binary and partial credit items and their applications to item mapping and crite- rion-referenced interpretation. Journal of Educational and Behavioral Statis-
Jaeger, R. M. (1998). Reporting the results of the National Assessment of Educa- tional Progress (NAEP Validity Studies report series). Palo Alto: American In- stitutes for Research.
Kolstad, A. (1996, April). The response probability convention embedded in reporting prose literacy levels from the 1992 National Adult Literacy Survey. Paper presented at the annual meeting of the American Educational Research Association, Chicago.
tics, 23, 35-56.
Kolstad, A,, Cohen, J., Baldi, S., Chan, T., DeFur, E., & Angeles, J. (1998, May 6). The response probability convention used in reporting data from IRT assess- ment scales: Should NCES adopt a standard? Report prepared for the Na- tional Center for Education Statistics, Washington, DC.
Lewis, D. M., Mitzel, H. C., & Green, D. R. (1996, June). Standard setting: A book- mark approach. Paper presented at the CCSSO national conference on Large- Scale Assessment, Phoenix.
Lord, F. M. (1980). Applications of item response theory to practical testing problems. Hillsdale, NJ: Lawrence Erl- baum Associates.
Mislevy, R. J., Johnson, E. G., & Muraki, E. (1992). Scaling procedures in NAEP. Journal of Educational Statistics, 1 <
Mitzel, H. C., Lewis, D. M., Patz, R. J., & Green, D.R. (2001). The bookmark method: Psychological perspectives. In Cizek, G. J. (Ed.), Setting Performance Standards: Concepts, Methods, and Perspectives (pp. 249-281). Mahwah, NJ: Lawrence Erlbaum Associates.
Reckase, M. D. (2000, June). The evolution of the NAEP achievement levels setting process: A summary of the research and development efforts conducted by ACT Iowa City: ACT, Inc.
Thurstone, L. L. (1925). A method of scal- ing psychological and educational tests. The Journal of Educational Pt.s2/chol-
131-154.
ogy, 16, 433-451.
Call for Nominations-NCME Website Editor
NCME seeks nominations for the position of Website editor. The Website is intended to disseminate information about NCME and its activities, and to serve as a resource and a means of communication for NCME members. The editor’s primary role is to continue development of the site and to determine what materials to post, within the framework of NCME policy. This includes screening submissions from NCME members and posting information at the request of the Board. In addition, the Website editor implements special projects, which may be initiated by the Board or by the editor. For example, a depository for NCME conference presentations and a software “bulletin board” have recently been initiated on the site. The editor is assisted by an editorial board that he or she appoints, and receives guidance from the NCME Publications Committee and the NCME Board. The Website editor position requires editorial skills, Web skills, initiative, and creativity. The term for the editor is three years, beginning no later than January 2002. NCME provides funds to support the operation and maintenance of the Website. By July 15, 2001, please relay nominations, including information about the nominee’s qualifications, to Rebecca Zwick, Chair, NCME Publications Committee, Department of Education, University of California at Santa Barbara, Santa Barbara CA 93 106-9490, or send email to [email protected].
Summer 2001 25