A novel approach to fog/low stratus detection using Meteosat 8 data
●
nrd●
●
S
6oO
r“tiiitatd●
(aaCaab�7mRc●
ait
0d
Comparison of Retinal Nerve Fiber LayerThickness and Optic Disk Algorithms withOptical Coherence Tomography to Detect
Glaucoma
ANITA MANASSAKORN, MD, KOUROS NOURI-MAHDAVI, MD,
AND JOSEPH CAPRIOLI, MDp©
SdaIsOihprrnhqgatst(Mt
A
C
F
t
PURPOSE: To compare the performance of the retinalerve fiber layer (RNFL) thickness and optic disk algo-ithms as determined by optical coherence tomography toetect glaucoma.DESIGN: Observational cross-sectional study.METHODS: SETTING: Academic tertiary-care center.
TUDY POPULATION: One eye from 42 control subjects and5 patients with open-angle glaucoma with visual acuityf >20/40, and no other ocular pathologic condition.BSERVATION PROCEDURES: Two optical coherence tomog-aphy algorithms were used: “fast RNFL thickness” andfast optic disk.” MAIN OUTCOME MEASURES: Area underhe receiver operating characteristic curves and sensitiv-ties at fixed specificities were used. Discriminating abil-ty of the average RNFL thickness and RNFL thicknessn clock-hour sectors and quadrants was compared withhe parameters that were derived from the fast optic disklgorithm. Classification and regression trees were usedo determine the best combination of parameters for theetection of glaucoma.RESULTS: The average visual field mean deviation
�SD) was 0.0 � 1.3 and �5.3 � 5.0 dB in the controlnd glaucoma groups, respectively. The RNFL thicknesst the 7 o’clock sector, inferior quadrant, and the vertical/D ratio had the highest area under the receiver oper-
ting characteristic curves (0.93 � 0.02, 0.92 � 0.03,nd 0.90 � 0.03, respectively). At 90% specificity, theest sensitivities (�SE) from each algorithm were 86%
3% for RNFL thickness at the 7 o’clock sector and9% � 4% for horizontal integrated rim width (esti-ated rim area). The combination of inferior quadrantNFL thickness and vertical C/D ratio achieved the best
lassification (misclassification rate, 6.2%).CONCLUSION: The fast optic disk algorithm performs
s well as the fast RNFL thickness algorithm for discrim-nation of glaucoma from normal eyes. A combination of
he two algorithms may provide enhanced diagnosticIe
© 2006 BY ELSEVIER INC. A002-9394/06/$32.00oi:10.1016/j.ajo.2005.08.023
erformance. (Am J Ophthalmol 2006;141:105–115.2006 by Elsevier Inc. All rights reserved.)
UBJECTIVE EVALUATION OF THE OPTIC DISK AND
retinal nerve fiber layer (RNFL) is the currentstandard for detection of early and internal structural
amage in glaucoma. However, this subjective approach isssociated with high intra- and interobserver variability.1
n recent years, new imaging techniques for detection oftructural damage in glaucoma have been introduced.ptical coherence tomography (OCT), one of the prom-
sing technologies, uses near-infrared light to produceigh-resolution cross-sectional images of the retina androvides quantitative measurements. Various OCT algo-ithms have been used for evaluation of the optic nerve andetina.2–4 For detection of glaucoma, the fast RNFL thick-ess5–15 and the fast optic disk algorithms of StratusOCT14–17
ave been explored recently. Both algorithms generateuantitative data that are amenable to statistical andraphic analyses. However, there is limited informationvailable regarding the comparative performance of thewo algorithms to detect glaucoma.14,15 The purpose of thistudy was to compare the performance of the fast RNFLhickness and the fast optic disk algorithms of the OCTmodel 3000, StratusOCT; software version 3.0; Carl Zeisseditec Inc, Dublin, California) for the detection of early
o moderate glaucoma.
ccepted for publication Aug 5, 2005.From the Glaucoma Division, Jules Stein Eye Institute, University of
alifornia Los Angeles, Los Angeles, California.Presented as a poster at the annual meeting of ARVO, May 1–5, 2005,
ort Lauderdale, Florida.Supported by a grant from “Research to Prevent Blindness” and from
he National Institutes of Health R01 EY12738.Inquiries to Joseph Caprioli, MD, Glaucoma Division, Jules Stein Eye
nstitute, 100 Stein Plaza, Los Angeles, CA 90095; fax: 310-206-7773;-mail: [email protected]
LL RIGHTS RESERVED. 105

T
dUiacpecvateHOnvpe
polmcoSvffitdctafidrto
hfp3sgetmalAa
oCptwcelsq
Fgtatpsndhdplcdm
1
MATERIAL AND METHODS
HIS OBSERVATIONAL CROSS-SECTIONAL STUDY WAS CON-
ucted at the Glaucoma Division, Jules Stein Eye Institute,niversity of California at Los Angeles. The University’s
nstitutional review board approved this investigation, andll participants gave their approval and signed an informedonsent form to participate in the study. Eligible partici-ants were recruited from a clinical database or werenrolled prospectively. Patients with glaucoma and theontrol group met the following criteria: age �40 years,isual acuity �20/40, spheric refractive error between �6nd �6 diopters (D), astigmatism �3 diopters, and in-raocular pressure �8 mm Hg at the time of the OCTxamination. Eligible eyes had a SITA-standard 24 to 2umphrey visual field available within 6 months of theCT measurement. Patients who had other intraocular oreurologic diseases that affected the RNFL, optic disk orisual field, secondary causes for increased intraocularressure, and nonglaucomatous disk abnormalities werexcluded.
The control group was recruited from university staff,atient spouses, and volunteers. They had no history ofcular symptoms or diseases and no previous incisional oraser surgery. All participants had normal anterior seg-ents on slit-lamp biomicroscopy, open angles on gonios-
opy, normal posterior segments by indirectphthalmoscopy at the slit-lamp, and reliable normalITA-standard 24 to 2 Humphrey visual fields. A reliableisual field was defined as one with �30% fixation loss,alse-positive, and false-negative responses. A normal visualeld was defined as a visual field with a glaucoma hemifieldest result within normal limits and a pattern standardeviation with a probability value of �5%. All glaucomaases had open-angle glaucoma (primary high- or low-ension glaucoma, exfoliative or pigmentary glaucoma)nd had reliable abnormal Humphrey visual fields con-rmed at least once. A glaucomatous visual field defect wasefined as a visual field with a glaucoma hemifield testesult outside normal limit and a pattern standard devia-ion with probability value of �5% confirmed on at leastne visual field.OCT was used to image the RNFL and the optic nerve
ead (ONH). Imaging with the two algorithms was per-ormed at the same session by an experienced ophthalmichotographer. For the fast RNFL thickness protocol, three.4-mm diameter circular scans were acquired over 1.92econds. A good quality image was defined as an image witheneralized signal distribution, a reflectance signal fromither RNFL or retinal pigment epithelium strong enougho identify either layer, and no missing parts caused by eyeovement. The segmentation line that defines the upper
nd lower border of the RNFL must be on the internalimiting membrane and lower border of the RNFL. The-scan value and signal-to-noise ratio are provided on the
nalysis printout. Images with �90% satisfactory A-scan d
AMERICAN JOURNAL OF06
r a signal-to-noise ratio of �25 dB were excluded.18
omparison to an age-matched normative database iserformed automatically by the OCT and provides quan-itative, color-coded data. The OCT RNFL thickness dataere exported to a personal computer. Left eye data areonverted automatically into right eye format during thexport procedure. The following parameters were calcu-ated: average RNFL thickness, RNFL thickness in theuperior and inferior hemifields, RNFL thickness in fouruadrants (superior: 46 to 135 degrees; nasal: 136 to 225
IGURE 1. The fast optic disk algorithm orientation andraphic output display. A, Orientation of the six linear scans ofhe individual radial scan analyses from the fast optic disklgorithm of optical coherence tomography. B, An example ofhe graphic output display of the fast optic disk algorithm. Fivearameters are derived from each of the six individual radialcan analyses: rim area (area above the line dividing theeuroretinal rim and the cup to the anterior surface of the opticisk: red-hashed area, [A]); average nerve width at disk (theeight of the nerve fiber bundle: straight yellow line [B]); diskiameter (the distance between the inner edges of the retinaligment epithelium: straight blue line [C]); cup diameter (theength of the line that connects the outermost borders of theup at the level of 150 �m above the disk reference line:ashed, straight red line [D]); and rim length (disk diameterinus the cup diameter [E]).
egrees; inferior: 226 to 315 degrees, and temporal: 316 to
OPHTHALMOLOGY JANUARY 2006
4c
lttlleftppdriFfiatm
O(aheaAttopitlpaoemw
V
5 degrees), and RNFL thickness in twelve 30-degreelock hour sectors.
The fast optic disk algorithm performs six 4-mm radialinear scans in 1.92 seconds (Figure 1A). For each scan,he A-scan detects the anterior surface of the RNFL andhe retinal pigment epithelium (retinal pigment epithe-ium). Then, the boundary of the optic disk (disk referenceine) is defined as the inner edge of the retinal pigmentpithelium and used as the reference to calculate all theast optic disk parameters. A line located 150 �m abovehe level of the retinal pigment epithelium and runningarallel to the line that connects the edge of the retinaligment epithelium on the two sides of the disk isefined as the dividing line between the neuroretinalim and the cup. There are two output displays, thendividual radial scan analysis and the ONH analysis.rom the individual radial scan analysis, the followingve parameters are evaluated (Figure 1B): rim area,verage nerve width at disk, disk diameter, cup diame-er, and rim length. The OCT uses the aforementioned
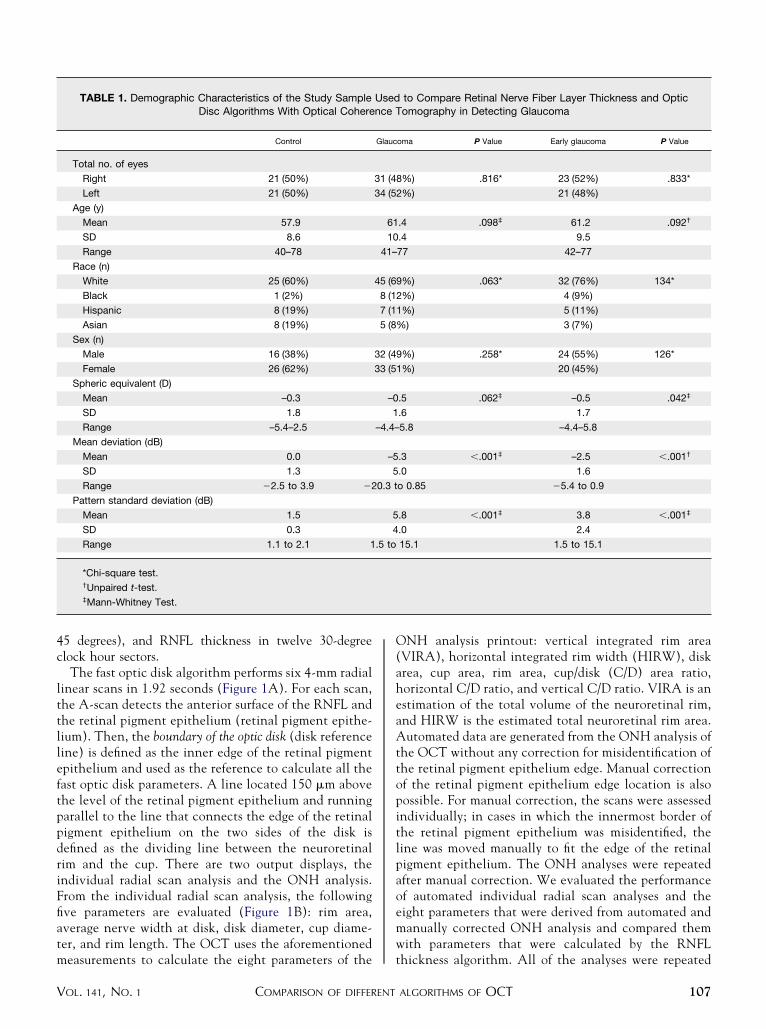
TABLE 1. Demographic Characteristics of the Study SampleDisc Algorithms With Optical Cohere
Control
Total no. of eyes
Right 21 (50%)
Left 21 (50%)
Age (y)
Mean 57.9
SD 8.6
Range 40–78
Race (n)
White 25 (60%)
Black 1 (2%)
Hispanic 8 (19%)
Asian 8 (19%)
Sex (n)
Male 16 (38%)
Female 26 (62%)
Spheric equivalent (D)
Mean –0.3
SD 1.8
Range –5.4–2.5
Mean deviation (dB)
Mean 0.0
SD 1.3
Range �2.5 to 3.9 �2
Pattern standard deviation (dB)
Mean 1.5
SD 0.3
Range 1.1 to 2.1 1
*Chi-square test.†Unpaired t-test.‡Mann-Whitney Test.
easurements to calculate the eight parameters of the t
COMPARISON OF DIFFERENTOL. 141, NO. 1
NH analysis printout: vertical integrated rim areaVIRA), horizontal integrated rim width (HIRW), diskrea, cup area, rim area, cup/disk (C/D) area ratio,orizontal C/D ratio, and vertical C/D ratio. VIRA is anstimation of the total volume of the neuroretinal rim,nd HIRW is the estimated total neuroretinal rim area.utomated data are generated from the ONH analysis of
he OCT without any correction for misidentification ofhe retinal pigment epithelium edge. Manual correctionf the retinal pigment epithelium edge location is alsoossible. For manual correction, the scans were assessedndividually; in cases in which the innermost border ofhe retinal pigment epithelium was misidentified, theine was moved manually to fit the edge of the retinaligment epithelium. The ONH analyses were repeatedfter manual correction. We evaluated the performancef automated individual radial scan analyses and theight parameters that were derived from automated andanually corrected ONH analysis and compared themith parameters that were calculated by the RNFL
to Compare Retinal Nerve Fiber Layer Thickness and Opticomography in Detecting Glaucoma
oma P Value Early glaucoma P Value
%) .816* 23 (52%) .833*
%) 21 (48%)
.4 .098‡ 61.2 .092†
.4 9.5
77 42–77
%) .063* 32 (76%) 134*
%) 4 (9%)
%) 5 (11%)
) 3 (7%)
%) .258* 24 (55%) 126*
%) 20 (45%)
.5 .062‡ –0.5 .042‡
.6 1.7
5.8 –4.4–5.8
.3 �.001‡ –2.5 �.001†
.0 1.6
o 0.85 �5.4 to 0.9
.8 �.001‡ 3.8 �.001‡
.0 2.4
15.1 1.5 to 15.1
Usednce T
Glauc
31 (48
34 (52
61
10
41–
45 (69
8 (12
7 (11
5 (8%
32 (49
33 (51
–0
1
–4.4–
–5
5
0.3 t
5
4
.5 to
hickness algorithm. All of the analyses were repeated
ALGORITHMS OF OCT 107

f(
tgsm
m(cctt
1
or a subset of glaucomatous eyes with early glaucomamean deviation, ��6.0 dB).
Unpaired Student t test, chi–square, or Mann-Whitneyests were used to compare the glaucoma and normalroups. Receiver operating characteristic curves and sen-itivities and specificities were used to compare the perfor-
TABLE 2. Comparison of Results of the Fast Retinal NerveBetween Normal Patients
Variable Control (mean
Average RNFL thickness (microns) 98.2 (� 1
RNFL thickness at clock hour sectors (microns)
1 112.5 (� 4
2 87.2 (� 3
3 56.3 (� 2
4 66.8 (� 2
5 102.0 (� 3
6 135.6 (� 3
7 143.7 (� 2
8 78.5 (� 2
9 55.6 (� 1
10 84.4 (� 2
11 130.3 (� 3
12 125.4 (� 4
RNFL thickness in hemifields (microns)
Superior 99.7 (� 1
Inferior 96.5 (� 1
RNFL thickness in quadrants (microns)
Superior 122.8 (� 2
Inferior 127.4 (� 2
Temporal 69.4 (� 2
Nasal 73.6 (� 2
Fast optic disc (automated)
VIRA (mm3)* 0.43 (� 0
HIRW (mm2)† 1.68 (� 0
Disc area (mm2) 2.27 (� 0
Cup area (mm2) 0.67 (� 0
Rim area (mm2) 1.60 (� 0
C/D area ratio 0.29 (� 0
Horizontal C/D ratio 0.55 (� 0
Vertical C/D ratio 0.48 (� 0
Fast optic disc (manual)
VIRA (mm3) 0.41 (� 0
HIRW (mm2) 1.65 (� 0
Disc area (mm2) 2.00 (� 0
Cup area (mm2) 0.59 (� 0
Rim area (mm2) 1.40 (� 0
C/D area ratio 0.28 (� 0
Horizontal C/D ratio 0.54 (� 0
Vertical C/D ratio 0.49 (� 0
HIRW � Horizontal integrated rim width (an estimation of the total
of the total volume of the RNFL tissue in the rim).
*Unpaired t-test.†Mann-Whitney test.
ance of the two algorithms and to assess the multivariate a
AMERICAN JOURNAL OF08
odels. We used classification and regression treesCART) methods (software version 3.1; SPSS Inc, Chi-ago, Illinois) for determining the optimal parsimoniousombination of parameters from both algorithms that havehe highest performance for discrimination of glaucoma-ous from normal eyes. Logistic regression or discriminant
r Layer (RNFL) Thickness and Fast Optic Disc AlgorithmsPatients With Glaucoma
Glaucoma Early Glaucoma
Mean (� SE) P Value Mean (� SE) P Value
73.0 (� 2.1) �.001* 76.6 (� 2.3) �.001*
82.8 (� 3.4) �.001* 82.4 (� 4.3) �.001*
72.5 (� 2.9) .002* 73.8 (� 3.7) .011*
53.4 (� 1.8) .281† 53.7 (� 2.2) .360†
59.5 (� 2.1) .047† 60.9 (� 2.6) .131†
74.7 (� 3.0) �.001* 77.2 (� 3.1) �.001*
87.9 (� 3.7) �.001† 95.6 (� 4.3) �.001*
88.7 (� 3.9) �.001† 99.9 (� 4.2) �.001*
56.9 (� 2.3) �.001* 61.9 (� 2.9) �.001*
48.5 (� 1.8) �.001† 49.7 (� 2.1) .029*
65.1 (� 3.2) �.001* 69.1 (� 3.3) .001*
91.0 (� 4.3) �.001† 98.1 (� 4.9) �.001*
94.5 (� 4.1) �.001* 96.6 (� 5.2) �.001*
76.6 (� 2.6) �.001* 79.1 (� 3.0) �.001*
69.2 (� 2.0) �.001* 73.9 (� 2.1) �.001*
89.5 (� 3.4) �.001† 92.4 (� 4.2) �.001*
84.0 (� 3.1) �.001* 91.3 (� 3.2) �.001*
61.7 (� 2.0) .022† 62.6 (� 2.6) .070*
56.7 (� 2.2) �.001† 60.1 (� 2.4) �.001*
0.15 (� 0.02) �.001† 0.16 (� 0.02) �.001†
1.23 (� 0.04) �.001* 1.27 (� 0.04) �.001*
2.38 (� 0.06) .243* 2.32 (� 0.07) .620*
1.37 (� 0.07) �.001† 1.29 (� 0.08) �.001†
1.01 (� 0.05) �.001† 1.03 (� 0.06) �.001*
0.57 (� 0.02) �.001† 0.55 (� 0.03) �.001*
0.77 (� 0.02) �.001† 0.76 (� 0.02) �.001†
0.72 (� 0.02) �.001† 0.70 (� 0.02) �.001*
0.14 (� 0.02) �.001† 0.15 (� 0.02) �.001†
1.16 (� 0.04) �.001† 1.22 (� 0.04) �.001*
2.03 (� 0.05) .674† 2.04 (� 0.06) .610†
1.19 (� 0.07) �.001† 1.15 (� 0.07) �.001†
0.81 (� 0.05) �.001† 0.86 (� 0.06) �.001*
0.58 (� 0.02) �.001† 0.56 (� 0.03) �.001†
0.76 (� 0.02) �.001† 0.76 (� 0.02) �.001†
0.74 (� 0.02) �.001† 0.72 (� 0.02) �.001*
oretinal rim area); VIRA � vertical integrated rim area (an estimation
Fibeand
� SE)
.7)
.0)
.6)
.3)
.8)
.3)
.8)
.9)
.6)
.6)
.7)
.6)
.1)
.9)
.7)
.9)
.7)
.7)
.1)
.04)
.04)
.07)
.07)
.07)
.02)
.02)
.02)
.04)
.03)
.06)
.06)
.06)
.02)
.03)
.02)
neur
nalyses do not work well in this setting, because the
OPHTHALMOLOGY JANUARY 2006

nbadmoo
satlaw
he to
V
umber of correctly classified cases is so high and becauseoth models would lead to inflated odds ratios. The CARTpproach is particularly well suited for this kind of high-imensional data with relatively few cases. CART softwareakes no previous assumptions regarding the distribution
f the data or the relationship of each variable with the
TABLE 3. The Area Under the Receiver OFast Retinal Nerve Fiber Layer (RNFL) T
Entire G
Variable
Average RNFL thickness (microns)
RNFL thickness at clock hour sectors (micron
1
2
3
4
5
6
7
8
9
10
11
12
RNFL thickness in hemifields (microns)
Superior
Inferior
RNFL thickness in quadrants (microns)
Superior
Inferior
Temporal
Nasal
Fast optic disc (automated)
VIRA (mm3)*
HIRW (mm2)†
Disc area (mm2)
Cup area (mm2)
Rim area (mm2)
C/D area ratio
Horizontal C/D ratio
Vertical C/D ratio
Fast optic disc (manual)
VIRA (mm3)
HIRW (mm2)
Disc area (mm2)
Cup area (mm2)
Rim area (mm2)
C/D area ratio
Horizontal C/D ratio
Vertical C/D ratio
HIRW � Horizontal integrated rim width (an
vertical integrated rim area (an estimation of t
utcome (glaucoma or normal status in this case). CART p
COMPARISON OF DIFFERENTOL. 141, NO. 1
oftware explores each variable for the best cutoff pointnd orders the variables according to the probability valuehat is derived from the Pearson’s chi–square or theikelihood ratio, with a Bonferroni adjustment. The vari-bles are used successively to extract the best classificationith the smallest number of variables. The following
ing Curve (AUC) for All Parameters From theess and Fast Optic Disc Algorithms in thema Group
AUC � SE
Sensitivity at Fixed
Specificity (% � SE)
80% 90%
0.89 � 0.03 83 � 4 76 � 4
0.79 � 0.04 66 � 5 51 � 5
0.67 � 0.05 42 � 5 29 � 4
0.56 � 0.06 25 � 4 11 � 3
0.61 � 0.06 40 � 5 25 � 4
0.81 � 0.04 69 � 4 57 � 5
0.90 � 0.03 85 � 3 75 � 4
0.93 � 0.02 89 � 3 86 � 3
0.81 � 0.04 68 � 5 57 � 5
0.71 � 0.05 54 � 5 42 � 5
0.77 � 0.05 65 � 5 54 � 5
0.82 � 0.04 75 � 4 65 � 5
0.77 � 0.05 59 � 5 49 � 5
0.82 � 0.04 72 � 4 68 � 5
0.92 � 0.03 89 � 3 82 � 4
0.82 � 0.04 68 � 5 66 � 5
0.92 � 0.03 86 � 3 79 � 4
0.63 � 0.06 29 � 4 22 � 4
0.80 � 0.05 72 � 4 63 � 5
0.89 � 0.03 82 � 4 72 � 4
0.89 � 0.03 82 � 4 79 � 4
0.59 � 0.06 40 � 5 19 � 4
0.84 � 0.04 77 � 4 62 � 5
0.86 � 0.04 77 � 4 74 � 4
0.88 � 0.03 82 � 4 71 � 4
0.83 � 0.04 71 � 4 52 � 5
0.90 � 0.03 88 � 3 77 � 4
0.89 � 0.03 79 � 4 75 � 4
0.90 � 0.03 85 � 3 82 � 4
0.52 � 0.06 32 � 5 9 � 3
0.83 � 0.04 71 � 4 59 � 5
0.86 � 0.04 79 � 4 77 � 4
0.88 � 0.03 79 � 4 69 � 4
0.84 � 0.04 68 � 5 65 � 5
0.90 � 0.03 85 � 3 79 � 4
ation of the total neuroretinal rim area); VIRA �
tal volume of the RNFL tissue in the rim).
perathicknlauco
s)
estim
arameters from both algorithms were entered simulta-
ALGORITHMS OF OCT 109
ntffsw
cdgu
he to
1
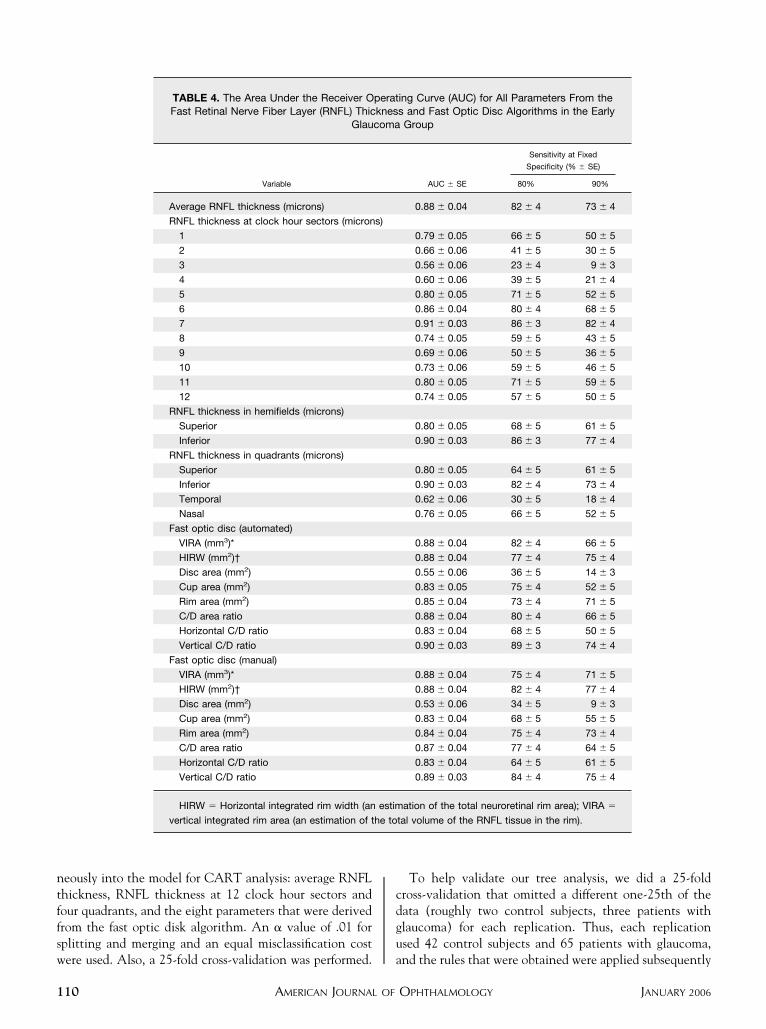
eously into the model for CART analysis: average RNFLhickness, RNFL thickness at 12 clock hour sectors andour quadrants, and the eight parameters that were derivedrom the fast optic disk algorithm. An � value of .01 forplitting and merging and an equal misclassification cost
TABLE 4. The Area Under the Receiver OFast Retinal Nerve Fiber Layer (RNFL) Thic
Glau
Variable
Average RNFL thickness (microns)
RNFL thickness at clock hour sectors (micron
1
2
3
4
5
6
7
8
9
10
11
12
RNFL thickness in hemifields (microns)
Superior
Inferior
RNFL thickness in quadrants (microns)
Superior
Inferior
Temporal
Nasal
Fast optic disc (automated)
VIRA (mm3)*
HIRW (mm2)†
Disc area (mm2)
Cup area (mm2)
Rim area (mm2)
C/D area ratio
Horizontal C/D ratio
Vertical C/D ratio
Fast optic disc (manual)
VIRA (mm3)*
HIRW (mm2)†
Disc area (mm2)
Cup area (mm2)
Rim area (mm2)
C/D area ratio
Horizontal C/D ratio
Vertical C/D ratio
HIRW � Horizontal integrated rim width (an
vertical integrated rim area (an estimation of t
ere used. Also, a 25-fold cross-validation was performed. a
AMERICAN JOURNAL OF10
To help validate our tree analysis, we did a 25-foldross-validation that omitted a different one-25th of theata (roughly two control subjects, three patients withlaucoma) for each replication. Thus, each replicationsed 42 control subjects and 65 patients with glaucoma,
ing Curve (AUC) for All Parameters From thes and Fast Optic Disc Algorithms in the EarlyGroup
AUC � SE
Sensitivity at Fixed
Specificity (% � SE)
80% 90%
0.88 � 0.04 82 � 4 73 � 4
0.79 � 0.05 66 � 5 50 � 5
0.66 � 0.06 41 � 5 30 � 5
0.56 � 0.06 23 � 4 9 � 3
0.60 � 0.06 39 � 5 21 � 4
0.80 � 0.05 71 � 5 52 � 5
0.86 � 0.04 80 � 4 68 � 5
0.91 � 0.03 86 � 3 82 � 4
0.74 � 0.05 59 � 5 43 � 5
0.69 � 0.06 50 � 5 36 � 5
0.73 � 0.06 59 � 5 46 � 5
0.80 � 0.05 71 � 5 59 � 5
0.74 � 0.05 57 � 5 50 � 5
0.80 � 0.05 68 � 5 61 � 5
0.90 � 0.03 86 � 3 77 � 4
0.80 � 0.05 64 � 5 61 � 5
0.90 � 0.03 82 � 4 73 � 4
0.62 � 0.06 30 � 5 18 � 4
0.76 � 0.05 66 � 5 52 � 5
0.88 � 0.04 82 � 4 66 � 5
0.88 � 0.04 77 � 4 75 � 4
0.55 � 0.06 36 � 5 14 � 3
0.83 � 0.05 75 � 4 52 � 5
0.85 � 0.04 73 � 4 71 � 5
0.88 � 0.04 80 � 4 66 � 5
0.83 � 0.04 68 � 5 50 � 5
0.90 � 0.03 89 � 3 74 � 4
0.88 � 0.04 75 � 4 71 � 5
0.88 � 0.04 82 � 4 77 � 4
0.53 � 0.06 34 � 5 9 � 3
0.83 � 0.04 68 � 5 55 � 5
0.84 � 0.04 75 � 4 73 � 4
0.87 � 0.04 77 � 4 64 � 5
0.83 � 0.04 64 � 5 61 � 5
0.89 � 0.03 84 � 4 75 � 4
ation of the total neuroretinal rim area); VIRA �
tal volume of the RNFL tissue in the rim).
peratknescoma
s)
estim
nd the rules that were obtained were applied subsequently
OPHTHALMOLOGY JANUARY 2006

tewst
O
6gTs(g(fgts(gd1srtrl0q(
tpsshtah
sggaH0taVrdmsatwm
dgno
Fb(s(t
Fb(s(t
V
o the remaining one-25th of eyes that were not used inach replication. Splits that were present in all 25 treesere retained for the final model, and the sensitivity and
pecificity was based on the average value across the 25rees.
RESULTS
NE EYE EACH FROM 42 NORMAL CONTROL SUBJECTS AND
5 patients with glaucoma were recruited. The demo-raphic characteristics of the study sample are shown inable 1. The mean age of the control group was not
ignificantly different from that of the glaucoma groupP � .098 and 0.092 for the entire glaucoma and earlylaucoma groups, respectively). Average mean deviation�SD) was 0.0 � 1.3 dB for normal eyes, �5.3 � 5.0 dBor all patients with glaucoma, and �2.5 � 1.6 dB for earlylaucomatous eyes. The mean (�SE) RNFL thickness inhe entire glaucoma group was 73.0 � 17.1 �m andignificantly lower than the control group98.2 � 10.8 �m; P � .001; Table 2). In the entirelaucoma group, the RNFL thickness was significantlyifferent from the control group (P � .001) in superior (1,0, 11, and 12), inferior (5, 6, 7, and 8), and 9 o’clockectors along with the superior, inferior, and nasal quad-ants. Among the 12 clock hour sectors, RNFL thickness athe 7 o’clock sector had the highest area-under-the-eceiver operating characteristic curve (AUC; �SE), fol-owed by the 6 and 11 o’clock sectors (0.93 � 0.02, 0.90 �.03, and 0.82 � 0.04, respectively). Among the fouruadrants, the inferior quadrant had the highest AUC
IGURE 2. Receiver operating characteristic curves for theest parameters of the retinal nerve fiber layer thicknessretinal nerve fiber layer [RNFL] thickness in the 7 o’clockector and the inferior quadrant) and fast optic disk algorithmsvertical C/D ratio) and the average retinal nerve fiber layerhickness in the entire glaucoma group.
0.92 � 0.02; Table 3). The sensitivities for the RNFL s
COMPARISON OF DIFFERENTOL. 141, NO. 1
hickness parameters at 80% and 90% specificities arerovided in Table 3. The highest sensitivity at 90%pecificity belonged to the 7 o’clock (inferotemporal)ector (86% � 3%). In the early glaucoma group, the threeighest AUCs (�SE) belonged to the RNFL thickness athe 7, 6, and 11 o’clock sectors (0.91 � 0.03, 0.86 � 0.04,nd 0.80 � 0.05, respectively). The same locations alsoad the highest sensitivities at fixed specificities (Table 4).All fast optic disk parameters, except disk area, demon-
trated a significant difference between the control andlaucoma groups (P � .001; Table 2). In the entirelaucoma group, the three highest AUCs (�SE) from theutomated analysis belonged to the vertical C/D ratio,IRW, and VIRA (0.90 � 0.03, 0.89 � 0.03, and 0.89 �
.03), respectively (Table 3; Figure 2). The same parame-ers also had the best performance in the following orderfter manual correction: HIRW, vertical C/D ratio, andIRA (AUCs: 0.90 � 0.03, 0.90 � 0.03, and 0.89 � 0.03,
espectively). The AUCs for all parameters, except theisk area, were not significantly different between auto-ated and manually corrected analyses. The HIRW
howed the best sensitivity at 90% specificity with both theutomated method (79% � 4%) and after manual correc-ion (82% � 4%). When only eyes with early glaucomaere evaluated, the three highest AUCs from the auto-ated method were the same (Table 4; Figure 3).The AUCs for the rim area and average nerve width at
isk from the individual radial scan analyses for bothlaucoma groups are described in Table 5. The averageerve width at disk belonging to scan number 1 (1 to 7’clock axis) had the highest AUC of 0.93 � 0.02, with a
IGURE 3. Receiver operating characteristic curves for theest parameters of the retinal nerve fiber layer thicknessretinal nerve fiber layer [RNFL] thickness at the 7 o’clockector and the inferior quadrant) and fast optic disk algorithmsvertical C/D ratio) and the average retinal nerve fiber layerhickness in the early glaucoma group.
ensitivity of 80% � 4% at 90% specificity.
ALGORITHMS OF OCT 111

fCmca9aa
T
etRqni9TacosAa(
r
ahOIte1pp�Tvsgv
aeitfsMOgiidfa
eare
1
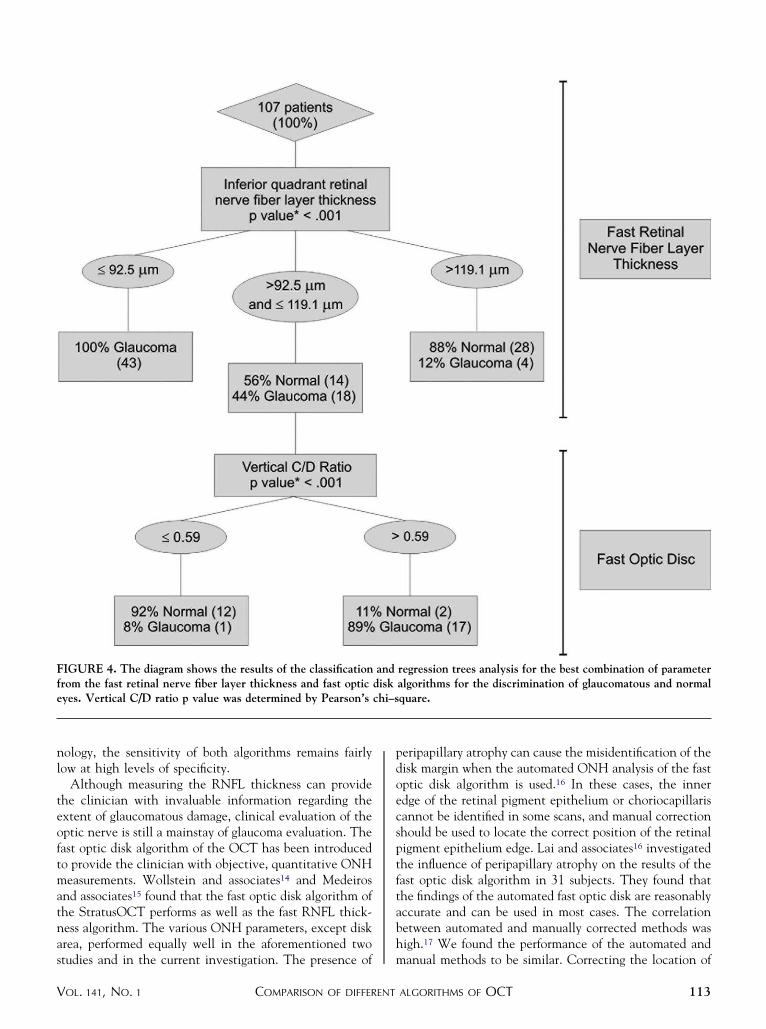
We simultaneously evaluated variables from both theast RNFL thickness and the fast optic disk algorithms withART to determine whether an optimal parsimoniousodel could be found (Figure 4). We found that a
ombination of RNFL thickness in the inferior quadrantnd the vertical C/D ratio provided the best accuracy of4% � 2% after cross validation. The nominal sensitivitynd specificity of this multivariate model was 92% (60/65)nd 95% (40/42), respectively.
DISCUSSION
HE CURRENT INVESTIGATION WAS CARRIED OUT TO
valuate and compare the performance of the fast RNFLhickness and fast optic disk algorithms of the OCT. TheNFL thickness in the 7 o’clock sector and in the inferioruadrant had the highest AUC for discrimination betweenormal eyes and eyes with glaucoma. The RNFL thickness
n the 7 o’clock sector was also the most sensitive (86% at0% specificity) among the RNFL thickness parameters.he vertical C/D ratio, HIRW, and VIRA from theutomated ONH analysis had the highest AUC for dis-riminating glaucomatous from normal eyes among the fastptic disk parameters; the highest sensitivities at the 90%pecificity belonged to HIRW and the vertical C/D ratio.mong the parameters for the individual radial scan
nalyses, the average nerve width at disk at scan number 11 to 7 o’clock axis) had the highest AUC.
The performance of the OCT RNFL thickness algo-
TABLE 5. The Area Under the Receiver Operating Characteristhe Rim Area and Average Nerve Width From the Indiv
Individual Radial Scan Parameters
At Scan
Number
Enti
AUC � SE
Rim Area* (mm2)
1 0.88 � 0.03
2 0.86 � 0.04
3 0.83 � 0.04
4 0.87 � 0.04
5 0.88 � 0.03
6 0.87 � 0.04
Average nerve width at disc
(mm)†1 0.93 � 0.02
2 0.88 � 0.03
3 0.86 � 0.04
4 0.87 � 0.03
5 0.91 � 0.03
6 0.88 � 0.03
*The average area above the cup line to the anterior surface of t†The average nerve width from each disc reference point to the n
ithm with different versions of the OCT has been evalu- S
AMERICAN JOURNAL OF12
ted previously. The AUC for the average RNFL thicknessas ranged from 0.73 to 1.00 for the OCT prototype andCT 2000,12,13,19–21 and 0.90 to 0.97 for OCT 3.14,15,22–24
n this study, we found that the AUC of the average RNFLhickness was 0.89 for the entire group and 0.88 for thearly glaucoma group (average mean deviation, �2.5 �.6 dB). The unusually high AUC of 1.00 for the OCTrototype and the OCT 2000 was reported in a sample ofatients with glaucoma with an average mean deviation of12.0 dB,21 which represents advanced visual field loss.he performance of optic nerve and RNFL imaging de-ices depends on how advanced the glaucoma is in theample that is under study. Our findings are consistent withradual improvement of the performance of consecutiveersions of the OCT.An interesting finding of this study was that both
lgorithms performed equally well when only eyes witharly glaucoma were considered. The AUCs and sensitiv-ties were very similar to, but slightly lower than, those forhe entire glaucoma group. The best parameters from theast RNFL thickness and fast optic disk algorithms were theame. These results are consistent with those of Nouri-
ahdavi and associates,13 in which the performance ofCT 2000 in a group of early perimetric patients with
laucoma was reported. Our study also confirms the find-ngs of previous studies that the RNFL thickness in thenferior quadrant has the best discriminating ability foretection of glaucoma.12,14,15,19–25 Similarly, the sensitivityor the best parameters from the fast RNFL thicknesslgorithm was consistent with published studies with
urve (AUC) and the Sensitivity at 80% and 90% Specificity ofRadial Scan Analysis of the Fast Optic Disc Algorithm
coma Group Early Glaucoma Group
Sensitivity at Fixed
Specificity (% � SE)
AUC � SE
Sensitivity at Fixed
Specificity (% � SE)
80% 90% 80% 90%
80 � 4 65 � 5 0.88 � 0.04 80 � 4 57 � 5
61 � 5 52 � 5 0.87 � 0.04 55 � 5 50 � 5
66 � 5 49 � 5 0.85 � 0.04 68 � 5 48 � 5
72 � 4 66 � 5 0.88 � 0.04 73 � 4 64 � 5
83 � 4 71 � 4 0.87 � 0.04 82 � 4 64 � 5
75 � 4 69 � 4 0.87 � 0.04 75 � 4 66 � 5
87 � 3 80 � 4 0.92 � 0.03 85 � 4 75 � 4
77 � 4 58 � 5 0.87 � 0.04 73 � 4 59 � 5
74 � 4 66 � 5 0.86 � 0.04 71 � 5 56 � 5
77 � 4 67 � 5 0.86 � 0.04 72 � 4 60 � 5
87 � 3 74 � 4 0.90 � 0.03 87 � 3 69 � 5
81 � 4 69 � 4 0.87 � 0.04 76 � 4 61 � 5
tic disc from both sides of each scan in vertically.
st point on the anterior surface of the retinal nerve fiber layer.
tic Cidual
re Glau
he op
tratusOCT.14,15,22–24 Despite the advances in OCT tech-
OPHTHALMOLOGY JANUARY 2006
nl
teoftmatnas
pdoecsptftabh
Ffe
V
ology, the sensitivity of both algorithms remains fairlyow at high levels of specificity.
Although measuring the RNFL thickness can providehe clinician with invaluable information regarding thextent of glaucomatous damage, clinical evaluation of theptic nerve is still a mainstay of glaucoma evaluation. Theast optic disk algorithm of the OCT has been introducedo provide the clinician with objective, quantitative ONHeasurements. Wollstein and associates14 and Medeiros
nd associates15 found that the fast optic disk algorithm ofhe StratusOCT performs as well as the fast RNFL thick-ess algorithm. The various ONH parameters, except diskrea, performed equally well in the aforementioned two
IGURE 4. The diagram shows the results of the classificationrom the fast retinal nerve fiber layer thickness and fast opticyes. Vertical C/D ratio p value was determined by Pearson’s
tudies and in the current investigation. The presence of m
COMPARISON OF DIFFERENTOL. 141, NO. 1
eripapillary atrophy can cause the misidentification of theisk margin when the automated ONH analysis of the fastptic disk algorithm is used.16 In these cases, the innerdge of the retinal pigment epithelium or choriocapillarisannot be identified in some scans, and manual correctionhould be used to locate the correct position of the retinaligment epithelium edge. Lai and associates16 investigatedhe influence of peripapillary atrophy on the results of theast optic disk algorithm in 31 subjects. They found thathe findings of the automated fast optic disk are reasonablyccurate and can be used in most cases. The correlationetween automated and manually corrected methods wasigh.17 We found the performance of the automated and
regression trees analysis for the best combination of parameteralgorithms for the discrimination of glaucomatous and normalquare.
anddiskchi–s
anual methods to be similar. Correcting the location of
ALGORITHMS OF OCT 113

tpp
snR(tobsa
mcfifpHlRpwphCwg
awsoceHpt
ngdrprg
1
1
1
1
1
1
1
1
1
1
he retinal pigment epithelium border is a time-consumingrocedure and, considering our findings, may need to beerformed only in selected eyes.No previous study has evaluated the individual radial
can analysis. We found that the rim area and the averageerve width at disk performed as well as other disk orNFL parameters. A single radial scan of the optic disk
the scan number 1 at 1 to 7 o’clock axis) had an AUChat was similar to that of the RNFL thickness at the 7’clock sector. This finding can be applied clinicallyecause the use of only a single scan for glaucomacreening may be a useful time- and cost-efficientpproach.
We used the CART analysis to find the optimal parsi-onious combination of parameters for detecting glau-
oma. As shown in Figure 4, the first parameter to be usedor classification by CART was the RNFL thickness in thenferior quadrant followed by the vertical C/D ratio of theast optic disk algorithm. The combination of these twoarameters resulted in a low misclassification rate (6.2%).owever, we must emphasize that, given the high corre-
ation and good discriminating ability of many of theNFL and ONH parameters, there are potentially otherairwise combinations of different variables that couldork nearly as well. The CART analyses are helpfulotentially for defining clinically useful cutoff points thatave immediate application for the clinician (Figure 4).onfirmation of our findings in other groups of patientsith glaucoma is required before the results can beeneralized.
One limitation of our study is that there is no generallyccepted criteria for the definition of a good quality scanith the fast optic disk algorithm. To avoid bias in the
election of fast optic disk images, we included all the fastptic disk images of patients whose RNFL images wereonsidered eligible on the basis of the criteria describedarlier. This may have led to the inclusion of poor images.owever, any such bias would have led to a worse
erformance of the fast optic disk algorithm compared withhe fast RNFL thickness algorithm.
In conclusion, the performance of the fast RNFL thick-ess and fast optic disk algorithms for the detection of earlylaucoma are similar, and both can be used clinically toetect early glaucomatous damage. A combination of theesults from both algorithms leads to a better diagnosticrecision. The use of only one scan from the individualadial scan analysis may be a useful and practical tool forlaucoma screening.
REFERENCES
1. Girkin CA, McGwin G Jr, Long C, DeLeon-Ortega J, GrafCM, Everett AW. Subjective and objective optic nerveassessment in African Americans and whites. Invest Oph-
thalmol Vis Sci 2004;45:2272–2278.AMERICAN JOURNAL OF14
2. Schuman JS, Hee MR, Arya AV, et al. Optical coherencetomography: a new tool for glaucoma diagnosis. Curr OpinOphthalmol 1995;6:89–95.
3. Wang M, Luo R, Liu Y. Optical coherence tomography andits application in ophthalmology. Yan Ke Xue Bao 1998;14:116–120.
4. Baumal CR. Clinical applications of optical coherence to-mography. Curr Opin Ophthalmol 1999;10:182–188.
5. Schuman JS, Hee MR, Puliafito CA, et al. Quantification ofnerve fiber layer thickness in normal and glaucomatous eyesusing optical coherence tomography. Arch Ophthalmol1995;113:586–596.
6. Gurses-Ozden R, Ishikawa H, Hoh ST, et al. Increasingsampling density improves reproducibility of optical coher-ence tomography measurements. J Glaucoma 1999;8:238–241.
7. Mistlberger A, Liebmann JM, Greenfield DS, et al. Heidel-berg retina tomography and optical coherence tomography innormal, ocular-hypertensive, and glaucomatous eyes. Oph-thalmology 1999;106:2027–2032.
8. Pieroth L, Schuman JS, Hertzmark E, et al. Evaluation offocal defects of the nerve fiber layer using optical coherencetomography. Ophthalmology 1999;106:570–579.
9. Zangwill LM, Williams J, Berry CC, Knauer S, Weinreb RN.A comparison of optical coherence tomography and retinalnerve fiber layer photography for detection of nerve fiberlayer damage in glaucoma. Ophthalmology 2000;107:1309–1315.
0. Hoh ST, Greenfield DS, Mistlberger A, Liebmann JM, IshikawaH, Ritch R. Optical coherence tomography and scanning laserpolarimetry in normal, ocular hypertensive, and glaucomatouseyes. Am J Ophthalmol 2000;129:129–135.
1. Bowd C, Weinreb RN, Williams JM, Zangwill LM. Theretinal nerve fiber layer thickness in ocular hypertensive,normal, and glaucomatous eyes with optical coherence to-mography. Arch Ophthalmol 2000;118:22–26.
2. Wollstein G, Schuman JS, Price LL, et al. Optical coherencetomography (OCT) macular and peripapillary retinal nervefiber layer measurements and automated visual fields. Am JOphthalmol 2004;138:218–225.
3. Nouri-Mahdavi K, Hoffman D, Tannenbaum DP, Law SK,Caprioli J. Identifying early glaucoma with optical coherencetomography. Am J Ophthalmol 2004;137:228–235.
4. Wollstein G, Ishikawa H, Wang J, Beaton SA, Schuman JS.Comparison of three optical coherence tomography scanningareas for detection of glaucomatous damage. Am J Ophthal-mol 2005;139:39–43.
5. Medeiros FA, Zangwill LM, Bowd C, Vessani RM, SusannaR Jr, Weinreb RN. Evaluation of retinal nerve fiber layer,optic nerve head, and macular thickness measurements forglaucoma detection using optical coherence tomography.Am J Ophthalmol 2005;139:44–55.
6. Lai E, Wollstein G, Price LL, et al. Optical coherence tomog-raphy disc assessment in optic nerves with peripapillary atrophy.Ophthalmic Surg Lasers Imaging 2003;34:498–504.
7. Schuman JS, Wollstein G, Farra T, et al. Comparison ofoptic nerve head measurements obtained by optical coher-ence tomography and confocal scanning laser ophthalmos-copy. Am J Ophthalmol 2003;135:504–512.
8. Zeiss C, Meditec, Inc., Dublin, CA, StratusOCT User
Manual, Rev. A 12/02:6–3.OPHTHALMOLOGY JANUARY 2006

1
2
2
2
2
2
2
V
9. Zangwill LM, Bowd C, Berry CC, et al. Discriminatingbetween normal and glaucomatous eyes using the Heidel-berg retina tomograph, GDx nerve fiber analyzer, andoptical coherence tomograph. Arch Ophthalmol 2001;119:985–993.
0. Kanamori A, Nakamura M, Escano MF, Seya R, Maeda H,Negi A. Evaluation of the glaucomatous damage on retinalnerve fiber layer thickness measured by optical coherencetomography. Am J Ophthalmol 2003;135:513–520.
1. Guedes V, Schuman JS, Hertzmark E, et al. Optical coher-ence tomography measurement of macular and nerve fiberlayer thickness in normal and glaucomatous human eyes.Ophthalmology 2003;110:177–189.
2. Medeiros FA, Zangwill LM, Bowd C, Weinreb RN. Compar-
ison of the GDx VCC scanning laser polarimeter, HRT IICOMPARISON OF DIFFERENTOL. 141, NO. 1
confocal scanning laser ophthalmoscope, and stratus OCToptical coherence tomograph for the detection of glaucoma.Arch Ophthalmol 2004;122:827–837.
3. Leung CK, Yung WH, Ng AC, Woo J, Tsang MK, Tse KK.Evaluation of scanning resolution on retinal nerve fiberlayer measurement using optical coherence tomography innormal and glaucomatous eyes. J Glaucoma 2004;13:479 –485.
4. Budenz DL, Michael A, Chang RT, McSoley J, Katz J.Sensitivity and specificity of the StratusOCT for perimetricglaucoma. Ophthalmology 2005;112:3–9.
5. Williams ZY, Schuman JS, Gamell L, et al. Optical coher-ence tomography measurement of nerve fiber layer thicknessand the likelihood of a visual field defect. Am J Ophthalmol
2002;134:538–546.ALGORITHMS OF OCT 115

AAi
1
Biosketch
nita Manassakorn, MD, is Visiting Assistant Professor, Glaucoma Division, at Jules Stein Eye Institute, UCLA, Losngeles, CA and Instructor in Ophthalmology, at Chiang Mai University, Chiang Mai, Thailand. Her research interests
nclude imaging in glaucoma, visual field progression, and glaucoma management.
AMERICAN JOURNAL OF OPHTHALMOLOGY15.e1 JANUARY 2006
Copyright © 2022 FDOKUMEN