Comparison of hydraulic conductivities by grain-size analysis ...
10
© 2015 T. Pucko and T. Verbovšek, licensee De Gruyter Open. This work is licensed under the Creative Commons Attribution-NonCommercial-NoDerivs 3.0 License. The article is published with open access at www.degruyter.com. Open Geosci. 2015; 7:308–317 Research Article Open Access Tatjana Pucko and Timotej Verbovšek* Comparison of hydraulic conductivities by grain-size analysis, pumping, and slug tests in Quaternary gravels, NE Slovenia DOI 10.1515/geo-2015-0032 Received August 06, 2014; accepted February 11, 2015 Abstract: Hydraulic conductivities (K) can be obtained from pumping and slug tests as well as grain size analysis. Although empirical methods for such estimations are long- standing, there is still insucient comparison of K val- ues among the various approaches. Six grain-size analysis methods were tested on coarse-grained alluvial sediments from 12 water wells in NE Slovenia. Values of K from grain- size methods were compared to those of pumping tests and slug tests. Six grain-size methods (USBR, Slichter, Hazen, Beyer, Kozeny-Carman, and Terzaghi) were used for comparison with the Theis and Neuman pumping test method and the Bouwer-Rice method for slug tests. The results show that the USBR (US Bureau of Reclamation) method overestimates K values and there is no correla- tion with other results, so its use is not advised. Con- versely, whilst the Slichter method gives much lower esti- mates of K, it is the only one to completely fulll the grain size requirements. Other methods (Hazen, Beyer, Kozeny- Carman, and Terzaghi) result in intermediate values and are similar to the Slichter method; however they should be used for smaller-sized sediments. Due to their high trans- missivity and small radius of inuence, slug tests should be avoided in the analysis of gravels, as they only test a small portion of the aquifer compared to pumping tests. This is conrmed by the low correlation coecients be- tween hydraulic conductivities obtained from pumping tests and slug tests. Keywords: hydraulic conductivity; grain-size analysis; NE Slovenia; alluvial aquifer Tatjana Pucko: Chinova Resources Pty Ltd, Level 9, 303 Coronation Drive, Milton, QLD 4064, Australia, E-mail: tat- [email protected] *Corresponding Author: Timotej Verbovšek: University of Ljubljana, Faculty of Natural Sciences and Engineering, De- partment of Geology, Aškerčeva 12, Ljubljana, Slovenia, E-mail: [email protected] Introduction Hydraulic conductivity (K) is one of the most important pa- rameters in studies of groundwater and can be obtained by several methods on dierent scales – from laboratory to regional. Usually the K value is determined by pump- ing tests, slug tests, or tracer tests in the eld or labora- tory by analysis of sediment samples and further calcu- lation using empirical equations. The approach used in this paper, where values of hydraulic conductivity are de- termined from grain-size analyses, comprises well-known straightforward methods which have been used for more than 100 years [1–3] and have been included in various studies [4–14]. Numerous analyses for pumping tests (Theis, Cooper- Jacob, and Neuman as the most well-known and sev- eral others for fractured rocks and other exceptions) and grain-size analyses (USBR, Slichter, Hazen, Beyer, Kozeny- Carman, Terzaghi, etc., listed in [13] and [14]) exist around the world and encompass both the eld and the laboratory approach for scientic and geotechnical purposes. Gener- ally, estimated values are very poorly correlated with mea- sured ones, with errors ranging up to over 500% [15] or over 1000% [14]. There are some shortcomings of pumping test methods, as they are often expensive and the aquifer geometry and properties should be well understood before selecting the calculation method. Similar limitations ap- ply to laboratory tests, since it is quite dicult to obtain a truly representative sample. The original sediment struc- ture is mostly destroyed during sampling [11]. Grain-size analyses are therefore considered less reliable than pump- ing tests when using hydraulic conductivities for eld- scale characterization [7, 12]. Despite the latter obstacle, the estimation of hydraulic conductivities from the quick and low-cost grain-size anal- yses is a well-known method, as no aquifer geometry is needed to calculate the values of K. Pumping test meth- ods require the user to know whether the aquifer is of constant thickness and the nature of its termination (by fault or other impermeable barrier, etc.). A grain-size sam- ple does not take these factors into account and refers to only a small portion of the aquifer. Despite the common use of both approaches, correlations between the values
-
Upload
khangminh22 -
Category
Documents
-
view
1 -
download
0
Transcript of Comparison of hydraulic conductivities by grain-size analysis ...

© 2015 T. Pucko and T. Verbovšek, licensee De Gruyter Open.This work is licensed under the Creative Commons Attribution-NonCommercial-NoDerivs 3.0 License.The article is published with open access at www.degruyter.com.
Open Geosci. 2015; 7:308–317
Research Article Open Access
Tatjana Pucko and Timotej Verbovšek*Comparison of hydraulic conductivities by grain-size analysis,pumping, and slug tests in Quaternary gravels, NE SloveniaDOI 10.1515/geo-2015-0032
Received August 06, 2014; accepted February 11, 2015
Abstract: Hydraulic conductivities (K) can be obtainedfrom pumping and slug tests as well as grain size analysis.Althoughempiricalmethods for such estimations are long-standing, there is still insu�cient comparison of K val-ues among the various approaches. Six grain-size analysismethods were tested on coarse-grained alluvial sedimentsfrom 12 water wells in NE Slovenia. Values of K from grain-size methods were compared to those of pumping testsand slug tests. Six grain-size methods (USBR, Slichter,Hazen, Beyer, Kozeny-Carman, and Terzaghi) were usedfor comparison with the Theis and Neuman pumping testmethod and the Bouwer-Rice method for slug tests. Theresults show that the USBR (US Bureau of Reclamation)method overestimates K values and there is no correla-tion with other results, so its use is not advised. Con-versely, whilst the Slichter method gives much lower esti-mates of K, it is the only one to completely ful�ll the grainsize requirements. Other methods (Hazen, Beyer, Kozeny-Carman, and Terzaghi) result in intermediate values andare similar to the Slichtermethod; however they should beused for smaller-sized sediments. Due to their high trans-missivity and small radius of in�uence, slug tests shouldbe avoided in the analysis of gravels, as they only test asmall portion of the aquifer compared to pumping tests.This is con�rmed by the low correlation coe�cients be-tween hydraulic conductivities obtained from pumpingtests and slug tests.
Keywords: hydraulic conductivity; grain-size analysis; NESlovenia; alluvial aquifer
Tatjana Pucko: Chinova Resources Pty Ltd, Level 9, 303Coronation Drive, Milton, QLD 4064, Australia, E-mail: [email protected]*Corresponding Author: Timotej Verbovšek: University ofLjubljana, Faculty of Natural Sciences and Engineering, De-partment of Geology, Aškerčeva 12, Ljubljana, Slovenia, E-mail:[email protected]
1 IntroductionHydraulic conductivity (K) is one of themost important pa-rameters in studies of groundwater and can be obtainedby several methods on di�erent scales – from laboratoryto regional. Usually the K value is determined by pump-ing tests, slug tests, or tracer tests in the �eld or labora-tory by analysis of sediment samples and further calcu-lation using empirical equations. The approach used inthis paper, where values of hydraulic conductivity are de-termined from grain-size analyses, comprises well-knownstraightforward methods which have been used for morethan 100 years [1–3] and have been included in variousstudies [4–14].
Numerous analyses for pumping tests (Theis, Cooper-Jacob, and Neuman as the most well-known and sev-eral others for fractured rocks and other exceptions) andgrain-size analyses (USBR, Slichter, Hazen, Beyer, Kozeny-Carman, Terzaghi, etc., listed in [13] and [14]) exist aroundtheworld and encompass both the �eld and the laboratoryapproach for scienti�c and geotechnical purposes. Gener-ally, estimated values are very poorly correlated withmea-sured ones, with errors ranging up to over 500% [15] orover 1000% [14]. There are some shortcomings of pumpingtest methods, as they are often expensive and the aquifergeometry and properties should bewell understood beforeselecting the calculation method. Similar limitations ap-ply to laboratory tests, since it is quite di�cult to obtain atruly representative sample. The original sediment struc-ture is mostly destroyed during sampling [11]. Grain-sizeanalyses are therefore considered less reliable than pump-ing tests when using hydraulic conductivities for �eld-scale characterization [7, 12].
Despite the latter obstacle, the estimation of hydraulicconductivities from the quick and low-cost grain-size anal-yses is a well-known method, as no aquifer geometry isneeded to calculate the values of K. Pumping test meth-ods require the user to know whether the aquifer is ofconstant thickness and the nature of its termination (byfault or other impermeable barrier, etc.). A grain-size sam-ple does not take these factors into account and refers toonly a small portion of the aquifer. Despite the commonuse of both approaches, correlations between the values

Comparison of hydraulic conductivities by grain-size analysis, pumping | 309
of hydraulic conductivities from the pumping or slug testsand those estimated from the grain-size analyses are stillscarce.
The purpose of this paper is twofold. The �rst objec-tive is to analyze correlations between hydraulic conduc-tivities obtained from pumping tests, slug tests, and var-ious grain-size methods. As an advantage over other ap-proaches, samples for grain-size analyses were taken fromwells that were also used for pumping and slug tests. Thesecond objective is to apply grain-size analyses to gravel-sized sediments, which are not usually used to estimatethe hydraulic conductivity from grain-size analyses.
1.1 Determination of hydraulicconductivities from grain-size analyses
Determination of hydraulic conductivity from grain-sizeanalysis is based on empirical equations, relying mostlyon the diameter of sediment grains and other parameterssuch as the viscosity of water, porosity, and sorting coe�-cient (described indetail below).Many researchers ([1–15])have attempted to establish correlations between these pa-rameters and therefore numerous estimations of hydraulicconductivity from the grain-size analysis exist. Such equa-tions and their rangeof applicationhavebeen summarizedin [13] and [14].
Hydraulic conductivity is estimated by the followinggeneralized equation as:
K = g/ν × C × f (n) × d2e . (1)
K is the hydraulic conductivity (m/s) and g is the gravita-tional acceleration (9.81 m2/s). The kinematic viscosity ν(m2/s) depends on the temperature of water and is foundin tables in [13]. C is an empirical dimensionless coe�cientof proportionality, and varies greatly in the literature (e.g.[13, 14]); the Hazen method uses values in the range of 1to 1000 [5]. The average value of 8.4×10⁻³ is commonlyused [9, 11] for C and was also adopted in this paper. Thee�ective grain diameter de (cm) is taken as the diameterof grains with a speci�c cumulative weight (i.e. 60% ford60) of the sample from the grain-size distribution curve[6]. The distribution curve (also known as the particle-sizedistribution plot) plots the cumulative number of particles(as a percentage) versus their size in logarithmic scale andprovides information on whether small- or large-diametergrains prevail in the sample. The porosity function f (n)is dimensionless, depends on the porosity n (dimension-less), and is in some cases set to one (1). If there are noavailable data on porosity, it can be estimated from the co-e�cient of grain uniformity U = d60/d10 (also dimension-
less, sometimes denoted as η or C). Coe�cient U is usedto determine the homogeneity of the sample; a higher Uvalue indicates greater heterogeneity and poor sorting ofsediments. Estimated porosity is therefore calculated as
n = 0.255 × (1 + 0.83U). (2)
The most recognized relationships are summarized in Ta-ble 1. Other empirical formulae for estimation of K fromgrain-size analyses exist [13], but are mostly not used asthe coe�cients di�er (for example, d50 in the Alyamaniand Sen method [9] or d17 in the methods of Pavcich orSauerbrei [13]). For these reasons, they were also not usedin this paper.
It is apparent (Table 1 in this paper, Table 8.2 in [13])that not only are the coe�cients in the equations quite dif-ferent, but also the USBR and Beyer formulae disregardporosity in samples by setting the porosity function to one(1). Similarly, most methods assume that the coe�cient ofproportionality C is a constant value (Table 1). Equationshave a range of applications, although only the Slichtermethod is suitable for gravelswith grain-sizes above 2mm.It should also be noted that the Beyer and Slichter meth-ods have been misspelt [9] as the “Breyer" and "Slitcher”methods.
2 Methods
2.1 Geological and hydrogeological setting
The studied area lies in NE Slovenia between the easternpart of the Pannonian basin to the east and the SouthernAlps to the west (Figure 1). The research area lies in twobasins: Drava-Ptuj (composed of two smaller basins) andMura (also called Mura-Zala). The basins are �lled withQuaternary and Tertiary sediments [16]. The depth to thepre-Tertiary metamorphic basement ranges from 500 m tomore than 4000 m. Tertiary sediments are represented byclastic Miocene and Pliocene marine sands, silts, clays,and gravels, which intercalate with brackish clastic beds.Quaternary sediments are �uvial and limnic and appearmostly as quartz gravels, sometimesmixed with sand. Thethickness of these sediments is 10 to 20 m in the Murabasin [17], between 22 and 26 m (less in the vicinity of theriver) in the Drava basin, and varies greatly, from 4 to 22m,in the Ptuj basin.
Quaternary gravels are highly transmissive to waterand form mostly uncon�ned aquifers. In the Drava basin,the approximate hydraulic conductivities (obtained byseveral methods from the National Database of Hydroge-
310 | T. Pucko and T. Verbovšek
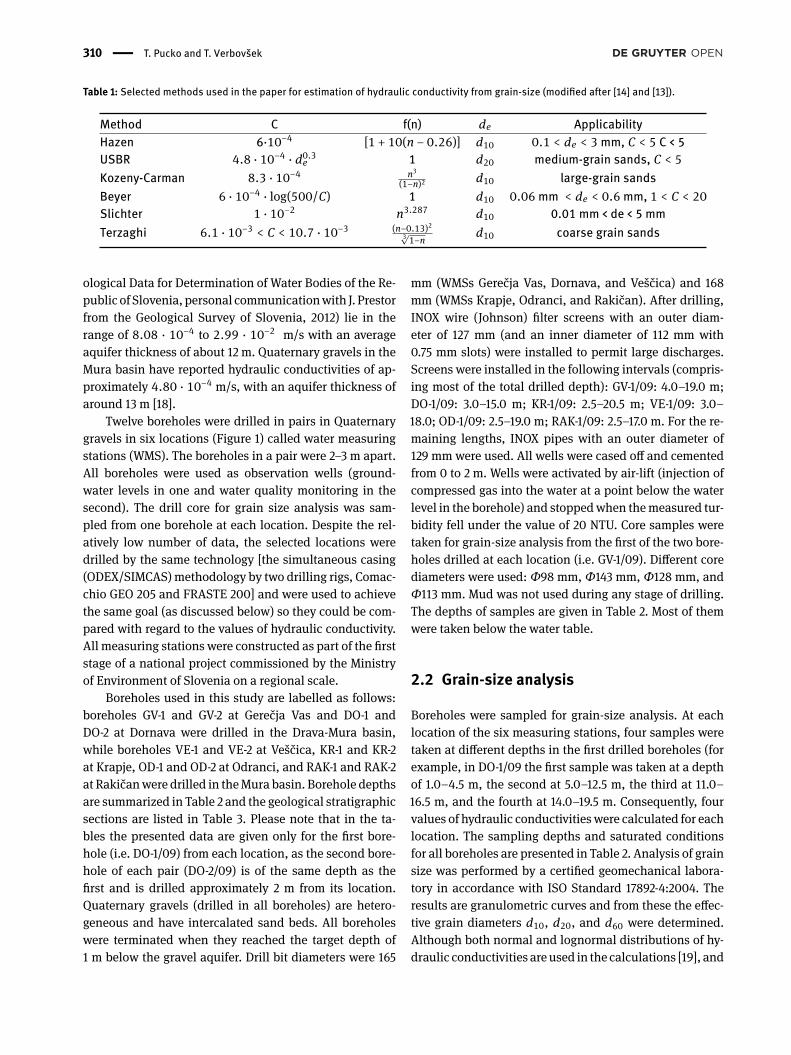
Table 1: Selected methods used in the paper for estimation of hydraulic conductivity from grain-size (modi�ed after [14] and [13]).
Method C f(n) de ApplicabilityHazen 6·10−4 [1 + 10(n − 0.26)] d10 0.1 < de < 3mm, C < 5 C < 5USBR 4.8 · 10−4 · d0.3e 1 d20 medium-grain sands, C < 5Kozeny-Carman 8.3 · 10−4 n3
(1−n)2 d10 large-grain sandsBeyer 6 · 10−4 · log(500/C) 1 d10 0.06mm < de < 0.6mm, 1 < C < 20Slichter 1 · 10−2 n3.287 d10 0.01 mm < de < 5 mmTerzaghi 6.1 · 10−3 < C < 10.7 · 10−3 (n−0.13)2
3√1−n d10 coarse grain sands
ological Data for Determination of Water Bodies of the Re-public of Slovenia, personal communicationwith J. Prestorfrom the Geological Survey of Slovenia, 2012) lie in therange of 8.08 · 10−4 to 2.99 · 10−2 m/s with an averageaquifer thickness of about 12 m. Quaternary gravels in theMura basin have reported hydraulic conductivities of ap-proximately 4.80 · 10−4 m/s, with an aquifer thickness ofaround 13 m [18].
Twelve boreholes were drilled in pairs in Quaternarygravels in six locations (Figure 1) called water measuringstations (WMS). The boreholes in a pair were 2–3 m apart.All boreholes were used as observation wells (ground-water levels in one and water quality monitoring in thesecond). The drill core for grain size analysis was sam-pled from one borehole at each location. Despite the rel-atively low number of data, the selected locations weredrilled by the same technology [the simultaneous casing(ODEX/SIMCAS)methodology by two drilling rigs, Comac-chio GEO 205 and FRASTE 200] and were used to achievethe same goal (as discussed below) so they could be com-pared with regard to the values of hydraulic conductivity.All measuring stations were constructed as part of the �rststage of a national project commissioned by the Ministryof Environment of Slovenia on a regional scale.
Boreholes used in this study are labelled as follows:boreholes GV-1 and GV-2 at Gerečja Vas and DO-1 andDO-2 at Dornava were drilled in the Drava-Mura basin,while boreholes VE-1 and VE-2 at Veščica, KR-1 and KR-2at Krapje, OD-1 and OD-2 at Odranci, and RAK-1 and RAK-2at Rakičanwere drilled in theMura basin. Borehole depthsare summarized in Table 2 and the geological stratigraphicsections are listed in Table 3. Please note that in the ta-bles the presented data are given only for the �rst bore-hole (i.e. DO-1/09) from each location, as the second bore-hole of each pair (DO-2/09) is of the same depth as the�rst and is drilled approximately 2 m from its location.Quaternary gravels (drilled in all boreholes) are hetero-geneous and have intercalated sand beds. All boreholeswere terminated when they reached the target depth of1 m below the gravel aquifer. Drill bit diameters were 165
mm (WMSs Gerečja Vas, Dornava, and Veščica) and 168mm (WMSs Krapje, Odranci, and Rakičan). After drilling,INOX wire (Johnson) �lter screens with an outer diam-eter of 127 mm (and an inner diameter of 112 mm with0.75 mm slots) were installed to permit large discharges.Screens were installed in the following intervals (compris-ing most of the total drilled depth): GV-1/09: 4.0–19.0 m;DO-1/09: 3.0–15.0 m; KR-1/09: 2.5–20.5 m; VE-1/09: 3.0–18.0; OD-1/09: 2.5–19.0 m; RAK-1/09: 2.5–17.0 m. For the re-maining lengths, INOX pipes with an outer diameter of129 mm were used. All wells were cased o� and cementedfrom 0 to 2 m. Wells were activated by air-lift (injection ofcompressed gas into the water at a point below the waterlevel in the borehole) and stoppedwhen themeasured tur-bidity fell under the value of 20 NTU. Core samples weretaken for grain-size analysis from the �rst of the two bore-holes drilled at each location (i.e. GV-1/09). Di�erent corediameters were used: Φ98 mm, Φ143 mm, Φ128 mm, andΦ113 mm. Mud was not used during any stage of drilling.The depths of samples are given in Table 2. Most of themwere taken below the water table.
2.2 Grain-size analysis
Boreholes were sampled for grain-size analysis. At eachlocation of the six measuring stations, four samples weretaken at di�erent depths in the �rst drilled boreholes (forexample, in DO-1/09 the �rst sample was taken at a depthof 1.0–4.5 m, the second at 5.0–12.5 m, the third at 11.0–16.5 m, and the fourth at 14.0–19.5 m. Consequently, fourvalues of hydraulic conductivitieswere calculated for eachlocation. The sampling depths and saturated conditionsfor all boreholes are presented in Table 2. Analysis of grainsize was performed by a certi�ed geomechanical labora-tory in accordance with ISO Standard 17892-4:2004. Theresults are granulometric curves and from these the e�ec-tive grain diameters d10, d20, and d60 were determined.Although both normal and lognormal distributions of hy-draulic conductivities areused in the calculations [19], and

Comparison of hydraulic conductivities by grain-size analysis, pumping | 311
Table2:
Tech
nica
land
hydr
ogeo
logica
lboreh
olepa
rameters.
Gran
ulom
etric
samples
,noted
with
asteris
ks(*),weretake
nbe
low
thewater
tableleve
l.
WMS
Dateofpumping
test
Boreholedepth(m
)Discharge(l/s)
Waterleveldepth
(m)
Depths
oftakensamples
forg
ranulometric
analyses
(m)
Gerečjav.
04/01/09
214.56
10.63
3.0,6.5,15
.5*,18
.5*
Dornava
3/27
/200
917
5.5
3.41
1.0,5.0*,11.0*,14.0*
Veščica
3/25
/200
920
6.14
1.32
1.9*,7.5*,13
.5*,17
.5*
Krapje
3/26
/200
922
5.87
2.57
2.5,7.5*,13.5*,19.5*
Rakičan
8/25
/200
919
.55.48
3.32
4.5*,12.5*,16.5*,18.5*
Odranci
3/24
/200
921
6.46
0.96
3.5*,12.5*,16.5*,18.5*
312 | T. Pucko and T. Verbovšek
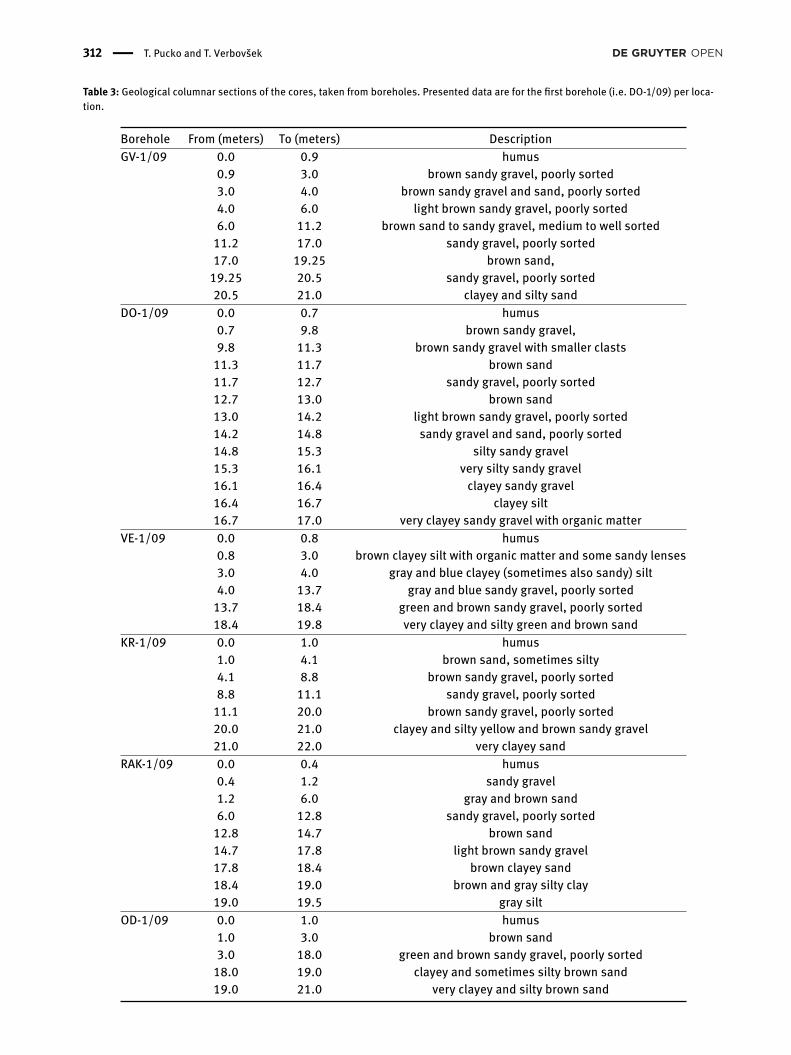
Table 3: Geological columnar sections of the cores, taken from boreholes. Presented data are for the �rst borehole (i.e. DO-1/09) per loca-tion.
Borehole From (meters) To (meters) DescriptionGV-1/09 0.0 0.9 humus
0.9 3.0 brown sandy gravel, poorly sorted3.0 4.0 brown sandy gravel and sand, poorly sorted4.0 6.0 light brown sandy gravel, poorly sorted6.0 11.2 brown sand to sandy gravel, medium to well sorted11.2 17.0 sandy gravel, poorly sorted17.0 19.25 brown sand,19.25 20.5 sandy gravel, poorly sorted20.5 21.0 clayey and silty sand
DO-1/09 0.0 0.7 humus0.7 9.8 brown sandy gravel,9.8 11.3 brown sandy gravel with smaller clasts11.3 11.7 brown sand11.7 12.7 sandy gravel, poorly sorted12.7 13.0 brown sand13.0 14.2 light brown sandy gravel, poorly sorted14.2 14.8 sandy gravel and sand, poorly sorted14.8 15.3 silty sandy gravel15.3 16.1 very silty sandy gravel16.1 16.4 clayey sandy gravel16.4 16.7 clayey silt16.7 17.0 very clayey sandy gravel with organic matter
VE-1/09 0.0 0.8 humus0.8 3.0 brown clayey silt with organic matter and some sandy lenses3.0 4.0 gray and blue clayey (sometimes also sandy) silt4.0 13.7 gray and blue sandy gravel, poorly sorted13.7 18.4 green and brown sandy gravel, poorly sorted18.4 19.8 very clayey and silty green and brown sand
KR-1/09 0.0 1.0 humus1.0 4.1 brown sand, sometimes silty4.1 8.8 brown sandy gravel, poorly sorted8.8 11.1 sandy gravel, poorly sorted11.1 20.0 brown sandy gravel, poorly sorted20.0 21.0 clayey and silty yellow and brown sandy gravel21.0 22.0 very clayey sand
RAK-1/09 0.0 0.4 humus0.4 1.2 sandy gravel1.2 6.0 gray and brown sand6.0 12.8 sandy gravel, poorly sorted12.8 14.7 brown sand14.7 17.8 light brown sandy gravel17.8 18.4 brown clayey sand18.4 19.0 brown and gray silty clay19.0 19.5 gray silt
OD-1/09 0.0 1.0 humus1.0 3.0 brown sand3.0 18.0 green and brown sandy gravel, poorly sorted18.0 19.0 clayey and sometimes silty brown sand19.0 21.0 very clayey and silty brown sand

Comparison of hydraulic conductivities by grain-size analysis, pumping | 313
Figure 1: Locations of water measuring stations (WMSs) on hydrogeological map [hydrogeological data modi�ed after the EuroWaterNetproject website (former link on http://nfp-si.eionet.eu.int/ewnsi, now at http://eionet-si.arso.gov.si), topographic map. From Surveying andMapping Authority of Republic Slovenia - GURS at 1:100,000 scale].
the values of K and transmissivities are lognormally dis-tributed [20, 21], the �nal value of hydraulic conductivity iscalculated as a mean weighted value of the four hydraulicconductivities, with weights representing the bed thick-ness. The value of kinematic viscosity of the water usedis 1.307 × 10⁻⁶ m2/s, which corresponds to the measuredmean water temperature of 10°C.
2.3 Pumping tests and slug tests
Hydraulic tests were performed from March to August2009. Slug tests were performed immediately after drillingand air-lift activation of boreholes in February 2009 (withthe exemption of WMS Rakičan in July 2009), with theweight instantaneously submerged below the water tablelevel. Measurement of the falling water level took placeevery 10 ms with a measuring precision of 0.1 cm. Testswere not performed at di�erent intervals. The pumpingtests lasted for 120minutes, and the discharge ranged fromQ = 4.66 to 6.46 l/s for the six boreholes. Althoughthe time of the pumping was relatively short, the mea-sured data �ts very well to the type curves, except for the�rst minute or few minutes. Water tables prior to pump-ing tests are given in Table 2. Drawdowns were low: upto 3% of the total water column (0.07–0.29 m). The re-
sults were analyzed using the software AQTESOLV 4.5 [22].Pumping tests were performed approximately one monthafter the drilling and slug tests, from March 24 to April1, 2009 (WMS Rakičan being again an exception on Au-gust 25, 2009). The Theis method for pumping tests wasused�rst [23], as it is among themostwell-knownmethodsand is applicable to aquifers with intergranular porosity;following that, the Neuman method was also applied forcomparison. The results of calculations using the uncon-�ned method were used for boreholes from the locationsGerečja vas, Dornava, Krapje, and Rakičan, whilst the re-sults of the con�nedmethodwere used for the Veščica andOdranci WMS, although values for all locations were cal-culated using both methods. A correction was performedin the AQTESOLV program, which permits the applicationof the Theismethod to an uncon�ned setting. The Bouwer-Rice methodwas selected for the analysis of slug test data.
Slug tests were performed twice at each of the twelveboreholes. The water table reached its original levelrapidly after the start of each slug test (in less than aminute), as the gravels are highly transmissive. For furthercomparison of the K values, the geometric mean of bothtests on each borehole was used, except for WMS Veščica,where values for borehole VE-2/09 are missing due to ameasuring-probe malfunction, and only data from bore-hole VE-1/09 were used.

314 | T. Pucko and T. Verbovšek
Figure 2: Box plot of hydraulic conductivity values obtained forgrain size, grouped by grain-size method. Values of K are presentedin logarithmic format as exponents (log K instead of K), as this pa-rameter is known to be lognormally distributed [24].
3 Results and discussion
3.1 Grain-size analysis
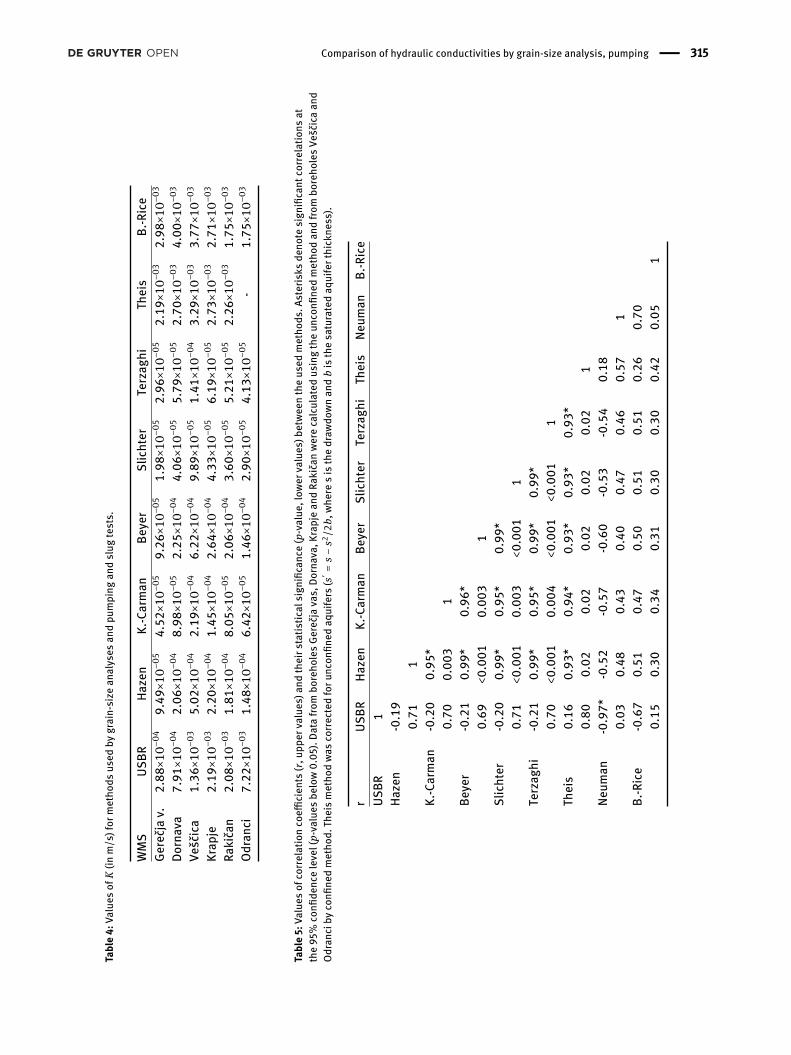
Box-plots of Kgrain−size with depth show that the high-est values of hydraulic conductivities are obtained by theUSBR method in all analyzed samples (Figure 2, Table 4).These values also have amuch larger data span than othermethods. In general, the di�erences are signi�cant, rang-ing up to two orders of magnitude. Apart from a visualinspection of high data values, the di�erences were alsocon�rmed by t-tests, which showed that the USBR groupdi�ered signi�cantly from the rest at the 95% con�dencelevel.
Conversely, the Slichter method gives the lowest esti-mations of K, and this group can also be statistically di�er-entiated from all of the others (with signi�cant di�erence).
The Beyer and Hazen methods give very similar val-ues (not proven to be di�erent by t-tests), followed by theKozeny-Carman and Terzaghi methods. Some authors alsofound that themethodsofHazen, Terzaghi, andBeyer gavevery similar results [6]. Interestingly, [11] found that theUSBR method produced the lowest values.
3.2 Pumping and slug tests
Results from pumping tests were analyzed with the Theisand Neuman methods. Data from WMS Odranci were notuseddue to the large time spanbetween themeasurementsandmeasuring errors, which all contributed to a problem-
Figure 3: Comparison of hydraulic conductivity values obtained forgrain-size, pumping, and slug tests.
atic interpretation of the hydraulic conductivities. There-fore this measuring station has been omitted from theseanalyses.
3.3 Comparison of values determined bygrain-size analyses and pumping andslug tests
Finally, hydraulic conductivities from the grain-size analy-ses were compared to those obtained by pumping and slugtests. Figure 3 summarizes the comparisons. It is obviousthat the grain-size analyses yield much lower values thanthe pumping or slug test methods, with di�erences of upto approximately two orders of magnitude.
The main reason for such poor prediction may lie inthe domain of applicability of grain-size methods. In theliterature, the USBR is considered inaccurate [14], and thesame holds for the Hazen formula due to its failure to re-produce low values of K [8]. The latter should be replacedby the Kozeny-Carman method [5].
The behavior of the USBR curve is completely di�erentfrom other grain-size, pumping, and slug test curves (Fig-ure 3). Apart from the already mentioned di�erences, theUSBR is also the only method to overestimate other meth-ods’ results for the OdranciWMS location. Such a poor cor-relation is also con�rmed by the correlation coe�cients(Table 5), where correlation of USBR with other methodsgives very low coe�cients (even negative). There can beseveral reasons for such behavior, among them that theUSBRmethod uses a di�erent estimation of e�ective graindiameter de (d20 instead of d10) and also takes the value ofporosity to be one (1). The methods mainly rely on particlesize,which is considered themost important parameter forthe determination of K [11]. Another method which uses aporosity value of one is the Beyer method, which gives themost similar results to USBR. Based on the results of our
Comparison of hydraulic conductivities by grain-size analysis, pumping | 315
Table4:
Values
ofK(in
m/s
)for
metho
dsus
edby
grain-size
analys
esan
dpu
mping
andslug
tests.
WMS
USBR
Hazen
K.-Carman
Beyer
Slichter
Terzaghi
Theis
B.-Rice
Gerečjav.
2.88×10−
049.49×10−
054.52×10−
059.26×10−
051.98×10−
052.96×10−
052.19×10−
032.98×10−
03
Dornava
7.91×10−
042.06×10−
048.98×10−
052.25×10−
044.06×10−
055.79×10−
052.70×10−
034.00×10−
03
Veščica
1.36×10−
035.02×10−
042.19×10−
046.22×10−
049.89×10−
051.41×10−
043.29×10−
033.77×10−
03
Krapje
2.19×10−
032.20×10−
041.45×10−
042.64×10−
044.33×10−
056.19×10−
052.73×10−
032.71×10−
03
Rakičan
2.08×10−
031.81×10−
048.05×10−
052.06×10−
043.60×10−
055.21×10−
052.26×10−
031.75×10−
03
Odranci
7.22×10−
031.48×10−
046.42×10−
051.46×10−
042.90×10−
054.13×10−
05-
1.75×10−
03
Table5:
Values
ofco
rrelationco
e�cien
ts(r,u
pper
values
)and
theirs
tatis
tical
sign
i�ca
nce(p
-value
,low
erva
lues
)betwee
ntheus
edmetho
ds.A
sterisks
deno
tesign
i�ca
ntco
rrelations
atthe95
%co
n�de
nceleve
l(p-va
lues
below
0.05
).Da
tafro
mbo
reho
lesGe
rečjava
s,Do
rnav
a,Kr
apje
andRa
kiča
nwereca
lculated
usingtheun
con�
nedmetho
dan
dfro
mbo
reho
lesVe
ščicaan
dOd
ranc
ibyco
n�ne
dmetho
d.Th
eismetho
dwas
correc
tedforu
ncon
�ned
aquifers
(s′ =
s−s2/2b,
whe
resis
thedr
awdo
wnan
dbis
thesa
turatedaq
uifert
hick
ness
).
rUS
BRHa
zen
K.-Carman
Beyer
Slichter
Terzaghi
Theis
Neum
anB.-Rice
USBR
1Ha
zen
-0.19
0.71
1K.-Carman
-0.20
0.95
*0.70
0.00
31
Beyer
-0.21
0.99
*0.96
*0.69
<0.001
0.00
31
Slichter
-0.20
0.99
*0.95
*0.99
*0.71
<0.001
0.00
3<0.001
1Terzaghi
-0.21
0.99
*0.95
*0.99
*0.99
*0.70
<0.001
0.00
4<0.001
<0.001
1Theis
0.16
0.93
*0.94
*0.93
*0.93
*0.93
*0.80
0.02
0.02
0.02
0.02
0.02
1Ne
uman
-0.97*
-0.52
-0.57
-0.60
-0.53
-0.54
0.18
0.03
0.48
0.43
0.40
0.47
0.46
0.57
1B.-Rice
-0.67
0.51
0.47
0.50
0.51
0.51
0.26
0.70
0.15
0.30
0.34
0.31
0.30
0.30
0.42
0.05
1
316 | T. Pucko and T. Verbovšek
study, the usage of the USBR method is therefore not ad-visable even though it provides the most similar values tothe pumping tests.
The Slichter method is the only valid method for grav-els according to the domain of applicability, even though itgives the lowest values of estimated K. Some authors havealso found that it underestimates K values [9].
The results agree with those of [14], as their trans-missivity estimates from pumping tests were several timeshigher than those from grain-size distributions. The latterare not in�uenced by hydraulic boundaries, and representmuch larger-scale analyses [7].
Values of Kgrain−size are known to bemostly lower thanhorizontal K values from hydraulic analyses [6, 11]. An ex-ception is the work of [7], where K values from grain sizeswere about three times larger than those from pumpingtests.
Generally, apart from the USBR method, the relation-ships between Kgrain−size methods and KTheis are strong(with correlation coe�cients values about (r ∼ 0.93) andsigni�cant at more than the 95% level Table 5). There areno correlations between the hydraulic conductivities ob-tained by the Theis method and the USBR method (r ∼0.16, nonsigni�cant). Interestingly, the relationships be-tween Kgrain−size and KNeuman aremuchweaker, with r giv-ing lower values and even negative correlations. Thereforethe results for the Neuman method are not considered ordiscussed further in the results. Other correlations withhydraulic conductivities from grain-size analyses are verysimilar, as the correlation coe�cients are very high (Ta-ble 5). There are also no strong correlations between anyof the grain-size analysis and the Bouwer-Rice methods,as all relationships are nonsigni�cant and the correlationcoe�cients are around 0.50.
The relationship of Kgrain−size with KBouwer−Rice givesvery low values of r = 0.16 and p = 0.03. Poor correlationof K values with those from slug tests can be straightfor-wardly explained, as the e�ective area of slug tests is verysmall, being only 0.1 m around the borehole, whereas thepumping tests consider a much larger region of up to sev-eral tens of meters [7]. The tested region is therefore notrepresentative of thewhole aquifer. Additionally, slug testsare more suitable for sediments with lower permeabilitiesthan the gravels which were analyzed in this study.
4 ConclusionsThe distribution of hydraulic conductivities obtained fromgrain-size analyses shows that the highest values of K
are obtained by the USBR method, and that these val-ues do not compare well with other methods. The val-ues obtained from the Beyer and Hazen methods are thehighest and most similar in comparison, followed by theKozeny-Carman and Terzaghi methods and �nally by theSlichter method, which always yields the lowest values ofhydraulic conductivities. Theoretical assumptions for thegrain size and the coe�cient of grain uniformity were sat-is�ed most often for the Slichter method and sometimesfor the Beyer method but not at all for the others.
The only advisable method for the estimation of Kfromgrain-size analyses in this studywould be the Slichtermethod due to its applicability domain. It does, however,give the lowest values of Kwhen compared to the pumpingtests. Such estimation should therefore be used with greatcaution because the results cannot be estimated directlyand the values of Kgrain−size are up to two orders of mag-nitude lower than those of KTheis. The use of the empiricalregression equation is recommended.
Whilst the USBRmethod gives themost similar valuesto the pumping or slug tests, the general shape of the curveand very low or illogical correlation coe�cients show thatthe method should not be used for the estimations.
Other grain-size-based methods with similar correla-tion coe�cients can be used with caution by adding re-gression equations (similar to the Slichter method), al-though they should not be applied to gravels due to thedomain of method applicability.
Finally, we can conclude that based on presented re-sults, the results from grain-size analyses can be com-pared among themselves (except for the USBR method),as con�rmed by very high and signi�cant correlation co-e�cients. However, the correlations of grain-size analy-ses with pumping test or slug test methods are generallymuch weaker, as they give non-signi�cant very poor cor-relations. If however used, they should be performed withcaution (correlations should be tested) and some possiblebetter correlations could be expected on other datasets.Apart from the domain of applicability of grain-size meth-ods, most probably the poor correlations can be attributedto scale e�ect, as grain-size analysis test only a small areaof sediment, and on the other side pumping tests obtainhydraulic conductivities from a much larger area. Also,slug tests greatly underestimate the hydraulic conductiv-ities by an order of magnitude.
Acknowledgement: The authors would like to thank Mar-tin Tancar and others from the company HGEM d.o.o. fortheir assistance and the anonymous reviewers for theirconstructive comments.

Comparison of hydraulic conductivities by grain-size analysis, pumping | 317
References[1] Hazen A., Some physical properties of sands and gravels, with
special reference to their use in �ltration, 1892, MassachusettsState Board of Health, Boston, 1995, 539–556.
[2] Kozeny J., Über Kapillare Leitung Des Wassers in Boden.Sitzungsber. Akad. Wiss. Wien Math. Naturwiss. Kl., 1927,2a(136), 271–306.
[3] Slichter C.S., Field measurements of the rate of movement ofunderground waters. U S Geological Survey. Water-supply andirrigation paper 1905, Washington, Government Printing O�ce122, iii p.
[4] Alyamani M.S., kSen Z., Determination of hydraulic conductiv-ity from complete grain-size distribution curves. Groundwater,1993, 31(4), 551–555.
[5] Carrier W.D., Goodbye, Hazen; hello, Kozeny-Carman. J.Geotech. Geoenviron. Eng., 2003, 129(11), 1054.
[6] Cheng C., Chen X., Evaluation of methods for determination ofhydraulic properties in an aquifer–aquitard system hydrologi-cally connected to a river. Hydrogeol. J., 2007, 15(4), 669–678.
[7] Cheong J.-Y. et al., Estimating hydraulic conductivity usinggrain-size analyses, aquifer tests, and numerical modeling ina riverside alluvial system in South Korea. Hydrogeol. J., 2008,16(6), 1129–1143.
[8] Eggleston J., Rojstaczer S., The value of grain-size hydraulicconductivity estimates: Comparisonwith high resolution in-situ�eld hydraulic conductivity. Geophys. Res. Lett., 2001, 28(22),4255–4258.
[9] Odong J., Evaluation of empirical formulae for determination ofhydraulic conductivity based on grain-size analysis. J. Am. Sci.,2008, 4(1).
[10] Shepherd R.G., Correlations of permeability and grain size.Groundwater, 1989, 27(5), 633–638.
[11] Song J. et al., Feasibility of grain-size analysis methods for de-termination of vertical hydraulic conductivity of streambeds. J.Hydrol., 2009, 375(3/4), 428–437.
[12] Uma K.O., Egboka B.C.E., Onuoha K.M., New statistical grain-size method for evaluating the hydraulic conductivity of sandy
aquifers. J. Hydrol., 1989, 108(0), 343–366.[13] Kasenow M., Determination of Hydraulic Conductivity from
GrainSizeAnalysis, 2002,Water ResourcesPublications, Engle-wood, CO.
[14] Vuković M., Soro A., Determination of hydraulic conductivityof porous media from grain-size composition, 1992, Water Re-sources Publications Littleton, CO, 83 p.
[15] Rosas J. et al., Determination of hydraulic conductivity fromgrain-size distribution for di�erent depositional environments.Groundwater, 2014, 52(3), 399–413.
[16] Kralj P., Kralj P., Thermal and mineral waters in north-easternSlovenia. Env. Geol., 2000, 39(5), 488–500.
[17] Mioč P., Markovič S., Osnovna geološka karta RS in RH.1:100.000: Tolmač za list Čakovec, Basic geological map of Re-public of Slovenia and Republic of Croatia. 1:100,000. Guideto the sheet Čakovec, 1998, Ljubljana, Slovenia: Inštitut za ge-ologijo, geotehnologijo in geo�ziko (in Slovene).
[18] Kranjc M. et al., Poročilo o kakovosti podzemne vode v Slovenijiv letu 2006, Groundwater quality report for 2006, 2008, Slove-nian Environment Agency (ARSO), Ljubljana, Slovenia, 162.
[19] Verbovšek T., Estimation of transmissivity and hydraulic con-ductivity from speci�c capacity and speci�c capacity index indolomite aquifers. J. Hydrol. Eng., 2008, 13(9), 817–823.
[20] Abou�rassi M., Mariño M.A., Cokriging of aquifer transmissivi-ties from �eld measurements of transmissivity and speci�c ca-pacity. Math. Geol., 1984, 16(1), 19–35.
[21] Ahmed S., DeMarsily G., Comparison of geostatistical methodsfor estimating transmissivity using data on transmissivity andspeci�c capacity. Water Resour. Res., 1987, 23(9), 1717–1737.
[22] Hydrosolve, AQTESOLV forWindows, 2006, Hydrosolve, Reston,VA.
[23] KrusemanG.P., Ridder N.A.D., Analysis and evaluation of pump-ing test data. 2nd. ed. International Institute for Land Reclama-tion and Improvement Bulletin, 2000, International Institute forLand Reclamation and Improvement, Wageningen, The Nether-lands, 275.
[24] Verbovšek T., VeseličM., Factors influencing thehydraulic prop-erties of wells in dolomite aquifers of Slovenia. Hydrogeol, J.,2008, 16(4), 779–795.