HYPERSPECTRAL BIDIRECTIONAL REFLECTANCE MEASUREMENTS OF FAGUS SYLVATICA LEAVES
Upload
xn--om-ykaCategory
view
1download
0
Central European Journal of Biology
* E-mail: [email protected]
Research Article
1 Ondokuz Mayis University, Faculty of Agriculture, Department of Farm Structures and Irrigation, Samsun, Turkey
2 Ondokuz Mayis University, Bafra Vocational School, Bafra, Samsun, Turkey
3 Ondokuz Mayis University, Faculty of Engineering, Department of Computer Engineering, Samsun, Turkey
4 North Dakota State University, Agricultural and Biosystems Engineering, Fargo, ND, United States
Kadir Ersin Temizel*1, Mehmet Serhat Odabas2, Nurettin Senyer3, Gokhan Kayhan3, Sreekala Gopalapillai Bajwa4, Omer Caliskan2, Erhan Ergun3
Comparision of some models for estimation of reflectance of hypericum leaves under stress
conditions
1. IntroductionPlants are valuable sources of phytochemicals; the phytochemicals with medicinal value has huge potential in drug development. Today, several chemicals derived from plants are used worldwide as important drugs. Hypericum species have been used as traditional medicinal plants due to their wound-healing, bactericide, anti- inflammatory, diuretic and sedative properties for many centuries [1-3]. The major phytomedicinal compounds of Hypericum plants are thought to be
phloroglucinol derivatives hyperforin and adhyperforin, the naphthodianthrones hypericin, pseudohypericin, the flavonoids hyperoside, rutin, quercitrin, quercetin and biapigenin, the phenylpropanes caffeic acid, chlorogenic acid, and essential oils which possess a wide array of biological properties [4-6]. H. perforatum is the most popular plant species used in the treatment of mild to moderate depression today. It should be noted that H. perforatum also has a potential for Acquired Immuno Deficiency Syndrome (AIDS) treatment [7-9].
Cent. Eur. J. Biol. • 9(12) • 2014 • 1226-1234DOI: 10.2478/s11535-014-0356-4
1226
Received 8 January 2014; Accepted 14 April 2014
Keywords: Hypericum • Multiple Linear Regression (MLR) • ANN • ANFIS • Stress Condition
Abstract: Lack of water resources and high water salinity levels are among the most important growth-restricting factors for plants species of the world. This research investigates the effect of irrigation levels and salinity on reflectance of Saint John’s wort leaves (Hypericum perforatum L.) under stress conditions (water and salt stress) by multiple linear regression (MLR), artificial neural network (ANN) and adaptive neuro-fuzzy inference system (ANFIS). Empirical and heuristics modeling methods were employed in this study to relate stress conditions to leaf reflectance. It was found that the constructed ANN model exhibited a high performance than multiple regression and ANFIS in estimating leaf reflectance accurately.
© Versita Sp. z o.o.
UnauthenticatedDownload Date | 6/30/16 10:09 PM
Kadir Ersin Temizel et al
Commercial drug application would require large-scale production of this plant. Therefore, it is important to understand and optimize production factors. Salinity is one of the major factors that affect plant growth; it is a serious problem in many areas of world’s causing considerable loss in agricultural production [10]. Saline soils occupy over 7% of the earth’s land surface, and show high levels of salinity due to the soluble salts in irrigation water, fertilizers used in agriculture, and the saline soils in the soil profile [11]. The deleterious effects of salinity on plant growth are associated with low osmotic potential of soil solution (water stress), nutritional imbalance, specific ion effect (salt stress), or a combination of these factors [12]. Saline soils are generally dominated by sodium ions, with the dominant anions being chloride and sulphate, as they have a high sodium absorption rate at high pH and electrical conductivities (>4 dSm-1) [13]. Soil salinity may reduce micronutrients uptake due to stronger competition by salt cations at the root surface [14].
The aim of this study was to determine the empirical relationships between reflectance and plant stress levels of hypericum leaves under stress conditions using multiple regression, artificial neural network and ANFIS models. If plant stress due to salinity and water can be quantitatively related to leaf reflectance, it could be used as an effective tool to monitor and manage this plant under these stress conditions.
2. Experimental Procedures2.1 Plant establishment
Seeds were germinated in a float system, commonly used for seedling production of broad-leaves tobacco Burley and Flue-Cured-Virginia under a 16 h light: 8 h dark cycle. Newly emerged seedlings were transferred to pots, 26 cm in diameter, filled out with a peat, pearlite and soil (1:1:1) mixture. They were watered daily until reaching maturity. After maturation, the pots were moved to greenhouse conditions.
2.2 Salt stress and water deficiency experiments
City water supply (ECi: 0.4 dS/m) was used as irrigation water during the experiment. The salts NaCl, CaCl2 and MgCl2 at doses of 0.4 (control, S0), 1 (S1), 2.5 (S2), 4 (S3) and 8 (S4) dS/m were added to the irrigation water and applied to the plant to generate the four salt stress treatments. The doses were selected from the previous publications [15,16]
For water deficiency experiments, firstly control pots were irrigated with city water supply fully, and left to drain for fifteen minutes. Then the amount of irrigation water not leaked but held by the soils in the pots was determined as the required water (W). Thus, a total of 3 water treatments of W1, W2 and W3 (80, 100 and 120% of required water, respectively) were used in the water stress experiment. The pots were watered weekly. The experimental design was a full factorial completely randomized experiment with 3 replications. Thus 45 pots were used. The experimental factors were combined as the following and applied in 18 times with 2-3 days intervals. The reflectance measurements between 325 – 1075 nm were made by means of a spectroradiometer (model Field Spec Pro FR, ASD, Boulder, USA). Three spectral measurements were made for each pot.
2.3 Data analyses
Data were analyzed for normal distribution and using analysis of variance. Modelling was done with MLR, ANN and ANFIS were implemented using the MATLAB software (Matlab® R2013a).
2.4 MLR model construction
The general purpose of multiple linear regression is to learn more about the relationship between several independent or predictor variables (x) and a dependent or criterion variable (y). A linear regression model assumes that the relationship between the dependent variable and independent variable(s) is linear. The model takes form yi = b0 + b1xi + … + bpxip + eI, i= 1, …, n,
so that xi′β is the inner product between vectors xi and β where ′ denotes the transpose.
The terminology used is: y is dependent variable and x are independent variables. Usually a constant (b0) is included as one of the regressors [17]. The best models to predict the reflectance were developed with a least square analysis with various subsets of the independent variables, namely, wavelength (nm), irrigation levels (%), salt doses (dS/m), and their interactions.
2.5 Artifical neural network (ANN)
Artificial neural networks resemble human brain in two respects; the network acquires knowledge through a learning process, and the interconnection strengths known as synaptic weights are used to store the knowledge [18,19]. ANNs are data driven self-adaptive non-linear systems. They can identify and learn correlated patterns between input data sets and corresponding target values, even when the underlying
1227
UnauthenticatedDownload Date | 6/30/16 10:09 PM
Comparision of some models for estimation of refl ectance of hypericum leaves under stress conditions
data relationship is unknown. ANNs have been widely used to model complex and non-linear processes and systems [20]. The ANNs can be explicitly programmed to perform a task by manually creating the topology and then setting the weights and thresholds of each link. The process of determining weights and biases is called training. The observed data set used to train the ANN is called the training data set. The training data set consists of input signals assigned with corresponding target (desired) output. The network training is an iterative process. In each iteration, weight coeffi cients of nodes are modifi ed using new data from the training data set. The weight coeffi cients and biases are adjusted in each iteration so as to minimize the error of prediction of target value. In this study, Levenberg-Marquardt (LM) Algorithm was used to train the network.
The Levenberg-Marquardt (LM) algorithm is an intermediate optimization algorithm between the Gauss–Newton (GN) and Gradient Descent (GD) algorithms [21]. It combines the speed of the GN algorithm with the stability of the GD method.
For LM algorithm, the performance index is optimized by minimizing error as defi ned below:
∑=
=−=K
kKPKPk Kkode
1
2 ....1)( (1)
where ek is the kth error vector, w=[w1 w2 … wN]T consists of all weights of the network, dkp is the desired value of the kth output and the pth pattern , okp is the actual value of the kth output and the pth pattern, p is pattern number and K is the number of the network outputs [22].
Jacobien matrix can be computed as equation:
(2)
Hessian matrix can be computed as equation.
IJJHT
m+= (3)
where m: Marquardt learning parameter, and I: unit matrix. All weights of the network can be updated as equation.
gHWWtt 1)()1( −+
−= (4)
where g , the Gradient vector can be computed as:
eJgT
= (5)
Notice that when µ is large, the algorithm becomes steepest descent, while for small µ the algorithm becomes Gauss-Newton. The Marquardt-Levenberg algorithm can be considered a trust-region modifi cation to Gauss-Newton [23].
2.6 Adaptive Neuro-Fuzzy Inference System (ANFIS)
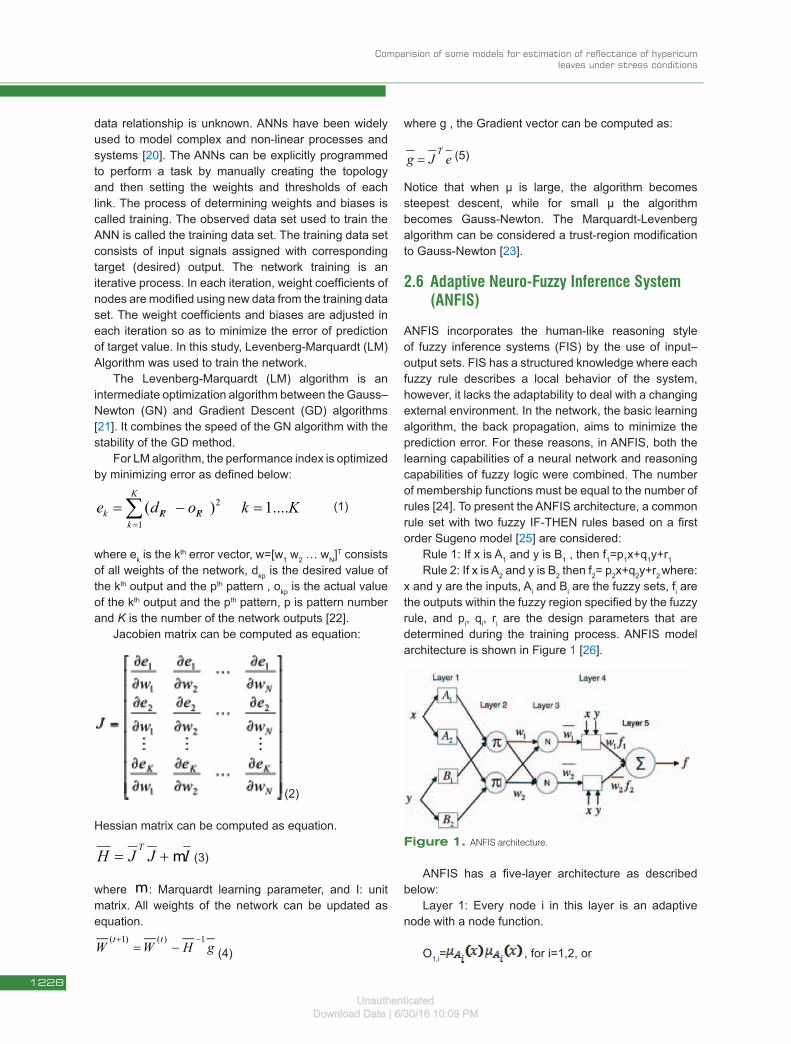
ANFIS incorporates the human-like reasoning style of fuzzy inference systems (FIS) by the use of input–output sets. FIS has a structured knowledge where each fuzzy rule describes a local behavior of the system, however, it lacks the adaptability to deal with a changing external environment. In the network, the basic learning algorithm, the back propagation, aims to minimize the prediction error. For these reasons, in ANFIS, both the learning capabilities of a neural network and reasoning capabilities of fuzzy logic were combined. The number of membership functions must be equal to the number of rules [24]. To present the ANFIS architecture, a common rule set with two fuzzy IF-THEN rules based on a fi rst order Sugeno model [25] are considered:
Rule 1: If x is A1 and y is B1 , then f1=p1x+q1y+r1
Rule 2: If x is A2 and y is B2 then f2= p2x+q2y+r2 where:x and y are the inputs, Ai and Bi are the fuzzy sets, fi are the outputs within the fuzzy region specifi ed by the fuzzy rule, and pi, qi, ri are the design parameters that are determined during the training process. ANFIS model architecture is shown in Figure 1 [26].
ANFIS has a fi ve-layer architecture as described below:
Layer 1: Every node i in this layer is an adaptive node with a node function.
O1,i= , for i=1,2, or
Figure 1 . ANFIS architecture.
1228
UnauthenticatedDownload Date | 6/30/16 10:09 PM

Kadir Ersin Temizel et al
O1,i= , for i=3,4,
where x, and y are the inputs to node i, and Ai, and Bi are the linguistic labels (such as “small” or “large”) associated with this node. In other words, O1,i is the membership function of Ai, and it specifies the degree to which the given x satisfies the quantifier Ai. For example, if the Gaussian membership function is employed,
given by
(6)
where {ai,bi} is the parameter set of the membership function. These parameters are referred to as premise parameters.
Layer 2: Every node in this layer is a fixed node labeled as P . This layer involves fuzzy operators. It uses the AND operator to fuzzy the inputs. The output of this layer can be represented as:
(7)
Layer 3: Every node in this layer is a fixed node labeled N .The ith node calculates the ratio of the ith rule’s firing strength to the sum of all rule’s firing strengths:
(8)
where is an outputs of this layer which is a vector called normalized firing strengths.
Layer 4: Every node i in this layer is an adaptive node. The output of each node is simply the product of the normalized firing strength and a first order polynomial.
(9)
where {pi,qi,ri} are the consequent parameters.Layer 5: The single node in this layer is a fixed node
labeled ∑. This node computes the overall output as the summation of all incoming signals.
(10)
ANFIS used in hybrid learning algorithm integrates Gradient Descent and Least Squares Estimation algorithm. The hybrid algorithm is composed of a forward pass and a backward pass (Table 1).
2.7 Model performance comparison and evaluation
In this research, models were optimized using MATLAB toolbox. The ANN-MLP model used 13 hidden neuron with logsig activation function. The model was set to stop training at 100 epochs. The ANFIS model used 3x3x3 fuzzy rules (gaussmf) and 400 epochs.
In this study, values accounted for (VAF) and root mean square error (RMSE) were calculated to evaluate the prediction capacity of MLR model developed in the study.
�
VAF = 1−var y − ′ y ( )
var y( )
x 100
(11)
(12)
�
RMSE =1N
y − ′ y ( )2
i=1
N
∑
where y and y’ are the calculated and predicted values, respectively. If the variance accounted for (VAF) is 100% and root mean square error (RMSE) is 0, the model would be perfect model. Mean absolute percentage error (MAPE) is a measure of accuracy for a fitted series in statistics. It was used as another measure of model performance.
�
MAPE =1N
Ai − Pi
Ai
x 100i=1
N
∑ (13)
Where,
�
Ai is the observed value and
�
Pi is the predicted va lue. The calculated values of RMSE, VAF and MAPE indicated high prediction performances.
3. Results and discussionMultiple Linear Regression (MLR) and Artificial Neural Network (ANN) models are both widely used in many areas for prediction and classification purposes. MLR is a traditional statistical technique, and it has an established methodology. ANN is a computational modeling tool that used to solve many complex real world problems due to its remarkable learning and generalization capabilities [27,28].
Table 1. Hybrid learning algorithm for ANFIS.
Parameters Forward Pass Backward pass
Premise Fixed Gradient Descent
Consequent Least-squares estimator
Fixed
1229
UnauthenticatedDownload Date | 6/30/16 10:09 PM
Comparision of some models for estimation of refl ectance of hypericum leaves under stress conditions
ANN is being used in water quality and water resources to estimate evaporation, evapotranspiration, rainfall, runoff, and nutrient transportation [29,30], accounting and fi nance [31], health and medicine [32,33], engineering and manufacturing [34,35], and marketing [36,37]. The ANN and MLR are used to predict the empirical relationships between refl ectance and plant stress levels of hypericum leaves under stress conditions using multiple regression, artifi cial neural network and ANFIS models. Artifi cial neural network and ANFIS models are outperformed compared to multivariate regression [38].
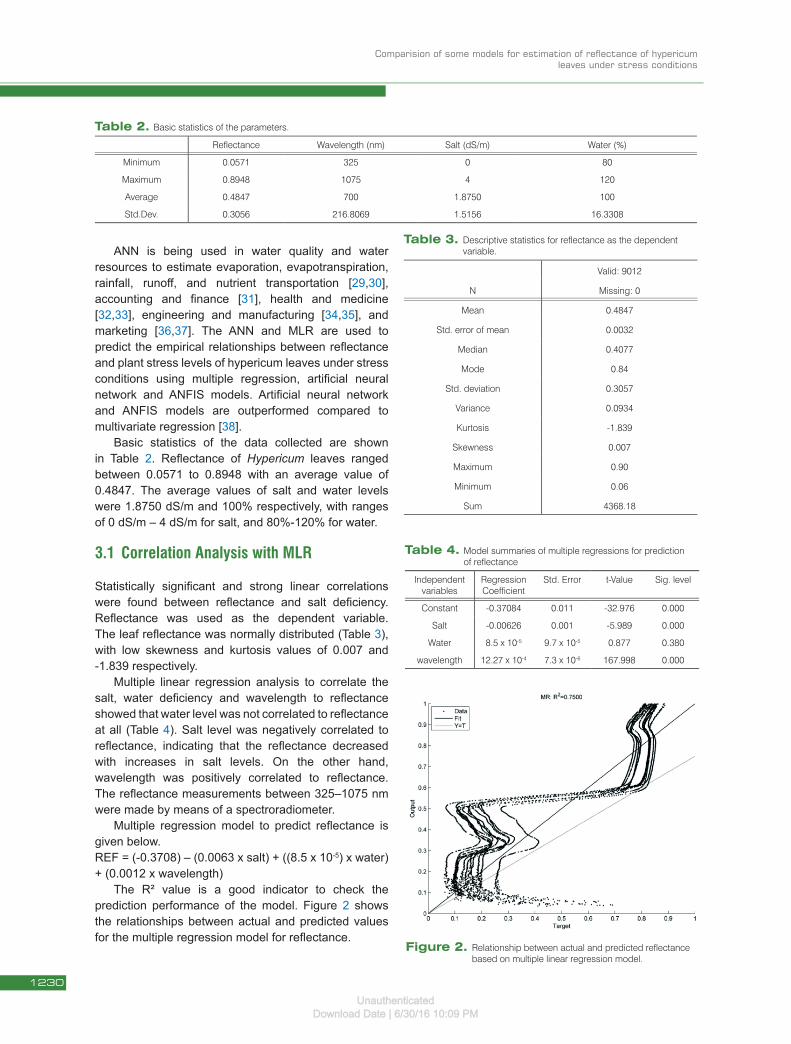
Basic statistics of the data collected are shown in Table 2. Refl ectance of Hypericum leaves ranged between 0.0571 to 0.8948 with an average value of 0.4847. The average values of salt and water levels were 1.8750 dS/m and 100% respectively, with ranges of 0 dS/m – 4 dS/m for salt, and 80%-120% for water.
3.1 Correlation Analysis with MLR
Statistically signifi cant and strong linear correlations were found between refl ectance and salt defi ciency. Refl ectance was used as the dependent variable. The leaf refl ectance was normally distributed (Table 3), with low skewness and kurtosis values of 0.007 and -1.839 respectively.
Multiple linear regression analysis to correlate the salt, water defi ciency and wavelength to refl ectance showed that water level was not correlated to refl ectance at all (Table 4). Salt level was negatively correlated to refl ectance, indicating that the refl ectance decreased with increases in salt levels. On the other hand, wavelength was positively correlated to refl ectance. The refl ectance measurements between 325–1075 nm were made by means of a spectroradiometer.
Multiple regression model to predict refl ectance is given below.REF = (-0.3708) – (0.0063 x salt) + ((8.5 x 10⁻⁵) x water) + (0.0012 x wavelength)
The R² value is a good indicator to check the prediction performance of the model. Figure 2 shows the relationships between actual and predicted values for the multiple regression model for refl ectance.
Table 2 . Basic statistics of the parameters.
Refl ectance Wavelength (nm) Salt (dS/m) Water (%)
Minimum 0.0571 325 0 80
Maximum 0.8948 1075 4 120
Average 0.4847 700 1.8750 100
Std.Dev. 0.3056 216.8069 1.5156 16.3308
Table 3. Descriptive statistics for refl ectance as the dependent variable.
N
Valid: 9012
Missing: 0
Mean 0.4847
Std. error of mean 0.0032
Median 0.4077
Mode 0.84
Std. deviation 0.3057
Variance 0.0934
Kurtosis -1.839
Skewness 0.007
Maximum 0.90
Minimum 0.06
Sum 4368.18
Table 4. Model summaries of multiple regressions for prediction of refl ectance
Independent variables
Regression Coeffi cient
Std. Error t-Value Sig. level
Constant -0.37084 0.011 -32.976 0.000
Salt -0.00626 0.001 -5.989 0.000
Water 8.5 x 10⁻⁵ 9.7 x 10⁻⁵ 0.877 0.380
wavelength 12.27 x 10⁻⁴ 7.3 x 10⁻⁶ 167.998 0.000
Figure 2. Relationship between actual and predicted refl ectance based on multiple linear regression model.
Figure 2.
1230
UnauthenticatedDownload Date | 6/30/16 10:09 PM
Kadir Ersin Temizel et al
In this study, values accounted for (VAF) and root mean square error (RMSE) were calculated to evaluate the prediction capacity of MLR model developed in the study as employed by Yilmaz and Kaynar [19]. Mean absolute percentage error (MAPE) is a measure of accuracy in a fi tted series value in statistics. It was used for comparison of the predicted model performance (Table 5).
3.2 ANN Model Performance
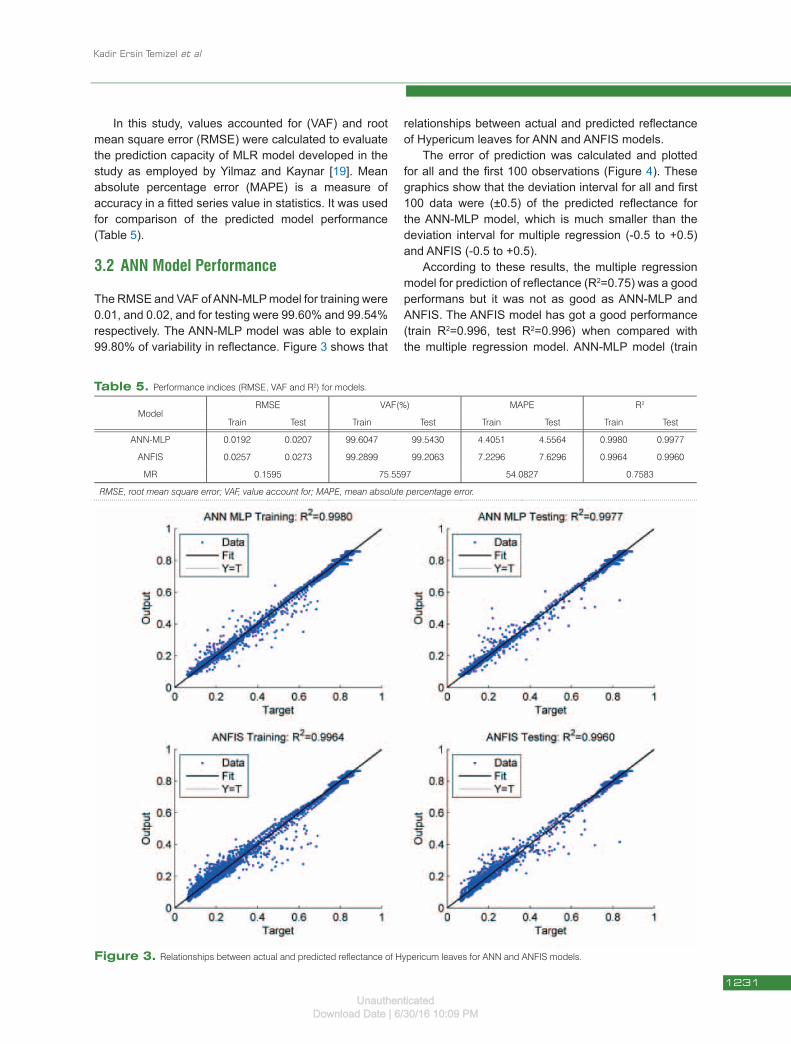
The RMSE and VAF of ANN-MLP model for training were 0.01, and 0.02, and for testing were 99.60% and 99.54% respectively. The ANN-MLP model was able to explain 99.80% of variability in refl ectance. Figure 3 shows that
relationships between actual and predicted refl ectance of Hypericum leaves for ANN and ANFIS models.
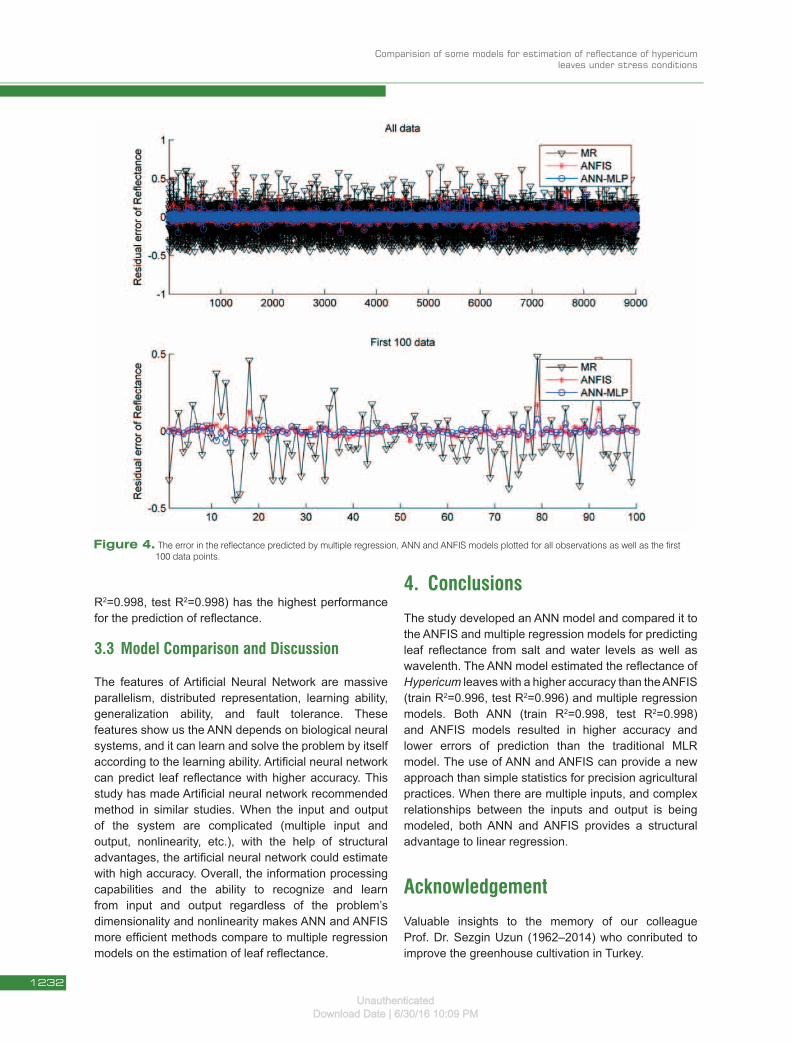
The error of prediction was calculated and plotted for all and the fi rst 100 observations (Figure 4). These graphics show that the deviation interval for all and fi rst 100 data were (±0.5) of the predicted refl ectance for the ANN-MLP model, which is much smaller than the deviation interval for multiple regression (-0.5 to +0.5) and ANFIS (-0.5 to +0.5).
According to these results, the multiple regression model for prediction of refl ectance (R2=0.75) was a good performans but it was not as good as ANN-MLP and ANFIS. The ANFIS model has got a good performance (train R2=0.996, test R2=0.996) when compared with the multiple regression model. ANN-MLP model (train
Table 5. Performance indices (RMSE, VAF and R2) for models.
ModelRMSE VAF(%) MAPE R2
Train Test Train Test Train Test Train Test
ANN-MLP 0.0192 0.0207 99.6047 99.5430 4.4051 4.5564 0.9980 0.9977
ANFIS 0.0257 0.0273 99.2899 99.2063 7.2296 7.6296 0.9964 0.9960
MR 0.1595 75.5597 54.0827 0.7583
RMSE, root mean square error; VAF, value account for; MAPE, mean absolute percentage error.
Figure 3. Relationships between actual and predicted refl ectance of Hypericum leaves for ANN and ANFIS models.
1231
UnauthenticatedDownload Date | 6/30/16 10:09 PM
Comparision of some models for estimation of refl ectance of hypericum leaves under stress conditions
R2=0.998, test R2=0.998) has the highest performance for the prediction of refl ectance.
3.3 Model Comparison and Discussion
The features of Artifi cial Neural Network are massive parallelism, distributed representation, learning ability, generalization ability, and fault tolerance. These features show us the ANN depends on biological neural systems, and it can learn and solve the problem by itself according to the learning ability. Artifi cial neural network can predict leaf refl ectance with higher accuracy. This study has made Artifi cial neural network recommended method in similar studies. When the input and output of the system are complicated (multiple input and output, nonlinearity, etc.), with the help of structural advantages, the artifi cial neural network could estimate with high accuracy. Overall, the information processing capabilities and the ability to recognize and learn from input and output regardless of the problem’s dimensionality and nonlinearity makes ANN and ANFIS more effi cient methods compare to multiple regression models on the estimation of leaf refl ectance.
4. ConclusionsThe study developed an ANN model and compared it to the ANFIS and multiple regression models for predicting leaf refl ectance from salt and water levels as well as wavelenth. The ANN model estimated the refl ectance of Hypericum leaves with a higher accuracy than the ANFIS (train R2=0.996, test R2=0.996) and multiple regression models. Both ANN (train R2=0.998, test R2=0.998) and ANFIS models resulted in higher accuracy and lower errors of prediction than the traditional MLR model. The use of ANN and ANFIS can provide a new approach than simple statistics for precision agricultural practices. When there are multiple inputs, and complex relationships between the inputs and output is being modeled, both ANN and ANFIS provides a structural advantage to linear regression.
AcknowledgementValuable insights to the memory of our colleague Prof. Dr. Sezgin Uzun (1962–2014) who conributed to improve the greenhouse cultivation in Turkey.
Figure 4. The error in the refl ectance predicted by multiple regression, ANN and ANFIS models plotted for all observations as well as the fi rst 100 data points.
1232
UnauthenticatedDownload Date | 6/30/16 10:09 PM

Kadir Ersin Temizel et al
References
[1] Kirakosyan A., Gibson D., Sirvent T., Comparative survey of Hypericum perforatumplants as sourc-es of hypericins and hyperforin, Journal of Herbs Species and Medicinal Plants, 2003, 10, 110-122
[2] Cirak C., Saglam B., Ayan A.K., Kevseroglu K., Morphogenetic and diurnal variation of hy-pericin in some Hypericum species from Turkey during the course of ontogenesis, Biochemical Systematics and Ecology, 2006, 34, 1-13
[3] Cirak C., Radusiene J., Janulis V., Ivanauskas L., Chemical constituents of some Hypericum spe-cies growing in Turkey, Journal of Plant Biology, 2007a, 50(6), 632-635
[4] Patocka J., The chemistry pharmacology and toxicology of the biologically active constituents of the herb Hypericum perforatum L., Journal of Applied Biomedicine, 2003, 1, 61-73
[5] Cirak C., Radusiene J., Saglam B., Janulis V., Variation of bioactive substances and morpho-logical traits in Hypericum perforatum populations from Northern Turkey, Biochemical Systematics and Ecology, 2007b, 35, 403-409
[6] Cirak C., Bertolli A., Pistelli L., Seyis F., Essential oil composition and variability of Hypericum per-foratum from wild populations of northern Turkey, Pharmaceutical Biology, 2010, 48(8), 906-914
[7] Vlietinck A.J., De Beuyne T., Apers S., Pieters L., Plant derived leading compounds for chemo-therapy of human immunodeficiency virus (HIV) infection, Planta Medica, 1998, 64, 97-109
[8] Cirak C., Radusiene J., Stanius Z., Camas N., Caliskan O., Odabas M.S., Secondary metabo-lites of Hypericum orientale L. growing in Turkey: variation among populations and plant parts, Acta Physiologia Plantarum, 2012, 34, 1313–1320
[9] Cirak C., Radusiene J., Camas N., Caliskan O., Odabas M.S., Changes in the contents of main secondary metabolites in two Turkish Hypericum species during plant development, Pharmaceutical Biology, 2013, 51(3), 391-399
[10] Shao H.B., Chu L.Y., Jaleel C.A., Water-deficiet stress-induced anatomical changes in higher plants, C. R. Biologies, 2008, 331(3), 215-225
[11] Copeman R.H., Martin C.A., Stutz J.C., Tomato growth in response to salinity and mycorrhizal fungi from saline or non-saline soils, Hortscience, 1996, 31(3), 341–344
[12] Yildirim E., Taylor A.G., Effect of biological treatments on growth of bean plants under salt stress, Annual Report of the Bean Improvement Cooperative, 2005, 48, 176-177
[13] Flowers T.J., Flowers S.A., Why does salinity pose such a difficult problem for plant breeders? Agricultural Water Management, 2005, 78, 15-24
[14] Page A.L., Chang A.C., Adriano D.C., Agricultural salinity assessment stresses and management deficiencies and toxicities of trace elements, in: tanj, K.K. (Eds), Manuals and Reports on Eng. Practice, 1990, 71, 138-160
[15] Said-Al Ahl H.A.H., Meawad A.A., Abou-Zeid E.N., Ali M.S., Response of different basil vari-eties to soil salinity, Int. Agrophysics, 2010, 24, 183-188
[16] Kara B., Kara N., Effect of different salinity (NaCl) concentrations on the first development stages of root and shoot organs of wheat, Anadolu J. Agric. Sci., 2010, 25(1), 37-43
[17] Erper I.,Turkkan M., Odabas M.S., The math-ematical approach to the effect of potassium bicarbonate on mycelial growth of Sclerotinia sclerotiorum and Rhizoctonia solani in vitro, Zemdirbyste=Agriculture, 2011, 98(2), 195-204
[18] Bekat T., Erdogan M., Inal F., Genc A., Prediction of the bottom ash formed in a coal-fired power plant using artificial neural networks, Energy, 2012, 45, 882-887
[19] Yilmaz I., Kaynar O., Multiple regression, ANN (RBF, MLP) and ANFIS models for prediction of swell potential of clayey soils, Expert Systems with Applications, 2011, 38, 5958–5966
[20] Xing-Mei S., Ying-Tao J., Mei Y., Shao-Kun L., Ke-Rum W., Chong-Tao W., Artificial Neural Network to Predict Leaf Population Chlorophyll Content from Cotton Plant Images, Agric. Sci. in China, 2010, 9(1), 38-45
[21] Arfken G., The Method of Steepest Descents, In: Mathematical Methods for Physicists, 3rd (ed.): Academic Press (Orlando, USA), 1985, 428-436
[22] Wilamowski B.M., Chen Y., Malinowski A., Efficient algorithm for training neural networks with one hidden layer, In Neural Networks, IJCNN ’99 International Joint Conference USA, 1999, 35-45
1233
UnauthenticatedDownload Date | 6/30/16 10:09 PM

Comparision of some models for estimation of reflectance of hypericum leaves under stress conditions
[23] Hagan M.T., Menhaj M.B., Training feedforward networks with the marquardt algorithm, IEEE Transactions on Neural Networks, 1945, (6), 989–993
[24] Jang J.S., ANFIS: adaptive-network-based fuzzy inference system, IEEE Trans. Sys. Man. Cybern, 1993, 23(3), 665–685
[25] Yoneyama Y., Nonlinear control design based on generalized Takagi–Sugeno fuzzy systems, Journal of the Franklin Institute, 2013, 25-27
[26] Jang J.S., Sun C.T., Mizutani E., Neuro-Fuzzy and Soft Computing: A Computational Approach to Learning and Machine Intelligence, Upper Saddle River NJ: Prentice-Hall, 1997, 5-15
[27] Basheer I., Selection of methodology for mod-eling hyster esis behavior of soils using neural networks. J. Comput.-aided Civil Infrastruct. Eng, 2000, 5 (6), 445-463
[28] Paliwal M., Kumar U.A., Neural networks and statistical techniques: A review of applications, Expert systems with applications, 2009, 36, 2-17
[29] Tokar A.S., Johnson P.A., Rainfall–runoff mod-elling using artificial neural networks. Journal of Hydrologic Engineering, ASCE, 1999, 4(3), 232-239
[30] Tayfur G., Guldal V., Artificial neural networks for estimating daily total suspended sediment in nat-ural streams, Nordic Hydrology, 2006, 37, 69-79
[31] Lenard M.J., Alam P., Madey G.R., The applica-tion of neural networks and a qualitative response model to the auditor’s going concern uncer-tainty decision, Decision Sciences, 1995, 26(2), 209-227
[32] Reggia J.A., Neural computation in medicine. Artificial Intelligence Medicine, 1993, 5, 143-157
[33] Ottenbacher K.J., Smith P.M., Illig S.B., Linn R.T., Fiedler R.C., Granger C.V., Comparison of lo-gistic regression and neural networks to predict rehospitalization in patients with stroke, Journal of Clinical Epidemiology, 2001, 54(11), 1159-1165
[34] Feng C.X., Wang X., Digitizing uncertainty modeling for reverse engineering applications: Regression versus neural networks. Journal of Intelligent Manufacturing, 2002, 13(3), 189-199
[35] Yesilnacar E., Topal T., Landslide susceptibil-ity mapping: A comparison of logistic regres-sion and neural networks methods in a medium scale study, Hendek region, Turkey, Engineering Geology, 2005, 79(3-4), 251-266
[36] Fish K.E., Barnes J.H., Aiken M.W., Artificial neural networks: A new methodology for indus-trial market segmentation, Industrial Marketing Management, 1995, 24, 431-438
[37] Ainscough T.L., Aronson J.E., An empirical inves-tigation and comparison of neural networks and regression for scanner data analysis, Journal of Retailing and Consumer Services, 1999, 6(4), 205-217
[38] Ayoubi S., Sahrawat K.L., Comparing multivari-ate regression and artificial neural network to predict barley production from soil characteristics in northern Iran, Archives of Agronomy and Soil Science, 2011, 57 (5), 549-565
1234
UnauthenticatedDownload Date | 6/30/16 10:09 PM
Copyright © 2022 FDOKUMEN