Spectral reflectance properties of carbonates from terrestrial analogue environments: Implications...
16
Spectral reflectance properties of carbonates from terrestrial analogue environments: Implications for Mars Edward A. Cloutis a, , Stephen E. Grasby b , William M. Last c , Richard L eveill e d , Gordon R. Osinski e,f , Barbara L. Sherriff c a Department of Geography, University of Winnipeg, 515 Portage Avenue, Winnipeg, MB, Canada R3B 2E9 b Geological Survey of Canada—Calgary, Natural Resources Canada, 3303 33rd St. N.W., Calgary, Alberta, Canada T2L-2A7 c Department of Geological Sciences, University of Manitoba, Winnipeg, MB, Canada R3T 2N2 d Canadian Space Agency, 6767, route de l’A eroport, Saint-Hubert, QC, Canada J3Y 8Y9 e Department of Earth Sciences, University of Western Ontario,1151 Richmond Street, London, ON, Canada N6A 5B7 f Department of Physics & Astronomy, University of Western Ontario,1151 Richmond Street, London, ON, Canada N6A 5B7 article info Article history: Received 29 January 2009 Received in revised form 3 July 2009 Accepted 2 September 2009 Available online 10 September 2009 Keywords: Mars Analogue research Carbonates Impact cratering Spectroscopy abstract Spectroscopic analysis of carbonate-bearing samples from a variety of terrestrial environments provides important insights into spectroscopy-based investigations of Mars designed to detect the presence of carbonate minerals. In order to better address the spectral detectability of carbonates on Mars, we examined the spectral reflectance properties of carbonates and carbonate-bearing lithologies from a variety of terrestrial environments, including impact structures (Haughton, St. Martin, Eagle Butte), landslides (Frank), quarrying operations (Hecla), carbonates affected by weathering (Haughton, East German Creek), and sulfide–sulfate–carbonate assemblages (Central Manitoba). The goal is to identify processes and environments that can affect spectroscopy-based carbonate detection, for more detailed follow-on studies. Common carbonates appear to be stable, from a spectroscopic perspective, to various tectonic processes. Iron oxides/hydroxides do not appear to significantly affect spectral detectability of carbonates, as the spectrum-altering effects of these phases are largely restricted to the region below 1 mm, while useful carbonate absorption bands occur longward of 1.8 mm. Carbonate detection and characterization in the 0.35–2.5-mm region is largely restricted to a single absorption feature in the 2.3- mm region, which can be problematic for robust carbonate identification. While tectonic processes and iron oxide/hydroxide staining do not appear to significantly impair carbonate detection based on the 2.3-mm region absorption band, a number of other factors can affect carbonate detection. These include the fact that this absorption band is weak compared to many other minerals, a number of other minerals also exhibit absorption bands in this wavelength region (leading to possible misidentifications), and that even small abundances of minerals that absorb strongly in this region will reduce the strength of the carbonate absorption band. Identifying the nature of accessory minerals associated with carbonates can be used to constrain possible formation environments. Ongoing research at carbonate-bearing terrestrial analogue sites will continue to provide new insights into the occurrence and detection of carbonates on Mars. & 2009 Elsevier Ltd. All rights reserved. 1. Introduction Remote detections of carbonates on Mars are based largely on the use of reflectance and emittance spectroscopy. Collectively, the observational data suggest that carbonates are present, but at low abundances, across large parts of the surface. Carbonates seem to be present in a few small outcrops and as a minor component of surficial and atmospheric dust. The spectral detectivity of carbonates is a function of many factors including grain size, the nature of other materials with which they are mixed and the wavelength range used for detection (Ben- Dor and Banin, 1990; Wagner and Schade, 1996; Orofino et al., 1998, 1999, 2000; Fonti et al., 2001; Kirkland et al., 2003; Gilmore et al., 2004; Palomba et al., 2009). Some of the major spectro- scopy-based detections of carbonates on Mars are summarized below. Blaney and McCord (1989) conducted Earth-based telescopic observations of Mars and detected a weak absorption band that extended from 3.76 to 3.95 mm. The likeliest candidate to explain this feature was determined to be carbonate minerals, although a ARTICLE IN PRESS Contents lists available at ScienceDirect journal homepage: www.elsevier.com/locate/pss Planetary and Space Science 0032-0633/$ - see front matter & 2009 Elsevier Ltd. All rights reserved. doi:10.1016/j.pss.2009.09.002 Corresponding author. Tel.: +1 204 786 9386; fax: +1204 774 4134. E-mail addresses: [email protected] (E.A. Cloutis), Steve.Grasby@ NRCan-RNCan.gc.ca (S.E. Grasby), [email protected] (W.M. Last), Richard. [email protected] (R. L eveill e), [email protected] (G.R. Osinski), BL_sherriff@ umanitoba.ca (B.L. Sherriff). Planetary and Space Science 58 (2010) 522–537
-
Upload
independent -
Category
Documents
-
view
2 -
download
0
Transcript of Spectral reflectance properties of carbonates from terrestrial analogue environments: Implications...
ARTICLE IN PRESS
Planetary and Space Science 58 (2010) 522–537
Contents lists available at ScienceDirect
Planetary and Space Science
0032-06
doi:10.1
� Corr
E-m
NRCan-
Leveille
umanito
journal homepage: www.elsevier.com/locate/pss
Spectral reflectance properties of carbonates from terrestrial analogueenvironments: Implications for Mars
Edward A. Cloutis a,�, Stephen E. Grasby b, William M. Last c, Richard L�eveill�e d, Gordon R. Osinski e,f,Barbara L. Sherriff c
a Department of Geography, University of Winnipeg, 515 Portage Avenue, Winnipeg, MB, Canada R3B 2E9b Geological Survey of Canada—Calgary, Natural Resources Canada, 3303 33rd St. N.W., Calgary, Alberta, Canada T2L-2A7c Department of Geological Sciences, University of Manitoba, Winnipeg, MB, Canada R3T 2N2d Canadian Space Agency, 6767, route de l’A�eroport, Saint-Hubert, QC, Canada J3Y 8Y9e Department of Earth Sciences, University of Western Ontario, 1151 Richmond Street, London, ON, Canada N6A 5B7f Department of Physics & Astronomy, University of Western Ontario, 1151 Richmond Street, London, ON, Canada N6A 5B7
a r t i c l e i n f o
Article history:
Received 29 January 2009
Received in revised form
3 July 2009
Accepted 2 September 2009Available online 10 September 2009
Keywords:
Mars
Analogue research
Carbonates
Impact cratering
Spectroscopy
33/$ - see front matter & 2009 Elsevier Ltd. A
016/j.pss.2009.09.002
esponding author. Tel.: +1 204 786 9386; fax
ail addresses: [email protected] (E.
RNCan.gc.ca (S.E. Grasby), WM_Last@UManit
@asc-csa.gc.ca (R. L�eveill�e), [email protected]
ba.ca (B.L. Sherriff).
a b s t r a c t
Spectroscopic analysis of carbonate-bearing samples from a variety of terrestrial environments provides
important insights into spectroscopy-based investigations of Mars designed to detect the presence of
carbonate minerals. In order to better address the spectral detectability of carbonates on Mars, we
examined the spectral reflectance properties of carbonates and carbonate-bearing lithologies from a
variety of terrestrial environments, including impact structures (Haughton, St. Martin, Eagle Butte),
landslides (Frank), quarrying operations (Hecla), carbonates affected by weathering (Haughton, East
German Creek), and sulfide–sulfate–carbonate assemblages (Central Manitoba). The goal is to identify
processes and environments that can affect spectroscopy-based carbonate detection, for more detailed
follow-on studies. Common carbonates appear to be stable, from a spectroscopic perspective, to various
tectonic processes. Iron oxides/hydroxides do not appear to significantly affect spectral detectability of
carbonates, as the spectrum-altering effects of these phases are largely restricted to the region below
�1mm, while useful carbonate absorption bands occur longward of �1.8mm. Carbonate detection and
characterization in the 0.35–2.5-mm region is largely restricted to a single absorption feature in the 2.3-
mm region, which can be problematic for robust carbonate identification. While tectonic processes and
iron oxide/hydroxide staining do not appear to significantly impair carbonate detection based on the
2.3-mm region absorption band, a number of other factors can affect carbonate detection. These include
the fact that this absorption band is weak compared to many other minerals, a number of other minerals
also exhibit absorption bands in this wavelength region (leading to possible misidentifications), and
that even small abundances of minerals that absorb strongly in this region will reduce the strength of
the carbonate absorption band. Identifying the nature of accessory minerals associated with carbonates
can be used to constrain possible formation environments. Ongoing research at carbonate-bearing
terrestrial analogue sites will continue to provide new insights into the occurrence and detection of
carbonates on Mars.
& 2009 Elsevier Ltd. All rights reserved.
1. Introduction
Remote detections of carbonates on Mars are based largelyon the use of reflectance and emittance spectroscopy. Collectively,the observational data suggest that carbonates are present, butat low abundances, across large parts of the surface. Carbonatesseem to be present in a few small outcrops and as a minor
ll rights reserved.
: +1204 774 4134.
A. Cloutis), Steve.Grasby@
oba.ca (W.M. Last), Richard.
(G.R. Osinski), BL_sherriff@
component of surficial and atmospheric dust. The spectraldetectivity of carbonates is a function of many factors includinggrain size, the nature of other materials with which theyare mixed and the wavelength range used for detection (Ben-Dor and Banin, 1990; Wagner and Schade, 1996; Orofino et al.,1998, 1999, 2000; Fonti et al., 2001; Kirkland et al., 2003; Gilmoreet al., 2004; Palomba et al., 2009). Some of the major spectro-scopy-based detections of carbonates on Mars are summarizedbelow.
Blaney and McCord (1989) conducted Earth-based telescopicobservations of Mars and detected a weak absorption band thatextended from 3.76 to 3.95mm. The likeliest candidate to explainthis feature was determined to be carbonate minerals, although a
ARTICLE IN PRESS
E.A. Cloutis et al. / Planetary and Space Science 58 (2010) 522–537 523
more definitive identification of a specific species could not beconfidently made.
Pollack et al. (1990) ascribed a 6.7mm absorption feature inKuiper Airborne Observatory thermal observations of Mars tocarbonate present in airborne dust, but were unable to make amore definitive assignment. They also found more ambiguousevidence for an additional absorption band near 7.3mm (close to afeature also found by Lellouch et al. (2000)).
Calvin et al. (1994) detected absorption features at 2.28 and5.4mm in Mariner 6/7 infrared spectrometer and Earth-basedtelescopic data. They ascribed these features to hydrous magne-sium carbonates, such as hydromagnesite and artinite. Bell et al.(1994) also detected absorption features at 2.27870.002 and2.29670.002mm that they ascribed to surface mineralogy, onepossibility being carbonates.
Lellouch et al. (2000) found evidence for absorption bands at5.7, 6.3, 7.2, and 11.1mm in Infrared Space Observatory spectra ofMars. They found that the closest match to the latter two bandswas magnesite, although the band positions of their laboratorymagnesite spectra (6.92 and 11.27mm) did not exactly matchthose of the observational spectra (7.2 and 11.1mm). Thesefeatures were also seen in previous Mars spectra reexamined byLellouch et al. (2000).
Bandfield et al. (2003) found evidence for small concentrations(2–5 wt%) of carbonates, specifically dominated by magnesite, inTES spectra of Mars. The detection was based on the shape of Marsdust spectra in the 1350–1580 cm�1 (6.3–7.4-mm region) as wellas emissivity minima at 1580 cm�1 (6.3mm) and 1350 cm�1
(7.4mm).More recently, Ehlmann et al. (2008) have identified carbo-
nates, and specifically magnesium carbonates, in a regional-scalerock layer in the Nili Fossae region. The detection was based onabsorption features at 2.3 and 2.5mm, with subtler potentialfeatures at 3.4 and 3.9mm. The carbonate occurs within bedrockunits showing evidence of erosion.
Palomba et al. (2009) identified widespread occurrences ofmagnesium carbonates across large parts of Mars, and includingboth light and dark regions based on an absorption feature in the3.9-mm region. The carbonates appear to be present on thesurface, as opposed to in airborne dust, and are present at the fewwt% level.
Given the preponderance of meteorite impact craters on Mars,understanding the effects of shock on carbonates should be ofhigh priority. Early experimental and theoretical studies sug-gested that impact processes could lead to complete devolatiliza-tion of carbonates (e.g., Agrinier et al., 2001). However, thepresence of carbonates in highly shocked and shock-meltedterrestrial impact crater materials suggests that carbonates caneither persist through a wide range of shock pressures (Osinskiand Spray, 2001) or be redeposited from impact vapor plume/ejecta (Guillemette and Yancey, 2006). In a recent review, Osinskiet al. (2008) note that melting appears to be the dominantresponse of carbonates to impact, and not decomposition aspreviously suggested. It is notable that carbonate glasses are notformed in impact events, but rather melting leads to theformation of microcrystalline carbonate (Osinski and Spray, 2001).
The recognition of shock metamorphic effects in carbonatesremains an unresolved problem as this mineral group does notappear to produce any of the characteristic shock effects seen inother minerals, such as planar deformation features (PDFs) ordiaplectic glass. Shock processes in carbonates seem to produceelevated levels of some normally incompatible cations (e.g.,Osinski and Spray, 2001; Miura, 2007). Structural rearrangementsof carbonates are possible, as various polymorphs of a number ofcarbonate minerals are known, occurring both at ambientconditions (Chang et al., 1998), and at elevated pressures
(e.g., Isshiki et al., 2003; Sekine et al., 2006; Ono et al., 2007).Carbonates from impact craters can exhibit peak-broadening in X-ray diffraction data, but the cause of this broadening is not wellunderstood (e.g., Burt et al., 2005; Huson et al., 2006).
The sensitivity of carbonates to different processes, such asexposure to the Martian surface environment, impact heating andpressures, and tectonic forces is only poorly constrained atpresent. While some studies suggest that carbonates exposed toconditions equivalent to the surface of Mars may undergodecomposition and devolatilization (Mukhin et al., 1996), otherstudies indicate that carbonates should remain spectrally detect-able, as such processes would be self-terminating (Jurewicz et al.,1999) and/or sluggish (Cloutis et al., 2008). Active carbonateformation is also expected to be possible under current Marssurface conditions (Booth and Kieffer, 1978).
In order to better address the spectral detectivity of carbonateson Mars, we have examined the spectral reflectance properties ofcarbonates and carbonate-bearing lithologies from a variety ofterrestrial environments. The goal is to develop additionalconstraints on the conditions under which carbonates arespectrally detectable, supplementing existing studies (e.g.,Wagner and Schade, 1996; Orofino et al., 1998, 1999, 2000;Gilmore et al., 2004). The terrestrial environments that we haveexamined for carbonate spectral reflectance properties includeterrestrial impact craters and quarries (to assess the effects ofshock), cold hypersaline springs (to determine whether carbonatedissolution/precipitation, and precipitated coatings affect spectraldetectability), polar deserts (to assess the effects of cold climateweathering on carbonate spectra and detectability), sulfide-bearing mine tailings (to ascertain how sulfide oxidation andcarbonate buffering interact), rock slides (to assess the effects offault gouging on carbonate spectra), and iron oxide/hydroxide-stained carbonates (to constrain whether intimately mixed ironoxides affect carbonate detectability).
2. Experimental procedure
Carbonate-rich samples were acquired from the followingterrestrial environments: Haughton impact structure on DevonIsland, Canada (Osinski and Spray, 2001; Osinski et al., 2005), St.Martin impact structure in Manitoba, Canada (McCabe andBannatyne, 1970), an abandoned limestone quarry on HeclaIsland, Manitoba, Canada (shocked and unshocked carbonate-richlithologies; Baillie, 1952), East German Creek, Manitoba, Canada(hypersaline cold springs in a Devonian carbonate reef complex;Grasby and Betcher, 2002; Fedikow et al., 2004; Cloutis et al.,2007), the Central Manitoba sulfide–sulfate–carbonate minetailings near Bissett, Manitoba, Canada (Sherriff et al., 2007,2009), and the Frank Slide, Alberta, Canada (fault surfaces; Jones,1993).
Reflectance spectra were measured at both the University ofWinnipeg PSF (Cloutis et al., 2006a) with an ASD Field Spec Pro HRspectrometer, and at Brown University with the RELAB facility(Pieters, 1983). The ASD instrument acquires spectral databetween 0.35 and 2.5mm with a spectral resolution of between2 and 7 nm, which is interpolated internally by the instrument toultimately output data with a 1 nm sampling interval. Sampleillumination was provided by an in-house 50 W collimatedquartz–tungsten–halogen light source. Powdered mineral sampleswere measured with an incidence angle (i) of 301 and an emissionangle (e) of 01; whole rock spectra were measured with abifurcated probe at i=e=01. The size of a spot used for spectralmeasurements could be varied by adjusting the height of the lightsource and pick-up probe. The imaged spots measured between 5and 10 mm in diameter. Reflectance spectra were measured
ARTICLE IN PRESS
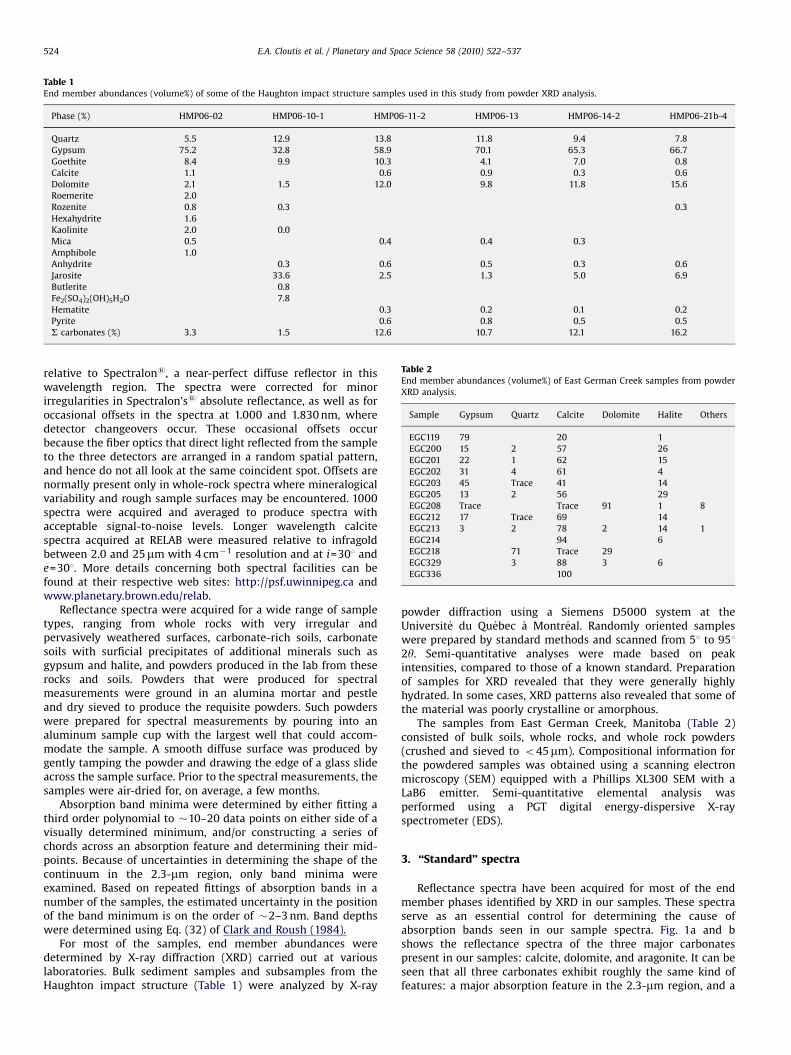
Table 1End member abundances (volume%) of some of the Haughton impact structure samples used in this study from powder XRD analysis.
Phase (%) HMP06-02 HMP06-10-1 HMP06-11-2 HMP06-13 HMP06-14-2 HMP06-21b-4
Quartz 5.5 12.9 13.8 11.8 9.4 7.8
Gypsum 75.2 32.8 58.9 70.1 65.3 66.7
Goethite 8.4 9.9 10.3 4.1 7.0 0.8
Calcite 1.1 0.6 0.9 0.3 0.6
Dolomite 2.1 1.5 12.0 9.8 11.8 15.6
Roemerite 2.0
Rozenite 0.8 0.3 0.3
Hexahydrite 1.6
Kaolinite 2.0 0.0
Mica 0.5 0.4 0.4 0.3
Amphibole 1.0
Anhydrite 0.3 0.6 0.5 0.3 0.6
Jarosite 33.6 2.5 1.3 5.0 6.9
Butlerite 0.8
Fe2(SO4)2(OH)5H2O 7.8
Hematite 0.3 0.2 0.1 0.2
Pyrite 0.6 0.8 0.5 0.5
S carbonates (%) 3.3 1.5 12.6 10.7 12.1 16.2
Table 2End member abundances (volume%) of East German Creek samples from powder
XRD analysis.
Sample Gypsum Quartz Calcite Dolomite Halite Others
EGC119 79 20 1
EGC200 15 2 57 26
EGC201 22 1 62 15
EGC202 31 4 61 4
EGC203 45 Trace 41 14
EGC205 13 2 56 29
EGC208 Trace Trace 91 1 8
EGC212 17 Trace 69 14
EGC213 3 2 78 2 14 1
EGC214 94 6
EGC218 71 Trace 29
EGC329 3 88 3 6
EGC336 100
E.A. Cloutis et al. / Planetary and Space Science 58 (2010) 522–537524
relative to Spectralons, a near-perfect diffuse reflector in thiswavelength region. The spectra were corrected for minorirregularities in Spectralon’ss absolute reflectance, as well as foroccasional offsets in the spectra at 1.000 and 1.830 nm, wheredetector changeovers occur. These occasional offsets occurbecause the fiber optics that direct light reflected from the sampleto the three detectors are arranged in a random spatial pattern,and hence do not all look at the same coincident spot. Offsets arenormally present only in whole-rock spectra where mineralogicalvariability and rough sample surfaces may be encountered. 1000spectra were acquired and averaged to produce spectra withacceptable signal-to-noise levels. Longer wavelength calcitespectra acquired at RELAB were measured relative to infragoldbetween 2.0 and 25mm with 4 cm�1 resolution and at i=301 ande=301. More details concerning both spectral facilities can befound at their respective web sites: http://psf.uwinnipeg.ca andwww.planetary.brown.edu/relab.
Reflectance spectra were acquired for a wide range of sampletypes, ranging from whole rocks with very irregular andpervasively weathered surfaces, carbonate-rich soils, carbonatesoils with surficial precipitates of additional minerals such asgypsum and halite, and powders produced in the lab from theserocks and soils. Powders that were produced for spectralmeasurements were ground in an alumina mortar and pestleand dry sieved to produce the requisite powders. Such powderswere prepared for spectral measurements by pouring into analuminum sample cup with the largest well that could accom-modate the sample. A smooth diffuse surface was produced bygently tamping the powder and drawing the edge of a glass slideacross the sample surface. Prior to the spectral measurements, thesamples were air-dried for, on average, a few months.
Absorption band minima were determined by either fitting athird order polynomial to �10–20 data points on either side of avisually determined minimum, and/or constructing a series ofchords across an absorption feature and determining their mid-points. Because of uncertainties in determining the shape of thecontinuum in the 2.3-mm region, only band minima wereexamined. Based on repeated fittings of absorption bands in anumber of the samples, the estimated uncertainty in the positionof the band minimum is on the order of �2–3 nm. Band depthswere determined using Eq. (32) of Clark and Roush (1984).
For most of the samples, end member abundances weredetermined by X-ray diffraction (XRD) carried out at variouslaboratories. Bulk sediment samples and subsamples from theHaughton impact structure (Table 1) were analyzed by X-ray
powder diffraction using a Siemens D5000 system at theUniversit�e du Qu�ebec �a Montr�eal. Randomly oriented sampleswere prepared by standard methods and scanned from 51 to 9512y. Semi-quantitative analyses were made based on peakintensities, compared to those of a known standard. Preparationof samples for XRD revealed that they were generally highlyhydrated. In some cases, XRD patterns also revealed that some ofthe material was poorly crystalline or amorphous.
The samples from East German Creek, Manitoba (Table 2)consisted of bulk soils, whole rocks, and whole rock powders(crushed and sieved to o45mm). Compositional information forthe powdered samples was obtained using a scanning electronmicroscopy (SEM) equipped with a Phillips XL300 SEM with aLaB6 emitter. Semi-quantitative elemental analysis wasperformed using a PGT digital energy-dispersive X-rayspectrometer (EDS).
3. ‘‘Standard’’ spectra
Reflectance spectra have been acquired for most of the endmember phases identified by XRD in our samples. These spectraserve as an essential control for determining the cause ofabsorption bands seen in our sample spectra. Fig. 1a and bshows the reflectance spectra of the three major carbonatespresent in our samples: calcite, dolomite, and aragonite. It can beseen that all three carbonates exhibit roughly the same kind offeatures: a major absorption feature in the 2.3-mm region, and a

ARTICLE IN PRESS
Fig. 1. Reflectance spectra of carbonates and various minerals detected in our samples. Common end member carbonates: calcite, aragonite, and dolomite powders
(o45mm grain size). (a) 0.35–2.5mm interval; (b) details of the 1.8–2.5mm interval; (c) Fe-free sulfates (0.35–2.5mm; note that the absorption bands seen in the anhydrite
spectrum are due to the presence of a few percent gypsum in the sample); (d) Fe-bearing sulfates (0.35–2.5mm); (e) hydroxides (0.35–2.5mm); (f) silicates (0.35–2.5mm);
(g) selected phyllosilicates that exhibit an absorption feature in the 2.3mm region (0.35–2.5mm).
E.A. Cloutis et al. / Planetary and Space Science 58 (2010) 522–537 525

ARTICLE IN PRESS
Fig. 2. Reflectance spectrum (2–5mm) of calcite powder also shown in Fig. 1. This
spectrum was measured at the RELAB facility at Brown University.
E.A. Cloutis et al. / Planetary and Space Science 58 (2010) 522–537526
reflectance decline longward of �2.4mm. The wavelengthposition of the 2.3-mm region absorption feature varies fordifferent carbonates, being centered near 2.320mm for aragonite,2.325mm for dolomite, and 2.340mm for calcite. These valuescompare to band minima of the strongest constituent absorptionband (based on Gaussian analysis) of 2.328–2.332mm foraragonite, 2.312–2.323 for dolomite, and 2.333–2.340 for calcite(Gaffey, 1986). Differences in band positions are probably due tovarious factors: sample composition and purity (cationsubstitutions can result in band positions shifting), spectralresolution, and the simultaneous Gaussian fitting of multipleband centers (Gaffey, 1986) versus single band minima (thisstudy). The absorption near 2.3mm is accompanied by two weakerbands at shorter wavelengths for all three minerals (Gaffey, 1986,1987). These bands are attributable to overtones andcombinations of bending and stretching vibrations of the CO3
ion (White, 1974; Gaffey, 1987). The carbonate spectra also exhibitadditional, but weaker absorption features. In calcite, weakabsorption bands appear at 1.875 and 2.000, and 2.16mm; inaragonite at 1.870 and 1.955mm; and in dolomite at 1.860, 1.980,and 2.140mm. These bands are also attributable to overtones andcombinations of CO3 stretching and bending vibrations (Gaffey,1987; Clark et al., 1990). Due to their weak nature, they are notexpected to normally appear in spectra of impure carbonates.Additional absorption bands in the 1.4 and 1.9mm region areattributable to water/hydroxyl that may be present in fluidinclusions, trace accessory minerals, or as adsorbed water, andare not intrinsic to these anhydrous carbonates.
XRD analysis of the samples used in our study revealed thepresence of additional phases (Tables 1 and 2). Spectra of most ofthese additional phases are shown in Fig. 1c–f. It can be seen thatthe sulfates, sulfides, and hydroxides do not exhibit absorptionbands in the 2.32–2.34mm region, and hence would not interferewith the determination of carbonate bands. However, a number ofthe silicates, specifically kaolinite, mica (phlogopite), and horn-blende (all of which are present in some of our samples), do showabsorption bands in or near this wavelength region and hencecould lead to erroneous identification of carbonate or cause anapparent shift of a carbonate absorption band to shorter or longerwavelengths. More generally, other phyllosilicates, such as Fe/Mgsaponites and clinochlore, also exhibit absorption features in the2.3mm region (Fig. 1g). It is noteworthy that the spectrum ofCaOH, a possible decomposition product of carbonates due toimpact (Osinski et al., 2008) exhibits an absorption band near2.4mm, potentially enabling its detection spectroscopically. Thisband is far enough removed from carbonate absorption bands thatit would not be confused with carbonates.
In the 2.5–5.0mm region, calcite reflectance spectra exhibit anumber of strong absorption bands (Fig. 2). These consist of bothpaired and single absorption bands; paired bands at 3.34 and 3.49,3.83 and 3.97, and 4.50 and 4.68mm, and single absorption bandsat 2.53 (the minimum of the downturn seen in Fig. 1 spectra), and4.27mm. Once again, these absorption bands are all attributable tocombinations and overtones of various CO3 stretching andbending vibrations (White, 1974), and their positions vary fordifferent carbonates.
In terms of spectral characterization, the types of spectralfeatures or changes we were interested in observing depended onthe nature of the issue being addressed. In the case of the impactstructures, quarry, and rock slide samples, we were searchingspecifically for spectral features or changes that are indicative ofeither structural or compositional disruptions. The spectralcharacteristics that are most amenable to assessment for thisclass of samples are changes in absorption band position betweenshocked and unshocked samples. Such a change could result fromstructural differences, and in fact the differences in band position
between the calcite, aragonite, and dolomite spectra are attribu-table to structural differences between them [due to varyingcation mass (Gaffey, 1987)]. When analyzing absorption bandpositions, it is important to determine, if possible, whether shiftsin absorption band positions may be due to the presence ofaccessory phases or compositional changes over small spatialscales.
Other potential spectral changes or differences could includeabsorption band broadening and shallowing, both of which couldpotentially be attributable to structural disruptions or a decreasein the degree of crystallinity. However these spectral changescould be mimicked by other processes, such as changes in grainsize or the presence of additional phases. Thus, spectralcomparisons based on band depths or broadening must beapproached cautiously.
In the case of carbonate samples affected by iron oxide stainingand precipitation of surface coatings, we are most interested indetermining whether the host or underlying carbonates, respec-tively, remain spectrally detectable. This is a more tractableproblem and involves determining whether carbonate absorptionbands are resolvable, while ensuring as much as possible that theobserved bands are in fact attributable to the carbonates. For thisreason we acquired, and used in our analysis, reflectance spectraof all the constituent phases identified in our samples.
4. Results
The spectroscopic data are aggregated and discussed in termsof the major variable or process that was being investigated inrelation to carbonates: impact processes, tectonic processes, ironoxide staining, surface precipitates, carbonate dissolution andreprecipitation, cold desert weathering, and sulfide–carbonateinteractions.
4.1. Impact processes—Haughton impact structure
The Haughton impact structure has many characteristics thatmake it a unique spectral analogue for Mars and, morespecifically, for the search for carbonates on Mars. Since the timeof impact, this region has remained tectonically stable and has notsuffered any deformation or burial events (see summary by Leeand Osinski, 2005).
Of relevance to this study is that the Haughton structureformed in a practically flat-lying �1880 m thick series of

ARTICLE IN PRESS
E.A. Cloutis et al. / Planetary and Space Science 58 (2010) 522–537 527
predominantly Lower Paleozoic sedimentary rocks of the ArcticPlatform (Osinski et al., 2005). Carbonates, in the form oflimestone and dolomite, dominate the sedimentary sequence,comprising �75% of the target sequence. As such, carbonatesfrom a wide range of shock levels are present, from low shocklevels at the crater rim, to moderately shocked samples from thecentral uplift and ejecta deposits, to highly shocked and shock-melted samples within the clast-rich carbonate impact melt rocksin the center of the structure (Osinski et al., 2005). Unshockedreference samples from outside the crater were also included.
Preliminary spectral reflectance studies of powdered samples ofshocked carbonates from Haughton suggest that highly shockedsamples exhibit a shift in the main carbonate absorption band from2.320mm in the unshocked and low shock level samples to 2.213mmin the highly shocked samples. Shock also seems to be accompaniedby a decrease in band depth, a bluing of the overall spectral slopeand a decrease in albedo (Craig et al., 2009). We acquired whole rockreflectance spectra of a number of carbonate-rich shocked andunshocked carbonate-rich samples from this locality.
As a baseline for examining the reflectance spectra of variouslyshocked samples, Fig. 3 shows the reflectance spectra ofunshocked samples of two of the main carbonate-richlithologies at Haughton: the Allen Bay and Thumb Mountainformations. These two sample spectra exhibit similar wavelengthpositions of their main absorption band: �2.320mm for Allen Bay
Fig. 3. Reflectance spectra of carbonate-rich unshocked whole rock samples from
the Haughton impact structure: (a) 0.35–2.5mm interval and (b) details of the 1.8–
2.5mm interval. The dashed vertical lines indicate approximate position of
carbonate-associated absorption bands in the 2.3-mm region.
and �2.321mm for Thumb Mountain. Large differences exist interms of overall reflectance and this is a function of spectralmeasurements on irregular rock surfaces, where surface andinterior texture can strongly affect overall spectral properties andabsorption band depths, and different degrees of iron oxide/hydroxide staining on exterior surfaces. However, such effects donot affect the key spectral parameter: absorption bandwavelength positions.
Fig. 4 shows reflectance spectra of different light and darkclasts on an impact melt rock hand sample (HMP05-026). Theabsorption feature near 2.34mm exhibits variations in itswavelength position, occurring at generally shorter wavelengthsin the lighter-colored spot spectra as compared to the dark clasts,ranging from �2.31 to �2.34mm and it also exhibits changes inoverall shape. This qualitative analysis indicates that brecciated,partially melted, carbonate-rich samples can exhibit significantvariations in spectral properties. Quantitative analysis ishampered by the fact that, because carbonate absorption bandsare weak, small amounts of accessory phases with strongabsorption bands in the 2.3mm region (including manyphyllosilicates) can affect both the shape and position of thecarbonate bands.
Samples HMP05-024 (Fig. 5) and HMP02-119 (Fig. 6) are bothimpact melt rocks. Spot spectra from broken and saw-cut surfacesindicate that the absorption band in the 2.3-mm region exhibits
Fig. 4. Reflectance spectra of different spots on a carbonate-rich impact melt
breccia hand sample from the Haughton impact structure (HMP05-026): (a) 0.35–
2.5mm interval and (b) details of the 1.8–2.5mm interval. The dashed vertical line
indicates approximate position of expected carbonate absorption band.

ARTICLE IN PRESS
Fig. 5. Reflectance spectra of different spots on a carbonate-rich impact melt
breccia hand sample from the Haughton impact structure (HMP05-024): (a) 0.35–
2.5mm interval and (b) details of the 1.8–2.5mm interval. The dashed vertical line
indicates approximate position of expected carbonate absorption band.
Fig. 6. Reflectance spectra of different spots on a carbonate-rich impact melt
breccia hand sample from the Haughton impact structure (HMP02-119): (a) 0.35–
2.5mm interval and (b) details of the 1.8–2.5mm interval. The dashed vertical line
indicates approximate position of expected carbonate absorption band.
E.A. Cloutis et al. / Planetary and Space Science 58 (2010) 522–537528
some variability in terms of wavelength position. These shifts arelikely associated with the presence of hydrated phases, as some ofthe spectra also exhibits an O–H absorption band in the 1.9-mmregion and additional bands in the 2.3-mm region.
Two carbonate shatter cones were spectrally characterized todetermine whether the striated surfaces exhibit spectral differ-ences associated with visible albedo variations (Fig. 7) or versusthe interior (Fig. 8). Spot spectra from light and dark areas onshatter cone surfaces show no variation in terms of thewavelength position or overall shape of spectral features (Fig. 7).The carbonate absorption band is consistently present at2.338mm and the shorter wavelength carbonate absorptionfeatures are also evident, in spite of the dark appearance of thesample.
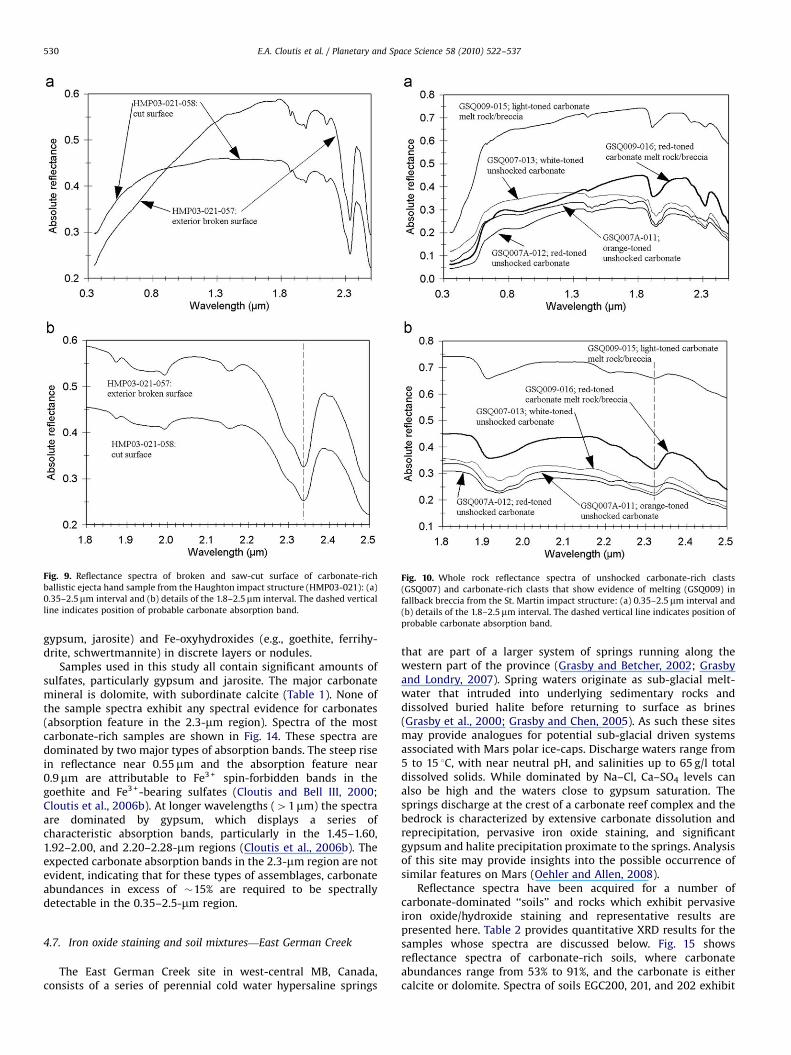
In Fig. 8 we acquired spot spectra on and away from shattercone surfaces (sample HMP001); absorption bands appear to beunaffected by whether they were acquired on striated or interiorsurfaces. These results suggest that shock pressures associatedwith the formation of shatter cones in carbonate-rich targets—ty-pically o10 GPa—will not lead to measurable variations incarbonate absorption band wavelength positions or shapes.Ballistic carbonate-rich ejecta from the Haughton crater, subjectedto low shock pressure, were also spectrally characterized (Fig. 9).All of the expected carbonate absorption bands are present, andtheir wavelength positions are identical for both spectra.
4.2. Impact processes—St. Martin impact structure
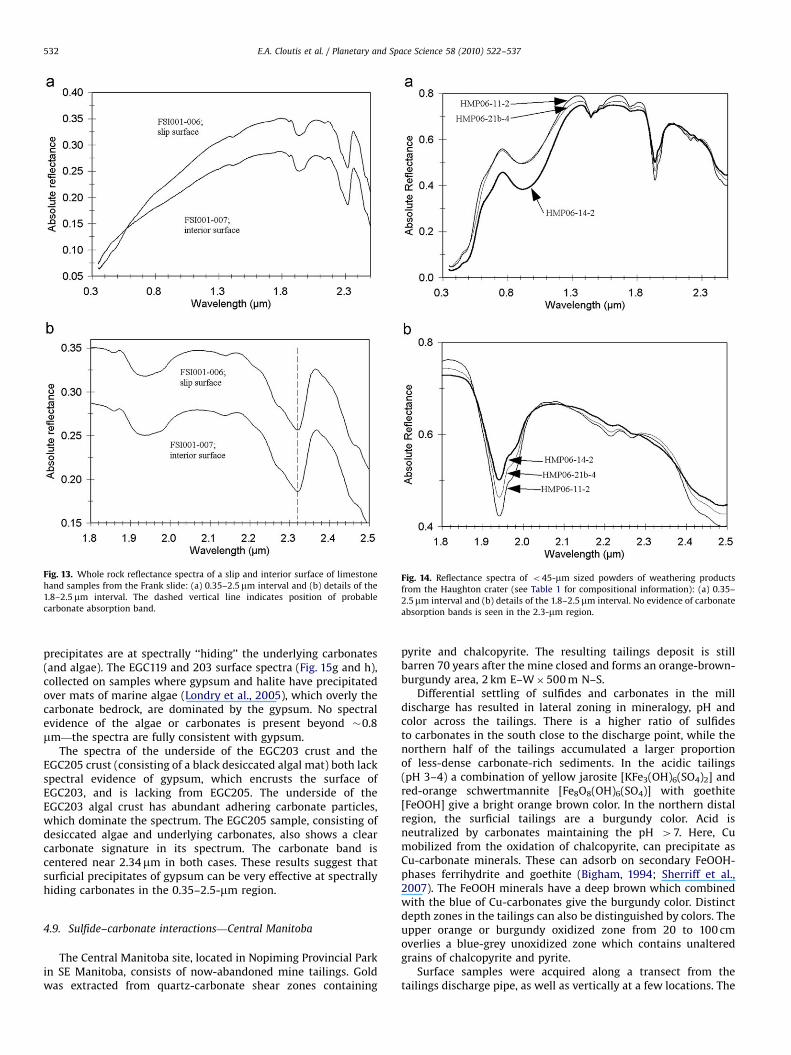
The St. Martin impact structure, located near the town ofGypsumville, Manitoba, Canada, is an �250 Ma impact crater witha structurally uplifted area �22 km diameter crater and an outerdiameter of structural disturbance of �38 km (McCabe andBannatyne, 1970; Kennedy-Coleman and Coleman, 2003; Grieve,2006). The impact occurred in Precambrian granitic bedrockoverlain by likely Silurian and Devonian evaporites and carbo-nates. Exposed materials include clasts of impact melt, as well asunshocked and shocked carbonate-rich clasts, the latter showingclear evidence of melt and flow. Reflectance spectra were acquiredfor both unshocked and melted carbonate-rich clasts (Fig. 10). Thecarbonate absorption band is located at 2.321mm in all of thesample spectra, suggesting that shock levels were not highenough to significantly affect carbonate structure.
4.3. Impact processes—Eagle Butte impact structure
The Eagle Butte impact structure, located in southern Alberta,is �19 km in diameter. Its age is not well constrained, but isyounger than Upper Cretaceous (Grieve, 2006). Partial shattercones were recovered in the central uplift area, consisting ofcarbonate-cemented quartz sandstone. The iron oxide-stained

ARTICLE IN PRESS
Fig. 7. Reflectance spectra of different spots on the surface of a carbonate-rich
shatter cone from the Haughton impact structure (HMP02-136): (a) 0.35–2.5mm
interval and (b) details of the 1.8–2.5mm interval. The dashed vertical line
indicates position of probable carbonate absorption band.
Fig. 8. Reflectance spectra of different spots on the surface and interior of a
carbonate-rich shatter cone from the Haughton impact structure (HMP001): (a)
0.35–2.5mm interval and (b) details of the 1.8–2.5mm interval. The dashed vertical
line indicates position of probable carbonate absorption band.
E.A. Cloutis et al. / Planetary and Space Science 58 (2010) 522–537 529
shatter cone and interior surfaces were spectrally characterized.The samples show ambiguous spectral evidence for the presenceof carbonates, largely in the form of an absorption band near2.355mm (Fig. 11), which may not be attributable to carbonates.Absorption bands in the 2.22-mm region suggest thatphyllosilicates (possibly illite), rather than carbonates, are thespectrally dominant phase in this sample. The absorption featureat 2.355mm shows no difference in wavelength position betweenthe interior and exterior surface spectra.
4.4. ‘‘Impact’’ processes—Hecla Quarry
Red River Formation dolomitic limestone was quarried fromtwo deposits on Hecla Island, Manitoba, Canada from �1890 to�1950. Samples collected from the walls of the blast holes, radialfracture surfaces, and adjacent (unfractured) bedrock werespectrally characterized (Fig. 12). The sample spectra aredominated by the expected carbonate absorption band near2.338mm, with no significant variation in band positionbetween the different samples, suggesting that shock levelsassociated with dynamiting were not sufficiently high to affectthe spectral properties of the carbonates.
4.5. Tectonic processes—Frank Slide
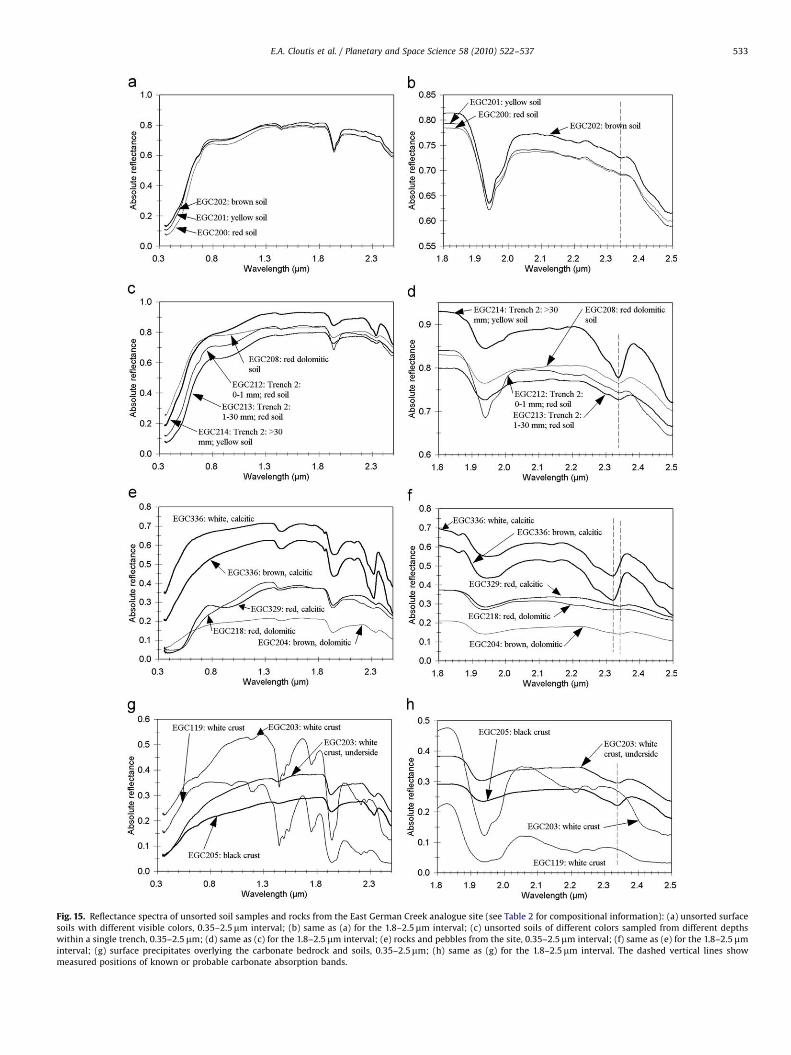
The 1903 Frank Slide at the town of Frank, Alberta, Canada,involved 82 Mt of dolomitic limestone (Jones, 1993). Dolostonesamples exhibiting slickensided surfaces were collected at the siteand both slip and interior surfaces were spectrally characterized(Fig. 13). The major carbonate absorption band position is thesame for both surfaces (2.320mm), suggesting that landslideprocesses are insufficiently energetic to significantly affectcarbonate structure.
4.6. Cold desert weathering—Haughton impact structure
In addition to the shocked carbonates from Haughton crater,samples of weathered but unshocked materials have beencollected in order to assess the effects of cold desert weatheringenvironments on the spectral detectability of carbonates. A post-impact, intra-crater, paleolacustrine record of sedimentation ispreserved in parts of the crater (Osinski and Lee, 2005). Thesesediments are predominantly composed of carbonates (dolomite,calcite), with lesser amounts of detrital quartz and other silicates.Diagenetic pyrite, formed at depth in these sediments, has beenexposed and weathered to various Fe- and Ca-sulfates (e.g.,
ARTICLE IN PRESS
Fig. 9. Reflectance spectra of broken and saw-cut surface of carbonate-rich
ballistic ejecta hand sample from the Haughton impact structure (HMP03-021): (a)
0.35–2.5mm interval and (b) details of the 1.8–2.5mm interval. The dashed vertical
line indicates position of probable carbonate absorption band.
Fig. 10. Whole rock reflectance spectra of unshocked carbonate-rich clasts
(GSQ007) and carbonate-rich clasts that show evidence of melting (GSQ009) in
fallback breccia from the St. Martin impact structure: (a) 0.35–2.5mm interval and
(b) details of the 1.8–2.5mm interval. The dashed vertical line indicates position of
probable carbonate absorption band.
E.A. Cloutis et al. / Planetary and Space Science 58 (2010) 522–537530
gypsum, jarosite) and Fe-oxyhydroxides (e.g., goethite, ferrihy-drite, schwertmannite) in discrete layers or nodules.
Samples used in this study all contain significant amounts ofsulfates, particularly gypsum and jarosite. The major carbonatemineral is dolomite, with subordinate calcite (Table 1). None ofthe sample spectra exhibit any spectral evidence for carbonates(absorption feature in the 2.3-mm region). Spectra of the mostcarbonate-rich samples are shown in Fig. 14. These spectra aredominated by two major types of absorption bands. The steep risein reflectance near 0.55mm and the absorption feature near0.9mm are attributable to Fe3 + spin-forbidden bands in thegoethite and Fe3 +-bearing sulfates (Cloutis and Bell III, 2000;Cloutis et al., 2006b). At longer wavelengths (41mm) the spectraare dominated by gypsum, which displays a series ofcharacteristic absorption bands, particularly in the 1.45–1.60,1.92–2.00, and 2.20–2.28-mm regions (Cloutis et al., 2006b). Theexpected carbonate absorption bands in the 2.3-mm region are notevident, indicating that for these types of assemblages, carbonateabundances in excess of �15% are required to be spectrallydetectable in the 0.35–2.5-mm region.
4.7. Iron oxide staining and soil mixtures—East German Creek
The East German Creek site in west-central MB, Canada,consists of a series of perennial cold water hypersaline springs
that are part of a larger system of springs running along thewestern part of the province (Grasby and Betcher, 2002; Grasbyand Londry, 2007). Spring waters originate as sub-glacial melt-water that intruded into underlying sedimentary rocks anddissolved buried halite before returning to surface as brines(Grasby et al., 2000; Grasby and Chen, 2005). As such these sitesmay provide analogues for potential sub-glacial driven systemsassociated with Mars polar ice-caps. Discharge waters range from5 to 15 1C, with near neutral pH, and salinities up to 65 g/l totaldissolved solids. While dominated by Na–Cl, Ca–SO4 levels canalso be high and the waters close to gypsum saturation. Thesprings discharge at the crest of a carbonate reef complex and thebedrock is characterized by extensive carbonate dissolution andreprecipitation, pervasive iron oxide staining, and significantgypsum and halite precipitation proximate to the springs. Analysisof this site may provide insights into the possible occurrence ofsimilar features on Mars (Oehler and Allen, 2008).
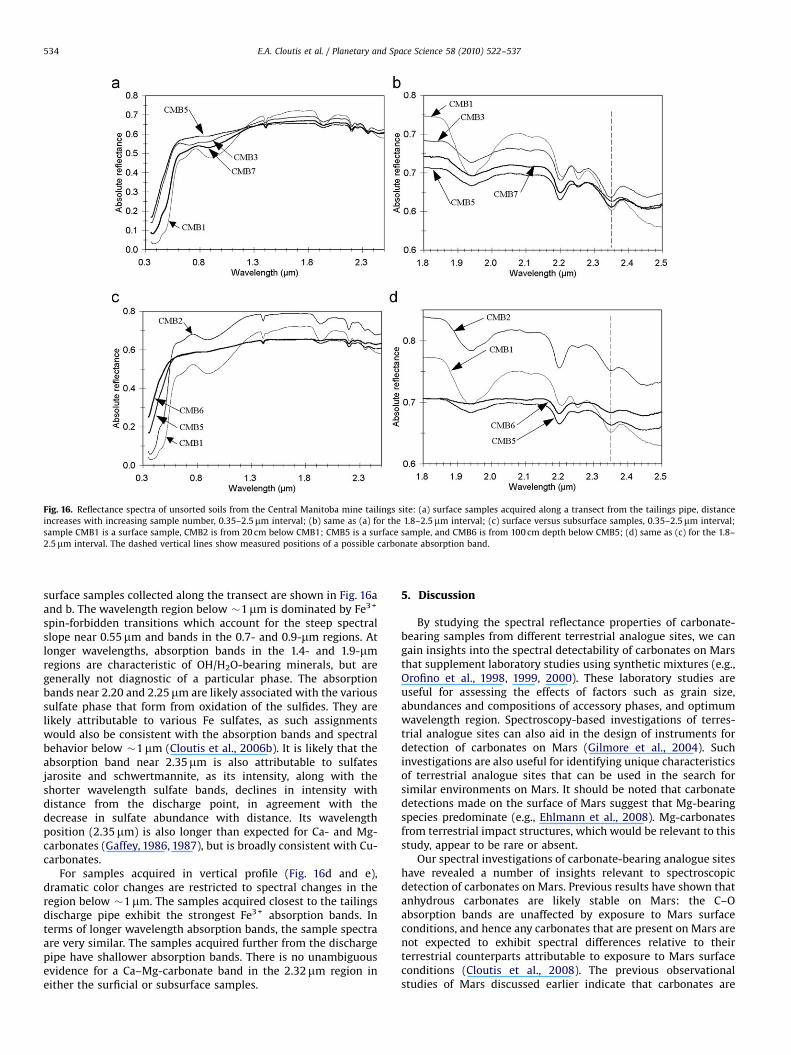
Reflectance spectra have been acquired for a number ofcarbonate-dominated ‘‘soils’’ and rocks which exhibit pervasiveiron oxide/hydroxide staining and representative results arepresented here. Table 2 provides quantitative XRD results for thesamples whose spectra are discussed below. Fig. 15 showsreflectance spectra of carbonate-rich soils, where carbonateabundances range from 53% to 91%, and the carbonate is eithercalcite or dolomite. Spectra of soils EGC200, 201, and 202 exhibit

ARTICLE IN PRESS
Fig. 11. Whole rock reflectance spectra of the surface and interior of shatter cones
from the Eagle Butte impact structure: (a) 0.35–2.5mm interval and (b) details of
the 1.8–2.5mm interval. The dashed vertical line indicates position of a possible
carbonate absorption band.
Fig. 12. Whole rock reflectance spectra of limestone samples from the Hecla
quarry, including surfaces of the blast hole, radial fracture surfaces and
unfractured interior surfaces: (a) 0.35–2.5mm interval and (b) details of the 1.8–
2.5mm interval. The dashed vertical line indicates position of probable carbonate
absorption band.
E.A. Cloutis et al. / Planetary and Space Science 58 (2010) 522–537 531
large differences in visible colors and were collected within 3 m ofeach other. Compositionally, they are quite similar (Table 2), andtheir spectra are dominated by an Fe3 + absorption edge near0.55mm, and weak Fe3 + absorption bands in the 0.9mm region. Atlonger wavelengths, the spectra are dominated by gypsumabsorption bands in the 1.4- and 1.9-mm regions (Fig. 15a).Carbonate absorption bands only become evident in the detailedspectra (Fig. 15b), as a weak feature near 2.34mm. The weaknessof this band is somewhat surprising given the fact that calcite isthe dominant mineral in these samples, but reinforces the factthat carbonates are weak absorbers in this region compared tomany other minerals. At longer wavelengths (3.9mm region)carbonate detection limits are o10% when carbonates aremixed with palaogonite (Jouglet et al., 2007). This illustrates thefact that carbonate detection limits will be a function of manyfactors.
The reflectance spectra for EGC212-214 provide additionalevidence concerning the spectral weakness of carbonates (Fig. 15cand d). EGC212 shows deeper gypsum absorption bands in the 1.4and 1.9mm regions (and a weaker carbonate band near 2.34mmthan EGC213). The major difference between these samples isgypsum content: 17% in EGC212 and 3% in EGC213. SampleEGC214, taken at the deepest depth is dominated by calcite andminor halite (Table 2). It exhibits the strongest carbonateabsorption band, also at 2.34mm. EGC208 is similar to EGC214,
but the dominant carbonate identified by XRD was dolomiterather than calcite (and has a substantially weaker carbonateabsorption band). The difference in band minima between thesetwo spectra is o2 nm.
Rock and pebble spectra from the site exhibit a wide rangeof morphologies and colors. This is expressed in the wide range ofspectral properties in the visible region (Fig. 15e and f). The lack ofgypsum in these samples is manifested in the lack of absorptionfeatures diagnostic of gypsum (e.g., no absorption triplet in the1.45–1.6-mm region). Beyond �1mm, the spectra are dominated byO–H absorption features in the 1.4- and 1.9-mm regions, andcarbonate absorption features in the 2.3-mm region. Carbonateabsorption band positions differ between the samples. Absorptionband appear near 2.32 or 2.34mm, however differences in bandpositions do not always correlate with major carbonate type asdetermined by XRD (Table 2). The cause of this apparent discrepancyis still under investigation.
4.8. Dissolution/precipitation and coatings—East German Creek
The East German Creek site is also characterized by gypsumand halite precipitation (and algal mats) proximate to the springs(Fedikow et al., 2004). Undisturbed samples collected at the siteare useful for examining whether and how effective these surface
ARTICLE IN PRESS
Fig. 13. Whole rock reflectance spectra of a slip and interior surface of limestone
hand samples from the Frank slide: (a) 0.35–2.5mm interval and (b) details of the
1.8–2.5mm interval. The dashed vertical line indicates position of probable
carbonate absorption band.
Fig. 14. Reflectance spectra of o45-mm sized powders of weathering products
from the Haughton crater (see Table 1 for compositional information): (a) 0.35–
2.5mm interval and (b) details of the 1.8–2.5mm interval. No evidence of carbonate
absorption bands is seen in the 2.3-mm region.
E.A. Cloutis et al. / Planetary and Space Science 58 (2010) 522–537532
precipitates are at spectrally ‘‘hiding’’ the underlying carbonates(and algae). The EGC119 and 203 surface spectra (Fig. 15g and h),collected on samples where gypsum and halite have precipitatedover mats of marine algae (Londry et al., 2005), which overly thecarbonate bedrock, are dominated by the gypsum. No spectralevidence of the algae or carbonates is present beyond �0.8mm—the spectra are fully consistent with gypsum.
The spectra of the underside of the EGC203 crust and theEGC205 crust (consisting of a black desiccated algal mat) both lackspectral evidence of gypsum, which encrusts the surface ofEGC203, and is lacking from EGC205. The underside of theEGC203 algal crust has abundant adhering carbonate particles,which dominate the spectrum. The EGC205 sample, consisting ofdesiccated algae and underlying carbonates, also shows a clearcarbonate signature in its spectrum. The carbonate band iscentered near 2.34mm in both cases. These results suggest thatsurficial precipitates of gypsum can be very effective at spectrallyhiding carbonates in the 0.35–2.5-mm region.
4.9. Sulfide–carbonate interactions—Central Manitoba
The Central Manitoba site, located in Nopiming Provincial Parkin SE Manitoba, consists of now-abandoned mine tailings. Goldwas extracted from quartz-carbonate shear zones containing
pyrite and chalcopyrite. The resulting tailings deposit is stillbarren 70 years after the mine closed and forms an orange-brown-burgundy area, 2 km E–W�500 m N–S.
Differential settling of sulfides and carbonates in the milldischarge has resulted in lateral zoning in mineralogy, pH andcolor across the tailings. There is a higher ratio of sulfidesto carbonates in the south close to the discharge point, while thenorthern half of the tailings accumulated a larger proportionof less-dense carbonate-rich sediments. In the acidic tailings(pH 3–4) a combination of yellow jarosite [KFe3(OH)6(SO4)2] andred-orange schwertmannite [Fe8O8(OH)6(SO4)] with goethite[FeOOH] give a bright orange brown color. In the northern distalregion, the surficial tailings are a burgundy color. Acid isneutralized by carbonates maintaining the pH 47. Here, Cumobilized from the oxidation of chalcopyrite, can precipitate asCu-carbonate minerals. These can adsorb on secondary FeOOH-phases ferrihydrite and goethite (Bigham, 1994; Sherriff et al.,2007). The FeOOH minerals have a deep brown which combinedwith the blue of Cu-carbonates give the burgundy color. Distinctdepth zones in the tailings can also be distinguished by colors. Theupper orange or burgundy oxidized zone from 20 to 100 cmoverlies a blue-grey unoxidized zone which contains unalteredgrains of chalcopyrite and pyrite.
Surface samples were acquired along a transect from thetailings discharge pipe, as well as vertically at a few locations. The
ARTICLE IN PRESS
Fig. 15. Reflectance spectra of unsorted soil samples and rocks from the East German Creek analogue site (see Table 2 for compositional information): (a) unsorted surface
soils with different visible colors, 0.35–2.5mm interval; (b) same as (a) for the 1.8–2.5mm interval; (c) unsorted soils of different colors sampled from different depths
within a single trench, 0.35–2.5mm; (d) same as (c) for the 1.8–2.5mm interval; (e) rocks and pebbles from the site, 0.35–2.5mm interval; (f) same as (e) for the 1.8–2.5mm
interval; (g) surface precipitates overlying the carbonate bedrock and soils, 0.35–2.5mm; (h) same as (g) for the 1.8–2.5mm interval. The dashed vertical lines show
measured positions of known or probable carbonate absorption bands.
E.A. Cloutis et al. / Planetary and Space Science 58 (2010) 522–537 533
ARTICLE IN PRESS
Fig. 16. Reflectance spectra of unsorted soils from the Central Manitoba mine tailings site: (a) surface samples acquired along a transect from the tailings pipe, distance
increases with increasing sample number, 0.35–2.5mm interval; (b) same as (a) for the 1.8–2.5mm interval; (c) surface versus subsurface samples, 0.35–2.5mm interval;
sample CMB1 is a surface sample, CMB2 is from 20 cm below CMB1; CMB5 is a surface sample, and CMB6 is from 100 cm depth below CMB5; (d) same as (c) for the 1.8–
2.5mm interval. The dashed vertical lines show measured positions of a possible carbonate absorption band.
E.A. Cloutis et al. / Planetary and Space Science 58 (2010) 522–537534
surface samples collected along the transect are shown in Fig. 16aand b. The wavelength region below �1mm is dominated by Fe3 +
spin-forbidden transitions which account for the steep spectralslope near 0.55mm and bands in the 0.7- and 0.9-mm regions. Atlonger wavelengths, absorption bands in the 1.4- and 1.9-mmregions are characteristic of OH/H2O-bearing minerals, but aregenerally not diagnostic of a particular phase. The absorptionbands near 2.20 and 2.25mm are likely associated with the varioussulfate phase that form from oxidation of the sulfides. They arelikely attributable to various Fe sulfates, as such assignmentswould also be consistent with the absorption bands and spectralbehavior below �1mm (Cloutis et al., 2006b). It is likely that theabsorption band near 2.35mm is also attributable to sulfatesjarosite and schwertmannite, as its intensity, along with theshorter wavelength sulfate bands, declines in intensity withdistance from the discharge point, in agreement with thedecrease in sulfate abundance with distance. Its wavelengthposition (2.35mm) is also longer than expected for Ca- and Mg-carbonates (Gaffey, 1986, 1987), but is broadly consistent with Cu-carbonates.
For samples acquired in vertical profile (Fig. 16d and e),dramatic color changes are restricted to spectral changes in theregion below �1mm. The samples acquired closest to the tailingsdischarge pipe exhibit the strongest Fe3 + absorption bands. Interms of longer wavelength absorption bands, the sample spectraare very similar. The samples acquired further from the dischargepipe have shallower absorption bands. There is no unambiguousevidence for a Ca–Mg-carbonate band in the 2.32mm region ineither the surficial or subsurface samples.
5. Discussion
By studying the spectral reflectance properties of carbonate-bearing samples from different terrestrial analogue sites, we cangain insights into the spectral detectability of carbonates on Marsthat supplement laboratory studies using synthetic mixtures (e.g.,Orofino et al., 1998, 1999, 2000). These laboratory studies areuseful for assessing the effects of factors such as grain size,abundances and compositions of accessory phases, and optimumwavelength region. Spectroscopy-based investigations of terres-trial analogue sites can also aid in the design of instruments fordetection of carbonates on Mars (Gilmore et al., 2004). Suchinvestigations are also useful for identifying unique characteristicsof terrestrial analogue sites that can be used in the search forsimilar environments on Mars. It should be noted that carbonatedetections made on the surface of Mars suggest that Mg-bearingspecies predominate (e.g., Ehlmann et al., 2008). Mg-carbonatesfrom terrestrial impact structures, which would be relevant to thisstudy, appear to be rare or absent.
Our spectral investigations of carbonate-bearing analogue siteshave revealed a number of insights relevant to spectroscopicdetection of carbonates on Mars. Previous results have shown thatanhydrous carbonates are likely stable on Mars: the C–Oabsorption bands are unaffected by exposure to Mars surfaceconditions, and hence any carbonates that are present on Mars arenot expected to exhibit spectral differences relative to theirterrestrial counterparts attributable to exposure to Mars surfaceconditions (Cloutis et al., 2008). The previous observationalstudies of Mars discussed earlier indicate that carbonates are
ARTICLE IN PRESS
E.A. Cloutis et al. / Planetary and Space Science 58 (2010) 522–537 535
present on Mars. Our study of analogue sites provides importantconstraints on how various processes may affect their spectraldetectability.
The spectrally characterized samples from the various analo-gue sites that have been affected by impact, explosive shock, andtectonic (landslide) processes suggest that carbonates are spec-trally stable, and their detection is not negatively affected by theseprocesses, except possibly in cases of high shock (Craig et al.,2009); however the cause of the spectral differences between thehighly shocked sample and other samples has not yet beendetermined. However, it should be noted that the definition of‘‘highly shock’’ is still largely unconstrained. Further laboratorywork is ongoing to better constrain the relationship betweenshock level and carbonate spectral properties. Impact melt rocksfrom the Haughton impact structure display spectral variabilitywithin a single hand sample, and some of this spectral variability(in terms of the 2.3-mm region carbonate absorption band) may berelated to compositional variability in the carbonates, or composi-tional and structural changes accompanying shock melting andrecrystallization. Other apparently melted carbonate samples (St.Martin crater) do not display evidence of shifts in carbonateabsorption band positions. Further analysis of the samples fromcarbonate-bearing impact craters should provide further insightsinto shock levels, shock alteration processes, and spectral proper-ties.
Spectral analysis of carbonate-bearing rocks and soils fromenvironments where the carbonates are a component of cold polardesert weathering products suggests that carbonate abundanceswell above detection limits established for carbonate detectionusing longer wavelength features (415% vs. �10% (Jouglet et al.,2007) or �5% (Bandfield et al., 2003)) are required for carbonatedetection based on the 0.35–2.5-mm region. Carbonate detectionsusing features in the 4-mm region are possible to abundances aslow as o�5% for even weakly-featured carbonates (i.e., magne-site and huntite) when these carbonates are mixed with plausibleMars materials, such as basalts and palagonites (Palomba et al.,2009).
Iron oxides/hydroxides, which can pervasively color manycarbonates, seem to have their greatest effect at shorterwavelengths (o�1mm). As readily detectable carbonate absorp-tion bands occur longward of �1.8mm, the presence of suchaccessory phases as coloring agents in carbonates should notsignificantly impact carbonate detectability. It should be empha-sized that large-scale variations in overall spectral slope betweendifferent samples can be attributed to multiple causes, such asdifferences in surface roughness, grain size, and amount of ironoxide/hydroxide coating, and hence slope differences are notnecessarily diagnostic of differences in carbonate composition orstructure.
In addition to the effects that different minerals have onspectral detectability, the accessory minerals present will affectcarbonate detectability and also provide insights into possibledepositional environments. Results of spectral analysis of surfacesamples from the East German Creek analogue site indicate thatprecipitated phases, such as gypsum, can effectively mask thespectral signature of underlying carbonates. Similarly, gypsumand jarosite mask the spectral signature of carbonates in theHaughton sedimentary deposits.
The ability of accessory phases to ‘‘hide’’ carbonates from view(i.e., detection limit) is difficult to quantify. Absorption bandsbecome progressively weaker as the abundance of accessoryphases increases (e.g., Orofino et al., 1998, 1999). Carbonatedetectability will be a function of signal-to-noise ratio (SNR):more carbonates will be required for confident detection inspectra with lower SNR. Also, on natural surfaces, as seen in ourEast German Creek samples, gypsum coatings are neither
continuous nor of uniform thickness. Coated grains likely requireless gypsum to ‘‘hide’’ carbonates from view than the moretraditional intimate mineral mixtures that are normally used inlaboratory spectral studies. In the case of jarosite (Haughtondeposits), it possesses an absorption band close to 2.3mm (Fig. 1d),and hence detection of an adjacent and overlapped carbonateband, which may be present, would require the use of spectraldeconvolution techniques for confident identification.
One shortcoming of restricting carbonate detection to thewavelength region shortward of 2.5mm is that the most diagnosticand strongest absorption band occurs in the 2.3-mm region. Anumber of other minerals also have absorption bands in thisregion, including phyllosilicates and sulfates (Clark et al., 1990,2003; Cloutis et al., 2006b), especially Fe/Mg smectites andchlorites, the most widespread and abundant phyllosilicates onMars (Mustard et al., 2008). Relying on a single absorption band orfeature does not provide for robust detection. Longer wavelengthdata, if available, is advantageous from two perspectives: (1) itprovides additional absorption bands for confirmation of carbo-nate presence, and (2) longer wavelength carbonates bands aregenerally more intense than the 2.3-mm region absorption feature,and detection limits are expected to be lower in this wavelengthregion.
Ongoing studies of carbonate-bearing lithologies from a varietyof terrestrial analogue sites will provide new insights into thespectral detectability of carbonates on Mars, as well as constraintson depositional or formational environments that can plausibly beascribed to such occurrences.
6. Conclusions
We have undertaken a combination of qualitative andquantitative analysis of carbonates from a variety of terrestrialenvironments in order to better understand what processes couldbe invoked to ‘‘hide’’ carbonates from detection by reflectancespectroscopy. The intent is to identify processes that can affectspectroscopy-based carbonate detection, so that more detailedfollow-on studies can be conducted. Carbonate samples wereacquired from a variety of environments: impact structures(Haughton, St. Martin, Eagle Butte), landslides (Frank), quarryingoperations (Hecla), carbonates affected by weathering (Haughton,East German Creek), and sulfide–sulfate–carbonate assemblages(Central Manitoba). Common carbonates (calcite, dolomite)appear to be stable, from a spectroscopic perspective, to varioustectonic processes and low to moderate shock levels. The presenceof iron oxides/hydroxides do not affect spectral detectability ofcarbonates based on the use of absorption bands in the 2.3-mmregion, as the spectrum-altering effects of these phases are largelyrestricted to the region below �1mm.
While it appears that many tectonic processes and iron oxide/hydroxide staining do not adversely affect our ability to detect thepresence of carbonates using absorption features in the 2.3-mmregion, other factors can impair carbonate detection. Reliablecarbonate detection and characterization in the 0.35–2.5-mmregion is largely restricted to the single strongest absorptionfeature in the 2.3-mm region, which introduces issues of therobustness of any putative carbonate detections. In addition, otherminerals, such as a number of phyllosilicates, also possessabsorption bands in this wavelength region, although absorptionband shapes and positions normally differ from those ofcarbonates. Minerals that strongly absorb in the 2.3-mm regioncan also greatly reduce carbonate band depths, to the point ofmaking them unresolvable. Thus, carbonate detection will bemost reliable in cases where additional absorption bandsassociated with other minerals that also possess an absorption
ARTICLE IN PRESS
E.A. Cloutis et al. / Planetary and Space Science 58 (2010) 522–537536
band in the 2.3-mm region are absent, or through the identifica-tion of additional carbonate absorption bands at longer wave-lengths.
While this study combines qualitative and quantitativeanalysis, it does suggest a number of avenues for futureinvestigation. The most pressing need is to develop quantitativelinkages between shock levels, shock features in carbonates, andspectral variations. In addition, detailed petrographic studiesshould be combined with spectroscopy to better constrainprocesses that may affect carbonate absorption bands in samplesthat exhibit spectral variations between ‘‘affected’’ and ‘‘unaf-fected’’ surfaces for various alteration processes. The current studysuggests that most tectonic processes will not lead to measurablespectral variations. This implies that any carbonates that may bepresent on the surface of Mars cannot be ‘‘hidden’’ from view viaweathering or through common tectonic processes, exceptperhaps very high shock levels (Craig et al., 2009). Ongoingresearch at carbonate-bearing terrestrial analogue sites willcontinue to provide new insights into mechanisms for detectingcarbonates on Mars.
Acknowledgments
This study was supported by research grants and contractsfrom the Canadian Space Agency (CSA), the Natural Sciences andEngineering Research Council of Canada (NSERC), the CanadaFoundation for Innovation (CFI), and the University of Winnipeg.The PSF-HOSERLab facility, where most of the spectral measure-ments were conducted was established with funding from CFI,CSA, and the Manitoba Research Innovations Fund. Thanks toMark Zalcik for providing samples from the Eagle Butte site.Thanks also to Bethany Ehlmann and an anonymous reviewer fortheir thorough and valuable reviews of this manuscript.
References
Agrinier, P., Deutsch, A., Scharer, U., Martinez, I., 2001. Fast back-reactions of shock-released CO2 from carbonates: an experimental approach. Geochim. Cosmo-chim. Acta 65, 2615–2632.
Baillie, A.D., 1952. Ordovician Geology of Lake Winnipeg and Adjacent Areas.Manitoba Department of Mines and Natural Resources Report 51-6.
Bandfield, J.L., Glotch, T.D., Christensen, P.R., 2003. Spectroscopic identification ofcarbonate minerals in the Martian dust. Science 301, 1084–1087.
Bell III, J.F., Pollack, J.B., Geballe, T.R., Cruikshank, D.P., Freedman, R., 1994.Spectroscopy of Mars from 2.04 to 2.44mm during the 1993 opposition:absolute calibration and atmospheric versus mineralogic origin of narrowabsorption features. Icarus 111, 106–123.
Ben-Dor, E., Banin, A., 1990. Near-infrared reflectance analysis of carbonateconcentrations in soils. Appl. Spectrosc. 44, 1064–1069.
Bigham, J.M., 1994. Mineralogy of ochre deposits formed by sulfide oxidation. In:Jambor, J.L., Blowes, D.W. (Eds.), Short Course Handbook on EnvironmentalGeochemistry of Sulfide Mine Waste. Mineralogical Association of Canada,Waterloo, pp. 103–132.
Blaney, D.L., McCord, T.B., 1989. An observational search for carbonates on Mars. J.Geophys. Res. 94, 10159–10166.
Booth, M.C., Kieffer, H.H., 1978. Carbonate formation in Marslike environments. J.Geophys. Res. 83, 1809–1815.
Burt, J.B., Pope, M.C., Watkinson, A.J., 2005. Petrographic, X-ray diffraction, andelectron spin resonance analysis of deformed calcite: Meteor Crater, Arizona.Meteorit. Planet. Sci. 40, 297–306.
Calvin, W.M., King, T.V.V., Clark, R.N., 1994. Hydrous carbonates on Mars? Evidencefrom Mariner 6/7 infrared spectrometer and ground-based telescopic spectra.J. Geophys. Res. 99, 14659–14675.
Chang, L.L.Y., Howie, R.A., Zussman, J., 1998. Rock Forming Minerals. Volume 5B.Non-silicates: Sulphates, Carbonates, Phosphates, Halides, second ed. TheGeological Society, London.
Clark, R.N., Roush, T.L., 1984. Reflectance spectroscopy: quantitative analysistechniques for remote sensing applications. J. Geophys. Res. 89, 6329–6340.
Clark, R.N., King, T.V.V., Klejwa, M., Swayze, G.A., 1990. High spectral resolutionreflectance spectroscopy of minerals. J. Geophys. Res. 95, 12653–12680.
Clark, R.N., Swayze, G.A., Livo, K.E., Kokaly, R.F., Sutley, S.J., Dalton, J.B., McDougal,R.R., Gent, C.A., 2003. Imaging spectroscopy: earth and planetary remote
sensing with the USGS Tetracorder and expert systems. J. Geophys. Res. 108,doi:10.1029/2002JE001847.
Cloutis, E.A., Bell III, J.F., 2000. Diaspores and related hydroxides: spectral-compositional properties and implications for Mars. J. Geophys. Res. 105,7053–7070.
Cloutis, E., Craig, M., Kaletzke, L., McCormack, K., Stewart, L., 2006a. HOSERLab: anew planetary spectrophotometer facility. Lunar Planet. Sci. 37, abstract #2121(CD-ROM).
Cloutis, E.A., Hawthorne, F.C., Mertzman, S.A., Krenn, K., Craig, M.A., Marcino, D.,Methot, M., Strong, J., Mustard, J.F., Blaney, D.L., Bell III, J.F., Vilas, F., 2006b.Detection and discrimination of sulfate minerals using reflectance spectro-scopy. Icarus 184, 121–157.
Cloutis, E., Badiou, P., Ginn, F., Goldsborough, G., Last, W., Londry, K., 2007.Investigation of the East German Creek, Manitoba Mars Analogue Site. FinalReport to Canadian Space Agency Canadian Analogue Research Network(CARN) Program.
Cloutis, E.A., Craig, M.A., Kruzelecky, R.V., Jamroz, W.R., Scott, A., Hawthorne, F.C.,Mertzman, S.A., 2008. Spectral reflectance properties of minerals exposed tosimulated Mars surface conditions. Icarus 195, 140–168.
Craig, M.A., Osinski, G.R., Flemming, R.L., Cloutis, E.A., 2009. UV–VIS–NIRreflectance spectra of shocked carbonates from the Haughton impact structure,Devon Island, Canada: 0.35–2.5mm; implications for carbonate identificationon Mars. Lunar Planet. Sci. 40, abstract #1643 (CD ROM).
Ehlmann, B.L., Mustard, J.F., Murchie, S.L., Poulet, F., Bishop, J.L., Brown, A.J., Calvin,W.M., Clark, R.N., Des Marais, D.J., Milliken, R.E., Roach, L.H., Roush, T.L.,Swayze, G.A., Wray, J.J., 2008. Orbital identification of carbonate-bearing rockson Mars. Science 322, 1828–1832.
Fedikow, M.A.F., Bezys, R.K., Bamburak, J.D., Hosain, I.T., Abercrombie, H.J., 2004.Prairie-type microdisseminated mineralization in the Dawson Bay Area, West-Central Manitoba (NTS 63C14 and 15). Manitoba Geological Survey Geoscien-tific Report GR2004-1.
Fonti, S., Jurewicz, A., Blanco, A., Blecka, M.I., Orofino, V., 2001. Presenceand detection of carbonates on the Martian surface. J. Geophys. Res. 106,27815–27822.
Gaffey, S.J., 1986. Spectral reflectance of carbonate minerals in the visible and near-infrared (0.35–2.55 microns): calcite, aragonite, and dolomite. Am. Mineral. 71,151–162.
Gaffey, S.J., 1987. Spectral reflectance of carbonate minerals in the visible and nearinfrared (0.35–2.55mm): anhydrous carbonate minerals. J. Geophys. Res. 92,1429–1440.
Gilmore, M.S., Merrill, M.D., Castano, R., Bornstein, B., Greenwood, J.P., 2004. Effectof Mars analogue dust deposition on the automated detection of calcite invisible/near infrared spectra. Icarus 172, 641–646.
Grasby, S.E., Betcher, R.N., 2002. Regional hydrogeochemistry of the carbonate rockaquifer, southern Manitoba. Can. J. Earth Sci. 39, 1053–1063.
Grasby, S.E., Chen, Z., 2005. Subglacial recharge into the Western Canadasedimentary basin-impact of Pleistocene glaciation on basin hydrodynamics.Geol. Soc. Am. Bull. 117, 500–514.
Grasby, S.E., Londry, K.L., 2007. Biogeochemistry of hypersaline springs supportinga mid-continent marine ecosystem: an analogue for Martian springs?.Astrobiology 7, 662–683.
Grasby, S.E., Betcher, R., Osadetz, K., Render, F., 2000. Reversal of the regional flowsystem of the Williston Basin in response to Pleistocene glaciation. Geology 28,635–638.
Grieve, R.A.F., 2006. Impact Structures in Canada. Geological Association of Canada.Guillemette, R.N., Yancey, T.E., 2006. Microaccretionary and accretionary carbonate
spherules of the Chixulub impact event from Brazos River, Texas and BassRiver, New Jersey. Lunar Planet. Sci. 37, abstract #1779 (CD ROM).
Huson, S.A., Foit, F.F., Watkinson, A.J., Pope, M.C., 2006. X-ray diffraction powderpatterns and thin section observations from the Sierra Madera impactstructure. Lunar Planet. Sci. 37, abstract #2377 (CD ROM).
Isshiki, M., Irifune, T., Ono, S., Ohishi, Y., Watanuki, T., Nishibori, E., Takata, M.,Sakata, M., 2003. Stability of magnesite and its high pressure form in thelowermost mantle. Nature 427, 60–63.
Jones, P.B., 1993. Structural geology of the modern Frank slide and ancient BluffMountain slide, Crowsnest, Alberta. Bull. Can. Petroleum Geol. 41, 232–243.
Jouglet, D., Poulet, F., Bibring, J.P., Langevin, Y., Gondet, B., 2007. Search forcarbonates on Mars with the OMEGA/Mars Express data. In: SeventhInternational Mars Conference, abstract #3153.
Jurewicz, A., Blecka, M.I., Blanco, A., Fonti, S., Orofino, V., 1999. Presence anddetection of carbonates on the Martian surface. Am. Astron. Soc. DPS Meeting31, abstract #39.02.
Kennedy-Coleman, S., Coleman, D.L., 2003. Maps of Meteorite/Asteroid ImpactCraters on Earth. Jensan Scientifics.
Kirkland, L.E., Herr, K.C., Adams, P.M., 2003. Infrared stealthy surfaces: why TES andTHEMIS may miss some substantial mineral deposits on Mars and implicationsfor remote sensing of planetary surfaces. J. Geophys. Res. 108 (E12), 5137,doi:10.1029/2003JE002105.
Lee, P., Osinski, G.R., 2005. The Haughton-Mars project: overview of scienceinvestigations at the Haughton impact structure and surrounding terrains, andrelevance to planetary studies. Meteorit. Planet. Sci. 40, 1755–1758.
Lellouch, E., Encrenaz, T., de Graauw, T., Erard, S., Morris, P., Crovisier, J.,Feuchtgruber, H., Girard, T., Burgdorf, M., 2000. The 2.4–45mm spectrum ofMars observed with the Infrared Space Observatory. Planet. Space Sci. 48,1393–1405.
ARTICLE IN PRESS
E.A. Cloutis et al. / Planetary and Space Science 58 (2010) 522–537 537
Londry, K.L., Badiou, P.H., Grasby, S.E., 2005. Identification of a marine green algaPercursaria percursa, in hypersaline springs in the middle of the NorthAmerican continent. Can. Field Nat. 119, 82–87.
McCabe, H.R., Bannatyne, B.B., 1970. Lake St. Martin crypto-explosion crater andgeology of the surrounding area. Manitoba Mines Branch Geological Paper3/70.
Miura, Y., 2007. Formations of calcium-carbonates by natural and artificial shockwave impacts: new type formation of carbonates. Lunar Planet. Sci. 38,abstract #1277 (CD ROM).
Mukhin, LM., Koscheevi, A.P., Dikov, Yu.P., Huth, J., Wanke, H., 1996. Experimentalsimulations of the photodecomposition of carbonates and sulphates on Mars.Nature 379, 141–143.
Mustard, J.F., Mucrhie, S.L., Pelkey, S.M., Ehlmann, B.L., Milliken, R.E., Grant, J.A.,Bibring, J.-P., Poulet, F., Bichop, J., Noe Dobrea, E., Roach, L., Seelos, F., Arvidson,R.E., Wiseman, S., Green, R., Hash, C., Humm, D., Malaret, E., McGovern, J.A.,Seelos, K., Clancy, T., Clark, R., Des Marais, D., Isenberg, N., Knudson, A.,Langevin, Y., Martin, T., McGuire, P., Morris, R., Robinson, M., Roush, T., Smith,M., Swayze, G., Taylor, H., Titus, T., Wolff, M., 2008. Hydrated silicate mineralson Mars observed by the Mars Reconnaissance Orbiter CRISM instrument.Nature 454, 305–309.
Oehler, D.Z., Allen, C.C., 2008. Ancient hydrothermal springs in Arabia Terra, Mars.Lunar Planet. Sci. 39, abstract #1949 (CD ROM).
Ono, S., Kikegawa, T., Ohishi, Y., 2007. High-pressure transition of CaCO3. Am.Mineral. 92, 1246–1249.
Orofino, V., Blanco, A., Fonti, S., Proce, R., Rotundi, A., 1998. The infrared opticalconstants of limestone particles and implications for the search for carbonateson Mars. Planet. Space Sci. 46, 1659–1669.
Orofino, V., Blanco, A., Blecka, M.I., De Carlo, F., Fonti, S., Jurewicz, A., 1999. Thespectroscopic search for carbonates on the surface and in the atmosphere ofMars: laboratory measurements and numerical simulations. Adv. Space Res.23, 1609–1612.
Orofino, V., Blanco, A., Blecka, M.I., Fonti, S., Jurewicz, A., 2000. Carbonates andcoated particles on Mars. Planet. Space Sci. 48, 1341–1347.
Osinski, G.R., Lee, P., 2005. Intra-crater sedimentary deposits at the Haughtonimpact structure, Devon Island, Canadian High Arctic. Meteorit. Planet. Sci. 40,1887–1899.
Osinski, G.R., Spray, J.G., 2001. Impact-generated carbonate melts: evidence fromthe Haughton structure, Canada. Earth Planet. Sci. Lett. 194, 17–29.
Osinski, G.R., Lee, P., Spray, J.G., Parnell, J., Lim, S.S., Bunch, T.E., Cockell, C.S., Glass,B., 2005. Geological overview and cratering model for the Haughton impactstructure, Devon Island, Canadian High Arctic. Meteorit. Planet. Sci. 401759–1776
Osinski, G.R., Spray, J.G., Grieve, R.A.F., 2008. Impact melting in sedimentary rocktargets: an assessment. In: Evans, K.R., Horton Jr., J.W., King Jr., D.T., Morrow,J.R. (Eds.), The Sedimentary Record of Meteorite Impacts. Geol. Soc. Am. Spec.Pap. 437, pp. 1–18.
Palomba, E., Zinzi, A., Cloutis, E.A., D’Amore, M., Grassi, D., Maturilli, A., 2009.Evidence for Mg-rich carbonates on Mars from a 3.9mm absorption feature.Icarus, 203, 58–65.
Pieters, C.M., 1983. Strength of mineralogical absorption features in thetransmitted component of reflection: first results from RELAB. J. Geophys.Res. 88, 9534–9544.
Pollack, J.B., Roush, T., Witteborn, F., Bregman, J., Wooden, D., Stoker, C., Toon, O.B.,Rank, D., Dalton, B., Freedman, R., 1990. Thermal emission spectra of Mars (5.4–10.5mm): evidence for sulfates, carbonates, and hydrates. J. Geophys. Res. 95,
14595–14627.Sekine, T., He, H., Kobayashi, T., Yamaguchi, A., 2006. Hugoniot and impact-induced
phase transition of magnesite. Am. Mineral. 91, 1802–1806.Sherriff, B.L., Sidenko, N.V., Salzsauler, K.A., 2007. Differential settling and
geochemical evolution of tailings’ surface water at the Central Manitoba GoldMine. Appl. Geochem. 22, 342–356.
Sherriff, B.L., Ferguson, I., Gupton, M.W., VanGulck, J.F., Sidenko, N.V., Priscu, C.,Marco P�erez-Flores, M., Gomez-Trevino, E., 2009. A geophysical and geotech-nical study to determine the hydrological regime of the Central Manitoba goldmine tailings deposit. Can. Geotech. J. 1, 1–12.
Wagner, C., Schade, U., 1996. Measurements and calculations for estimating thespectrometric detection limits for carbonates in Martian soil. Icarus 123256–268
White, W.B., 1974. The carbonate minerals. In: Farmer, V.C. (Ed.), The InfraredSpectra of Minerals. Mineralogical Society, London, pp. 227–284.