Use of In‐Season Reflectance for Predicting Yield Potential in Bermudagrass
14
This article was downloaded by:[Oklahoma State University] [Oklahoma State University] On: 2 July 2007 Access Details: [subscription number 769426451] Publisher: Taylor & Francis Informa Ltd Registered in England and Wales Registered Number: 1072954 Registered office: Mortimer House, 37-41 Mortimer Street, London W1T 3JH, UK Communications in Soil Science and Plant Analysis Publication details, including instructions for authors and subscription information: http://www.informaworld.com/smpp/title~content=t713597241 Use of In-Season Reflectance for Predicting Yield Potential in Bermudagrass Online Publication Date: 01 June 2007 To cite this Article: Mosali, J., Girma, Kefyalew, Teal, R. K., Freeman, K. W. and Raun, W. R. , (2007) 'Use of In-Season Reflectance for Predicting Yield Potential in Bermudagrass', Communications in Soil Science and Plant Analysis, 38:11, 1519 - 1531 To link to this article: DOI: 10.1080/00103620701378466 URL: http://dx.doi.org/10.1080/00103620701378466 PLEASE SCROLL DOWN FOR ARTICLE Full terms and conditions of use: http://www.informaworld.com/terms-and-conditions-of-access.pdf This article maybe used for research, teaching and private study purposes. Any substantial or systematic reproduction, re-distribution, re-selling, loan or sub-licensing, systematic supply or distribution in any form to anyone is expressly forbidden. The publisher does not give any warranty express or implied or make any representation that the contents will be complete or accurate or up to date. The accuracy of any instructions, formulae and drug doses should be independently verified with primary sources. The publisher shall not be liable for any loss, actions, claims, proceedings, demand or costs or damages whatsoever or howsoever caused arising directly or indirectly in connection with or arising out of the use of this material. © Taylor and Francis 2007
Transcript of Use of In‐Season Reflectance for Predicting Yield Potential in Bermudagrass
This article was downloaded by:[Oklahoma State University][Oklahoma State University]
On: 2 July 2007Access Details: [subscription number 769426451]Publisher: Taylor & FrancisInforma Ltd Registered in England and Wales Registered Number: 1072954Registered office: Mortimer House, 37-41 Mortimer Street, London W1T 3JH, UK
Communications in Soil Science andPlant AnalysisPublication details, including instructions for authors and subscription information:http://www.informaworld.com/smpp/title~content=t713597241
Use of In-Season Reflectance for Predicting YieldPotential in Bermudagrass
Online Publication Date: 01 June 2007To cite this Article: Mosali, J., Girma, Kefyalew, Teal, R. K., Freeman, K. W. andRaun, W. R. , (2007) 'Use of In-Season Reflectance for Predicting Yield Potential inBermudagrass', Communications in Soil Science and Plant Analysis, 38:11, 1519 -1531To link to this article: DOI: 10.1080/00103620701378466URL: http://dx.doi.org/10.1080/00103620701378466
PLEASE SCROLL DOWN FOR ARTICLE
Full terms and conditions of use: http://www.informaworld.com/terms-and-conditions-of-access.pdf
This article maybe used for research, teaching and private study purposes. Any substantial or systematic reproduction,re-distribution, re-selling, loan or sub-licensing, systematic supply or distribution in any form to anyone is expresslyforbidden.
The publisher does not give any warranty express or implied or make any representation that the contents will becomplete or accurate or up to date. The accuracy of any instructions, formulae and drug doses should beindependently verified with primary sources. The publisher shall not be liable for any loss, actions, claims, proceedings,demand or costs or damages whatsoever or howsoever caused arising directly or indirectly in connection with orarising out of the use of this material.
© Taylor and Francis 2007
Dow
nloa
ded
By:
[Okl
ahom
a S
tate
Uni
vers
ity] A
t: 20
:49
2 Ju
ly 2
007
Use of In-Season Reflectance for PredictingYield Potential in Bermudagrass
J. Mosali
Samuel Roberts Noble Foundation, Ardmore, Oklahoma, USA
Kefyalew Girma, R. K. Teal, K. W. Freeman, and W. R. Raun
Department of Plant and Soil Sciences, Oklahoma State University,
Stillwater, Oklahoma, USA
Abstract: Spatial variability of soil nutrients is known to exist at distances of less than
1 m. Recently, an on-the-go system for application of nitrogen (N) fertilizer based on
spectral measurements known as in-season estimated yield (INSEY) improved N use
efficiency (NUE) by as much as 17% in winter wheat. Six trials were conducted in
2001, 2002, and 2003 at Ardmore and Burneyville, OK, with an objective to
develop an index similar to INSEY for use in predicting yield potential in bermuda-
grass (Cynodon dactylon L.) that can be used for adjusting fertilizer N rates. Initial
results indicate that 55% of variation in predicted bermudagrass forage yield was
explained by a Bermudagrass–INSEY (B-INSEY) index and 54% of the variation in
forage N uptake was explained using the normalized difference vegetative index
(NDVI). The remaining challenge is to develop appropriate N fertilizer rates based
on this information and apply these rates using on-the-go technology.
Keywords: Bermudagrass, in-season estimated yield (INSEY), normalized difference
vegetation index (NDVI), NUE, spectral indices
Received 6 September 2005, Accepted 30 May 2006
Contribution from the Oklahoma Agricultural Experiment Station and the Samuel
Roberts Noble Foundation.
Address correspondence to William R. Raun, Department of Plant and Soil
Sciences, 044 North Ag Hall, Oklahoma State University, OK 74078. E-mail: bill.
Communications in Soil Science and Plant Analysis, 38: 1519–1531, 2007
Copyright # Taylor & Francis Group, LLC
ISSN 0010-3624 print/1532-2416 online
DOI: 10.1080/00103620701378466
1519

Dow
nloa
ded
By:
[Okl
ahom
a S
tate
Uni
vers
ity] A
t: 20
:49
2 Ju
ly 2
007
INTRODUCTION
During the past few decades, the largest increase in the use of agricultural
inputs has been fertilizer N (Johnston 2000). Because many plant nutrients
are nonrenewable and depleting rapidly, efficient use of applied fertilizers is
important in these times of high production costs and environmental
concern. Currently, N-use efficiency for worldwide cereal production is
estimated to be 33% (Raun and Johnson 1999) and for forage production,
around 45%. The general production practice is to apply most of the N
based on a yield goal early in the spring. Johnson (1991) suggested that in
order to take the advantage of the above-average growing conditions in
dryland agriculture, it is better to set the yield goal above that of average
yields. Yield goal is the “yield per acre you hope to grow,” clearly indicating
the risk the farmer is taking when he calculates the amount of fertilizer for the
crop before production (Dahnke et al. 1988). Usually, fertilizer rates are
defined by a specified yield goal, taking into account available soil N (Raun
et al. 2001).
Osborne et al. (1999) reported that though yield increased with increasing
rates of N fertilizer, N-fertilizer recovery levels in bermudagrass were greatest
(85%) at N rates less than 224 kg N ha21, and recovery was less than 20%
when 1344 kg N ha21 was applied. Mathias, Bennett, and Lundberg (1978)
reported that bermudagrass yields and N concentration increased, whereas
percent recovery decreased with rising N applications up to 448 kg N ha21.
The presence of spatial variability in agricultural landscapes is an issue
demanding careful consideration for efficient use of fertilizers. One
approach to increase fertilizer-use efficiency is variable rate technology
(VRT). Carr et al. (1991) investigated economic efficiency of uniform fertili-
zer rates for the whole field versus variable rates for dryland wheat in accord-
ance with soil units that had different crop yield potential. They showed
positive returns of $53.57–58.10 kg21 when optimum treatments for a
specific soil were applied rather than uniform rates for the whole field.
Although soil units and satellite images distinguish field elements by
nutrient availability, their separation is rather poor (coarse scale), which
results in low efficiency of variable versus uniform application.
Nitrogen-use efficiency is also complicated by cropland spatial variability
that is known to exist at resolutions smaller than 1 m2 (Solie et al. 1996; Raun
et al. 1998). Raun et al. (1998) and Solie et al. (1999) reported that variability
exists in 0.3-m by 0.3-m bermudagrass plots with regard to the availability of
nutrients. The same work reported that variable fertilizer treatment of crops,
where each field element is treated separately, can be an effective alternative
to the existing uniform fertilizer application practices. Nitrogen fertilizer
requirements depend on the potential N uptake by the crop and are related
to the overall yield potential. Potential yield is the yield that can be
produced on a specific soil under specific weather conditions, and that
changes with time (Raun et al. 2001).
J. Mosali et al.1520
Dow
nloa
ded
By:
[Okl
ahom
a S
tate
Uni
vers
ity] A
t: 20
:49
2 Ju
ly 2
007
Cabrera and Kissel (1988) made fertilizer N recommendations based on N
mineralized from organic matter. According to Rodriguez and Miller (2000),
there was a positive linear relationship between total Kjeldahl nitrogen
(TKN) and near-infrared reflectance spectroscopy (NIRS). Spectral radiance
measurements were evaluated by Sembiring et al. (1998) to identify optimum
wavelengths for dual detection of N and P status in bermudagrass when
0, 112, 224, and 336 kg N ha21 and 0, 29, or 58 kg P ha21 were applied in a
factorial arrangement of treatments. Biomass, N uptake, P uptake, and N con-
centration could be predicted using 695/405 nm, with 435 nm as a covariate.
Taylor et al. (1998) reported that correlation of forage yield and N removal
with red, near infrared (NIR), and normalized difference vegetative index
(NDVI) were best with maximum forage production; however, when forage
production levels were low, correlation decreased dramatically for the red
wavelength compared with NIR and NDVI.
Crawford, Kennedy, and Johnson (1961) reported that the stage of growth,
level of N fertilization, plant part, and light intensity all influenced NO3-N con-
centration, whereas cultivar, source, time, and method of placement had no
effect in forages. Kincheloe (1994) reported that field practices should be site
specific and the areas within the field should be categorized to be best manage-
ment practices (BMP). He defined BMPs as those practices that have been tested
in research and proven on farmers’ fields as most effective in terms of input effi-
ciency, production potential, and environmental protection.
In-season knowledge of potential yield might be the key to successful
variable rate fertilizer applications. Raun et al. (2001) demonstrated that the
estimated yield (EY) index was a good predictor of grain yield over a wide
range of environmental conditions in winter wheat. Raun et al. (2002) later
refined this index, where only one NDVI reading is taken postdormancy,
divided by only those days where growing degree days are positive
GDD . 0 (including this environmental factor eliminates the days where
growth is not possible) from planting to the date of sensing, and named it
in-season estimate of yield (INSEY). The same work showed that yield
potential based on midseason estimates increased NUE by 15% when
compared to the uniform rates, and this was attributed to collecting readings
from each 1 m2 and fertilizing each 1 m2, recognizing that the spatial variability
exists at 1-m2 resolutions and that the potential yield of each 1 m2 is different.
The objective of this study is to develop an index similar to INSEY for
wheat for use in predicting forage yield potential in bermudagrass, which
can later be used for adjusting fertilizer N.
MATERIALS AND METHODS
Two field experiments with minimum fertilization located at Burneyville
(Minco silt loam, coarse-silty, mixed, superactive, thermic Udic Haplustolls)
and Ardmore (Wilson silt loam, fine, smectitic, thermic oxyaquic Vertic
Predicting Yield Potential in Bermudagrass 1521
Dow
nloa
ded
By:
[Okl
ahom
a S
tate
Uni
vers
ity] A
t: 20
:49
2 Ju
ly 2
007
Haplustalfs), Oklahoma, were initiated in April 2001. These were previously
established pastures with “Midland” bermudagrass. The experiments were
laid out in a randomized complete block design with eight treatments and
three replications. The plots received urea-N rates of 0, 56, 112, 168, and
224 kg N ha21 broadcast applied early in the spring at the time of breaking
dormancy (last week of March to first week of April).
Plot sizes were 3.04 m2 6.08 m with 3.04-m alleys. Phosphorus (P) and
potassium (K) were broadcast applied as per soil-test recommendations at both
sites at the initiation of the experiment. During early March of each year, a mix
of LoVol 6, Pendimax, was used to control weeds. Initial soil-test data and
dates of activities are reported in Tables 1 and 2, respectively.
Sensor readings were collected for 3 years at both locations at the time of
harvest for each cutting and during in-season growth for most cuttings. In-
season readings were collected following at least 10–14 days of active
growth (around 3 inches of height). Spectral reflectance measurements during
2001 from the bermudagrass canopy was measured using a handheld sensor
that was developed at Oklahoma State University, which included two
upward- and two downward-looking photodiode sensors that collected
readings in two bands, red (671+ 6 nm) and near infrared (780+ 6 nm) band-
widths during 2001 (Stone et al. 1996b). The reflectance sensor employed
photodiode detectors with inference filters. One pair of filters (up-looking)
received incoming light from the sun, and the other pair (down-looking)
received light reflected by vegetation and/or soil surface. The instrument
used a built-in 16-bit A/D converter that converted the signals from all four
photodiode sensors simultaneously. The ratio of readings from down-looking
to up-looking photodiodes allowed the elimination of fluctuation among
readings due to differences in atmospheric conditions and shadows. During
2002 and 2003, sensor readings were taken using a GreenSeekerw handheld
optical sensor (NTech Industries, Inc.) to measure crop reflectance and
calculate the NDVI. This sensor is an active sensor (which means it has its
own self-contained illumination in the both red [650þ 10 nm full-width half
magnitude] and NIR [77þ 15 nm]). When held at a distance of approximately
60 cm to 100 cm above the crop, it senses an area of 60 cm � 10 cm.
Table 1. Initial surface (0–15 cm) soil chemical characteristics and classification at
Ardmore and Burneyville, OK
Location pHaNH4-N
b
(mg kg21)
NO3-Nb
(mg kg21)
Pc
(mg kg21)
Kc
(mg kg21)
Ardmore 5.2 9.4 1.5 56 225
Burneyville 5.7 10.5 2.6 30 187
apH: 1:1 soil–water.bNH4-N and NO3-N: 2 M KCl extraction.cP and K: Mehlich III extraction.
J. Mosali et al.1522
Dow
nloa
ded
By:
[Okl
ahom
a S
tate
Uni
vers
ity] A
t: 20
:49
2 Ju
ly 2
007
This device measures reflectance, which is the fraction of emitted light in
the sensed area that is returned to the sensor (Raun et al. 2005). NDVI is
calculated based on the following formula:
NDVI ¼ðNIRref=NIRincÞ � ðREDref=REDincÞ
ðNIRref=NIRincÞ þ ðREDref=REDincÞ
where NDVI is as defined above; NIRref and NIRinc are reflected and incident
NIR light, respectively; and REDref and REDinc are reflected and incident red
light, respectively.
When the bermudagrass was at or near morphological stage of 41 to 49
(anthesis) as defined by West (1990), the forage was harvested. Caution was
taken to collect harvest data prior to anthesis because the grass turns a pale
color after this stage and there are increased chances of underestimating N
uptake, thus altering the N content in the grass. Forage was harvested in the
center of each plot using a John Deere (GT 262) lawn mower, with a
cutting width of 96.52 cm and a forage collection device attached. Forage
samples were weighed for fresh weight and subsampled for moisture
content at the time of harvest. The samples were then dried for 48 h in a
forced air oven at 708C and ground to pass a 0.125-mm (120-mesh) sieve.
The total forage N content was analyzed using a Carlo-Erba (Milan, Italy)
NA-1500 dry-combustion analyzer (Schepers, Francis, and Thompson 1989).
Early-season plant N uptake was determined by multiplying dry-matter yield
by the total N concentration determined from dry combustion. The difference
method (N removed in the check plot subtracted from the N removed in the
Table 2. Dates for field activities carried out at Ardmore and Burneyville, OK, during
the 2001–2003 cropping seasons
Field activity
Ardmore Burneyville
2001 2002 2003 2001 2002 2003
Dormancy
fertilization
Mar. 23 Apr. 10 Apr. 3 Mar. 23 Apr. 10 Apr. 3
1st sensor
reading
May 22 May 15 May 8 May 22 May 15 May 8
1st harvest Jun. 20 May 15 Jun. 19 Jun. 20 May 15 Jun. 19
2nd sensing Jun. 20 Jun. 04 Jun.19 Jun. 20 Jun. 4 Jun. 19
3rd sensing Jul. 10 Jul. 12 Aug. 1 Jul. 10 Jul. 12 Aug. 1
2nd harvest Aug. 10 Oct. 02 Oct. 27 Aug. 10 Jul. 12 Sep. 3
4th sensing Aug. 10 Aug. 09 Sep. 3 Aug. 10 Aug. 9 Sep. 3
5th sensing Oct. 2 — Oct. 27 Oct. 2 — Oct. 27
Final
harvest
Oct. 2 — — Oct. 2 Oct. 2 Oct. 27
Predicting Yield Potential in Bermudagrass 1523
Dow
nloa
ded
By:
[Okl
ahom
a S
tate
Uni
vers
ity] A
t: 20
:49
2 Ju
ly 2
007
fertilized plot divided by the amount of fertilizer N applied) was used to
determine NUE.
Data was analyzed using Microsoft Excel and SAS (SAS 2001). Growing
degree days were calculated by subtracting the base temperature from the daily
average minimum and maximum temperatures (Table 3). The minimum temp-
erature at which a plant can grow is called the base temperature (Eastin and
Sullivan 1984), which for bermudagrass is 108C:
B� INSEY ¼NDVIP
GDD;
GDD ¼TEMPmaxþ TEMPmin
2� 108C
where B-INSEY is in-season estimate of Bermudagrass forage yield.
At each trial, an N-rich strip (N applied at a rate when N would not be
limiting through out the growth cycle) was established, and 336 kg N ha21
was applied at the time of breaking of dormancy, followed by
224 kg N ha21 applied after every harvest until September.
RESULTS AND DISCUSSION
Individual Year
In 2001, NDVI measurements collected at the time of harvest at
Burneyville and Ardmore (three and two harvests, respectively) were
Table 3. Cropping period, GDD, and GDD . 0 data used at Ardmore and
Burneyville
Location Year Cutting
Cropping period
(days)a GDD . 0b SGDDc
Ardmore 2001 1 66 38 686
2002 2 57 19 374
2003 1 65 23 437
Burneyville 2001 1 66 38 903
2001 2 51 20 591
2002 2 57 19 394
2003 1 65 23 432
2003 2 75 43 1377
aCropping period: The time between the two harvests.bGDD . 0: The number of days where growing degree days are positive for the
period between previous harvest-breaking dormancy and the sensing date.cSGDD: Cumulative GDD from previous harvest/breaking dormancy until sensing
date.
J. Mosali et al.1524
Dow
nloa
ded
By:
[Okl
ahom
a S
tate
Uni
vers
ity] A
t: 20
:49
2 Ju
ly 2
007
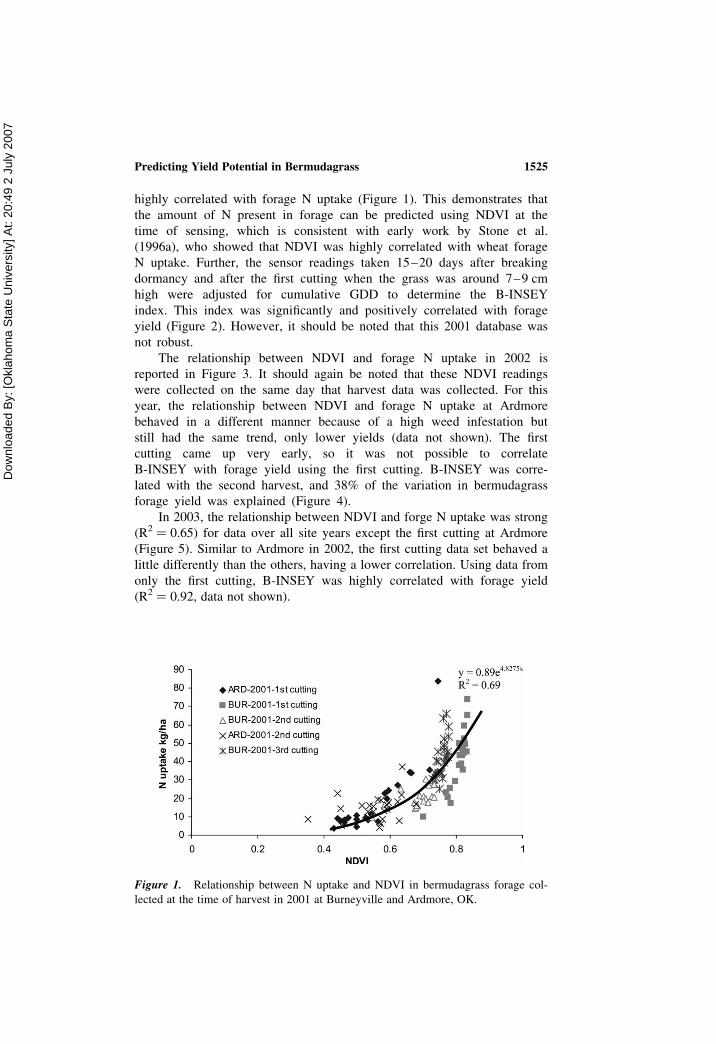
highly correlated with forage N uptake (Figure 1). This demonstrates that
the amount of N present in forage can be predicted using NDVI at the
time of sensing, which is consistent with early work by Stone et al.
(1996a), who showed that NDVI was highly correlated with wheat forage
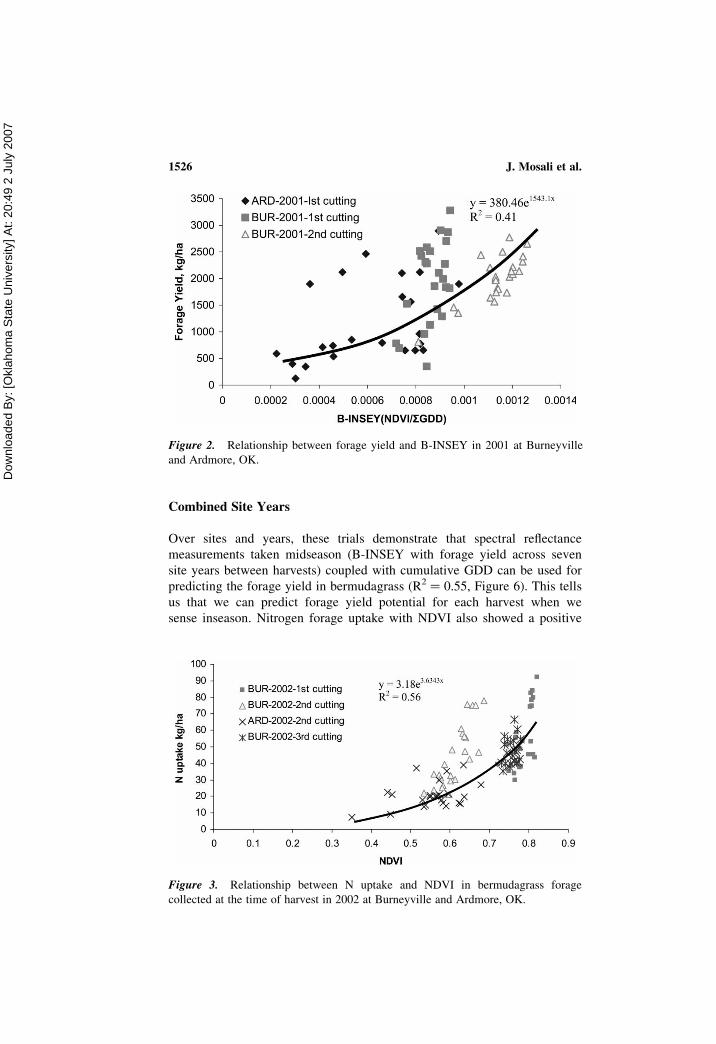
N uptake. Further, the sensor readings taken 15–20 days after breaking
dormancy and after the first cutting when the grass was around 7–9 cm
high were adjusted for cumulative GDD to determine the B-INSEY
index. This index was significantly and positively correlated with forage
yield (Figure 2). However, it should be noted that this 2001 database was
not robust.
The relationship between NDVI and forage N uptake in 2002 is
reported in Figure 3. It should again be noted that these NDVI readings
were collected on the same day that harvest data was collected. For this
year, the relationship between NDVI and forage N uptake at Ardmore
behaved in a different manner because of a high weed infestation but
still had the same trend, only lower yields (data not shown). The first
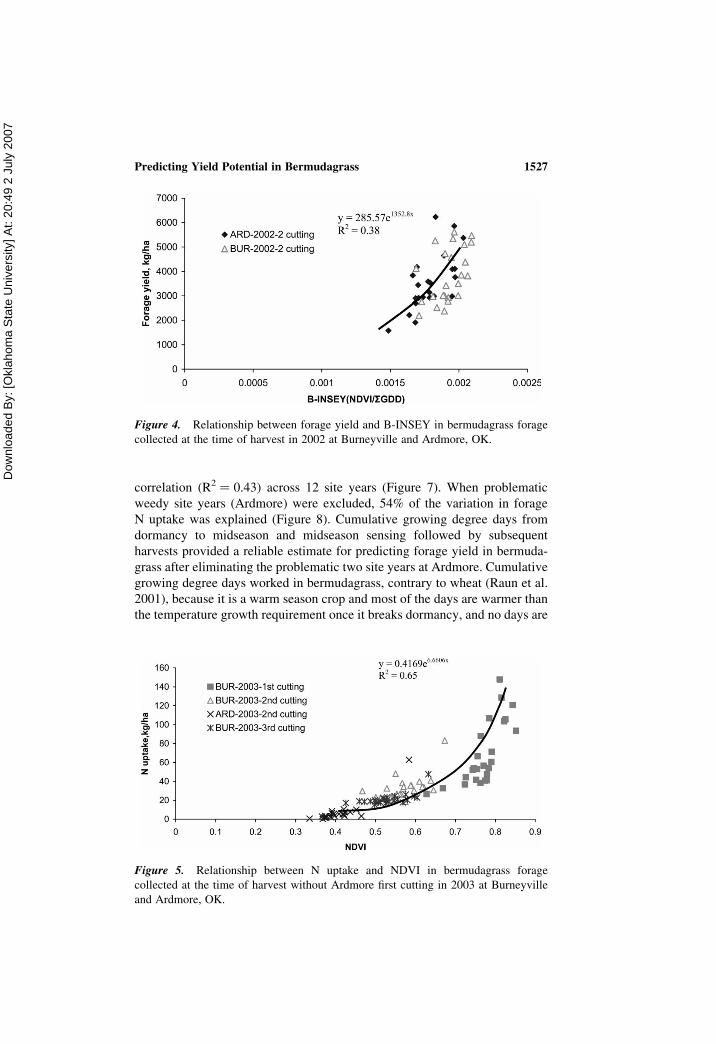
cutting came up very early, so it was not possible to correlate
B-INSEY with forage yield using the first cutting. B-INSEY was corre-
lated with the second harvest, and 38% of the variation in bermudagrass
forage yield was explained (Figure 4).
In 2003, the relationship between NDVI and forge N uptake was strong
(R2 ¼ 0.65) for data over all site years except the first cutting at Ardmore
(Figure 5). Similar to Ardmore in 2002, the first cutting data set behaved a
little differently than the others, having a lower correlation. Using data from
only the first cutting, B-INSEY was highly correlated with forage yield
(R2 ¼ 0.92, data not shown).
Figure 1. Relationship between N uptake and NDVI in bermudagrass forage col-
lected at the time of harvest in 2001 at Burneyville and Ardmore, OK.
Predicting Yield Potential in Bermudagrass 1525
Dow
nloa
ded
By:
[Okl
ahom
a S
tate
Uni
vers
ity] A
t: 20
:49
2 Ju
ly 2
007
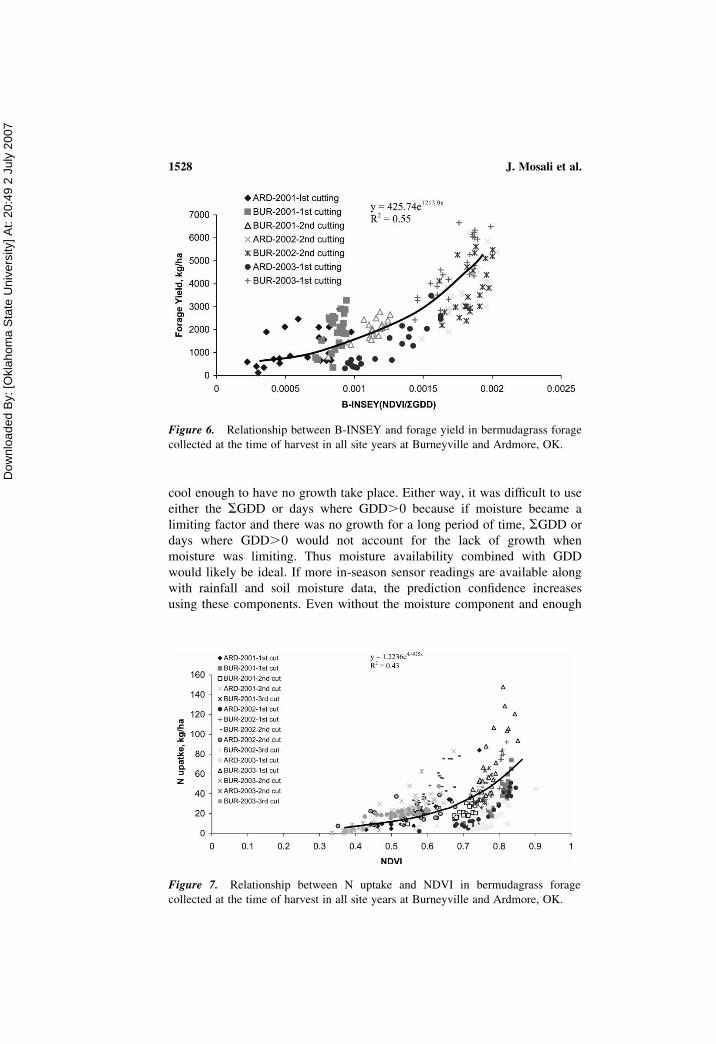
Combined Site Years
Over sites and years, these trials demonstrate that spectral reflectance
measurements taken midseason (B-INSEY with forage yield across seven
site years between harvests) coupled with cumulative GDD can be used for
predicting the forage yield in bermudagrass (R2 ¼ 0.55, Figure 6). This tells
us that we can predict forage yield potential for each harvest when we
sense inseason. Nitrogen forage uptake with NDVI also showed a positive
Figure 2. Relationship between forage yield and B-INSEY in 2001 at Burneyville
and Ardmore, OK.
Figure 3. Relationship between N uptake and NDVI in bermudagrass forage
collected at the time of harvest in 2002 at Burneyville and Ardmore, OK.
J. Mosali et al.1526
Dow
nloa
ded
By:
[Okl
ahom
a S
tate
Uni
vers
ity] A
t: 20
:49
2 Ju
ly 2
007
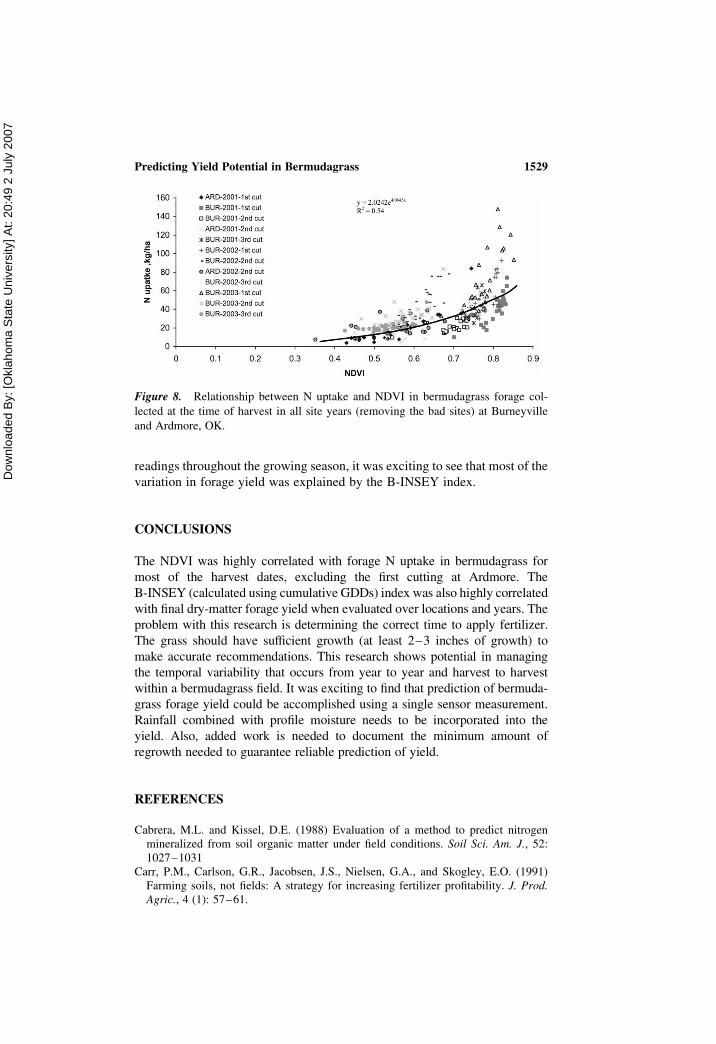
correlation (R2 ¼ 0.43) across 12 site years (Figure 7). When problematic
weedy site years (Ardmore) were excluded, 54% of the variation in forage
N uptake was explained (Figure 8). Cumulative growing degree days from
dormancy to midseason and midseason sensing followed by subsequent
harvests provided a reliable estimate for predicting forage yield in bermuda-
grass after eliminating the problematic two site years at Ardmore. Cumulative
growing degree days worked in bermudagrass, contrary to wheat (Raun et al.
2001), because it is a warm season crop and most of the days are warmer than
the temperature growth requirement once it breaks dormancy, and no days are
Figure 5. Relationship between N uptake and NDVI in bermudagrass forage
collected at the time of harvest without Ardmore first cutting in 2003 at Burneyville
and Ardmore, OK.
Figure 4. Relationship between forage yield and B-INSEY in bermudagrass forage
collected at the time of harvest in 2002 at Burneyville and Ardmore, OK.
Predicting Yield Potential in Bermudagrass 1527
Dow
nloa
ded
By:
[Okl
ahom
a S
tate
Uni
vers
ity] A
t: 20
:49
2 Ju
ly 2
007
cool enough to have no growth take place. Either way, it was difficult to use
either the SGDD or days where GDD.0 because if moisture became a
limiting factor and there was no growth for a long period of time, SGDD or
days where GDD.0 would not account for the lack of growth when
moisture was limiting. Thus moisture availability combined with GDD
would likely be ideal. If more in-season sensor readings are available along
with rainfall and soil moisture data, the prediction confidence increases
using these components. Even without the moisture component and enough
Figure 6. Relationship between B-INSEY and forage yield in bermudagrass forage
collected at the time of harvest in all site years at Burneyville and Ardmore, OK.
Figure 7. Relationship between N uptake and NDVI in bermudagrass forage
collected at the time of harvest in all site years at Burneyville and Ardmore, OK.
J. Mosali et al.1528
Dow
nloa
ded
By:
[Okl
ahom
a S
tate
Uni
vers
ity] A
t: 20
:49
2 Ju
ly 2
007
readings throughout the growing season, it was exciting to see that most of the
variation in forage yield was explained by the B-INSEY index.
CONCLUSIONS
The NDVI was highly correlated with forage N uptake in bermudagrass for
most of the harvest dates, excluding the first cutting at Ardmore. The
B-INSEY (calculated using cumulative GDDs) index was also highly correlated
with final dry-matter forage yield when evaluated over locations and years. The
problem with this research is determining the correct time to apply fertilizer.
The grass should have sufficient growth (at least 2–3 inches of growth) to
make accurate recommendations. This research shows potential in managing
the temporal variability that occurs from year to year and harvest to harvest
within a bermudagrass field. It was exciting to find that prediction of bermuda-
grass forage yield could be accomplished using a single sensor measurement.
Rainfall combined with profile moisture needs to be incorporated into the
yield. Also, added work is needed to document the minimum amount of
regrowth needed to guarantee reliable prediction of yield.
REFERENCES
Cabrera, M.L. and Kissel, D.E. (1988) Evaluation of a method to predict nitrogenmineralized from soil organic matter under field conditions. Soil Sci. Am. J., 52:1027–1031
Carr, P.M., Carlson, G.R., Jacobsen, J.S., Nielsen, G.A., and Skogley, E.O. (1991)Farming soils, not fields: A strategy for increasing fertilizer profitability. J. Prod.Agric., 4 (1): 57–61.
Figure 8. Relationship between N uptake and NDVI in bermudagrass forage col-
lected at the time of harvest in all site years (removing the bad sites) at Burneyville
and Ardmore, OK.
Predicting Yield Potential in Bermudagrass 1529
Dow
nloa
ded
By:
[Okl
ahom
a S
tate
Uni
vers
ity] A
t: 20
:49
2 Ju
ly 2
007
Crawford, R.F., Kennedy, W.K., and Johnson, W.C. (1961) Some factors that affect
nitrate accumulation in forages. Agron. J., 53: 159–162.
Dahnke, W.C., Swenson, L.J., Goos, R.J., and Leholm, A.G. (1988) Choosing a crop
yield goal. North Dakota State Ext. Ser. SF-822. Fargo, N.D.: North Dakota
University.
Eastin, J.D. and Sullivan, C.Y. (1984) Environmental stress influences on plant physi-
ology and production. In Physiological Basis of Crop Growth and Development;
Tesar, M.B. (ed.); CSSA and ASA: Madison, Wisc., 201–213.
Johnson, G.V. (1991) General model for predicting crop response to fertilizers. Agron.
J., 83: 367–373.
Johnston, A.E. (2000) Efficient use of nutrients in agricultural production systems.
Commun. Soil Sci. Plant Anal., 31: 1599–1620.
Kincheloe, S. (1994) Tools to aid management: The use of site specific management.
J. Soil Water Conserv., 49 (2): 43–47.
Mathias, E.L., Bennett, O.L., and Lundberg, P.E. (1978) Fertilization effects on yield
and N concentration of Midland bermudagrass. Agron. J., 70: 973–976.
Osborne, S.L., Raun, W.R., Johnson, G.V., Rogers, J.L., and Altom, W. (1999) Bermu-
dagrass response to high nitrogen rates, sources, and season of application. Agron. J.,
91: 438–444.
Raun, W.R. and Johnson, G.V. (1999) Improving nitrogen use efficiency for cereal pro-
duction. Agron. J., 91: 357–363.
Raun, W.R., Johnson, G.V., Stone, M.L., Solie, J.B., Lukina, E.V., and
Thomason, W.E. (2001) In-season prediction of potential grain yield in winter
wheat using canopy reflectance. Agron. J., 93: 131–178.
Raun, W.R., Solie, J.B., Freeman, K.W., Stone, M.L., Martin, K.L., Johnson, G.V., and
Mullen, R.W. (2005) Growth stage, development, and spatial variability in corn
evaluated using optical sensor readings. J. Plant Nutr., 28: 173–182.
Raun, W.R., Solie, J.B., Johnson, G.V., Stone, M.L., Mullen, R.W., Freeman, K.W.,
Thomason, W.E., and Lukina, E.V. (2002) Improving nitrogen use efficiency in
cereal grain production with optical sensing and variable rate application. Agron.
J., 94: 815–820.
Raun, W.R., Solie, J.B., Johnson, G.V., Stone, M.L., Whitney, R.W., Lees, H.L.,
Sembiring, H., and Phillips, S.B. (1998) Micro-variability in soil test, plant
nutrient, and yield parameters in bermudagrass. Soil Sci. Soc. Am. J., 62: 683–690.
Rodriguez, I.R. and Miller, G.L. (2000) Using near infrared reflectance spectroscopy to
schedule nitrogen applications on dwarf-type bermudagrasses. Agron. J., 92:
423–427.
SAS Institute. 2001. SAS/STAT user’s guide, release 8.1. Cary, N.C.: SAS Institute.
Schepers, J.S., Francis, D.D., and Thompson, M.T. (1989) Simultaneous determination
of total C, total N and 15 N on soil and plant material. Commun. Soil Sci. Plant Anal.,
20: 949–959.
Sembiring, H., Raun, W.R., Johnson, G.V., Stone, M.L., Solie, J.B., and Phillips, S.B.
(1998) Detection of nitrogen and phosphorus nutrient status in bermudagrass using
spectral radiance. J. Plant Nutr., 21: 1189–1206.
Solie, J.B., Raun, W.R., and Stone, M.L. (1999) Submeter spatial variability of selected
soil and bermudagrass production variables. Soil Sci. Soc. Am. J., 63: 1724–1733.
Solie, J.B., Raun, W.R., Whitney, R.W., Stone, M.L., and Ringer, J.D. (1996) Optical
sensor based field element size and sensing strategy for nitrogen application. Trans.
ASAE, 39 (6): 1983–1992.
J. Mosali et al.1530
Dow
nloa
ded
By:
[Okl
ahom
a S
tate
Uni
vers
ity] A
t: 20
:49
2 Ju
ly 2
007
Stone, M.L., Solie, J.B., Raun, W.R., Whitney, R.W., Taylor, S.L., and Ringer, J.D.(1996a) Use of spectral radiance for correcting in-season fertilizer nitrogendeficiencies in winter wheat. Trans. ASAE, 39 (5): 1623–1631.
Stone, M.L., Solie, J.B., Whitney, R.W., Raun, W.R., and Lees, H.L. (1996b) Sensorsfor detection of nitrogen in winter wheat. SAE Technical Paper No. 961757. SAE:Warrendale, Penn.
Taylor, S.L., Raun, W.R., Solie, J.B., Johnson, G.V., Stone, M.L., and Whitney, R.W.(1998) Use of spectral radiance for correcting nitrogen deficiencies and estimatingsoil test variability in an established bermudagrass pasture. J. Plant Nutr., 21:2287–2302.
West, C.P. (1990) A proposed growth stage system for bermudagrass. In Proceedingsof American Forage and Grassland Conference, Blacksbury, VA. 6–9 June 1990.American Forage and Grass Council: Georgetown, TX.
Predicting Yield Potential in Bermudagrass 1531