Consistency of MODIS surface bidirectional reflectance distribution function and albedo retrievals:...
15
Consistency of MODIS surface bidirectional reflectance distribution function and albedo retrievals: 2. Validation Yufang Jin, Crystal B. Schaaf, Curtis E. Woodcock, Feng Gao, 1 Xiaowen Li, 1 and Alan H. Strahler Department of Geography and Center for Remote Sensing, Boston University, Boston, Massachusetts, USA Wolfgang Lucht Potsdam-Institut fu ¨r Klimafolgenforschung, Potsdam, Germany Shunlin Liang Department of Geography, University of Maryland, College Park, Maryland, USA Received 26 July 2002; revised 6 November 2002; accepted 15 January 2003; published 8 March 2003. [1] The evaluation of the first available satellite-based global albedo product at 1-km resolution is essential for its application in climate studies. We evaluate the accuracy of the Moderate-Resolution Imaging Spectroradiometer (MODIS) albedo product using available field measurements at Surface Radiation Budget Network (SURFRAD) and Cloud and Radiation Testbed–Southern Great Plains (CART/SGP) stations and examine the consistency between the MODIS surface albedos and the Clouds and Earth’s Radiant Energy System (CERES) top-of-the-atmosphere albedos as well as historical global albedos from advanced very high resolution radiometer (AVHRR) and Earth Radiation Budget Experiment (ERBE) observations. A comparison with the field measurements shows that the MODIS surface albedo generally meets an absolute accuracy requirement of 0.02 for our study sites during April – September 2001, with the root mean square errors less than 0.018. Larger differences appear in the winter season probably due to the increased heterogeneity of surface reflectivity in the presence of snow. To examine the effect of spatial heterogeneity on the validation of the MODIS albedos using fine resolution field measurements, we derive an intermediate albedo product from four Landsat Enhanced Thematic Mapper Plus (ETM+) images at 30-m spatial resolution as a surrogate for the distributed field measurements. The surface albedo is relatively homogeneous over the study stations in growing seasons, and therefore the validation during April – September is supported. A case study over three SURFRAD stations reveals that the MODIS bidirectional reflectance distribution function model is able to capture the solar zenith angle dependence of surface albedo as shown by the field measurements. We also find that the MODIS surface shortwave albedo is consistent with the contemporary and collocated CERES top-of atmosphere albedos derived directly from broadband observations. The MODIS albedo is also well correlated with historical surface albedos derived from AVHRR and ERBE observations, and a high bias of 0.016 and a low bias of 0.034 compared to those of the latter albedos are reasonable considering the differences in instruments and retrieval algorithms as well as environmental changes. INDEX TERMS: 3322 Meteorology and Atmospheric Dynamics: Land/atmosphere interactions; 3359 Meteorology and Atmospheric Dynamics: Radiative processes; 3360 Meteorology and Atmospheric Dynamics: Remote sensing; KEYWORDS: MODIS, surface albedo, validation Citation: Jin, Y., C. B. Schaaf, C. E. Woodstock, F. Gao, X. Li, A. H. Strahler, W. Lucht, and S. Liang, Consistency of MODIS surface bidirectional reflectance distribution function and albedo retrievals: 2. Validation, J. Geophys. Res., 108(D5), 4159, doi:10.1029/2002JD002804, 2003. 1. Introduction [2] As a key land physical parameter controlling the surface radiation energy budget [Dickinson, 1995], surface albedo with an absolute accuracy of 0.02–0.05 is required JOURNAL OF GEOPHYSICAL RESEARCH, VOL. 108, NO. D5, 4159, doi:10.1029/2002JD002804, 2003 1 Also at Research Center for Remote Sensing, Beijing Normal University, Beijing, China. Copyright 2003 by the American Geophysical Union. 0148-0227/03/2002JD002804$09.00 ACL 3 - 1
-
Upload
independent -
Category
Documents
-
view
4 -
download
0
Transcript of Consistency of MODIS surface bidirectional reflectance distribution function and albedo retrievals:...
Consistency of MODIS surface bidirectional reflectance
distribution function and albedo retrievals:
2. Validation
Yufang Jin, Crystal B. Schaaf, Curtis E. Woodcock, Feng Gao,1 Xiaowen Li,1
and Alan H. StrahlerDepartment of Geography and Center for Remote Sensing, Boston University, Boston, Massachusetts, USA
Wolfgang LuchtPotsdam-Institut fur Klimafolgenforschung, Potsdam, Germany
Shunlin LiangDepartment of Geography, University of Maryland, College Park, Maryland, USA
Received 26 July 2002; revised 6 November 2002; accepted 15 January 2003; published 8 March 2003.
[1] The evaluation of the first available satellite-based global albedo product at 1-kmresolution is essential for its application in climate studies. We evaluate the accuracy of theModerate-Resolution Imaging Spectroradiometer (MODIS) albedo product usingavailable field measurements at Surface Radiation Budget Network (SURFRAD) andCloud and Radiation Testbed–Southern Great Plains (CART/SGP) stations and examinethe consistency between the MODIS surface albedos and the Clouds and Earth’s RadiantEnergy System (CERES) top-of-the-atmosphere albedos as well as historical globalalbedos from advanced very high resolution radiometer (AVHRR) and Earth RadiationBudget Experiment (ERBE) observations. A comparison with the field measurementsshows that the MODIS surface albedo generally meets an absolute accuracy requirementof 0.02 for our study sites during April–September 2001, with the root mean square errorsless than 0.018. Larger differences appear in the winter season probably due to theincreased heterogeneity of surface reflectivity in the presence of snow. To examine theeffect of spatial heterogeneity on the validation of the MODIS albedos using fineresolution field measurements, we derive an intermediate albedo product from fourLandsat Enhanced Thematic Mapper Plus (ETM+) images at 30-m spatial resolution as asurrogate for the distributed field measurements. The surface albedo is relativelyhomogeneous over the study stations in growing seasons, and therefore the validationduring April–September is supported. A case study over three SURFRAD stations revealsthat the MODIS bidirectional reflectance distribution function model is able to capture thesolar zenith angle dependence of surface albedo as shown by the field measurements. Wealso find that the MODIS surface shortwave albedo is consistent with the contemporaryand collocated CERES top-of atmosphere albedos derived directly from broadbandobservations. The MODIS albedo is also well correlated with historical surface albedosderived from AVHRR and ERBE observations, and a high bias of 0.016 and a low bias of0.034 compared to those of the latter albedos are reasonable considering the differences ininstruments and retrieval algorithms as well as environmental changes. INDEX TERMS:
3322 Meteorology and Atmospheric Dynamics: Land/atmosphere interactions; 3359 Meteorology and
Atmospheric Dynamics: Radiative processes; 3360 Meteorology and Atmospheric Dynamics: Remote
sensing; KEYWORDS: MODIS, surface albedo, validation
Citation: Jin, Y., C. B. Schaaf, C. E. Woodstock, F. Gao, X. Li, A. H. Strahler, W. Lucht, and S. Liang, Consistency of
MODIS surface bidirectional reflectance distribution function and albedo retrievals: 2. Validation,
J. Geophys. Res., 108(D5), 4159, doi:10.1029/2002JD002804, 2003.
1. Introduction
[2] As a key land physical parameter controlling thesurface radiation energy budget [Dickinson, 1995], surfacealbedo with an absolute accuracy of 0.02–0.05 is required
JOURNAL OF GEOPHYSICAL RESEARCH, VOL. 108, NO. D5, 4159, doi:10.1029/2002JD002804, 2003
1Also at Research Center for Remote Sensing, Beijing NormalUniversity, Beijing, China.
Copyright 2003 by the American Geophysical Union.0148-0227/03/2002JD002804$09.00
ACL 3 - 1
by climate models at a range of spatial and temporal scales[Henderson-Sellers and Wilson, 1983; Sellers, 1993].However, this objective has not yet been satisfied to theextent that, for instance, global surface albedo maps ofsuch accuracy are not routinely provided. A land coverbased scheme is currently adopted in most of the landsurface model (LSMs) and general circulation models(GCMs) for the parameterization and specification of sur-face albedo [Bonan, 1996; Sellers et al., 1996; Hansen,1983], although a quantified justification for this scheme isyet to be answered due to the limit of high resolutionglobal albedo data sets. On the other hand, natural land-scapes are a collection of nested objects in a hierarchicalfashion, and various processes control the biophysicalcharacteristics at different spatial scales [Woodcock andHarward, 1992; Collins and Woodcock, 2000]. Land sur-face models usually allow a subgrid specification of landcover proportions to account for the heterogeneity ofsurface properties within a grid [Dickinson et al., 1993;Bonan, 1996], while GCMs are generally implemented atvery coarse spatial resolutions [Trenberth, 1992]. Theincreasing spatial resolution of modern climate modelsmakes it necessary to examine spatial features of globalsurface albedo and the effect of spatial scales on thealbedo specification. This calls for a spatially explicitglobal albedo product with high accuracy and high spatialresolution.[3] In view of this need, surface albedo, including seven
spectral and three broadband albedos, is produced as astandard product along with other radiative quantities fromobservations acquired by the Moderate-Resolution ImagingSpectroradiometer (MODIS) aboard the Terra (EOS AM-1)platform [Wanner et al., 1997; Lucht et al., 2000a; Schaaf etal., 2002]. As a first global albedo product at a 1-kmresolution, the MODIS albedo product can be aggregatedto subgrid land surface classes and can be routinely updatedfor use in weather prediction models. It is also very flexibleas far as the spectral specification and the illuminationconditions are concerned [Strahler et al., 1996; Wanner etal., 1997].[4] The evaluation of such a satellite-derived albedo
product, however, is essential for users, without whichsubsequent science would be open to questioning. It isusually undertaken by reference to internal diagnosticsand independent measurements [Rodgers, 2000]. In a com-panion paper [Jin et al., 2003], the performance of theMODIS BRDF and albedo retrieval algorithm is evaluatedbased on the product Quality Assurance (QA) fields, anal-ysis of the input data, and intercomparisons with differentretrieval algorithms. The main purpose of this study is tovalidate the operational MODIS albedo product, namely, toassess its accuracy and to examine its consistency with otherglobal albedo products.[5] Validation is a procedure to assess the uncertainties of
the estimated product by comparing it with ground truth[Justice et al., 2000]. Independent field measurements, onthe ground or at a tower, as well as measurements fromaircraft, are generally presumed to be ground truth and areoften taken as the reference for validation. The validation ofsatellite-derived products, however, is difficult becausesatellite observations cover larger areas than in situ meas-urements [Lucht et al., 2000b]. A key problem arising from
such different measurement scales is whether a singleground measurement represents the mean value for the pixelat the satellite scale [Tian et al., 2002]. When land surface isheterogeneous, a number of ground samples are needed tocapture the spatial variance of the albedo and hence torepresent the mean albedo value over the region covering asatellite pixel [Lucht et al., 2000b]. This, however, posesboth logistic and practical difficulties for albedo validation.An alternative is to select relatively homogeneous regionsfor the validation so that the ground measurement matcheswell the mean albedo at the satellite scale. Surface albedoalso depends on the sun and viewing geometry and atmos-pheric conditions, which requires contemporary ground andsatellite observations for the validation. It is thus notsurprising that only a limited number of validation exercisesfor satellite-derived albedos are found in the literature, suchas comparisons of ground-based albedometer measurementsand AVHRR-based albedos through spatial modeling [Luchtet al., 2000b].[6] The Surface Radiation Budget Network (SURF-
RAD) [Augustine et al., 2000] and the Southern GreatPlains (SGP) site of the Cloud and Radiation Testbed(CART) [Stokes and Schwartz, 1994] were designed toprovide accurate and continuous measurements of thesurface radiation budget for climate research. Upwardand downward radiation measurements are routinely meas-ured at a temporal resolution of 3 minutes, from which thesurface albedo can be calculated. The landform andvegetation are relatively homogeneous over an extendedregion around these stations. Therefore, these stations canprovide ground observations to verify the satellite-basedalbedo retrievals.[7] This study uses the field measurements acquired from
the above mentioned stations in 2001 to quantify theaccuracy of the operational MODIS albedos. The simulta-neous and collocated top-of-atmosphere (TOA) albedo[Wielicki et al., 1998] derived from Clouds and Earth’sRadiant Energy System (CERES), a broadband instrumenton board the same Terra Platform [Wielicki et al., 1996], isalso used here for a consistency analysis. To examine if theMODIS albedo is consistent with other commonly usedhistorical data sets of global albedo climatology, a compar-ison is also undertaken with the independent global albedosderived from the Advanced Very High Resolution Radio-meter (AVHRR) [Csiszar and Gutman, 1999] and the EarthRadiation Budget Experiment (ERBE) radiometer [Li andGarand, 1994].
2. MODIS Albedo Retrieval Algorithm
[8] As described in the companion paper [Jin et al.,2003], the MODIS BRDF and albedo algorithm uses athree-parameter semiempirical RossThick-LiSparse-Recip-rocal (RTLSR) BRDF model to characterize the anisotropicreflectivity of the land surface [Wanner et al., 1997; Lucht etal., 2000a; Schaaf et al., 2002]. The MODIS atmosphericcorrection algorithm uses aerosol and water vapor informa-tion retrieved from MODIS observations to derive surfacereflectance from TOA radiance [Vermote et al., 1997a].Cloud-free atmospherically-corrected surface reflectancesare then accumulated during each 16 day period, fromwhich the BRDF parameters are first retrieved. Seven
ACL 3 - 2 JIN ET AL.: VALIDATION OF MODIS ALBEDO RETRIEVAL ALGORITHM
spectral albedos are then derived through angular integra-tion of the retrieved BRDF models. Finally a spectral tobroadband conversion [Liang et al., 1999] is used toproduce three broadband albedos (0.3–0.7 mm, 0.7–5.0mm, and 0.3–5.0 mm). In addition to a mainstream process(full inversion), a backup magnitude inversion algorithm isused if there are less than seven clear looks or if observa-tions do not fit the BRDF model well during a 16 day period[Strugnell and Lucht, 2001]. The snow/ice flag is turned onif the majority of observations are indicated as snow/iceduring a 16 day period, and only those observations areused for the BRDF and albedo snow inversion [Schaaf etal., 2002]. Otherwise, only snow-free observations are usedfor the retrieval.
3. Validation With Field Measurements
3.1. Station Descriptions
[9] As part of the world-wide baseline surface radiationnetwork, the Surface Radiation Budget Network was estab-lished by NOAA’s Surface Radiation Research Branch[Augustine et al., 2000]. It has been used to validate short-wave radiation budgets derived from the GOES observa-tions [Pinker et al., 1996]. Currently there are six operatingstations that cover climatologically diverse regions over theUnited States [DeLuisi et al., 1999]. Land cover is relativelyhomogeneous over an extended region at each station. Thestation in central Pennsylvania is located on Penn StateUniversity’s Agricultural Research Farm and that in Bond-ville is located in an agricultural region southwest ofChampaign, Illinois. The Goodwin Creek station is locatedon rural pasture land to the west of Oxford, Mississippi. TheFort Peck station, located on the Fort Peck Tribes Reser-vation in Montana, is dominated by grasslands. There isonly sparse vegetation at the Desert Rock station, northwestof Las Vegas, Nevada. The land surface of Table Mountainstation, north of Boulder, Colorado, is sandy, with a mix ofexposed rocks, sparse grasses, desert shrubs and smallcactus.[10] The Southern Great Plains radiation testbed, estab-
lished by DOE’s Atmospheric Radiation Measurement(ARM) Program, is located in Southern Kansas and North-ern Oklahoma. The main cover types are croplands, grass-lands and savannas. The 21 SGP sites are designed to coveran area roughly 350 km on a side (about the size of a gridcell of a general circulation model). The locations of theinstruments were chosen so that the measurements reflectconditions over the typical distribution of land uses withinthe site.[11] For both networks, total downward and upward solar
radiation (0.28–3.0 mm) were measured every 3 minutes byupward-looking pyranometers mounted on a horizontalplatform and inverted pyranometers mounted on 10-mmeteorological towers, respectively. The 45� effective fieldof view of the downward-looking pyranometer translates toan area of about 18 m in diameter on the ground. The directnormal and diffuse shortwave fluxes are also measured byEppley Normal Incidence Pyranometer and a ventilated andshaded Spectrosun pyranometer. The data sets were aver-aged to a 1/2 hour time step by the CERES ARM ValidationExperiment (CAVE) [Rutan et al., 2001]. In addition,estimates of cloud fraction as seen from the upward-point-
ing pyranometers are given for certain time periods [Longand Ackerman, 2000].
3.2. Time Series of Surface Albedo
[12] We derived the surface albedos from the measureddownward and upward radiation at local solar noon for eachSURFRAD and CART site. For a better comparison withthe MODIS clear sky surface albedos, cloud screening wasperformed using a threshold of 0.2 for the estimated cloudfraction in the CAVE data set. The field albedos under clearconditions were then averaged over all snow-free days orsnow days for each 16-day period during 2001, dependingon the snow flag embedded in the MODIS albedo QAproduct. We used an albedo threshold of 0.5 here to identifydaily snow conditions due to the lack of snow informationin the CAVE data set.[13] Note that the field albedos correspond to the actual
solar illumination with both direct beam and diffuse radia-tion, while MODIS provides intrinsic surface albedos (blacksky albedo for direct beam at local solar noon and white skyalbedo for isotropic diffuse radiation). To obtain MODIS-based albedos comparable with the field measurements, wefirst calculated the ratios of the measured direct and diffusedownwelling radiation to the total downwelling radiation atlocal solar noon under clear sky conditions, respectively.The MODIS black sky albedo at local solar noon and thewhite sky albedo were then weighted by the above ratios toobtain so-called MODIS actual albedos.[14] Figures 1a–1c shows the annual time series of the
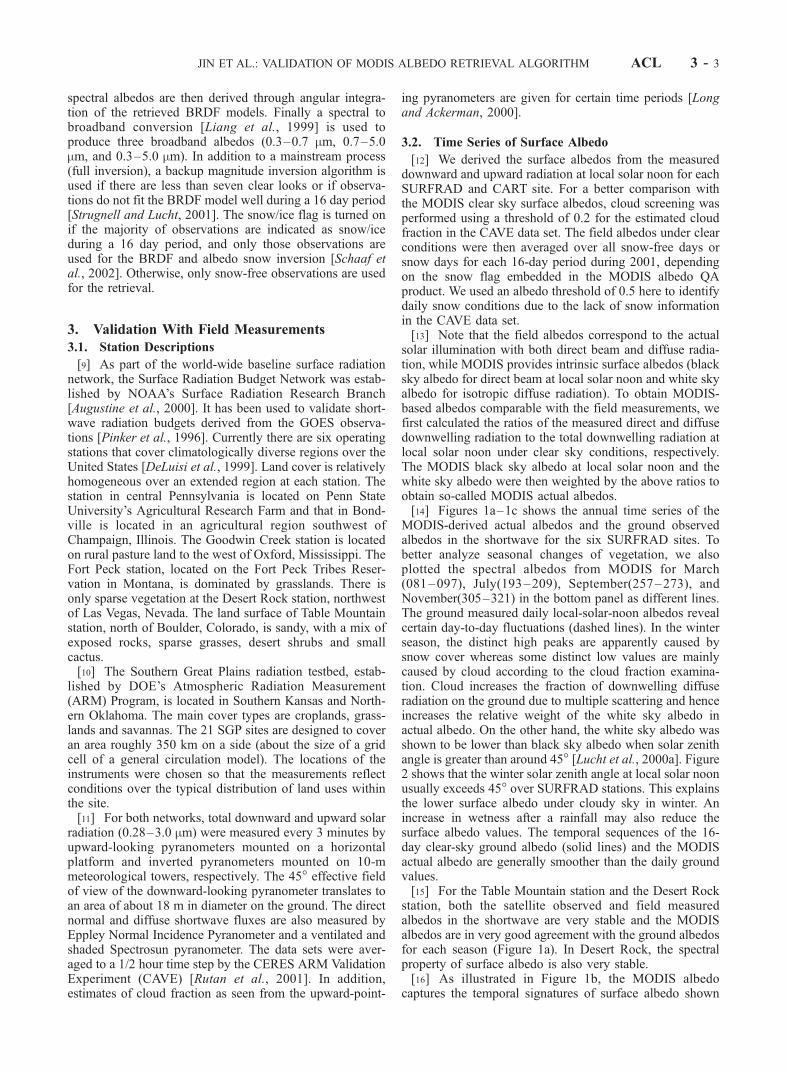
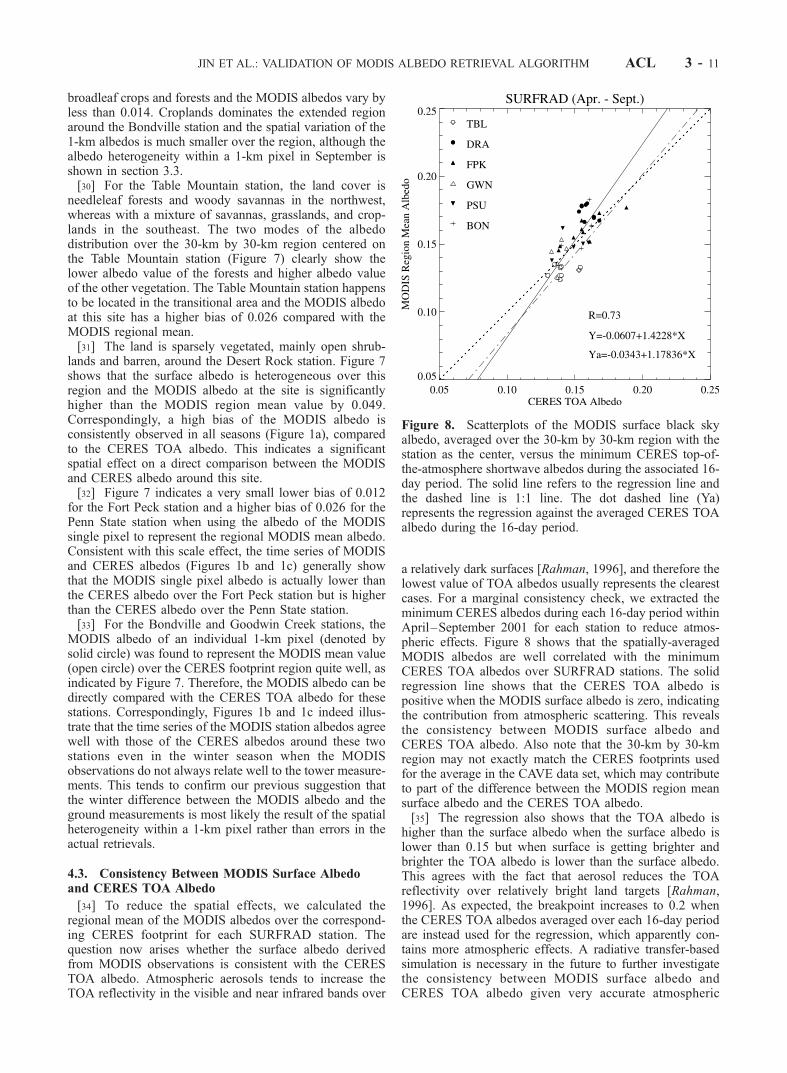
MODIS-derived actual albedos and the ground observedalbedos in the shortwave for the six SURFRAD sites. Tobetter analyze seasonal changes of vegetation, we alsoplotted the spectral albedos from MODIS for March(081–097), July(193–209), September(257–273), andNovember(305–321) in the bottom panel as different lines.The ground measured daily local-solar-noon albedos revealcertain day-to-day fluctuations (dashed lines). In the winterseason, the distinct high peaks are apparently caused bysnow cover whereas some distinct low values are mainlycaused by cloud according to the cloud fraction examina-tion. Cloud increases the fraction of downwelling diffuseradiation on the ground due to multiple scattering and henceincreases the relative weight of the white sky albedo inactual albedo. On the other hand, the white sky albedo wasshown to be lower than black sky albedo when solar zenithangle is greater than around 45� [Lucht et al., 2000a]. Figure2 shows that the winter solar zenith angle at local solar noonusually exceeds 45� over SURFRAD stations. This explainsthe lower surface albedo under cloudy sky in winter. Anincrease in wetness after a rainfall may also reduce thesurface albedo values. The temporal sequences of the 16-day clear-sky ground albedo (solid lines) and the MODISactual albedo are generally smoother than the daily groundvalues.[15] For the Table Mountain station and the Desert Rock
station, both the satellite observed and field measuredalbedos in the shortwave are very stable and the MODISalbedos are in very good agreement with the ground albedosfor each season (Figure 1a). In Desert Rock, the spectralproperty of surface albedo is also very stable.[16] As illustrated in Figure 1b, the MODIS albedo
captures the temporal signatures of surface albedo shown
JIN ET AL.: VALIDATION OF MODIS ALBEDO RETRIEVAL ALGORITHM ACL 3 - 3
in the comparable field measurements, especially in spring,summer, and early fall. In Fort Peck, Montana, both thefield and the MODIS surface albedos are above 0.5 inJanuary and February because of snow on the ground. Thefield data show that the total shortwave albedo decreasesslightly from late March and then becomes stable until July.The MODIS shortwave albedo is also rather small andstable during this time period. Moreover, the phenology of
vegetation is shown by the increase of the MODIS near-infrared broadband albedo and the decrease of the MODISvisible albedo starting from April when more leaves beginto appear and less bare ground is exposed. Starting fromAugust, the MODIS shortwave albedo increases, similar tothe field albedos, as a result of the continuing increase of thevisible albedo during vegetation senescence. Similar trendsare observed in Goodwin Creek station where pasture land
Figure 1a. Temporal sequences of surface shortwave albedos at local solar noon (LSN) as observedfrom the SURFRAD stations (all sky daily values: dashed line; 16-day averages under clear sky: solidline) and derived from the MODIS operational black sky and white sky albedos for the pixels in whichthe stations are located. The solid circles and the solid squares represent the MODIS retrievals with themain inversion algorithm and the backup magnitude inversion, respectively. The plus refers to theCERES clear-sky top-of-atmosphere (TOA) albedos averaged over all the footprints within the 15-kmradius. The triangle and diamond refer to the MODIS broadband albedos in the visible (VIS) and nearinfrared (NIR), respectively. The MODIS spectral albedos are shown in the bottom panel for four periodsin 2001. Note that the missing data in June is due to the Power Supply 2 shutdown anomaly of theMODIS instrument from 15 June 2001 to 2 July 2001.
ACL 3 - 4 JIN ET AL.: VALIDATION OF MODIS ALBEDO RETRIEVAL ALGORITHM

is dominant, but the MODIS albedo is lower than the fieldmeasurements except in summer. It should also be notedthat the solar zenith angle at local solar noon changes fromaround 20� in summer to around 60� in winter as shown inFigure 2, which also contributes to the annual cycle ofsurface albedo.[17] The temporal signatures of the field measurements are
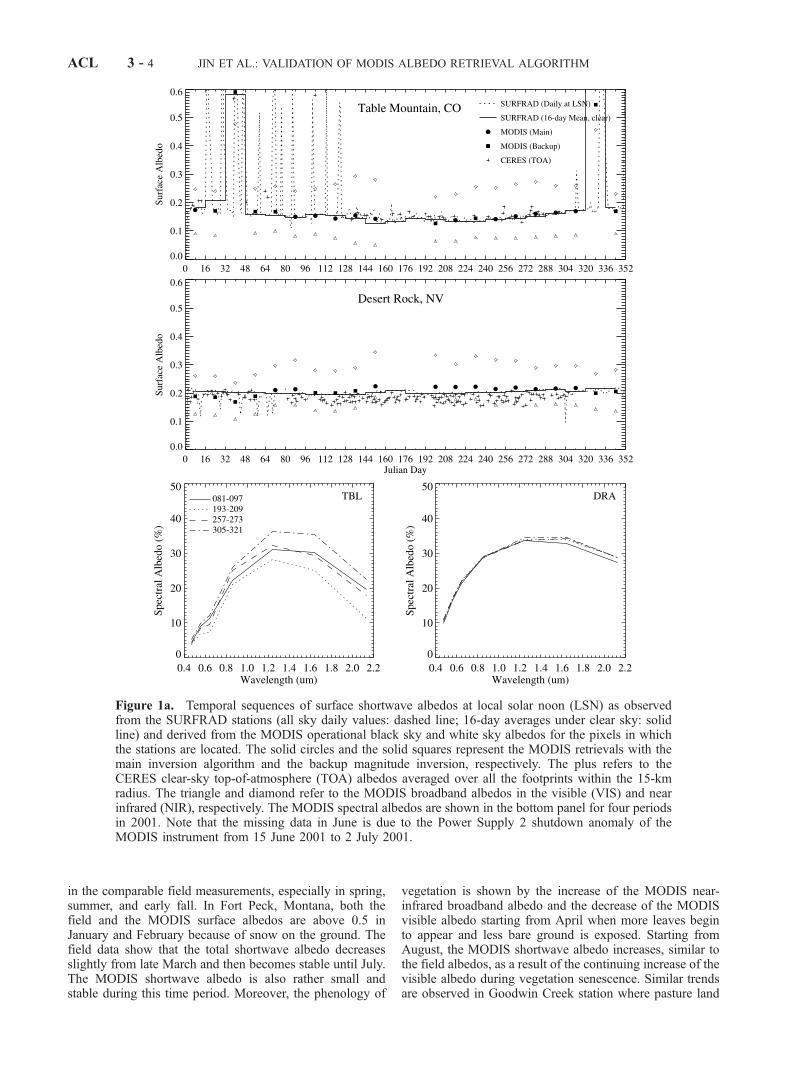
more apparent in the Penn State University station and theBondville station, such as the decrease of shortwave albedosduring January–March (Figure 1c). Both stations are locatedin agricultural areas. The MODIS albedos from both the fullinversion and magnitude inversion algorithms agree wellwith the field measurements during April–September. How-ever, they are lower than the field values by up to 0.05 for thePenn State station and by up to 0.10 for the Bondville stationduring the winter season. In the shortwave, the MODISalbedo is lower in winter than in summer, which is contrary
to the trend as shown in the field measurement. The temporaltrend of the MODIS spectral albedos, however, follows thephenology of crops. We found an apparent increase fromMarch to July and a gradual decrease of the near-infraredalbedo from July to November. The MODIS albedos in thevisible are slightly higher inMarch and November than thosein summer. One possibility for the discrepancy betweenMODIS and field shortwave albedos is that the in situ fieldobservations may not be representative of the overallMODIS pixel as the ground area seen from a pyranometeris significantly smaller. This scale effect is particularlyimportant when there is extensive landscape heterogeneity.Over agricultural areas, the surface radiative properties areprobably more heterogeneous in early spring, late fall andwinter, due to snow fall and snow melting as well as rapidvegetation change, than in growing seasons. This issue willbe further investigated in the following section.
Figure 1b. Same as Figure 1a but for Fort Peck (FPK) and Goodwin Creek (GWN) stations.
JIN ET AL.: VALIDATION OF MODIS ALBEDO RETRIEVAL ALGORITHM ACL 3 - 5
[18] To exclude the above mentioned possible scaleeffects of snow cover, snow melting, and vegetation change,Figure 3 plots only the albedos acquired during April–September 2001 for both SURFRAD and CART sites.During these growing seasons, a very good agreement isshown between the MODIS albedos and the field albedos.For the SURFRAD stations, the RMSE is 0.018 and theMODIS albedo has a slightly low bias of 0.004. A RMSE of0.015 and a lower bias of 0.005 were found for the CART/SGP sites. It is obvious that the MODIS albedo products ingreen seasons generally meet the absolute albedo accuracywithin 0.02 required by climate models, especially overgrasslands and croplands. Further studies are needed toinvestigate the accuracy of MODIS albedo products forlarge solar zenith angle, where the anisotropy of thedownwelling diffuse radiation reduces the accuracy of usingthe weighted sum of MODIS black sky and white sky
albedo to represent surface albedo under actual illuminationconditions [Lewis and Barnsley, 1994].
3.3. Scale Effects on Surface Albedo Validation
[19] The larger difference between the MODIS albedoand the field values in winter, late fall, and early spring thanthose in growing seasons suggests the possible effect ofspatial heterogeneity within the MODIS pixels on thecomparison. Large number of well-sampled ground obser-vations are required to capture the variance of albedoswithin a larger region where the land reflectivity is hetero-geneous. In this case statistics can be derived to validate theMODIS albedo product. However, this method is imprac-tical to implement. Landsat ETM+ observations, with a 30-m spatial resolution, are more comparable with the fluxmeasurements at the tower, and thus can be used as asurrogate for distributed field measurements to examine if
Figure 1c. Same as Figure 1a but for Penn State (PSU) and Bondville (BON) stations.
ACL 3 - 6 JIN ET AL.: VALIDATION OF MODIS ALBEDO RETRIEVAL ALGORITHM

the area around the stations is sufficiently homogeneoussuch that the station measurement represents the albedomean at the MODIS 1-km resolution.[20] We used here four examples to explore possible
spatial scale effects on albedo validation. Two Landsatimages, acquired on 15 July and 17 September 2000,cover the Bondville SURFRAD station. For each 1-kmby 1-km region collocated with the MODIS pixel, thedigital counts were first converted to TOA reflectances andatmospheric correction was then performed with 6S [Ver-mote et al., 1997b] using the field-measured aerosoloptical depths. To obtain the albedo from the Landsatsurface directional reflectances, we used the MODISBRDF parameters to derive the ratio of the hemisphericalalbedo at local solar noon to the directional surfacereflectance at the Landsat near-nadir observing geometry.Finally, narrowband to broadband conversion coefficients[Liang, 2000] were applied to derive the Landsat totalshortwave albedo.[21] Over the MODIS 1 km2 region where the Bondville
station is located, the histogram of the Landsat shortwavealbedos at the 30-m resolution (Figure 4, upper left panel)shows that the surface albedo is relatively homogeneous(low variance) in July, when vegetation is lush and theLandsat albedo at the field site is only slightly higher by0.017 than the mean value of the Landsat albedos over the 1km2 region. As noted earlier, the MODIS albedo is actuallyvery similar to the field albedo in summer for this station. InSeptember, during the senescent season, the surroundingsurface is more heterogeneous as shown by the three modesin the Landsat albedo distribution and the higher overallvariance. The Landsat albedo at the field site is higher thanthe mean value by 0.027 (Figure 4, upper right panel),indicating that a higher bias of 0.027 would be caused whenusing the albedo of the 30-m by 30-m field around thestation to represent the mean albedo value over the MODISpixel. This explains partly the lower bias of 0.05 for theMODIS 1 km albedo relative to the ground measuredalbedo in September presented in Figure 1c. As a more
appropriate comparison, the MODIS albedos are shown tobe similar with the mean values of Landsat albedos over the1-km by 1-km region.[22] In Southern Great Plains, the Landsat image acquired
on 12 July 2001 covers the sites C01 and E15. There are nocorresponding MODIS albedo products in July 2001 due tohigh frequency of cloud cover in summer over this area. Thedirectional-to-hemispherical conversion is thus not under-taken for these two sites. This, however, does not affect ourexamination of spatial effect as it has no influence on thedistribution of Landsat albedos over the MODIS pixel.Figure 4 (bottom panel) shows that the Landsat shortwavealbedo at the site matches well the mean Landsat albedovalues over the 1-km by 1-km region, with the differenceless than 0.004. This agreement indicates that the fieldmeasurements can be directly used to validate the MODIS1-km albedo products in summer at these two sites. Thelower panel of Figure 3 indeed demonstrates the very goodagreement between the MODIS albedos and the fieldmeasurements.
3.4. Solar Zenith Angle Dependence
[23] An accurate quantification of the solar zenith angledependence of surface albedo would improve the derivationof daily and monthly mean surface albedo, and increase theaccuracy of the modeled shortwave radiation absorbed bythe surface. By characterizing the anisotropy of surfacereflectivity, the retrieved MODIS BRDF model can beeasily integrated to derive the surface albedo under anyillumination condition.[24] We used the MODIS operationally-produced BRDF
parameters to derive the surface black sky albedo at varioussolar zenith angles. The fraction of the direct and diffuseradiation measured in SURFRAD stations are then used toderive the actual surface albedo. We also calculated theaverage values of ground measured albedos under clear skyconditions over each corresponding 16-day period forvarious local hours. Figure 5 shows the diurnal cycle ofthe MODIS (dotted line) and measured (solid line) surface
Figure 2. Time series of solar zenith angle at local solar noon over six SURFRAD stations. Solid linewithout symbols refers to solar zenith angle when EOS-Terra passes over Table Mountain Station.
JIN ET AL.: VALIDATION OF MODIS ALBEDO RETRIEVAL ALGORITHM ACL 3 - 7

albedos for Fort Peck, Penn State University, and DesertRock sites during Julian days 208–224 and 240–256,respectively. The field-based measurement reveals that thealbedo has the minimum value near noon and increases withthe solar zenith angle. The MODIS albedos are shown tocapture such a trend. As the solar zenith angle increases, thepath lengths of photon interaction with vegetation increasesand hence the probability of multiple scattering is increased,leading to higher albedo. For the Fort Peck and Penn State
University sites, the MODIS albedos display slightlyweaker solar zenith angle dependence than those of theground measurements.[25] Also shown in Figure 5 is that largest differences
between MODIS and measurements appear when solarzenith angle is greater than 65�. This is mainly due to thedecreased accuracy of the RTLSR BRDF model at highsolar zenith angles [Lucht, 1998]. Lewis and Barnsley[1994] also found that an isotropic diffuse approximationmay introduce errors in calculating actual albedo from theblack sky and white sky albedo when the solar zenith angleis high. The asymmetry of the MODIS actual albedosaround local solar noon is caused by the asymmetricfractions of diffuse and direct radiation in the morningand the afternoon as measured over SURFRAD stations.
4. Consistency With CERES TOA BroadbandAlbedo
4.1. Instrument and Data
[26] Broadband instruments can reduce the narrowband-to-broadband conversion uncertainties in the albedoretrieval compared to the narrowband instruments. TheEarth Radiation Budget Experiment (ERBE) is the firstmulti-satellite system tailored to the measurement of thetop-of-atmosphere shortwave, longwave and total radiationfluxes [Barkstrom, 1984]. CERES, on board the same Terraplatform as MODIS, is a new design based on the successfulERBE scanning radiometer [Wielicki et al., 1996] and isexpected to double the ERBE accuracy of radiative fluxesand broadband albedo at the top of the atmosphere. Asdescribed in part 1 [Jin et al., 2003], the MODIS surfacealbedo is retrieved from the TOA spectral radiances througha series of correction and modeling procedures and hence itsaccuracy depends on each intermediate process. Therefore,it is necessary to check if this downstream product isconsistent with an independent measurement of albedo atthe top of the atmosphere.[27] With a field of view of 20-km at nadir, the CERES
footprint data has been subsetted from the daily ES-8 files[Wielicki et al., 1996] and pared down to correspond withthe 1/2 hour time step of the processed surface data by theCAVE [Rutan et al., 2001]. We used the average of theCERES top-of-atmosphere albedos over all the CERESfootprints that fall within a 15-km radius of a given surfacesite. Only the observations identified as clear scenes in theCAVE data set are used here for our analysis.
4.2. Spatial Analysis of MODIS Albedos OverCERES Footprint
[28] The annual time series of the CERES TOA albedosare also shown in Figures 1a–1c. It should be noted that theCERES TOA albedo is produced for Terra-overpass solarzenith angle while the MODIS albedo is produced at localsolar noon. However, the difference between the solarzenith angle at local solar noon and that of Terra overpass(10:30AM) is mostly less than 10 over SURFRAD stations(Figure 2), which does not cause significant albedo change.Considering the different spatial scales of the MODISalbedo and the CERES albedo, it is necessary to check ifthe albedo for a single MODIS pixel with a 1-km resolutionrepresents the mean status of the albedo over a large region
Figure 3. Scatterplots of the MODIS actual shortwavealbedo versus the field albedo for the SURFRAD stations(Figure 3a) and CART/SGP sites (Figure 3b) during April–September 2001. All albedos are values at the local solarnoon. The dashed lines refer to the boundary of the absoluteaccuracy requirement of 0.02.
ACL 3 - 8 JIN ET AL.: VALIDATION OF MODIS ALBEDO RETRIEVAL ALGORITHM

covered by the CERES average 30-km by 30-km footprint.Figure 6 shows images of the IGBP land cover types and thetotal shortwave surface albedo from MODIS over a 30-kmby 30-km region centered on each SURFRAD station. Notethat the albedo images shown are derived for the MODISobservations in May 2001 for the Goodwin Creek station
and in early September 2001 for all other SURFRADstations, which are examples of the full inversion. We alsoplotted the distribution of the MODIS surface albedos overeach 30-km by 30-km region and calculated the regionalmean values of the MODIS albedos (Figure 7) for thecorresponding time periods.
Figure 4. Histograms (solid curve) of surface albedos derived from Landsat ETM+ within a 1-km by 1-km region collocated with the MODIS pixel where the station is located. The mean value and standarddeviation of the Landsat albedos within the region are plotted as an open circle and a horizontal line. TheLandsat albedo at the actual station location is represented by the dashed line whereas the MODIS albedoat the site is represented by the solid circle. The top panels refer to the Bondville station, and the Landsatimageries were acquired on 15 July and 17 September 2000, respectively. The bottom panels representthe CART sites C01 and E15, and the Landsat imagery was acquired on 12 July 2001.
Figure 5. Solar zenith angle dependence of surface albedo as observed from the ground and derivedfrom the retrieved MODIS BRDF model at Fort Peck, Penn State, and Desert Rock SURFRAD stations.The time periods for the observations are also shown in the panel titles.
JIN ET AL.: VALIDATION OF MODIS ALBEDO RETRIEVAL ALGORITHM ACL 3 - 9

[29] The albedo histograms show that the Fort Peck,Goodwin Creek, Penn State, and Bondville stations arerelatively more homogeneous than the Table Mountainand Desert Rock sites in growing seasons. The extendedregion around the Fort Peck is covered by grass and crops,
and the standard deviation of the MODIS albedos over thisregion is 0.025. The extended region around the GoodwinCreek station is dominated by croplands with broadleafforests and woody savannas scattered around. Located in anagricultural area, the Penn State station is surrounded by
Figure 6. Images of the MODIS IGBP land cover type and the MODIS black sky shortwave albedoover a 30-km by 30-km region centered on each SURFRAD station. Fill values are in black, and whiterepresents water or the pixels outside a tile boundary. IGBP 1. Evergreen needleleaf forests; 3. Deciduousneedleleaf forests; 4. Deciduous broadleaf forests; 5. Mixed forests; 6. Closed shrublands; 7. Openshrublands; 8. Woody savannas; 9. Savannas; 10. Grasslands; 12. Croplands; 13. Urban and built-uplands; 14. Cropland/Natural vegetation mosaics; 15. Snow and Ice; 16. Barren.
Figure 7. Histograms (solid curve) of the MODIS surface albedos within a 30-km by 30-km regioncollocated centered in the station. The mean value and standard deviation of the MODIS albedos withinthe region are plotted as open circle and horizontal line. The MODIS albedo at the actual site isrepresented by the solid circles whereas the minimum, mean, and maximum of the CERES albedosduring the 16-day period are represented by the vertical solid lines from left to right.
ACL 3 - 10 JIN ET AL.: VALIDATION OF MODIS ALBEDO RETRIEVAL ALGORITHM
broadleaf crops and forests and the MODIS albedos vary byless than 0.014. Croplands dominates the extended regionaround the Bondville station and the spatial variation of the1-km albedos is much smaller over the region, although thealbedo heterogeneity within a 1-km pixel in September isshown in section 3.3.[30] For the Table Mountain station, the land cover is
needleleaf forests and woody savannas in the northwest,whereas with a mixture of savannas, grasslands, and crop-lands in the southeast. The two modes of the albedodistribution over the 30-km by 30-km region centered onthe Table Mountain station (Figure 7) clearly show thelower albedo value of the forests and higher albedo valueof the other vegetation. The Table Mountain station happensto be located in the transitional area and the MODIS albedoat this site has a higher bias of 0.026 compared with theMODIS regional mean.[31] The land is sparsely vegetated, mainly open shrub-
lands and barren, around the Desert Rock station. Figure 7shows that the surface albedo is heterogeneous over thisregion and the MODIS albedo at the site is significantlyhigher than the MODIS region mean value by 0.049.Correspondingly, a high bias of the MODIS albedo isconsistently observed in all seasons (Figure 1a), comparedto the CERES TOA albedo. This indicates a significantspatial effect on a direct comparison between the MODISand CERES albedo around this site.[32] Figure 7 indicates a very small lower bias of 0.012
for the Fort Peck station and a higher bias of 0.026 for thePenn State station when using the albedo of the MODISsingle pixel to represent the regional MODIS mean albedo.Consistent with this scale effect, the time series of MODISand CERES albedos (Figures 1b and 1c) generally showthat the MODIS single pixel albedo is actually lower thanthe CERES albedo over the Fort Peck station but is higherthan the CERES albedo over the Penn State station.[33] For the Bondville and Goodwin Creek stations, the
MODIS albedo of an individual 1-km pixel (denoted bysolid circle) was found to represent the MODIS mean value(open circle) over the CERES footprint region quite well, asindicated by Figure 7. Therefore, the MODIS albedo can bedirectly compared with the CERES TOA albedo for thesestations. Correspondingly, Figures 1b and 1c indeed illus-trate that the time series of the MODIS station albedos agreewell with those of the CERES albedos around these twostations even in the winter season when the MODISobservations do not always relate well to the tower measure-ments. This tends to confirm our previous suggestion thatthe winter difference between the MODIS albedo and theground measurements is most likely the result of the spatialheterogeneity within a 1-km pixel rather than errors in theactual retrievals.
4.3. Consistency Between MODIS Surface Albedoand CERES TOA Albedo
[34] To reduce the spatial effects, we calculated theregional mean of the MODIS albedos over the correspond-ing CERES footprint for each SURFRAD station. Thequestion now arises whether the surface albedo derivedfrom MODIS observations is consistent with the CERESTOA albedo. Atmospheric aerosols tends to increase theTOA reflectivity in the visible and near infrared bands over
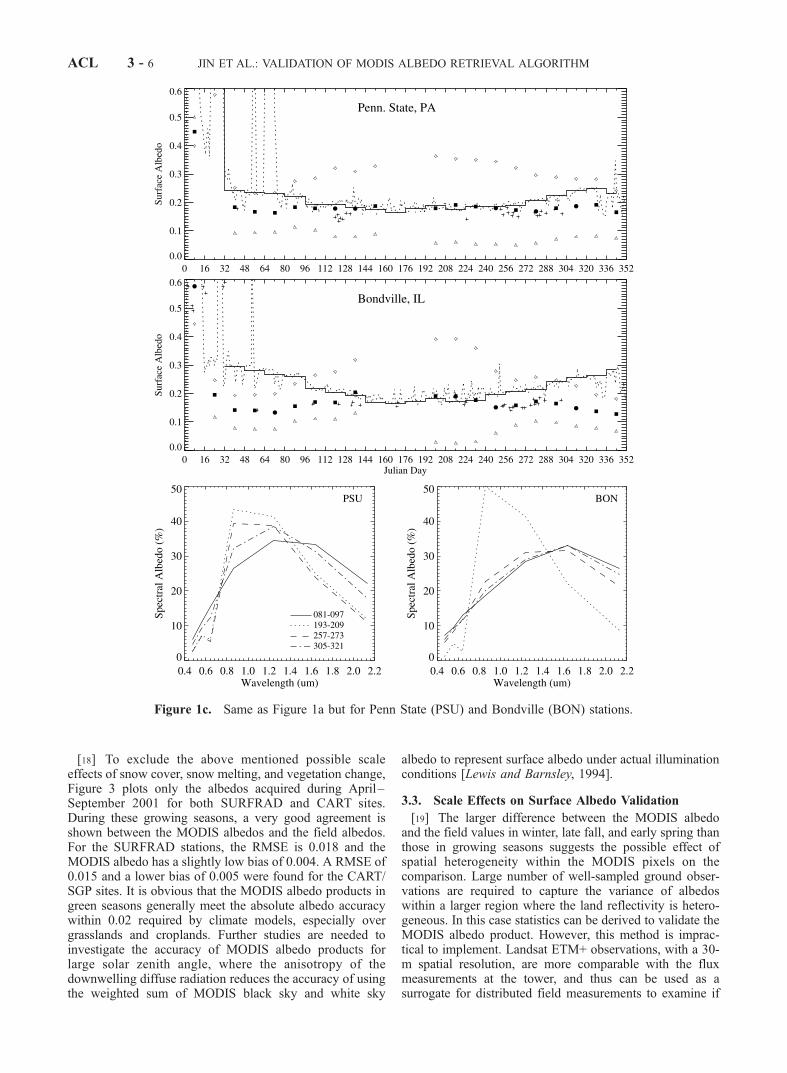
a relatively dark surfaces [Rahman, 1996], and therefore thelowest value of TOA albedos usually represents the clearestcases. For a marginal consistency check, we extracted theminimum CERES albedos during each 16-day period withinApril–September 2001 for each station to reduce atmos-pheric effects. Figure 8 shows that the spatially-averagedMODIS albedos are well correlated with the minimumCERES TOA albedos over SURFRAD stations. The solidregression line shows that the CERES TOA albedo ispositive when the MODIS surface albedo is zero, indicatingthe contribution from atmospheric scattering. This revealsthe consistency between MODIS surface albedo andCERES TOA albedo. Also note that the 30-km by 30-kmregion may not exactly match the CERES footprints usedfor the average in the CAVE data set, which may contributeto part of the difference between the MODIS region meansurface albedo and the CERES TOA albedo.[35] The regression also shows that the TOA albedo is
higher than the surface albedo when the surface albedo islower than 0.15 but when surface is getting brighter andbrighter the TOA albedo is lower than the surface albedo.This agrees with the fact that aerosol reduces the TOAreflectivity over relatively bright land targets [Rahman,1996]. As expected, the breakpoint increases to 0.2 whenthe CERES TOA albedos averaged over each 16-day periodare instead used for the regression, which apparently con-tains more atmospheric effects. A radiative transfer-basedsimulation is necessary in the future to further investigatethe consistency between MODIS surface albedo andCERES TOA albedo given very accurate atmospheric
Figure 8. Scatterplots of the MODIS surface black skyalbedo, averaged over the 30-km by 30-km region with thestation as the center, versus the minimum CERES top-of-the-atmosphere shortwave albedos during the associated 16-day period. The solid line refers to the regression line andthe dashed line is 1:1 line. The dot dashed line (Ya)represents the regression against the averaged CERES TOAalbedo during the 16-day period.
JIN ET AL.: VALIDATION OF MODIS ALBEDO RETRIEVAL ALGORITHM ACL 3 - 11

information such as aerosol optical depth and amount ofwater vapor.
5. Comparison With Other Global AlbedoData Sets
[36] A number of algorithms were developed to retrieveregional or global surface albedo from various satelliteinstruments [Pinker and Laszlo, 1992; Li and Garand,1994; Weiss et al., 1999; Gutman, 1999; Csiszar and Gut-man, 1999; Pinty et al., 2000a, 2000b]. Li and Garand[1994] produced a monthly surface broadband albedoclimatology with a 2.5� resolution using five years of ERBEclear-sky data during 1985-1989. The TOA broadbandalbedo was first derived with ERBE Angular DistributionModels and a linear parameterization was then establishedto derive surface albedo directly from the TOA albedoassuming a fixed aerosol optical depth of 0.05 at 550 nm.A higher resolution albedo product was derived from
weekly composites of NOAA AVHRR/GAC GVI data sets,which contains the 5-year monthly means of surface broad-band shortwave albedos at a 0.15� spatial resolution underclear-sky and snow-free conditions during 1985–1991[Csiszar and Gutman, 1999]. In Csiszar and Gutman’sretrieval algorithm, a narrow-to-broadband conversion wasfirst performed and angular and atmospheric correctionssimilar to Li and Garand’s methods were undertaken.Furthermore, albedo is normalized to overhead sun illumi-nation conditions. Both ERBE and AVHRR albedo productswere validated with available field measurements [Li andGarand, 1994; Csiszar and Gutman, 1999]. To examine theconsistency between the MODIS albedos and the above twohistorical data sets which are commonly used by climatemodelers, we aggregated the MODIS albedos in June andSeptember 2001 from 1-km resolution to 0.15� and 2.5�resolution for comparison.[37] Figure 9 shows the operational MODIS 1-km surface
black sky albedo at local solar noon, the 0.15� AVHRR
Figure 9. Global September albedo from the MODIS operational product with 1-km resolution, theAVHRR observations with 0.15� resolution [Csiszar and Gutman, 1999], and the ERBE observationswith 2.5� resolution [Li and Garand, 1994]. Fill values are in black.
ACL 3 - 12 JIN ET AL.: VALIDATION OF MODIS ALBEDO RETRIEVAL ALGORITHM

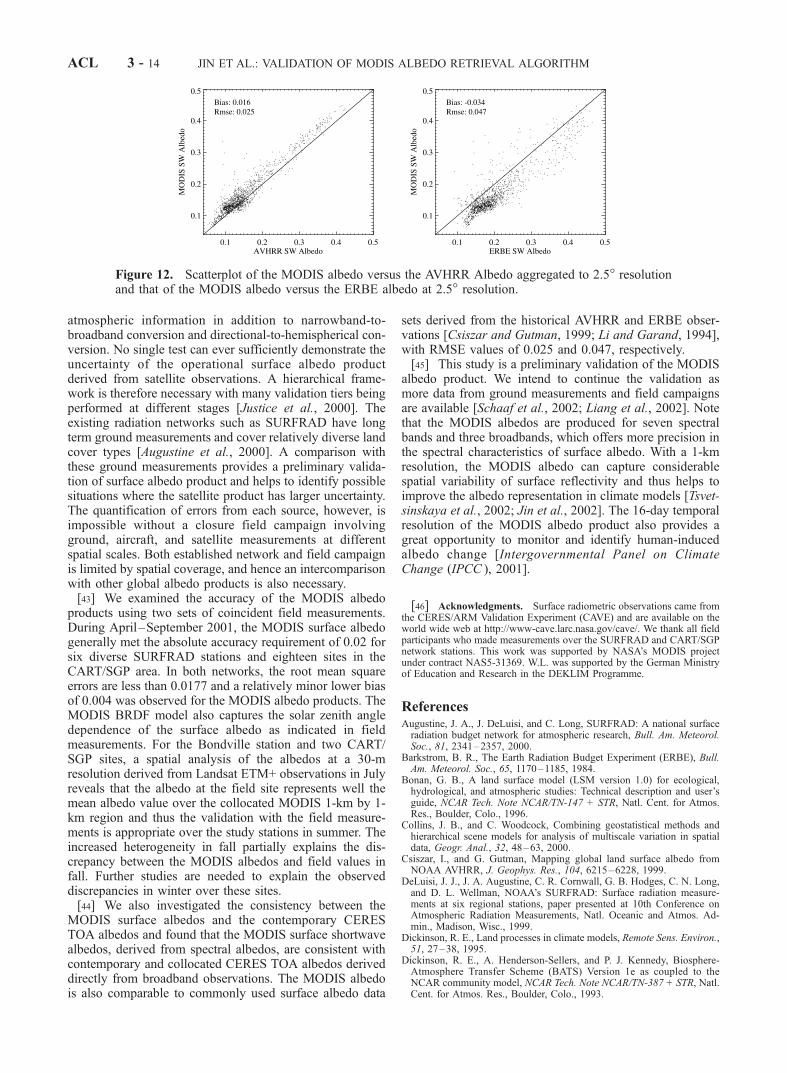
albedo under overhead sun conditions, and the 2.5� ERBEmonthly mean surface albedo in September. Similar spatialpatterns of surface albedo are apparent in both the MODISand AVHRR data sets. The surface albedo of boreal forest isas low as 0.1 while the albedo of desert is around 0.35. Theintermediate albedo values appear in grasslands and sav-annas. This coarse scale pattern is also observed in theERBE low-resolution albedo product. The fine resolutionMODIS albedos, however, capture the most detailed spatialfeatures. In general, global albedo distributions of thesethree data sets are similar in June and September as shownby the histograms in Figure 10, but some systematic biasesexist. Figure 11 shows that the latitude distribution ofsurface albedos are also similar. The maximum albedo, forexample, occurs around 20�N, where the largest area ofdesert is located.[38] Figure 12 shows that the MODIS black sky albedo
agrees well with the AVHRR albedo. The RMSE is 0.025.The MODIS albedo has a slightly high bias of 0.016. Notethat the albedo under off-nadir direct illumination at localsolar noon is usually higher than when the sun is overhead.Significantly higher MODIS albedos are found in relativelybright areas such as Central Asia and Northern Africa, asshown in Figure 9. Over these areas, the aerosol opticaldepth is higher than the prescribed 0.05 at 550nm [Torres etal., 2002]. Aerosols are found to reduce the albedo ofrelative bright targets [Rahman, 1996], and therefore thepossible residual aerosol effect may also contribute to thelower surface albedo derived from the AVHRR observations[Csiszar and Gutman, 1999] over these bright areas.[39] The MODIS albedo is also generally higher than that
of AVHRR in South America, especially on the eastern side
of the continent. Over this region, various studies haveshown that 100 million hectares of land have been degradedas a result of deforestation and some 70 million hectares ofland have been overgrazed during late 80’s and early 90’s[United Nations Environment Programme, 2000]. Thiscontinuing land cover change may cause some of theincrease in surface albedo from historical observations tomore recent MODIS observations. In addition to deforesta-tion, there is very intense biomass burning in the Amazonbasin. Residual contamination from smoke may also con-tribute to the differences in the albedo products.[40] The correlation between the MODIS and ERBE
albedo is 0.90 and the RMSE is 0.047. On the average, theERBE albedo has a higher bias of 0.034 compared to theMODIS albedo. TheERBEdata set is a dailymean albedo andis expected to be higher than those under an overheadillumination and at local solar noon. Moreover, cloud iden-tification ismore difficult for theERBEobservations at coarseresolution, leading to an increase in the retrieved albedo.[41] The differences between the MODIS albedo and
those derived from the historical AVHRR and ERBEobservations are in the range of the uncertainties attributedto the diversity of the instruments, the retrieval algorithms,the angular geometry, and environmental change, such asdeforestation. The operational MODIS albedo is thus con-sidered to be comparable with the historical AVHRR andERBE albedo data sets.
6. Discussion and Conclusions
[42] Surface reflectivity varies with time and space.Retrieving surface albedo from space relies on prerequisite
Figure 10. Histograms of global surface albedos at 2.5� resolution.
Figure 11. Zonal means of surface albedo in June and September.
JIN ET AL.: VALIDATION OF MODIS ALBEDO RETRIEVAL ALGORITHM ACL 3 - 13
atmospheric information in addition to narrowband-to-broadband conversion and directional-to-hemispherical con-version. No single test can ever sufficiently demonstrate theuncertainty of the operational surface albedo productderived from satellite observations. A hierarchical frame-work is therefore necessary with many validation tiers beingperformed at different stages [Justice et al., 2000]. Theexisting radiation networks such as SURFRAD have longterm ground measurements and cover relatively diverse landcover types [Augustine et al., 2000]. A comparison withthese ground measurements provides a preliminary valida-tion of surface albedo product and helps to identify possiblesituations where the satellite product has larger uncertainty.The quantification of errors from each source, however, isimpossible without a closure field campaign involvingground, aircraft, and satellite measurements at differentspatial scales. Both established network and field campaignis limited by spatial coverage, and hence an intercomparisonwith other global albedo products is also necessary.[43] We examined the accuracy of the MODIS albedo
products using two sets of coincident field measurements.During April–September 2001, the MODIS surface albedogenerally met the absolute accuracy requirement of 0.02 forsix diverse SURFRAD stations and eighteen sites in theCART/SGP area. In both networks, the root mean squareerrors are less than 0.0177 and a relatively minor lower biasof 0.004 was observed for the MODIS albedo products. TheMODIS BRDF model also captures the solar zenith angledependence of the surface albedo as indicated in fieldmeasurements. For the Bondville station and two CART/SGP sites, a spatial analysis of the albedos at a 30-mresolution derived from Landsat ETM+ observations in Julyreveals that the albedo at the field site represents well themean albedo value over the collocated MODIS 1-km by 1-km region and thus the validation with the field measure-ments is appropriate over the study stations in summer. Theincreased heterogeneity in fall partially explains the dis-crepancy between the MODIS albedos and field values infall. Further studies are needed to explain the observeddiscrepancies in winter over these sites.[44] We also investigated the consistency between the
MODIS surface albedos and the contemporary CERESTOA albedos and found that the MODIS surface shortwavealbedos, derived from spectral albedos, are consistent withcontemporary and collocated CERES TOA albedos deriveddirectly from broadband observations. The MODIS albedois also comparable to commonly used surface albedo data
sets derived from the historical AVHRR and ERBE obser-vations [Csiszar and Gutman, 1999; Li and Garand, 1994],with RMSE values of 0.025 and 0.047, respectively.[45] This study is a preliminary validation of the MODIS
albedo product. We intend to continue the validation asmore data from ground measurements and field campaignsare available [Schaaf et al., 2002; Liang et al., 2002]. Notethat the MODIS albedos are produced for seven spectralbands and three broadbands, which offers more precision inthe spectral characteristics of surface albedo. With a 1-kmresolution, the MODIS albedo can capture considerablespatial variability of surface reflectivity and thus helps toimprove the albedo representation in climate models [Tsvet-sinskaya et al., 2002; Jin et al., 2002]. The 16-day temporalresolution of the MODIS albedo product also provides agreat opportunity to monitor and identify human-inducedalbedo change [Intergovernmental Panel on ClimateChange (IPCC ), 2001].
[46] Acknowledgments. Surface radiometric observations came fromthe CERES/ARM Validation Experiment (CAVE) and are available on theworld wide web at http://www-cave.larc.nasa.gov/cave/. We thank all fieldparticipants who made measurements over the SURFRAD and CART/SGPnetwork stations. This work was supported by NASA’s MODIS projectunder contract NAS5-31369. W.L. was supported by the German Ministryof Education and Research in the DEKLIM Programme.
ReferencesAugustine, J. A., J. DeLuisi, and C. Long, SURFRAD: A national surfaceradiation budget network for atmospheric research, Bull. Am. Meteorol.Soc., 81, 2341–2357, 2000.
Barkstrom, B. R., The Earth Radiation Budget Experiment (ERBE), Bull.Am. Meteorol. Soc., 65, 1170–1185, 1984.
Bonan, G. B., A land surface model (LSM version 1.0) for ecological,hydrological, and atmospheric studies: Technical description and user’sguide, NCAR Tech. Note NCAR/TN-147 + STR, Natl. Cent. for Atmos.Res., Boulder, Colo., 1996.
Collins, J. B., and C. Woodcock, Combining geostatistical methods andhierarchical scene models for analysis of multiscale variation in spatialdata, Geogr. Anal., 32, 48–63, 2000.
Csiszar, I., and G. Gutman, Mapping global land surface albedo fromNOAA AVHRR, J. Geophys. Res., 104, 6215–6228, 1999.
DeLuisi, J. J., J. A. Augustine, C. R. Cornwall, G. B. Hodges, C. N. Long,and D. L. Wellman, NOAA’s SURFRAD: Surface radiation measure-ments at six regional stations, paper presented at 10th Conference onAtmospheric Radiation Measurements, Natl. Oceanic and Atmos. Ad-min., Madison, Wisc., 1999.
Dickinson, R. E., Land processes in climate models, Remote Sens. Environ.,51, 27–38, 1995.
Dickinson, R. E., A. Henderson-Sellers, and P. J. Kennedy, Biosphere-Atmosphere Transfer Scheme (BATS) Version 1e as coupled to theNCAR community model, NCAR Tech. Note NCAR/TN-387 + STR, Natl.Cent. for Atmos. Res., Boulder, Colo., 1993.
Figure 12. Scatterplot of the MODIS albedo versus the AVHRR Albedo aggregated to 2.5� resolutionand that of the MODIS albedo versus the ERBE albedo at 2.5� resolution.
ACL 3 - 14 JIN ET AL.: VALIDATION OF MODIS ALBEDO RETRIEVAL ALGORITHM
Gutman, G. G., On the use of long-term global data of land reflectances andvegetation indices derived from the advanced very high resolution radio-meter, J. Geophys. Res., 104, 6241–6255, 1999.
Hansen, J. E., Efficient three dimensional global models for climate studies:Models I and II, Mon. Weather Rev., 11, 609–662, 1983.
Henderson-Sellers, A., and M. F. Wilson, Surface albedo data for climaticmodeling, Rev. Geophys., 21, 1743–1778, 1983.
Intergovernmental Panel on Climate Change (IPCC), Climate Change2001: The Scientific Basis, Cambridge Univ. Press, New York, 2001.
Jin, Y., C. B. Schaaf, F. Gao, X. Li, A. H. Strahler, X. Zeng, and R. E.Dickinson, How does snow impact the albedo of vegetated land surfacesas analyzed with MODIS data?, Geophys. Res. Lett., 29(10), 1374,10.1029/2001GL014132, 2002.
Jin, Y., C. B. Schaaf, F. Gao, X. Li, A. H. Strahler, W. Lucht, and S. Liang,Consistency of MODIS surface bidirectional reflectance distributionfunction and albedo retrievals: 1. Algorithm performance, J. Geophys.Res., 108, doi:10.1029/2002JD002803, in press, 2003.
Justice, C. O., A. Belward, J. Morisette, J. L. Privette, and F. Baret, Devel-opments in the validation of satellite products for the study of land sur-face, Int. J. Remote Sens., 21, 3383–3390, 2000.
Lewis, P., and M. J. Barnsley, Influence of the sky radiance distribution onvarious formulations of the Earth surface albedo, paper presented atInternational Symposium on Physical Measurements and Signatures inRemote Sensing, Int. Sco. for Photogramm. and Remote Sens., Vald’Isere, France, 1994.
Li, Z., and L. Garand, Estimation of surface albedo from space: A para-meterization for global application, J. Geophys. Res., 99, 8335–8350,1994.
Liang, S., Narrowband to broadband conversions of land surface albedo, I,Algorithms, Remote Sens. Environ., 76, 213–238, 2000.
Liang, S., A. H. Strahler, and C. W. Walthall, Retrieval of land surfacealbedo from satellite observations: A simulation study, J. Appl. Meteorol.,38, 712–725, 1999.
Liang, S., H. Fang, M. Chen, C. J. Shuey, C. Walthall, C. Daughtry,J. Morisette, C. Schaaf, and A. Strahler, Validating MODIS land surfacereflectance and albedo products: Methods and preliminary results, Re-mote Sens. Environ., 83, 149–162, 2002.
Long, C. N., and T. P. Ackerman, Identification of clear skies from broad-band pyranometer measurements and calculation of downwelling short-wave cloud effects, J. Geophy. Res., 105, 15,609–15,626, 2000.
Lucht, W., Expected retrieval accuracies of bidirectional reflectance andalbedo from EOS-MODIS and MISR angular sampling, J. Geophys.Res., 103, 8763–8778, 1998.
Lucht, W., C. B. Schaaf, and A. H. Strahler, An algorithm for the retrievalof albedo from space using semiempirical BRDF models, IEEE Trans.Geosci. Remote Sens., 38, 977–998, 2000a.
Lucht, W., A. H. Hyman, A. H. Strahler, M. J. Barnsley, P. Hobson, andJ.-P. Muller, A comparison of satellite-derived spectral albedos to ground-based broadband albedo measurements modeled to satellite spatial scalefor a semidesert landscape, Remote Sens. Environ., 74, 85–98, 2000b.
Pinker, R., and I. Laszlo, Modeling surface solar irradiance for satelliteapplications on a global scale, J. Appl. Meteorol., 31, 194–211, 1992.
Pinker, R. T., I. Laszlo, Y. Wang, and J. D. Tarpley, GCIP GOES shortwaveradiation budgets: Validation activity, paper presented at Second Interna-tional Scientific Conference on the Global Energy and Water Cycle,World Clim. Res. Program, Washington, D. C., 1996.
Pinty, B., F. Roveda, M. M. Verstraete, N. Gobron, Y. Govaerts, J. V.Martonchik, D. J. Diner, and R. A. Kahn, Surface albedo retrieval fromMeteosat, 1, Theory, J. Geophy. Res., 105, 18,099–18,112, 2000a.
Pinty, B., F. Roveda, M. M. Verstraete, N. Gobron, Y. Govaerts, J. V.Martonchik, D. J. Diner, and R. A. Kahn, Surface albedo retrieval fromMeteosat, 2, Applications, J. Geophy. Res., 105, 18,113–18,134, 2000b.
Rahman, H., Atmospheric optical depth and water vapor effects on theangular characteristics of surface reflectance in NOAA AVHRR, Int. J.Remote Sens., 17, 2981–2999, 1996.
Rodgers, C. D., Inverse Methods for Atmospheric Sounding: Theory andPractice, World Sci., River Edge, N. J., 2000.
Rutan, D. A., F. G. Rose, N. Smith, and T. P. Charlock, Validation data setfor CERES Surface and Atmospheric Radiation Budget (SARB), GE-WEX News, 11(1), 11–12, 2001.
Schaaf, C. B., et al., First operational BRDF, albedo and nadir reflectanceproducts from MODIS, Remote Sens. Environ., 83, 135–148, 2002.
Sellers, P. J., Remote sensing of the land surface for studies of globalchange, NASA/GSFC International Satellite Land Surface ClimatologyProject report, NASA Goddard Flight Space Cent., Greenbelt, Md., 1993.
Sellers, P. J., D. A. Randall, G. J. Collatz, J. A. Berry, C. B. Field, D. A.Dazlich, C. Zhang, G. D. Collelo, and L. Bounoua, A revised land sur-face parameterization (SiB2) for atmospheric GCMs, part I, Model for-mulation, J. Clim., 9, 676–705, 1996.
Stokes, G. M., and S. E. Schwartz, The Atmospheric Radiation Measure-ment (ARM) program: Programmatic background and design of the cloudand radiation test bed, Bull. Am. Meteorol. Soc., 75, 1201–1221, 1994.
Strahler, A. H., W. Wanner, C. B. Schaaf, X. Li, B. Hu, J.-P. Muller,P. Lewis, and M. J. Barnsley, MODIS BRDF/Albedo product: Algorithmtheoretical basis document, NASA EOS-MODIS Doc., Version 4.0, pp. 9–17, Natl. Aeronau. and Space Admin., Washington, D. C., 1996.
Strugnell, N. C., and W. Lucht, An algorithm to infer continental-scalealbedo from AVHRR data, land cover class, and field observations oftypical BRDFs, J. Clim., 14, 1360–1376, 2001.
Tian, Y., et al., Multiscale analysis and validation of the MODIS LAIproduct over Maun, Botswana, I, Uncertainty assessment, Remote Sens.Environ., 83, 414–430, 2002.
Torres, O., P. K. Bhartia, J. R. Herman, A. Sinyuk, and B. Holben, A longterm record of aerosol optical thickness from TOMS observations andcomparison to AERONET measurements, J. Atmos. Sci., 59, 398–413,2002.
Trenberth, K. E., Climate System Modeling, Cambridge Univ. Press, NewYork, 1992.
Tsvetsinskaya, E. A., C. B. Schaaf, F. Gao, A. H. Strahler, R. E. D. X. Zeng,and W. Lucht, Relating MODIS-derived surface albedo to soils and rocktypes over northern Africa and the Arabian Peninsula, Geophys. Res.Lett., 29(9), 1353, doi:10.1029/2001GL014096, 2002.
United Nations Environment Programme, Global Environment Outlook,Oxford Univ. Press, New York, 2000.
Vermote, E. F., N. Z. Saleous, C. O. Justice, Y. J. Kaufman, J. Privette,L. Remer, J. C. Roger, and D. Tarne, Atmospheric correction of visible tomiddle infrared EOS-MODIS data over land surface, background, opera-tional algorithm and validation, J. Geophys. Res., 102, 17,131–17,141,1997a.
Vermote, E. F., D. Tanre, J. L. Deuze, M. Herman, and J. J. Morcette,Second simulation of the satellite signal in the solar spectrum: An over-view, IEEE Trans. Geosci. Remote Sens., 35, 675–686, 1997b.
Wanner, W., A. H. Strahler, B. Hu, P. Lewis, J.-P. Muller, X. Li, C. B.Schaaf, and M. J. Barnsley, Global retrieval of bidirectional reflectanceand albedo over land from EOS MODIS and MISR data: Theory andalgorithm, J. Geophys. Res., 102, 17,143–17,162, 1997.
Weiss, M., F. Baret, M. Leroy, A. Begue, O. Hautecoeur, and R. Santer,Hemispherical reflectance and albedo estimates from the accumulation ofacross-track Sun-synchronous satellite data, J. Geophys. Res., 104,22,221–22,232, 1999.
Wielicki, B. A., B. R. Barkstrom, E. F. Harrison, G. L. S. R. B. Lee, andJ. E. Cooper, Clouds and the Earth’s Radiant Energy System (CERES):An Earth Observing System experiment, Bull. Am. Meteorol. Soc., 77,853–868, 1996.
Wielicki, B. A., et al., Clouds and the Earth’s Radiant Energy System(CERES): Algorithm overview, IEEE Trans. Geosci. Remote Sens., 36,1127–1140, 1998.
Woodcock, C., and V. Harward, Nested-hierarchical scene models and im-age segmentation, Int. J. Remote Sens., 13, 3167–3187, 1992.
�����������������������F. Gao, Y. Jin, X. Li, C. B. Schaaf, A. H. Strahler, and C. E. Woodcock,
Department of Geography and Center for Remote Sensing, BostonUniversity, Boston, MA 02215, USA. ([email protected]; [email protected];[email protected]; [email protected]; [email protected]; [email protected])S. Liang, Department of Geography, 2181 LeFrak Hall, College Park,
MD 20742, USA. ([email protected])W. Lucht, Potsdam-Institut fur Klimafolgenforschung (PIK), Telegrafen-
berg C4, Postfach 60 12 03, D14412 Potsdam, Germany. ([email protected])
JIN ET AL.: VALIDATION OF MODIS ALBEDO RETRIEVAL ALGORITHM ACL 3 - 15