Automatic registration of laser reflectance and colour intensity images for 3D reconstruction
12
Robotics and Autonomous Systems 39 (2002) 157–168 Automatic registration of laser reflectance and colour intensity images for 3D reconstruction P. Dias a , V. Sequeira a,∗ , J.G.M. Gonçalves a , F. Vaz b a European Commission, Joint Research Centre, Institute for the Protection and Security of the Citizen (IPSC), TP 270, 21020 Ispra (VA), Italy b University of Aveiro/IEETA, 3800 Aveiro, Portugal Abstract The objective of the work presented in this paper is to generate complete, high-resolution models of real world scenes from passive intensity images and active range sensors. In previous work, an automatic method has been developed in order to compute 3D models of real world scenes from laser range data. The aim of this project is to improve these existing models by fusing range and intensity data. The paper presents different techniques in order to find correspondences between the different sets of data. Based on these control points, a robust camera calibration is computed with a minimal user intervention in order to avoid the fastidious point and click phase that is still necessary in many systems. The intensity images are then re-projected into the laser coordinate frame to produce an image that combines the laser reflectance and the available video intensity images into a colour texture map. © 2002 Elsevier Science B.V. All rights reserved. Keywords: 3D reconstruction; Automatic registration; Camera calibration; Texture map 1. Introduction With the increase in computer capabilities, 3D models are becoming more interesting as they can be displayed and used in a home PC without requir- ing dedicated hardware. Commercial products are already available to compute 3D models, e.g. small object for Internet application. On the other hand, real world scenes are often too complex for realistic model acquisition. This work tries to combine the information coming from the most typical 3D sensors (laser range finders and video) in order to overcome these limitations. Almost every laser returns for each measurement the distance to the point and the reflected light intensity. ∗ Corresponding author. Tel.: +39-0332-785233; fax: +39-0332-789185. E-mail addresses: [email protected] (P. Dias), [email protected] (V. Sequeira). This leads to two different sets of data. From the distance measurement, the 3D models are computed, whereas an image can be generated from the re- flectance information [13]. The choice of using the reflectance image rather than the 3D model for the registration was based on several considerations: first, the reflectance image is a 2D (normally, infrared) image such as the video inten- sity image, which allows the use of already existing techniques for matching intensity images [9]. In addi- tion, the re-projection of the intensity image into the reflectance image is a very intuitive and fast way of evaluating the registration. Unfortunately, the images obtained with the laser and the video camera are very different. The camera is a high-resolution passive sensor whereas the laser is an active sensor of lower resolution. To overcome these differences a feature and area based matching algorithm was developed. 0921-8890/02/$ – see front matter © 2002 Elsevier Science B.V. All rights reserved. PII:S0921-8890(02)00201-4
-
Upload
independent -
Category
Documents
-
view
1 -
download
0
Transcript of Automatic registration of laser reflectance and colour intensity images for 3D reconstruction

Robotics and Autonomous Systems 39 (2002) 157–168
Automatic registration of laser reflectance and colour intensityimages for 3D reconstruction
P. Diasa, V. Sequeiraa,∗, J.G.M. Gonçalvesa, F. Vazb
a European Commission, Joint Research Centre, Institute for the Protection and Security of the Citizen (IPSC),TP 270, 21020 Ispra (VA), Italy
b University of Aveiro/IEETA, 3800 Aveiro, Portugal
Abstract
The objective of the work presented in this paper is to generate complete, high-resolution models of real world scenes frompassive intensity images and active range sensors. In previous work, an automatic method has been developed in order tocompute 3D models of real world scenes from laser range data. The aim of this project is to improve these existing modelsby fusing range and intensity data. The paper presents different techniques in order to find correspondences between thedifferent sets of data. Based on these control points, a robust camera calibration is computed with a minimal user interventionin order to avoid the fastidious point and click phase that is still necessary in many systems. The intensity images are thenre-projected into the laser coordinate frame to produce an image that combines the laser reflectance and the available videointensity images into a colour texture map. © 2002 Elsevier Science B.V. All rights reserved.
Keywords: 3D reconstruction; Automatic registration; Camera calibration; Texture map
1. Introduction
With the increase in computer capabilities, 3Dmodels are becoming more interesting as they canbe displayed and used in a home PC without requir-ing dedicated hardware. Commercial products arealready available to compute 3D models, e.g. smallobject for Internet application. On the other hand,real world scenes are often too complex for realisticmodel acquisition.
This work tries to combine the information comingfrom the most typical 3D sensors (laser range findersand video) in order to overcome these limitations.Almost every laser returns for each measurement thedistance to the point and the reflected light intensity.
∗ Corresponding author. Tel.:+39-0332-785233;fax: +39-0332-789185.E-mail addresses: [email protected] (P. Dias), [email protected](V. Sequeira).
This leads to two different sets of data. From thedistance measurement, the 3D models are computed,whereas an image can be generated from the re-flectance information [13].
The choice of using the reflectance image ratherthan the 3D model for the registration was based onseveral considerations: first, the reflectance image is a2D (normally, infrared) image such as the video inten-sity image, which allows the use of already existingtechniques for matching intensity images [9]. In addi-tion, the re-projection of the intensity image into thereflectance image is a very intuitive and fast way ofevaluating the registration.
Unfortunately, the images obtained with the laserand the video camera are very different. The camerais a high-resolution passive sensor whereas the laseris an active sensor of lower resolution. To overcomethese differences a feature and area based matchingalgorithm was developed.
0921-8890/02/$ – see front matter © 2002 Elsevier Science B.V. All rights reserved.PII: S0921-8890(02)00201-4

158 P. Dias et al. / Robotics and Autonomous Systems 39 (2002) 157–168
Compared to other registration techniques [5,10],this one is independent of the experimental set-up(e.g. internal camera parameters), does not need anyprevious calibration and minimises user interven-tion.
2. Matching laser reflectance with intensityimages
The matching algorithm is divided into two mainsteps: rescaling and matching. Rescaling resizes thevideo image to match the dimensions of the reflectance
Fig. 1. The original intensity (1024× 1536) and reflectance (1850× 444) images with the initial user selection.
image. Matching is used to locate correspondingfeatures.
2.1. Rescaling algorithm
Traditional matching techniques used in photogram-metry or stereo vision [6] use images obtained fromthe same sensors, i.e. same size and same resolution.In our specific case, an intermediate step is requiredto rescale the two images before using any matchingprocedure.
In our system, the user has to select a rectangulararea of interest in the reflectance image corresponding

P. Dias et al. / Robotics and Autonomous Systems 39 (2002) 157–168 159
Fig. 2. Flowchart of the rescaling procedure.
to the video image to be registered (see Fig. 1). Therescaling procedure starts with this initial approxima-tion and evaluates the planar transformation betweenthe images using five parameters: the planar transla-tion coordinates, the scaling factors for bothx- andy-axis, and the planar rotation between both images.The result, after a few iterations, is a coarse approxi-mation of the transformation between the two imageswith enough overlapping between the main featuresallowing the use of matching algorithms.
The flowchart in Fig. 2 presents the algorithm. In thefirst step, a Canny edge detector [3] and the distancetransform [1,2] are applied to the video image. Thereflectance edges are then iteratively translated, scaledand rotated over the distance transform image untilthe transformation that leads to a minimum distancebetween the edges is found.
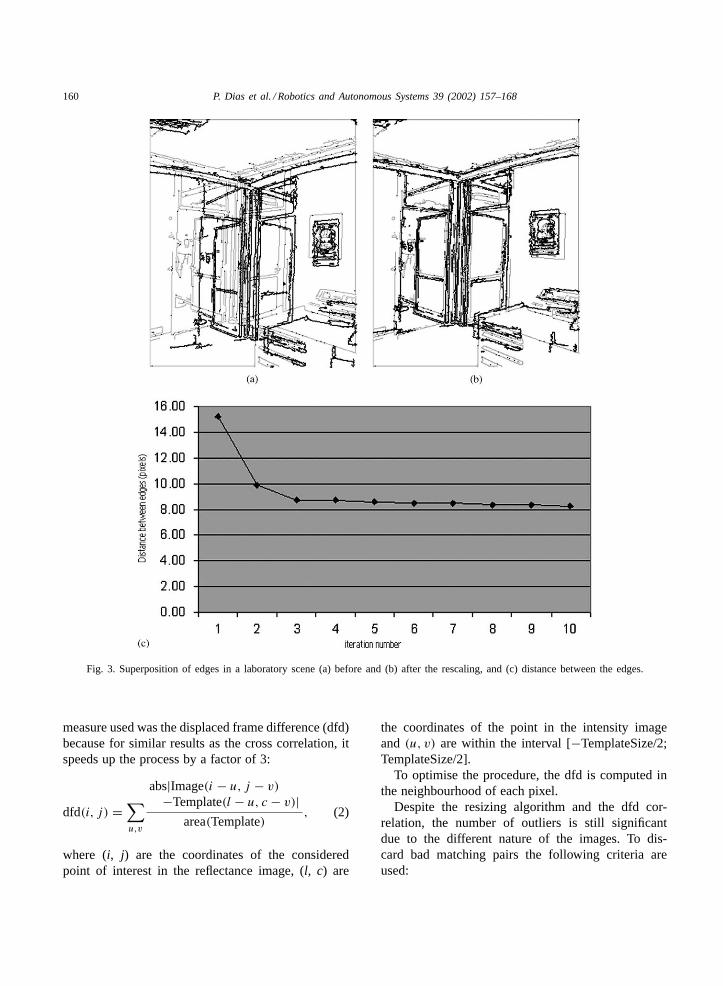
The results of the rescaling procedure are presentedin Fig. 3 (in black the edges detected in the reflectanceimage and in light grey the ones extracted from theintensity image). Fig. 3(a) shows the superposition ofthe edges of the video and the reflectance image be-fore running the process. Fig. 3(b) presents the resultsafter applying the algorithm with the reflectance edgesrescaled. Fig. 3(c) shows the evolution of the averagedistance between the edges of both images along the
rescaling procedure. Despite the average error of eightpixels, the result of the rescaling is sufficient for thesubsequent matching step.
2.2. Point based matching
The next step of the matching procedure is tofind some control points over the images. A Harriscorner detector [8] is used to find points of inter-est in the reflectance image based on the followingformula:
R(x, y) = A(x, y) × B(x, y) − C2(x, y)
−Weight× (A(x, y) + B(x, y))2, (1)
where A and B are the smoothed direction deriva-tives andC is the smoothing of the products of thedirection derivatives. The derivatives are calculatedwith a Sobel operator and smoothed with a Gaus-sian filter. Weight is a user-defined constant. Here,Weight = 0.04, so grey value corners return positivevalues forR(x, y), while straight edges receive negativevalues.
For each point of interest, correlation is computedover the gradient images (to make the matching moreinvariant to changes in illumination). The correlation
160 P. Dias et al. / Robotics and Autonomous Systems 39 (2002) 157–168
Fig. 3. Superposition of edges in a laboratory scene (a) before and (b) after the rescaling, and (c) distance between the edges.
measure used was the displaced frame difference (dfd)because for similar results as the cross correlation, itspeeds up the process by a factor of 3:
dfd(i, j) =∑u,v
abs|Image(i − u, j − v)
−Template(l − u, c − v)|area(Template)
, (2)
where (i, j) are the coordinates of the consideredpoint of interest in the reflectance image, (l, c) are
the coordinates of the point in the intensity imageand (u, v) are within the interval [−TemplateSize/2;TemplateSize/2].
To optimise the procedure, the dfd is computed inthe neighbourhood of each pixel.
Despite the resizing algorithm and the dfd cor-relation, the number of outliers is still significantdue to the different nature of the images. To dis-card bad matching pairs the following criteria areused:

P. Dias et al. / Robotics and Autonomous Systems 39 (2002) 157–168 161
Fig. 4. Point based matching in the laboratory image.
(i) If various matches are accumulated on a smallarea, only the one with the higher correlation isconsidered: a matching pairi is considered validonly if
Correlation(xi, yi) = max(correlation(xj , yj ))
for eachj :√(xi − xj )2 + (yi − yj )2 � Threshold, (3)
where (xi , yi) are the coordinates of the video pixelof the matching ‘i’.
(ii) The average distance between the matchings arecomputed over the images and only the pairs forwhich the distance is lower than a given thresholdare considered:√
(xv − xr)2 + (yv − yr)2 <Dist
2, with
Dist =∑n
i=1
√(xvi
− xri )2 + (yvi
− yri )2
n, (4)
where (xv, yv) is the coordinate of a pixel in thevideo image; (xr, yr) is the coordinate of the cor-responding pixel in reflectance image andn is thenumber of matching.
Fig. 5. Reflectance (black) and re-projected video (light grey)edges.

162 P. Dias et al. / Robotics and Autonomous Systems 39 (2002) 157–168
The results of this matching procedure are pre-sented in Fig. 4 for the laboratory images. In thiscase, 50 matching pairs are detected and consideredvalid.
3. Camera calibration
3.1. Camera model
A Tsai camera calibration technique [14] is used tocalibrate the camera. This pinhole perspective projec-tion model is based on 11 parameters. Six extrinsic
Fig. 6. The occlusion problem, (a) direct re-projection, (b) re-projection usingZ-buffer to reject occluded points.
parameters characterise the position and orientation ofthe camera; the other five describe the camera proper-ties (such as focal length and radial distortion).
Depending on the 3D position of the control points,either the coplanar or non-coplanar calibration is used.The user has also the possibility to provide the internalparameters of the camera (if known) and calibrate onlythe extrinsic parameters.
3.2. Robust estimation
Due to the difficulty of matching the reflectanceand the video image, a relatively large number of
P. Dias et al. / Robotics and Autonomous Systems 39 (2002) 157–168 163
mismatches will appear during the matching step. Nev-ertheless, a good calibration for the camera is com-puted based on a RANSAC estimation technique [7].A calibration is computed starting with a subset ofrandom points. For each of the candidate calibrations,the one with the largest support is selected, excludingmost of the outliers. The algorithm needs three pa-rameters: the number of trials (5); the subset of pointsused in each trial for the first evaluation (a third of thematching pairs); the threshold to consider a point asan outlier (15 pixels).
4. Re-projection
Once a model for the camera is obtained, it is possi-ble to associate to each 3D point its projection into thevideo image; this is done in the re-projection step. Theaim is to obtain a texture map ready to apply to thereconstructed surfaces making the whole 3D modelricher and more realistic.
In most cases, different camera views overlap inparts of the models. To avoid rough transitions in theseborder areas, colour blending is applied.
4.1. Re-projection and Z-buffering
Fig. 5 presents the edges detected on the originalreflectance image (in black) and the edges detectedon the re-projected image (light grey). The results arevisibly better than using only the resizing algorithm(see Fig. 3). The median distance between the edgeshas decreased to 6.15 pixels (the error after the resizingalgorithm was 8.3, see Fig. 3(c)).
Projecting the video image pixels into the re-flectance image can lead to errors of projection due tooccluded points as shown in Fig. 6, where the arrowspoint to the errors due to occlusions. To avoid thisproblem, aZ-buffer is filled with the Z-coordinateof the closest 3D points for each pixel of the videoimage. Using thisZ-buffer to handle occlusions, itis possible to select the correct video points whenre-projecting the data.
Back-projecting the known 3D positions will limitthe final texture map resolution to the range imagesize. To overcome this limitation, the reflectance canbe “zoomed” to the size of the video image, and alinear interpolation can be used to compute the “extra”
3D positions. Using this interpolation process, it ispossible to exploit the full resolution of the intensityimage for the texture map.
4.2. Colour blending
In most cases, the field of view of the laser image ismuch larger than the one from a normal camera. Nowa-days it is possible to find lasers capable of acquiring270◦ or even 360◦ images; thus, several video imagesare necessary to cover the whole reflectance image.To solve this problem, each image is back-projectedinto the laser coordinate frame followed by a colourblending technique to smooth the transitions betweenimages.
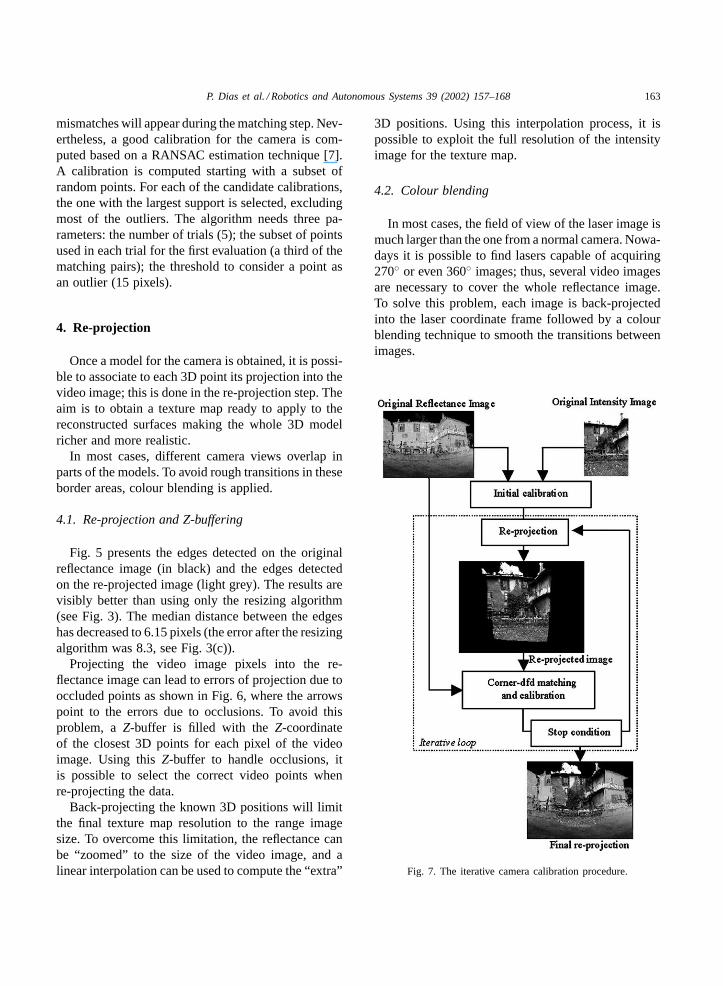
Fig. 7. The iterative camera calibration procedure.

164 P. Dias et al. / Robotics and Autonomous Systems 39 (2002) 157–168
The colour blending process computes for eachpoint the number of video images that have a pixelprojected in this position and the distance to the clos-est contour of each image. The final value of thepixel will be a weighted combination of the intensityvalues in each image according to the distance to theclosest contour. The formula used to compute thefinal intensity value in each RGB image is
Intensity(x, y) =∑n
i=1Intensityi (x, y) × disti (x, y)
Distancetotal
with Distancetotal =n∑
i=1
disti (x, y), (5)
Fig. 8. Some examples of the re-projection process (a, b) and two snap-shots of the final textured model of the laboratory (c).
where Intensityi(x, y) is the intensity of pixel (x, y)in imagei, disti(x, y) is the distance of pixel (x, y) tothe closest border in imagei, andn is the number ofimages with a pixel projected in (x, y).
5. Current work: iterative calibration
Due to the different nature of the images, a singlerun of the algorithm can lead to a camera calibrationthat is not fully satisfactory. To improve the reliabil-ity of the calibration process, an iterative procedurehas been introduced (see Fig. 7). The point based

P. Dias et al. / Robotics and Autonomous Systems 39 (2002) 157–168 165
matching (see Section 2.2) ensures the computa-tion of a first approximation for the camera model.Based on this first calibration, the video image isre-projected into the reflectance coordinate frame.The red channel of the re-projected image (selectedfor its higher similarity with the infrared reflectanceimage) is then used as entry into a new matchingalgorithm. At this point, reflectance and re-projectedimages are already very similar (since the distor-tion introduced by the camera is already consideredby the re-projection) and a new matching proce-dure is used. The matching algorithm detects cornersin both the re-projected and the reflectance image,and dfd is computed between neighbouring corners.The neighbouring corner with the higher correla-tion is then selected as the new matching point and
Fig. 9. The texture map (a) and two snap-shots (b, c) of the textured 3D model of a farmhouse.
based on these correspondences, a new calibration iscomputed.
6. Experimental results
Figs. 8 and 9 present the results of the re-projectionand blending processes for two real scenes. The firstone is a laboratory at the JRC site. The second oneis a farmhouse in Laveno (Italy) on the shores ofLago Maggiore. Both the scenes were acquired witha RIEGL LMS-Z210 laser range scanner [11] and aCanon PowerShot Pro70 digital camera.
Fig. 8(a) shows the re-projection of the test image,used in previous sections to illustrate the automaticmatching, into the reflectance image. Fig. 8(b) is the
166 P. Dias et al. / Robotics and Autonomous Systems 39 (2002) 157–168
final texture map obtained from the re-projection andblending of 12 images (for illustration, the borders ofeach re-projected image are also displayed). Fig. 8(c)presents two snap-shots of the model after applyingthe texture map. The only user intervention was theselection of a rectangle in the reflectance image cor-responding approximately to the same field of view ofthe different video images. The rest of the procedurewas fully automatic.
Fig. 9 presents similar results for the model of afarmhouse. Fig. 9(a) shows one of the texture mapsof the final model obtained after the re-projectionof three video images into the reflectance image.In Figs. 9(b) and 9(c) two snap-shots of the finaltextured 3D model are shown. In this case some con-trol points have been manually added to guide theprocess. To convey spatial awareness when movingthrough the surrounding, the 3D model is combinedwith a panoramic triangulated sphere providing abackground image to the model [12].
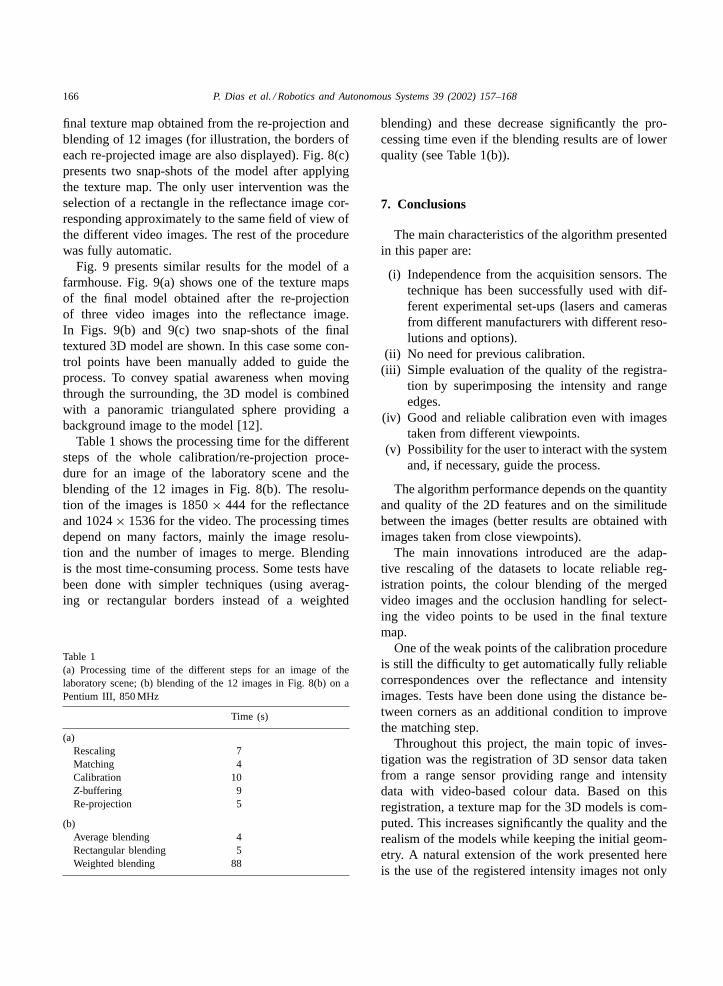
Table 1 shows the processing time for the differentsteps of the whole calibration/re-projection proce-dure for an image of the laboratory scene and theblending of the 12 images in Fig. 8(b). The resolu-tion of the images is 1850× 444 for the reflectanceand 1024× 1536 for the video. The processing timesdepend on many factors, mainly the image resolu-tion and the number of images to merge. Blendingis the most time-consuming process. Some tests havebeen done with simpler techniques (using averag-ing or rectangular borders instead of a weighted
Table 1(a) Processing time of the different steps for an image of thelaboratory scene; (b) blending of the 12 images in Fig. 8(b) on aPentium III, 850 MHz
Time (s)
(a)Rescaling 7Matching 4Calibration 10Z-buffering 9Re-projection 5
(b)Average blending 4Rectangular blending 5Weighted blending 88
blending) and these decrease significantly the pro-cessing time even if the blending results are of lowerquality (see Table 1(b)).
7. Conclusions
The main characteristics of the algorithm presentedin this paper are:
(i) Independence from the acquisition sensors. Thetechnique has been successfully used with dif-ferent experimental set-ups (lasers and camerasfrom different manufacturers with different reso-lutions and options).
(ii) No need for previous calibration.(iii) Simple evaluation of the quality of the registra-
tion by superimposing the intensity and rangeedges.
(iv) Good and reliable calibration even with imagestaken from different viewpoints.
(v) Possibility for the user to interact with the systemand, if necessary, guide the process.
The algorithm performance depends on the quantityand quality of the 2D features and on the similitudebetween the images (better results are obtained withimages taken from close viewpoints).
The main innovations introduced are the adap-tive rescaling of the datasets to locate reliable reg-istration points, the colour blending of the mergedvideo images and the occlusion handling for select-ing the video points to be used in the final texturemap.
One of the weak points of the calibration procedureis still the difficulty to get automatically fully reliablecorrespondences over the reflectance and intensityimages. Tests have been done using the distance be-tween corners as an additional condition to improvethe matching step.
Throughout this project, the main topic of inves-tigation was the registration of 3D sensor data takenfrom a range sensor providing range and intensitydata with video-based colour data. Based on thisregistration, a texture map for the 3D models is com-puted. This increases significantly the quality and therealism of the models while keeping the initial geom-etry. A natural extension of the work presented hereis the use of the registered intensity images not only
P. Dias et al. / Robotics and Autonomous Systems 39 (2002) 157–168 167
for texturing but also to correct and improve the 3Dgeometry of the models. In effect, detecting edges inintensity images is a fast and easy process and can beused as a guide to correct geometrical entities such aslines in 3D models [4].
Acknowledgements
This research was primarily funded by theEC CAMERA TMR (Training and Mobility ofResearchers) network, contract number ERBFM-RXCT970127 and by the Portuguese Foundation forScience and Technology through the Ph.D. grantPRAXIS XXI/BD/19555/99.
References
[1] G. Borgefors, A new distance transformation approximatingthe Euclidean distance, in: Proceedings of the EighthInternational Conference on Pattern Recognition, Paris, 1986,pp. 336–338.
[2] G. Borgefors, An improved version of the Chamfer matchingalgorithm, in: Proceedings of the Seventh InternationalConference on Pattern Recognition, New York, 1984,pp. 1175–1177.
[3] J.F. Canny, A computational approach to edge detection, IEEETransactions on Pattern Analysis and Machine IntelligencePAMI-8 (6) (1986) 679–698.
[4] P. Dias, V. Sequeira, J.G.M. Gonçalves, F. Vaz, Fusion ofintensity and range data for improved 3D segmentation, in:Proceedings of the IEEE ICIP’2001, Thessaloniki, Greece,Vol. III, 2001, pp. 1107–1110.
[5] M.D. Elstrom, A stereo-based technique for the registrationof color and ladar images, Master Degree Thesis, Universityof Tennessee, Knoxville, TN, August 1998.
[6] O. Faugeras, Three-dimensional Computer Vision, MIT Press,Cambridge, MA, 1993.
[7] M.A. Fischler, R.C. Bolles, Random sample consensus: Aparadigm for model fitting with applications to image analysisand automated cartography, Communications of the ACM24 (6) (1981) 381–395.
[8] C.G. Harris, M. Stephens, A combined corner and edgedetector, in: Proceedings of the Fourth Alvey VisionConference, 1988, pp. 147–151.
[9] C. Heipke, Overview of image matching techniques, in:Proceedings of the OEEPE Workshop on the Application ofDigital Photogrammetric Workstations, 1996.
[10] M. Partington, C. Jaynes, A hybrid image and modelbased approach to photorealistic building reconstruction, in:Proceedings of the Virtual and Augmented Architecture,VAA’01, Trinity College, Dublin, June 21–22, 2001,pp. 243–254.
[11] Technical Document and User’s Instruction Manual, RIEGLGmbH, Laser Mirror Scanner LMS-Z210, November1999.
[12] V. Sequeira, E. Wolfart, E. Bovisio, E. Biotti, J.G.M.Gonçalves, Hybrid 3D reconstruction and image basedrendering techniques for reality modelling, in: SPIE—Videometrics and Optical Methods for 3D ShapeMeasurement VII, San Jose, CA, USA, January2001.
[13] V. Sequeira, K. Ng, E. Wolfart, J.G.M. Gonçalves, D.Hogg, Automated reconstruction of 3D models from realenvironments, ISPRS Journal of Photogrammetry and RemoteSensing 54 (1999) 1–22.
[14] R.Y. Tsai, A versatile camera calibration technique forhigh-accuracy 3D machine vision metrology using off-the-shelf TV cameras and lenses, IEEE Journal of Robotics andAutomation RA-3 (4) (1987) 323–344.
Paulo Dias is a Ph.D. student at theSurveillance and Information RetrievalSector, within IPSC (Institute for the Pro-tection and Security of the Citizen) ofthe Joint Research Centre of the EuropeanCommission, Ispra, Italy. He received hisdiploma in Electronics and Telecommuni-cations Engineering from the Universityof Aveiro, Portugal, in 1998. His diplomathesis involved the development of tools
for the control and navigation of a mobile platform and his pri-mary research interests are now in 3D reconstruction, computervision and robotics.
Vitor Sequeira has a degree in Electron-ics and Telecommunications Engineeringfrom the University of Aveiro, Portugal(1990), and the Ph.D. from Departmentof Electrical and Computer Engineering ofthe Technical University of Lisbon, Portu-gal (1996). He is currently a Scientific Of-ficer of the European Commission’s JointResearch Centre (JRC), within IPSC—Surveillance and Information Retrieval
Sector. His current interests are 3D reconstruction of real scenes“as-built” including the design information verification and surveil-lance of safeguards relevant plants, Internet-based control of re-mote devices including performance assessment and data security,augmented reality and tele/virtual presence applications. He haspublished over 30 papers in the above mentioned fields, receivedthe “Young Authors” award from the International Society for Pho-togrammetry and Remote Sensing (ISPRS) in Hakodate, Japan,1998, and the U.V. Helava Award for the best paper published inthe ISPRS Journal during 1999.

168 P. Dias et al. / Robotics and Autonomous Systems 39 (2002) 157–168
João G.M. Gonçalves is the Head ofthe Surveillance and Information RetrievalSector within IPSC (Institute for the Pro-tection and Security of the Citizen) ofthe Joint Research Centre of the EuropeanCommission. After his first degree in Elec-tronics and Telecommunications Engineer-ing, he got an M.Sc. in Digital Systemsfrom Brunel University and a Ph.D. onMedical Image Processing from the Uni-
versity of Manchester. Former to his appointment at the JRC,he was Associate Professor at the University of Aveiro, Portu-gal. Professor Gonçalves has been working in the field of remoteverification in nuclear safeguards and non-proliferation, involvingwork on mobile robotics, 3D reconstruction of real environments“as-built”, augmented reality and tele-presence. He has partici-pated in many EU research projects and networks and contributedto over 40 scientific publications.
Francisco Vaz was born in Oporto, Por-tugal, in 1945. He received the Electri-cal Engineering degree from University ofOporto in 1968 and the Ph.D. degree inElectrical Engineering from the Universityof Aveiro, Portugal, in 1987. His Ph.D.dissertation was on automatic EEG pro-cessing. From 1969 to 1973 he worked forthe Portuguese Nuclear Committee. Afterworking in the industry for several years
he joined the staff of the Department of Electronics Engineeringand Telecommunications of University of Aveiro in 1978 wherehe is currently Full Professor and leading the signal-processinggroup. Since then his research interests have always been centredon the digital processing of biological signals. Dr. Vaz is a memberof the board of the Portuguese Society of Biomedical Engineering.