Elemental composition and reflectance of ambient fine particles at 21 European locations
12
Atmospheric Environment 39 (2005) 5947–5958 Elemental composition and reflectance of ambient fine particles at 21 European locations Thomas Go¨tschi a, , Marianne E. Hazenkamp-von Arx b , Joachim Heinrich c , Roberto Bono d , Peter Burney e , Bertil Forsberg f , Deborah Jarvis e , Jose Maldonado g , Dan Norba¨ck h , Willem B. Stern i , Jordi Sunyer j , Kjell Tore´n k , Giuseppe Verlato l , Simona Villani m , Nino Ku¨nzli a,b a University of Southern California, Los Angeles, USA b Institute of Social and Preventive Medicine, University of Basel, Switzerland c GSF National Research Center for Environment and Health, Institute of Epidemiology, Neuherberg, Germany d Department of Public Health and Microbiology, University of Turin, Italy e Department of Public Health Sciences, Kings College London, UK f Department of Public Health and Clinical Medicine, Umea University, Sweden g Hospital Juan Ramon Jimenez, Huelva, Spain h Department of Occupational and Environmental Medicine, University Hospital Uppsala, Sweden i Geochemical Laboratory, Institute for Mineralogy and Petrography, University of Basel, Switzerland j Institut Municipal d Investigacio Medica (IMIM), Barcelona, Spain k Department of Occupational Medicine, Go¨teborg University, Sweden l Department of Medicine and Public Health, University of Verona, Italy m Department of Health Science, University of Pavia, Italy Received 2 November 2004; accepted 19 June 2005 Abstract We sampled fine particles (PM 2.5 ) over a 1-year period at 21 central urban monitoring sites in 20 cities of the European Community Respiratory Health Survey (ECRHS). Particle filters were then analysed for elemental composition using energy dispersive X-ray fluorescence spectrometry and reflectance (light absorption). Elemental analyses yielded valid results for 15 elements (Al, As, Br, Ca, Cl, Cu, Fe, K, Mn, Pb, S, Si, Ti, V, Zn). Annual and seasonal means of PM 2.5 , reflectance, and elements show a wide range across Europe with the lowest levels found in Iceland and up to 80 times higher concentrations in Northern Italy. This pattern holds for most of the air pollution indicators. The mass concentration of S did constitute the largest fraction of the analysed elements of PM 2.5 in all locations. The crustal component varies from less than 10% up to 25% across these cities. Temporal correlations of daily values vary considerably from city to city, depending on the indicators compared. Nevertheless, correlations between estimates of long-term exposure, such as annual means, are generally high among indicators of PM 2.5 from anthropogenic sources, such as S, metals, and reflectance. This highlights the ARTICLE IN PRESS www.elsevier.com/locate/atmosenv 1352-2310/$ - see front matter r 2005 Elsevier Ltd. All rights reserved. doi:10.1016/j.atmosenv.2005.06.049 Corresponding author. Tel.: +1 323 442 1234; fax: +1 323 442 3272. E-mail address: [email protected] (T. Go¨tschi).
Transcript of Elemental composition and reflectance of ambient fine particles at 21 European locations

ARTICLE IN PRESS
1352-2310/$ - se
doi:10.1016/j.at
�CorrespondE-mail addr
Atmospheric Environment 39 (2005) 5947–5958
www.elsevier.com/locate/atmosenv
Elemental composition and reflectance of ambient fineparticles at 21 European locations
Thomas Gotschia,�, Marianne E. Hazenkamp-von Arxb, Joachim Heinrichc,Roberto Bonod, Peter Burneye, Bertil Forsbergf, Deborah Jarvise,Jose Maldonadog, Dan Norbackh, Willem B. Sterni, Jordi Sunyerj,Kjell Torenk, Giuseppe Verlatol, Simona Villanim, Nino Kunzlia,b
aUniversity of Southern California, Los Angeles, USAbInstitute of Social and Preventive Medicine, University of Basel, Switzerland
cGSF National Research Center for Environment and Health, Institute of Epidemiology, Neuherberg, GermanydDepartment of Public Health and Microbiology, University of Turin, Italy
eDepartment of Public Health Sciences, Kings College London, UKfDepartment of Public Health and Clinical Medicine, Umea University, Sweden
gHospital Juan Ramon Jimenez, Huelva, SpainhDepartment of Occupational and Environmental Medicine, University Hospital Uppsala, Sweden
iGeochemical Laboratory, Institute for Mineralogy and Petrography, University of Basel, SwitzerlandjInstitut Municipal d Investigacio Medica (IMIM), Barcelona, SpainkDepartment of Occupational Medicine, Goteborg University, Sweden
lDepartment of Medicine and Public Health, University of Verona, ItalymDepartment of Health Science, University of Pavia, Italy
Received 2 November 2004; accepted 19 June 2005
Abstract
We sampled fine particles (PM2.5) over a 1-year period at 21 central urban monitoring sites in 20 cities of the
European Community Respiratory Health Survey (ECRHS). Particle filters were then analysed for elemental
composition using energy dispersive X-ray fluorescence spectrometry and reflectance (light absorption). Elemental
analyses yielded valid results for 15 elements (Al, As, Br, Ca, Cl, Cu, Fe, K, Mn, Pb, S, Si, Ti, V, Zn).
Annual and seasonal means of PM2.5, reflectance, and elements show a wide range across Europe with the lowest
levels found in Iceland and up to 80 times higher concentrations in Northern Italy. This pattern holds for most
of the air pollution indicators. The mass concentration of S did constitute the largest fraction of the analysed
elements of PM2.5 in all locations. The crustal component varies from less than 10% up to 25% across these
cities. Temporal correlations of daily values vary considerably from city to city, depending on the indicators
compared. Nevertheless, correlations between estimates of long-term exposure, such as annual means, are generally
high among indicators of PM2.5 from anthropogenic sources, such as S, metals, and reflectance. This highlights the
e front matter r 2005 Elsevier Ltd. All rights reserved.
mosenv.2005.06.049
ing author. Tel.: +1323 442 1234; fax: +1 323 442 3272.
ess: [email protected] (T. Gotschi).
ARTICLE IN PRESST. Gotschi et al. / Atmospheric Environment 39 (2005) 5947–59585948
difficulty to disentangle effects of specific sources or PM constituents in future health effect analyses using annual
averages.
r 2005 Elsevier Ltd. All rights reserved.
Keywords: Air pollution; PM2.5; Elements; Reflectance; Long-term exposure assessment
1. Introduction
Epidemiological studies have successfully used measures
of particulate matter, i.e. the mass concentration (mgm�3)
of particles with a median aerodynamic diameter of 2.5 or
10mm (PM2.5, PM10), to investigate associations between
air pollution and human health (Brunekreef and Holgate,
2002; US EPA, 2003; WHO, 2003). However, PM2.5 is an
unspecific measure for a mixture of scores of particulate air
pollutants, predominantly but not exclusively originating
from combustion processes. Therefore, a primary goal of
air pollution research is aimed towards identifying culprit
agents of air pollution to understand and prevent adverse
health outcomes. Besides physical aspects such as particle
number, size, or surface, the chemical composition of
particles is likely to play a crucial role (WHO, 2003).
Airborne particulate matter is a mixture of thousands of
different substances, diverse in such critical characteristics
as their solubility, persistence in the atmosphere and in
human tissue, reactivity, toxicity and carcinogenicity, as
well as their chemical structure and elemental composition.
A second incentive to more specifically characterize
ambient particulate pollution is to identify sources of
emissions to be targeted by policies. PM2.5 mass is not
source-specific and its composition can vary significantly
in time and space, primarily due to variations in sources,
emission strength, meteorological conditions, physical
processes, and chemical reactions. Besides combustion
processes, including traffic and industrial emissions,
natural sources such as wind-blown dust or sea spray
can contribute to PM2.5 levels. Further characterization
of PM2.5 samples therefore is needed to attribute health
effects to specific pollution sources.
The European Community Respiratory Health Survey
(ECRHS) is a cohort study addressing, among others, the
long-term effects of air pollution on respiratory illnesses
and lung function in adults of 20 European cities (Fig. 1)
(European Community Respiratory Health Group,
2002). We measured PM2.5 and nitrogen dioxide (NO2)
concentrations over a 1-year period at a central monitor-
ing location in each study centre. In addition we
measured the reflectance and analysed the elemental
composition of the particle samples. PM2.5 and NO2
ambient concentrations have been described previously
(Hazenkamp-von Arx et al., 2003, 2004).
The purpose of this report is to describe the elemental
composition and reflectance of this large set of PM2.5
samples. We first describe the annual and seasonal
means for each location. We then describe the correla-
tions between PM2.5 and elements and reflectance within
each city and discuss different patterns across Europe.
Ultimately, we provide the cross-community correla-
tions of the annual means of all particle metrics. The
correlations across the study centres are of particular
relevance when using community mean levels to
compare health conditions across centres. While highly
correlated constituents can be used as surrogates for
each other, their independent contribution to health
effects cannot be disentangled.
2. Methods
A standardized PM2.5 protocol was implemented and
has been described in detail (Hazenkamp-von Arx et al.,
2003). Briefly, in each of the 21 study centres we used
identical equipment (Basel-Sampler from BGI, Inc.;
Gelman Teflo filters), procedures, and sampling and
storage schemes. In each centre, a central monitoring
site was chosen, either at a pre-existing air monitoring
station, or in collaboration with local air monitoring
authorities. Monitors in Italy and Antwerp City were
located close to roads, which is likely to have affected
some of the metrics. Between June 2000 and December
2001, we sampled 7 days over a 2-week period during
each month, yielding 84 days over a 1-year period.
Weekday samples were exposed 24 h, whereas weekends
were captured on single filters exposed for 48 h (in total
72 filters per centre). The predetermined sampling days
were the same for all centres. Overall, more than 1600
samples were collected. All filters were weighed in the
same laboratory. Reweighing of selected filters demon-
strated a high reliability of the weighing process and
analyses of blank filters did not suggest the need for
adjustment for filter contamination (Hazenkamp-von
Arx et al., 2003). Given the restricted sampling schedule
of 84 days per year, we expect our annual mean
estimates to fall within a 10% margin of error from a
hypothetical true mean based on daily measurements
(unpublished data).
PM2.5 filter samples were analysed for 26 different
chemical elements, using energy dispersive X-ray fluor-
escence spectrometry (ED-XRF), a non-destructive
method we previously applied in the EXPOLIS study
(ED-XRF, Geochemical Laboratory, Institute of Miner-
alogy and Petrography, Basel University/CH-4056

ARTICLE IN PRESS
Fig. 1. Locations of the 21 study centres of ECRHS (note: 2 centres in Antwerp, City and South).
T. Gotschi et al. / Atmospheric Environment 39 (2005) 5947–5958 5949
Basel) (Mathys et al., 2001). ED-XRF is capable of
detecting elements with an atomic number above
Z ¼ 11, but is neither able to analyze low atomic
number elements like H, C, N or O, nor to perform
chemical speciation. Elemental analyses provided accu-
rate results for 14 elements (Al, As, Br, Ca, Cl, Cu, Fe,
K, Mn, Pb, Si, Ti, V, Zn). Measurements of sulphur
were highly correlated with declared sulphur contents of
standard materials (rPearson ¼ 0:98); however, concentra-tions were systematically overestimated by ED-XRF. A
correction factor of 0.42 was derived from parallel
analyses of 12 filters using ion chromatography (ICP)
and applied to ED-XRF sulphur measurements. Cali-
bration for Mg, Na, and P showed low correlations
(rPearsono0:8) between different standards, impeding the
interpretation of the measured values. For 7 elements
(Bi, Cd, Co, Cr, Ga, Ni, Se,) concentrations were too
low on most filters to be detected reliably. Iodine could
not be analysed due to methodological problems. More
details on quality assurance of the method are published
elsewhere (Mathys et al., 2001, 2002).
Since carbon cannot be detected with ED-XRF,
reflectance of the filters was measured and the absorp-
tion coefficient (Abs) calculated. We used a standard
method (Reflectometer EEL model 43; Diffusion Sys-
tems Ltd., London, UK) to measure reflectance, which
has been applied and described earlier (Gotschi et al.,
2002). Repeated reflectance measurements of 78
filters showed an average relative difference of 1.2%.
Elemental carbon (EC) is the dominant light absorbing
substance in airborne particulate matter; therefore,
reflectance can be used as a surrogate measure for EC.

ARTICLE IN PRESST. Gotschi et al. / Atmospheric Environment 39 (2005) 5947–59585950
In urban settings reflectance can be considered a diesel-
specific traffic indicator, since several studies estimated
that in urban settings the major fraction of EC originates
from diesel combustion (66–96%) (Schauer, 2003).
The specific elements measured on PM2.5 will be
briefly described. Sulphur (S) is assumed to represent a
background portion of PM2.5, mainly consisting of
sulphate particles (SO42�), which are oxidation products
formed from sulphur dioxide (SO2) emissions during
long-range transportation in the atmosphere. Lead (Pb)
and bromine (Br) may reflect aspects of traffic emissions.
However, since Pb was banned from gasoline, the origin
of airborne Pb is less clear, possibly stemming from re-
suspension of road dust, brake abrasion, industrial
emissions, and waste incineration (Lee et al., 1994; de
Miguel et al., 1997; Chiaradia and Cupelin, 2000;
Lammel et al., 2002). Bromine is thought to be mainly
emitted by vehicles, though other sources, i.e. fossil fuel
combustion, incineration, sea spray, or crustal material,
exist (Lee et al., 1994; Lammel et al., 2002). Other
metals, particularly iron (Fe), copper (Cu), and zinc
(Zn), are of toxicological interest, since these transition
metals may play a crucial role in the oxidative stress
pathway, hypothesized to be part of the causal explana-
tion of many observed air pollution-related health
effects (Gilliland et al., 1999). Aluminium (Al), calcium
(Ca), and silicon (Si) are the main components of
geogenic matter or crustal material (Andrews et al.,
1996; Press and Siever, 1997). Chlorine (Cl) is a
significant contributor to PM2.5 mass. Sources of
chlorine are sea salt particles, salt particles from street
de-icing, industrial emissions of hydrochloric acid (HCl),
and emissions from waste incineration (US Environ-
mental Protection Agency, 1990). Potassium (K) is
associated with biogenic aerosols from wood combus-
tion, pollen, and spores (Matthias-Maser and Jaenicke,
1994). Vanadium (V) is a trace element emitted during
the combustion of fossil fuels, such as coal and
vanadium-rich fuel oil (WHO, 2000). Titanium (Ti) is
used as a pigment in paints (TiO2) and in metal alloys. It
is abundant in the Earth’s crust. The main sources of Ti
contamination in the general environment are the
combustion of fossil fuels and the incineration of
titanium-containing wastes (WHO, 1984). Major
sources of arsenic (As) are nonferrous metal smelters
and power plants burning arsenic-rich coal (WHO,
2000). Manganese (Mn) emissions can be increased near
foundries and where ferro- and silico-manganese in-
dustries are present (WHO, 2000).
All data in this manuscript are presented as measures
of air concentrations (mgm�3 for PM2.5, ngm�3 for
all elements, and absorption coefficient *105m�1 for
reflectance).
For descriptive purposes, annual and seasonal means
are presented. For calculation of means, single filter data
were weighed by exposure time with each month
assigned equal weight (Hazenkamp-von Arx et al.,
2004). Winter is defined as November to February,
and summer as May to August. Coefficients of variance
(standard deviation/mean) presented for the annual
means reflect the variability of the monthly means.
To compare the composition of PM2.5 across centres,
percent of accounted mass of PM2.5 (for elements only)
and within city Pearson correlations were calculated.
Spearman correlations yielded very similar results and
are therefore not presented. To assess whether indicators
will provide independent information for health ana-
lyses, Pearson correlation coefficients between annual
means were calculated across centres.
Overall, data completeness was high yielding more
than 80% of the scheduled sampling time in all cities,
except for Verona where technical problems occurred
(data completeness 37% of scheduled sampling time).
Therefore, data for Verona need to be interpreted with
caution.
3. Results
The range of annual mean concentrations across the 21
study centres is large for all indicators, showing ratios
between the 90th and the 10th percentile from 2.4 for
sulphur to 11.1 for zinc. As can be seen from Table 1, the
majority of indicators show the highest annual means in
Turin. Exceptions are indicators of crustal material and
some trace metals (Cu, Ti, V, Zn) which show the highest
concentrations in some of the Spanish centres and in
Grenoble. Pavia, located in the same air shed as Turin,
the plain of the river Po (see Fig. 1), showed similarly
high levels. Barcelona and, to a lesser extent, Antwerp
City and Paris are in the range of the Italian centres for
presumably traffic-related indicators (Abs, Pb, Br), but
show significantly lower levels of PM2.5 and sulphur.
Reykjavik in Iceland and the Swedish centres Umea and
Uppsala showed the lowest concentrations for most
indicators, particularly for those associated with anthro-
pogenic activities. In Reykjavik, sulphur concentrations
were more than ten times lower than in Turin, and the
difference for reflectance was more than 40-fold (0.1 vs.
4.3 abs. coeff. m�1).
In general, similar pollution levels have been observed
for centres located in the same regions, such as the three
Swedish (Gothenburg, Umea, Uppsala), the two British
(Ipswich, Norwich), or the three Italian centres
(Pavia, Turin, Verona), respectively. The two centres
in Antwerp, one in the city centre (Antwerp City) and
the other in the southern suburbs (Antwerp South),
11.5 km apart, do suggest pronounced differences for
reflectance within the same city (2.9 vs. 1.7 abs. coeff.
105m�1). Earlier, we reported a comparable difference
in annual mean NO2 for the same two locations (58 vs.
26mgm�3) (Hazenkamp-von.Arx et al., 2004).

ARTICLE IN PRESS
Table 1
Annual means (coefficient of variance) for each centre and indicator
PM2.5 Abs Al As Br Ca Cl Cu Fe K Mn Pb S Si Ti V Zn
Antwerp city 24.1 2.9 177 7.4 5.1 87 1113 9.7 127 182 6.9 28.6 1465 363 5.3 6.8 52.4
(0.60) (0.35) (0.49) (1.23) (0.87) (0.34) (1.29) (0.69) (0.46) (0.79) (0.62) (0.72) (0.34) (0.48) (0.47) (0.59) (0.85)
Antwerp South 20.8 1.7 128 6.3 4.7 46 892 6.3 66 182 5.1 25.8 1453 263 3.6 5.7 45.4
(0.44) (0.44) (0.46) (0.90) (0.71) (0.41) (1.11) (0.97) (0.46) (0.66) (0.54) (0.71) (0.30) (0.58) (0.61) (0.59) (0.86)
Albacete 13.1 1.4 344 1.6 3.9 277 280 4.6 49 350 2.0 11.3 1009 730 5.6 2.7 12.2
(0.25) (0.23) (0.64) (0.53) (0.45) (0.50) (1.22) (0.73) (0.54) (0.50) (0.28) (0.54) (0.36) (0.60) (0.58) (0.40) (0.64)
Barcelona 22.2 3.1 389 12.5 12.1 226 831 21.3 145 430 10.4 52.7 1388 686 19.0 9.0 80.5
(0.34) (0.36) (0.51) (0.51) (0.76) (0.19) (0.97) (0.52) (0.32) (1.41) (0.68) (0.56) (0.34) (0.25) (0.67) (0.29) (0.49)
Basel 17.4 1.7 151 3.6 5.3 60 472 6.5 78 255 3.3 13.5 1039 299 3.1 1.6 32.9
(0.52) (0.27) (0.49) (0.68) (0.51) (0.26) (1.06) (0.34) (0.24) (0.60) (0.36) (0.34) (0.41) (0.34) (0.34) (0.28) (0.43)
Erfurt 16.3 1.7 148 4.5 2.2 52 329 5.0 72 157 3.1 14.8 1144 313 2.8 0.8 38.5
(0.58) (0.43) (0.41) (0.89) (0.53) (0.30) (1.77) (0.44) (0.41) (0.70) (0.42) (0.96) (0.47) (0.39) (0.43) (0.33) (1.02)
Galdakao 16.3 1.9 197 8.6 3.8 199 411 17.9 166 191 23.0 39.0 1585 453 4.0 9.6 149.7
(0.36) (0.23) (0.45) (0.66) (0.37) (0.34) (0.75) (0.57) (0.33) (0.46) (0.42) (0.55) (0.63) (0.42) (0.38) (0.84) (0.61)
Grenoble 19.0 2.6 257 5.8 3.4 139 667 16.7 125 326 10.7 23.2 888 1404 5.5 3.3 185.0
(0.47) (0.36) (0.71) (0.72) (0.59) (1.12) (1.48) (0.56) (0.63) (0.62) (0.71) (0.53) (0.28) (0.65) (0.62) (0.35) (0.81)
Gothenburg 12.6 1.0 97 2.1 2.2 38 540 4.2 52 113 2.7 5.2 903 217 2.4 3.9 15.9
(0.27) (0.29) (0.43) (0.37) (0.34) (0.49) (0.99) (0.60) (0.43) (0.45) (0.42) (0.71) (0.45) (0.57) (0.50) (0.48) (0.43)
Huelva 17.3 1.4 444 12.2 4.9 168 806 26.6 76 297 2.9 26.9 1558 1259 17.1 6.7 40.9
(0.27) (0.26) (0.48) (0.77) (0.30) (0.33) (0.84) (0.61) (0.37) (0.47) (0.34) (0.53) (0.57) (0.43) (1.06) (0.49) (0.63)
Ipswich 16.5 1.3 115 6.4 4.7 37 1147 4.6 41 201 3.3 18.8 999 165 4.5 5.6 22.4
(0.41) (0.39) (0.60) (0.93) (0.72) (0.33) (0.92) (0.78) (0.39) (0.90) (0.56) (1.06) (0.47) (0.31) (1.00) (0.85) (0.60)
Norwich 16.2 1.6 108 4.3 3.9 92 1027 3.2 42 116 2.6 13.6 977 204 2.6 4.5 15.0
(0.32) (0.25) (0.31) (0.57) (0.56) (1.09) (0.76) (0.67) (0.32) (0.36) (0.57) (0.55) (0.40) (0.39) (0.34) (0.77) (0.42)
Oviedo 15.9 2.1 467 6.2 7.1 281 562 9.0 138 232 6.4 22.9 1181 781 7.4 5.5 31.1
(0.23) (0.36) (0.25) (0.51) (0.48) (0.37) (0.79) (0.35) (0.29) (0.28) (0.42) (0.37) (0.56) (0.33) (0.27) (0.32) (0.20)
Pavia 35.3 2.9 228 9.2 11.1 85 963 9.4 124 364 9.9 37.4 1783 539 8.2 4.2 47.0
(0.57) (0.34) (0.34) (0.64) (0.68) (0.39) (1.23) (0.37) (0.36) (0.68) (0.96) (0.58) (0.23) (0.35) (0.55) (0.31) (0.78)
Paris 17.8 2.4 141 3.7 4.1 79 668 10.0 98 180 4.4 15.7 1081 321 3.9 2.2 40.1
(0.39) (0.21) (0.50) (0.45) (0.70) (0.28) (0.94) (0.36) (0.34) (0.49) (0.56) (0.49) (0.39) (0.52) (0.42) (0.42) (0.47)
Reykjavik 3.7 0.1 111 0.9 1.2 41 936 1.7 23 29 0.5 2.6 155 245 3.0 0.4 2.2
(0.45) (0.61) (0.63) (0.17) (0.61) (0.47) (0.88) (0.58) (0.62) (0.44) (0.78) (1.12) (0.56) (0.57) (0.73) (0.31) (0.55)
Tartu 14.8 1.6 156 2.5 2.2 85 289 2.7 32 386 2.8 8.6 892 367 2.7 1.3 32.6
(0.34) (0.31) (0.88) (0.57) (0.63) (0.71) (0.98) (0.60) (0.49) (0.55) (0.52) (0.65) (0.28) (0.95) (0.93) (0.44) (0.48)
Turin 44.9 4.3 380 14.4 21.3 116 1322 23.1 262 471 13.3 63.8 1827 744 8.5 3.6 70.1
(0.50) (0.24) (0.27) (0.48) (0.70) (0.26) (1.08) (0.45) (0.40) (0.69) (0.59) (0.53) (0.24) (0.28) (0.31) (0.40) (0.60)
Umea 5.6 0.6 70 1.1 1.2 22 160 2.4 25 63 1.2 3.0 415 172 1.6 0.9 6.2
(0.21) (0.40) (0.66) (0.50) (0.45) (0.09) (1.26) (0.76) (0.45) (0.33) (0.45) (0.86) (0.38) (0.75) (0.77) (0.56) (0.51)
Uppsala 10.4 1.0 103 1.8 1.7 34 225 4.5 54 116 1.9 5.0 752 247 2.0 1.4 14.9
(0.43) (0.33) (0.44) (0.58) (0.53) (0.46) (1.03) (0.51) (0.56) (0.79) (0.59) (0.86) (0.50) (0.49) (0.43) (0.55) (0.49)
Veronaa 41.5 4.2 336 19.4 22.9 257 1099 22.1 302 411 30.7 80.1 2015 759 8.7 1.9 135.5
(0.42) (0.21) (0.29) (0.42) (0.39) (0.36) (0.87) (0.25) (0.29) (0.56) (0.67) (0.27) (0.45) (0.52) (0.32) (0.44) (0.53)
PM2.5 in mgm�3, reflectance (Abs) in absorption coefficient 105m�1, and elements in ngm�3. Mean values based on less than 50% of
filter values above the limit of detection are printed in italic and should be interpreted with caution. Values from Verona are based on
37% of the scheduled sampling time only and should also be interpreted cautiously.aAnnual mean based on 37% of scheduled sampling time only.
T. Gotschi et al. / Atmospheric Environment 39 (2005) 5947–5958 5951
ARTICLE IN PRESS
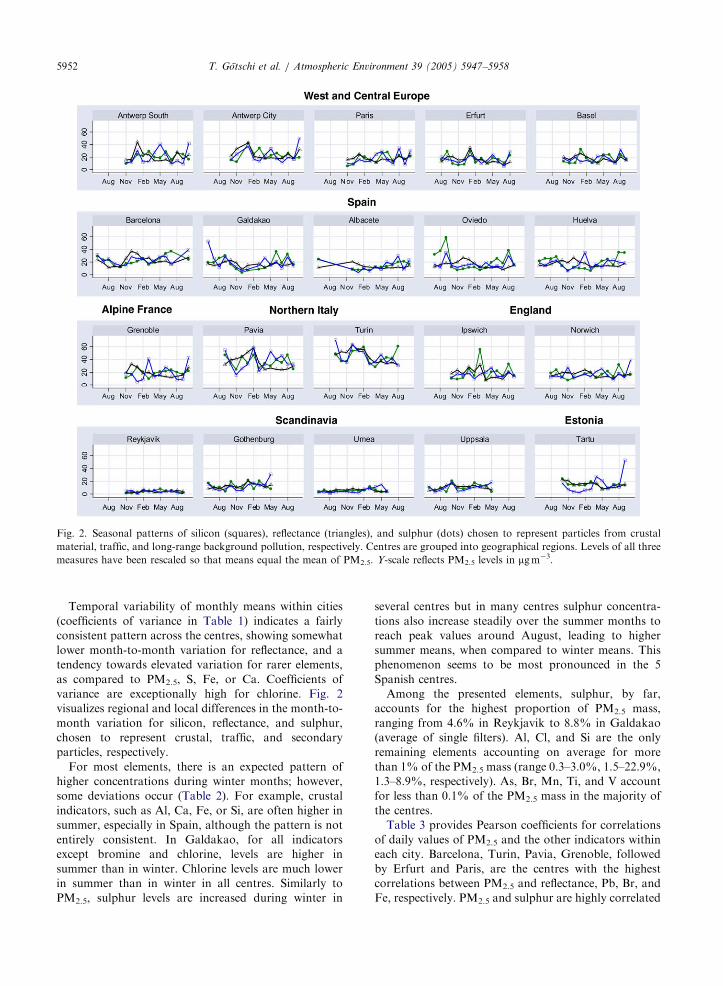
Fig. 2. Seasonal patterns of silicon (squares), reflectance (triangles), and sulphur (dots) chosen to represent particles from crustal
material, traffic, and long-range background pollution, respectively. Centres are grouped into geographical regions. Levels of all three
measures have been rescaled so that means equal the mean of PM2.5. Y-scale reflects PM2.5 levels in mgm�3.
T. Gotschi et al. / Atmospheric Environment 39 (2005) 5947–59585952
Temporal variability of monthly means within cities
(coefficients of variance in Table 1) indicates a fairly
consistent pattern across the centres, showing somewhat
lower month-to-month variation for reflectance, and a
tendency towards elevated variation for rarer elements,
as compared to PM2.5, S, Fe, or Ca. Coefficients of
variance are exceptionally high for chlorine. Fig. 2
visualizes regional and local differences in the month-to-
month variation for silicon, reflectance, and sulphur,
chosen to represent crustal, traffic, and secondary
particles, respectively.
For most elements, there is an expected pattern of
higher concentrations during winter months; however,
some deviations occur (Table 2). For example, crustal
indicators, such as Al, Ca, Fe, or Si, are often higher in
summer, especially in Spain, although the pattern is not
entirely consistent. In Galdakao, for all indicators
except bromine and chlorine, levels are higher in
summer than in winter. Chlorine levels are much lower
in summer than in winter in all centres. Similarly to
PM2.5, sulphur levels are increased during winter in
several centres but in many centres sulphur concentra-
tions also increase steadily over the summer months to
reach peak values around August, leading to higher
summer means, when compared to winter means. This
phenomenon seems to be most pronounced in the 5
Spanish centres.
Among the presented elements, sulphur, by far,
accounts for the highest proportion of PM2.5 mass,
ranging from 4.6% in Reykjavik to 8.8% in Galdakao
(average of single filters). Al, Cl, and Si are the only
remaining elements accounting on average for more
than 1% of the PM2.5 mass (range 0.3–3.0%, 1.5–22.9%,
1.3–8.9%, respectively). As, Br, Mn, Ti, and V account
for less than 0.1% of the PM2.5 mass in the majority of
the centres.
Table 3 provides Pearson coefficients for correlations
of daily values of PM2.5 and the other indicators within
each city. Barcelona, Turin, Pavia, Grenoble, followed
by Erfurt and Paris, are the centres with the highest
correlations between PM2.5 and reflectance, Pb, Br, and
Fe, respectively. PM2.5 and sulphur are highly correlated

ARTICLE IN PRESS
Table 2
Winter means (upper row) and summer means (lower row) for each centre and indicator
PM2.5 Abs Al As Br Ca Cl Cu Fe K Mn Pb S Si Ti V Zn
Antwerp citya 37.0 3.9 216 15.0 9.6 113 2725 14.5 187 319 11.5 45.0 1621 393 7.0 9.0 96.2
17.6 2.4 142 3.0 3.5 77 287 8.8 98 108 4.8 24.2 1442 310 4.4 5.9 30.5
Antwerp South 24.4 2.1 133 10.0 7.1 51 1774 9.8 82 260 7.2 37.5 1205 213 3.9 7.3 72.2
17.3 1.4 101 5.3 2.0 40 288 3.4 47 124 3.5 15.5 1581 284 3.1 4.8 27.4
Albacete 15.4 1.7 206 2.5 3.8 205 678 6.7 33 546 1.6 12.0 714 420 3.5 2.4 17.7
11.5 1.2 499 1.0 4.3 405 38 3.3 61 236 2.2 12.1 1195 1064 7.5 2.9 7.6
Barcelona 30.2 4.2 379 18.3 22.5 249 1704 26.8 190 401 17.4 75.0 1298 728 23.5 9.4 105.9
20.0 2.5 512 9.2 4.5 209 237 23.2 124 715 6.5 42.3 1890 767 21.0 10.5 60.6
Basel 23.7 2.1 197 6.7 7.6 66 1044 6.6 85 397 4.2 14.9 1074 262 3.4 1.8 43.2
13.7 1.6 147 2.2 3.6 65 52 7.5 83 174 2.9 13.7 1251 354 3.2 1.5 29.7
Erfurt 19.9 2.1 150 6.5 2.7 63 782 4.9 80 219 3.7 22.3 1019 325 3.2 0.8 61.0
11.0 1.2 164 1.7 1.4 47 21 3.8 59 98 2.4 4.6 1221 346 2.8 1.0 12.0
Galdakaoa 10.8 1.6 119 7.2 4.1 141 507 10.6 127 136 16.1 25.2 673 266 2.6 3.0 72.8
20.9 1.9 238 7.6 3.3 231 179 19.9 169 253 22.6 38.7 2571 526 4.5 11.8 178.9
Grenoble 28.0 3.4 322 9.4 5.3 121 1714 19.9 176 512 16.3 33.5 882 914 6.6 3.5 319.2
12.9 1.8 205 3.6 2.4 209 75 18.0 75 229 5.0 19.3 1005 1365 4.8 2.8 109.3
Gothenburg 12.5 1.2 84 2.2 2.6 40 891 5.1 56 113 3.0 5.0 869 183 2.0 3.4 20.2
11.2 0.9 113 1.6 2.1 45 410 4.2 49 65 2.5 5.0 826 255 3.3 5.3 9.3
Huelva 17.2 1.7 469 16.5 5.5 186 1419 30.7 85 393 3.7 29.1 882 1250 13.0 5.0 54.8
16.9 1.1 491 10.5 4.8 170 206 28.9 80 202 2.6 29.4 2191 1428 24.9 9.2 42.9
Ipswich 21.3 1.8 162 11.0 8.4 41 2418 5.9 50 335 3.6 32.2 896 153 7.3 3.7 34.7
15.0 1.0 97 4.2 2.2 36 218 2.8 37 119 3.4 9.3 1350 189 2.8 10.0 14.4
Norwicha 17.7 2.0 134 6.3 6.4 209 1811 3.5 51 160 4.2 19.5 736 232 3.0 2.8 17.9
14.6 1.3 97 2.2 2.6 49 247 3.7 36 85 1.7 12.0 1255 207 2.3 7.0 12.7
Oviedo 17.5 3.0 483 9.0 10.5 387 996 7.5 117 206 6.3 27.9 766 746 7.5 5.8 35.6
16.7 1.5 485 3.2 4.7 213 142 11.0 166 272 6.4 22.0 1901 843 7.8 6.2 29.2
Pavia 55.3 4.1 226 16.1 19.6 99 2175 11.4 167 655 18.8 61.5 1907 508 8.7 4.9 83.6
19.9 2.1 280 4.7 3.6 87 77 6.7 103 181 5.3 18.6 1928 655 11.0 3.7 29.2
Paris 21.0 2.5 112 4.1 6.3 76 1309 11.5 97 221 5.0 18.4 885 219 3.1 2.3 42.6
15.9 2.3 169 3.8 2.0 95 158 10.5 111 166 4.8 11.8 1363 398 4.9 2.2 39.8
Reykjavik 4.8 0.1 155 0.8 1.5 56 1515 1.5 30 30 0.8 1.1 91 298 4.2 0.4 1.6
3.3 0.2 79 0.9 1.2 34 618 1.7 21 32 0.3 4.7 216 214 3.1 0.4 2.1
Tartu 15.6 1.8 68 3.2 2.3 30 538 2.8 19 433 2.6 9.7 865 120 0.9 1.7 37.0
10.2 1.1 131 1.4 1.0 120 30 1.4 31 160 1.8 3.1 709 341 2.4 0.7 16.3
Turin 69.2 5.4 449 21.7 38.0 137 3015 29.6 379 876 21.9 100.9 2095 850 11.3 5.2 121.9
23.0 3.3 303 7.0 7.4 88 115 15.2 167 205 5.9 34.6 1875 643 6.5 2.5 35.3
Umea 5.8 0.8 50 1.4 1.1 22 332 2.5 21 71 1.4 1.8 397 117 1.0 0.7 7.5
4.9 0.4 66 0.9 0.9 21 56 0.9 20 41 0.7 2.1 334 183 1.4 0.8 3.0
Uppsala 11.5 1.2 78 2.5 2.1 26 346 5.5 50 139 2.4 5.6 826 176 1.5 1.3 18.5
7.2 0.7 95 0.9 0.8 30 189 2.3 35 47 1.0 1.7 529 234 1.8 1.1 6.6
Veronab 51.0 4.7 381 24.7 27.8 319 1859 26.0 358 554 46.8 94.4 2167 1006 10.2 1.3 191.2
16.0 2.6 154 5.1 6.3 92 47 13.0 142 148 8.7 43.7 1402 240 3.3 2.1 92.9
PM2.5 in mgm�3, reflectance (Abs) in absorption coefficient 105m�1, and elements in ngm�3. Mean values based on less than 50% of
filter values above the limit of detection are printed in italic and should be interpreted with caution.aWinter mean based on less than 80% of scheduled sampling time (Antwerp City:60%, Galdakao:66%, Norwich:64%).bWinter and summer mean based on less than 80% of scheduled sampling time (43%, 18%, resp.).
T. Gotschi et al. / Atmospheric Environment 39 (2005) 5947–5958 5953

ARTICLE IN PRESS
Table 3
Within-city Pearson correlation coefficients between PM2.5 and all other indicators
Abs Al As Br Ca Cl Cu Fe K Mn Pb S Si Ti V Zn
Antwerp city 0.63 0.57 0.75 0.71 0.33 0.67 0.43 0.59 0.84 0.74 0.67 0.85 0.32 0.70 0.38 0.75
Antwerp South 0.86 0.49 0.51 0.42 0.41 0.53 0.30 0.66 0.64 0.42 0.41 0.74 0.19 0.54 0.60 0.46
Albacete 0.55 0.25 0.30 0.30 0.21 0.36 0.12 0.23 0.57 0.27 0.11 0.56 0.21 0.26 0.57 0.19
Barcelona 0.79 0.48 0.69 0.81 0.50 0.79 0.59 0.76 0.32 0.59 0.74 0.55 0.49 0.57 0.58 0.67
Basel 0.68 0.24 0.56 0.51 0.19 0.74 0.16 0.56 0.87 0.64 0.32 0.83 0.16 0.46 0.71 0.66
Erfurt 0.81 0.49 0.87 0.54 0.50 0.81 0.52 0.70 0.92 0.77 0.79 0.80 0.39 0.62 0.21 0.84
Galdakao 0.61 0.56 0.45 0.27 0.55 �0.05 0.40 0.52 0.76 0.53 0.42 0.89 0.55 0.57 0.64 0.45
Gothenburg 0.39 0.44 0.42 0.49 0.20 0.10 0.03 0.14 0.65 0.38 0.50 0.81 0.24 0.27 0.35 0.48
Grenoble 0.81 0.23 0.78 0.74 0.09 0.86 0.47 0.72 0.90 0.70 0.75 0.55 0.06 0.26 0.48 0.78
Huelva 0.64 0.20 0.32 0.65 0.39 �0.02 0.24 0.29 0.64 0.47 0.41 0.79 0.40 0.11 0.68 0.31
Ipswich 0.80 0.57 0.58 0.78 0.11 0.67 0.51 0.57 0.56 0.39 0.55 0.73 0.50 0.51 0.40 0.78
Norwich 0.73 0.54 0.33 0.65 0.08 0.30 0.36 0.67 0.64 0.46 0.26 0.80 0.27 0.48 0.51 0.55
Oviedo 0.48 0.61 0.42 0.53 0.35 0.10 0.35 0.53 0.73 0.27 0.43 0.72 0.57 0.64 0.61 0.62
Paris 0.62 0.34 0.69 0.65 0.49 0.45 0.38 0.70 0.84 0.48 0.54 0.75 0.20 0.49 0.50 0.54
Pavia 0.78 0.13 0.81 0.81 0.32 0.90 0.40 0.71 0.83 0.71 0.83 0.56 0.07 0.11 0.36 0.84
Reykjavik �0.05 0.31 0.03 0.29 0.55 0.70 0.00 0.18 0.52 0.26 �0.11 0.42 0.17 0.18 0.01 �0.06
Tartu 0.83 0.19 0.69 0.38 0.02 0.64 0.17 0.28 0.85 0.58 0.47 0.76 0.16 0.16 0.50 0.81
Turin 0.73 0.45 0.70 0.82 0.42 0.91 0.52 0.75 0.86 0.75 0.76 0.56 0.34 0.51 0.84 0.79
Umea 0.50 0.10 0.43 0.27 0.02 �0.06 0.10 0.16 0.74 0.45 0.03 0.87 �0.02 �0.07 0.48 0.64
Uppsala 0.64 0.30 0.66 0.43 0.17 0.08 0.13 0.26 0.69 0.62 0.25 0.85 0.15 0.27 0.65 0.57
Veronaa 0.80 0.43 0.82 0.83 0.61 0.77 0.78 0.82 0.90 0.57 0.84 0.65 0.38 0.61 0.39 0.57
Correlation coefficients above 0.7 are bolded.aBased on 28 filters only.
T. Gotschi et al. / Atmospheric Environment 39 (2005) 5947–59585954
in two thirds of the centres; however Barcelona, Turin,
and Pavia are now among the centres with lower
correlations (r � 0:55). PM2.5 and K show correlations
above 0.7 in 11 centres.
We also investigated pairwise within-city correlations
between all other indicators. Correlations are highest
between Al and Si, and Al and Ti, which show Pearson
coefficients greater than 0.9 in 11 and 9 centres,
respectively. Correlations between Pb and Br are above
0.7 in 16 of the centres. In Barcelona, Turin, and Pavia,
Pb and Br are also correlated with reflectance (r40:7).Also, Pearson correlation coefficients are often higher
than 0.7 for reflectance and Fe (13 centres), Fe and Mn
(13), Si and Ti (13), and Zn and Pb (10). Correlation
tables for each city are available upon request.
Pairwise correlations of annual means across the 21
centres are mostly above 0.8 among markers of
predominantly anthropogenic pollution, i.e. S, Abs, Br,
Pb, As, Fe, and PM2.5, as well as among crustal elements,
i.e. Al, Ca, Si, and Ti (Table 4). In contrast, correlations
are low between anthropogenic and crustal indicators. In
addition, correlations appear somewhat weaker between
Cl, K, Mn, V, Zn and many other indicators. Similar
patterns were observed for seasonal means with correla-
tions slightly lower in summer (data not shown). Results
from the elemental analysis are available in a report
(http://www.ecrhs.org/reports.htm).
4. Discussion
These first trans-European PM2.5 speciation data show
that PM2.5 composition and levels of constituents vary
significantly across Europe, with levels of some toxic
components, i.e. Zn, being up to 80 times higher in
Northern Italy as compared to Iceland. The overall
pattern confirms a north–south pollution gradient across
Europe observed by others (Hamilton and Mansfield,
1991; Pacyna et al., 1991; Hoek et al., 1997; Roemer
et al., 2000). In general, pollution levels were higher in
larger cities and in centres where climate and topography
enhanced accumulation of air pollution, such as in Turin,
Barcelona, and Antwerp. In contrast, areas of low
population density and exposed to small amounts of
pollution from long-range transport, such as Reykjavik
and the northern Swedish centres Umea and Uppsala,
showed the lowest pollution levels for all constituents.
Annual means for crustal indicators deviate consider-
ably from the PM2.5 pattern across centres, most notably
in the Spanish cities. Assuming the likely, although
simplified, chemical structures of crustal compounds in
PM2.5 (i.e. SiO2; Al2O3; 50% CaCO3, 50% CaSO4), this
fraction could make up for 13–25% of the PM2.5 mass in
the Spanish centres, and 24% in the alpine centre
Grenoble, while in the other centres it typically accounts
for less than 10%.

ARTICLE IN PRESS
Table 4
Pearson correlation coefficients of annual means across cities
PM2.5 Abs Al As Br Ca Cl Cu Fe K Mn Pb S Si Ti V
Abs 0.93 1
Al 0.47 0.54 1
As 0.84 0.82 0.64 1
Br 0.91 0.87 0.58 0.88 1
Ca 0.30 0.45 0.84 0.51 0.45 1
Cl 0.64 0.54 0.23 0.62 0.60 0.03 1
Cu 0.63 0.69 0.74 0.87 0.66 0.56 0.40 1
Fe 0.85 0.90 0.58 0.86 0.89 0.54 0.47 0.76 1
K 0.73 0.76 0.71 0.67 0.72 0.58 0.28 0.64 0.63 1
Mn 0.68 0.72 0.38 0.78 0.72 0.54 0.32 0.66 0.88 0.49 1
Pb 0.88 0.89 0.60 0.96 0.93 0.54 0.59 0.80 0.94 0.71 0.86 1
S 0.87 0.81 0.56 0.86 0.75 0.46 0.48 0.72 0.78 0.66 0.70 0.85 1
Si 0.34 0.44 0.80 0.51 0.34 0.64 0.14 0.74 0.45 0.62 0.34 0.43 0.38 1
Ti 0.41 0.46 0.80 0.70 0.51 0.57 0.36 0.79 0.42 0.62 0.29 0.59 0.53 0.64 1
V 0.18 0.25 0.38 0.43 0.14 0.39 0.33 0.50 0.25 0.20 0.31 0.39 0.50 0.24 0.55 1
Zn 0.46 0.60 0.33 0.58 0.41 0.43 0.18 0.67 0.68 0.46 0.80 0.63 0.49 0.60 0.27 0.35
Correlation coefficients above 0.7 are bolded.
T. Gotschi et al. / Atmospheric Environment 39 (2005) 5947–5958 5955
Elevated winter levels of indicators associated with
anthropogenic activities were observed in several cen-
tres, most dramatically in Northern Italy and Antwerp,
where inversion layers are a common phenomenon.
Persistent thermal inversions, combined with low wind
velocities, cause an accumulation of exhaust emissions,
while at the same time the amount of wind-blown
particles from crustal origin is likely to be reduced.
Nevertheless, crustal elements may be increased due to
the accumulation of resuspended road dust.
On the other hand, the warm and dry summer climate
on the Iberian Peninsula, which favours the formation and
lift-up of dust particles, is likely to account for the
increased concentrations of crustal particles in the Spanish
centres, as compared to centres with cooler, more humid
climates. Saharan dust considerably affects this region as
well (Rodriguez et al., 2002, 2004; Viana et al., 2003;
Alastuey et al., 2004). Increased sulphur levels over the
summer months, observed most notably in Spain, are
consistent with atmospheric conversion of sulphur dioxide
(SO2) into sulphate particles (SO42�) taking place more
rapidly in warm air masses, as described in other studies
(Querol et al., 2001; Tanner et al., 2004). As mentioned,
calibration procedures and method comparisons revealed
that ED-XRF sulphur concentrations had to be corrected;
thus the absolute levels need to be interpreted with care.
Relative comparisons between measurements, however,
are not affected.
The extreme seasonal differences in chlorine levels are
a unique finding. These results may not only represent
differences in actual concentrations, or emission levels
but may have methodological reasons. The warmer
summer climate may lead to enhanced evaporation of
hydrochloric acid (HCl) from the filters surface, which
can be formed there by various mechanisms, such as
reactions of acids or ozone with salt particles (NaCl)
(Yao et al., 2001). We also observed strong losses of Cl
on an exposed control filter that was analysed 191 times
for its elemental composition at a temperature of 40 1C
and under a partial vacuum. Cl concentration decreased
from �1600 to �800 ng cm�2 over the first 10 measure-
ments. This, and a similar observation for bromine,
indicates that evaporation of halogenated semi-volatile
organic compounds may have taken place (Mathys et
al., 2002). Although the temperature of 40 1C during the
elemental analysis clearly exceeds outdoor temperatures
even during summer, sampling warmer air may similarly
lead to increased Cl losses due to evaporation from the
filters during summer months, as compared to winter.
Although evaporation of Cl, in some way, is probably
the most important factor, it remains unclear to what
extent increased temperature, ozone levels, differences in
emissions (e.g. street de-icing), or other unknown factors
are responsible for the large differences of Cl observed
between summer and winter levels.
Increased city-to-city variation for reflectance and
other indicators, as compared to regionally fairly homo-
geneous levels for sulphur, probably reflects the more
relevant contribution of locally produced emissions,
including emissions close to the sampling locations. Five
of our monitors are located within 15m of a main street
(Antwerp City, Basel, Pavia, Turin, Verona). Several
studies could show strong concentration gradients for
traffic-related pollutants with increasing distance from

ARTICLE IN PRESST. Gotschi et al. / Atmospheric Environment 39 (2005) 5947–59585956
roadways (Janssen et al., 1997; Roorda-Knape et al.,
1998; Zhu et al., 2002a, b). As a consequence, traffic-
related PM constituents may be oversampled by these
monitors. The reported levels, therefore, reflect exposure
conditions for people living along comparable roads but
not necessarily exposure of the population at large.
Within cities, PM2.5 and sulphur are mostly highly
correlated, since sulphates are a major component of
PM2.5. However, these correlations appear lower where
primary pollution sources become more important, such
as in large cities with high levels of traffic-related
pollutants. The correlations of silicon and aluminium
reflect a relatively constant proportion between SiO2 and
Al2O3 found in crustal material in many areas of Europe
(Putaud et al., 2004). The highly correlated lead and
bromine used to have a major common source in
gasoline. It is unclear though, to what extent this still is
reflected in our data, or whether residues resulting from
road dust or industrial activities are responsible for the
observed correlations. In addition, the correlation
between reflectance and Fe remains unclear. While
reflectance is an indicator for traffic-related soot
emissions, Fe could reflect crustal components of road
dust re-suspended by vehicles, or particles generated
during combustion in engines. Harrison et al. 2003
reported moderate correlations between Fe and NOx,
which they used as an indicator of traffic pollution at a
roadside location.
The diversity of temporal within-city correlation
patterns is a result of the variety of centre specific
characteristics of pollution sources and meteorology and
highlights their relevance for short-term air pollution
levels.
The observed differences in the PM composition
within and across centres may also reflect variability in
PM toxicity, which is not reflected in the PM mass
concentration alone. We hypothesize that the hetero-
geneity in PM composition may partly explain differ-
ences in the PM concentration-response estimates
observed in time-series analyses of mortality and
morbidity in the APHEA study (Le Tertre et al., 2002;
Aga et al., 2003).
A goal within ECRHS is to investigate long-term
effects of air pollution, using the 2000/01 annual means
as the default surrogate for long-term exposure. Despite
the observed within-city diversity of daily and seasonal
patterns for the various indicators, which may reflect
pollution from different origin, our data show that
collinearity among annual means of pollutants com-
pared across cities is large in most cases. Given these
high correlations across cities, it will be difficult to
interpret associations with health effects independently
for the various correlated constituents in cross-commu-
nity comparisons.
Two main factors are likely to be responsible for the
correlations of the long-term estimates across cities
observed for most measured constituents of PM2.5.
First, all study centres are urban areas and thus may
lead to relatively similar mixes of anthropogenic
emission sources across the cities. In contrast to the
absolute amount of emissions, the relative contribution
of the major anthropogenic sources, i.e. traffic, industry,
and domestic emissions, to a city’s total emissions may
not be strongly affected by the size and density of the
city. Second, apart from the total emissions, local
meteorology has a major impact on ambient concentra-
tions. Since it affects many pollutants similarly, it not
only introduces short-term collinearity between pollu-
tants, but also determines their long-term average levels.
Consequently, cities with adverse weather patterns such
as frequent inversion layers will have higher pollution
levels for all pollutants, whereas others with weather
more favourable to pollution dispersion will have lower
levels for all pollutants.
The observation of high correlations among various
constituents does not necessarily imply that population
mean exposures are equally well characterized for each
constituent. Within-city spatial variability may largely
differ among various constituents (Roosli et al., 2001;
Zhu et al., 2002a, b). For indicators which are rather
heterogeneously distributed in space, within-city con-
trasts in exposure, and hence misclassification in
exposure, may be of similar magnitude as the between-
city variability, therefore jeopardizing the investigation
of health effect contrasts across cities. To assess effects
of such heterogeneously distributed constituents, expo-
sure data collected at various locations within cities
would be needed.
A further limitation of our data with regard to their
use as estimates of long-term exposures is the uncer-
tainty to which extent levels measured in 2000/01 may
represent past exposures. Only limited historic air
pollution data are available (Fernandez et al., 2005;
Naef and Xhillari, 2000), indicating more dramatic
changes for S than for example for NO2. We hypothe-
size, though, that for many pollutants the ranking across
the 20 cities did not change dramatically over the past
one or two decades. Erfurt, located in the former
German Democratic Republic, will likely have to be
exempt from this assumption due to the radical changes
in emission sources since the German reunification
(Heinrich et al., 2000).
In summary, we found a substantial diversity of PM
composition patterns across the 21 centres which was
not reflected in the aggregated annual mean estimates of
anthropogenic pollutants. Long-term exposure estimates
for many constituents appear to be driven by common
factors, such as meteorology and population density,
resulting in highly correlated annual means. Conse-
quently, the ability to assess independent contributions
of PM constituents to various long-term health effects in
this study will be limited.

ARTICLE IN PRESST. Gotschi et al. / Atmospheric Environment 39 (2005) 5947–5958 5957
Acknowledgements
We thank Dr. Patrick Mathys (Geochemical Labora-
tory, Institute for Mineralogy and Petrography, Uni-
versity of Basel, Switzerland) for the elemental analyses
of all filter samples.
This work forms part of the ECRHS II project,
funded by the European Commission (Quality of Life
Programme, Environment and Health Key Action;
Project number: QLK4-CT-1999-01237) and by the
Swiss Federal Agency for Education and Science
(BBW-No. 99.0200). T. Gotschi was funded by an
EPA STAR Fellowship. N. Kunzli, head of the air
pollution unit of ECRHS had a Swiss National Science
Foundation Advanced Scientist Fellowship (PROSPER
32-048922.96) and is now supported by the National
Institute of Environmental Health Sciences (Grant
number P30ES07048) and the Hastings Foundation.
The Swedish Environment Protection Agency (SNAP
Project), the Vlaamse Milieu Maatschappij (Dr. E.
Roekens), local authorities and other foundations
supported this study with funds and equipment.
Members of the ECRHS Working Group Air Pollu-
tion and Health: Michael Abramson, Ursula Ackermann-
Liebrich, Lucy Bayer-Oglesby, Roberto Bono, Peter
Burney, Roberto de Marco, Bertil Forsberg, Thorarinn
Gislason, Thomas Gotschi, Marianne E. Hazenkamp,
Joachim Heinrich, Deborah Jarvis, Joost Weyler, Nino
Kunzli, Linnea Lillienberg, Christina Luczynska, Jose
Maldonado, Inga Mills, Dan Norback, Felix Payo Losa,
Albino Poli, Michela Ponzio, Argo Soon, Jordi Sunyer,
Kjell Toren, Giuseppe Verlato, Simona Villani.
References
Aga, E., Samoli, E., Touloumi, G., Anderson, H.R., Cadum,
E., Forsberg, B., Goodman, P., Goren, A., Kotesovec, F.,
Kriz, B., Macarol-Hiti, M., Medina, S., Paldy, A.,
Schindler, C., Sunyer, J., Tittanen, P., Wojtyniak, B.,
Zmirou, D., Schwartz, J., Katsouyanni, K., 2003. Short-
term effects of ambient particles on mortality in the elderly:
results from 28 cities in the APHEA2 project. European
Respiratory Journal Suppliment 40, 28s–33s.
Alastuey, A., Querol, X., Rodriguez, S., Plana, F., Lopez-Soler,
A., Ruiz, C., Mantilla, E., 2004. Monitoring of atmospheric
particulate matter around sources of secondary inorganic
aerosol. Atmospheric Environment 38 (30), 4979–4992.
Andrews, J.E., Brimblecombe, P., Jickells, T.D., Liss, P.S.,
1996. An introduction to environmental chemistry. Black-
well Science, Oxford.
Brunekreef, B., Holgate, S.T., 2002. Air pollution and health.
Lancet 360 (9341), 1233–1242.
Chiaradia, M., Cupelin, F., 2000. Behaviour of airborne lead
and temporal variations of its source effects in Geneva
(Switzerland): comparison of anthropogenic versus natural
processes. Atmospheric Environment 34 (6), 959–971.
de Miguel, E., Llamas, J.F., Chacon, E., Berg, T., Larssen, S.,
Royset, O., Vadset, M., 1997. Origin and patterns of
distribution of trace elements in street dust: unleaded
petrol and urban lead. Atmospheric Environment 31 (17),
2733–2740.
European Community Respiratory Health Group, 2002. The
European community respiratory health survey II. Eur-
opean Respiratory Journal 20 (5), 1071–1079.
Fernandez, M., Gonzalez, A., Javato, R., 2005. Spanish EMEP
assessment report http://www.emep.int/assessment/Part2/
207-218_Part2.pdf (accessed 2005).
Gilliland, F.D., McConnell, R., Peters, J., Gong, H.J., 1999. A
theoretical basis for investigating ambient air pollution and
children’s respiratory health. Environmental Health Per-
spectives 107 (Suppl 3), 403–407.
Gotschi, T., Oglesby, L., Mathys, P., Monn, C., Manalis, N.,
Koistinen, K., Jantunen, M., Hanninen, O., Polanska, L.,
Kunzli, N., 2002. Comparison of black smoke and PM2.5
levels in indoor and outdoor environments of four
European cities. Environmental Science and Technology
36 (6), 1191–1197.
Hamilton, R.S., Mansfield, T.A., 1991. Airborne particulate
elemental carbon: its sources, transport and contribution to
dark smoke and soiling. Atmospheric Environment. Part A.
General Topics 25 (3–4), 715–723.
Harrison, R.M., Tilling, R., Romero, M.S.C., Harrad, S.,
Jarvis, K., 2003. A study of trace metals and polycyclic
aromatic hydrocarbons in the roadside environment. Atmo-
spheric environment 37, 2391–2402.
Hazenkamp-von Arx, M.E., Gotschi Fellmann, T., Oglesby, L.,
Ackermann-Liebrich, U., Gislason, T., Heinrich, J., Jarvis,
D., Luczynska, C., Manzanera, A.J., Modig, L., Norback,
D., Pfeifer, A., Poll, A., Ponzio, M., Soon, A., Vermeire, P.,
Kunzli, N., 2003. PM2.5 assessment in 21 European study
centers of ECRHS II: method and first winter results.
Journal of the Air and Waste Management Association.
53 (5), 617–628.
Hazenkamp-von Arx, M.E., Gotschi, T., Ackermann-Liebrich,
U., Bono, R., Burney, P., Cyrys, J., Jarvis, D., Lillienberg,
L., Luczynska, C., Maldonado, J.A., Jaen, A., de Marco,
R., Mi, Y., Modig, L., Bayer-Oglesby, L., Payo, F., Soon,
A., Sunyer, J., Villani, S., Weyler, J., Kunzli, N., 2004.
PM2.5 and NO2 assessment in 21 European study centres of
ECRHS II: annual means and seasonal differences. Atmo-
spheric Environment 38 (13), 1943–1953.
Heinrich, J., Hoelscher, B., Wichmann, H.E., 2000. Decline of
ambient air pollution and respiratory symptoms in children.
American Journal of Respiratory and Critical Care Medi-
cine 161 (6), 1930–1936.
Hoek, G., Forsberg, B., Borowska, M., Hlawiczka, S., Vaskovi,
E., Welinder, H., Branis, M., Benes, I., Kotesovec, F., Otto
Hagen, L., 1997. Wintertime PM10 and black smoke
concentrations across Europe: results from the peace study.
Atmospheric Environment 31 (21), 3609–3622.
Janssen, N.A., Van Mansom, D.F.M., Van Der Jagt, K.,
Harssema, H., Hoek, G., 1997. Mass concentration and
elemental composition of airborne particulate matter at
street and background locations. Atmospheric Environment
31 (8), 1185–1193.
Lammel, G., Rohrl, A., Schreiber, H., 2002. Atmospheric lead
and bromine in germany—post-abatement levels, variabilities

ARTICLE IN PRESST. Gotschi et al. / Atmospheric Environment 39 (2005) 5947–59585958
and trends. Environmental Science and Pollution Research 9
(6), 397–404.
Lee, D.S., Garland, J.A., Fox, A.A., 1994. Atmospheric
concentrations of trace elements in urban areas of the United
Kingdom. Atmospheric Environment 28 (16), 2691–2713.
Le Tertre, A., Medina, S., Samoli, E., Forsberg, B., Michelozzi,
P., Boumghar, A., Vonk, J.M., Bellini, A., Atkinson, R.,
Ayres, J.G., Sunyer, J., Schwartz, J., Katsouyanni, K., 2002.
Short-term effects of particulate air pollution on cardiovas-
cular diseases in eight European cities. Journal of Epide-
miology and Community Health 56 (10), 773–779.
Mathys, P., Stern, W.B., Oglesby, L., Braun-Fahrlander, C.,
Ackermann-Liebrich, U., Jantunen, M., Kunzli, N., 2001.
Elemental analysis of airborne particulate matter by ED-
XRF within the European EXPOLIS study. ICP Informa-
tion Newsletter 27 (3), 190–195.
Mathys, P., Oetterli, C., Stern, W.B., Oglesby, L., Hazenkamp-
von Arx, M.E., Kuenzli, N., 2002. Elemental analysis of
PM2.5 samples collected in the framework of the ECRHS II
study: description of methods http://www.ecrhs.org/reports/
wp7report.pdf.
Matthias-Maser, S., Jaenicke, R., 1994. Examination of atmo-
spheric bioaerosol particles with radii 40.2mm. Journal ofAerosol Science 25 (8), 1605–1613.
Naef, R., Xhillari, D., 2000. Finale report of work package 5:
historic data of ambient air pollution in 37 European
Cities of ECRHS I and II http://www.ecrhs.org/reports/
FINAL%20REPORT%20WP5%20ECRHS%20II.pdf.
Pacyna, J.M., Larssen, S., Semb, A., 1991. European survey for
NOx emissions with emphasis on Eastern Europe. Atmo-
spheric Environment. Part A. General Topics 25 (2),
425–439.
Press, F., Siever, R., 1997. Understanding Earth. W.H. Free-
man, New York.
Putaud, J.-P., Raes, F., Van Dingenen, R., Bruggemann, E.,
Facchini, M.-C., Decesari, S., Fuzzi, S., Gehrig, R., Huglin,
C., Laj, P., 2004. A European aerosol phenomenology—2:
chemical characteristics of particulate matter at kerbside,
urban, rural and background sites in Europe. Atmospheric
Environment 38 (16), 2579–2595.
Querol, X., Alastuey, A., Rodriguez, S., Plana, F., Ruiz, C.R.,
Cots, N., Massague, G., Puig, O., 2001. PM10 and PM2.5
source apportionment in the Barcelona Metropolitan
area, Catalonia, Spain. Atmospheric Environment 35 (36),
6407–6419.
Rodriguez, S., Querol, X., Alastuey, A., Mantilla, E., 2002.
Origin of high summer PM10 and TSP concentrations at
rural sites in Eastern Spain. Atmospheric Environment 36
(19), 3101–3112.
Rodriguez, S., Querol, X., Alastuey, A., Viana, M.-M.,
Alarcon, M., Mantilla, E., Ruiz, C.R., 2004. Comparative
PM10–PM2.5 source contribution study at rural, urban and
industrial sites during PM episodes in Eastern Spain.
Science of The Total Environment 328 (1–3), 95–113.
Roemer, W., Hoek, G., Brunekreef, B., Clench-Aas, J.,
Forsberg, B., Pekkanen, J., Schutz, A., 2000. PM10
elemental composition and acute respiratory health effects
in European children (PEACE project). Pollution effects on
asthmatic children in Europe. European Respiratory
Journal 15 (3), 553–559.
Roorda-Knape, M.C., Janssen, N.A.H., De Hartog, J.J., Van
Vliet, P.H.N., Harssema, H., Brunekreef, B., 1998. Air
pollution from traffic in city districts near major motorways.
Atmospheric Environment 32 (11), 1921–1930.
Roosli, M., Theis, G., Kunzli, N., Staehelin, J., Mathys, P.,
Oglesby, L., Camenzind, M., Braun-Fahrlander, C., 2001.
Temporal and spatial variation of the chemical composition
of PM10 at urban and rural sites in the Basel area,
Switzerland. Atmospheric Environment 35 (21), 3701–3713.
Schauer, J.J., 2003. Evaluation of elemental carbon as a marker
for diesel particulate matter. Jornal of Exposure Analysis
and Environmental Epidemiology 13 (6), 443–453.
Tanner, R.L., Parkhurst, W.J., Valente, M.L., David Phillips, W.,
2004. Regional composition of PM2.5 aerosols measured at
urban, rural and background sites in the Tennessee valley.
Atmospheric Environment 38 (20), 3143–3153.
US Environmental Protection Agency, 1990. Air Emission
Species Manual, Volume II: Particulate Matter Species
Profiles. second ed. Research Triangle Park.
US EPA, 2003. Air Quality Criteria Document for Particulate
Matter (Fourth External Review Draft). Research Triangle
Park, NC, US Environmental Protection Agency Office
of Research and Development, National Center For
Environmental Assessment http://cfpub.epa.gov/ncea/cfm/
partmatt.cfm?ActType=default.
Viana, M., Querol, X., Alastuey, A., Gangoiti, G., Menendez,
M., 2003. PM levels in the Basque Country (Northern
Spain): analysis of a 5-year data record and interpretation
of seasonal variations. Atmospheric Environment 37 (21),
2879–2891.
WHO, 1984. Environmental Health Criteria 24: Titanium.
United Nations Environment Programme, International
Labour Organization, World Health Organization,
Geneva http://www.inchem.org/documents/ehc/ehc/ehc24.
htm ]SubSectionNumber:1.1.2.WHO, 2000. Air Quality Guidelines for Europe. World Health
Organization, Copenhagen.
WHO, 2003. Health Aspects of Air Pollution with Particulate
Matter, Ozone and Nitrogen Dioxide. World Health
Organization, Bonn, p. 98.
Yao, X., Fang, M., Chan, C.K., 2001. Experimental study of
the sampling artifact of chloride depletion from collected
sea salt aerosols. Environmental Science and Technology
35 (3), 600–605.
Zhu, Y., Hinds, W.C., Kim, S., Shen, S., Sioutas, C., 2002a.
Study of ultrafine particles near a major highway with
heavy-duty diesel traffic. Atmospheric Environment 36 (27),
4323–4335.
Zhu, Y., Hinds, W.C., Kim, S., Sioutas, C., 2002b. Concentra-
tion and size distribution of ultrafine particles near a major
highway. Journal of Air Waste Management Association
52 (9), 1032–1042.