
Comparing satellite derived precipitation datasets using the Hillslope River Routing (HRR) model in...
14
HYDROLOGICAL PROCESSES Hydrol. Process. 25, 3216–3229 (2011) Published online 28 March 2011 in Wiley Online Library (wileyonlinelibrary.com) DOI: 10.1002/hyp.8045 Comparing satellite derived precipitation datasets using the Hillslope River Routing (HRR) model in the Congo River Basin R. E. Beighley, 1 * R. L. Ray, 2 Y. He, 2 H. Lee, 3 L. Schaller, 4 K. M. Andreadis, 5 M. Durand, 6 D. E. Alsdorf 7 and C. K. Shum 8 1 Associate Professor, Civil, Construction and Environmental Engineering, San Diego State University, San Diego, CA 92182, USA 2 Post-Doctoral Researcher, Civil, Construction and Environmental Engineering, San Diego State University, USA 3 Research Associate, School of Earth Sciences, The Ohio State University, Columbus, Ohio, 43210, USA 4 Undergraduate Researcher, School of Earth Sciences, The Ohio State University, USA 5 Post-doctoral Researcher, Byrd Polar Research Center, The Ohio State University, USA 6 Assistant Professor, School of Earth Sciences, The Ohio State University, USA 7 Associate Professor, School of Earth Sciences, The Ohio State University, USA 8 Professor, School of Earth Sciences, The Ohio State University, USA Abstract: In this paper, three satellite derived precipitation datasets (TRMM, CMORPH, PERSIANN) are used to drive the Hillslope River Routing (HRR) model in the Congo Basin. The precipitation data are compared spatially and temporally in two forms: (1) precipitation magnitudes, and (2) resulting streamflow and water storages. Simulated streamflow is assessed using historical monthly discharge data from in situ stream gauges and recent stage data based on water surface elevations derived from ENVISAT radar altimetry data. Simulated total water storage is assessed using monthly storage change values derived from GRACE data. The results show that the three precipitation datasets vary significantly in terms of magnitudes but generally produce a reasonable hydrograph throughout much of the basin, with the exception of the equatorial regions of the watershed. The satellite datasets provide unreasonably high values for specific periods (e.g. all three in Oct–Nov; only CMORPH and PERSIANN in Mar–Apr) in the equatorial regions. Overall, TRMM (3B42) provides the best spatial and temporal distributions and magnitudes or rainfall based on the assessment measures used here. Both CMORPH and PERSIANN tend to overestimate magnitudes, especially in the equatorial regions of the Basin. Copyright 2011 John Wiley & Sons, Ltd. KEY WORDS grace; envisat; trmm; cmorph; persiann; Congo River Basin Received 30 April 2010; Accepted 28 January 2011 INTRODUCTION Precipitation is arguably the most important variable in hydrological modelling. However, in situ measurements are either very sparse, discontinuous, or completely lacking in many part of the world (Dai et al., 2007; Asadullah et al., 2008; Hossain and Huffman, 2008; Sapiano and Arkin, 2009). At present, satellite rainfall data are available at useful spatial (0Ð25 ° grids) and temporal (3–6 h) resolutions for the entire tropics and middle latitudes (Dai et al., 2007). Owing to their near global spatial coverage and improving temporal and spatial resolutions, satellite derived precipitation data enable the study of climate and hydrology in areas where it is almost impossible to obtain in situ measurements (Artan et al., 2007). Numerous researchers have examined the quality of satellite derived precipitation datasets, such as the Trop- ical Measuring Mission (TRMM), Climate Prediction * Correspondence to: R. E. Beighley, Civil, Construction and Envi- ronmental Engineering, San Diego State University, San Diego, CA 92182, USA. E-mail: [email protected] Center MORPHing Technique (CMORPH), and Precip- itation Estimation from Remotely Sensed Information using Artificial Neural Network (PERSIANN), in vari- ous regions of the world (e.g. de Goncalves et al., 2006; Dai et al., 2007; Dinku et al., 2007, 2008; Ruane and Roads, 2007; Asadullah et al., 2008; Nesbitt et al., 2008; Zhou et al., 2008; Stisen and Sandholt, 2009). Note, the three rainfall products will be abbreviated as fol- lows throughout the text: TRMM (TR), CMORPH (CM) and PERSIANN (PE). However, it is still unclear as to which precipitation product is ‘best’ over different regions because of disagreement among satellite obser- vations. For example, Nesbitt et al. (2008) found that the CM and PE estimate higher rainfall rates relative to TR in the Sierra Madre Occidental (i.e. the western Mex- ico mountain range running approximately north–south) whereas Dinku et al. (2008) found that the TR and CM performance is better in Ethiopia and Zimbabwe. In con- trast, de Goncalves et al. (2006) found PE performance is better than TR in South America. Most of these stud- ies are conducted where in situ rainfall measurements are available such as North America, South America, and Europe. On the other hand, few studies examining Copyright 2011 John Wiley & Sons, Ltd.
Transcript of Comparing satellite derived precipitation datasets using the Hillslope River Routing (HRR) model in...

HYDROLOGICAL PROCESSESHydrol. Process. 25, 3216–3229 (2011)Published online 28 March 2011 in Wiley Online Library(wileyonlinelibrary.com) DOI: 10.1002/hyp.8045
Comparing satellite derived precipitation datasetsusing the Hillslope River Routing (HRR) model
in the Congo River Basin
R. E. Beighley,1* R. L. Ray,2 Y. He,2 H. Lee,3 L. Schaller,4 K. M. Andreadis,5 M. Durand,6
D. E. Alsdorf7 and C. K. Shum8
1 Associate Professor, Civil, Construction and Environmental Engineering, San Diego State University, San Diego, CA 92182, USA2 Post-Doctoral Researcher, Civil, Construction and Environmental Engineering, San Diego State University, USA
3 Research Associate, School of Earth Sciences, The Ohio State University, Columbus, Ohio, 43210, USA4 Undergraduate Researcher, School of Earth Sciences, The Ohio State University, USA
5 Post-doctoral Researcher, Byrd Polar Research Center, The Ohio State University, USA6 Assistant Professor, School of Earth Sciences, The Ohio State University, USA7 Associate Professor, School of Earth Sciences, The Ohio State University, USA
8 Professor, School of Earth Sciences, The Ohio State University, USA
Abstract:
In this paper, three satellite derived precipitation datasets (TRMM, CMORPH, PERSIANN) are used to drive the HillslopeRiver Routing (HRR) model in the Congo Basin. The precipitation data are compared spatially and temporally in two forms:(1) precipitation magnitudes, and (2) resulting streamflow and water storages. Simulated streamflow is assessed using historicalmonthly discharge data from in situ stream gauges and recent stage data based on water surface elevations derived fromENVISAT radar altimetry data. Simulated total water storage is assessed using monthly storage change values derived fromGRACE data. The results show that the three precipitation datasets vary significantly in terms of magnitudes but generallyproduce a reasonable hydrograph throughout much of the basin, with the exception of the equatorial regions of the watershed.The satellite datasets provide unreasonably high values for specific periods (e.g. all three in Oct–Nov; only CMORPH andPERSIANN in Mar–Apr) in the equatorial regions. Overall, TRMM (3B42) provides the best spatial and temporal distributionsand magnitudes or rainfall based on the assessment measures used here. Both CMORPH and PERSIANN tend to overestimatemagnitudes, especially in the equatorial regions of the Basin. Copyright 2011 John Wiley & Sons, Ltd.
KEY WORDS grace; envisat; trmm; cmorph; persiann; Congo River Basin
Received 30 April 2010; Accepted 28 January 2011
INTRODUCTION
Precipitation is arguably the most important variable inhydrological modelling. However, in situ measurementsare either very sparse, discontinuous, or completelylacking in many part of the world (Dai et al., 2007;Asadullah et al., 2008; Hossain and Huffman, 2008;Sapiano and Arkin, 2009). At present, satellite rainfalldata are available at useful spatial (0Ð25° grids) andtemporal (3–6 h) resolutions for the entire tropics andmiddle latitudes (Dai et al., 2007). Owing to their nearglobal spatial coverage and improving temporal andspatial resolutions, satellite derived precipitation dataenable the study of climate and hydrology in areas whereit is almost impossible to obtain in situ measurements(Artan et al., 2007).
Numerous researchers have examined the quality ofsatellite derived precipitation datasets, such as the Trop-ical Measuring Mission (TRMM), Climate Prediction
* Correspondence to: R. E. Beighley, Civil, Construction and Envi-ronmental Engineering, San Diego State University, San Diego, CA92182, USA. E-mail: [email protected]
Center MORPHing Technique (CMORPH), and Precip-itation Estimation from Remotely Sensed Informationusing Artificial Neural Network (PERSIANN), in vari-ous regions of the world (e.g. de Goncalves et al., 2006;Dai et al., 2007; Dinku et al., 2007, 2008; Ruane andRoads, 2007; Asadullah et al., 2008; Nesbitt et al., 2008;Zhou et al., 2008; Stisen and Sandholt, 2009). Note,the three rainfall products will be abbreviated as fol-lows throughout the text: TRMM (TR), CMORPH (CM)and PERSIANN (PE). However, it is still unclear asto which precipitation product is ‘best’ over differentregions because of disagreement among satellite obser-vations. For example, Nesbitt et al. (2008) found that theCM and PE estimate higher rainfall rates relative to TRin the Sierra Madre Occidental (i.e. the western Mex-ico mountain range running approximately north–south)whereas Dinku et al. (2008) found that the TR and CMperformance is better in Ethiopia and Zimbabwe. In con-trast, de Goncalves et al. (2006) found PE performanceis better than TR in South America. Most of these stud-ies are conducted where in situ rainfall measurementsare available such as North America, South America,and Europe. On the other hand, few studies examining
Copyright 2011 John Wiley & Sons, Ltd.

COMPARING SATELLITE PRECIPITATION IN THE CONGO RIVER BASIN 3217
the quality of satellite rainfall using in situ rainfall orstream flow measurements have been conducted in Africabecause many African countries have sparse or no surfacemeteorological stations (Nicholson et al., 2003). There-fore, it is challenging to validate hydrologic model outputand satellite rainfall products in this region.
Specific to Africa, Asadullah et al. (2008) examinedTR, CM, and PE rainfall datasets in East Africa (Uganda)and found large quantitative differences among the prod-ucts. They have recommended using more than one satel-lite rainfall product for quality assessment. Recently,Stisen and Sandholt (2009) evaluated five satellite prod-ucts including TR, CM, and PE in the Senegal RiverBasin using the MIKE SHE (DHI, 2007) hydrologicalmodel. They found that TR performs better than the othersatellite products in this basin. In comparison, CentralAfrica has even fewer studies focused on rainfall qualityassessment and hydrologic modelling compared to otherregions in Africa (Laraque et al., 2001). Moreover, theCongo River Basin in Central Africa, which is the sec-ond largest watershed in the world (i.e. 3Ð7 million km2),has limited hydrologic studies due to lack of in situ rain-fall and stream flow measurements after 1990. Someresearchers have compared satellite rainfall distributionsin the Congo and Amazon River Basins and identi-fied cross correlations between rainfall distributions fromthese two basins (e.g., Eltahir et al., 2004; Tazalika andJury, 2008; Molinier et al., 2009). However, they did notexamine the quality of satellite rainfall products in theCongo River Basin. Negron Juarez et al. (2009) com-pared several satellite derived precipitation datasets overAfrica and found that the least favourable results werefor the Congo Basin. Since essentially no in situ mea-surements are available after 1990, Crowley et al. (2006)studied water storage change using Gravity Recovery andClimate Experiment (GRACE) in combination with TRsatellite rainfall in Congo River Basin. In addition, Werth
et al. (2009) evaluated the WaterGAP Global Hydrol-ogy Model using GRACE water storage anomalies andin situ streamflow in three large river basins; the Amazon,Congo, and Mississippi. They used the monthly GlobalPrecipitation Climatology Center’s (GPCC) rainfall prod-uct and monthly streamflow data (1903–1983) in CongoRiver Basin. Although they did not examine the qual-ity of the satellite products, they recommended the useof GRACE data in a limited data region such as CongoRiver Basin for model improvement.
In this study, three satellite derived precipitationdatasets (TR, CM, PE) are used to assess their appli-cability in terrestrial rainfall-runoff modelling using theHillslope River Routing (HRR) model. The HRR modelsimulates vertical water and energy balance, lateral sur-face and subsurface runoff using kinematic waves, andchannel and floodplain discharge using diffusion wavemethodologies (Beighley et al., 2009). Using the HRRmodel, three sources of rainfall data are used to quantifysimulated discharge accuracy based on historical monthlystreamflow, ENVISAT derived water surface heights, andGRACE derived changes in monthly water storages. Thisstudy also examines the quality of satellite rainfall andpredictive capability of HRR model at sub-basin scales(¾10 000–1 000 000 km2).
STUDY SITE
This study was performed in the Congo Basin, theworld’s second largest river basin (3Ð7 million km2) andeighth longest river (4700 km), which crosses the equatortwice (Laraque et al., 2001). The Congo Basin is primar-ily covered by tropical rain forest. This basin is definedby the area within 5 °N–10 °S latitude and 15° –30 °Elongitude (Figure 1). At peak flow, the discharge to the
Figure 1. Congo River Basin with Pfafstetter Level 1 sub-divisions, stream locations, flow gauge locations (crosses) and ENVISAT sites (squares)used in the study
Copyright 2011 John Wiley & Sons, Ltd. Hydrol. Process. 25, 3216–3229 (2011)

3218 R. E. BEIGHLEY ET AL.
Table I. Summary of historical streamflow data
GaugeID
Area (km2) Period Meanannual
Q (m3/s)
Meanannual
Q (mm)
10 500 000 1911–1990 4038 255948 158 400 1947–1983 1662 3311534 3 475 000 1903–1983 40 190 3651538 33 790 1976–1979 193 181
ocean is over 60 000 m3s�1 with a mean annual flowof approximately 40 000 m3s�1 (i.e. contributes approxi-mately 3Ð5 mm/yr to global sea level). Given this researchfocuses on satellite derived rainfall products, it is alsoimportant to note that the Congo Basin is subjected tosignificant lighting activity (Williams and Satori, 2004).
The period of study, 1 Jan 2003–31 Dec 2008, wasselected to ensure continuous coverage of all the satel-lite derived and remotely monitored datasets required todrive the HRR. However, much of the in situ stream-flow data are not available for this period. Here, meanmonthly streamflow determined from the historical data(i.e. 1903–1990) are used to assess the model results(i.e. 2003–2008). Although measured and modelled dis-charges are compared in this study, we highlight thefact that the resulting model assessment is limited dueto the different sample periods. The four streamflowgauges used in this study are shown in Figure 1 andlisted in Table I. The streamflow data were obtainedfrom the Global River Discharge Database (Coe andOlejniczak, 1999). The drainage areas for the selectedgauges range from 0Ð034 to 3Ð47 million km2 (Table I).For these gauges, mean annual discharge ranges from190 to 40 200 m3s�1 and mean annual runoff rangesfrom about 180 to 365 mm. Although the period of sam-pling differs for each gauge (Table I), the collective datacovers the period from 1903 to 1990. In addition, approx-imately monthly water surface elevations obtained fromENVISAT (Figure 1) for six locations are used. Thus,mean monthly streamflow data, ENVISAT altimetry dataand GRACE derived water storages are used to assess themodel results for the purpose of quantifying the impactsof rainfall dataset on streamflow.
METHODOLOGIES
Landscape representation
In this study, surface topography is approximated bythe second version of the 3-arc sec (¾90 m) digital ele-vation model (DEM) developed from NASA’s ShuttleRadar Topography Mission (SRTM) (Farr et al., 2007;Moglen and Beighley, 2000). The DEM was used todefine flow directions, ground slopes and the result-ing drainage network (Lehner et al., 2008). The datasetsused for this research were obtained from HydroSHEDS(http://hydrosheds.cr.usgs.gov). Note, STRM verticalaccuracy is on the order of 1–10 m and is impacted
by vegetation (i.e. top of vegetation vs ground surfaceelevation) and other artifacts. For the purpose of identi-fying channel locations and sub-basin boundaries, theselimitations are not significant. However, SRTM derivedchannel slopes are problematic, and it is also not pos-sible to derive channel cross-sections. Figure 1 showsthe Congo Basin delineated to Pfafstetter (PFAF) level1 (i.e. units 1–9 per the methods described by Verdinand Verdin, 1999). This Pfafstetter discretisation frame-work is a natural system, based on topographic subdi-vision of the land surface and the resulting topology ofthe hydrographic network. The appeal of the Pfafstet-ter approach stems from its economy of digits used tonumber the topographic units, the topological informationthat the digits carry, and the facility with which it lendsitself to computational parallelisation. The Congo Basinwas ultimately delineated to Pfafstetter level 4 using athreshold area of ¾8Ð1 km2 (1000 pixels). The resultingnumber of sub-basins is 5498. At level 4, the medianmodel unit drainage area is 670 km2 ranging from <1 to25 750 km2. The mean hillslope length is 5Ð4 km rang-ing from 61 m to 70 km, and channel reaches are onaverage 36 km ranging from 93 m to 720 km. The meanhillslope gradient is 4Ð8% ranging from ¾0 to 28%, andchannel slopes are on average 0Ð9% ranging from ¾0to 32%.
Since HRR requires channel/floodplain cross-sections,a rectangular section was assumed and the relationshipbetween channel width and upstream drainage area wasdeveloped based on measurements of channel widthsfrom low-water Global Rainforest Mapping (Rosenqvistet al., 2000) images (3-arc-sec) at 38 locations:
w D 0Ð438A0Ð592u R2 D 0Ð70 �1�
where w is the combined channel/floodplain width(m) and Au is the upstream drainage area (km2). Note,this data source captures low-flow conditions and doesnot illustrate the potential floodplain extent. Althoughthis likely underestimates the effective channel/floodplainwidth at the measured sites, it is a reasonable place-holder until a more detailed analysis, such as the workdescribed in Beighley and Gummadi (2010) and Coeet al. (2008), can be performed. For example, Figure 2shows that although the general trend is strong, thedata vary from site to site. Secondly, although flowwidths are critical for simulating water surface ele-vations, the effect of channel width error on sim-ulated discharge is minimal (i.e. <10%) (Gummadi,2008). Thus, the relationship developed here with lim-ited data is assumed to be reasonable and used toapproximate channel/floodplain widths for the HRRmodel, but this highlights the need for additionalresearch on characterising floodplains in the Congo RiverBasin.
Precipitation datasets
This study used TR, CM and PE satellite rainfalldatasets because of their similar high spatial and temporal
Copyright 2011 John Wiley & Sons, Ltd. Hydrol. Process. 25, 3216–3229 (2011)

COMPARING SATELLITE PRECIPITATION IN THE CONGO RIVER BASIN 3219
y = 0.4375x0.5916
R2 = 0.699
1E+2
1E+3
1E+4
1E+4 1E+5 1E+6 1E+7
Wid
th (
m)
Drainage Area (km2)
Figure 2. Relationship between channel width and upstream drainage areafor 38 locations spread throughout the Congo River Basin
resolutions as well as near global coverage. The spatialand temporal characteristics of each dataset includingreferences are summarized in Table II. In this study,the sub-daily data (3- or 6-h) from all three datasetswere aggregated to daily data for the period 1 Jan2003–31 Dec 2008. During the 6 years, 98 days (<5%)are missing in PE with only 8 and 2 days missing forTR and CM, respectively. To fill the missing days, anaverage rainfall value from the nearest pixels in the otherdatasets was used.
The TR instrument was launched on 27 November1997 as a joint effort by NASA and the Japanese SpaceAgency (Kummerow et al., 1998, Gao et al., 2006). TR
provides precipitation data from December 1997 to thepresent (available from http://TRMM.gsfc.nasa.gov). SeeTable II for additional product details. For the 3B42 prod-uct used here, four steps are performed: (1) microwave(MW) precipitation estimates are calibrated and com-bined, (2) infrared (IR) precipitation estimates are cre-ated using the calibrated MW precipitation, (3) MW andIR estimates are combined, and (4) rescaling to matchmonthly gauge data is applied. See http://trmm.gsfc.nasa.gov/3b42.html for more details.
The CMORPH (CM) product is a global rainfalldataset at high spatial (8–27 km) and temporal (0Ð5-h–24-h) resolutions. Table II gives additional productdetails. The product is based on precipitation estimatesderived exclusively from low orbiter satellite microwaveobservations, and whose features are transported via spa-tial propagation information obtained from geostation-ary satellite infrared data (Ruane and Roads, 2007).For details on CM and to obtain data, see http://www.cpc.ncep.noaa.gov/products/janowiak/cmorphdescription.html.
The PE product is based on the use of artificialneural networks to compute rainfall rates using infraredbrightness temperature of clouds from geostationarysatellites (Hong et al., 2005). The geostationary satellites;GOES-8, GOES-10, GMS-5, Meteosat-6, and Meteosat-7 and low orbital satellites such as TR, NOAA, DMSPare used in the rainfall data processing. See Table II foradditional details. The PE products can be obtained from
Table II. Summary of satellite datasets
Datasets Input data sources andmerging
Spatial and temporalresolution
Data coverage References
TRMM 3B42 Geo-IR, SSM/I, AMSU,TRMM, AMSR, Gages
0Ð25° grid, 3-h 50 °S–50 °N Huffman et al., 2007
1/1998 to present
CMORPH Geo-IR, SSM/I, AMSU,TRMM, and AMSR
0Ð25° grid, 30-min 60 °S–60 °N Joyce et al., 2004
12/2002 to present
PERSIANN Geo-IR, TRMM, NOAA,DMSP
0Ð25° grid, 1-h 60 °S–60 °N Hsu et al., 1997
3/2000 to present
Water storage anomalies GRACE >300 km, monthly Global Guo et al., 2010; Duanet al., 2009
3/2002 to present
Altimetry (18-Hz) ENVISAT ¾350 m alongtrack sampling,35 days
81Ð5 °S–81Ð5 °N Benveniste, 2002
2003 to present
Additional datasetsLeaf Area Index MOD15BU 0Ð25° grid, monthly Global, 3/2000 to
presentAerosol optical depth MOD08M3 1° grid, monthly Global, 3/2000 to
presentAlbedo (B&W sky) MCD43C3 0Ð05° grid, 8-day Global, 2/2000 to
presentAir temperature MOD11C3 0Ð05° grid, monthly Global, 3/2000 to
present
Copyright 2011 John Wiley & Sons, Ltd. Hydrol. Process. 25, 3216–3229 (2011)

3220 R. E. BEIGHLEY ET AL.
the following site: http://chrs.web.uci.edu/persiann/data.html.
Water storage anomalies (GRACE) and stagemeasurements (ENVISAT)
The GRACE satellite was launched on 17 March 2002for the mapping of the global gravity field and its tempo-ral variation. It enables satellite-to-satellite tracking usingmicrowave inter-satellite ranging, designed to map theglobal gravitational signal with a resolution of 400 kmor more, and a temporal resolution of one month (Tap-ley et al., 2004). GRACE is capable of observing stor-age change anomalies in the form of water thicknesschange (Wahr et al., 2006) over a basin. Examples of theGRACE hydrologic studies include estimating water stor-age changes over the Amazon Basin (Han et al., 2005;Schmidt et al., 2006, 2008), the Congo Basin (Crowleyet al., 2006), and in Bangladesh (Andersen et al., 2008).In this study, we used 86 monthly gravity solutions, forthe period January 2003–December 2008 from Centerfor Space Research (CSR) GRACE level 2 (L2) release-04 (RL04) data products, which are used to computemonthly storage change anomalies on a 1° ð 1° grid. Toreduce the GRACE longitudinal stripes associated withcorrelations among even or odd degree spherical har-monic coefficients at resonant orders and manifest ashigh-frequency errors (Swenson and Wahr, 2006; Chenet al., 2009), decorrelation based on Duan et al. (2009)was used. Finally, smoothing using a 3-degree Gaussianfilter and land signal leakage correction were applied(Guo et al., 2010). Geocenter motion which is unob-servable by GRACE is added using a solution based onsatellite laser ranging to geodetic satellites, and a cor-rection to account for the glacial isostatic adjustmentprocess due to deglaciation of Last Pleistocene ice-sheetsis applied using the ICE-4G(VM2) model. The resultingGRACE storage change data have a spatial resolution of300 km, as opposed to the 600-km resolution data usedby Crowley et al. (2006).
The ENVISAT altimeter data used in this study arefrom the periods of January 2003 to December 2008. TheEnvisat orbits has a 35-day repeat cycle with 98Ð5° incli-nation. The Envisat Geophysical Data Record contains18 Hz re-tracked measurements, which correspond to analong-track sampling of approximately 350 m. There arefour different re-trackers: OCEAN, ICE-1, ICE-2, andSEA ICE re-trackers (Benveniste, 2002). In this study,we use ICE-1 (Bamber, 1994) re-tracked measurementswhich have been demonstrated to be the most suitablefor inland water bodies (Frappart et al., 2006; Lee et al.,2010). The instrument corrections, media corrections (drytroposphere correction, wet troposphere correction cal-culated by the French Meteorological Office from theEuropean Centre for Medium-Range Weather Forecastsmodel, and the ionosphere correction based on GlobalIonosphere Maps), and geophysical corrections (orbit,solid Earth, and pole tides) have been applied. In addi-tion, the 5Ð6 m level Ultra Stable Oscillator anomalies forEnvisat cycles 44–77 were corrected using the European
Space Agency’s correction tables (J. Benveniste, personalcommunications, 2007).
Water balance model
The Water Balance Model (WBM) represents the verti-cal fluxes and stores of water in and through the canopyand soil layers based on the conservation of mass andenergy. The subsurface zone is separated into two layers:the upper layer or root zone supporting evapotranspiration(ET), and the lower layer, supporting horizontal rout-ing. The upper layer is characterized by a rooting depthand a plant-available water capacity (Webb et al., 2000);the lower layer by a hydraulic conductivity and drain-able porosity. The canopy is characterized by leaf areaindex (LAI), resistance factors for the impedance of vaportransport, and a precipitation interception factor. The ETis the sum of wet canopy evaporation, dry canopy transpi-ration and evaporation from saturated soil surfaces basedon the potential ET using Penman-Monteith indirectlythrough the temperature-based method of estimating itsdata sources developed by Allen et al. (1998). Infiltra-tion is total rainfall minus canopy interception and thefraction of rainfall falling on saturated surfaces. In eachtime step, the WBM passes two sources of water to therouting model: water available for surface runoff (Ts) andwater transferred to the lower soil layer (D); both quanti-ties have units of depth per time and are integrated overplane area in the routing model.
The WBM is described in detail by Beighley et al.(2009). In this application, the model uses 8-day black-and-white sky albedo and cloud cover to estimate bluesky albedo for use in the ET calculation. Table II providesa summary of the drivers used to estimate ET in theWBM. In terms of model parameterisation, the maximumsoil moisture deficit in the upper soil layer (�m D �f ��w), where �f is soil moisture content at field capacityand �w is soil moisture at the permanent wilting point, iscritical and initially based on soil characteristics obtainedfrom Webb et al. (2000). From this reference point, �m
was calibrated.
Routing model
Routing is performed using one-dimensional flowequations. In particular, the methods used are: (i) thekinematic wave method for surface and subsurface runofffrom plane elements, and (ii) Muskingum-Cunge (MC)routing for channels and floodplains. These methods arewell proven and described by numerous authors (e.g.Chow, 1959; Mahmood and Yevjevich, 1975; Maidment,1992). Relative to the methods describing HRR inBeighley et al. (2009), this application combines thechannel and floodplain into one continuous cross-sectionwith no lateral separation of flows. The reason for using acomposite cross-section in the Congo is due to the lack ofavailable bankfull characteristics (e.g. discharge, depth,and width). For example, Beighley and Gummadi (2011)provide detailed characteristics for the Amazon Basin. Asimilar study is needed for the Congo to fully implementseparate channel and floodplain routing.
Copyright 2011 John Wiley & Sons, Ltd. Hydrol. Process. 25, 3216–3229 (2011)

COMPARING SATELLITE PRECIPITATION IN THE CONGO RIVER BASIN 3221
In terms of model parameterisation, there are threeimportant routing parameters: hillslope surface roughness(k), subsurface horizontal conductivity (Kh) and channelroughness (n). The most sensitive parameter is horizontalconductivity due to its scale dependence. For example,hillslope lengths range from 61 m to 70 km (median D5Ð4 km) for the level 4 model. For the larger length, wateris assumed to remain in the subsurface for the entirehillslope length (Lp). In reality, it is likely that the watertravelled some distance as subsurface flow (i.e. a distanceLss as a function of Ksat) before discharging into a smallchannel. This channel would then convey the water theremaining hillslope length to the main channel (i.e. adistance Lc as a function of channel velocity, Vc). Thus,for this version of HRR, Kh must represent the combinedflow velocities of the entire model unit’s hillslope length(i.e. Lp ð Kh ¾ Lss ð Ksat C Lc ð Vc). We are currentlyworking on new methods that allow for small tributarychannels (as described above) to intercept both surfaceand subsurface runoff such that runoff does not travel theentire hillslope length defined for the model unit beforetransitioning into channel flow. However, this approachrequires relatively fine scale (<1–10 km) field data forhillslope flowpaths.
RESULTS AND DISCUSSION
This paper examined the TR, CM, and PE rainfall datain the context of HRR model predictions in the CongoRiver Basin. Results are compared and discussed at thesub-basin scale using the level 1 Pfafstetter units (i.e.sub-basins 1–9). The results are mainly presented forPFAF units 6, north of equator; 1 and 9, south of equator,and 4 and 7, bisected by the equator (Figure 1). Previousresearchers found large discrepancies between gauge andsatellite precipitation over equatorial regions in Africa(McCollum et al., 2000; Nicholson et al., 2003). Theyhave suggested careful consideration and analysis in thisregion prior to use of rainfall datasets in modelling. Thispaper first compared three satellite rainfall datasets usingCumulative Distribution Frequency (CDF) and meanmonthly time series analysis for the sub-basins. Second,predicted monthly streamflow (HRR) using 3 present(2003–2008) satellite datasets is compared with theobserved monthly streamflow using historical monthlygage data (4 stations). Third, simulated total water storagechanges for PFAF level 1 sub-basins are compared withmonthly GRACE water storage changes. Fourth, Envisataltimeter stages (6 stations) are used to compare withpredicted daily streamflow.
Comparison of TR, CM and PE precipitation datasets
Figure 3 shows the mean monthly precipitation forPFAF units 1, 2, 4, 6, 7, and 9, and Table III providesthe annual values. The seasonal cycle shows the bimodalrainfall distribution pattern with maximum rainfall val-ues in March/April and again in October/November overthe Congo Basin (Negron Juarez et al., 2009). This
bimodal pattern is most evident in the two sub-basinsthat cross the equator (units 4 and 7) and diminishesas you move from the equator (i.e. unit 9). For bothdry and wet periods, PE and CM consistently estimatedhigher values relative to TR. For example, during thewet periods in unit 7 (i.e. Mar–Apr, Oct–Nov), PE,CM, and TR estimate mean monthly rainfall valuesin the range of 320–400, 300–350, and 120–170 mm,respectively. Interestingly, the wettest month (i.e. Oct)shows the greatest difference among the satellite rainfallproducts. In October for unit 7, TR monthly rainfall isabout 200 and 250 mm lower than CM and PE, respec-tively. Here, we only compare satellite rainfall prod-ucts. While there are a few precipitation gauges in thebasin (e.g. only 22 gauges or approximately 1 gauge per170000 km2 in the Global Historical Climatology Net-work; http://www.ncdc.noaa.gov/oa/climate/ghcn-daily/),the limited coverage is not suitable for comparing iso-lated, point measurements to coarse, remotely sensedproducts.
Results show greatest mean annual rainfall differencesamong the three rainfall datasets in unit 7 (equatorialregion), and the smallest difference in unit 8 (Table III).The magnitudes of the differences are significant. Forexample, in unit 7, mean annual precipitation from TRis approximately 1500 and 2000 mm lower than CM andPE, respectively. Relative to TR, these differences are onthe order of 100130%. In unit 8, annual rainfall from TRis only 180 and 410 mm lower than CM and PE or only18–42%. Although this analysis does not suggest whichsatellite datasets is best (i.e. most comparable to in situgauge data), it clearly shows that the TR estimates arelower relative to both CM and PE throughout the CongoBasin.
Figure 4 shows the CDF plots for daily precipitationdata over the 2003–2008 study period from the satel-lite products spatially averaged over PFAF units 1, 2,4, 6, 7, and 9. For the 6-year period, the results areconsistent throughout the basin, with PE providing themost precipitation, followed closely by CM and a notice-able decrease in TR. For example, in unit 6, TR, CM,and PE estimate precipitation values less than 6, 12, and14 mm/day, respectively, approximately 80% of the time.Although the magnitudes of precipitation are different,especially between TR and the others, all three productscapture the similar overall seasonal distribution patternand duration of no precipitation days (i.e. dry days) rang-ing from over 40% in the south (unit 9) to near zero inunit 7, which contains approximately equal land area onboth sides of the equator (Figure 1). The equatorial linepasses through the southern part of the unit 4 whereas itpasses through the middle of the unit 7. Consequently,unit 7 has a different (i.e. less skewed) rainfall distribu-tion relative to unit 4 and other non-equatorial sub-basins.PFAF unit 7 received some rainfall almost every day.In contrast, unit 4 has no rain ¾5–10% of the timewhile non-equatorial sub-basins have no rain 10–40%of the time in the entire study period. Again, this anal-ysis does not suggest that one satellite datasets is best,
Copyright 2011 John Wiley & Sons, Ltd. Hydrol. Process. 25, 3216–3229 (2011)

3222 R. E. BEIGHLEY ET AL.
0
100
200
300
400
Jan
Feb
Mar
Apr
May Jun
Jul
Aug
Sep Oct
Nov
Dec
Mea
n m
on
thly
rai
nfa
ll (m
m) PFAF 1
0
100
200
300
400
Jan
Feb
Mar
Apr
May Jun
Jul
Aug
Sep Oct
Nov
Dec
Mea
n m
on
thly
rai
nfa
ll (m
m) PFAF 2
0
100
200
300
400
Jan
Feb
Mar
Apr
May Jun
Jul
Aug
Sep Oct
Nov
Dec
Mea
n m
on
thly
rai
nfa
ll (m
m) PFAF 4
0
100
200
300
400
Jan
Feb
Mar
Apr
May Jun
Jul
Aug
Sep Oct
Nov
Dec
Mea
n m
on
thly
rai
nfa
ll (m
m) PFAF 6
0
100
200
300
400
Jan
Feb
Mar
Apr
May Jun
Jul
Aug
Sep Oct
Nov
Dec
Mea
n m
on
thly
rai
nfa
ll (m
m)
PFAF 7
0
100
200
300
400
Jan
Feb
Mar
Apr
May Jun
Jul
Aug
Sep Oct
Nov
Dec
Mea
n m
on
thly
rai
nfa
ll (m
m) PFAF 9
TRMM CMORPH PERSIANN
(a) (b)
(c) (d)
(f)(e)
Figure 3. Mean monthly rainfall from the three rainfall datasets averaged over PFAF units 1, 2, 4, 6, 7, and 9 (Figure 1)
Table III. Mean annual rainfall comparison for three rainfalldatasets
PFAF unit Mean annual (mm)
TRMM CMORPH PERSIANN
1 1432 2012 20342 1372 2403 25403 1546 2429 25234 1485 2278 24845 1583 2599 30896 1227 2484 28767 1498 3014 34848 979 1158 13869 1003 1525 1660
but it clearly shows: (i) that TR estimates are lower rela-tive to both CM and PE throughout the Congo Basin,and (ii) higher skewness in the CDF plots (i.e. moretemporal variation in rainfall) as the sub-basin distancefrom the equator increases. The causes for the differencesamong the three satellite products may be associated withthe different sensors and retrieval algorithms used in therainfall estimates. For example, the TR rainfall retrievalalgorithm uses rain rate estimates from both microwave(MW) and infrared (IR) sensors, whereas, CM and PErainfall retrieval algorithms derived rain rates exclusivelyfrom MW and IR sensors, respectively (Hirpa et al.,2010). Note, the TR algorithm also provides scaling
Copyright 2011 John Wiley & Sons, Ltd. Hydrol. Process. 25, 3216–3229 (2011)

COMPARING SATELLITE PRECIPITATION IN THE CONGO RIVER BASIN 3223
0
10
20
30
40
0 0.2 0.4 0.6 0.8 1
Rai
nfa
ll (m
m)
Probability (%)
PFAF 1
0
10
20
30
40
0 0.2 0.4 0.6 0.8 1
Rai
nfa
ll (m
m)
Probability (%)
PFAF 2
0
10
20
30
40
0 0.2 0.4 0.6 0.8 1
Rai
nfa
ll (m
m)
Probability (%)
PFAF 4
0
10
20
30
40
0 0.2 0.4 0.6 0.8 1
Rai
nfa
ll (m
m)
Probability (%)
PFAF 6
0
10
20
30
40
0 0.2 0.4 0.6 0.8 1
Rai
nfa
ll (m
m)
Probability (%)
PFAF 7
0
10
20
30
40
0 0.2 0.4 0.6 0.8 1
Rai
nfa
ll (m
m)
Probability (%)
PFAF 9
TRMM CMORPH PERSIANN
(a) (b)
(d)(c)
(e) (f)
Figure 4. Comparison of TRMM, CMORPH and PERSIANN Cumulative Distribution Frequency (CDF) curves for PFAF units 1, 2, 4, 6, 7, and 9(Figure 1)
based on monthly rainfall patterns obtained from gaugedata.
Model calibration
Here, model calibration is not intended to exactlymatch hydrographs for each precipitation dataset. Theintent is to provide a reasonable parameter set to comparethe effects of the three precipitation datasets on simulatedwater storage and streamflow. HRR was parameterizedbased on available datasets (e.g. LAI, soils, slopes, flowlengths, etc.) and only four model parameters were usedfor calibration: the maximum soil moisture deficit inthe upper soil layer (�m), hillslope surface roughness(k), subsurface horizontal conductivity (Kh) and channelroughness (n). Basing on Beighley et al. (2009), theseparameters were set to 0Ð1; 33000; 0Ð05 m s�1; and0Ð04. Using all three rainfall datasets, the resultingmonthly streamflow values were compared to historicaldata (streamflow climatology) at the four gauge locations
shown in Figure 1. Basing on those results, it wasevident that both mass and timing could be improved.Thus, the parameters were ultimately altered to �m D 0Ð3;k D 66000; Kh D 0Ð014 m s�1; and n D 0Ð04. Note, thetiming parameters were adjusted to best fit the generaltrends evident in each rainfall product, which producesimilar timing characteristics. In terms of water balance,�m D 0Ð3 maximizes water storage in the rooting zone,which maximizes ET and minimizes runoff. Althoughthe simulated hydrographs appear to best fit the TRresults, �m was maximized to obtain the best fit possiblefor CM and PE. For the routing, the increase in k anddecrease in Kh delays the response times relative to theparameters from Beighley et al. (2009) which focused onthe Amazon Basin. The two routing parameters are scaledependent and in this application, the hillslope lengths areapproximately 50% of the lengths used in the Amazon,which supports both the direction and magnitude oftheir changes. As discussed below, the timing of the
Copyright 2011 John Wiley & Sons, Ltd. Hydrol. Process. 25, 3216–3229 (2011)

3224 R. E. BEIGHLEY ET AL.
0
10
20
30
40
Jan
Feb
Mar
Apr
May Jun
Jul
Aug
Sep Oct
Nov
Dec
Dis
char
ge
(cm
s) T
ho
usa
nd
s
Gauge-10TRMMCMORPHPERSIANN
(a)
0
0.4
0.8
1.2
1.6
Jan
Feb
Mar
Apr
May Jun
Jul
Aug
Sep Oct
Nov
Dec
Dis
char
ge
(cm
s) T
ho
usa
nd
s
Gauge-1538TRMMCMORPHPERSIANN
(b)
0
50
100
150
200
Jan
Feb
Mar
Apr
May Jun
Jul
Aug
Sep Oct
Nov
Dec
Dis
char
ge
(cm
s) T
ho
usa
nd
s
Gauge-1534TRMMCMORPHPERSIANN
(c)
0
2.5
5
7.5
10
Jan
Feb
Mar
Apr
May Jun
Jul
Aug
Sep Oct
Nov
Dec
Dis
char
ge
(cm
s) T
ho
usa
nd
s
Gauge-948TRMMCMORPHPERSIANN
(d)
Figure 5. Comparison of simulated monthly discharge and historical gauge discharge measurements (1903–1990) at four locations (see Figure 1)
hydrographs for the Congo Basin is reasonable forall three precipitation datasets (i.e. reasonable routingparameters). For the TR precipitation, the mass balanceis also good. The mean monthly and annual mass errorsfrom the four gauges range from 12 to 147% and 1 to133%, respectively. However, the CM and PE datasetsresult in a significant increase in annual runoff relativeto the historical gauge data. The mean annual mass errorfrom the four gauges is 154–331%, and 184–426% forCM and PE, respectively. Given that �m D 0Ð3, whichis considered a near maximum value resulting in theminimum runoff, the mass errors from the CM and PEcannot be reduced with model calibration. For example,based on Rawls et al. (1982), effective soil porosityminus wilting point water content (i.e. moisture contentavailable for ET) ranges from approximately 0Ð38 forsand to 0Ð11 for clay, with a mean value of about 0Ð24.
An alternative to investigating annual mass errors isto assess annual rainfall to runoff ratios (i.e. annualrunoff/rainfall). For the Congo Basin, approximately 24%of the rainfall is converted to runoff (Williams and Satori,2004). Using the annual rainfall from the three productsand the annual runoff at the largest gauge (ID 1534,3Ð4M km2), the ratios are 28, 15, and 14% for TR,CM and PE, respectively. The simulated ratios (HRRrunoff/Product rainfall) for TR, CM and PE are 34,57, and 60%, respectively. As stated above, with WBM
parameters selected to maximize ET, ratios for CM andPE are smaller than reported values when compared togauge runoff and larger than reported values based onsimulation results (i.e. too much rainfall in both cases).The TR product generally agrees with reported ratios butalso tends to overestimates rainfall. Again, our intent isto develop a reasonable parameter set that can be usedfor all three datasets in order to assess the effects ofeach precipitation product on model results. Basing on theabove parameters, the following sections compare modelresults from the three rainfall products.
Mean monthly historical gauge and model predictedstreamflow
The rainfall datasets were used to predict daily stream-flow which was averaged to monthly values and com-pared with the mean monthly historical gauge measure-ments at four locations in the Congo Basin. The fourgauges, labeled 1534 and 1538 south of the equator,and 10 and 948 north of the equator, are located inPFAF units 1, 9, 6, and 4, respectively. Figure 5 presentsmean monthly streamflow resulting from HRR drivenwith the three products (2003–2008) and the histori-cal mean monthly gauge data (1903–1990). All threesatellite products clearly showed seasonal variations ineach sub-basin. As expected, non-equatorial sub-basins
Copyright 2011 John Wiley & Sons, Ltd. Hydrol. Process. 25, 3216–3229 (2011)

COMPARING SATELLITE PRECIPITATION IN THE CONGO RIVER BASIN 3225
Table IV. Mean monthly and annual error (%) between historical gauge data and HRR for the three rainfall datasets
Gages Monthly Annual
TRMM CMORPH PERSIANN TRMM CMORPH PERSIANN
10 12 405 556 5 331 426948 57 158 196 27 154 1841534 19 198 254 1 197 2521538 147 215 226 133 204 214
have only one peak flow annually, whereas, the equa-torial sub-basin (unit 4, Figure 5(d)) has two peaks peryear as a result of the annual south–north migration ofthe Intertropical Convergence Zone. The outlet sub-area(unit 1, Figure 5(c)), which integrates upstream drainagesfrom both north and south of the equator, also shows thebimodal hydrograph, especially for CM and PE. As dis-cussed and observed in the previous section, CM andPE estimate higher rainfall than TR. Results show highstreamflow predictions using CM and PE. This resultsupports the Nesbitt et al. (2008) findings that both CMand PE overestimate rainfall. Specifically, the noticeablespike in Mar–Jun streamflow from CM and PE at gauge948 as compared to TR, which shows only a gradualchange. For example, the mean annual mass error is lowat gauges 1534 and 10 (1 and 5%), moderate at gauge948 (27%), and large at gauge 1538 (133%) using TRrainfall. Whereas CM and PE rainfall products producedlarge errors at all four gauges ranging from 154 to 331%for CM and 184 to 426% for PE. Overall, predicted dis-charge patterns from TR shows reasonable agreement ateach station relative to the historical observations. Withthe exception of the Mar–Jun period at gauge 948, CMand PE generally capture the pattern of streamflow butsignificantly overestimate the magnitudes.
Table IV presents mean monthly and annual error inhistorical gauge data to HRR model predictions withthe three rainfall datasets compared to historical gaugedata. Large monthly (and annual) errors, 200–560%(150–330%) and 160–410% (180–430%) were observedusing PE and CM rainfall, respectively. Using TR rain-fall, 12 and 19% monthly and 5 and 1% annual errorwere observed at gauges 10 and 1534, respectively, whilelarger monthly (and annual) errors 60% (30%) and 150%(130%) were observed at gauges 948 and 1538. Note,the possible causes of the above errors are not only dueto uncertainties in satellite rainfall and their algorithms,but also the averaging of cumulative error for the longhistorical gauge datasets, and variations in climate andvegetation for the historical gauge record (1903–1990) ascompared to the current study period (2003–2008), whichnecessitates additional research for conclusive answers.
Comparison of HRR and GRACE water storage
This section discusses the relationship between totalwater storage changes derived from GRACE observationsand the HRR model predictions (i.e. surface runoff, rootzone moisture, subsurface runoff and channel/floodplain
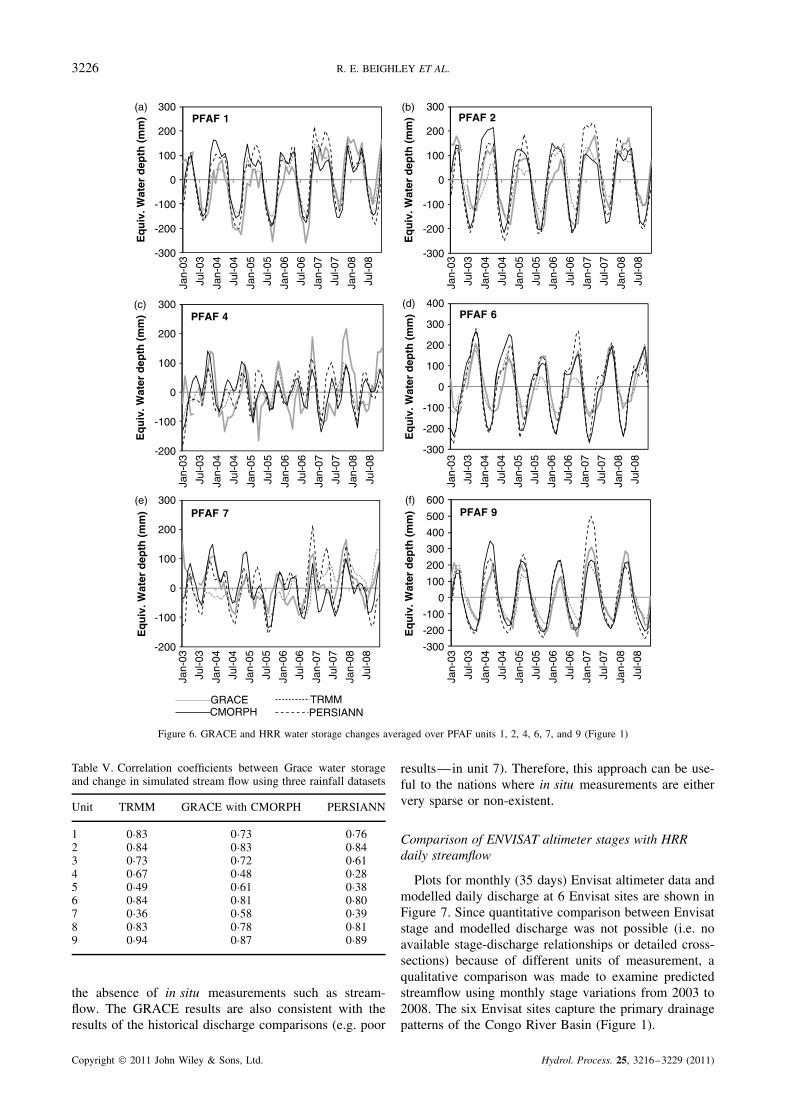
storage) averaged over the PFAF level 1 basins. Figure 6shows the comparison between GRACE and HRR modelpredictions using the three satellite products from 2003to 2008. Note, vertical error bars for GRACE approx-imation are not included in Figure 6 due to the smallsize and variability within the individual plots. How-ever, it should be noted that the uncertainty can be inthe range of approximately C/�25 mm in the CongoBasin (Crowley et al., 2006). The figure clearly showsseasonal and annual variations of water storage in eachsub-basin. In addition, GRACE and the rainfall datasets(CM to less extent) show that 2007 and 2008 were gen-erally wetter than the 2003–2006. From the results, itis clear that all three rainfall datasets capture wet anddry periods reasonably well except for PFAF unit 7.GRACE observations in the non-equatorial basins showlarge positive and negative storages relative to the equa-torial basin. For example, unit 7 shows storage changes ofapproximately š100 mm whereas PFAF 9 shows varia-tions larger than š200 mm. These GRACE observationssupport the fact that non-equatorial sub-basins receivemore rainfall in less time relative to the equatorial sub-basin (PFAF 7) as discussed in the previous section. Incomparison, both PE and CM show higher water storagechanges (too wet or too dry) during the study period. TRgenerally provides good agreement with GRACE obser-vations in the non-equatorial sub-basins. However, noneof the datasets perform well in equatorial sub-basins. Forexample, water storage variations observed by GRACE iscompletely different than predicted water storage changeusing TR, CM, and PE in PFAF 7 for several months peryear.
The correlation coefficients between the GRACEobservations of water storage change and HRR modelstorage change are presented in Table V. The estimatedcorrelation coefficients using PE and CM are lower thanTR except in PFAF units 5 and 7, where CM had thehighest correlations. Note, unit 5 is the smallest sub-basin (0Ð38% of Congo area). It may have little or noinfluence on the water storage observed at that locationfrom GRACE due to its small spatial extent.
Basing on the observed results, this analysis supportsthe findings of Crowley et al. (2006) and Werth et al.(2009) of good performance of GRACE water storagechange observations in the Congo River Basin. Thisstudy, with GRACE at a higher spatial resolution, showsthat GRACE water storage observations can play animportant role in validating hydrologic model results in
Copyright 2011 John Wiley & Sons, Ltd. Hydrol. Process. 25, 3216–3229 (2011)
3226 R. E. BEIGHLEY ET AL.
-300
-200
-100
0
100
200
300
Jan-
03
Jul-0
3
Jan-
04
Jul-0
4
Jan-
05
Jul-0
5
Jan-
06
Jul-0
6
Jan-
07
Jul-0
7
Jan-
08
Jul-0
8
Eq
uiv
. Wat
er d
epth
(m
m) PFAF 1
-300
-200
-100
0
100
200
300
Jan-
03
Jul-0
3
Jan-
04
Jul-0
4
Jan-
05
Jul-0
5
Jan-
06
Jul-0
6
Jan-
07
Jul-0
7
Jan-
08
Jul-0
8
Eq
uiv
. Wat
er d
epth
(m
m) PFAF 2
-200
-100
0
100
200
300
Jan-
03
Jul-0
3
Jan-
04
Jul-0
4
Jan-
05
Jul-0
5
Jan-
06
Jul-0
6
Jan-
07
Jul-0
7
Jan-
08
Jul-0
8
Eq
uiv
. Wat
er d
epth
(m
m) PFAF 4
-300
-200
-100
0
100
200
300
400
Jan-
03
Jul-0
3
Jan-
04
Jul-0
4
Jan-
05
Jul-0
5
Jan-
06
Jul-0
6
Jan-
07
Jul-0
7
Jan-
08
Jul-0
8
Eq
uiv
. Wat
er d
epth
(m
m) PFAF 6
-200
-100
0
100
200
300
Jan-
03
Jul-0
3
Jan-
04
Jul-0
4
Jan-
05
Jul-0
5
Jan-
06
Jul-0
6
Jan-
07
Jul-0
7
Jan-
08
Jul-0
8
Eq
uiv
. Wat
er d
epth
(m
m) PFAF 7
-300
-200
-100
0
100
200
300
400
500
600
Jan-
03
Jul-0
3
Jan-
04
Jul-0
4
Jan-
05
Jul-0
5
Jan-
06
Jul-0
6
Jan-
07
Jul-0
7
Jan-
08
Jul-0
8
Eq
uiv
. Wat
er d
epth
(m
m) PFAF 9
GRACECMORPH
TRMMPERSIANN
(a) (b)
(c) (d)
(f)(e)
Figure 6. GRACE and HRR water storage changes averaged over PFAF units 1, 2, 4, 6, 7, and 9 (Figure 1)
Table V. Correlation coefficients between Grace water storageand change in simulated stream flow using three rainfall datasets
Unit TRMM GRACE with CMORPH PERSIANN
1 0Ð83 0Ð73 0Ð762 0Ð84 0Ð83 0Ð843 0Ð73 0Ð72 0Ð614 0Ð67 0Ð48 0Ð285 0Ð49 0Ð61 0Ð386 0Ð84 0Ð81 0Ð807 0Ð36 0Ð58 0Ð398 0Ð83 0Ð78 0Ð819 0Ð94 0Ð87 0Ð89
the absence of in situ measurements such as stream-flow. The GRACE results are also consistent with theresults of the historical discharge comparisons (e.g. poor
results—in unit 7). Therefore, this approach can be use-ful to the nations where in situ measurements are eithervery sparse or non-existent.
Comparison of ENVISAT altimeter stages with HRRdaily streamflow
Plots for monthly (35 days) Envisat altimeter data andmodelled daily discharge at 6 Envisat sites are shown inFigure 7. Since quantitative comparison between Envisatstage and modelled discharge was not possible (i.e. noavailable stage-discharge relationships or detailed cross-sections) because of different units of measurement, aqualitative comparison was made to examine predictedstreamflow using monthly stage variations from 2003 to2008. The six Envisat sites capture the primary drainagepatterns of the Congo River Basin (Figure 1).
Copyright 2011 John Wiley & Sons, Ltd. Hydrol. Process. 25, 3216–3229 (2011)

COMPARING SATELLITE PRECIPITATION IN THE CONGO RIVER BASIN 3227
Figure 7. Comparisons between Envisat stage measurements and simulated discharge using TRMM, CMORPH and PERSIANN rainfall at sixlocations (Figure 1)
The timing of Envisat high and low stage observa-tions show a good match with high and low dischargepredictions from HRR using all three satellite rainfall.Results show a good agreement between annual peaksat E887, E973, E1001, and E315 (far from the equator)with all three rainfall datasets. However, poor agreementwas observed at E057 and E930, which are closest tothe equator. The Envisat observed annual peaks are inMarch and April at E973 (south of equator) and in Octo-ber and November at E930 (north of equator). Therefore,there is fair agreement among the peak discharge monthsresulting from the satellite rainfall and peak observationsfrom Envisat in the non-equatorial regions. However,for the equatorial region, Envisat altimeter data showvariations not consistent with the simulated streamflowfrom all three rainfall datasets. Overall, like the GRACEwater storage change observations, Envisat stage obser-vations can be used for assessing the hydrologic modelresults in the absence of in situ measurements. Futureefforts will focus on obtaining cross-sections and chan-nel slope for the Envisat locations to enable HRR dis-charge results to be transformed to geo-referenced watersurface elevations for comparison to the Envisat obser-vations.
CONCLUSIONS
This paper presents an application of the Hillslope RiverRouting (HRR) model in the Congo River Basin usingthe TRMM (TR), CMORPH (CM) and PERSIANN(PE) rainfall datasets. The HRR model was implementedon the Pfafstetter level 4 network (5498 sub-basins),and results are presented for Pfafstetter level 1 sub-basins (units 1–9). The presented HRR results are com-pared with 3 different measurement datasets: (i) meanmonthly historical streamflow data (1903–1990) at 4gauge stations, (ii) GRACE water storage anomalies in6 sub-basins, and (iii) Envisat altimeter observation at 6sites. The model results show that the 3 rainfall datasetscapture daily, seasonal and annual variations reason-ably well in most sub-basins except for the 2 equatorialsub-basins. In the equatorial region, discrepancies wereobserved in HRR model results with all 3 rainfall datasets(TR, CM, PE) when compared to Envisat and GRACEsatellite measurements. The discrepancies in satelliterainfall were also observed by previous researchers, suchas McCollum et al. (2000) and Nicholson et al. (2003),in equatorial regions. This paper supports these previousfindings and highlights the need for additional research onthe causes and potential solutions to these discrepancies.
Copyright 2011 John Wiley & Sons, Ltd. Hydrol. Process. 25, 3216–3229 (2011)

3228 R. E. BEIGHLEY ET AL.
In general, the HRR model predictions have a goodagreement with GRACE observations, Envisat altime-ter measurements, and mean monthly historical gaugemeasurements. Although the temporal distributions aresimilar, the magnitudes of the rainfall datasets differ.For example, TR mean annual rainfall is much lower(18–134%) as compared to both PE and CM at thesub-basin scale. Consequently, TR provides the bestagreement to the historical streamflow data, with meanmonthly and annual streamflow errors ranging from 12to 150% and 1 to 130%, respectively. In comparison,PE and CM resulted in annual streamflow errors rangingfrom 180 to 430% and 150 to 330%, respectively.
In summary, there are two important findings in thispaper. One, the satellite rainfall datasets investigated hereshow large variability in the equatorial regions of theCongo Basin. Additional research is needed to assess thecause and potential solutions to this variability. As usedhere, rainfall data from CMORPH and PERSIANN aresufficiently large that model calibration cannot accountfor the mass errors in simulated streamflow. Secondly,the HRR model, which is built on the Pfafstetter system,can effectively integrate GRACE water storages (coarseresolution data) and Envisat altimeter measurements(essentially point data) into the model assessment processfor examining performance in terms of both streamflowmagnitude and timing. In applications where in situmeasurements are limited or not available, the approachdiscussed here can be used to resolve regions or period forwhich the model formulation and/or forcing data resultin reasonable results.
ACKNOWLEDGEMENTS
This work was carried out under the auspices ofthe NASA New Investigator Program, Contract No.NNX06AF13G, and Ohio State University’s Climate,Water and Carbon Program. The authors also acknowl-edge the data obtained from NASA’s Earth ObservingSystem (EOS) satellites, GRACE Project (University ofTexas Center Space Research), ESA’s Envisat project,and the HydroSHEDS database provided by the WorldWildlife Fund, Inc.
REFERENCES
Allen RG, Pereira LS, Raes D, Smith M. 1998. Crop Evapotranspi-ration—Guidelines for Computing Crop Water Requirements, Irriga-tion and Drainage Paper No. 56 . Food and Agriculture Organizationof the United Nations: Rome; 290.
Andersen O, Berry P, Freeman J, Lemoine FG, Lutsckhe S, Jakobsen F,Butts M. 2008. Satellite altimetry and GRACE gravimetry forstudies of annual water storage variations in Bangladesh. TerrestrialAtmospheric and Oceanic Science 19(1–2): 47–52.
Artan G, Gadian H, Smith JL, Asante K, Bandaragoda CJ, Verdin JP.2007. Adequacy of satellite derived rainfall data for stream flowmodeling. Natural Hazards Review. 47: 167–185.
Asadullah A, McIntyre N, Kigobe M. 2008. Evaluation of five satelliteproducts for estimation of rainfall over Uganda. Hydrological Sciences53(6): 1137–1150.
Bamber JL. 1994. Ice sheet altimeter processing scheme. InternationalJournal of Remote Sensing 15: 925–938.
Beighley RE, Eggert K, Dunne T, He Y, Gummadi V. 2009. Simu-lating hydrologic and hydraulic processes throughout the Ama-zon River Basin. Hydrological Processes 23(8): 1221–1235.DOI:10.1002/hyp.7252.
Beighley RE, Gummadi V. (2011. in press). Developing Channel andFloodplain Dimensions with Limited Data: A Case Study in theAmazon Basin. Earth Surface Processes and Landforms .
Benveniste J. 2002. ENVISAT RA-2/MWR product handbook, Issue 1Ð2,PO-TN-ESR-RA-0050, Frascati, Italy: European Space Agency.
Chen J, Wilson CR, Tapley BD, Yang ZL and Niu GY. 2009. 2005drought event in the Amazon River basin as measured by GRACEand estimated by climate models. Journal of Geophysical Research114: B05404. DOI:10.1029/2008JB006056.
Chow VT. 1959. Open Channel Hydraulics . McGraw-Hill: New York;680.
Coe MT, Costa MH, Howard EA. 2008. Simulating the surface watersof the Amazon River Basin: Impacts of new river geomorphicand dynamic flow parameterizations. Hydrological Processes 22(14):2542–2553. DOI:10.1002/hyp.6850.
Coe MT, Olejniczak N. 1999. Global River Discharge Database (SAGE).Available online at [http://www.sage.wisc.edu/riverdata/] from theCenter for Sustainability and the Global Environment (SAGE), GaylordNelson Institute for Environmental Studies, University of Wisconsin-Madison, Madison, Wisconsin, USA.
Crowley JW, Mitrovica JX, Bailey RC, Tamisiea ME, Davis JL. 2006.Land water storage within the Congo Basin inferred from GRACEsatellite gravity data. Geophysical Research Letters 33: L19402.DOI:10.1029/2006GL027070.
Dai A, Lin X, Hsu KL. 2007. The frequency, intensity, and diurnal cycleof precipitation in surface and satellite observations over low- andmid-latitudes. Climate Dynamics 29: 727–744.
Danish Hydraulic Institute (DHI). 2007. MIKE SHE User Guide andTechnical Reference Manual, December 2007 edn.
de Goncalves LGG, Shuttleworth WJ, Nijssen B, Burke EJ, Marengo JA,Chou SC, Houser P, Toll Dl. 2006. Evaluation of model-derivedand remotely sensed precipitation products for continental SouthAmerica. Journal of Geophysical Research 111: D16113. DOI:1029/2005JD006276.
Dinku T, Ceccato P, Grover-Kopec E, Lema M, Connor SJ, RopelewskiCF. 2007. Validation of high-resolution satellite rainfall products overEast Africa’s complex topography. International Journal of RemoteSensing 29(7): 1503–1526.
Dinku T, Chidzambwa S, Ceccato P, Connor SJ, Ropelewski CF. 2008.Validation of high-resolution satellite rainfall products over complexterrain. International Journal of Remote Sensing 29(14): 4097–4110.
Duan XJ, Guo JY, Shum CK, ven der Wal W. 2009. On thepostprocessing removal of correlated errors in GRACE temporalgravity field solutions. Journal of Geodesy 83: 1095–1106.
Eltahir EAB, Loux B, Yamana TK, Bomblies A. 2004. A see-sawoscillation between Amazon and Congo basins. Geophysical ResearchLetters 31: L23201. DOI:10.1029/2004GL021160.
Farr TG, Rosen PA, Caro E, Crippen R, Duren R, Hensley S, Kobrick M,Paller M, Rodriguez E, Roth L, Seal D, Shaffer S, Shimada J,Umland J, Werner M, Oskin M, Burbank D, Alsdorf D. 2007. TheShuttle Radar Topography Mission. Reviews of Geophysics 45:RG2004.
Frappart F, Calmant S, Cauhope M, Seyler F, Cazenave A. 2006.Preliminary results of ENVISAT RA-2-derived water levels validationover the Amazon basin. Remote Sensing of Environment 100: 252–264.
Gao H, Wood EF, Jackson TJ, Drusch M, Bindlish R. 2006. UsingTRMM/TMI to retrieve surface soil moisture over the southern UnitedStates from 1998 to 2002. Journal of Hydrometeorology 7: 23–38.
Gummadi V. 2008. Hydraulic geometry relations for the Amazon Basin,Thesis (MS), Civil Engineering , San Diego State University: San Diego,CA; p. 86.
Guo JY, Duan XJ, Shum CK. 2010. Non-isotropic Gaussian smoothingand leakage reduction for determining mass changes over land andocean using GRACE data. Geophysics Journal International 181:290–302.
Han SC, Shum CK, Jekeli C, Alsdorf D. 2005. Improved estimation ofterrestrial water storage changes from GRACE. Geophysical ResearchLetters 32: L07302. DOI:10.1029/2005GL022382.
Hong Y, Hsu KL, Sorooshian S, Gao X. 2005. Improved representationof diurnal variability of rainfall retrieved from the TropicalRainfall Measuring Mission Microwave Imager adjusted PrecipitationEstimation from Remotely sensed Information using Artificial NeuralNetworks (PERSIANN) system. Journal of Geophysical research 110:D06102. DOI:10.1029/2004JD005301.
Copyright 2011 John Wiley & Sons, Ltd. Hydrol. Process. 25, 3216–3229 (2011)

COMPARING SATELLITE PRECIPITATION IN THE CONGO RIVER BASIN 3229
Hirpa FA, Gebremichael M, Hopson T. 2010. Evaluation of high-resolution satellite precipitation products over very complex terrainin Ethiopia. Journal of Applied Meteorology and Climatology 49(5):1044–1051.
Hossain F, Huffman GE. 2008. Investigating errors metrics forsatellite rainfall data at hydrologically relevant scales. Journal ofHydrometeorology 9: 563–575.
Hsu KL, Gao XG, Sorooshian S, Gupta HV. 1997. Precipitationestimation from remotely sensed information using artificial neuralnetworks. Journal of Applied Meteorology 36: 1176–1190.
Huffman GJ, Adler RF, Bolvin DT, Gu GJ, Nelkin EJ, Bowman KP,Hong Y, Stocker EF, Wolff DB. 2007. The TRMM multisatelliteprecipitation analysis (TMPA): Quasi-global, multiyr, combined-sensorprecipitation estimates at fine scales. Journal of Hydrometeorology 8:38–55.
Joyce RJ, Janowiak JE, Arkin PA, Xie PP. 2004. CMORPH: a methodthat produces global precipitation estimates from passive microwaveand infrared data at high spatial and temporal resolution. Journal ofHydrometeorology 5: 487–503.
Kummerow C, Barnes W, Koju T, Shiue j, Simpson J. 1998. TheTropical Rainfall Measuring Mission (TRMM) sensor package. Journalof Atmospheric and Oceanic Technology 15: 809–817.
Laraque A, Mahe G, Orange D, Marieu B. 2001. Spatiotemporalvariations in hydrological regimes within Central Africa during theXXth century. Journal of Hydrology 245: 104–117.
Lee H, Durand M, Jung HC, Alsdorf D, Shum CK, Sheng Y. 2010.Characterization of surface water storage changes in Arctic lakesusing simulated SWOT measurements. International Journal of RemoteSensing 31(14): 3931–3953.
Lehner B, Verdin K, Jarvis A. 2008. New global hydrography derivedfrom spaceborne elevation data. Eos, Transactions, AGU 89(10):93–94.
Mahmood K, Yevjevich V. 1975. Unsteady Flow in Open Channels ,Water Resources Press: Ft. Collins, CO.
Maidment D. 1992. Handbook of Hydrology . McGraw-Hill: New York,NY.
McCollum JR, Gruber A, Ba MB. 2000. Discrepency between gauge andsatellite estimates of rainfall in equatorial Africa Journal of AppliedMeteorology 39: 666–679.
Moglen GE, Beighley RE. 2000. Using GIS to determine the extent ofgaged streams in a region. Journal of Hydrologic Engineering ASCE5(2): 190–196.
Molinier M, Ronchail J, Guyot JL, Cochonneau G, Guimaraes V, deOliveira E. 2009. Hydrological variability in the Amazon drainagebasin and African tropical basins. Hydrological Processes 23:3245–3252. DOI:10.1002/hyp.7400.
Negron Juarez RI, Li W, Fu R, Fernandes K. 2009. Comparisonof precipitation datasets over the tropical South American andAfrican Continents. Journal of Hydrometeorology 10: 289–299.DOI:10.1175/2008JHM1023.1.
Nesbitt SW, Gochis DJ, Lang TJ. 2008. The diurnal cycle of cloudsand precipitation along the Sierra Madre Occidental observed duringNAME-2004: Implications for warm season precipitation estimation incomplex terrain. Journal of Hydrometeorology 9: 728–743.
Nicholson SE, Some B, McCollum J, Nelkin E, Klotter D, Berte Y,Diallo BM, Gaye I, Kpabeba G, Ndiaye O, Noukpozounkou JN,Tanu MM, Thiam A, Toure AA, Traore AK. 2003. Validation of
TRMM and other rainfall estimates with a high-density gauge datasetfor West Africa. Part I: Validation of GPCC rainfall product and pre-TRMM satellite and blended products. Journal of Applied Meteorology42: 1337–1354.
Rawls WJ, Brakensiek DL, Saxton KE. 1982. Estimation of soil waterproperties. Transactions of the ASAE 25(5): 1316–1320, 1328.
Ruane AC, Roads JO. 2007. 6-hour to 1-year variance of five globalprecipitation sets. Earth Interactions 11: DOI:101175/EI225.1.
Rosenqvist A, Shimada M, Chapman B, Freeman A, De Grandi G,Saatchi S, Rauste Y. 2000. The Global Rain Forest MappingProject—A review. Interntional Journal of Remote Sensing 21(6):1375–1387.
Sapiano MRP, Arkin PA. 2009. An intercomparison and validation ofhigh-resolution satellite precipitation estimates with 3-hourly gaugedata. Journal of Hydrometeorol 10: 149–166.
Schmidt M, Han S, Kusche J, Sanchez L, Shum CK. 2006. Regionalhigh-resolution spatio-temporal gravity modeling from GRACE datausing spherical wavelets. Geophysicl Research Letters 33: L08403.DOI:10.1029/2005GL025509.
Schmidt M, Seitz F, Shum CK. 2008. Regional four-dimensionalhydrological mass variations from GRACE, atmospheric fluxconvergence, and river gauge data. Journal of Geophysical Research113: B10402. DOI:10.1029/2008JB005575.
Stisen S, Sandholt I. 2009. Evaluation of remote-sensing-based rainfallproducts through predictive capability in hydrological runoff modeling.Hydrological Processes DOI:10.1002/hyp.7529.
Swenson S, Wahr J. 2006. Post-processing removal of correlatederrors in GRACE data. Geophysical Research Letters 33: L08402.Doi:10.1029/2005GL025285.
Tapley BD, Bettadpur S, Ries J, Thompson P, Watkins M. 2004.GRACE measurements of mass variability in the Earth system. Science305: 503–505.
Tazalika L, Jury MR. 2008. Intra-seasonal rainfall oscillations overCentral Africa: Space-time character and evolution. Theoretical andApplied Climatology 98: 67–80.
Verdin KL, Verdin JP. 1999. A Topological System for Delineation andcodification of the Earth’s River Basins. Journal of Hydrology 218:1–12.
Wahr J, Swenson S, Velicogna I. 2006. Accuracy of GRACE massestimates. Geophysical Research Letters 33: L06401. DFOI:10.1029/2005GL025305.
Webb RW, Rosenzweig CE, Levine ER. 2000. Global Soil Texture andDerived Water-Holding Capacities, Oak Ridge National LaboratoryDistributed Active Archive Center [http://www.daac.ornl.gov]: OakRidge, TN, DIO:10.3334/ORNLDAAC/548.
Werth S, Guntner A, Petrovic S, Schmidt R. 2009. Integration ofGRACE mass variations into a global hydrological model. Earth andPlanetary Science Letters 277: 166–173.
Williams ER, Satori G. 2004. Lightning, thermodynamics and hydro-logical comparison of the two tropical continental chimneys. Jour-nal of Atmospheric and Solar-Terrestrial Physics 66: 1213–1231.DOI:10.1016/j.jastp.2004.05.015.
Zhou T, Yu R, Chen H, Dai A, Pan Y. 2008. Summer precipitationfrequency, intensity, and diurnal cycle over China: A comparison ofsatellite data with rain gauge observations. Journal of Climate 21:3997–4010.
Copyright 2011 John Wiley & Sons, Ltd. Hydrol. Process. 25, 3216–3229 (2011)