
Mitochondrial genomes are retained by selective constraints ...
Upload
independentCategory
view
3download
0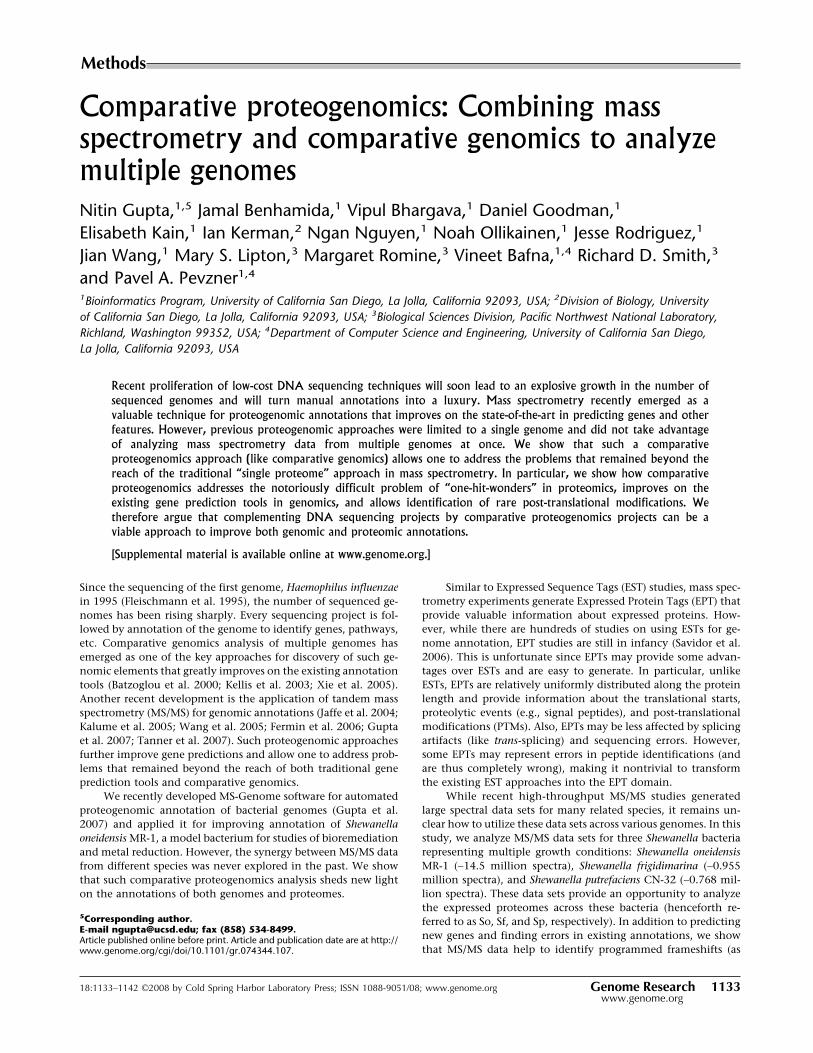
Comparative proteogenomics: Combining massspectrometry and comparative genomics to analyzemultiple genomesNitin Gupta,1,5 Jamal Benhamida,1 Vipul Bhargava,1 Daniel Goodman,1
Elisabeth Kain,1 Ian Kerman,2 Ngan Nguyen,1 Noah Ollikainen,1 Jesse Rodriguez,1
Jian Wang,1 Mary S. Lipton,3 Margaret Romine,3 Vineet Bafna,1,4 Richard D. Smith,3
and Pavel A. Pevzner1,4
1Bioinformatics Program, University of California San Diego, La Jolla, California 92093, USA; 2Division of Biology, Universityof California San Diego, La Jolla, California 92093, USA; 3Biological Sciences Division, Pacific Northwest National Laboratory,Richland, Washington 99352, USA; 4Department of Computer Science and Engineering, University of California San Diego,La Jolla, California 92093, USA
Recent proliferation of low-cost DNA sequencing techniques will soon lead to an explosive growth in the number ofsequenced genomes and will turn manual annotations into a luxury. Mass spectrometry recently emerged as avaluable technique for proteogenomic annotations that improves on the state-of-the-art in predicting genes and otherfeatures. However, previous proteogenomic approaches were limited to a single genome and did not take advantageof analyzing mass spectrometry data from multiple genomes at once. We show that such a comparativeproteogenomics approach (like comparative genomics) allows one to address the problems that remained beyond thereach of the traditional “single proteome” approach in mass spectrometry. In particular, we show how comparativeproteogenomics addresses the notoriously difficult problem of “one-hit-wonders” in proteomics, improves on theexisting gene prediction tools in genomics, and allows identification of rare post-translational modifications. Wetherefore argue that complementing DNA sequencing projects by comparative proteogenomics projects can be aviable approach to improve both genomic and proteomic annotations.
[Supplemental material is available online at www.genome.org.]
Since the sequencing of the first genome, Haemophilus influenzaein 1995 (Fleischmann et al. 1995), the number of sequenced ge-nomes has been rising sharply. Every sequencing project is fol-lowed by annotation of the genome to identify genes, pathways,etc. Comparative genomics analysis of multiple genomes hasemerged as one of the key approaches for discovery of such ge-nomic elements that greatly improves on the existing annotationtools (Batzoglou et al. 2000; Kellis et al. 2003; Xie et al. 2005).Another recent development is the application of tandem massspectrometry (MS/MS) for genomic annotations (Jaffe et al. 2004;Kalume et al. 2005; Wang et al. 2005; Fermin et al. 2006; Guptaet al. 2007; Tanner et al. 2007). Such proteogenomic approachesfurther improve gene predictions and allow one to address prob-lems that remained beyond the reach of both traditional geneprediction tools and comparative genomics.
We recently developed MS-Genome software for automatedproteogenomic annotation of bacterial genomes (Gupta et al.2007) and applied it for improving annotation of Shewanellaoneidensis MR-1, a model bacterium for studies of bioremediationand metal reduction. However, the synergy between MS/MS datafrom different species was never explored in the past. We showthat such comparative proteogenomics analysis sheds new lighton the annotations of both genomes and proteomes.
Similar to Expressed Sequence Tags (EST) studies, mass spec-trometry experiments generate Expressed Protein Tags (EPT) thatprovide valuable information about expressed proteins. How-ever, while there are hundreds of studies on using ESTs for ge-nome annotation, EPT studies are still in infancy (Savidor et al.2006). This is unfortunate since EPTs may provide some advan-tages over ESTs and are easy to generate. In particular, unlikeESTs, EPTs are relatively uniformly distributed along the proteinlength and provide information about the translational starts,proteolytic events (e.g., signal peptides), and post-translationalmodifications (PTMs). Also, EPTs may be less affected by splicingartifacts (like trans-splicing) and sequencing errors. However,some EPTs may represent errors in peptide identifications (andare thus completely wrong), making it nontrivial to transformthe existing EST approaches into the EPT domain.
While recent high-throughput MS/MS studies generatedlarge spectral data sets for many related species, it remains un-clear how to utilize these data sets across various genomes. In thisstudy, we analyze MS/MS data sets for three Shewanella bacteriarepresenting multiple growth conditions: Shewanella oneidensisMR-1 (∼14.5 million spectra), Shewanella frigidimarina (∼0.955million spectra), and Shewanella putrefaciens CN-32 (∼0.768 mil-lion spectra). These data sets provide an opportunity to analyzethe expressed proteomes across these bacteria (henceforth re-ferred to as So, Sf, and Sp, respectively). In addition to predictingnew genes and finding errors in existing annotations, we showthat MS/MS data help to identify programmed frameshifts (as
5Corresponding author.E-mail [email protected]; fax (858) 534-8499.Article published online before print. Article and publication date are at http://www.genome.org/cgi/doi/10.1101/gr.074344.107.
Methods
18:1133–1142 ©2008 by Cold Spring Harbor Laboratory Press; ISSN 1088-9051/08; www.genome.org Genome Research 1133www.genome.org
well as sequencing errors), a difficult problem in genomics. Wedemonstrate that comparative analysis of peptides across speciesis helpful in resolving the dilemma of “one-hit-wonders” in pro-teomics. We further discuss how comparative proteogenomicanalysis enables identification of rare PTMs and proteolyticevents, two difficult problems for which the high-throughputtechniques are not available. Drawing parallels from gene micro-array platforms, we also use mass spectrometry-based protein ex-pression data to analyze the conserved and differentially ex-pressed pathways across these species. Our software is available athttp://proteomics.bioprojects.org/ and the proteomic data setsare available from http://ober-proteomics.pnl.gov/data.
Results
Multiple Shewanella genomes
The three Shewanella species used in this study were recentlysequenced, So containing 5,131,416 base pairs (bp) being the firstone (Heidelberg et al. 2002). Subsequently, Sf and Sp genomeshave been sequenced (4,845,257 and 4,649,325 bp, respectively).Sf and Sp genomes, unlike So, do not have accompanying pub-lications in the literature, although they have been cited in otherstudies (Yang et al. 2006). The genome sequences and annota-tions used in this study were obtained from the TIGR CMR da-tabase.
The protein orthology assignments across differentShewanella species were prepared using INPARANOID (Remm etal. 2001), subsequently aligned by MUSCLE (Edgar 2004) (datacourtesy of LeeAnn McCue and Sean Conlan). Figure 1A showsthe numbers of orthologs shared by different Shewanella species.While 2590 genes have orthologs in all three species (we callsuch triplets “shared genes”), for some proteins, orthologswere found in only one other species and, in many cases (for
example, 1715 in So), in none. (Many Shewanella genes may beartifacts of existing gene finding tools that tend to overpredictshort genes. See Clamp et al. (2007) regarding recent controversyon gene overprediction.)
The shared genes are used for comparative analysis in thisstudy. The protein sequence identity between So and Sp is ∼85%,while Sf is ∼70% identical to the other two species (averageamong all shared genes). As a result, most orthologous trypticpeptides for these species differ in at least one position.
Protein identification
Based on the peptides identified from InsPecT searches (seeMethods), expression of 40%–45% proteins is confirmed in eachspecies. Table 1 provides the number of annotated genes and ourprotein identifications. Interestingly, the fraction of expressedproteins among the shared genes is much higher, at ∼55%. Thishints at a correlation between protein expression and sequenceconservation, in agreement with the observations made in Guptaet al. (2007). In this study, we also demonstrated the use of MS-based protein identification to analyze the expression of path-ways or functional categories. Having proteomic data for threespecies now allows us to compare the expression of pathways andidentify which pathways are conserved or differentially ex-pressed across these species. The comparative pathway analysis isdescribed in the Supplemental material (Supplement 7).
Resolving one-hit-wonders
There are 1052 shared genes that are expressed in all three species(see Fig. 1B). However, in accordance with the Proteomics Pub-lication Guidelines (Carr et al. 2004; Bradshaw et al. 2006), werequire at least two peptides to consider a protein as expressed.Since almost every analysis of MS/MS data sets reveals a largenumber of proteins with a single identified peptide (one-hit-wonders), it leads to a significant reduction in the number ofidentified proteins (one-hit-wonders represent 21%, 28%, and27% of all identified proteins in So, Sp, and Sf, respectively). Forexample, there are 404 such proteins in So that cannot be re-ported as reliable identifications. While many of them indeedrepresent expressed proteins, it is not clear how to separate themfrom erroneous peptide identifications (Gupta et al. 2007). Belowwe explore the use of comparative analysis across species to reli-ably select the expressed proteins among the one-hit-wondersand thus remove the term “hypothetical” from some existinggene annotations.
For each shared gene, we define an expression signaturewith three values that represent the number of peptide identifi-cations in the three species. The value is 2 if the expression isconfirmed by two or more peptides, 1 if only one peptide is
Figure 1. Expression of orthologous genes across the three species.(A) The number of orthologs shared between different species. There are2590 orthologous genes present in all three species (referred to as“shared genes”). (B) The number of expressed shared genes (confirmedby two or more peptides) among the three species; 1052 shared genesare expressed in all three species, 708 shared genes are expressed innone.
Table 1. Protein identification results
S. oneidensis(So)
S. putrefaciens(Sp)
S. frigidimarina(Sf)
Annotated genes 4928 3972 4029Expressed proteins 1967 (1572) 1625 (1372) 1744 (1447)Single-hit proteins 404 (248) 462 (295) 464 (306)
For each species, the total number of genes, the number of genes con-firmed as expressed proteins by two or more peptides, and the numberof genes with only one peptide hit are reported. The numbers in theparentheses represent the number of shared genes, out of 2590 in total,that are present in the corresponding list of genes.
Gupta et al.
1134 Genome Researchwww.genome.org
observed, and 0 for no peptides. For example, the signature (0, 1,2) for a shared gene represents no peptide identification in So,one peptide identification in Sp, and confirmed expression withtwo or more peptides in Sf. There are 27 possible distinct expres-sion signatures that such a vector may take for a shared gene. Wecombine these into 10 position independent values, such that (2,1, 1) is considered the same as (1, 1, 2) or (1, 2, 1). Table 2 showsthe frequency of these 10 expression signatures among the 2590shared genes. The argument against considering one-hit-wondersas expressed protein is that they may be unexpressed proteinswith one false peptide identification. However, we note that, ifthe orthologous genes of a one-hit-wonder are expressed in theother two species, it adds support that the gene is a true expressedgene. Such genes are readily identified as having expression sig-nature (1, 1, 1), (1, 1, 2), or (1, 2, 2). This approach provides extraevidence for the expression of 3 � 10 + 2 � 56 + 187 = 329 one-hit-wonders in total in the three species. [The signatures (0, 1, 1),(0, 1, 2), and (0, 2, 2) are also useful, albeit less reliable (they mayrepresent biologically interesting cases when orthologous pro-teins are expressed in some species but not expressed in others).]
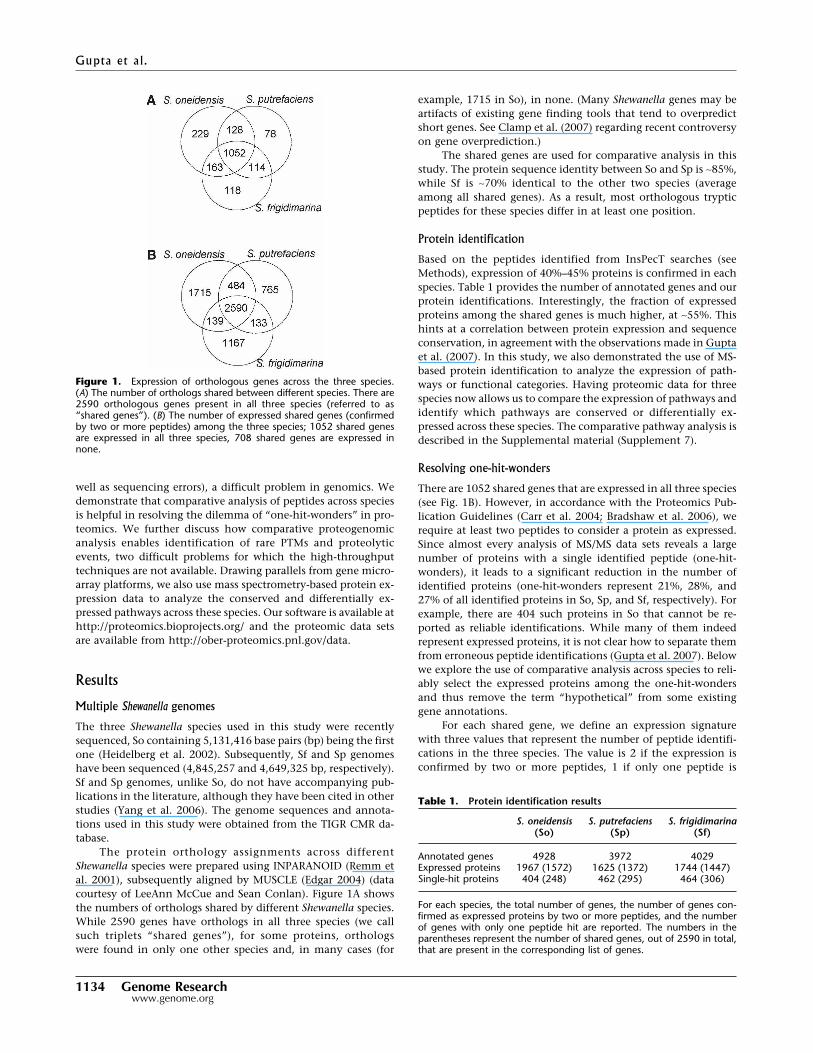
While orthologous one-hit-wonders are strong indicators ofprotein expression, peptides identified at the same orthologouspositions (correlated peptides) in different species provide over-whelming evidence that the proteins are expressed (see Methodsfor description of correlated peptides). Since the likelihood ofthis happening by chance is extremely small, we now dig deeperinto analysis of the orthologous one-hit-wonders and demon-strate that they often have correlated peptides. Figure 2 showsthe example of a shared gene (annotated as hypothetical lipo-protein) that has only one identified peptide in each organism.However, it turns out that these peptides, in spite of beingslightly different from each other in their sequences, are locatedat the same position in the alignment of the orthologs. Thus, weargue that these proteins should be considered as expressed andre-annotated to remove the term “hypothetical” from their an-notations.
One reason for observing only a single peptide from a pro-tein is the relatively few number (one in some cases) of detectablepeptides in a protein (Supplement S4 in the Supplemental mate-rial describes how mutations in correlated peptides provide valu-able data for studies of peptide detectability) (Tang et al. 2006; Luet al. 2007; Mallick et al. 2007). However, if this is the case, theorthologous peptides should be observed in the closely relatedspecies. We thus check if the only peptide observed in a proteinis correlated between multiple species. If the peptide identifica-tion is spurious, it is very unlikely that the peptide will be at the
same position as the observed peptides in itsorthologs. Interestingly, we find 46 out of404 one-hit-wonders in So having a corre-lated peptide in at least one of the other twospecies, providing strong evidence for theexpression of these proteins. Similarly, 50and 85 one-hit-wonders in Sf and Sp, re-spectively, can be resolved as expressedbased on correlated peptides. We note that,if the peptide identifying a one-hit-wonder
is an incorrect identification, and the orthologous peptides iden-tified in the other species are exactly the same as the one-hit-wonder peptide, they may also represent incorrect identificationsof similar mass spectra (e.g., spectra from unknown contami-nants). Thus, the correlated peptides are less reliable if they areidentical. However, even a single change in the peptide se-quences significantly changes the corresponding spectra and,therefore, the one-hit-wonder confirmations based on such dis-tinct peptides are reliable. Noticeably, 38, 47, and 70 one-hit-wonders in So, Sf, and Sp, respectively, confirmed by correlatedpeptides, belong to this category.
Correcting gene predictions: Start sites
Peptides that match the genome in the non-protein-coding re-gion upstream of a gene, within 200-bp distance, are consideredcandidates for early start sites. These are cases of misannotatedgenes that are shortened at their N terminus. Cases with stopcodons between the peptide and the gene start site are discarded.To avoid spurious candidates from incorrect peptide identifica-tions, we consider a peptide only if there is another identifiedpeptide in the same reading frame within 200 bp (Gupta et al.2007). The starting position of the peptide (call it position X)does not necessarily correspond to the actual start site of thegene, but only tells that the actual start should be further up-stream of X.
To verify early start sites and determine their exact posi-tions, these genes were searched against proteins in 10 otherShewanella species, and position X for each candidate was com-pared to the start site of the aligned homolog. These species in-cluded Shewanella loihica PV-4, S. baltica OS155, S. amazonensisSB2B, S. sp. W3-18-1, S. denitrificans OS217, S. sp. ANA-3, S. sp.MR-4, and S. sp. MR-7, besides the other two from So, Sf, and Sp(leaving the one to which the candidate gene belongs). If thestart site of homolog aligned to a particular position is equal to orupstream of position X, then this new position was considered tobe a putative early start site. The most frequent (supported bymaximum number of homologs) of these putative starts is cho-sen as the new start site for the gene.
The list of early start site candidates is provided in Supple-mental Table S2A. Twenty-three among 28 such candidates in Soare assigned new start sites based on the comparative analysismentioned above. Notably, 18 of these early start sites have theexpected ATG, GTG, or TTG start codons, indicating that theseautomatically predicted start sites are indeed reliable. Two andthree early start sites are identified in Sp and Sf, respectively.
Figure 2. Example of correlated one-hit-wonders in shared genes. Aligned amino acid sequences of the shared gene (annotated as hypotheticallipoprotein) are shown for each organism (SO_0515 in So, CN32_3345 in Sp, and Sfri_3590 in Sf). The identified peptides are shown in blue.
Table 2. Expression signatures for shared genes
Expression signature (ES) (0, 0, 0) (0, 0, 1) (0, 0, 2) (0, 1, 1) (0, 1, 2)No. of proteins with given ES 434 195 182 69 187Expression signature (ES) (0, 2, 2) (1, 1, 1) (1, 1, 2) (1, 2, 2) (2, 2, 2)No. of proteins with given ES 218 10 56 187 1052
Three values in a vector correspond to three organisms, independent of the position. For example,(0, 0, 1) represents shared genes that have one peptide in (any) one of the species and no peptidein the other two.
Comparative proteogenomics
Genome Research 1135www.genome.org
As described in Methods, candidates for late start sites weregenerated using evidence from noncovered peptides. Such in-stances indicated a potential late start site either at the beginningof the noncovered peptide (call it position X) or, if N-terminalcleavage occurred, one position upstream (X � 1). The sequencesof these candidate genes are aligned to the proteins in 10 otherShewanella species. Each instance where the start of a protein inthe other species aligns to the potential late start site (beginningat position X or X � 1) is considered as confirmed by compara-tive genomics.
Supplemental Table S2B summarizes these cases in each ofthe three organisms. In So, five out of 33 late start candidates areconfirmed, four of which start with ATG codon and one withGTG (supporting the hypothesis that these are indeed start sites).Similarly, 11 out of 16 candidates are confirmed in Sf, and fouramong the 11 are confirmed in Sp (all of these are also found tohave ATG, GTG, or TTG start codon). The table also shows thatthe majority of these candidates have N-terminal methioninecleavage in the observed peptide. We find comparative pro-teomic evidence for one case where the late start site (10 aminoacids downstream from the annotated start site) is conserved inthe orthologs (ATP-dependent Clp protease, proteolytic subunitClpP) between So (SO_1794), Sf (Sfri_2596), and Sp (CN32_1490).However, we note that this site is also found in our analysis ofconserved proteolytic sites (below). While it is unclear whetherthis peptide corresponds to the late start site or a proteolyticevent, it clearly represents a real non-tryptic peptide, as opposedto an incorrect identification.
We note that our approach assumes that a gene has only onetranslational start site. However, if there is a gene with alternativestart sites, we will detect only the most upstream start site thathas supporting peptide evidence. We also discuss an approach todetect novel short genes using comparative proteogenomicanalysis in the Supplemental material (Supplement S6).
Identification of programmed frameshifts and sequencingerrors
A frameshift occurs when a ribosome skips one or more nucleo-tides in an mRNA sequence, thereby changing the reading frameto produce a different protein sequence from the original frame.In programmed frameshifts, this phenomenon is built into thetranslational machinery (Farabaugh 1996). Secondary RNA struc-tures such as pseudoknots are often responsible for the ribosomalpause and resulting frameshift (Tu et al. 1992). While many ef-forts went into frameshift detection (Posfai and Roberts 1992;Claverie 1993; Fichant and Quentin 1995; Brown et al. 1998;Medigue et al. 1999), accurate detection of frameshifts remainsan unsolved problem. Mass spectrometry, on the other hand,provides experimental evidence for the actual translation prod-ucts (proteins) and allows one to detect the frameshifts. The pres-ence of peptides from two different reading frames within theregion of a predicted gene may represent: (1) incorrect peptideidentification, (2) an insertion/deletion sequencing error, (3)overlapping genes in different frames, or (4) a programmedframeshift. We demonstrate the application of comparative ap-proaches for distinguishing between these possibilities.
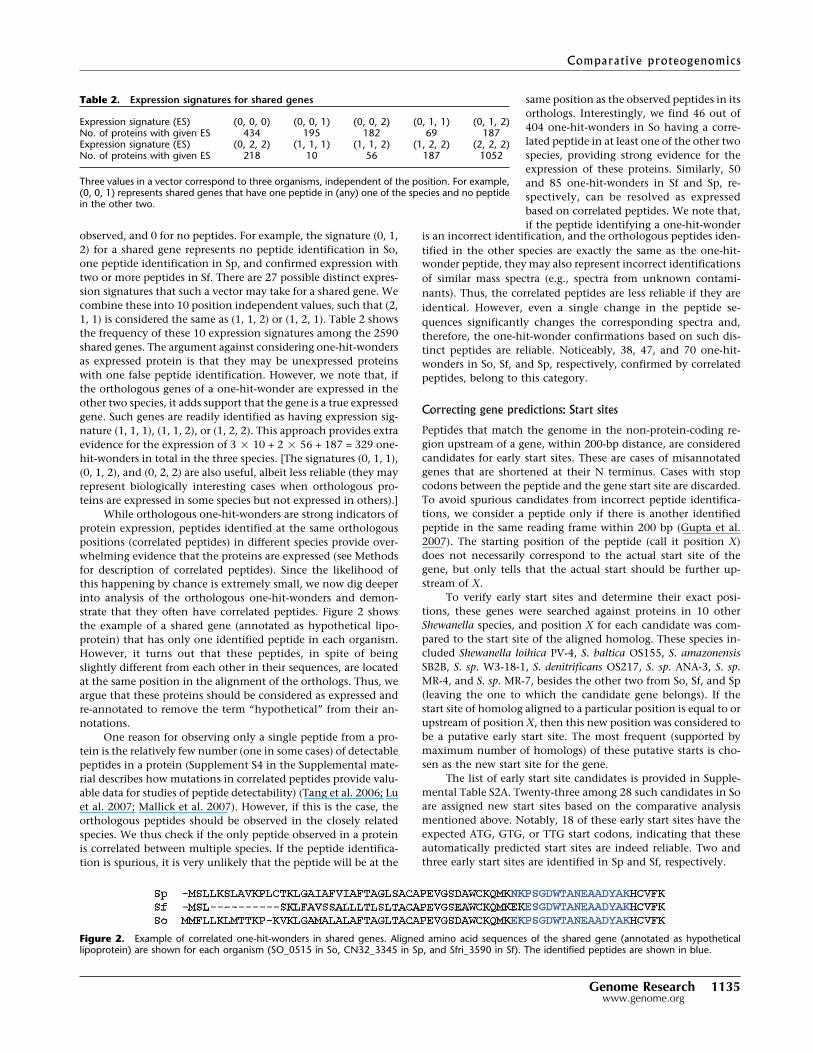
All identified peptides are mapped to the translated framesof the genome and compared with the annotated gene coordi-nates to determine alternate peptide reading frames in the DNAregion of a single gene. As depicted in Figure 3, three types ofcases are typically seen. In case A, multiple peptides are observed
in two different frames (only one of them being the annotatedframe of the gene) in nonoverlapping regions. In case B, only onepeptide is observed in an alternative frame at one of the ends,while, in case C, one peptide is seen out of frame with in-framepeptides on both sides. We postpone the discussion of case Csince in this case incorrect peptide identifications or overlappinggenes are more likely explanations than a frameshift. Case Aprovides the most reliable evidence of a programmed frameshiftsince presence of multiple peptides in the same region greatlyreduces the probability that these peptide identifications are spu-rious. The remaining case B, with only one peptide, is ambiguousand may represent either frameshifts or incorrect peptide iden-tifications, or overlapping genes. We exploit the sequences ofmultiple Shewanella species to find comparative evidence for pu-tative frameshifts in these cases.
Protein sequence from the original frame of the gene, as wellas sequence from the alternate frame implied by the identifiedpeptides, is compared against the other Shewanella species usingBLAST (Altschul et al. 1997). Good matches to the alternate-frame sequence and no matches to the gene-frame sequence pro-vide additional evidence for a frameshift. We note that someapparent frameshifts may be caused by sequencing errors or in-dels in the genome sequence when a certain number (not a mul-tiple of 3) of bases are erroneously added to or deleted from thesequence. To identify such sequencing errors, we take the nucleo-tide sequence of the region where frameshift occurs (region be-tween the observed in-frame and alternate-frame peptides) andgenerate ClustalW (Chenna et al. 2003) multiple sequence align-ment with the orthologous region in the other species. A se-quencing error is visible in this alignment as an indel in theoriginal sequence (see Fig. 4). Figure 5 shows an example of aprogrammed frameshift detected through this approach.
We identified 12 frameshift candidates in So conforming tocase A (Supplemental Table S3). All these candidate frameshiftswere verified with significant E-values. Nine of these instancesare estimated to be sequencing errors, and three genes are puta-tive programmed frameshifts: SO0991 (+1), SO4538 (�1), andSO4115 (�1). SO0991 (Fig. 5) is related to the peptide chainrelease factor 2 in Escherichia coli, that is known to undergo aprogrammed frameshift (Craigen et al. 1985). Fifteen frameshiftcandidates were identified conforming to case B but not verifiedby comparative evidence. No frameshift candidates could be veri-fied in Sp or Sf. This may be attributed to the relatively small
Figure 3. Commonly observed configurations of peptides in alternativeframe. (A) Case A: Multiple peptides are observed in two different frames(one of them being the frame of the gene) in nonoverlapping regions. (B)Case B: Only one peptide is observed out of frame at one of the ends. (C)Case C: One peptide is seen out of frame with in-frame peptides on bothsides.
Gupta et al.
1136 Genome Researchwww.genome.org

number of spectra for these two species (less than a million spec-tra each) as compared to 14.5 million spectra for So.
Proteolytic events
In Gupta et al. (2007), we demonstrated the use of genome scaleMS/MS data set for identification of N-terminal proteolyticevents such as N-terminal methioninecleavage and signal peptide cleavage. Anin vivo proteolytic event can be ob-served as a non-tryptic peptide (assum-ing the proteolytic enzyme does nothave the same specificity as trypsin).However, non-tryptic peptides may alsobe observed due to other reasons, such asdegradation of tryptic peptides or incor-rect peptide identifications. In Rod-riguez et al. (2008), we showed that thelikelihood of incorrect peptide identifi-cations can be reduced drastically (to<0.1%) by considering only doubly con-firmed cleavages and filtering out pos-sible degradation products (Rodriguez etal. 2008).
By applying the same filtering ap-proach as in Rodriguez et al. (2008) andremoving the cuts explained by the tryp-sin specificity, we obtain 365, 130, and62 putative proteolytic sites in So, Sp,
and Sf, respectively. To check whethersome of these sites are conserved be-tween multiple organisms, we map themon the alignment of orthologous pro-tein. Thirty-one proteolytic sites arefound conserved between two or moreorganisms (see Table 3). This is a signifi-cantly larger number of conserved sitesthan expected by chance. For example,with proteomes of length ∼1 millionamino acids (aa) each, the expectednumber of sites conserved by chance be-tween Sp and Sf is less than (62/106) � (130/106) � 106 ≈ 0.01, but weobserve 13. One may further challengethat these cleavages may be an artifact ofin vitro peptide degradations, and thatthese peptides may be overrepresentedin proteins containing multiple pep-tides. In this case, the statistical argu-ment above must be applied to the set ofthese highly expressed proteins ratherthan to all proteins. To check this, wetook proteins with 10 or more peptides(635 proteins in Sp, 671 in Sf) with totallength close to 300,000 aa in each or-ganism, and 128 and 57 putative pro-teolytic sites in Sp and Sf, respec-tively. All 13 sites conserved betweenSp and Sf belongs to these highly ex-pressed proteins. The expected num-ber of sites conserved by chance inthese proteins is (128/300000) � (57/300000) � 300,000 ≈ 0.02, still much
smaller than the observed 13 sites. Thus, we argue that the con-served sites reported here cannot be results of nonspecific degra-dations.
We note that many of these sites are located within peptideladders (multiple overlapping peptides), which also raises thepossibility that these cleavage sites may be a result of peptide
Figure 5. An example of a programmed frameshift. The nucleotide sequence for gene SO_0991 isshown in red, the amino acid sequence of the corresponding protein is shown in green, and the aminoacid sequences of the three translated frames are shown in black. This gene has been correctlyannotated in TIGR, and our predicted peptides in both the original frame and the alternative framematch the protein sequence.
Figure 4. Frameshift generated by sequencing error. In top panel, the nucleotide sequence for geneSO0590 is shown in red, the amino acid sequence of the protein is shown in green, and the amino acidsequences of the three translated frames are shown in black. Peptides identified by mass spectrometryare marked in blue (surrounded by boxes). The middle panel shows the ClustalW alignment with otherShewanella species in the region where frameshift occurs. The erroneous insertion of an extra “t” standsout in the alignment. The bottom panel indicates that both peptides fall in the original frame if the extranucleotide is removed.
Comparative proteogenomics
Genome Research 1137www.genome.org
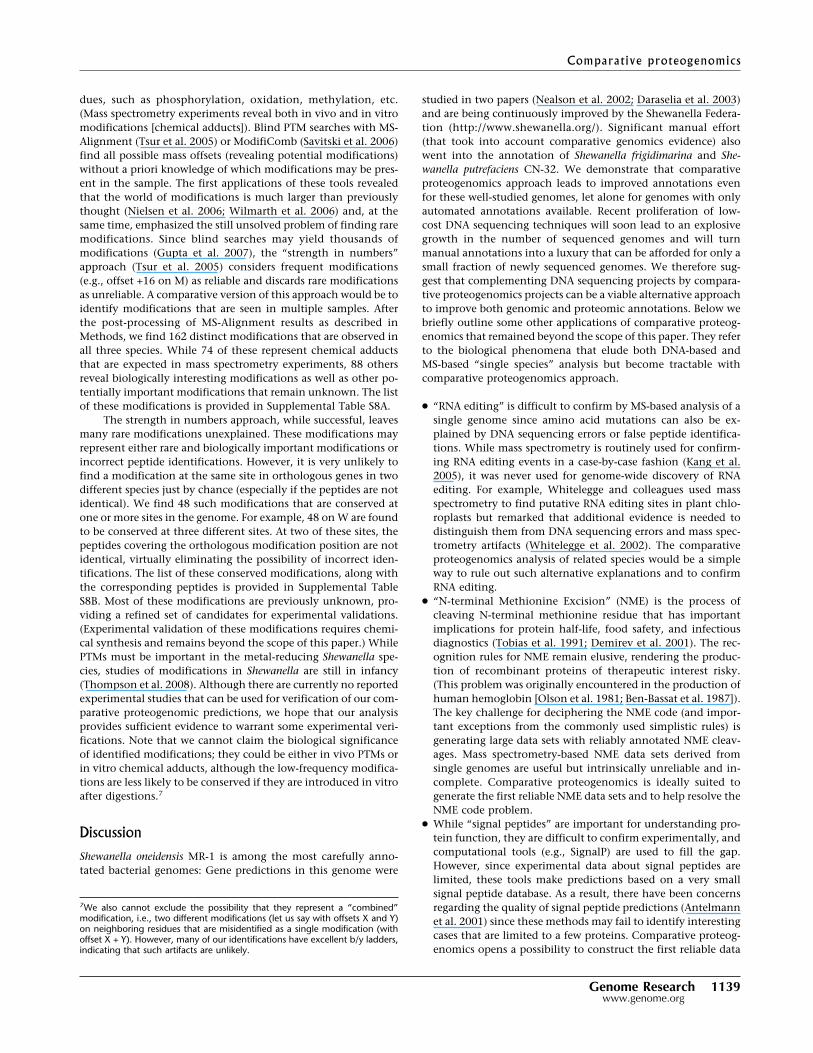
degradation (see the example in Fig. 6). However, carefully look-ing into these ladders, we see that they are more likely a union oftwo peptide ladders, one coming from the proteolysed and theother from the unproteolysed protein product. This is supportedby high spectral counts for the peptides around the cleavage sitein many cases, given that one expects much lower spectralcounts (usually 1) for degraded peptides as compared to the tryp-tic (un-degraded) peptide in a ladder. For example, the peptideLVNTGWTGGPHGIGK that supports the predicted cleavage sitein Figure 6 has a spectral count of 98, even higher than the
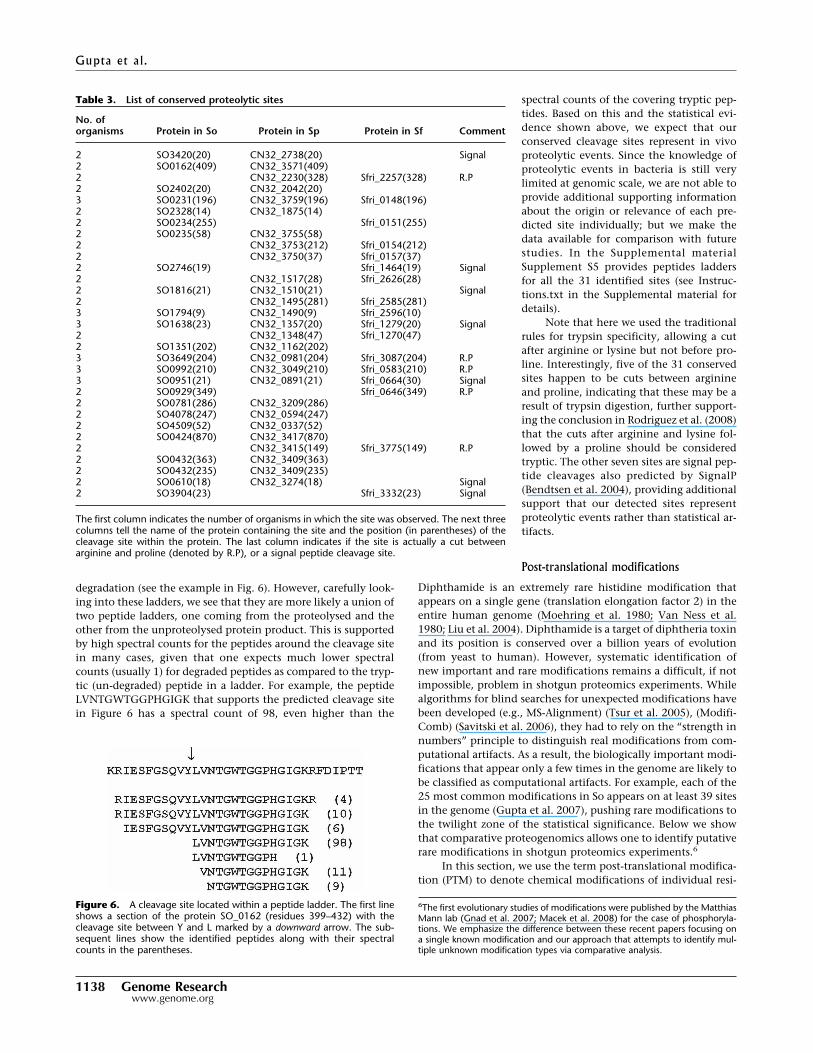
spectral counts of the covering tryptic pep-tides. Based on this and the statistical evi-dence shown above, we expect that ourconserved cleavage sites represent in vivoproteolytic events. Since the knowledge ofproteolytic events in bacteria is still verylimited at genomic scale, we are not able toprovide additional supporting informationabout the origin or relevance of each pre-dicted site individually; but we make thedata available for comparison with futurestudies. In the Supplemental materialSupplement S5 provides peptides laddersfor all the 31 identified sites (see Instruc-tions.txt in the Supplemental material fordetails).
Note that here we used the traditionalrules for trypsin specificity, allowing a cutafter arginine or lysine but not before pro-line. Interestingly, five of the 31 conservedsites happen to be cuts between arginineand proline, indicating that these may be aresult of trypsin digestion, further support-ing the conclusion in Rodriguez et al. (2008)that the cuts after arginine and lysine fol-lowed by a proline should be consideredtryptic. The other seven sites are signal pep-tide cleavages also predicted by SignalP(Bendtsen et al. 2004), providing additionalsupport that our detected sites representproteolytic events rather than statistical ar-tifacts.
Post-translational modifications
Diphthamide is an extremely rare histidine modification thatappears on a single gene (translation elongation factor 2) in theentire human genome (Moehring et al. 1980; Van Ness et al.1980; Liu et al. 2004). Diphthamide is a target of diphtheria toxinand its position is conserved over a billion years of evolution(from yeast to human). However, systematic identification ofnew important and rare modifications remains a difficult, if notimpossible, problem in shotgun proteomics experiments. Whilealgorithms for blind searches for unexpected modifications havebeen developed (e.g., MS-Alignment) (Tsur et al. 2005), (Modifi-Comb) (Savitski et al. 2006), they had to rely on the “strength innumbers” principle to distinguish real modifications from com-putational artifacts. As a result, the biologically important modi-fications that appear only a few times in the genome are likely tobe classified as computational artifacts. For example, each of the25 most common modifications in So appears on at least 39 sitesin the genome (Gupta et al. 2007), pushing rare modifications tothe twilight zone of the statistical significance. Below we showthat comparative proteogenomics allows one to identify putativerare modifications in shotgun proteomics experiments.6
In this section, we use the term post-translational modifica-tion (PTM) to denote chemical modifications of individual resi-
6The first evolutionary studies of modifications were published by the MatthiasMann lab (Gnad et al. 2007; Macek et al. 2008) for the case of phosphoryla-tions. We emphasize the difference between these recent papers focusing ona single known modification and our approach that attempts to identify mul-tiple unknown modification types via comparative analysis.
Figure 6. A cleavage site located within a peptide ladder. The first lineshows a section of the protein SO_0162 (residues 399–432) with thecleavage site between Y and L marked by a downward arrow. The sub-sequent lines show the identified peptides along with their spectralcounts in the parentheses.
Table 3. List of conserved proteolytic sites
No. oforganisms Protein in So Protein in Sp Protein in Sf Comment
2 SO3420(20) CN32_2738(20) Signal2 SO0162(409) CN32_3571(409)2 CN32_2230(328) Sfri_2257(328) R.P2 SO2402(20) CN32_2042(20)3 SO0231(196) CN32_3759(196) Sfri_0148(196)2 SO2328(14) CN32_1875(14)2 SO0234(255) Sfri_0151(255)2 SO0235(58) CN32_3755(58)2 CN32_3753(212) Sfri_0154(212)2 CN32_3750(37) Sfri_0157(37)2 SO2746(19) Sfri_1464(19) Signal2 CN32_1517(28) Sfri_2626(28)2 SO1816(21) CN32_1510(21) Signal2 CN32_1495(281) Sfri_2585(281)3 SO1794(9) CN32_1490(9) Sfri_2596(10)3 SO1638(23) CN32_1357(20) Sfri_1279(20) Signal2 CN32_1348(47) Sfri_1270(47)2 SO1351(202) CN32_1162(202)3 SO3649(204) CN32_0981(204) Sfri_3087(204) R.P3 SO0992(210) CN32_3049(210) Sfri_0583(210) R.P3 SO0951(21) CN32_0891(21) Sfri_0664(30) Signal2 SO0929(349) Sfri_0646(349) R.P2 SO0781(286) CN32_3209(286)2 SO4078(247) CN32_0594(247)2 SO4509(52) CN32_0337(52)2 SO0424(870) CN32_3417(870)2 CN32_3415(149) Sfri_3775(149) R.P2 SO0432(363) CN32_3409(363)2 SO0432(235) CN32_3409(235)2 SO0610(18) CN32_3274(18) Signal2 SO3904(23) Sfri_3332(23) Signal
The first column indicates the number of organisms in which the site was observed. The next threecolumns tell the name of the protein containing the site and the position (in parentheses) of thecleavage site within the protein. The last column indicates if the site is actually a cut betweenarginine and proline (denoted by R.P), or a signal peptide cleavage site.
Gupta et al.
1138 Genome Researchwww.genome.org
dues, such as phosphorylation, oxidation, methylation, etc.(Mass spectrometry experiments reveal both in vivo and in vitromodifications [chemical adducts]). Blind PTM searches with MS-Alignment (Tsur et al. 2005) or ModifiComb (Savitski et al. 2006)find all possible mass offsets (revealing potential modifications)without a priori knowledge of which modifications may be pres-ent in the sample. The first applications of these tools revealedthat the world of modifications is much larger than previouslythought (Nielsen et al. 2006; Wilmarth et al. 2006) and, at thesame time, emphasized the still unsolved problem of finding raremodifications. Since blind searches may yield thousands ofmodifications (Gupta et al. 2007), the “strength in numbers”approach (Tsur et al. 2005) considers frequent modifications(e.g., offset +16 on M) as reliable and discards rare modificationsas unreliable. A comparative version of this approach would be toidentify modifications that are seen in multiple samples. Afterthe post-processing of MS-Alignment results as described inMethods, we find 162 distinct modifications that are observed inall three species. While 74 of these represent chemical adductsthat are expected in mass spectrometry experiments, 88 othersreveal biologically interesting modifications as well as other po-tentially important modifications that remain unknown. The listof these modifications is provided in Supplemental Table S8A.
The strength in numbers approach, while successful, leavesmany rare modifications unexplained. These modifications mayrepresent either rare and biologically important modifications orincorrect peptide identifications. However, it is very unlikely tofind a modification at the same site in orthologous genes in twodifferent species just by chance (especially if the peptides are notidentical). We find 48 such modifications that are conserved atone or more sites in the genome. For example, 48 on W are foundto be conserved at three different sites. At two of these sites, thepeptides covering the orthologous modification position are notidentical, virtually eliminating the possibility of incorrect iden-tifications. The list of these conserved modifications, along withthe corresponding peptides is provided in Supplemental TableS8B. Most of these modifications are previously unknown, pro-viding a refined set of candidates for experimental validations.(Experimental validation of these modifications requires chemi-cal synthesis and remains beyond the scope of this paper.) WhilePTMs must be important in the metal-reducing Shewanella spe-cies, studies of modifications in Shewanella are still in infancy(Thompson et al. 2008). Although there are currently no reportedexperimental studies that can be used for verification of our com-parative proteogenomic predictions, we hope that our analysisprovides sufficient evidence to warrant some experimental veri-fications. Note that we cannot claim the biological significanceof identified modifications; they could be either in vivo PTMs orin vitro chemical adducts, although the low-frequency modifica-tions are less likely to be conserved if they are introduced in vitroafter digestions.7
Discussion
Shewanella oneidensis MR-1 is among the most carefully anno-tated bacterial genomes: Gene predictions in this genome were
studied in two papers (Nealson et al. 2002; Daraselia et al. 2003)and are being continuously improved by the Shewanella Federa-tion (http://www.shewanella.org/). Significant manual effort(that took into account comparative genomics evidence) alsowent into the annotation of Shewanella frigidimarina and She-wanella putrefaciens CN-32. We demonstrate that comparativeproteogenomics approach leads to improved annotations evenfor these well-studied genomes, let alone for genomes with onlyautomated annotations available. Recent proliferation of low-cost DNA sequencing techniques will soon lead to an explosivegrowth in the number of sequenced genomes and will turnmanual annotations into a luxury that can be afforded for only asmall fraction of newly sequenced genomes. We therefore sug-gest that complementing DNA sequencing projects by compara-tive proteogenomics projects can be a viable alternative approachto improve both genomic and proteomic annotations. Below webriefly outline some other applications of comparative proteog-enomics that remained beyond the scope of this paper. They referto the biological phenomena that elude both DNA-based andMS-based “single species” analysis but become tractable withcomparative proteogenomics approach.
● “RNA editing” is difficult to confirm by MS-based analysis of asingle genome since amino acid mutations can also be ex-plained by DNA sequencing errors or false peptide identifica-tions. While mass spectrometry is routinely used for confirm-ing RNA editing events in a case-by-case fashion (Kang et al.2005), it was never used for genome-wide discovery of RNAediting. For example, Whitelegge and colleagues used massspectrometry to find putative RNA editing sites in plant chlo-roplasts but remarked that additional evidence is needed todistinguish them from DNA sequencing errors and mass spec-trometry artifacts (Whitelegge et al. 2002). The comparativeproteogenomics analysis of related species would be a simpleway to rule out such alternative explanations and to confirmRNA editing.
● “N-terminal Methionine Excision” (NME) is the process ofcleaving N-terminal methionine residue that has importantimplications for protein half-life, food safety, and infectiousdiagnostics (Tobias et al. 1991; Demirev et al. 2001). The rec-ognition rules for NME remain elusive, rendering the produc-tion of recombinant proteins of therapeutic interest risky.(This problem was originally encountered in the production ofhuman hemoglobin [Olson et al. 1981; Ben-Bassat et al. 1987]).The key challenge for deciphering the NME code (and impor-tant exceptions from the commonly used simplistic rules) isgenerating large data sets with reliably annotated NME cleav-ages. Mass spectrometry-based NME data sets derived fromsingle genomes are useful but intrinsically unreliable and in-complete. Comparative proteogenomics is ideally suited togenerate the first reliable NME data sets and to help resolve theNME code problem.
● While “signal peptides” are important for understanding pro-tein function, they are difficult to confirm experimentally, andcomputational tools (e.g., SignalP) are used to fill the gap.However, since experimental data about signal peptides arelimited, these tools make predictions based on a very smallsignal peptide database. As a result, there have been concernsregarding the quality of signal peptide predictions (Antelmannet al. 2001) since these methods may fail to identify interestingcases that are limited to a few proteins. Comparative proteog-enomics opens a possibility to construct the first reliable data
7We also cannot exclude the possibility that they represent a “combined”modification, i.e., two different modifications (let us say with offsets X and Y)on neighboring residues that are misidentified as a single modification (withoffset X + Y). However, many of our identifications have excellent b/y ladders,indicating that such artifacts are unlikely.
Comparative proteogenomics
Genome Research 1139www.genome.org
set of all signal peptides in a set of genomes and to studyevolution of signal peptides across multiple species.
● “Operon prediction” in bacterial genomes is an important butstill unsolved problem. Despite the fact that many bacterialstudies (e.g., prediction of regulatory motifs) critically dependon operon predictions, the accuracy of existing computationaltools for operon prediction remains low (Ermolaeva et al. 2001;Price et al. 2005). Ideally, either all proteins in an operon areexpressed or, alternatively, no protein in an operon is ex-pressed. If all expressed proteins were identified (and all iden-tified proteins were expressed), this rule would translate intothe following rule: Either all proteins in an operon are identi-fied or, alternatively, no protein in an operon is identified.However, a protein may be expressed but not identified insome genomes (false negatives) and identified but not ex-pressed in others (false positives). Since peptide identificationserrors are somewhat random, the probability that the sameprotein is not expressed but identified in multiple species israther small. Also, since peptide detectability varies from spe-cies, we expect that comparative proteogenomics approachbased on signatures (described in the Results section) mayminimize errors and improve on existing operon predictions.
Methods
Peptide identificationPeptide identification in So was described in an earlier study(Gupta et al. 2007). The MS/MS spectra were acquired on ion-trapmass spectrometers (LCQ, ThermoFinnigan) using electrosprayionization. We used InsPecT (Tanner et al. 2005) (July 2007 ver-sion) to search the spectra of each species against a databasecontaining the six-frame translation of the genome along withcommon contaminants and a decoy database of the same size.InsPecT search was run using default parameter settings (frag-ment ion tolerance of 0.5 Da and parent mass tolerance of 2.5Da). The InsPecT score threshold was selected for each case tolimit the number of identifications on the decoy database to atmost 1% of the number of identifications on the target database,to keep the false discovery rate under control. After the filteringstep, we obtained 29,160 peptides in So, 22,820 peptides in Sf,and 22,358 peptides in Sp. These include 337, 222, and 269 pep-tides in So, Sf, and Sp, respectively, that do not match the anno-tated proteins in these genomes. We demonstrate that coordi-nated mapping of these peptides (that are usually discarded asfalse identifications) represents valuable information for improv-ing genome annotations.
Analyzing late start codonsWe describe an algorithm for predicting “late” start codons, i.e.,the (correct) start codons that are located downstream from thewrongly annotated start codons. While a late start codon impliesa “missing” peptide in the beginning of the protein (between thewrongly annotated and correct start codons), such missing pep-tides can also be caused by low peptide detectability (Kuster et al.2005) or may simply represent signal peptides. However, non-covered peptides (nontryptic peptides with no upstream cover-age) (see Gupta et al. 2007 for more details) in the beginning ofthe protein, that cannot be explained by the signal peptide con-sensus sequence, point to late start codons. There are 33 cases ofN-terminal most-noncovered peptides in So, within 18 residuesof the start. Conspicuously, many of them either begin with ATGstart codons or start immediately after a start codon (as in the
case of N-terminal Methionine cleavage) (see Gupta et al. 2007).If all these peptides were artifacts, the distribution of the codonsfor amino acids at positions 1 (where the observed peptide be-gins) and �1 (corresponding to N-terminal Methionine cleav-age) in these peptides would be somewhat uniform with an av-erage 33/61 ≈ 0.5 peptides per codon. Instead, we see a nonuni-form distribution at position 1 and �1 with a sharp peak at ATG(standard Methionine start codon) and overrepresentation ofother start codons (TTG and GTG). We thus believe that all thesecases cannot be artifacts (such as degradation products or incor-rect peptide identifications).
To exclude signal peptides from consideration, we consideronly noncovered peptides located within a distance of 18 aa orless from the start of the protein (signal peptides are typicallylonger than 18 aa). Thirty-three, 16, and 11 candidates are ob-served in So, Sf, and Sp, respectively. Comparative analysis of thethree Shewanella species is subsequently performed to validatethese candidates for late start codons.
Correlated peptidesTraditional MS/MS analysis is focused on identification of pro-teins and is less concerned with the question of which peptidesin a protein are observed or not observed. In this study, we utilizethe availability of proteomic data from related species to analyzethe expression of peptides at orthologous positions. In a typicalmass spectrometry experiment, some peptides with low detect-ability are always missed, resulting in highly nonuniform proteincoverage by identified peptides (Purvine et al. 2004; Kuster et al.2005). For example, while most ribosomal proteins in So havehigh coverage (>50%), a few have low coverage and one of themdoes not have any identified peptides. Peptide detectability maydepend on several factors including protein abundance, peptidelength, peptide hydrophobicity, etc., and several groups are us-ing large data sets to develop the ability to its prediction (Tang etal. 2006; Lu et al. 2007; Mallick et al. 2007).
All identified peptides in shared genes were mapped to thealignment of the orthologs to get their coordinates with respectto the alignment. This provides a uniform reference scale to com-pare the positions of observed peptides between the orthologousproteins in the three species, as individual proteins may havedifferent lengths. Peptides identified by MS/MS in two species arecalled correlated peptides if they are observed in the same posi-tion in the protein alignment or one of them spans another. Inother words, if one peptide is located at positions (start1, end1) inthe alignment, and the other peptide at (start2, end2), then pep-tides are considered correlated if start1 � start2 � end2 � end1 orstart2 � start1 � end1 � end2.
Identification of post-translational modificationsMS-Alignment (Tsur et al. 2005) was used to identify PTMs ineach of the three organisms in a blind mode, in the range from�200 to +250 Da. Common contaminants like keratins wereincluded in the protein sequence databases. A decoy database ofthe same size as the actual protein database, containing shuffledsequences, was used to control the error rates. Any hits to thedecoy database are expected to be incorrect identifications. Ascore cutoff is chosen such that the number of PTM sites identi-fied in the decoy database is at most 5% of the number of iden-tifications in the target database. This provides a controlled PTMsite-specific false-discovery rate of 5%. We note that this is a morestringent criterion than a 5% error rate at the spectrum or peptidelevel, since several peptides in the forward database may point tothe same PTM site. We further removed all spectra that wereidentified in the regular InsPecT search. After this post-processing
Gupta et al.
1140 Genome Researchwww.genome.org

of MS-Alignment results, 9917, 7649, and 6709 PTMs were ob-tained in So, Sf, and Sp, respectively (the complete lists alongwith the DTA files of spectra are available from http://proteomics .bioprojects .org/Downloads/spectra_and_peptideLists_supplement.zip). We only use tryptic-modified pep-tides in the subsequent analysis.
AcknowledgmentsWe thank Andrei Osterman for many insightful comments. Thiswork was supported by National Institutes of Health GrantNIGMS 1-R01-RR16522 and by the Howard Hughes Medical In-stitute Professor Award. Part of this research at Pacific NorthwestNational Laboratory was supported by the Genomics:GtL Pro-gram, Office of Biological and Environmental Research, U.S. De-partment of Energy. Pacific Northwest National Laboratory is op-erated for the DOE by Batelle Memorial Institute under ContractDE-AC06-76RLO 1830.
References
Altschul, S., Madden, T.L., Schäffer, A.A., Zhang, J., Zhang, Z., Miller,W., and Lipman, D.J. 1997. Gapped BLAST and PSI-BLAST: A newgeneration of protein database search programs. Nucleic Acids Res.25: 3389–3402.
Antelmann, H., Tjalsma, H., Voigt, B., Ohlmeier, S., Bron, S., van Dijl, J.,and Hecker, M. 2001. A proteomic view on genome-based signalpeptide predictions. Genome Res. 11: 1484–1502.
Batzoglou, S., Pachter, L., Mesirov, J., Berger, B., and Lander, E. 2000.Human and mouse gene structure: Comparative analysis andapplication to exon prediction. Genome Res. 10: 950–958.
Ben-Bassat, A., Bauer, K., Chang, S., Myambo, K., Boosman, A., andChang, S. 1987. Processing of the initiation methionine fromproteins: Properties of the Escherichia coli methionineaminopeptidase and its gene structure. J. Bacteriol. 169: 751–757.
Bendtsen, J., Nielsen, H., von Heijne, G., and Brunak, S. 2004. Improvedprediction of signal peptides: SignalP 3.0. J. Mol. Biol. 340: 783–795.
Bradshaw, R., Burlingame, A., Carr, S., and Aebersold, R. 2006.Reporting protein identification data: The next generation ofguidelines. Mol. Cell. Proteomics 5: 787–788.
Brown, N., Sander, C., and Bork, P. 1998. Frame: Detection of genomicsequencing errors. Bioinformatics 14: 367–371.
Carr, S., Aebersold, R., Baldwin, M., Burlingame, A., Clauser, K., andNesvizhskii, A. 2004. The need for guidelines in publication ofpeptide and protein identification data: Working group onpublication guidelines for peptide and protein identification data.Mol. Cell. Proteomics 3: 531–533.
Chenna, R., Sugawara, H., Koike, T., Lopez, R., Gibson, T., Higgins, D.,and Thompson, J. 2003. Multiple sequence alignment with theClustal series of programs. Nucleic Acids Res. 31: 3497–3500.
Clamp, M., Fry, B., Kamal, M., Xie, X., Cuff, J., Lin, M., Kellis, M.,Lindblad-Toh, K., and Lander, E. 2007. Distinguishingprotein-coding and noncoding genes in the human genome. Proc.Natl. Acad. Sci. 104: 19428–19433.
Claverie, J. 1993. Detecting frame shifts by amino acid sequencecomparison. J. Mol. Biol. 234: 1140–1157.
Craigen, W., Cook, R., Tate, W., and Caskey, C. 1985. Bacterial peptidechain release factors: Conserved primary structure and possibleframeshift regulation of release factor 2. Proc. Natl. Acad. Sci.82: 3616–3620.
Daraselia, N., Dernovoy, D., Tian, Y., Borodovsky, M., Tatusov, R., andTatusova, T. 2003. Reannotation of Shewanella oneidensis genome.OMICS 7: 171–176.
Demirev, P., Lin, J., Pineda, F., and Fenselau, C. 2001. Bioinformaticsand mass spectrometry for microorganism identification:Proteome-wide post-translational modifications and database searchalgorithms for characterization of intact H. pylori. Anal. Chem.73: 4566–4573.
Edgar, R. 2004. MUSCLE: Multiple sequence alignment with highaccuracy and high throughput. Nucleic Acids Res. 32: 1792–1797.
Ermolaeva, M., White, O., and Salzberg, S. 2001. Prediction of operonsin microbial genomes. Nucleic Acids Res. 29: 1216–1221.
Farabaugh, P. 1996. Programmed translational frameshifting. Microbiol.Mol. Biol. Rev. 60: 103–134.
Fermin, D., Allen, B., Blackwell, T., Menon, R., Adamski, M., Xu, Y.,Ulintz, P., Omenn, G., and States, D. 2006. Novel gene and genemodel detection using a whole genome open reading frame analysisin proteomics. Genome Biol. 7: R35. doi: 10.1186/gb-2006-7-4-r35.
Fichant, G. and Quentin, Y. 1995. A frameshift error detectionalgorithm for DNA sequencing projects. Nucleic Acids Res.23: 2900–2908.
Fleischmann, R., Adams, M., White, O., Clayton, R., Kirkness, E.,Kerlavage, A., Bult, C., Tomb, J., Dougherty, B., Merrick, J., et al.1995. Whole-genome random sequencing and assembly ofHaemophilus influenzae Rd. Science 269: 496–498.
Gnad, F., Ren, S., Cox, J., Olsen, J., Macek, B., Oroshi, M., and Mann,M. 2007. PHOSIDA (phosphorylation site database): Management,structural and evolutionary investigation, and prediction ofphosphosites. Genome Biol. 8: R250. doi: 10.1186/gb-2007-8-11-r250.
Gupta, N., Tanner, S., Jaitly, N., Adkins, J., Lipton, M., Edwards, R.,Romine, M., Osterman, A., Bafna, V., Smith, R., et al. 2007. Wholeproteome analysis of post-translational modifications: Applicationsof mass-spectrometry for proteogenomic annotation. Genome Res.17: 1362–1377.
Heidelberg, J., Paulsen, I.T., Nelson, K.E., Gaidos, E.J., Nelson, W.C.,Read, T.D., Eisen, J.A., Seshadri, R., Ward, N., Methe, B., et al. 2002.Genome sequence of the dissimilatory metal ion-reducing bacteriumShewanella oneidensis. Nat. Biotechnol. 20: 1118–1123.
Jaffe, J., Berg, H., and Church, G. 2004. Proteogenomic mapping as acomplementary method to perform genome annotation. Proteomics4: 59–77.
Kalume, D., Peri, S., Reddy, R., Zhong, J., Okulate, M., Kumar, N., andPandey, A. 2005. Genome annotation of Anopheles gambiae usingmass spectrometry-derived data. BMC Genomics 6: 128. doi:10.1186/1471-2164-6-128.
Kang, X., Rogers, K., Gao, G., Falick, A., Zhou, S., and Simpson, L. 2005.Reconstitution of uridine-deletion precleaved RNA editing with tworecombinant enzymes. Proc. Natl. Acad. Sci. 102: 1017–1022.
Kellis, M., Patterson, N., Endrizzi, M., Birren, B., and Lander, E. 2003.Sequencing and comparison of yeast species to identify genes andregulatory elements. Nature 423: 241–254.
Kuster, B., Schirle, M., Mallick, P., and Aebersold, R. 2005. Scoringproteomes with proteotypic peptide probes. Nat. Rev. Mol. Cell Biol.6: 577–583.
Liu, S., Milne, G., Kuremsky, J., Fink, G., and Leppla, S. 2004.Identification of the proteins required for biosynthesis ofdiphthamide, the target of bacterial ADP-ribosylating toxins ontranslation elongation factor 2. Mol. Cell. Biol. 24: 9487–9497.
Lu, P., Vogel, C., Wang, R., Yao, X., and Marcotte, E. 2007. Absoluteprotein expression profiling estimates the relative contributions oftranscriptional and translational regulation. Nat. Biotechnol.25: 117–124.
Macek, B., Gnad, F., Soufi, B., Kumar, C., Olsen, J., Mijakovic, I., andMann, M. 2008. Phosphoproteome analysis of E. coli revealsevolutionary conservation of bacterial Ser/Thr/Tyr phosphorylation.Mol. Cell. Proteomics 7: 299–307.
Mallick, P., Schirle, M., Chen, S., Flory, M., Lee, H., Martin, D., Ranish,J., Raught, B., Schmitt, R., Werner, T., et al. 2007. Computationalprediction of proteotypic peptides for quantitative proteomics. Nat.Biotechnol. 25: 125–131.
Medigue, C., Rose, M., Viari, A., and Danchin, A. 1999. Detecting andanalyzing DNA sequencing errors: Toward a higher quality of theBacillus subtilis genome sequence. Genome Res. 9: 1116–1127.
Moehring, J., Moehring, T., and Danley, D. 1980. Post-translationalmodification of elongation factor 2 in diphtheria-toxin-resistantmutants of CHO-K1 cells. Proc. Natl. Acad. Sci. 77: 1010–1014.
Nealson, K., Belz, A., and McKee, B. 2002. Breathing metals as a way oflife: Geobiology in action. Antonie Van Leeuwenhoek 81: 215–222.
Nielsen, M., Savitski, M., and Zubarev, R. 2006. Extent of modificationsin human proteome samples and their effect on dynamic range ofanalysis in shotgun proteomics. Mol. Cell. Proteomics 5: 2384–2391.
Olson, K., Fenno, J., Lin, N., Harkins, R., Snider, C., Kohr, W., Ross, M.,Fodge, D., Prender, G., Stebbing, N., et al. 1981. Purified humangrowth hormone from E. coli is biologically active. Nature293: 408–411.
Posfai, J. and Roberts, R. 1992. Finding errors in DNA sequences. Proc.Natl. Acad. Sci. 89: 4698–4702.
Price, M., Huang, K., Alm, E., and Arkin, A. 2005. A novel method foraccurate operon predictions in all sequenced prokaryotes. NucleicAcids Res. 33: 880–892.
Purvine, S., Picone, A., and Kolker, E. 2004. Standard mixtures forproteome studies. OMICS 8: 79–92.
Remm, M., Storm, C., and Sonnhammer, E. 2001. Automatic clusteringof orthologs and in-paralogs from pairwise species comparisons. J.Mol. Biol. 314: 1041–1052.
Comparative proteogenomics
Genome Research 1141www.genome.org

Rodriguez, J., Gupta, N., Smith, R., and Pevzner, P. 2008. Does trypsincut before proline? J. Proteome Res. 7: 300–305.
Savidor, A., Donahoo, R., Hurtado-Gonzales, O., Verberkmoes, N., Shah,M., Lamour, K., and McDonald, W. 2006. Expressed peptide tags: Anadditional layer of data for genome annotation. J. Proteome Res.5: 3048–3058.
Savitski, M., Nielsen, M., and Zubarev, R. 2006. Modificomb, a newproteomic tool for mapping substoichiometric post-translationalmodifications, finding novel types of modifications, andfingerprinting complex protein mixtures. Mol. Cell. Proteomics5: 935–948.
Tang, H., Arnold, R., Alves, P., Xun, Z., Clemmer, D., Novotny, M.,Reilly, J., and Rejivojac, P. 2006. A computational approach towardlabel-free protein quantification using predicted peptidedetectability. Bioinformatics 22: e481–e488. doi:10.1093/bioinformatics/btl237.
Tanner, S., Shu, H., Frank, A., Wang, L., Zandi, E., Mumby, M., Pevzner,P., and Bafna, V. 2005. InsPecT: Fast and accurate identification ofpost-translationally modified peptides from tandem mass spectra.Anal. Chem. 77: 4626–4639.
Tanner, S., Shen, Z., Ng, J., Florea, L., Guigo, R., Briggs, S., and Bafna, V.2007. Improving gene annotation using peptide mass spectrometry.Genome Res. 17: 231–239.
Thompson, M., Thompson, D., and Hettich, R. 2008. Systematicassessment of the benefits and caveats in mining microbialpost-translational modifications from shotgun proteomic data: Theresponse of Shewanella oneidensis to chromate exposure. J. ProteomeRes. 7: 648–658.
Tobias, J., Shrader, T., Rocap, G., and Varshavsky, A. 1991. The N-endrule in bacteria. Science 254: 1374–1377.
Tsur, D., Tanner, S., Zandi, E., Bafna, V., and Pevzner, P. 2005.Identification of post-translational modifications via blind search ofmass spectra. Nat. Biotechnol. 23: 1562–1567.
Tu, C., Tzeng, T., and Bruenn, J. 1992. Ribosomal movement impeded
at a pseudoknot required for frameshifting. Proc. Natl. Acad. Sci.89: 8636–8640.
Van Ness, B., Howard, J., and Bodley, J. 1980. ADP-ribosylation ofelongation factor 2 by diphtheria toxin. NMR spectra and proposedstructures of ribosyl-diphthamide and its hydrolysis products. J. Biol.Chem. 255: 10710–10716.
Wang, R., Prince, J., and Marcotte, E. 2005. Mass spectrometry of the M.smegmatis proteome: Protein expression levels correlate withfunction, operons, and codon bias. Genome Res. 15: 1118–1126.
Whitelegge, J., Zhang, H., Aguilera, R., Taylor, R., and Cramer, W. 2002.Full subunit coverage liquid chromatography electrospray ionizationmass spectrometry (LCMS+) of an oligomeric membrane protein:Cytochrome b6f complex from spinach and the cyanobacteriumMastigocladus laminosus. Mol. Cell. Proteomics 1: 816–827.
Wilmarth, P., Tanner, S., Dasari, S., Nagalla, S., Riviere, M., Bafna, V.,Pevzner, P., and David, L. 2006. Age-related changes in humancrystallins determined from comparative analysis ofpost-translational modifications in young and aged lens: Doesdeamidation contribute to crystallin insolubility? J. Proteome Res.5: 2554–2566.
Xie, X., Lu, J., Kulbokas, E., Golub, T., Mootha, V., Lindblad-Toh, K.,Lander, E., and Kellis, M. 2005. Systematic discovery of regulatorymotifs in human promoters and 3� UTRs by comparison of severalmammals. Nature 434: 338–345.
Yang, C., Rodionov, D., Li, X., Laikova, O., Gelfand, M., Zagnitko, O.,Romine, M., Obraztsova, A., Nealson, K., Osterman, A., et al. 2006.Comparative genomics and experimental characterization ofN-acetylglucosamine utilization pathway of Shewanella oneidensis. J.Biol. Chem. 281: 29872–29885.
Received November 12, 2007; accepted in revised form April 2, 2008.
Gupta et al.
1142 Genome Researchwww.genome.org
Copyright © 2022 FDOKUMEN