Marques prosodiques de la focalisation contrastive en somali
Upload
khangminh22Category
view
0download
0
Comparative phylogeography of theSomali-Masai region in eastern Africausing selected rodent species as a model
Tatiana AghováPh.D. dissertation
Brno, 2018
MASARYK UNIVERSITY Faculty of Science
Department of Botany and Zoology
Comparative phylogeography of the
Somali-Masai region in eastern Africa
using selected rodent species as a model
Tatiana Aghová
Ph.D. dissertation
Supervisor: doc. Mgr. et Mgr. Josef Bryja, Ph.D. Co-supervisor: doc. Mgr. Radim Šumbera, Ph.D.
Brno 2018

Bibliographic Entry Author: Mgr. Tatiana Aghová Faculty of Science, Masaryk University Department of Botany and Zoology Title of Thesis: Comparative phylogeography of the Somali-Masai
region in eastern Africa using selected rodent species as a model
Degree programme: Biology Field of Study: Zoology Supervisor: doc. Mgr. et Mgr. Josef Bryja, Ph.D.
Institute of Vertebrate Biology AS CR, v.v.i Co-supervisor: doc. Mgr. Radim Šumbera, Ph.D.
Faculty of Science, University of South Bohemia in !"#$%&'()*+,-.! Department of zoology
Academic Year: 2017/2018 Number of Pages: 285 Keywords: Somali-Masai savanna, phylogeography, rodents,
Nannomys, Gerbilliscus, Saccostomus, Acomys

Bibliografický záznam Autor: Mgr. Tatiana Aghová !"#$%$&'%()*+,-.*/01.2,3.4.#5*$&.,/67&(#871. Ústav botaniky a zoologie Názov práce: Porovnávacia fylogeografia východoafrickej oblasti
Somali-Masai na príklade modelovej skupiny hlodavcov
91/%7:6;,<#$=#.>: Biológia 91/%7:6;,$?$#: Zoológia 9*$071(@: doc. Mgr. et Mgr. Josef Bryja, Ph.D. A41.&,?7$0$=7(,$?#.10$&)B,CD,EF2,&G&G7 Konzultant: %$)G,3=#G,F.%7>,9/>?(#.2, HGIG
J"#$%$&'%()*+,-.*/01.2,K7H$L(4*+,/67&(#871.,v E(4*;)H,M/%':$&7)")H
Katedra zoologie Akademický rok: 2017/2018 $L(1,41#+6: 285 N@OL$&P,40$&+: Somali-Masai savana, fylogeografia, hlodavce,
Nannomys, Gerbilliscus, Saccostomus, Acomys

ABSTRACT
The Somali-Masai region, and especially its non-forested savanna-like ecosystems, is one of
the least known ecoregions of Africa from biogeographic point of view. For example,
information on genetic structure within specialized species or among closely related species is
entirely missing; therefore making it difficult to assess which historical factors (e.g. Plio-
Pleistocene climate fluctuations, geomorphological barriers, etc.) have influenced the evolution
of savanna biota in this part of Eastern Africa.
Small mammals, and especially rodents, are suitable model for phylogeographic
reconstructions, because they are tightly linked to specific habitat type, have low dispersal
ability and relatively high substitution rate of mitochondrial DNA. In the present PhD study, I
have analyzed for the first time the genetic structure of four rodent genera preferring open
habitats and living (at least partly) in Somali-Masai region: pygmy mice (Mus), pouched mice
(Saccostomus), gerbils (Gerbilliscus), and spiny mice (Acomys).
For the first part of the thesis, I summarized the genetic diversity of model taxa and
showed that in each genus studied there are lineages endemic to Somali-Masai region. Some of
them might correspond to new species which should be further analysed by integrative
taxonomic revision. For second part, I provided a revised list of nine fossils that could be
considered as reference constraints for molecular clock calibrations for murid rodents. Finally,
for the third part I reconstructed the history of Somali-Masai savanna, including the
identification of the most important long-term geographical barriers of gene flow (e.g. mountain
chains, aridity belts, paleo-lakes), which have played an important role in the evolution of
savanna ecosystems in Eastern Africa especially during the Plio-Pleistocene. Results of the
comparative phylogeographic study can shed light also on evolutionary history of other
savanna-living organisms, including our own ancestors (as numerous crucial localities for
studies of human evolution are located in the Somali-Masai region).


ABSTRAKT
Región Somali-Masai (predovšetkým savanové ekosystémy) patria k najmenej preskúmaným oblastiam
Afriky z biogeografického hladiska; chýbajú základné genetické informácie o vnútrodruhovej
a !"#$"%&'()!*+ ,-%&.-/%!+ 01)12()34'+ (%512$# ()6+ 7%!-(+ *!+ )!8 $+ (9-$1:2!+ $"!2-$;$.()1<+ '$0-(%$4.=+
faktory (ako Plio-Pleistocéne klimatické zmeny, geomorfologické bariéry, a->6?@+ .-(%=+ ()ABC)2$B$+
evolúciu savanovej bioty vo východnej Afrike.
D%(92=+ 4$41)4!@+ A%!"(),!-.3 + 'B("1)4!+ 0/+ )'("23 + ("!B()3 + (%512$# ( + A%!+
;CB(5!(5%1;$4.=+%!.(2,-%&.4$!+# 2$!.(8.34'+"E)("()6+F/+)$1#12=+21+,A!4$;$4.3+-CA+'19$-1-&@+ 1*/+2G#.&+
04'(A2(0<+ $5%()1<+21+ )!8.=+)#"$1B!2(0-$+ 1 %!B1-G)2!+)C0(./+ &-1H2/+ %34'B(0<+ 21+ $-(4'(2"%$IB2!*+
DNA. V A%!".B1"12!*+"$#!%-1H2!*+A%I4$+0( +121BC#()1B1+5!2!-$4./+,-%&.-/%&+,-C%(4'+%("()+'B("1)4()@+
.-(%=+:$*/+A%!"(),!-.3 JH$10-(H2!+) otvorených habitatoch v Somali-Masai regióne: myš (Mus, podrod
Nannomys), Saccostomus, pieskomil (Gerbilliscus) a C,+9("B$21-I+KAcomys).
V A%)!*+ H10-$+ "$#!%-I4$!+ 01+ #1 !%$1)1 + 21+ 5!2!-$4./+ "$)!%#$-&+ ("!B()34'+ -1LM2()6+ N,!-.C+
,-&"()12=+%("C+ 1*/+!2"! $4.=+5!2!-$4.=+BG2$!+) Somali-Masai regióne, niektoré z nich predstavujú
nové druhy a 1B$+9C+9C<+A("%(9!2=+$2-!5%1-G)2!*+-1L(2( $4.!*+%!)G#$$6+N "%&'!*+H10-$+A%$2I,1 +#(#21 +
"!)$1-$4'+ ;(0GB$G@+ .-(%=+ E:&+9C<+A(&:$-=+1.(+ %!;!%!2H2=+.1B$9%1H2=+9("C+ A%!+ (B!.&BI%2!+ "1-()12$!+
hlodavcov. V tretej H10-$+ %!.(2,-%&&*! +'$0-M%$&+ 01)12C+F( 1B$-Masai a $"!2-$;$.&*! +21*"EB!:$-!*,$!+
"B'("(9=+ 5!(5%1;$4.=+ 91%$=%C+ A%!+ -(.+ 5=2()+ K21A%6+ '(%0.=+ 10G)C@+ A/,-!@+ A1B!(-jazerá), ktoré hrali
významnú rolu v !)(B/4$$+ 01)12()34'+ !.(0C0-= ()+ )(+ )34'("2!*+ O;%$.!+ A(H10+ 7Bio-Pleistocénu.
N30B!".C+ (*!*+A(%()2I)14!*+;CB(5!(5%1;$4.!*+,-/"$!+ E:&+A( E4<+(9*102$<+!)(B&H2/+'$0-M%$&+>1B,G4'+
01)12()34'+(%512$# ()@+)%I-12!+2I,'(+)B10-2='(+A%!"4'("4&+K%("+Homo?6+7%!-(:!+ 2(:0-)(+#I01"234'+
B(.1BG-+A%!+,-/"$& +8&"0.!*+!)(B/4$!+*!+A%I)e v Somali-Masai regióne.


© Tatiana Aghová, Masaryk University, 2018

ACKNOWLEDGEMENT
First, I would like to thank my wonderful supervisor, Josef Bryja. He trusted me from our first
meeting and guided me in the scientific world including editing my documents (many of which
had bad grammar), giving me the opportunity to travel for conferences and fieldworks,
introducing me to local and international collaborators, and giving me space to work on my
own, he showed me how to have fun, balance work and life, and he has tought me lot of non-
scientific skills as well (e.g. how travel through airports and how to tap a beer ). He is great
inspiration for me and an example for how to be a great scientist and kind human as well.
THANK YOU PEPA!
I acknowledge my great co-supervisor Radim Šumbera, who was my support in
difficult situations and for his humor, /012#3+ !"4*5 for his sence for perfect analysis (even
if it makes me crazy sometimes). Special thanks to 675+8-93%&' and :50"5+;%0&!<"%&', who
introduced me to the molecular lab and =5>?5-+@AB"%&' and C4D%$+E!'*#" for their help with
NGS sequencing. For the field expedition, I would like to say big thanks Vladimír Mazoch for
his patience (and lot of fun too ), Yonas Meheretu in Ethiopia, Jana Vrbová Komárková
and Christopher Sabuni for Tanzania fieldwork and all local collaborators. Additional thanks
goes out to our international colaborators, who significantly help me increase quality of my
research: Leonid Lavrenchenko for numerous Ethiopian samples, Molly M. McDonough, for
long discussions about our favourite genus Gerbilliscus and for correction of my English, Yuri
Kimura, who help me with fossils and support my scientific ideas. Big thanks also to my
supervisors at CBGP Montpellier: Laurent Granjon for taking care of me, Gauthier Dobigny
for motivation finishing things on time, Gael J. Kergoat from whom I learned a lot about
analyses, but also how important is to analyze and write with a focus on every detail. I thank
also Alexandre Dehne-Garcia for helping me with cluster and his optimism when I needed it.
At University of Antwerp I would like to thank Frederik Van De Perre, Erik Verheyen and
Herwig Leirs, for giving me their trust in the challenging molecular part of COBIMFO project
and Natalie van Houtte for her laboratory and personnel support. It was big pleasure to work
with you! Special thanks to my colleagues at Natural History Museum in Prague, they give
me their trust in sequencing museum specimens and at the same time give me time and space
to finish my PhD. For the administrative part during my whole PhD I acknowledge Andrea
!"#$"%&' and (!)%*#+,-!*!..


Here, I would like to thank all the people in Institute in Vertebrate Biology in
Studenec. During last six years you become my second family . I would like to thanks Stuart
Baird for correction of my English. I acknowledge also my friend and female scientific idol,
Joëlle Goüy de Bellocq, thank you for your support, it was my honor to share an office with
you. The biggest THANKS goes to my best friend, colleague and roommate Terka Králová
who shared with me all the victories and downs during my PhD. Thank you all, earning my
PhD was one of the best parts of my entire life!
And last, but not least I would like to thank my family and friends. They supported me
in my decisions, even if sometimes they did not understand why I would like to go somewhere
or do something or even if they were afraid for me lot of time. They give me the trust in myself,
when I didn’t see it. Thank you and I love you!
FUNDING
This PhD dissertation was supported by projects of the Czech Science Foundation, nos.
P506/10/0983 and 15-20229S, the Ministry of Culture of the Czech Republic (DKRVO
2017/15, National Museum, 00023272). Additionally the travel cost were covered from Projects
of specific research on Masaryk University (2012-2017), NextGen Project
(CZ.1.07/2.3./20.0303 !" #$%&'(&)" *+," -./+,*01.+" 23*,4+5" 6*78-*!" '*918" *" :,8;<="
Hlávkových”.


TABLE OF CONTENTS Preface ........................................................................................................ 19
Introduction................................................................................................. 21
Aims of the thesis ....................................................................................... 28
Methods ...................................................................................................... 29
Summary of main results ............................................................................ 34
Conclusions and future directions .............................................................. 48
References................................................................................................... 51
Paper I ......................................................................................................... 61
Paper II........................................................................................................ 83
Paper III ......................................................................................................109
Paper IV ......................................................................................................125
Paper V ....................................................................................................... 199
Appendix..................................................................................................... 271
19
21
28
29
34
48
51
61
83
109
125
199
271

19
Tatiana Aghová / Ph.D. dissertation (2018)
PREFACE
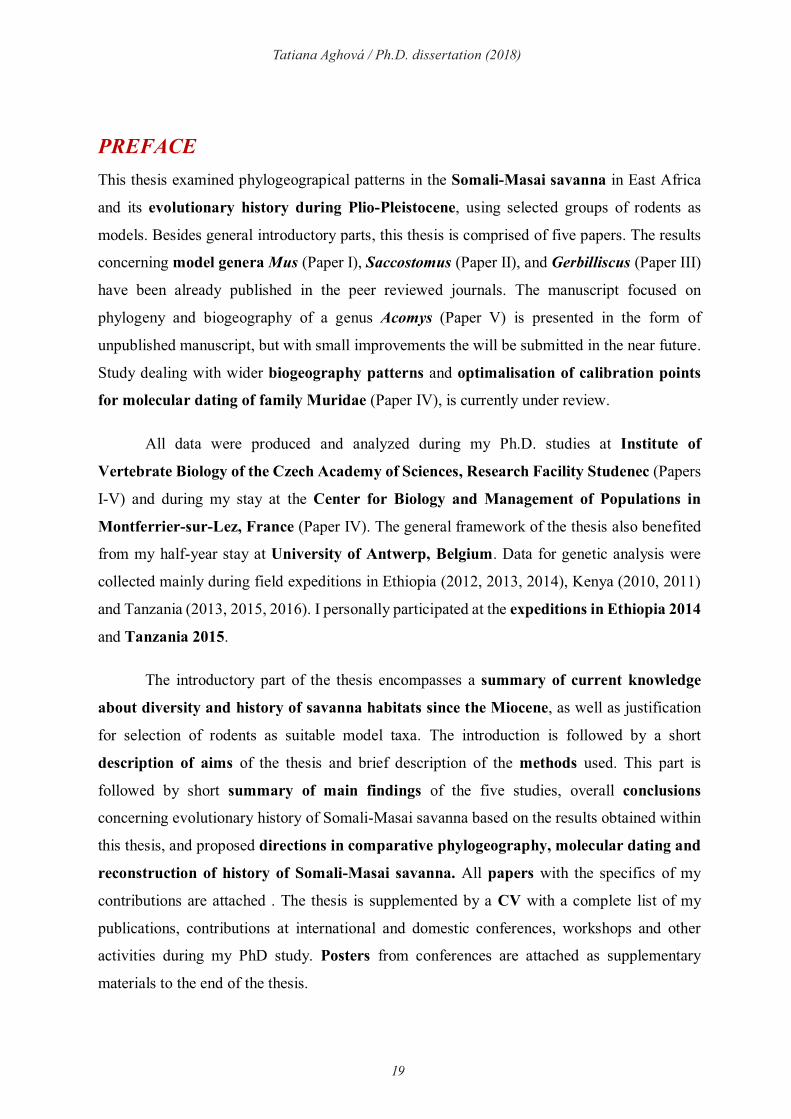
This thesis examined phylogeograpical patterns in the Somali-Masai savanna in East Africa
and its evolutionary history during Plio-Pleistocene, using selected groups of rodents as
models. Besides general introductory parts, this thesis is comprised of five papers. The results
concerning model genera Mus (Paper I), Saccostomus (Paper II), and Gerbilliscus (Paper III)
have been already published in the peer reviewed journals. The manuscript focused on
phylogeny and biogeography of a genus Acomys (Paper V) is presented in the form of
unpublished manuscript, but with small improvements the will be submitted in the near future.
Study dealing with wider biogeography patterns and optimalisation of calibration points
for molecular dating of family Muridae (Paper IV), is currently under review.
All data were produced and analyzed during my Ph.D. studies at Institute of
Vertebrate Biology of the Czech Academy of Sciences, Research Facility Studenec (Papers
I-V) and during my stay at the Center for Biology and Management of Populations in
Montferrier-sur-Lez, France (Paper IV). The general framework of the thesis also benefited
from my half-year stay at University of Antwerp, Belgium. Data for genetic analysis were
collected mainly during field expeditions in Ethiopia (2012, 2013, 2014), Kenya (2010, 2011)
and Tanzania (2013, 2015, 2016). I personally participated at the expeditions in Ethiopia 2014
and Tanzania 2015.
The introductory part of the thesis encompasses a summary of current knowledge
about diversity and history of savanna habitats since the Miocene, as well as justification
for selection of rodents as suitable model taxa. The introduction is followed by a short
description of aims of the thesis and brief description of the methods used. This part is
followed by short summary of main findings of the five studies, overall conclusions
concerning evolutionary history of Somali-Masai savanna based on the results obtained within
this thesis, and proposed directions in comparative phylogeography, molecular dating and
reconstruction of history of Somali-Masai savanna. All papers with the specifics of my
contributions are attached . The thesis is supplemented by a CV with a complete list of my
publications, contributions at international and domestic conferences, workshops and other
activities during my PhD study. Posters from conferences are attached as supplementary
materials to the end of the thesis.

20
Tatiana Aghová / Ph.D. dissertation (2018)
List of papers included in the thesis:
I. Bryja, J., Mikula, O., Šumbera, R., Meheretu, Y., Aghová, T., Lavrenchenko, L. A.,
Mazoch, V., Oguge, N., Mbau, J.S., Welegerima, K., Amundala, N., Colyn, M., Leirs,
H., Verheyen, E., 2014. Pan-African phylogeny of Mus (subgenus Nannomys) reveals
one of the most successful mammal radiations in Africa. BMC Evolutionary Biology,
14(1), 256.
II. Mikula, O., Šumbera, R., Aghová, T., Mbau, J.S., Bryja, J., 2016. Evolutionary history
and species diversity of African Pouched Mice of the genus Saccostomus (Rodentia:
Nesomyidae). Zoologica Scripta, 45(6), 595-617.
III. Aghová, T., Šumbera, R., Piálek, L., Mikula, O., McDonough, M.M., Lavrenchenko,
L.A., Meheretu, Y., Mbau, J.S., Bryja, J., 2017. Multilocus phylogeny of East African
gerbils (Rodentia, Gerbilliscus) illuminates the history of the Somali-Masai savanna.
Journal of Biogeography, 44(10), 2295–2307.
IV. Aghová T., Kimura Y, Bryja J., Dobigny G., Granjon L., Kergoat G.J.: Fossils know it
best: using a new set of fossil calibrations to improve the temporal phylogenetic
framework of murid rodents (Rodentia: Myomorpha: Muroidea: Muridae).
(Molecular Phylogenetics and Evolution, Major revision)
V. Aghová, T. !"#$%&'()*+, !-. !Šumbera, R., Frynta, D, Lavrenchenko, L.A., Meheretu,
Y., Sádlová, J., Votýpka, J., Mbau, J.S., Modrý, D., Bryja, J.: Multiple radiations of
spiny mice (Rodentia: Acomys) in arid environments of Afro-Arabia: evidence from
multi-locus phylogeny. (Prepared for BMC Evolutionary Biology)
21
Tatiana Aghová / Ph.D. dissertation (2018)
INTRODUCTION
Diversity of African ecosystems
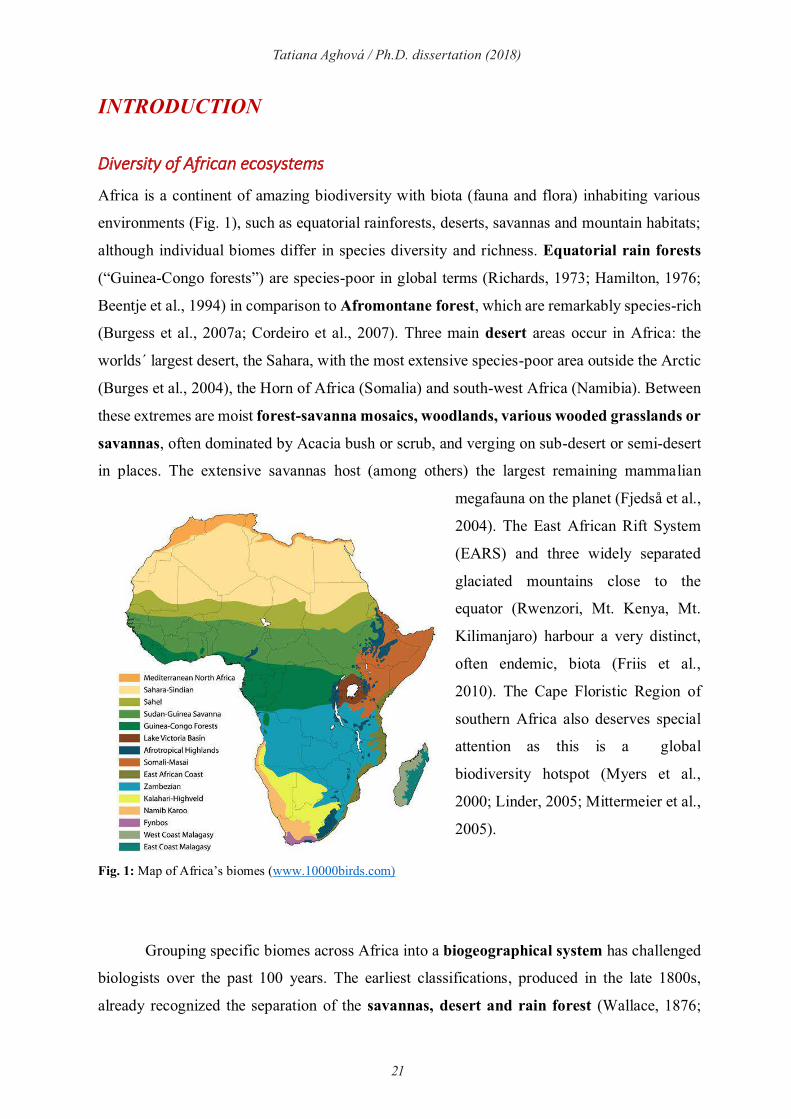
Africa is a continent of amazing biodiversity with biota (fauna and flora) inhabiting various
environments (Fig. 1), such as equatorial rainforests, deserts, savannas and mountain habitats;
although individual biomes differ in species diversity and richness. Equatorial rain forests
(“Guinea-Congo forests”) are species-poor in global terms (Richards, 1973; Hamilton, 1976;
Beentje et al., 1994) in comparison to Afromontane forest, which are remarkably species-rich
(Burgess et al., 2007a; Cordeiro et al., 2007). Three main desert areas occur in Africa: the
worlds´ largest desert, the Sahara, with the most extensive species-poor area outside the Arctic
(Burges et al., 2004), the Horn of Africa (Somalia) and south-west Africa (Namibia). Between
these extremes are moist forest-savanna mosaics, woodlands, various wooded grasslands or
savannas, often dominated by Acacia bush or scrub, and verging on sub-desert or semi-desert
in places. The extensive savannas host (among others) the largest remaining mammalian
megafauna on the planet (Fjedså et al.,
2004). The East African Rift System
(EARS) and three widely separated
glaciated mountains close to the
equator (Rwenzori, Mt. Kenya, Mt.
Kilimanjaro) harbour a very distinct,
often endemic, biota (Friis et al.,
2010). The Cape Floristic Region of
southern Africa also deserves special
attention as this is a global
biodiversity hotspot (Myers et al.,
2000; Linder, 2005; Mittermeier et al.,
2005).
Fig. 1: Map of Africa’s biomes (www.10000birds.com)
Grouping specific biomes across Africa into a biogeographical system has challenged
biologists over the past 100 years. The earliest classifications, produced in the late 1800s,
already recognized the separation of the savannas, desert and rain forest (Wallace, 1876;
22
Tatiana Aghová / Ph.D. dissertation (2018)
Engler, 1879–1882). A century later, White (1983) defined a set of phytochoria for Africa and
estimated the number of species and the degree of endemism in each phytochorion. The
phytochoria were fundamentally based on species-level distribution patterns and were derived
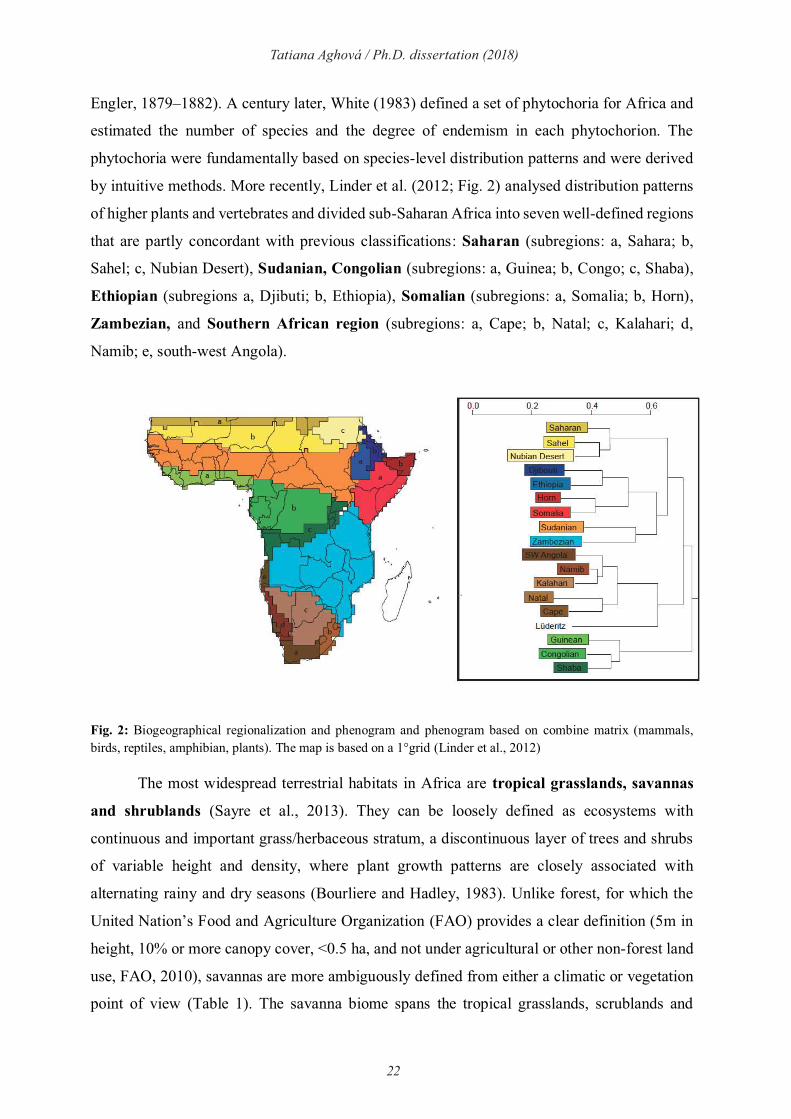
by intuitive methods. More recently, Linder et al. (2012; Fig. 2) analysed distribution patterns
of higher plants and vertebrates and divided sub-Saharan Africa into seven well-defined regions
that are partly concordant with previous classifications: Saharan (subregions: a, Sahara; b,
Sahel; c, Nubian Desert), Sudanian, Congolian (subregions: a, Guinea; b, Congo; c, Shaba),
Ethiopian (subregions a, Djibuti; b, Ethiopia), Somalian (subregions: a, Somalia; b, Horn),
Zambezian, and Southern African region (subregions: a, Cape; b, Natal; c, Kalahari; d,
Namib; e, south-west Angola).
Fig. 2: Biogeographical regionalization and phenogram and phenogram based on combine matrix (mammals, birds, reptiles, amphibian, plants). The map is based on a 1°grid (Linder et al., 2012)
The most widespread terrestrial habitats in Africa are tropical grasslands, savannas
and shrublands (Sayre et al., 2013). They can be loosely defined as ecosystems with
continuous and important grass/herbaceous stratum, a discontinuous layer of trees and shrubs
of variable height and density, where plant growth patterns are closely associated with
alternating rainy and dry seasons (Bourliere and Hadley, 1983). Unlike forest, for which the
United Nation’s Food and Agriculture Organization (FAO) provides a clear definition (5m in
height, 10% or more canopy cover, <0.5 ha, and not under agricultural or other non-forest land
use, FAO, 2010), savannas are more ambiguously defined from either a climatic or vegetation
point of view (Table 1). The savanna biome spans the tropical grasslands, scrublands and
23
Tatiana Aghová / Ph.D. dissertation (2018)
wooded savannas of sub-Saharan Africa, encompassing the Sahel (the vast semi-arid region of
North Africa south of the Sahara), the Rift Valley formation in equatorial East Africa and most
of Southern Africa (Mayaux et al., 2004). Four biogeographical regions with predominating
savanna-like habitats were distinguished across African continent (e.g. Linder et al. 2012; Fig.
2): Zambezian, Somalian, Sudanian and South African savanna. Affected mainly by
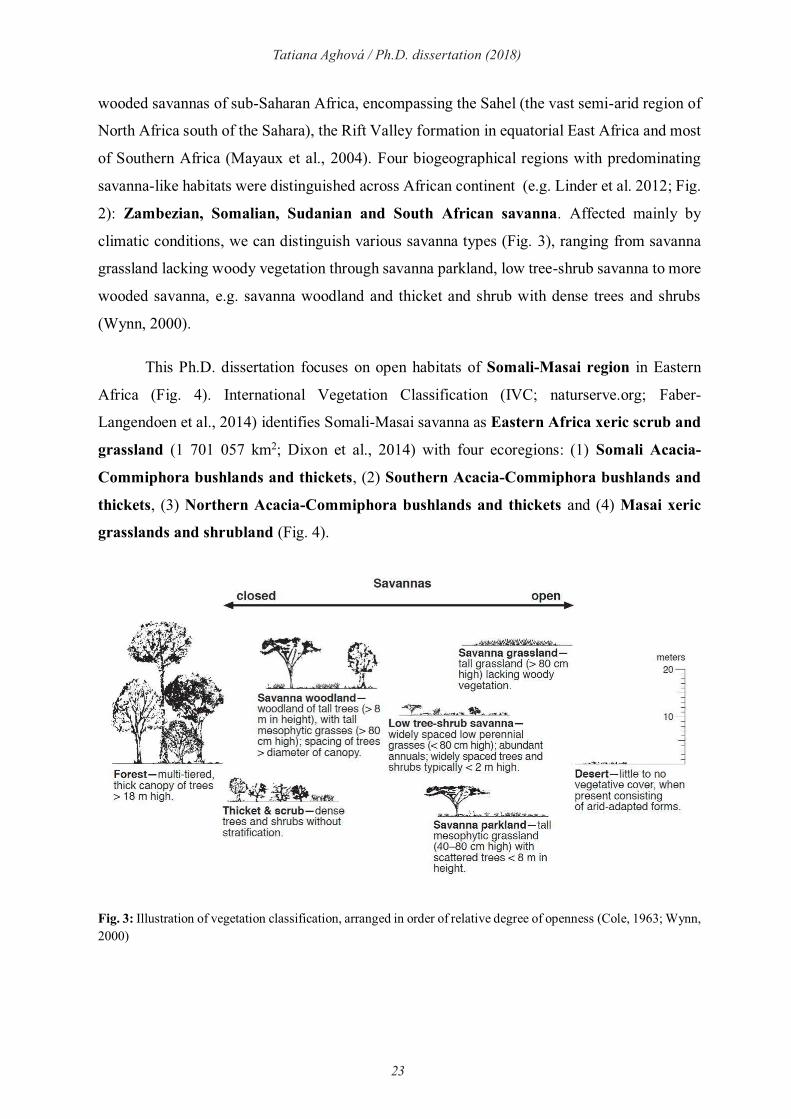
climatic conditions, we can distinguish various savanna types (Fig. 3), ranging from savanna
grassland lacking woody vegetation through savanna parkland, low tree-shrub savanna to more
wooded savanna, e.g. savanna woodland and thicket and shrub with dense trees and shrubs
(Wynn, 2000).
This Ph.D. dissertation focuses on open habitats of Somali-Masai region in Eastern
Africa (Fig. 4). International Vegetation Classification (IVC; naturserve.org; Faber-
Langendoen et al., 2014) identifies Somali-Masai savanna as Eastern Africa xeric scrub and
grassland (1 701 057 km2; Dixon et al., 2014) with four ecoregions: (1) Somali Acacia-
Commiphora bushlands and thickets, (2) Southern Acacia-Commiphora bushlands and
thickets, (3) Northern Acacia-Commiphora bushlands and thickets and (4) Masai xeric
grasslands and shrubland (Fig. 4).
Fig. 3: Illustration of vegetation classification, arranged in order of relative degree of openness (Cole, 1963; Wynn, 2000)

24
Tatiana Aghová / Ph.D. dissertation (2018)
Table 1: Definitions of savannas (based on Mistry, 2000; Mistry and Beradi, 2014)
Definition of savanna Authors
Climatic
Ecosystems which lie in the tropical savanna and monsoon climatic zones, largely between the latitudes of Cancer and Capricorn, where annual precipitation is between 250 and 2000 mm, most of which falls in the wet season
Köppen (1990, 1884)
Any formation or landscape within the region experiencing a winter dry season and summer rains is a savanna.
Jaeger (1945), Lauer (1952), Troll (1950),
Ecosystems bound by dry forests at higher rainfall (> 1000 mm), by thorn forests at lower rainfall (< 500 mm), and by thorn steppe and temperate savannas at lower temperatures (< 18°C)
Holdrige (1947)
Ecosystems with low to moderate rainfall (500-1300 mm) and high mean annual temperatures (18-30 °C)
Whittaker (1975)
Vegetation
A mixed physiognomy of grasses and woody plants in any geographical area
Dansereau (1957)
A mixed tropical formation of grasses and woody plants, expluding pure grasslands
Walter (1973)
Open formations dominated by grasses, in the lowland tropics, where trees and shrubs, if presnt, are of little physiognomic significance
Beard (1953), Whittaker (1975)
Fig. 4: Distribution of Somali-Masai savanna with four Terrestrial Ecoregions of the World (TEOW; modified from Dixon et al., 2014)

25
Tatiana Aghová / Ph.D. dissertation (2018)
Ecosystems which lie in the tropical savanna and monsoon climatic
Any formation or landscape within the region experiencing a winter dry
Ecosystems bound by dry forests at higher rainfall (> 1000 mm), by
1300 mm) and high
of grasses and woody plants in any geographical
A mixed tropical formation of grasses and woody plants, expluding pure
Open formations dominated by grasses, in the lowland tropics, where , Whittaker
Distribution, diversity and history of the Somali-Masai savanna
The Somali-Masai region was originally proposed by White (1983) as a distinct dry
phytochorion, extending from Eritrea to Tanzania (Fig. 4). This region exhibits complex
climatic and topographical patterns resulting in different biologies of the taxa (Linder et al.,
2012). The major geomorphological feature in this region is the East African Rift System
(EARS, Fig. 5), which has a long-term influence on the climatic regime in Africa (Sepulchre et
al., 2006). While this region has relatively low floristic and faunistic species diversity, a high
level of endemism exists for plants (Thulin, 1993), reptiles (Burgess et al., 2007b) and rodents
(Varshavsky et al., 2007). This region is home to the Horn of Africa biodiversity hotspot,
which ranks among the oldest and most stable arid regions of Africa (Kingdon, 1990). Thulin
(1994) proposed this region as a refugium for arid-adapted plants, from there Socotra, Arabia
and southern Africa were
subsequently colonised. Importanty,
this region is one of the least known
African bioregions and possibly also
one of the most threatened due to
the rapid increase of human
populations and climatic changes
(Geist & Lambin, 2004).
Fig. 5: The East African Rift System with its rift segments. The basemap is a Space Shuttle radar topography image by NASA (authors Wood and Guth, https://geology.com/articles/east-africa-rift.shtml )
The current biological diversity of Somali-Masai savanna was influenced mainly by
global climate changes and by local tectonic processes, especially the development of the
EARS (Sepulchre et al., 2006). Volcanism associated with the Great Rift Valley began as early
as 45-33 Ma in the Ethiopian Rift (Maslin and Trauth, 2009). Major faulting in Ethiopia occured
between 20-14 Ma and was followed by faulting in northern Kenya between 12 and 7 Ma.
Central and southern Kenya Rift was formed between 9 and 6 Ma (Baker et al., 1988; Strecker
26
Tatiana Aghová / Ph.D. dissertation (2018)
et al., 1990; Ebinger et al., 2000; Maslin and Trauth, 2009). In the Tanzanian sector of the rift,
sedimentation in isolated basins began at ~5 Ma (Foster et al., 1997). A major phase of rift
faulting occurred at 1.2 Ma and produced the present-day rift escarpments (Foster et al., 1997).
In combination with Plio-Pleistocene climatic changes promoting expansion of C4 grasses
(Cerling et al., 1998), Eastern Africa became a center of endemism for organisms living in
open habitats (Kingdon, 2015). Many evolutionary divergent clades of ungulates such as
warthog (Randi et al., 2002); lesser kudu, desert warhog, Grevy’s zebra, Grant’s gazelle
(Lorenzen et al., 2012), giraffe (Brown et al., 2007; Fennessy et al., 2016), evolved in Somali-
Masai savanna.
Rodents as suitable model group for phylogeographical studies
Murid rodents (Rodentia: Muridae) are excellent model organisms for biological research
for several reasons. It is the most diverse family of mammals with more than 155 genera and
816 recognized species (Denys et al., 2017). They colonized different ecological niches in a
wide array of environments ranging from warm (deserts or tropical forests) to cold habitats such
as high altitude mountain ranges (Vaughan et al., 2011). Life habits in murids are also diverse,
as the family encompasses amphibious, arboreal, fossorial or terrestrial taxa (Musser and
Carleton, 2005). Family Muridae also includes two key mammalian model organisms: the lab
mouse (Mus) and rat (Rattus). They are widely used in biomedicine, physiology, genetics and
evolutionary biology.
More than 60 zoonotic diseases (diseases transmitted from free-living animals to
humans or livestock) can be transmitted from rodents via direct and indirect ways (see the
comprehensive review of Meerburg et al., 2009). For example, African rodents are reservoirs
for arenaviruses, e.g. Lassa (Fichet-Calvet and Rogers, 2009), Mopeia, Luna, Mobala
(Meheretu et al., 2012); hantaviruses, e.g. Sangassou (Klempa et al., 2006) and Tigray (Goüy
de Bellocq et al., 2016). Most of these viruses were detected in the tribe Praomyini (e.g. host
rodent species Mastomys natalensis, M. awashensis, Stenocephalemys albipes, Hylomyscus
simus). Other genera within Muridae can function as reservoirs as well. For example, Lecompte
et al. (2007) detected a new arenavirus Kodoko from Mus minutoides. Kassahun et al. (2015)
identified parasitic protozoans from the genus Leishmania in gerbils (Gerbillinae:
Gerbilliscus nigricaudus, Gerbillus nannus), spiny mice (Deomyinae: Acomys sp.) and murines
(Murinae: Arvicanthis sp. and Mastomys erythroleucus).

27
Tatiana Aghová / Ph.D. dissertation (2018)
Rodents are also very good candidates for inferring the biogeographic history for a
particular ecosystems by inferring contemporary patterns of genetic variation owing to their
short generation time and rapid mtDNA substitution rate, their relatively limited dispersal
ability, and their close associations with particular habitats (Fedorov et al., 2008). Their
outstanding diversity combined with their widespread and abundant distribution and rich fossil
record, makes them a excellent model for phylo(bio-)geographical studies. In this thesis four
model genera of African rodents were selected: three genera from the family Muridae (Murinae:
Mus, Gerbillinae: Gerbilliscus, Deomyinae: Acomys) and one genus from the family
Nesomyidae (Saccostomus; Fig. 6). All of them live in savanna ecosystems in Eastern Africa,
and analysis of their evolutionary history can thus help to understand which factors affected
evolution of these ecosystems.
a) b)
c) d)
Fig.6: Model taxa: a) Nannomys ( !"#$%&'(%)(*+&,-); b) Saccostomus . !"#$%&/!01(% &2-34&53&Gerbilliscus (author /!01(% &2-34&63&Acomys (http://www.hlasek.com/acomys_cahirinus1sk.html)
28
Tatiana Aghová / Ph.D. dissertation (2018)
AIMS OF THE THESIS
Somali-Masai savanna in East Africa is one of the least known African biogeographic regions.
Information about itraspecific genetic structure or genetic structure among closely related
species is almost absent from this region. Thus, it is difficult to assess which factors (e.g. Plio-
Pleiostocene climate fluctuations, geomorphological barriers, etc.) have influenced the
evolution of savanna biota in this part of Africa. Understanding the drivers and mechanisms
of species diversification and persistence is of central interest to biogeography, evolutionary
biology and conservation genetics (Frankham et al., 2004, Höglund, 2009). Furthermore,
comparative phylogeography could provide robust conclusions regarding biogeographical
processes operating during the Plio-Pleistocene in Eastern Africa. In this Ph.D. dissertation
three main aims were defined:
1. Description of genetic diversity of four model rodent genera inhabiting Somali-Masai
savanna with suggestions for possible taxonomic implications (Paper I-III, V).
2. Optimalization of methods for divergence dating in phylo(bio-)geographic
reconstructions of murid rodents (Paper IV).
3. Reconstruction of evolutionary history of Somali-Masai savanna during Plio-
Pleistocene and identification of factors that have influenced current distribution of
genetic diversity in this ecosystem (Paper I-III, V).
29
Tatiana Aghová / Ph.D. dissertation (2018)
METHODS
Data collection
Material collected during recent field expeditions to Ethiopia, Kenya and Tanzania was
supplemented by additonal material (especially tissue samples) from American Museum of
Natural History (AMNH, New York), Natural History Museum (BMNH, London), Magyar
Természettudományi Múzeum (HNHM, Budapest), Institut des Sciences de l’Evolution (ISEM,
Montpellier), Livingstone Museum (LM, Livingstone), Museum of Comparative Zoology
(MCZ, Boston), Museum of Vertebrate Zoology (MVZ, Berkeley), Muséum national d’Histoire
naturelle (MNHN, Paris), Institut royal des Sciences naturelles de Belgique (RBINS, Brussel),
Musée royal de l’Afrique centrale (RMCA, Tervuren), Senckenberg Museum (SMF, Fankfurt),
Staatliches Museum für Naturkunde (SMNS, Stuttgart), Ditsong National Museum of Natural
History (TM, Pretoria), Texas Tech University (TTU, Lubbock), Smithosonian Institution-
National Museum of Natural History (USNM, Washington, D.C.) and Museum für Naturkunde
(ZMB, Berlin).
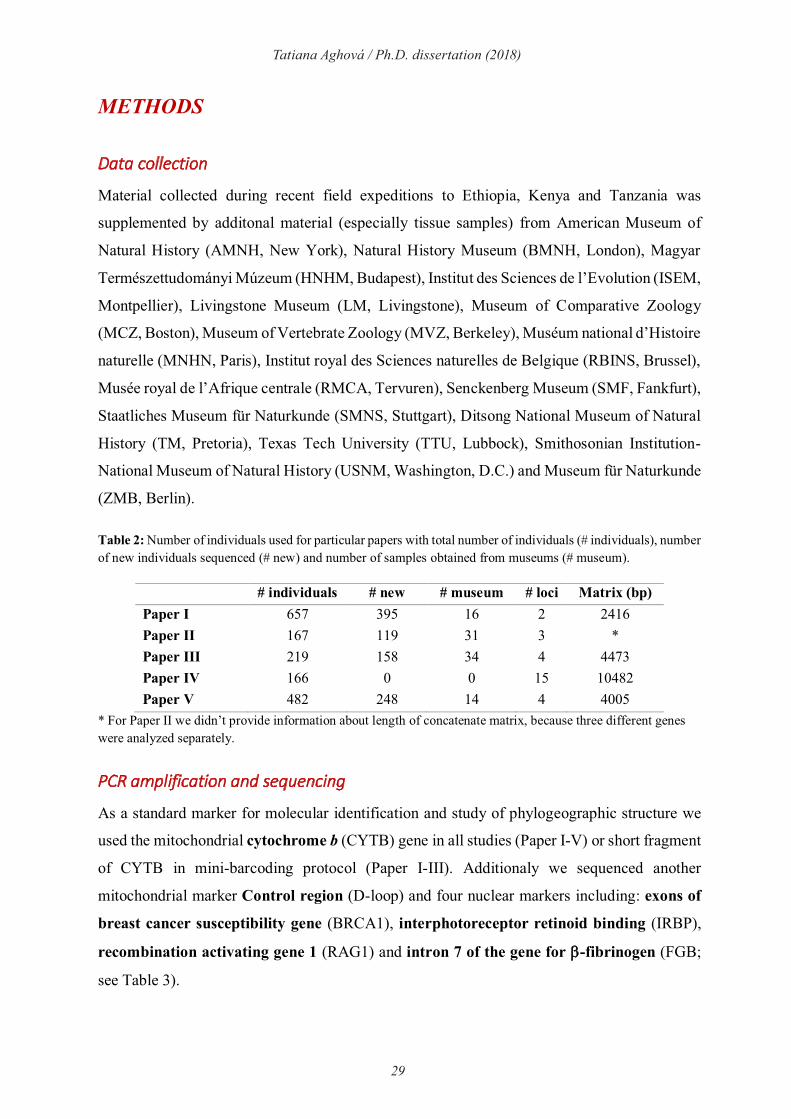
Table 2: Number of individuals used for particular papers with total number of individuals (# individuals), number of new individuals sequenced (# new) and number of samples obtained from museums (# museum).
# individuals # new # museum # loci Matrix (bp)
Paper I 657 395 16 2 2416
Paper II 167 119 31 3 *
Paper III 219 158 34 4 4473
Paper IV 166 0 0 15 10482
Paper V 482 248 14 4 4005
* For Paper II we didn’t provide information about length of concatenate matrix, because three different genes were analyzed separately.
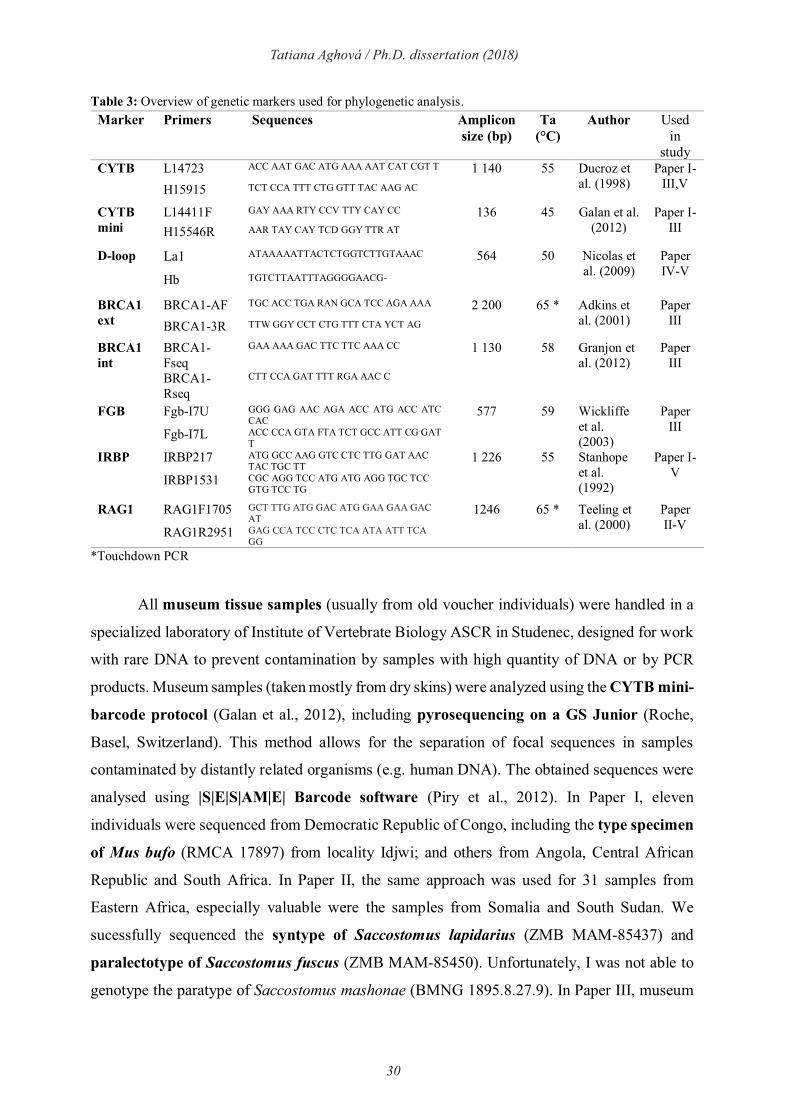
PCR amplification and sequencing
As a standard marker for molecular identification and study of phylogeographic structure we
used the mitochondrial cytochrome b (CYTB) gene in all studies (Paper I-V) or short fragment
of CYTB in mini-barcoding protocol (Paper I-III). Additionaly we sequenced another
mitochondrial marker Control region (D-loop) and four nuclear markers including: exons of
breast cancer susceptibility gene (BRCA1), interphotoreceptor retinoid binding (IRBP),
recombination activating gene 1 (RAG1) and intron 7 of the gene for -fibrinogen (FGB;
see Table 3).
30
Tatiana Aghová / Ph.D. dissertation (2018)
Table 3: Overview of genetic markers used for phylogenetic analysis.
Marker Primers Sequences Amplicon
size (bp) Ta
(°C)
Author Used in
study CYTB L14723 ACC AAT GAC ATG AAA AAT CAT CGT T 1 140 55 Ducroz et
al. (1998) Paper I-
III,V H15915 TCT CCA TTT CTG GTT TAC AAG AC
CYTB
mini
L14411F GAY AAA RTY CCV TTY CAY CC 136 45 Galan et al. (2012)
Paper I-III H15546R AAR TAY CAY TCD GGY TTR AT
D-loop La1 ATAAAAATTACTCTGGTCTTGTAAAC 564 50 Nicolas et al. (2009)
Paper IV-V
Hb TGTCTTAATTTAGGGGAACG-
BRCA1
ext
BRCA1-AF TGC ACC TGA RAN GCA TCC AGA AAA 2 200 65 * Adkins et al. (2001)
Paper III BRCA1-3R TTW GGY CCT CTG TTT CTA YCT AG
BRCA1
int
BRCA1-Fseq
GAA AAA GAC TTC TTC AAA CC 1 130 58 Granjon et al. (2012)
Paper III
BRCA1-Rseq
CTT CCA GAT TTT RGA AAC C
FGB Fgb-I7U GGG GAG AAC AGA ACC ATG ACC ATC CAC
577 59 Wickliffe et al. (2003)
Paper III
Fgb-I7L ACC CCA GTA FTA TCT GCC ATT CG GAT T
IRBP IRBP217 ATG GCC AAG GTC CTC TTG GAT AAC TAC TGC TT
1 226 55 Stanhope et al. (1992)
Paper I-V
IRBP1531 CGC AGG TCC ATG ATG AGG TGC TCC GTG TCC TG
RAG1 RAG1F1705 GCT TTG ATG GAC ATG GAA GAA GAC AT
1246 65 * Teeling et al. (2000)
Paper II-V
RAG1R2951 GAG CCA TCC CTC TCA ATA ATT TCA GG
*Touchdown PCR
All museum tissue samples (usually from old voucher individuals) were handled in a
specialized laboratory of Institute of Vertebrate Biology ASCR in Studenec, designed for work
with rare DNA to prevent contamination by samples with high quantity of DNA or by PCR
products. Museum samples (taken mostly from dry skins) were analyzed using the CYTB mini-
barcode protocol (Galan et al., 2012), including pyrosequencing on a GS Junior (Roche,
Basel, Switzerland). This method allows for the separation of focal sequences in samples
contaminated by distantly related organisms (e.g. human DNA). The obtained sequences were
analysed using |S|E|S|AM|E| Barcode software (Piry et al., 2012). In Paper I, eleven
individuals were sequenced from Democratic Republic of Congo, including the type specimen
of Mus bufo (RMCA 17897) from locality Idjwi; and others from Angola, Central African
Republic and South Africa. In Paper II, the same approach was used for 31 samples from
Eastern Africa, especially valuable were the samples from Somalia and South Sudan. We
sucessfully sequenced the syntype of Saccostomus lapidarius (ZMB MAM-85437) and
paralectotype of Saccostomus fuscus (ZMB MAM-85450). Unfortunately, I was not able to
genotype the paratype of Saccostomus mashonae (BMNG 1895.8.27.9). In Paper III, museum
31
Tatiana Aghová / Ph.D. dissertation (2018)
Marker Amplicon Ta Author Used
ACC AAT GAC ATG AAA AAT CAT CGT T 55 et Paper I-
CYTB 45 Galan et al. Paper I-
50 Nicolas et Paper
BRCA1 AF 65 * et Paper
3R
BRCA1 58 Granjon et Paper
GGG GAG AAC AGA ACC ATG ACC ATC 59 Wickliffe Paper
ACC CCA GTA FTA TCT GCC ATT CG GAT
ATG GCC AAG GTC CTC TTG GAT AAC 55 Stanhope Paper I-
CGC AGG TCC ATG ATG AGG TGC TCC
RAG1F1705 ATG GAA GAA GAC 65 * Teeling et Paper
RAG1R2951
specimens were important from more reasons. First, we sequenced syntype of Gerbilliscus
nigricaudus bayeri (RMCA 5183-M) from Maroon River (Kenya), and additional samples
from South Sudan. Second, we broadened the range of putatively new species Gerbilliscus sp.
n. (Babile) by records from two new localities in Ethiopia and Somalia. Finally, we confirmed
distribution of G. robustus from Ethiopia to Chad by genotyping museum vouchers from Sudan.
Paper V includes recently collected specimens from various museum, therefore, these samples
were processed using standard protocols (specifically it concerns the samples from Djibouti,
Egypt, Jordan, Niger, South Africa and Yemen). Most important are the tissue samples from
Djibouti (601474, 601476, 602643) which may represent a new species of Acomys, and material
of Acomys subspinosus (VV2001118), which represents the first nuclear data, therby resolving
the phylogenetic position of this very distinct taxon.
Phylogenetic analysis, species delimitation and divergence dating
Phylogenetic analyses were conducted using both Bayesian inference (BI; MrBayes v3.2.6,
Ronquist et al., 2012a) and maximum likelihood (ML; RAxML v8.2.8, Stamatakis, 2014).
Analyses were performed on the online computer cluster CIPRES Science Gateway (Miller et
al., 2010; www.phylo.org) and on the high performance computing (HPC) cluster hosted in
the Centre de Biologie pour la Gestion des Populations (CBGP) in Montferrier-sur-Lez, France
or METACENTRUM (https://metavo.metacentrum.cz). For both phylogenetic analytical
approaches we carried out partitioned analyses to improve phylogenetic accuracy (Nylander et
al., 2004). The best partitioning scheme and substitution models were determined with
PartitionFinder 1.1.1 (Lanfear et al., 2014).
For species delimitation we used several alternative approaches: (i) single locus
delimitation with Generalized Mixed Yule Coalescent (GMYC, Pons et al., 2006) in Papers I
and V; multi-rate Poisson Tree Process (mPTP, Kapli et al., 2016) in Paper V, and Automatic
Barcode Gap Discovery (ABGD, Puillandre et al., 2012) in Paper V; and (ii) multilocus
coalescent based model Bayesian Phylogenetics & Phylogeography (BP&P, Yang and
Rannala, 2014) in Paper IV and Species Tree And Classification Estimation, Yarely (STACEY,
Jones 2014) in Paper V. The species tree was calculated under the Bayesian framework
implemented in *BEAST package (Heled & Drummond, 2010), an extension of BEAST 1.8.2
(Drummond et al., 2012).
32
Tatiana Aghová / Ph.D. dissertation (2018)
Bayesian relaxed-clock analyses were conducted with BEAST v1.8 (Drummond et al.,
2012) for Papers III-IV and BEAST v2.4 (Drummond et al., 2015) for Paper V. The priors for
fossil constraints (Papers I-V) were defined by using lognormal statistical distributions. The
final analyses were carried out by two independent runs each with 50 million generations and
trees sampled every 5,000 generations. We used a conservative burn-in of 12.5 million
generations per run. Post burn-in trees from both analyses were further combined using the
LogCombiner module of BEAST. Convergence of runs was assessed graphically under Tracer
v.1.6 and by examining the ESS of parameters.
Historical biogeography analysis
Ancestral biogeography was reconstructed using the R package BioGeoBEARS (Matzke,
2013). We constrained biogeographic areas depending on the aims of particular analysis: in
paper IV we followed Olson et al. (2001), and in Paper V we defined the regions using Linder
et al. (2012) and Holt et al. (2013). Six models of geographic range evolution were compared
in a likelihood framework: (i) Dispersal-Extinction Cladogenesis model (DEC) similar to
Lagrange (Ree and Smith, 2008), which parameterizes dispersal and extinction; (ii) DEC +J
model (Matzke, 2013; 2014), which adds founder-event speciation with long-distance dispersal
(cladogenesis, where daughter lineage is allowed to jump to a new range outside the range of
the ancestor; Matzke, 2013) to the DEC framework; (iii) Dispersal Vicariance Analysis (DIVA;
Ronquist, 1997); (iv) DIVA with long-distance dispersal (DIVA +J; Matzke, 2013); (v)
Bayesian inference of historical biogeography for discrete areas (BayArea; Landis et al., 2013);
and (vi) BayArea with long-distance dispersal (BayArea +J; Matzke, 2013). Model fit was
assessed using the Akaike information criterion (AIC) and likelihood-ratio tests (LRT).
Species distribution modelling
The present distribution of the East African Gerbilliscus, Saccostomus and Acomys was
predicted by maximum entropy modelling (MaxEnt, Phillips et al., 2006). Only CYTB-
barcoded specimens were included to avoid taxonomic confusion resulting in 66 unique
presence records for Gerbilliscus and 203 for Acomys. In Paper II, the georeferenced records
of Saccostomus were supplemented with records from public databases (e.g. African Rodentia,
Terryn et al., 2007; GBIF www.gbif.org, MaNIS www.manis.org). We used 19 BioClim
variables downloaded from the WorldClim website (Hijmans et al., 2005). We modelled
distribution of particular taxa in extant conditions as well as paleoclimatic projections for the
last glacial maximum (LGM, 21 ka; Braconnot et al. 2007) and the last interglacial (LIG,

33
Tatiana Aghová / Ph.D. dissertation (2018)
120-140ka; Otto-Bliesner et al. 2006). The species distribution modelling (SDM) analysis was
performed using MaxEnt v. 3.3.3k (Phillips et al. 2004) or using interface with R computing
environment by packages ‘dismo’ (Hijmans et al., 2016) and ‘ENMeval’ (Muscarella et al.,
2014).
Beside SDM presented in Papers II, III, and V, we performed additional SDM for
comparative purpose at finer scale for five clades living in sympatry in Somali-Masai savanna:
Acomys cahirinus group (background data composed of bioclimatic variables from 35
localities), Acomys wilsoni group (55 localities), Gerbilliscus nigricaudus group (20
localities), Gerbilliscus robustus group (81 localities) and Saccostomus mearnsi group (27
localities). We followed the methods described above. The results were convertet in map using
QGIS with treshold sensitivity-specificity sum maximize (Manel et al., 2001; Jiménez-
Valvarde and Lobo, 2007).

34
Tatiana Aghová / Ph.D. dissertation (2018)
SUMMARY OF MAIN RESULTS
Somali-Masai savanna harbours phylogenetically distinct lineages of rodents
Using comprehensive material collected by our team and collaborators, we analysed if and to
what extent the rodent diversity in the Somali-Masai savanna is distinct from neighbouring
biogeographical regions within savanna dominated ecosystems, especially compared to
Sudanian and Zambezian savannas. For this purpose we performed phylogenetic analyses of
four widespread rodent genera prefering open habitats. Three of them (Acomys, Mus, and
Gerbilliscus) are widespread across sub-Saharan Africa, while Saccostomus is limited to
eastern and southern Africa. Phylogenetic analyses unambiguously showed that the Somali-
Masai region harbours phylogenetically unique clades in all four genera and exhibit clades
that comprise species complexes, suitable for more detailed comparative phylogeographic
analysis. Although the presence of taxa specific to this region was expected, the occurrence of
endemic clades even in the most abundant rodent groups is surprising and predefines rodents
as suitable phylogeographic models for testing phylogeographic scenaria. Below, I summarize
the main results obtained by phylogenetic analysis of four rodent genera, with main focus on
genetic lineages living in Somali-Masai savanna.
Pygmy mice (genus Mus, subgenus Nannomys)
Rodents of the genus Mus represent one of the most valuable biological models for biomedical
and evolutionary research (Macholán et al., 2012). Currently, four subgenera of genus Mus are
recognized: Mus, Coelomys, Pyromys and Nannomys (Chevret et al., 2005). The African pygmy
mice, Nannomys (Fig. 6a), are small rodents (4-12 g in most taxa, but see Meheretu et al., 2014)
endemic to the sub-Saharan Africa. In Paper I, a comprehensive genetic analysis was
performed for 657 individuals of Nannomys collected at approximately 300 localities across
sub-Saharan Africa. Based on our analysis we provide evidence for African colonization from
Asia in end of Miocene. The radiation of the group started in Eastern Africa and resulted in
important cryptic diversity (27 molecular operational taxonomic units; "MOTUs"). The
subgenus is composed of three basal branches representing mountainous species (M. sp.
„Nyika“, M. imberbis and M. sp. „Harrena“) and five well supported species groups. We call
them herafter triton, setulosus, baoulei, sorella and minutoides groups, based on the
previous use of these names, representing the best known species within particular clades. The
subgenus Nannomys is distributed throughout sub-Saharan Africa (Fig. 7), but there are several
35
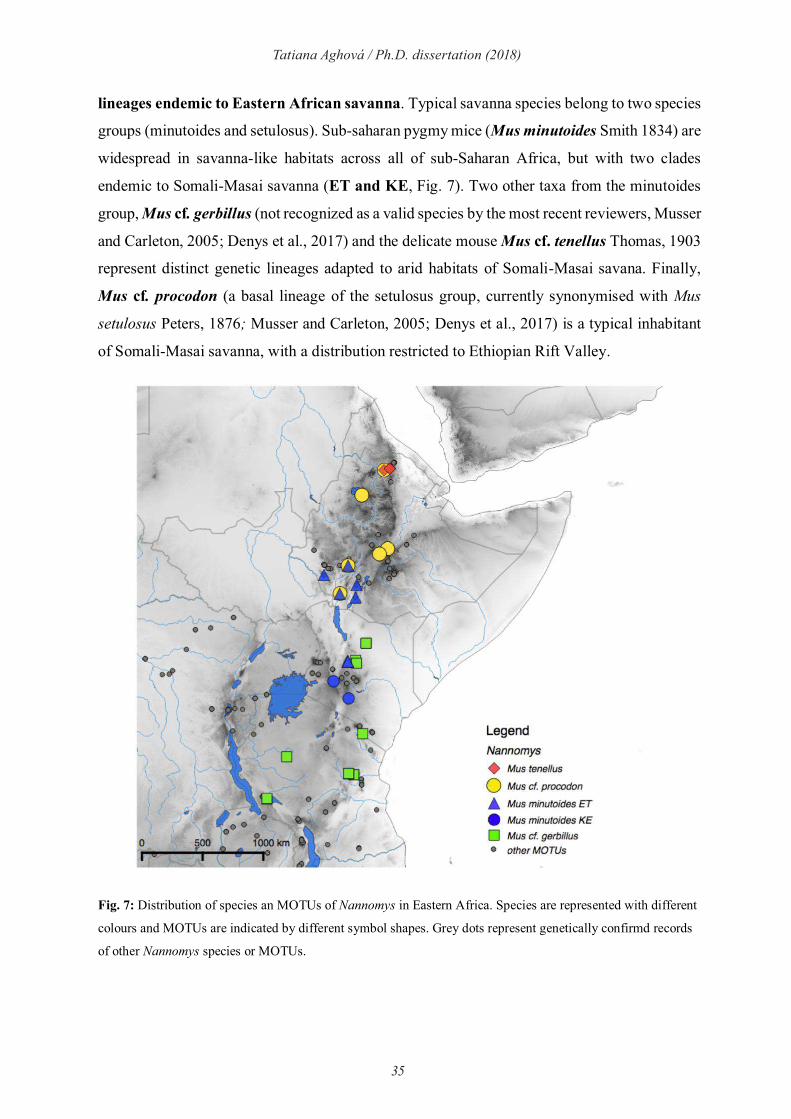
Tatiana Aghová / Ph.D. dissertation (2018)
lineages endemic to Eastern African savanna. Typical savanna species belong to two species
groups (minutoides and setulosus). Sub-saharan pygmy mice (Mus minutoides Smith 1834) are
widespread in savanna-like habitats across all of sub-Saharan Africa, but with two clades
endemic to Somali-Masai savanna (ET and KE, Fig. 7). Two other taxa from the minutoides
group, Mus cf. gerbillus (not recognized as a valid species by the most recent reviewers, Musser
and Carleton, 2005; Denys et al., 2017) and the delicate mouse Mus cf. tenellus Thomas, 1903
represent distinct genetic lineages adapted to arid habitats of Somali-Masai savana. Finally,
Mus cf. procodon (a basal lineage of the setulosus group, currently synonymised with Mus
setulosus Peters, 1876; Musser and Carleton, 2005; Denys et al., 2017) is a typical inhabitant
of Somali-Masai savanna, with a distribution restricted to Ethiopian Rift Valley.
Fig. 7: Distribution of species an MOTUs of Nannomys in Eastern Africa. Species are represented with different
colours and MOTUs are indicated by different symbol shapes. Grey dots represent genetically confirmd records
of other Nannomys species or MOTUs.

36
Tatiana Aghová / Ph.D. dissertation (2018)
The pouched mice (Saccostomus)
Pouched mice, of the genus Saccostomus (Fig. 6b) are typical inhabitants of savannas in
southern and eastern Africa. Saccostomus are small to medium sized, slow-moving rodents,
which are locally abundant in highly seasonal environments of grasslands, savannas, shrublands
and woodlands of southern and eastern Africa (Gaster et al., 2007). In Paper II, we performed
analyses of genetic and morphological variability across the geographic distribution of the
genus. Results confirm the distinction between two recognized species complexes, S.
campestris and S. mearnsi with parapatric distributions in the Zambezian and Somali-Masai
bioregions, respectively. Our molecular and morphological data suggest cryptic diversity.
Southern African pouched mouse S. campestris group consists of two subspecies S. campestris
campestris (Peters, 1846; comprising two CYTB clades) and S. campestris mashonae (de
Winton, 1897) that are moderately differentiated, albeit distinct at nuclear IRBP marker and
skull form. Saccostomus mearnsi group consists of two species distributed in Somali-Masai
savanna, East African pouched mouse S. mearnsi Heller, 1910 and gray-bellied pouched mouse
S. umbriventer Miller, 1910. These lineages are markedly differentiated in both nuclear
markers and skull form and may possibly co-occur in south-western Kenya and north-eastern
Tanzania. The distribution of S. umbriventer is confined to the narrow belt in northern Tanzania
and southwest Kenya, whereas S. mearnsi is distributed from central Kenya to southern
Ethiopia, reaching South Sudan and southern Somalia, where the limits of its distribution are
unresolved (Fig. 8).

37
Tatiana Aghová / Ph.D. dissertation (2018)
Fig. 8: Distribution of Saccostomus mearnsi group in East Africa. Species are represented with different colours and shapes. Grey dots represent genetically confirmd records of Saccostomus campestris group.
Gerbils (Gerbilliscus)
Gerbils of the genus Gerbilliscus (Thomas, 1897; Fig. 6c) are widespread rodents living in
savannas, woodlands, grasslands and semi-deserts of sub-Saharan Africa. Currently, four main
clades of Gerbilliscus are recognized: eastern (Paper III), western (Granjon et al., 2012),
southern (McDonough et al., 2015) and the so-called Gerbillurus clade from south-western
Africa (Colangelo et al., 2007). The distribution of the eastern clade of Gerbilliscus (Fig.9) is
largely concordant with the borders of the Somali-Masai region and parapatric with respect to
western and southern clades of Gerbilliscus (Paper III). Multilocus genetic analyses of this
eastern clade provides existence of two main lineages - „robustus“ with four species (Fringe-
tailed gerbil G. robustus Cretzschmar, 1826, East African gerbil G. vicinus Peters, 1878,
Phillips’s gerbil G. phillipsi Winton, 1898 and G. sp. n. (Babile)) and „nigricaudus“ with two
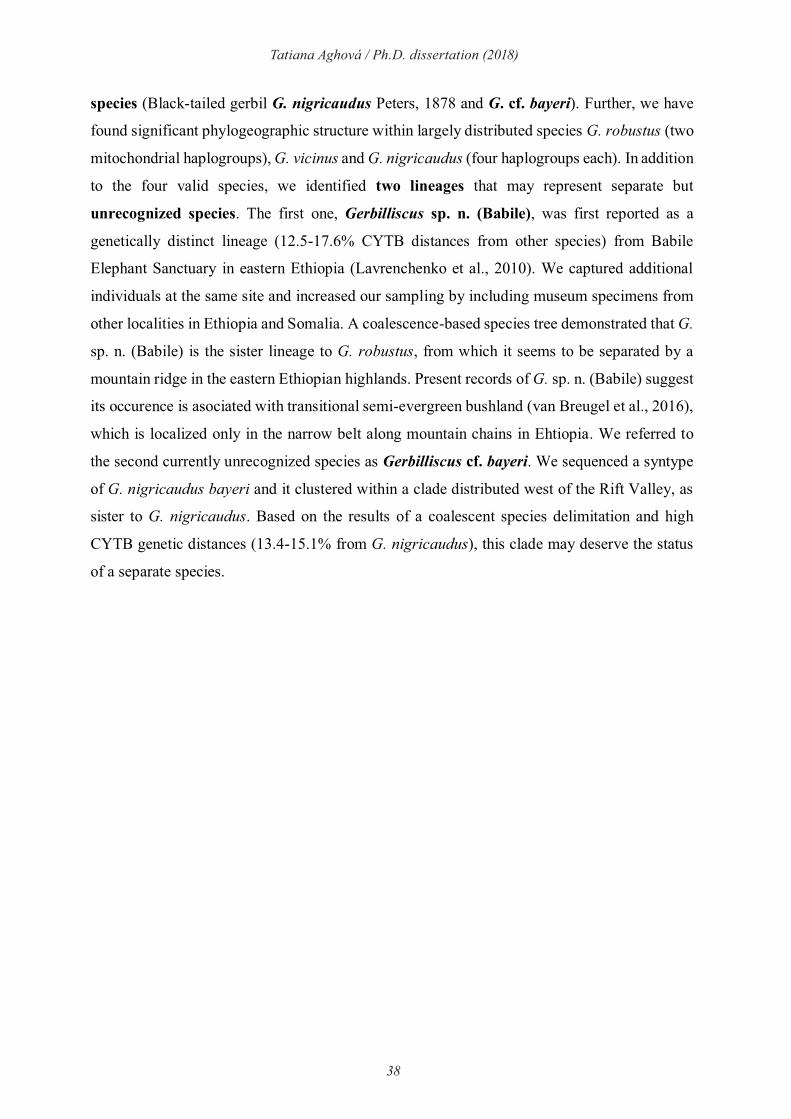
38
Tatiana Aghová / Ph.D. dissertation (2018)
species (Black-tailed gerbil G. nigricaudus Peters, 1878 and G. cf. bayeri). Further, we have
found significant phylogeographic structure within largely distributed species G. robustus (two
mitochondrial haplogroups), G. vicinus and G. nigricaudus (four haplogroups each). In addition
to the four valid species, we identified two lineages that may represent separate but
unrecognized species. The first one, Gerbilliscus sp. n. (Babile), was first reported as a
genetically distinct lineage (12.5-17.6% CYTB distances from other species) from Babile
Elephant Sanctuary in eastern Ethiopia (Lavrenchenko et al., 2010). We captured additional
individuals at the same site and increased our sampling by including museum specimens from
other localities in Ethiopia and Somalia. A coalescence-based species tree demonstrated that G.
sp. n. (Babile) is the sister lineage to G. robustus, from which it seems to be separated by a
mountain ridge in the eastern Ethiopian highlands. Present records of G. sp. n. (Babile) suggest
its occurence is asociated with transitional semi-evergreen bushland (van Breugel et al., 2016),
which is localized only in the narrow belt along mountain chains in Ehtiopia. We referred to
the second currently unrecognized species as Gerbilliscus cf. bayeri. We sequenced a syntype
of G. nigricaudus bayeri and it clustered within a clade distributed west of the Rift Valley, as
sister to G. nigricaudus. Based on the results of a coalescent species delimitation and high
CYTB genetic distances (13.4-15.1% from G. nigricaudus), this clade may deserve the status
of a separate species.
39
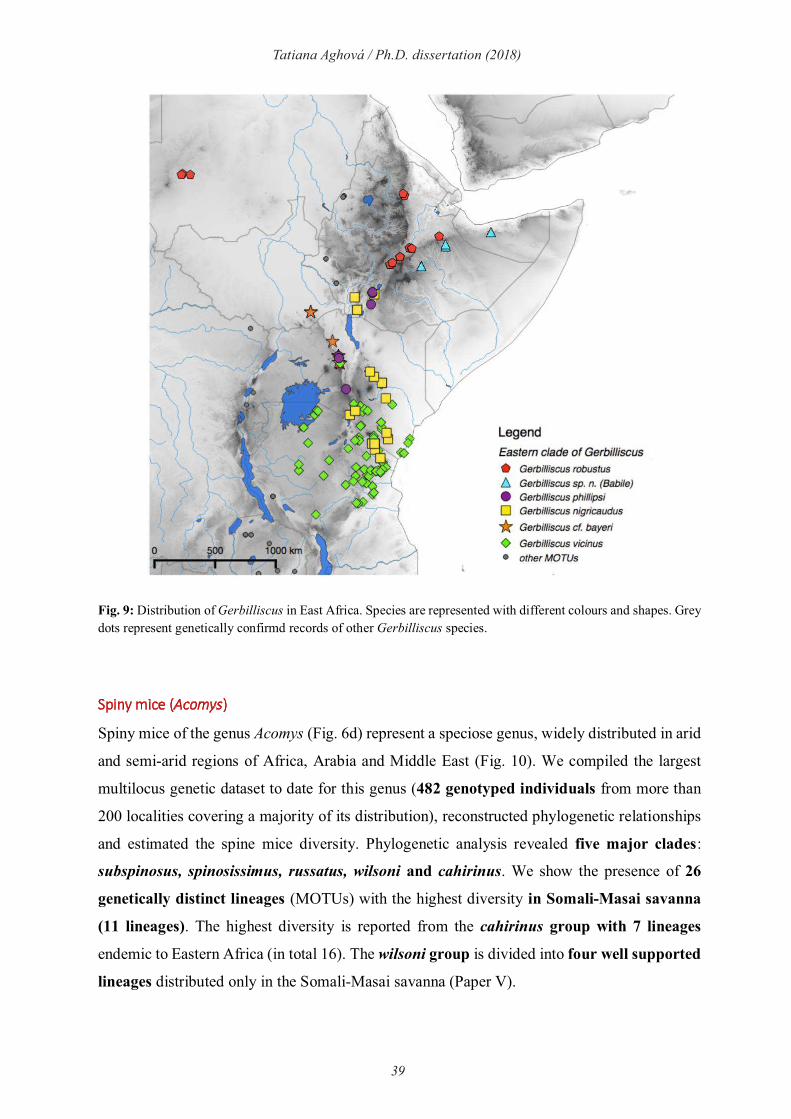
Tatiana Aghová / Ph.D. dissertation (2018)
Fig. 9: Distribution of Gerbilliscus in East Africa. Species are represented with different colours and shapes. Grey dots represent genetically confirmd records of other Gerbilliscus species.
Spiny mice (Acomys)
Spiny mice of the genus Acomys (Fig. 6d) represent a speciose genus, widely distributed in arid
and semi-arid regions of Africa, Arabia and Middle East (Fig. 10). We compiled the largest
multilocus genetic dataset to date for this genus (482 genotyped individuals from more than
200 localities covering a majority of its distribution), reconstructed phylogenetic relationships
and estimated the spine mice diversity. Phylogenetic analysis revealed five major clades:
subspinosus, spinosissimus, russatus, wilsoni and cahirinus. We show the presence of 26
genetically distinct lineages (MOTUs) with the highest diversity in Somali-Masai savanna
(11 lineages). The highest diversity is reported from the cahirinus group with 7 lineages
endemic to Eastern Africa (in total 16). The wilsoni group is divided into four well supported
lineages distributed only in the Somali-Masai savanna (Paper V).
40
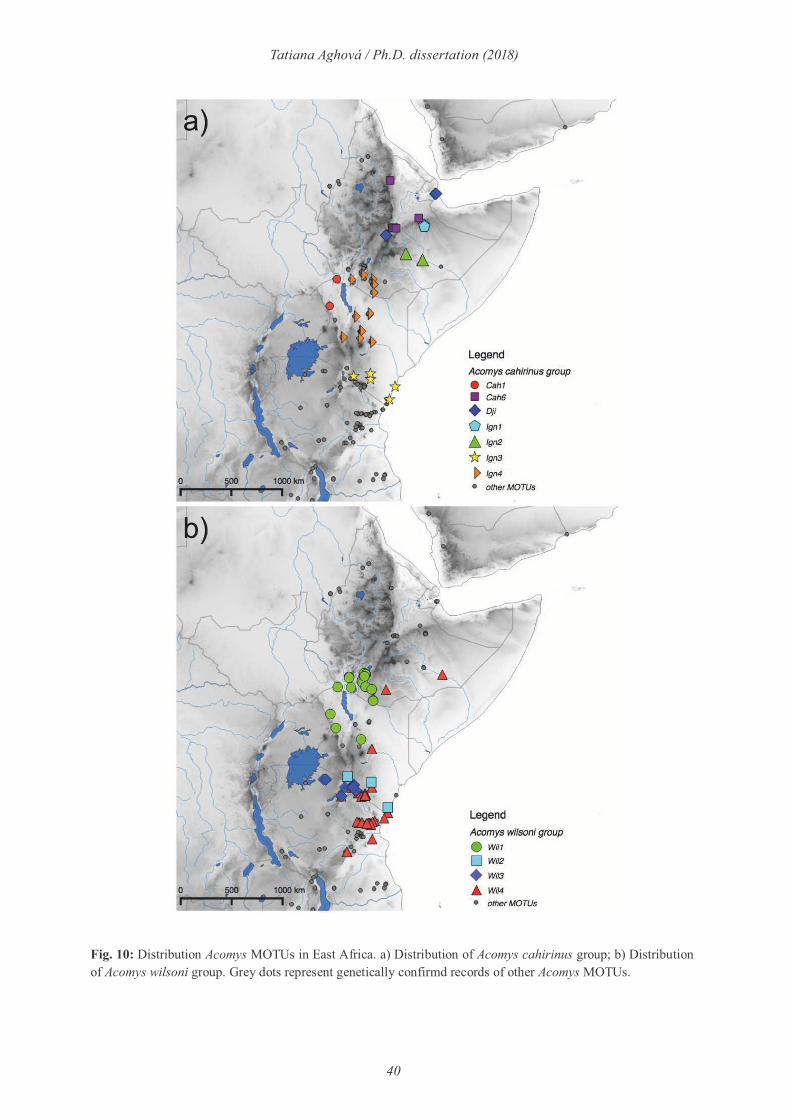
Tatiana Aghová / Ph.D. dissertation (2018)
Fig. 10: Distribution Acomys MOTUs in East Africa. a) Distribution of Acomys cahirinus group; b) Distribution of Acomys wilsoni group. Grey dots represent genetically confirmd records of other Acomys MOTUs.

41
Tatiana Aghová / Ph.D. dissertation (2018)
Optimalization of methods for divergence dating in phylo(bio-)geographic
reconstructions
Although divergence time dating is now a well-established cornerstone of evolutionary
biology, there is still no widely accepted objective methodology for converting data from the
fossil record to calibration information of use in molecular phylogenies (Drummond and
Bouckaert, 2015). In the last few years, several methodological approaches to better
implement fossil calibrations have been developed, for instance allowing one to directly
include fossil lineages in phylogenies (‘total-evidence dating’; Pyron, 2010; Ronquist et al.
2012b) or to account for information on the density of the fossil record (‘fossilized birth-death
(FBD) process’; Stadler, 2010; Heath et al., 2014). Nevertheless, there is still lack of reliable
fossil records for family Muridae. Until 2008 there were numerous studies based only on a
single calibration point represented by the split „Mus/Rattus“ (e.g. Adkins et al., 2001; Steppan
et al., 2004). This split represent separation of two fossil genera †Progonomys and †Karnimata.
†Progonomys was considered the ancestor of the Mus lineage and †Karnimata as the ancestor
of a lineage containing Rattus (Jacobs and Flynn, 2005). After detailed study of these fossils,
Kimura et al. (2015) showed, that †Karnimata is more related to current Arvicanthini tribe,
therefore this split represent divergence between Mus and Arvicanthis. This example shows
how important is to localize particular fossils on the phylogenetic tree correctly.
The uncertainity in using different fossil record (or different ages) leads to very distinct
estimation of divergence dating. In Paper IV, we examine previous studies to compare
different estimations of divergence times in the family Muridae. Most controversy is usually
in the calibration of molecular clock in the crown Murinae. In the past, the authors most often
calibrated it based on †Progonomys/†Karnimata split as shown above (with estimated age of
crown Murinae 10-14 Ma; Schenk et al., 2013, Fabre et al., 2013, Rowe et al., 2008, 2013,
Lecompte et al., 2008; Steppan et al., 2004; or 23 Ma in Adkins et al., 2001). Nevertheless,
there was no clear consensus, if this calibration point is on the node between Rattus and Mus,
or on the crown of Murinae (including Phloeomyini, the most basal lineage or not). The other
very controversal fossil calibration is for the tribe Apodemyini or Apodemus clade. In both
cases the authors used the fossil †Parapodemus, with different ages (4.89-11 Ma, Lecompte et
al., 2008; Fabre et al., 2013; Schenk et al., 2013, Bryja et al., 2014).
For correctly estimation of divergence date for family Muridae, the list of reliable fossil
records is needed. The main advantage of our Paper IV lies in detailed descriptions of each
42
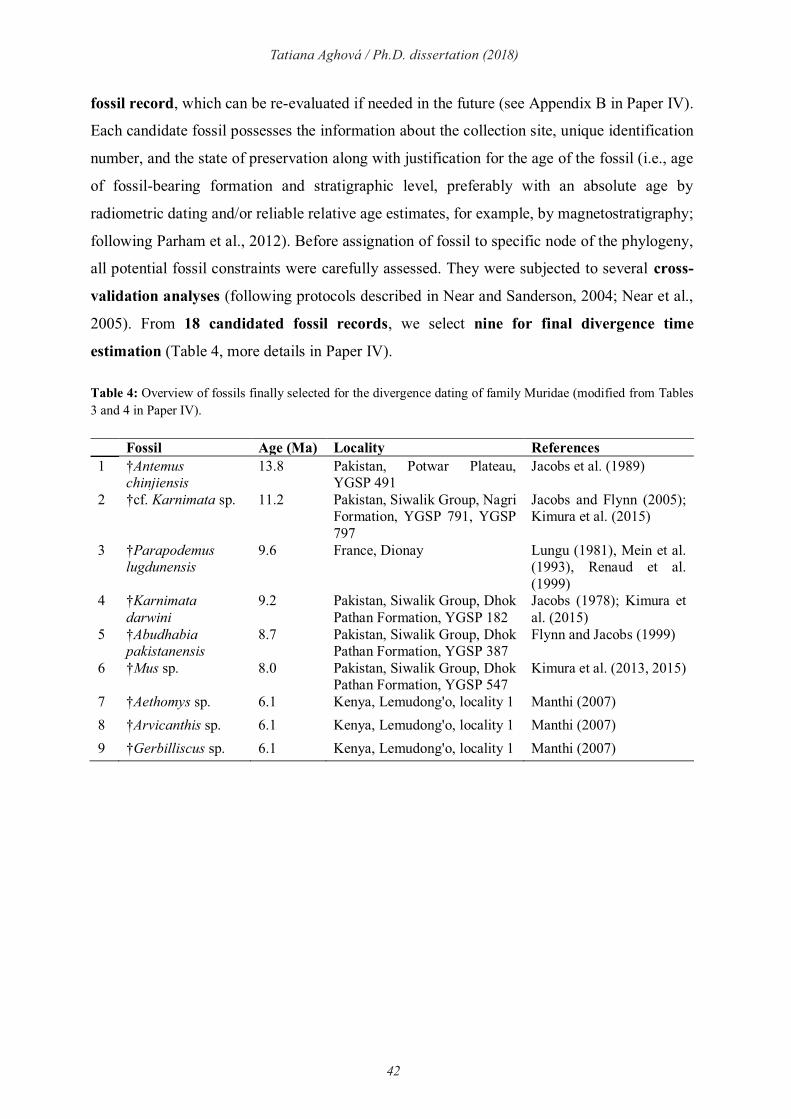
Tatiana Aghová / Ph.D. dissertation (2018)
fossil record, which can be re-evaluated if needed in the future (see Appendix B in Paper IV).
Each candidate fossil possesses the information about the collection site, unique identification
number, and the state of preservation along with justification for the age of the fossil (i.e., age
of fossil-bearing formation and stratigraphic level, preferably with an absolute age by
radiometric dating and/or reliable relative age estimates, for example, by magnetostratigraphy;
following Parham et al., 2012). Before assignation of fossil to specific node of the phylogeny,
all potential fossil constraints were carefully assessed. They were subjected to several cross-
validation analyses (following protocols described in Near and Sanderson, 2004; Near et al.,
2005). From 18 candidated fossil records, we select nine for final divergence time
estimation (Table 4, more details in Paper IV).
Table 4: Overview of fossils finally selected for the divergence dating of family Muridae (modified from Tables 3 and 4 in Paper IV).
Fossil Age (Ma) Locality References
1 †Antemus chinjiensis
13.8 Pakistan, Potwar Plateau, YGSP 491
Jacobs et al. (1989)
2 †cf. Karnimata sp. 11.2 Pakistan, Siwalik Group, Nagri Formation, YGSP 791, YGSP 797
Jacobs and Flynn (2005); Kimura et al. (2015)
3 †Parapodemus lugdunensis
9.6 France, Dionay Lungu (1981), Mein et al. (1993), Renaud et al. (1999)
4 †Karnimata
darwini
9.2 Pakistan, Siwalik Group, Dhok Pathan Formation, YGSP 182
Jacobs (1978); Kimura et al. (2015)
5 †Abudhabia pakistanensis
8.7 Pakistan, Siwalik Group, Dhok Pathan Formation, YGSP 387
Flynn and Jacobs (1999)
6 †Mus sp. 8.0 Pakistan, Siwalik Group, Dhok Pathan Formation, YGSP 547
Kimura et al. (2013, 2015)
7 †Aethomys sp. 6.1 Kenya, Lemudong'o, locality 1 Manthi (2007)
8 †Arvicanthis sp. 6.1 Kenya, Lemudong'o, locality 1 Manthi (2007)
9 †Gerbilliscus sp. 6.1 Kenya, Lemudong'o, locality 1 Manthi (2007)
43
Tatiana Aghová / Ph.D. dissertation (2018)
Age (Ma)
1 Pakistan, Potwar Plateau,
2 sp. Group, Nagri nd Flynn (2005);
3 Lungu (1981), Mein et al.
4 Pakistan, Siwalik Group, Dhok Jacobs (1978); Kimura et
5 Pakistan, Siwalik Group, Dhok Flynn and Jacobs (1999)
6 Pakistan, Siwalik Group, Dhok 2015)
7 Kenya, Lemudong'o, locality 1
8 Kenya, Lemudong'o, locality 1
9 sp. Kenya, Lemudong'o, locality 1
Evolutionary history of Somali-Masai savanna in Plio-Pleistocene
The evolutionary history of African savanna ecosystems and their biota has started in Miocene.
During the Early Miocene (23.0-16.0 Ma), the reopening of the Mediterranean-Indo-Pacific
seaway (Rögl, 1999) separated Africa from Eurasia, thus giving rise (among others) to the main
clades of Afrotropic murid rodents. Three subfamilies, Deomyinae, Gerbillinae and
Lophiomyinae, then likely diversified primarily in the Afrotropics (Chevret and Dobigny,
2005; Ndiaye et al., 2016; Schenk et al., 2013; Paper IV). The subfamily Murinae started to
diversify in Indomalaya, most probably in Southeast Asia, where is the highest phylogenetic
diversity of this subfamily (Fabre et al., 2013). In comparison family Nesomyidae has origine
in Africa and Madagascar (Schenk et al., 2013).
During the Middle Miocene (16.0-11.6 Ma) a global cooling caused general
aridification („Parathethys Salinity Crisis“; Rögl, 1999) and vegetation shifts (from moisture-
adapted C3 plants to tropical arid-adapted C4 grasses; Cerling et al., 1997, 1998). This climatic
and faunal changes (savanna expansions) gave rise the current rodent genera in Africa, e.g.
Acomys split from sister genus Deomys (Papers IV,V), Gerbilliscus split from Desmodillus and
Tatera (Papers III, IV) and particular clades of Murinae colonized Africa and some of them
intensively radiated there (e.g. Praomyini or Arvicanthini; Paper IV).
The first splits in model genera studied in my dissertation occured in the Late Miocene
(11.6-5.3 Ma). For example, the Eastern Gerbilliscus clade split from the southern and western
clades around 7.03 Ma (HPD 6.17-10.13 Ma; Paper III). The similar pattern was found in genus
Acomys (Paper V). The first Acomys divergence i.e. between lineages from Zambezian region
(subspinosus+spinosissimus) and Somali-Masai region (russatus+cahirinus+wilsoni) was
estimated to occurred 8.69 Ma (HPD 8.51-9.29 Ma). At the same time, there was probably split
between the genus Saccostomus and its sister genera Cricetomys and Beamys (Paper II). These
separations were caused most probably by "coast-to-coast" tropical forest, which is evidence
for occurrence tropical forest is evidenced by phylogenetic analyses of plants and animals living
in nowadays fragmented forests of Congo basin and eastern African montane and coastal forests
(Couvreur et al., 2008; Bryja et al., 2017). This continuous forest was likely one of the most
important factors in early evolution of savanna inhabitants, because is separated northern (=
Somali-Masai) and southern (= Zambezian) savannas. Around 8 Ma, the maximum of the shift
from C3 forest and woodland to C4 savanna occurred (Cerling et al., 1998; rodents fossils
Kimura et al., 2013; bovid fossils Garrett et al., 2015). During short period the Somali-Masai
44
Tatiana Aghová / Ph.D. dissertation (2018)
savanna was probably connected with the Mediterranean area in Egypt and Sinai –
probably during this time Acomys russatus split from the rest of the East African group and
dispersed to the north along the Nile river. Later (ca 7 Ma) the Sahara desert become
hyperarid (Pickford et al., 2006; Schuster et al., 2006; Carranza et al., 2008) and this migration
route was no longer possible (but this vegetation corridor was repeatedly used for dispersal of
savanna taxa much later (e.g. Arvicanthis niloticus, Dobigny et al. 2013; Crocidura olivieri,
Jacquet et al., 2015; Acomys cahirinus group, Paper V). The aridification of Africa was
promoted also by the Messinian salinity crisis at ca. 5.3 Ma (Krijgman et al., 1999; Maslin
and Chirstensen, 2007; Hodell et al., 2001). During this period of global sea level depression
(Haq et al., 1987), Africa and Arabia were reconnected through Neguev-Sinai landbridge
(„Levantine corridor“, Fernandes et al., 2006) and/or landbridge in the Bab-el-Mandeb
(Bosworth et al., 2005). In murids, evidence to support this faunal exchange can be found in
the Mus (Nannomys), which colonized Afrotropics and started there its radiation ca. 5.2 Ma
(Paper II).
During the Pliocene (5.3-2.5 Ma), futher diversification within the model genera
continued. This period gave rise to different groups of Acomys (estimation of the first
diversification in wilsoni group 4.67 Ma, split between „ignitus“ and „Djibouti“ clade 4.57 Ma;
Paper V), and split between major Saccostomus groups (mearnsi and campestris 3.9 Ma; Paper
II). With influence from intensification of the Northern Hemisphere Glaciation (iNHG, 3.2-
2.5 Ma; Haug and Tiedemann, 1988), Acomys dimidiatus diverged after colonisation of the
Arabian peninsula. At least two different colonization events occured for Acomys species from
Somali-Masai into Sudanian savanna, where they diverged into A. johannis complex (Cah2-
Cah4) and A. chudeaui (Cah11; Paper V). Connection between the Somali-Masai and Sudanian
savannas is further evidenced by westward dispersal of Gerbilliscus robustus (clade R2; Paper
III). There are also some other examples of bi-directional exchange of rodent fauna between
Somali-Masai and Sudanian savanna, e.g. Mastomys erythroleucus (Brouat et al., 2009),
Arvicanthins niloticus (Dobigny et al., 2013), or Gerbilliscus kempi in (Granjon et al., 2012,
our unpublished data). Our ecological niche modelling (Papers III and V) suggests that
conditions for east-west migration have been suitable especially during more humid periods
(represented by last interglacial in our models). Because ENM predicts only patchy suitable
habitats for Somali-Masai taxa in Sudanian savanna, is likely why the distribution of other
probably more specialized Somali-Masai taxa (e.g. Grant’s gazelle, Beisa oryx, Grevy’s zebra

45
Tatiana Aghová / Ph.D. dissertation (2018)
or pouched mice) remained limited to the easternmost part of Africa (Lorenzen et al., 2012;
Kebede et al., 2014; Paper II).
The Pleistocene was a climatically very turbulent period that significantly affected
current distribution of genetic diversity of Somali-Masai fauna. Within the genus Gerbilliscus,
all six current species almost simultanously diversified around 1.7 Ma: split of G. robustus and
G. sp. n. (Babile) is estimated at 1.62 Ma (HPD 0.73-2.95 Ma), G. phillipsi and G. vicinus at
1.75 Ma (HPD 0.73-3.31) and G. nigricaudus adn G. cf. bayeri at 1.80 Ma (HPD 0.86-3.53
Ma). Most extant Acomys species occured already in Pleistocene, including the second
migration from Somali-Masai region to the north (Cah9 = A. cahirinus). This period was
important also for speciation in Mus (Nannomys), including the radiation within the minutoides
group in open habitats across whole sub-Saharan Africa and, later on, the spread of a single
species, M. minutoides, again across whole sub-Saharan Africa. Two species of Saccostomus
mearnsi group split at 2.0 Ma (HPD 1.3-2.9 Ma). S. umbriventer occupied (based on predicted
distribution modelling) southern refugium in Tanzania and S. mearnsi refugium north near Lake
Victoria and Lake Turkana (Paper II).
Species distribution modelling and the extent of Somali-Masai savanna
The distribution of model groups in my thesis was most significantly influenced by annual
precipitation (bio12) and precipitation of coldest quarter (bio19). There is not a substantial
difference between predicted distribution models for present, LGM, and LIG for taxa
primarily distributed in Somali-Masa savanna (Fig. 11). This is in contrast to rodents living in
Zambezian savanna, where suitable area shrank to very small refugia especially during LIG
period, and current populations show signs of recent population expansion (e.g. Gerbilliscus
leucogaster McDonough et al., 2016; Aethomys chrysophilus Mazoch et al., 2017; Saccostomus
campestris group, Paper II).
Different model groups had slightly different habitat preferences within Somali-
Masai savanna (e.g. Acomys generally prefers rocky habitats, Saccostomus grasslands, and
Gerbilliscus shrubs, etc.), but their predicted distribution shows coincident pattern (Fig. 11).
We can therefore use the results of ENMs for generalization concerning the extent of suitable
habitats of organisms typical for Somali-Masai savanna. The southern border of Somali-
Masai savanna is in northern and central Tanzania, which is concordant with the
distribution of most model species. The southern Kenya and northern Tanzania are

46
Tatiana Aghová / Ph.D. dissertation (2018)
important centers of biodiversity of savanna-like ecosystems. Cuthbert et al. (2017) showed
that this region is water-rich (e.g. rivers: Tana, Galana, Tsavo, Pangani; springs and
groundwater). Groundwater, which acts to buffer climate variability, in the form of springs
and baseflow to perennial streams, created hydro-refugia that likely persisted through long dry
periods (Cuthbert et al., 2017). Important barriers to dispersal for savanna inhabitants (both
current and past) are mountains like Mt. Elgon or the Kenyan Highlands (Cherrangani, Mau,
Mt. Kenya), where more continuous forests are expected especially in humid periods of
Pleistocene. In contrast, the Tanzanian Highlands (Mt. Kilimanjaro, northern part of Eastern
Arc Mts) probably did not play as important of a role, even if they probably separated some
intraspecific lineages of savanna species (see below). Another important unsuitable habitat is
represented by extremly dry Masai xeric shrublands near lake Turkana (Fig. 4). Extremely
unsuitable conditions are also present in the Horn of Africa, usually considered as large part
of Somali-Masai region (e.g. Linder et al. 2012), where the only suitable conditions occur on
the sout-eastern part of Somalia. Suitable climatic conditions for some taxa are also predicted
in the south of Arabian peninsula (Fig. 11), but from the model groups only Acomys are known
to have succesfully colonized this area.

47
Tatiana Aghová / Ph.D. dissertation (2018)
Fig. 11: MaxEnt predictions of the present distribution (green), last glacial maximum (ca 21 ka; blue) and last intreglacial period (120-130 ka, red) for a) Acomys cahirinus group, b) Acomys wilsoni group, c) Gerbilliscus
nigricaudus group, d) Gerbilliscus robustus group, e) Saccostomus mearnsi group.

48
Tatiana Aghová / Ph.D. dissertation (2018)
CONCLUSIONS AND FUTURE DIRECTIONS
Genetic diversity
This Ph.D. thesis provides the first analysis of detailed genetic structure for rodents from
Somali-Masai savanna, including identification of the main factors responsible for their
evolutionary history since the Miocene. Using molecular methods, we uncovered cryptic
diversity in this region, where the basic faunistic data were largely missing.
Most studies in the thesis are based on initial DNA barcoding of collected material
using the mitochondrial CYTB gene, followed by analysis of several nuclear genes for each
mitochondrial clade. This approach has, of course, some weak points. Nuclear markers are often
not variable enough for reliable reconstruction of phylogeny of closely related species, and
multilocus phylogenetic trees are still biased by the CYTB phylogeny. In such cases,
mitochondrial introgression can lead to uncorrect species trees and/or species misidentification.
In the future, it can be advantagous to use genomic approaches to uncover unbiased
phylogenies and population structure, e.g. by full/representative genome sequencing (e.g.
anchored hybrid enrichment, Lemmon et al., 2012; RAD sequencing, Leaché et al., 2014; Kai
et al., 2014, etc.).
The advance of next-generation sequencing can be used also by genotyping of museum
specimens. The importance of museum specimens has increased in last years, because
fieldwork in some parts of Eastern Africa is not possible for political or other reasons (e.g.
South Sudan, Somalia). Additionaly, museums keep type material collections, which is
essential for further taxonomic investigation. Nevertheless, museum conditions were optimized
for expecially specimen longevity, not molecular stability, therefore work with museum DNA
is challenging (e.g. DNA is fragmented, degradated and/or contains DNA contaminations).
Nevertheless, in last decade several methods were designed to to overcome these complications:
a) amplicon sequencing (Hajibabaei et al., 2006; Galane et al., 2012); b) whole-genome
shotgun sequencing (Tilak et al., 2015); c) target enrichment (Mason et al., 2011); d)
sequence capture of ultraconserved elements (McCormack et al., 2016).
Optimalization of methods for divergence dating
The second part of this thesis is dealing with optimalization of fossil calibrations for estimation
of the dated phylogeny of muroid rodents. We have created a detailed, annotated fossil

49
Tatiana Aghová / Ph.D. dissertation (2018)
database including 18 fossils with description, why each fossils should or shouldn’t be used
for calibration of ultrametic divergence trees.
We also see at least one weakness of our study (Paper IV). The fossil constrains are
assigned on phylogenetic tree based only on paleontological information. The detailed
information about teeth morphology were considered, but they were not always available.
Recent advances in divergence time estimation, e.g. „tip dating“ (Ronquist et al., 2012b) and
fossilized birth-death processes (Stadler, 2010; Heath et al., 2014; Drummond and Stadler et
al., 2016) allow integration of fossil taxa directly into phylogenetic analyses based on both
molecular (extant species) and morphological data (extinct and extant species). Therefore
allowing for better assignment of fossils onto the phylogenetic tree of current taxa, it should be
very useful to prepare morphometric matrix for extinct and extant taxa as well. Such dataset
then could be analysed by a „total evidence dating“ (Ronquist et al., 2012b; Pyron, 2011). This
methods allows one to use all available fossil records, not only the oldest representatives of
selected lineages (Gavryushkina et al., 2014).
Evolutionary history of the Somali-Masai savanna
In the third part of my Ph.D. thesis, I identified factors, which played role in evolution of
Somali-Masai rodent fauna during the Plio-Pleistocene. Our molecular dataset, with estimation
of divergence dates and modelling of present and past species distributions might facilitate our
understanding of evolutionary history of savanna in Eastern Africa.
Repeated expansions and contractions of savanna habitats were caused by global and local
factors. The main global climatic transitions, which influence Eastern Africa were Mesian
salinity crisis (6-5.3 Ma) and intesification of Norhern Hemisphere glaciation (3.2-2.5 Ma). The
local geomorphology play important role in evolution of the East African biota. The current
distribution of genetic diversity of Somali-Masai region seems to be influenced mainly by
combination of following factors:
(1) Mountain chains. The most important mountains are Kenyan Highlands (from Mt.
Elgon to Mt. Kenya), especially forests currently confined to their higher altitudes. In
Ethiopia, a similar role was played by Ethiopian highlands, especially in its Eastern part
where mountains separate Somalian and Afar lowlands.
50
Tatiana Aghová / Ph.D. dissertation (2018)
(2) Regions of extreme aridity. Extremly dry environmens are not suitable even for
savanna-living organisms. Based on distribution maps and species distribution modelling
we have observed, that Masai xeric shrublands in northern Kenya and Horn of Africa
are too dry and very likely uninhabited by model organism studied in this thesis.
(3) Water bodies. One of the factors, which influenced distribution of model organisms is
accesibility to water resources as underground water acts as a buffer to climate
variability and promotes the long-term refugia of open habitats (e.g. in Tanzania/Kenya
border; Cuthbert et al. 2017). On the other hand, water bodies are important natural
barriers to gene flow for terrestrial organisms. Rifting generated numerous Rift basins,
either filled with water or were extremely dry with halophytic vegetation (White, 1983),
which could prevent the dispersal of small terrestrial animals (Trauth et al., 2010; Maslin
et al., 2014). Genetic structure of multiple Somali-Masai taxa studied in this thesis was
likely affected by rift lakes, separating populations west vs. east of the rift, or north vs.
south within the rift itself.
These factors, likely influencing the evolutionary history for taxa inhabiting the Somali-
Masai region, are selected on the basis of the studies of limited number rodent genera. To assess
their general role in evolution of savanna organisms, it will be necessary to perform also studies
on other savanna living organism (reptiles, invertebrates, plants). Comparative
phylogeographic approach will be important not only for general understanding of evolution
of wildlife in Eastern Africa (with numerous conservation implications), but at the same time
for better understanding of our own history, because similar factors in the same region very
likely influenced also the evolution of genus Homo.
51
Tatiana Aghová / Ph.D. dissertation (2018)
REFERENCES
Aghová, T., Šumbera, R., Piálek, L., Mikula, O., Mcdonough, M.M., Lavrenchenko, L.A., Meheretu, Y., Mbau, J.S., Bryja, J., 2017. Multilocus phylogeny of East African gerbils (Rodentia, Gerbilliscus) illuminates the history of the Somali-Masai savanna. Journal of Biogeography, 44(10), 2295–2307.
Adkins, R.M., Gelke, E.L., Rowe, D., Honeycutt, R.L., 2001. Molecular phylogeny and divergence time estimates for major rodent groups: evidence from multiple genes. Mol. Biol. Evol. 18, 777–91.
Baker, B.H., Mitchell, J.G., Williams, L.A.J., 1988. Stratigraphy, geochronology and volcano-tectonic evolution of the Kedong-Naivasha-Kinangop region, Gregory Rift Valley, Kenya. Journal of the Geological Society of London 145, 107–116.
Beard, J.S., 1953. The Savanna Vegetation of Northern Tropical America. Ecol. Monogr. 23, 149–215. Beentje, H.J., Adams, B., Davis, S.D., Hamilton, A.C., 1994. Regional overview: Africa. Centres of plant
diversity (ed. by S.D. Davis, V.H. Heywood and A.C. Hamilton), pp. 101–148. IUCN Publication Unit, Cambridge. Beerling,
Bosworth, W., Huchon, P., McClay, K., 2005. The Red Sea and Gulf of Aden Basins. J. African Earth Sci. 43, 334–378. doi:10.1016/j.jafrearsci.2005.07.020
Bourliere, F., Hadley, M., 1983. Present-day savannas: an overview. Ecosystems of the world. Braconnot, P., Otto-Bliesner, B., Harrison, S., Joussaume, S., Peterchmitt, J.Y., Abe-Ouchi, A., Crucifix, M.,
Driesschaert, E., Fichefet, T., Hewitt, C.D., Kageyama, M., Kitoh, A., Laîné, A., Loutre, M.F., Marti, O., Merkel, U., Ramstein, G., Valdes, P., Weber, S.L., Yu, Y., Zhao, Y., 2007. Results of PMIP2 coupled simulations of the Mid-Holocene and Last Glacial Maximum - Part 1: experiments and large-scale features. Clim. Past 3, 261–277. doi:10.5194/cp-3-261-2007
Breugel, P., Friis, I., Demissew, S., 2016. The transitional semi-evergreen bushland in Ethiopia: characterization and mapping of its distribution using predictive modelling. Applied vegetation science, 19(2), pp.355-367.
Brouat, C., Tatard, C., Bâ, K., Cosson, J.F., Dobigny, G., Fichet-Calvet, E., Granjon, L., Lecompte, E., Loiseau, A., Mouline, K. and Piry, S., 2009. Phylogeography of the Guinea multimammate mouse (Mastomys erythroleucus): a case study for Sahelian species in West Africa. Journal of Biogeography, 36(12), pp.2237-2250.
Bryja, J., Mikula, O., Šumbera, R., Meheretu, Y., Aghová, T., Lavrenchenko, L. A., Mazoch, V., Oguge, N., Mbau, J.S., Welegerima, K., Amundala, N., Colyn, M., Leirs, H., Verheyen, E., 2014. Pan-African phylogeny of Mus (subgenus Nannomys) reveals one of the most successful mammal radiations in Africa. BMC Evolutionary Biology, 14(1), 256.
Brown, D.M., Brenneman, R.A., Koepfli, K.-P., Pollinger, J.P., Milá, B., Georgiadis, N.J., Louis, E.E., Grether, G.F., Jacobs, D.K., Wayne, R.K., 2007. Extensive population genetic structure in the giraffe. BMC Biol. 5, 57. doi:10.1186/1741-7007-5-57
Burgess, N.D., D’Amico Hales, J., Underwood, E., Dinerstein, E., Olson, D., Itoua, I., Schipper, J., Ricketts, T., Newman, K., 2004. Terrestrial ecoregions of Africa and Madagascar: a continental assessment. Island Press, Washington, DC.
Burgess, N.D., Balmford, A., Cordeiro, N.J., Fjeldså, J., Kuper, W., Rahbek, C., Sanderson, E.W., Scharlemann, J.P.W., Sommer, J.H., Williams, P.H., 2007a. Correlations among species distributions, human density and human infrastructure across the high biodiversity tropical mountains of Africa. Biological Conservation, 134, 164–177
Burgess, N.D., Butynski, T.M., Cordeiro, N.J., Doggart, N.H., Fjeldså, J., Howell, K.M., Kilahama, F.B., Loader, S.P., Lovett, J.C., Mbilinyi, B., Menegon, M., Moyer, D.C., Nashanda, E., Perkin, A., Rovero, F., Stanley, W.T., Stuart, S.N., 2007b. The biological importance of the Eastern Arc Mountains of Tanzania and Kenya. Biol. Conserv. 134, 209–231. doi:10.1016/j.biocon.2006.08.015
Carranza, S., Arnold, E.N., Geniez, P., Roca, J., Mateo, J.A., 2008. Radiation, multiple dispersal and parallelism in the skinks, Chalcides and Sphenops (Squamata: Scincidae), with comments on Scincus and Scincopus and the age of the Sahara Desert. Mol. Phylogenet. Evol. 46, 1071–1094. doi:10.1016/j.ympev.2007.11.018
Cerling, T.E., Harris, J.M., Macfadden, B.J., Leakey, M.G., Quadek, J., Eisenmann, V., Ehleringer, J.R., 1997. Global vegetation change through the Miocene / Pliocene boundary. Nature 389, 153–158. doi:10.1038/38229
Cerling, T.E., Ehleringer, J.R., Harris, J.M., 1998. Carbon dioxide starvation, the development of C4 ecosystems, and mammalian evolution. Philos. Trans. R. Soc. B Biol. Sci. 353, 159–171. doi:10.1098/rstb.1998.0198
52
Tatiana Aghová / Ph.D. dissertation (2018)
Chevret, P., Dobigny, G., 2005. Systematics and evolution of the subfamily Gerbillinae (Mammalia, Rodentia, Muridae). Mol. Phylogenet. Evol. 35, 674–688. doi:10.1016/j.ympev.2005.01.001
Chevret, P., Veyrunes, F., Britton-Davidian, J., 2005. Molecular phylogeny of the genus Mus (Rodentia: Murinae) based on mitochondrial and nuclear data. Biological Journal of the Linnean Society, 84(3), pp.417-427.
Colangelo, P., Granjon, L., Taylor, P.J., Corti, M., 2007. Evolutionary systematics in African gerbilline rodents of the genus Gerbilliscus: inference from mitochondrial genes. Mol. Phylogenet. Evol. 42, 797–
806. doi:10.1016/j.ympev.2006.10.001 Cole, M. M., 1963. Vegetation nomenclature and classification with particular reference to the savannas.
South African Geogr. J. 55, 3–14. Cordeiro, N.J., Burgess, N.D., Dovie, D.B.K., Kaplin, B.A., Marrs, R., 2007. Conservation in areas of high
population density in sub-Saharan Africa. Biological Conservation, 134, 155–163 Couvreur, T.L., Chatrou, L.W., Sosef, M.S., Richardson, J.E., 2008. Molecular phylogenetics reveal multiple
tertiary vicariance origins of the African rain forest trees. BMC Biology, 6(1), p.54. Cuthbert, M.O., Gleeson, T., Reynolds, S.C., Bennett, M.R., Newton, A.C., McCormack, C.J., Ashley, G.M.,
2017. Modelling the role of groundwater hydro-refugia in East African hominin evolution and dispersal. Nat. Commun. 8, 15696. doi:10.1038/ncomms15696
Dansereau, P., 1957. Biogeography. An ecological perspective. The Ronald Press Co., New York. Denys, C., Taylor, P.J., Aplin, K.P., 2017. Family Muridae. In: Wilson et al. (Eds.) Hadbook of the Mammals
of the World, Volume 7: Rodents II. Lynx Edicions. ISBN-13: 9788416728046 Dixon, A.P., Faber-Langendoen, D., Josse, C., Morrison, J., Loucks, C.J., 2014. Distribution mapping of
world grassland types. J. Biogeogr. 41, 2003–2019. Dobigny, G., Tatard, C., Gauthier, P., Ba, K., Duplantier, J.M., Granjon, L. and Kergoat, G.J., 2013.
Mitochondrial and nuclear genes-based phylogeography of Arvicanthis niloticus (Murinae) and sub-Saharan open habitats Pleistocene history. PLoS One, 8(11), p.e77815.
Drummond, A. J., Bouckaert, R. R., 2015. Bayesian evolutionary analysis with BEAST. Cambridge University Press.
Drummond, A.J., Stadler, T., 2016. Bayesian phylogenetic estimation of fossil ages. Philos. Trans. R. Soc. London B 371, 20150129. doi:10.1098/rstb.2015.0129
Drummond, A.J., Suchard, M.A., Xie, D., Rambaut, A., 2012. Bayesian phylogenetics with BEAUti and the BEAST 1.7. Molecular biology and evolution, 29(8), pp.1969-1973.
Ducroz, J.F., Volobouev, V., Granjon, L., 1998. A molecular perspective on the systematics and evolution of the genus Arvicanthis (Rodentia, Muridae): inferences from complete cytochrome b gene sequences. Mol. Phylogenet. Evol. 10, 104–17. doi:10.1006/mpev.1997.0477
Ebinger, C.J., Temane, T., Harding, D., Tesfaye, S., Kelley, S., Rex, D., 2000. Rift deflection, migration, and propagation: linkage of the Ethiopian and Eastern rifts, Africa. Geological Society of America Bulletin 112, 163–176.
Engler, A., 1879-1882. Versuch einer Entwicklungsgeschichte der Pflanzenwelt. Engelman, Leipzig Faber-Langendoen, D., Keeler-Wolf, T., Meidinger, D., Tart, D., Hoagland, B., Josse, C., Navarro, G.,
Ponomarenko, S., Saucier, J.P., Weakley, A., Comer, P., 2014. EcoVeg: A new approach to vegetation description and classification. Ecol. Monogr. 84, 533–561. doi:10.1890/13-2334.1
Fabre, P.H., Pagès, M., Musser, G.G., Fitriana, Y.S., Fjeldså, J., Jennings, A., Jønsson, K.A.., Kennedy, J., Michaux, J., Semiadi, G., Supriatna, N., Helgen, K.M., 2013. A new genus of rodent from Wallacea (Rodentia: Muridae: Murinae: Rattini), and its implication for biogeography and Indo-Pacific Rattini systematics. Zool. J. Linn. Soc. 169, 408–447. doi:10.1111/zoj.12061
Fedorov, V.B., Goropashnaya, A. V., Boeskorov, G.G., Cook, J.A., 2008. Comparative phylogeography and demographic history of the wood lemming (Myopus schisticolor): Implications for late Quaternary history of the taiga species in Eurasia. Mol. Ecol. 17, 598–610. doi:10.1111/j.1365-294X.2007.03595.x
Fennessy, J., Bidon, T., Reuss, F., Kumar, V., Elkan, P., Nilsson, M.A., Vamberger, M., Fritz, U. and Janke, A., 2016. Multi-locus analyses reveal four giraffe species instead of one. Current Biology, 26(18), pp.2543-2549.
Fernandes, C.A., Rohling, E.J., Siddall, M., 2006. Absence of post-Miocene Red Sea land bridges: Biogeographic implications. J. Biogeogr. 33, 961–966. doi:10.1111/j.1365-2699.2006.01478.x
Fichet-Calvet, E., Rogers, D.J., 2009. Risk maps of lassa fever in West Africa. PLoS Negl. Trop. Dis. 3. doi:10.1371/journal.pntd.0000388
Fjeldsa, J., Burgess, N.D., Blyth, S., de Klerk, H.M., 2004. Where are the major gaps in te reserve network for Africa’s mammals? Oryx 38, 17–25.

53
Tatiana Aghová / Ph.D. dissertation (2018)
Flynn, L.J., Jacobs, L.L., 1999. Late Miocene small mammal faunal dynamics: the crossroads of the Arabian peninsula. in: Whybrow, P.J., Hill, A., (Eds.), Fossil vertebrates of Arabia. Yale University Press, New Haven. pp. 412–419.
Foster, A., Ebinger, C., Mbede, E., Rex, D., 1997. Tectonic develop- ment of the northern Tanzanian sector of the East African Rift System. Journal of the Geological Society 154, 689–700.
Frankham, R., Ballou, J.D., Briscoe, D.A., 2004. A primer of conservation genetics. Cambridge University Press, Cambridge
Friis, I., Demissew, S., van Breugel, P. 2010. Atlas of the potential vegetation of Ethiopia. The Royal Danish Academy of Science and Letters, Copenhagen.
Galan, M., Page, M., Cosson, J.F., 2012. Next- !"!#$%&'"( )!*+!",&"-( .'#( /'0!"%( 1$#,'0&"-23( )4!,&!5(Identification from Fresh, Degraded and Environmental Samples. PLoS One 7. doi:10.5061/dryad.1j6v6
Galster, S., Burgess, N. D., Fjeldsa, J., Hansen, L. A., Rahbek, C. 2007. One Degree Resolution Databases of the Distribution of 1085 Species of Mammals in Sub-Saharan Africa. On-line data source-Version 1.00. Denmark: Zoological Museum, University of Copenhagen. Available via http://www.daim.snm.ku.dk/african-vertebrates-search
Garrett, N.D., Fox, D.L., McNulty, K.P., Faith, J.T., Peppe, D.J., Van Plantinga, A., Tryon, C.A., 2015. Stable isotope paleoecology of late Pleistocene middle stone age humans from the Lake Victoria Basin, Kenya. Journal of human evolution, 82, pp.1-14.
Gavryushkina, A., Welch, D., Stadler, T., Drummond, A.J., 2014. Bayesian Inference of Sampled Ancestor Trees for Epidemiology and Fossil Calibration. PLoS Comput. Biol. 10, e1003919. doi:10.1371/journal.pcbi.1003919
Geist, H.J., Lambin, E.F., 2004. Dynamic Causal Patterns of Desertification. Bioscience 54, 817. '67( 0!( 1!88',*9( :;9( <=>?@'AB9( :;9( C!D!#!%+9( E;9( F?G@'AB9( H;9( 1#7I'AB9( J;9( K!;( L;9( 1#7I$9( :;9( MNOP;(
Complete genome characterisation and phylogenetic position of Tigray hantavirus from the Ethiopian white-footed mouse, Stenocephalemys albipes. Infect. Genet. Evol. 45, 242–245. doi:10.1016/j.meegid.2016.09.009
Granjon, L., Colangelo, P., Tatard, C., Colyn, M., Dobigny, G., Nicolas, V., 2012. Intrageneric relationships within Gerbilliscus (Rodentia, Muridae, Gerbillinae), with characterization of an additional West African species. Zootaxa 25, 1–25.
Hajibabaei, M., Singer, G.A.C., Hebert, P.D.N., Hickey, D.A., 2007. DNA barcoding: how it complements taxonomy, molecular phylogenetics and population genetics. Trends Genet. 23, 167–72. doi:10.1016/j.tig.2007.02.001
Hamilton, A.C., 1976. The significance of patterns of distribution shown by forest plants and animals in tropical Africa for the reconstruction of upper Pleistocene palaeoenvironments: a review. Paleoecology of Africa, 9, 63–97
Haq, B.U., Hardenbol, J.A.N., Vail, P.R., 1987. Chronology of fluctuating sea levels since the Triassic. Science, 235(4793), pp.1156-1167.
Haug, G.H., Tiedemann, R., 1998. Effect of the formation of the Isthmus of Panama on Atlantic Ocean thermohaline circulation. Nature, 393(6686), p.673.
Heath, T.A., Huelsenbeck, J.P., Stadler, T., 2014. The fossilized birth–death process for coherent calibration of divergence-time estimates. Proceedings of the National Academy of Sciences, 111(29), pp.E2957-E2966.
Heled, J., Drummond, A.J., 2010. Bayesian inference of species trees from multilocus data. Mol. Biol. Evol.
27, 570–80. doi:10.1093/molbev/msp274 Hijmans, R.J., Cameron, S.E., Parra, J.L., Jones, P.G., Jarvis, A., 2005. Very high resolution interpolated
climate surfaces for global land areas. Int. J. Climatol. 25, 1965–1978. doi:10.1002/joc.1276 Hijmans, R.J., Phillips, S., Leathwick, J., Elith, J., 2016. dismo: Species distribution modeling. R package
version 1.0-15. Available at: https://CRAN.R-project.org/package=dismo Hodell, D.A., Curtis, J.H., Sierro, F.J., Raymo, M.E., 2001. Correlation of Late Miocene to Early Pliocene
sequences between the Mediterranean and North Atlantic. Paleoceanography 16, 164–178. doi:10.1029/1999PA000487
Holdridge, L. R., 1947. Determination of world plant formations from simple climatic data. Science 105(2727), 367-368.
Holt, B.G., Lessard, J.-P., Borregaard, M.K., Fritz, S.A., Araújo, M.B., Dimitrov, D., Fabre, P.-H., Graham, C.H., Graves, G.R., Jønsson, K.A., Nogués-Bravo, D., Wang, Z., Whittaker, R.J., Fjeldså, J., Rahbek, Q;9( MNOR;( J"( S40$%!( '.( T$88$,!U5( V''-!'-#$4D&,( /!-&'"5( '.( %D!( T'#80; Science. 339, 74–78.
54
Tatiana Aghová / Ph.D. dissertation (2018)
doi:10.1126/science.1228282 Höglund, J., 2009. Evolutionary conservation genetics. Oxford University Press, Oxford. Jacobs, L. L., 1978. Fossil rodents (Rhizomyidae and Muridae) from Neogene Siwalk deposits, Pakistan.
Mus. North. Ariz. Bull. 52, 1–103. Jacobs, L. L., L. J. Flynn, Downs, W.R., 1989. Neogene Rodentia of Southern Asia. in: Black, C.C., Dawson,
M.R. (Eds.), Papers on fossil rodents in honor of Albert Elmer Wood. Natural History Museum, Los Angeles. pp. 157–177
Jacobs, L.L., Flynn, L.J., 2005. Of mice… again: the Siwalik rodent record, murine distribution, and
molecular clocks. Interpreting the past: essays on human, primate, and mammal evolution in honor of David Pilbeam, 63, p.80.
Jacquet, F., Denys, C., Verheyen, E., Bryja, J., Hutterer, R., Peterhans, J.C.K., Stanley, W.T., Goodman, S.M., Couloux, A., Colyn, M., Nicolas, V., 2015. Phylogeography and evolutionary history of the Crocidura olivieri complex (Mammalia, Soricomorpha): from a forest origin to broad ecological expansion across Africa. BMC Evol. Biol. 15, 1–15. doi:10.1186/s12862-015-0344-y
Jaeger, F., 1945. Zur Gliederung und Benenming des tropischen Graslandgurtels. Verh. Naturf. Ges. Basel 56: 509-520
Jiménez-Valverde, A., Lobo, J.M., 2007. Threshold criteria for conversion of probability of species presence to either-or presence-absence. Acta Oecologica 31, 361–369. doi:10.1016/j.actao.2007.02.001
Jones, G.R., 2014. STACEY: species delimitation and phylogeny estimation under the multispecies coalescent. BioRxiv, 010199.
Kai, W., Nomura, K., Fujiwara, A., Nakamura, Y., Yasuike, M., Ojima, N., Masaoka, T., Ozaki, A., Kazeto, Y., Gen, K., Nagao, J., Tanaka, H., Kobayashi, T., Ototake, M., 2014. A ddRAD-based genetic map and its integration with the genome assembly of Japanese eel (Anguilla japonica) provides insights into genome evolution after the teleost-specific genome duplication. BMC Genomics 15, 233. doi:10.1186/1471-2164-15-233
Kapli, P., Lutteropp, S., Zhang, J., Kobert, K., Pavlidis, P., Stamatakis, A., Flouri, T., 2017. Multi-rate Poisson tree processes for single-locus species delimitation under maximum likelihood and Markov chain Monte Carlo. Bioinformatics 33, 1630–1638. doi:10.1093/bioinformatics/btx025
Kassahun, A., Sadlova, J., Dvorak, V., Kostalova, T., Rohousova, I., Frynta, D., Aghova, T., Yasur-Landau, D., Lemma, W., Hailu, A., Baneth, G., Warburg, A., Volf, P., Votypka, J., 2015. Detection of Leishmania donovani and L. tropica in Ethiopian wild rodents. Acta Trop. 1–6. doi:10.1016/j.actatropica.2015.02.006
Kebede, F., Rosenbom, S., Khalatbari, L., Moehlman, P.D., Beja-Pereira, A., Bekele, A., 2016. Genetic diversity of the Ethiopian Grevy’s zebra (Equus grevyi) populations that includes a unique population of the Alledeghi Plain. Mitochondrial DNA Part A, 27(1), pp.397-400.
Kimura, Y., Hawkins, M.T., McDonough, M.M., Jacobs, L.L., Flynn, L.J., 2015. Corrected placement of Mus-Rattus fossil calibration forces precision in the molecular tree of rodents. Scientific reports, 5, p.14444.
Kimura, Y., Jacobs, L.L., Cerling, T.E., Uno, K.T., Ferguson, K.M., Flynn, L.J., Patnaik, R., 2013. Fossil Mice and Rats Show Isotopic Evidence of Niche Partitioning and Change in Dental Ecomorphology Related to Dietary Shift in Late Miocene of Pakistan. PLoS One 8, 1–10. doi:10.1371/journal.pone.0069308
Kingdon, J., 1990. Island Africa: the evolution of Africa’s rare animals and plants. Collins, London. Kingdon, J., 2015. The Kingdon field guide to African mammals. Bloomsbury Publishing Plc London. Klempa, B., Fichet-Calvet, E., Lecompte, E., Auste, B., Aniskin, V., Meisel, H., Denys, C., Koivogui, L., ter
Meulen, J., Krüger, D.H., 2006. Hantavirus in African wood mouse, Guinea. Emerging Infectious Diseases, 12(5), p.838.
Köppen, W., 1900. Versuch einer Klassifikation der Klimate, vorzugsweise nach ihren Beziehungen zur Pflanzenwelt. Geographische Zeitschrift, 6(11. H), pp.593-611.
Köppen, W., 1884. Die Wärmezonen der Erde, nach der Dauer der heissen, gemässigten und kalten Zeit und nach der Wirkung der Wärme auf die organische Welt betrachtet. Meteorologische Zeitschrift, 1(0), pp.215-226.
Krijgsman, W., Hilgen, F.J., Raffi, I., Sierro, F.J., Wilson, D.S., 1999. Chronology, causes and progression of the Messinian salinity crisis. Nature, 400(6745), p.652.
Landis, M.J., Matzke, N.J., Moore, B.R., Huelsenbeck, J.P., 2013. Bayesian analysis of biogeography when the number of areas is large. Syst. Biol. 62, 789–804. doi:10.1093/sysbio/syt040
Lanfear, R., Calcott, B., Kainer, D., Mayer, C., Stamatakis, A., 2014. Selecting optimal partitioning schemes
55
Tatiana Aghová / Ph.D. dissertation (2018)
for phylogenomic datasets. BMC Evol. Biol. 14, 82. doi:10.1186/1471-2148-14-82 Lauer, W., 1952. Humide and aride Jahreszeiten in Afrika und Sudamerika und ihre Beziehungen zu den
Vegetationsgurteln. Banner Geogr. Abh. 9. Lavrenchenko, L.A., Kruskop, S. V, Bekele, A., Belay, G., Morozov, P.N., Ivlev, Y.F., Warshavsky, A.A.,
2010. Mammals of the Babille Elephant Sanctuary (Eastern Ethiopia). Russ. J. Theriol. 9, 47–60. Leaché, A.D., Fujita, M.K., Minin, V.N., Bouckaert, R.R., 2014. Species delimitation using genome-wide
SNP Data. Syst. Biol. 63, 534–542. doi:10.1093/sysbio/syu018 Lecompte, E., Aplin, K., Denys, C., Catzeflis, F., Chades, M., Chevret, P., 2008. Phylogeny and
biogeography of African Murinae based on mitochondrial and nuclear gene sequences, with a new tribal classification of the subfamily. BMC Evolutionary Biology, 8(1), p.199.
Lecompte, E., ter Meulen, J., Emonet, S., Daffis, S., Charrel, R.N., 2007. Genetic identification of Kodoko virus, a novel arenavirus of the African pigmy mouse (Mus Nannomys minutoides) in West Africa. Virology 364, 178–183. doi:10.1016/j.virol.2007.02.008
Lemmon, A.R., Emme, S.A., Lemmon, E.M., 2012. Anchored hybrid enrichment for massively high-throughput phylogenomics. Syst. Biol. 61, 727–744. doi:10.1093/sysbio/sys049
Linder, H.P., 2005. Evolution of diversity: the Cape flora. Trends in Plant Science, 10(11), 536–541. Linder, H.P., de Klerk, H.M., Born, J., Burgess, N.D., Fjeldså, J., Rahbek, C., 2012. The partitioning of
Africa: statistically defined biogeographical regions in sub-Saharan Africa. J. Biogeogr. 39, 1189–1205. doi:10.1111/j.1365-2699.2012.02728.x
Lorenzen, E.D., Heller, R., Siegismund, H.R., 2012. Comparative phylogeography of African savannah ungulates. Mol. Ecol. 21, 3656–3670. doi:10.1111/j.1365-294X.2012.05650.x
Lungu, A. N., 1981. Hipparion Fauna of Middle Sarmatian of Moldavia (Insectivora, Lagomorpha and Rodentia). State Tiraspol Institut Pedagogiki Publ. 1557, 1-137.
Macholan, M., Vyskocilova, M.M., Bejcek, V., Stastny, K., 2012. Mitochondrial DNA sequence variation and evolution of Old World house mice (Mus musculus). Folia Zool. 61, 284–307.
Manel, S., Williams, H.C., Ormerod, S.J., 2001. Evaluating presence absence models in ecology; the need to count for prevalence. J. Appied Ecol. 38, 921–931. doi:10.1046/j.1365-2664.2001.00647.x
Manthi, F.K., 2007. A preliminary review of the rodent fauna from Lemudong’o, southwestern Kenya, and its implication to the late Miocene paleoenvironments. Kirtlandia 56, 92–105.
Maslin, M.A., Trauth, M.H., 2009. Plio-Pleistocene East African Pulsed Climate Variability and Its Influence on Early Human Evolution, in: Leakey, R.E., Grine, F.E., Fleagle, J.G., Sponheimer, M., Lee-Thorp, J. a., Bobe, R., Leakey, M.G., Reed, K.E., Russak, S.M., Maslin, M. a., Trauth, M.H., Roche, H., Blumenschine, R.J., Shea, J.J., Ungar, P.S., Scott, R.S., Dean, M.C., Smith, B.H., Larson, S.G., Smith, E.J., Heesy, C.P., Smith, H.F., Lordkipanidze, D., Rightmire, G.P., Kimbel, W.H., Wood, B. a., Tobias, P. V., Jungers, W.L., Lieberman, D.E., Bramble, D.M., Raichlen, D.A. (Eds.), The First Humans: Origin and Early Evolution of the Genus Homo. Springer, pp. 151–158. doi:10.1007/978-1-4020-9980-9
Maslin, M. A., Brierley, C.M., Milner, A.M., Shultz, S., Trauth, M.H., Wilson, K.E., 2014. East african climate pulses and early human evolution. Quat. Sci. Rev. 101, 1–17. doi:10.1016/j.quascirev.2014.06.012
Maslin, M. A, Christensen, B., 2007. Tectonics, orbital forcing, global climate change, and human evolution in Africa: introduction to the African paleoclimate special volume. J. Hum. Evol. 53, 443–64. doi:10.1016/j.jhevol.2007.06.005
Mason, V.C., Li, G., Helgen, K.M., Murphy, W.J., 2011. Efficient cross-species capture hybridization and next-generation sequencing of mitochondrial genomes from noninvasively sampled museum specimens. Genome Res. 21, 1695–1704. doi:10.1101/gr.120196.111
Matzke, N.J., 2013. Probabilistic historical biogeography: new models for founder-event speciation, imperfect detection, and fossils allow improved accurancy and model-testing. Berkeley Plan. J. 26, 217–220. doi:10.5811/westjem.2011.5.6700
Matzke, N.J., 2014. Model selection in historical biogeography reveals that founder-event speciation is a crucial process in island clades. Syst. Biol. 63, 951–970. doi:10.1093/sysbio/syu056
Mayaux, P., Bartholomé, E., Fritz, S., Belward, A., 2004. A new land-cover map of Africa for the year 2000. Journal of Biogeography, 31(6), pp.861-877.
!"#$%&'()&' *+,-!&'.)&'/012!&'3)&'4#56*7+#68&'9., Russo, I.R., Verheyen, E., Šumbera, R., Phylogeography of a widespread sub-Saharan murid rodent Aethomys chrysophilus: the role of geographic barriers and paleoclimate in the Zambezian bioregion. Mammalia.
McCormack, J.E., Tsai, W.L.E., Faircloth, B.C., 2016. Sequence capture of ultraconserved elements from
56
Tatiana Aghová / Ph.D. dissertation (2018)
bird museum specimens. Mol. Ecol. Resour. 16, 1189–1203. doi:10.1111/1755-0998.12466 McDonough, M.M., Šumbera, R., Mazoch, V., Ferguson, A.W., Phillips, C.D., Bryja, J., 2015. Multilocus
phylogeography of a widespread savanna-woodland-adapted rodent reveals the influence of Pleistocene geomorphology and climate change in Africa’s Zambezi region. Mol. Ecol. 24, 5248–5266. doi:10.1111/mec.13374
Meerburg, B.G., Singleton, G.R., Kijlstra, A., 2009. Rodent-borne diseases and their risks for public health. Critical reviews in microbiology, 35(3), pp.221-270.
Meheretu, Y., Cizkova, D., Tesikova, J., Welegerima, K., Tomas, Z., Kidane, D., Girmay, K., Schmidt-Chanasit, J., Bryja, J., Guenther, S., Bryjova, A., Leirs, H., de Bellocq, J.G., 2012. High Diversity of RNA Viruses in Rodents, Ethiopia. Emerg. Infect. Dis. 18, 2047–2050. doi:10.3201/eid1812.120596
Meheretu, Y., Šumbera, R., Bryja, J., 2015. Enigmatic Ethiopian endemic rodent Muriculus imberbis (Rüppell 1842) represents a separate lineage within genus Mus. Mammalia, 79(1), pp.15-23.
Mein, P., Martín-Suárez, E., Agustí, J., 1993. Progonomys Schaub, 1938 and Huerzelerimys gen. nov.(Rodentia); their evolution in Western Europe. Scripta Geologica, 103, pp.41-64.
Mikula, O., Šumbera, R., Aghová, T., Mbau, J.S., Bryja, J., 2016. Evolutionary history and species diversity of African Pouched Mice of the genus Saccostomus (Rodentia: Nesomyidae). Zoologica Scripta, 45(6), 595-617.
Miller, M.A., Pfeiffer, W., Schwartz, T., 2010. Creating the CIPRES Science Gateway for inference of large phylogenetic trees, in: 2010 Gateway Computing Environments Workshop, GCE 2010. pp. 1–8.
Mistry, J., 2000. Savannas. Prog. Phys. Geogr. 24, 601–608. Mistry, J., Beradi, A., 2014. World savannas: ecology and human use. Routledge. Mittermeier, R.A., Gil, P.R., Hoffman, M., Pilgrim, J., Brooks, T., Mittermeier, C.G., Lamoreux, J., da
Fonseca, G.A.B., 2005. Hotspots revisited: Earth’s biologically richest and most endangered terrestrial ecoregions. University of Chicago Press, Chicago.
Muscarella, R., Galante, P.J., Soley-Guardia, M., Boria, R.A., Kass, J.M., Uriarte, M., Anderson, R.P., 2014. ENMeval: An R package for conducting spatially independent evaluations and estimating optimal model complexity for Maxent ecological niche models. Methods Ecol. Evol. 5, 1198–1205. doi:10.1111/2041-210X.12261
Musser, G.G., Carleton M.D., 2005. Superfamily Muroidea, in: Wilson D.E., Reeder D.A.M. (Eds.), Mammal Species of the World. The Johns Hopkins University Press, Baltimore, pp. 894–1531.
Myers, N., Mittermeier, R.A., Mittermeier, C.G., da Fonseca, G.A.B., Kent, J. 2000. Biodiversity hotspots for conservation priorities. Nature, 403, 853–858.
Ndiaye, A., Chevret, P., Dobigny, G., Granjon, L., 2016. Evolutionary systematics and biogeography of the arid habitat-adapted rodent genus Gerbillus (Rodentia, Muridae): a mostly Plio-Pleistocene African history. Journal of Zoological Systematics and Evolutionary Research, 54(4), pp.299-317.
Near, T.J., Meylan, P.A.,Shaffer, H.B., 2004. Assessing concordance of fossil calibration points in molecular clock studies: an example using turtles. The American Naturalist, 165(2), pp.137-146.
Near, T.J., Sanderson, M.J., 2004. Assessing the quality of molecular divergence time estimates by fossil calibrations and fossil-based model selection. Philos. Trans. R. Soc. Lond. B. Biol. Sci. 359, 1477–1483. doi:10.1098/rstb.2004.1523
Nicolas, V., Granjon, L., Duplantier, J.M., Cruaud, C., Dobigny, G., 2009. Phylogeography of spiny mice (genus Acomys, Rodentia: Muridae) from the south-western margin of the sahara with taxonomic implications. Biol. J. Linn. Soc. 98, 29–46. doi:10.1111/j.1095-8312.2009.01273.x
Nylander, J.A.A., Ronquist, F., Huelsenbeck, J.P., Nieves-Aldrey, J.L., 2004. Bayesian Phylogenetic Analysis of Combined Data. Syst. Biol. 53, 47–67. doi:10.1080/10635150490264699
Olson, D.M., Dinerstein, E., Wikramanayake, E.D., Burgess, N.D., Powell, G.V.N., Underwood, E.C., D’amico, J.A., Itoua, I., Strand, H.E., Morrison, J.C., Loucks, C.J., Allnutt, T.F., Ricketts, T.H., Kura, Y., Lamoreux, J.F., Wettengel, W.W., Hedao, P., Kassem, K.R., 2001. Terrestrial Ecoregions of the World: A New Map of Life on Earth. Bioscience 51, 933. doi:10.1641/0006-3568(2001)051[0933:TEOTWA]2.0.CO;2
Otto-Bliesner, B.L., 2006. Simulating Arctic Climate Warmth and Icefield Retreat in the Last Interglaciation. Science (80-. ). 311, 1751–1753. doi:10.1126/science.1120808
Parham, J.F., Donoghue, P.C.J., Bell, C.J., Calway, T.D., Head, J.J., Holroyd, P. A., Inoue, J.G., Irmis, R.B., Joyce, W.G., Ksepka, D.T., Patané, J.S.L., Smith, N.D., Tarver, J.E., Van Tuinen, M., Yang, Z., Angielczyk, K.D., Greenwood, J.M., Hipsley, C.A., Jacobs, L., Makovicky, P.J., Müller, J., Smith, K.T., Theodor, J.M., Warnock, R.C.M., Benton, M.J., 2012. Best practices for justifying fossil calibrations. Syst. Biol. 61, 346–359. doi:10.1093/sysbio/syr107
57
Tatiana Aghová / Ph.D. dissertation (2018)
Phillips, S.J., Anderson, R.P., Schapire, R.E., 2006. Maximum entropy modeling of species geographic distributions. Ecological modelling, 190(3-4), pp.231-259.
Phillips, S.J., Dudík, M., Schapire, R.E., 2004. A maximum entropy approach to species distribution modeling. In Proceedings of the twenty-first international conference on Machine learning (p. 83). ACM.
Pickford, M., Wanas, H., Soliman, H., 2006. Indications for a humid climate in the western desert of egypt 11–10 Myr ago: evidence from Galagidae (Primates, Mammalia). Comptes Rendus Palevol 5: 935–943
Piry, S., Guivier, E., Realini, A., Martin, J.F., 2012. |SE|S|AM|E| Barcode: NGS-oriented software for amplicon characterization–application to species and environmental barcoding. Molecular Ecology Resources, 12(6), pp.1151-1157.
Pons, J., Barraclough, T.G., Gomez-Zurita, J., Cardoso, A., Duran, D.P., Hazell, S., Kamoun, S., Sumlin, W.D., Vogler, A.P., 2006. Sequence-based species delimitation for the DNA taxonomy of undescribed insects. Systematic biology, 55(4), pp.595-609.
Puillandre, N., Lambert, A., Brouillet, S., Achaz, G., 2012. ABGD, Automatic Barcode Gap Discovery for primary species delimitation. Molecular ecology, 21(8), pp.1864-1877.
Pyron, R.A., 2011. Divergence time estimation using fossils as terminal taxa and the origins of Lissamphibia. Syst. Biol. 60, 466–481.
Pyron, R.A., 2010. A likelihood method for assessing molecular divergence time estimates and the placement of fossil calibrations. Syst. Biol. 59, 185–194. doi:10.1093/sysbio/syp090
Randi, E., D’Huart, J.P., Lucchini, V., Aman, R., 2002. Evidence of two genetically deeply divergent species of warhthog, Phacochoerus africanus and P. aethiopicus (Artiodactyla: Suiformes) in Eastern Africa. Mamm. Biol. 67, 91–96.
Ree, R.H., Smith, S.A., 2008. Maximum likelihood inference of geographic range evolution by dispersal, local extinction, and cladogenesis. Syst. Biol. 57, 4–14. doi:10.1080/10635150701883881
Renaud, S., Michaux, J., Mein, P., Aguilar, J.P., Auffray, J.C., 1999. Patterns of size and shape differentiation during the evolutionary radiation of the European Miocene murine rodents. Lethaia 32, 61–71. doi:10.1111/j.1502-3931.1999.tb00581.x
Richards, P.W. 1973. Africa, the ‘odd man out’. Tropical forest ecosystems in Africa and South America: a comparative review (ed. by B.J. Meggers, E.S. Ayensu and W.D. Duckworth), pp. 21–26. Smithsonian Institution Press, Washington, DC.
Rögl, F., 1999. Mediterranean and Paratethys. Facts and hypotheses of an Oligocene to Miocene paleogeography (short overview). Geol. Carpathica 50, 339–349.
Ronquist, F., 1997. Dispersal-Vicariance Analysis: A New Approach to the Quantification of Historical Biogeography. Syst. Biol. 46, 195. doi:10.2307/2413643
Ronquist, F., Teslenko, M., van der Mark, P., Ayres, D.L., Darling, A., Höhna, S., Larget, B., Liu, L., Suchard, M.A., Huelsenbeck, J.P., 2012a. MrBayes 3.2: efficient Bayesian phylogenetic inference and model choice across a large model space. Syst. Biol. 61, 539–42. doi:10.1093/sysbio/sys029
Ronquist, F., Klopfstein, S., Vilhelmsen, L., Schulmeister, S., Murray, D.L., Rasnitsyn, A.P., 2012b. A total-evidence approach to dating with fossils, applied to the early radiation of the hymenoptera. Syst. Biol. 61, 973–999. doi:10.1093/sysbio/sys058
Rowe, K.C., Reno, M.L., Richmond, D.M., Adkins, R.M., Steppan, S.J., 2008. Pliocene colonization and adaptive radiations in Australia and New Guinea (Sahul): Multilocus systematics of the old endemic rodents (Muroidea: Murinae). Mol. Phylogenet. Evol. 47, 84–101. doi:10.1016/j.ympev.2008.01.001
Sayre, R., Comer, P., Hak, J., Josse, C., Bow, J., Warner, H., Larwanou, M., Kelbessa, E., Bekele, T., Kehl, H., Amena, R., Andriamasimanana, R., Ba, T., Benson, L., Boucher, T., Brown, M., Cress, J., Dassering, O., Friesen, B., Gachathi, F., Houcine, S., Keita, M., Khamala, E., Marangu, D., Mokua, F., Morou, B., Mucina, L., Mugisha, S., Mwavu, E., Rutherford, M., Sanou, P., Syampungani, S., Tomor, B., Vall, A., Weghe, J. Vande, Wangui, E., Waruingi, L., 2013. A new map of standardized terrestrial
ecosystems of Africa. 1–24. doi:ISBN 978-0-89291-275-9 Schenk, J.J., Rowe, K.C., Steppan, S.J., 2013. Ecological opportunity and incumbency in the diversification
of repeated continental colonizations by muroid rodents. Syst. Biol. 62, 837–64. doi:10.1093/sysbio/syt050
Schuster, M., Duringer, P., Ghienne, J.-F., Vignaud, P., Mackaye, H.T., Likius, A., Brunet, M., 2006. The Age of the Sahara Desert. Science (80-. ). 312, 1138-1139-1139. doi:10.1126/science.312.5777.1138b
Sepulchre, P., Ramstein, G., Fluteau, F., Schuster, M., Tiercelin, J.-J., Brunet, M., 2006. Tectonic uplift and Eastern Africa aridification. Science 313, 1419–1423. doi:10.1126/science.1129158
Stadler, T., 2010. Sampling-through-time in birth-death trees. J. Theor. Biol. 267, 396–404.
58
Tatiana Aghová / Ph.D. dissertation (2018)
Stamatakis, A., 2014. RAxML version 8: a tool for phylogenetic analysis and post-analysis of large phylogenies. Bioinformatics, 30(9), pp.1312-1313.
Stanhope, M.J., Czelusniak, J., Si, J.-S., Nickerson, J., Goodman, M., 1992. A molecular perspective on mammalian evolution from the gene encoding interphotoreceptor retinoid binding protein, with convincing evidence for bat monophyly. Mol. Phylogenet. Evol. 1, 148–160.
Steppan, S., Adkins, R., Anderson, J., 2004. Phylogeny and divergence-date estimates of rapid radiations in muroid rodents based on multiple nuclear genes. Syst. Biol. 53, 533–553. doi:10.1080/10635150490468701
Strecker, M.R., Blisniuk, P.M., Eisbacher, G.H., 1990. Rotation of extension direction in the central Kenya Rift. Geology 18, 299–302.
Teeling, E.C., Scally, M., Kao, D.J., Romagnoli, M.L., Springer, M.S., Stanhope, M.J., 2000. Molecular evidence regarding the origin of echolocation and flight in bats. Nature 403, 188–192.
Terryn, L., Wendelen, W., Leirs, H., Lenglet, G., Verheyen, E., 2007. African Rodentia. Web address: http://projects. biodiversity. be/africanrodentia.
Thulin, M., 1993. Flora of Somalia, Volume 1-Pteridophyta; Gymnospamae; angiospamae (Annonacae-Fabaceae). Flora of Somalia.
Thulin, M., 1994. Aspects of disjunct distributions and endemism in the arid parts of the Horn of Africa, particularly Somalia. Proceedings of the XIIIth plenary meeting of AETFAT, Zomba, Malawi, 2–11
April 1991 (ed. by J.H. Seyani and A.C. Chikuni), pp. 1105–1119. National Herbarium and Botanic Gardens of Malawi, Zomba.
Tilak, M.K., Justy, F., Debiais-Thibaud, M., Botero-Castro, F., Delsuc, F., Douzery, E.J.P., 2015. A cost-effective straightforward protocol for shotgun Illumina libraries designed to assemble complete mitogenomes from non-model species. Conserv. Genet. Resour. 7, 37–40. doi:10.1007/s12686-014-0338-x
Trauth, M.H., Maslin, M. a., Deino, A.L., Junginger, A., Lesoloyia, M., Odada, E.O., Olago, D.O., Olaka, L. a., Strecker, M.R., Tiedemann, R., 2010. Human evolution in a variable environment: the amplifier lakes of Eastern Africa. Quat. Sci. Rev. 29, 2981–2988. doi:10.1016/j.quascirev.2010.07.007
Troll, C., 1950. Savannentypen und das Problem der Primarsavannen. Proc. 7th Int. Bot. Congress, Stockholm, 670-674.
Varshavsky, A.A., Karimova, T.Y., Neronov, V.M., 2007. Specific features of the rodent fauna formation in Somali Peninsula. Zoologichesky Zhurnal, 86, 1498–1506.
Vaughan, T.A., Ryan, J.M., Czaplewski, N.J., 2011. Mammology. 5th ed. Jones and Bartlett Publishers, Sudbury.
Wallace, A.R., 1876. The Geographical Distribution of Animals with a Study of the Relations of Living and
Extinct Faunas, Harper & Brothers, London. Walter, H., 1973. Vegetation of the Earth in Relation to Climate and the Eco-physiological Conditions.
English Universities Press.. White, F., 1983. The vegetation of Africa: A descriptive memoir to accompany the
UNESCO/AETFAT/UNSO vegetation map of Africa (Natural Resources Research 20). UN
Educational, Scientific and Cultural Organization, Paris. White, F., 1987. Vegetation Map of Africa. The Vegetation of Africa: A Descriptive Memoir to Accompany
the Unesco/AETFAT/UNSO Vegetation map of Africa. J. Ecol. 75, 1214. doi:10.2307/2260340 Whittaker, R.H., 1975. Communities and ecosystems, 2nd edn, p. 385. Macmillan, New York Wickliffe, J.K., Hoffmann, F.G., Carroll, D.S., Dunina-Barkovskaya, Y.V., Bradley, R.D., Baker, R.J., 2003.
PCR and sequencing primers for intron 7 (Fgb-I7) of the fibrinogen, B beta polypeptide (Fgb) in mammals: a novel nuclear DNA marker. Occasional Papers, Museum of Texas Tech University, 219, p.i8.
Wynn, J.G., 2000. Paleosols, stable carbon isotopes, and paleoenvironmental interpretation of Kanapoi, Northern Kenya. Journal of Human Evolution, 39(4), pp.411-432.
Yang, Z., Rannala, B., 2014. Unguided species delimitation using DNA sequence data from multiple loci. Mol. Biol. Evol. 31, 3125–3135. doi:10.1093/molbev/msu279

59
Tatiana Aghová / Ph.D. dissertation (2018)
Pan-African phylogeny of Mus
(subgenus Nannomys) reveals one of the
most successful mammal radiations in
Africa
Bryja, J., Mikula, O., umbera, R., Meheretu, Y., Aghová, T.,
Lavrenchenko, L. A., Mazoch, V., Oguge, N., Mbau, J.S.,
Welegerima, K., Amundala, N., Colyn, M., Leirs, H.,
Verheyen, E., 2014. BMC Evolutionary Biology, 14(1), 256.
https://doi.org/10.1186/s12862-014-0256-2
Study design: JB, R , EV
Collecting material: JB, R , VM, YM, LL, KW, NO, JM,
NA, MC, HL
Laboratory analysis: TA, YM
Data analysis: JB, OM
Writing: JB, OM
My contribution: 10%
Paper
I
Paper
I

60
Tatiana Aghová / Ph.D. dissertation (2018)

61
Tatiana Aghová / Ph.D. dissertation (2018)
RESEARCH ARTICLE Open Access
Pan-African phylogeny of Mus (subgenusNannomys) reveals one of the most successfulmammal radiations in AfricaJosef Bryja1,2,13*, Ondřej Mikula1,3, Radim Šumbera4, Yonas Meheretu5, Tatiana Aghová1,2, Leonid A Lavrenchenko6,
Vladimír Mazoch4, Nicholas Oguge7, Judith S Mbau8, Kiros Welegerima5, Nicaise Amundala9, Marc Colyn10,
Herwig Leirs11 and Erik Verheyen11,12
Abstract
Background: Rodents of the genus Mus represent one of the most valuable biological models for biomedical and
evolutionary research. Out of the four currently recognized subgenera, Nannomys (African pygmy mice, including
the smallest rodents in the world) comprises the only original African lineage. Species of this subgenus became
important models for the study of sex determination in mammals and they are also hosts of potentially dangerous
pathogens. Nannomys ancestors colonized Africa from Asia at the end of Miocene and Eastern Africa should be
considered as the place of their first radiation. In sharp contrast with this fact and despite the biological importance
of Nannomys, the specimens from Eastern Africa were obviously under-represented in previous studies and the
phylogenetic and distributional patterns were thus incomplete.
Results: We performed comprehensive genetic analysis of 657 individuals of Nannomys collected at approximately
300 localities across the whole sub-Saharan Africa. Phylogenetic reconstructions based on mitochondrial (CYTB) and
nuclear (IRBP) genes identified five species groups and three monotypic ancestral lineages. We provide evidence for
important cryptic diversity and we defined and mapped the distribution of 27 molecular operational taxonomic units
(MOTUs) that may correspond to presumable species. Biogeographical reconstructions based on data spanning all of
Africa modified the previous evolutionary scenarios. First divergences occurred in Eastern African mountains soon after
the colonization of the continent and the remnants of these old divergences still occur there, represented by
long basal branches of M. (previously Muriculus) imberbis and two undescribed species from Ethiopia and Malawi.
The radiation in drier lowland habitats associated with the decrease of body size is much younger, occurred mainly in
a single lineage (called the minutoides group, and especially within the species M. minutoides), and was probably linked
to aridification and climatic fluctuations in middle Pliocene/Pleistocene.
Conclusions: We discovered very high cryptic diversity in African pygmy mice making the genus Mus one of
the richest genera of African mammals. Our taxon sampling allowed reliable phylogenetic and biogeographic
reconstructions that (together with detailed distributional data of individual MOTUs) provide a solid basis for further
evolutionary, ecological and epidemiological studies of this important group of rodents.
Keywords: Biogeography, Tropical Africa, Molecular phylogeny, Pygmy mice, Plio-Pleistocene climatic fluctuations,
Divergence timing, Muridae (Murinae), Mus minutoides, Phylogeography, DNA barcoding
* Correspondence: [email protected] of Vertebrate Biology, Academy of Sciences of the Czech Republic,
Brno, Czech Republic2Department of Botany and Zoology, Faculty of Science, Masaryk University,
Brno, Czech Republic
Full list of author information is available at the end of the article
© 2014 Bryja et al.; licensee BioMed Central. This is an Open Access article distributed under the terms of the CreativeCommons Attribution License (http://creativecommons.org/licenses/by/4.0), which permits unrestricted use, distribution, andreproduction in any medium, provided the original work is properly credited. The Creative Commons Public DomainDedication waiver (http://creativecommons.org/publicdomain/zero/1.0/) applies to the data made available in this article,unless otherwise stated.
Bryja et al. BMC Evolutionary Biology (2014) 14:256
DOI 10.1186/s12862-014-0256-2
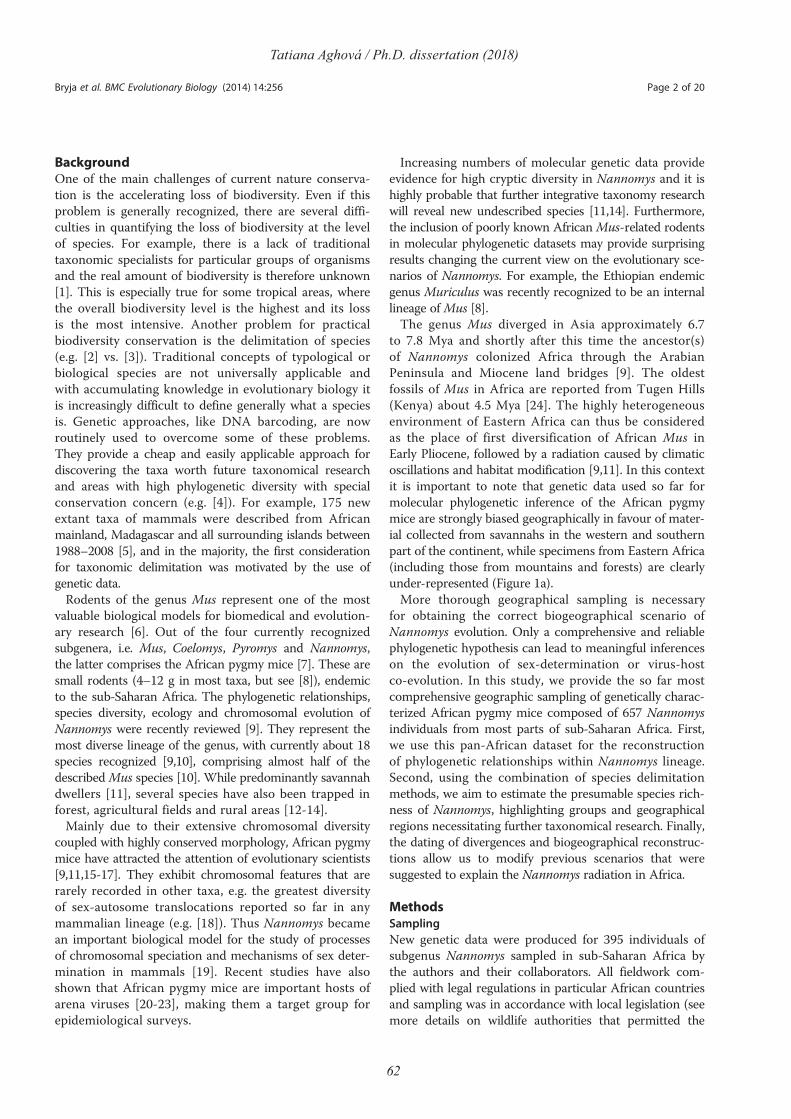
62
Tatiana Aghová / Ph.D. dissertation (2018)
Background
One of the main challenges of current nature conserva-
tion is the accelerating loss of biodiversity. Even if this
problem is generally recognized, there are several diffi-
culties in quantifying the loss of biodiversity at the level
of species. For example, there is a lack of traditional
taxonomic specialists for particular groups of organisms
and the real amount of biodiversity is therefore unknown
[1]. This is especially true for some tropical areas, where
the overall biodiversity level is the highest and its loss
is the most intensive. Another problem for practical
biodiversity conservation is the delimitation of species
(e.g. [2] vs. [3]). Traditional concepts of typological or
biological species are not universally applicable and
with accumulating knowledge in evolutionary biology it
is increasingly difficult to define generally what a species
is. Genetic approaches, like DNA barcoding, are now
routinely used to overcome some of these problems.
They provide a cheap and easily applicable approach for
discovering the taxa worth future taxonomical research
and areas with high phylogenetic diversity with special
conservation concern (e.g. [4]). For example, 175 new
extant taxa of mammals were described from African
mainland, Madagascar and all surrounding islands between
1988–2008 [5], and in the majority, the first consideration
for taxonomic delimitation was motivated by the use of
genetic data.
Rodents of the genus Mus represent one of the most
valuable biological models for biomedical and evolution-
ary research [6]. Out of the four currently recognized
subgenera, i.e. Mus, Coelomys, Pyromys and Nannomys,
the latter comprises the African pygmy mice [7]. These are
small rodents (4–12 g in most taxa, but see [8]), endemic
to the sub-Saharan Africa. The phylogenetic relationships,
species diversity, ecology and chromosomal evolution of
Nannomys were recently reviewed [9]. They represent the
most diverse lineage of the genus, with currently about 18
species recognized [9,10], comprising almost half of the
described Mus species [10]. While predominantly savannah
dwellers [11], several species have also been trapped in
forest, agricultural fields and rural areas [12-14].
Mainly due to their extensive chromosomal diversity
coupled with highly conserved morphology, African pygmy
mice have attracted the attention of evolutionary scientists
[9,11,15-17]. They exhibit chromosomal features that are
rarely recorded in other taxa, e.g. the greatest diversity
of sex-autosome translocations reported so far in any
mammalian lineage (e.g. [18]). Thus Nannomys became
an important biological model for the study of processes
of chromosomal speciation and mechanisms of sex deter-
mination in mammals [19]. Recent studies have also
shown that African pygmy mice are important hosts of
arena viruses [20-23], making them a target group for
epidemiological surveys.
Increasing numbers of molecular genetic data provide
evidence for high cryptic diversity in Nannomys and it is
highly probable that further integrative taxonomy research
will reveal new undescribed species [11,14]. Furthermore,
the inclusion of poorly known African Mus-related rodents
in molecular phylogenetic datasets may provide surprising
results changing the current view on the evolutionary sce-
narios of Nannomys. For example, the Ethiopian endemic
genus Muriculus was recently recognized to be an internal
lineage of Mus [8].
The genus Mus diverged in Asia approximately 6.7
to 7.8 Mya and shortly after this time the ancestor(s)
of Nannomys colonized Africa through the Arabian
Peninsula and Miocene land bridges [9]. The oldest
fossils of Mus in Africa are reported from Tugen Hills
(Kenya) about 4.5 Mya [24]. The highly heterogeneous
environment of Eastern Africa can thus be considered
as the place of first diversification of African Mus in
Early Pliocene, followed by a radiation caused by climatic
oscillations and habitat modification [9,11]. In this context
it is important to note that genetic data used so far for
molecular phylogenetic inference of the African pygmy
mice are strongly biased geographically in favour of mater-
ial collected from savannahs in the western and southern
part of the continent, while specimens from Eastern Africa
(including those from mountains and forests) are clearly
under-represented (Figure 1a).
More thorough geographical sampling is necessary
for obtaining the correct biogeographical scenario of
Nannomys evolution. Only a comprehensive and reliable
phylogenetic hypothesis can lead to meaningful inferences
on the evolution of sex-determination or virus-host
co-evolution. In this study, we provide the so far most
comprehensive geographic sampling of genetically charac-
terized African pygmy mice composed of 657 Nannomys
individuals from most parts of sub-Saharan Africa. First,
we use this pan-African dataset for the reconstruction
of phylogenetic relationships within Nannomys lineage.
Second, using the combination of species delimitation
methods, we aim to estimate the presumable species rich-
ness of Nannomys, highlighting groups and geographical
regions necessitating further taxonomical research. Finally,
the dating of divergences and biogeographical reconstruc-
tions allow us to modify previous scenarios that were
suggested to explain the Nannomys radiation in Africa.
Methods
Sampling
New genetic data were produced for 395 individuals of
subgenus Nannomys sampled in sub-Saharan Africa by
the authors and their collaborators. All fieldwork com-
plied with legal regulations in particular African countries
and sampling was in accordance with local legislation (see
more details on wildlife authorities that permitted the
Bryja et al. BMC Evolutionary Biology (2014) 14:256 Page 2 of 20
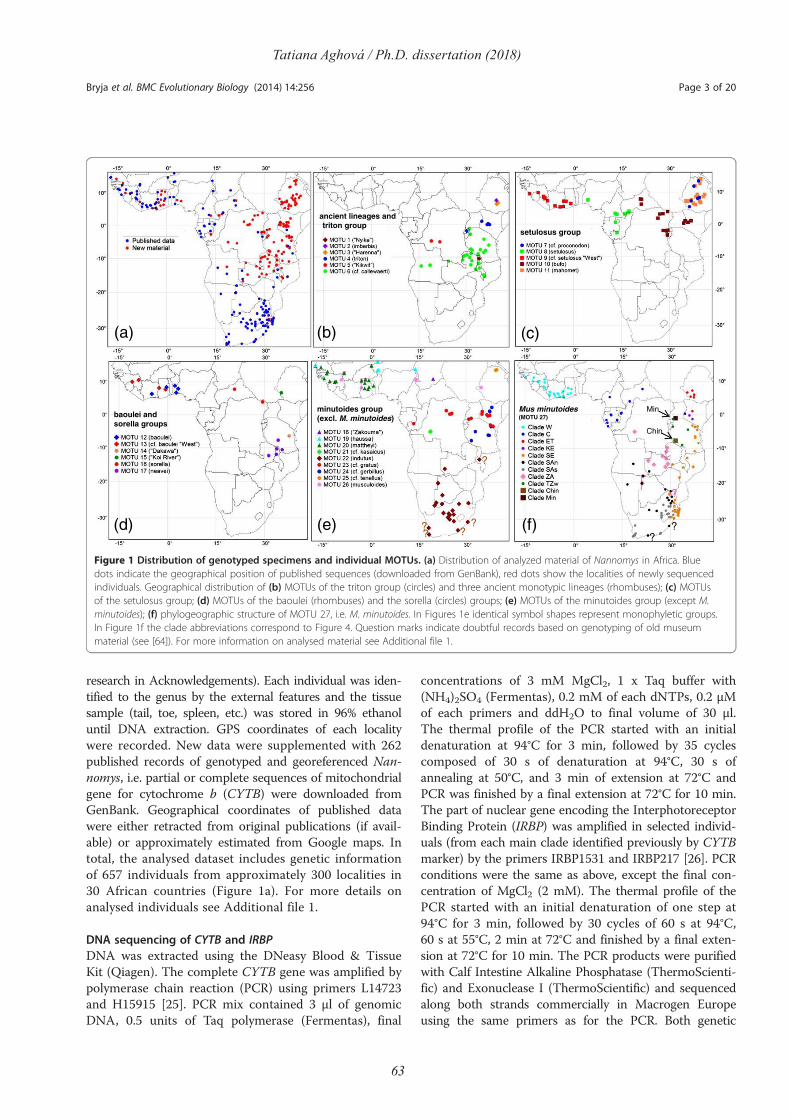
63
Tatiana Aghová / Ph.D. dissertation (2018)
research in Acknowledgements). Each individual was iden-
tified to the genus by the external features and the tissue
sample (tail, toe, spleen, etc.) was stored in 96% ethanol
until DNA extraction. GPS coordinates of each locality
were recorded. New data were supplemented with 262
published records of genotyped and georeferenced Nan-
nomys, i.e. partial or complete sequences of mitochondrial
gene for cytochrome b (CYTB) were downloaded from
GenBank. Geographical coordinates of published data
were either retracted from original publications (if avail-
able) or approximately estimated from Google maps. In
total, the analysed dataset includes genetic information
of 657 individuals from approximately 300 localities in
30 African countries (Figure 1a). For more details on
analysed individuals see Additional file 1.
DNA sequencing of CYTB and IRBP
DNA was extracted using the DNeasy Blood & Tissue
Kit (Qiagen). The complete CYTB gene was amplified by
polymerase chain reaction (PCR) using primers L14723
and H15915 [25]. PCR mix contained 3 μl of genomic
DNA, 0.5 units of Taq polymerase (Fermentas), final
concentrations of 3 mM MgCl2, 1 x Taq buffer with
(NH4)2SO4 (Fermentas), 0.2 mM of each dNTPs, 0.2 μM
of each primers and ddH2O to final volume of 30 μl.
The thermal profile of the PCR started with an initial
denaturation at 94°C for 3 min, followed by 35 cycles
composed of 30 s of denaturation at 94°C, 30 s of
annealing at 50°C, and 3 min of extension at 72°C and
PCR was finished by a final extension at 72°C for 10 min.
The part of nuclear gene encoding the Interphotoreceptor
Binding Protein (IRBP) was amplified in selected individ-
uals (from each main clade identified previously by CYTB
marker) by the primers IRBP1531 and IRBP217 [26]. PCR
conditions were the same as above, except the final con-
centration of MgCl2 (2 mM). The thermal profile of the
PCR started with an initial denaturation of one step at
94°C for 3 min, followed by 30 cycles of 60 s at 94°C,
60 s at 55°C, 2 min at 72°C and finished by a final exten-
sion at 72°C for 10 min. The PCR products were purified
with Calf Intestine Alkaline Phosphatase (ThermoScienti-
fic) and Exonuclease I (ThermoScientific) and sequenced
along both strands commercially in Macrogen Europe
using the same primers as for the PCR. Both genetic
(b)(a)
(e)(d)
(c)
(f)
Mus minutoides
(MOTU 27)
minutoides group
(excl. M. minutoides) baoulei and
sorella groups
setulosus group
ancient lineages and
triton group
Min
Chin
?
?
?? ?
??
?
Figure 1 Distribution of genotyped specimens and individual MOTUs. (a) Distribution of analyzed material of Nannomys in Africa. Blue
dots indicate the geographical position of published sequences (downloaded from GenBank), red dots show the localities of newly sequenced
individuals. Geographical distribution of (b) MOTUs of the triton group (circles) and three ancient monotypic lineages (rhombuses); (c) MOTUs
of the setulosus group; (d) MOTUs of the baoulei (rhombuses) and the sorella (circles) groups; (e) MOTUs of the minutoides group (except M.
minutoides); (f) phylogeographic structure of MOTU 27, i.e. M. minutoides. In Figures 1e identical symbol shapes represent monophyletic groups.
In Figure 1f the clade abbreviations correspond to Figure 4. Question marks indicate doubtful records based on genotyping of old museum
material (see [64]). For more information on analysed material see Additional file 1.
Bryja et al. BMC Evolutionary Biology (2014) 14:256 Page 3 of 20

64
Tatiana Aghová / Ph.D. dissertation (2018)
markers have been previously used to successfully resolve
systematic relationships in a wide range of related murid
rodents (e.g. [7,25].
Genetic data from fresh material were complemented
by museum samples (mostly dry skins) from the Royal
Museum for Central Africa (Tervuren, Belgium), Muséum
National d'Histoire Naturelle (Paris, France), American
Museum of Natural History (New York, USA) and
Hungarian Natural History Museum (Budapest, Hungary)
(for more details see Additional file 1). Museum samples
comprised only minor part of analysed material and we
used especially those from geographical areas difficult to
be accessed today (e.g. Central African Republic, eastern
Democratic Republic of Congo) and the type material of
Mus bufo. All museum samples were handled in a special-
ized laboratory of Institute of Vertebrate Biology ASCR in
Studenec, designed for work with rare DNA to prevent
contamination by samples with high quantity of DNA or
PCR products. DNA was extracted using the JETQUICK
Tissue DNA Spin Kit (Genomed). PCR amplification and
pyrosequencing on GS Junior were performed according
to mini-barcode protocol described by [27]. The main
advantage of this approach in analysis of museum samples
is that it allows for separating individual sequences in
samples contaminated by distantly related organisms (e.g.
contamination by human DNA), which is not possible
through the Sanger sequencing.
Phylogenetic reconstructions
Sequences of CYTB and IRBP were edited and aligned
in SeqScape v2.5 (Applied Biosystems), producing a final
alignment of 1140 and 1276 bp, respectively. The Find-
model web application (http://www.hiv.lanl.gov/content/
sequence/findmodel/findmodel.html) was used to iden-
tify the most appropriate substitution model for each
gene. The Akaike information criterion (AIC), compared
among 12 substitution models, revealed that the model
best fitting the ingroup data was the General time
reversible model with a gamma-distributed rate variation
across sites (GTR +G) for both CYTB and IRBP. As out-
groups, we used sequences of four species from other
subgenera of the genus Mus, i.e. M. platythrix (CYTB
GenBank Acc. code AJ698880, IRBP GenBank Acc. code
AJ698895), M. pahari (AY057814, AJ698893), M. caroli
(AB033698, AJ698885) and M. musculus (V00711,
AF126968); two sister lineages of the genus Mus within
subfamily Murinae, i.e. Apodemus flavicollis (AB032853,
AB032860) and Ratus norvegicus (V01556, AJ429134);
and one species from the subfamily Acomyinae, Acomys
cahirinus (AJ233953, AJ698898) see also [7,9,11].
Phylogenetic relationships within Nannomys were in-
ferred by maximum likelihood (ML) and Bayesian (BI)
approaches. ML analysis was performed using RAxML
8.0 [28]. The GTR + G model (option -m GTRGAMMA)
was selected for the six partitions, i.e. 1140 bp of CYTB,
1276 bp of IRBP, and both genes were partitioned also by
the position of nucleotides in the codons (option -q). The
robustness of the nodes was evaluated by the default boot-
strap procedure with 1,000 replications (option -# 1000).
Bayesian analysis of evolutionary relationships was per-
formed by Markov chain Monte Carlo (MCMC) method
in MrBayes v. 3.2.1 [29]. Three heated and one cold chain
were employed in all analyses, and runs were initiated
from random trees. Two independent runs were con-
ducted with 5 million generations per run; and trees and
parameters were sampled every 1,000 generations. Con-
vergence was checked using TRACER v1.5 [30]. For each
run, the first 10% of sampled trees were discarded as
burn-in. Bayesian posterior probabilities were used to
assess branch support of the Bayesian tree.
The most widespread Nannomys species (= MOTU, see
below) is M. minutoides. For this species we performed
more detailed analysis of intraspecific genetic variability.
We selected 131 sequences belonging to this clade and
trimmed the final alignment to the length of 741 bp.
Haplotypes were generated using DNaSP software [31]
and a median-joining network of haplotypes was produced
in the software Network 4.6.1.2 (downloaded on 10.2.2014
from http://www.fluxus-engineering.com/sharenet.htm).
Delimitation of MOTUs
We estimated the possible number of putative species
(called here molecular operational taxonomic units,
MOTUs, until the thorough taxonomic evidence will be
provided) of Nannomys in the sampled dataset by using
two types of divergence thresholds and the CYTB data-
set. The first was the time threshold estimated by the
Generalized Mixed Yule Coalescent (GMYC) model [32]
which describes single-locus branching pattern as a suc-
cession of speciation events replaced at a fixed threshold
time by a succession of intraspecific coalescent events.
The two stages are modelled by Yule process and neutral
coalescent, respectively, which allows finding maximum
likelihood estimate of the threshold time and evaluating
statistical support for the delimited species [33,34]. In
this framework reliably delimited species are those whose
basal internal split occurred well after the speciation-
coalescence threshold and which diverged from sister
species well before it. We therefore calculated two kinds
of support: (1) for each intra-specific basal split we calcu-
lated relative likelihood that it represents coalescence
rather than speciation event by summing up Akaike
weights of all threshold times older or equal to its age;
(2) for each inter-specific split we calculated relative
likelihood that it represents speciation as a sum of Akaike
weights of threshold times younger to it. The ultrametric
tree required by GMYC was produced by BEAST 1.8.0 [35]
with uncorrelated lognormal distribution of substitution
Bryja et al. BMC Evolutionary Biology (2014) 14:256 Page 4 of 20
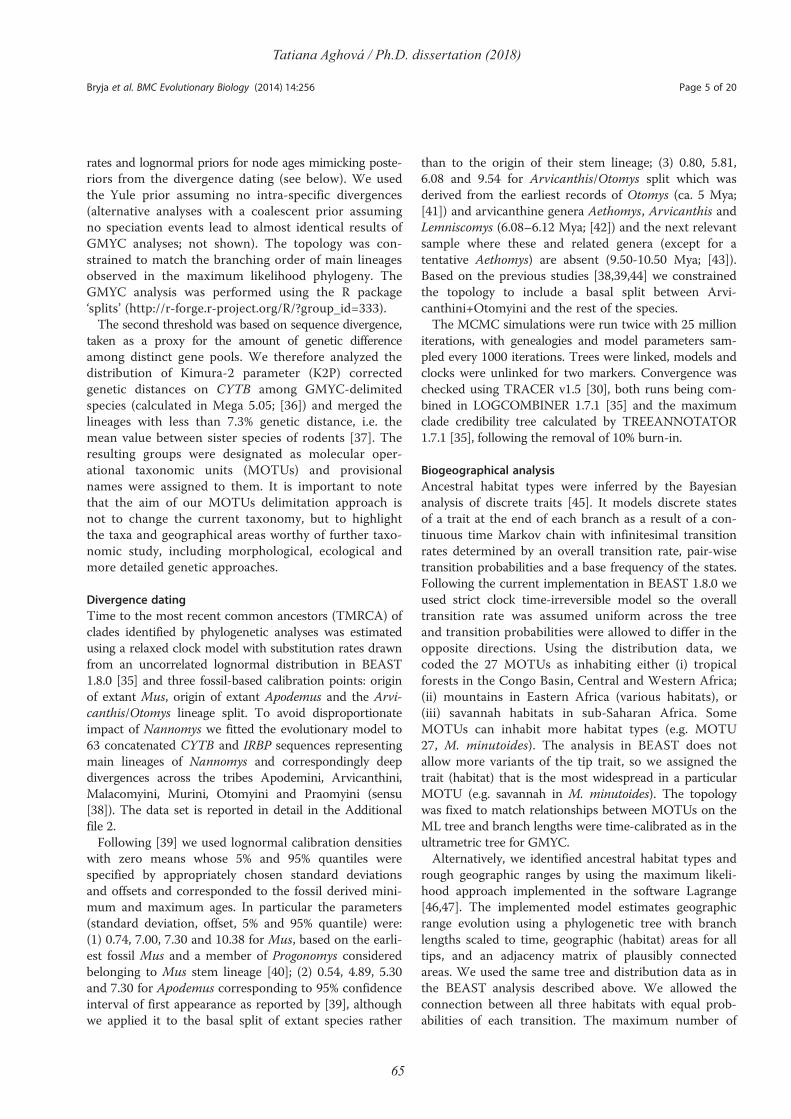
65
Tatiana Aghová / Ph.D. dissertation (2018)
rates and lognormal priors for node ages mimicking poste-
riors from the divergence dating (see below). We used
the Yule prior assuming no intra-specific divergences
(alternative analyses with a coalescent prior assuming
no speciation events lead to almost identical results of
GMYC analyses; not shown). The topology was con-
strained to match the branching order of main lineages
observed in the maximum likelihood phylogeny. The
GMYC analysis was performed using the R package
‘splits’ (http://r-forge.r-project.org/R/?group_id=333).
The second threshold was based on sequence divergence,
taken as a proxy for the amount of genetic difference
among distinct gene pools. We therefore analyzed the
distribution of Kimura-2 parameter (K2P) corrected
genetic distances on CYTB among GMYC-delimited
species (calculated in Mega 5.05; [36]) and merged the
lineages with less than 7.3% genetic distance, i.e. the
mean value between sister species of rodents [37]. The
resulting groups were designated as molecular oper-
ational taxonomic units (MOTUs) and provisional
names were assigned to them. It is important to note
that the aim of our MOTUs delimitation approach is
not to change the current taxonomy, but to highlight
the taxa and geographical areas worthy of further taxo-
nomic study, including morphological, ecological and
more detailed genetic approaches.
Divergence dating
Time to the most recent common ancestors (TMRCA) of
clades identified by phylogenetic analyses was estimated
using a relaxed clock model with substitution rates drawn
from an uncorrelated lognormal distribution in BEAST
1.8.0 [35] and three fossil-based calibration points: origin
of extant Mus, origin of extant Apodemus and the Arvi-
canthis/Otomys lineage split. To avoid disproportionate
impact of Nannomys we fitted the evolutionary model to
63 concatenated CYTB and IRBP sequences representing
main lineages of Nannomys and correspondingly deep
divergences across the tribes Apodemini, Arvicanthini,
Malacomyini, Murini, Otomyini and Praomyini (sensu
[38]). The data set is reported in detail in the Additional
file 2.
Following [39] we used lognormal calibration densities
with zero means whose 5% and 95% quantiles were
specified by appropriately chosen standard deviations
and offsets and corresponded to the fossil derived mini-
mum and maximum ages. In particular the parameters
(standard deviation, offset, 5% and 95% quantile) were:
(1) 0.74, 7.00, 7.30 and 10.38 for Mus, based on the earli-
est fossil Mus and a member of Progonomys considered
belonging to Mus stem lineage [40]; (2) 0.54, 4.89, 5.30
and 7.30 for Apodemus corresponding to 95% confidence
interval of first appearance as reported by [39], although
we applied it to the basal split of extant species rather
than to the origin of their stem lineage; (3) 0.80, 5.81,
6.08 and 9.54 for Arvicanthis/Otomys split which was
derived from the earliest records of Otomys (ca. 5 Mya;
[41]) and arvicanthine genera Aethomys, Arvicanthis and
Lemniscomys (6.08–6.12 Mya; [42]) and the next relevant
sample where these and related genera (except for a
tentative Aethomys) are absent (9.50-10.50 Mya; [43]).
Based on the previous studies [38,39,44] we constrained
the topology to include a basal split between Arvi-
canthini+Otomyini and the rest of the species.
The MCMC simulations were run twice with 25 million
iterations, with genealogies and model parameters sam-
pled every 1000 iterations. Trees were linked, models and
clocks were unlinked for two markers. Convergence was
checked using TRACER v1.5 [30], both runs being com-
bined in LOGCOMBINER 1.7.1 [35] and the maximum
clade credibility tree calculated by TREEANNOTATOR
1.7.1 [35], following the removal of 10% burn-in.
Biogeographical analysis
Ancestral habitat types were inferred by the Bayesian
analysis of discrete traits [45]. It models discrete states
of a trait at the end of each branch as a result of a con-
tinuous time Markov chain with infinitesimal transition
rates determined by an overall transition rate, pair-wise
transition probabilities and a base frequency of the states.
Following the current implementation in BEAST 1.8.0 we
used strict clock time-irreversible model so the overall
transition rate was assumed uniform across the tree
and transition probabilities were allowed to differ in the
opposite directions. Using the distribution data, we
coded the 27 MOTUs as inhabiting either (i) tropical
forests in the Congo Basin, Central and Western Africa;
(ii) mountains in Eastern Africa (various habitats), or
(iii) savannah habitats in sub-Saharan Africa. Some
MOTUs can inhabit more habitat types (e.g. MOTU
27, M. minutoides). The analysis in BEAST does not
allow more variants of the tip trait, so we assigned the
trait (habitat) that is the most widespread in a particular
MOTU (e.g. savannah in M. minutoides). The topology
was fixed to match relationships between MOTUs on the
ML tree and branch lengths were time-calibrated as in the
ultrametric tree for GMYC.
Alternatively, we identified ancestral habitat types and
rough geographic ranges by using the maximum likeli-
hood approach implemented in the software Lagrange
[46,47]. The implemented model estimates geographic
range evolution using a phylogenetic tree with branch
lengths scaled to time, geographic (habitat) areas for all
tips, and an adjacency matrix of plausibly connected
areas. We used the same tree and distribution data as in
the BEAST analysis described above. We allowed the
connection between all three habitats with equal prob-
abilities of each transition. The maximum number of
Bryja et al. BMC Evolutionary Biology (2014) 14:256 Page 5 of 20

66
Tatiana Aghová / Ph.D. dissertation (2018)
ancestral ranges was set to two. The resulting recon-
structions returned all models within two likelihood
units of the best model, which we summarized for each
daughter branch and plotted in the form of pie-charts
along the tree in R [48].
Results
Overview of collected data
For the phylogenetic analysis we retained 179 CYTB
sequences at least 700 bp (133 new sequences and 46
sequences from GenBank) representing as complete a
geographical distribution of each clade as possible
(Additional file 1). The remaining 478 sequences (usually
shorter and/or from the same or close neighbouring
localities), including 16 sequences obtained by 454 pyrose-
quencing of old museum samples, were unambiguously
assigned to particular MOTU by neighbour-joining ana-
lysis in MEGA 5.05 (bootstrap values higher than 95%)
and these data were used for mapping the geographical
distribution of phylogenetic clades.
We also selected 1–2 individuals from each of the main
significantly supported CYTB clades (if the tissues were
available) and sequenced them at IRBP gene. The final
phylogenetic analyses included 42 sequences of IRBP
(32 new sequences and 10 sequences from GenBank;
see Additional file 1) from all main species groups
except the baoulei group (see below). ML analyses were
performed separately for both genes, and because the
topology of trees was very similar (although the reso-
lution of IRBP was much lower; Additional file 3), we
finally performed both ML and BI reconstructions only
using a concatenated CYTB and IRBP dataset produced
in SEAVIEW [49].
Phylogeny of African Nannomys
Phylogenetic trees based on the concatenated dataset
were well resolved and with very similar topology of 179
ingroup sequences in both ML and BI analyses (Figure 2).
Subgenus Nannomys (including “Muriculus” imberbis; see
[8]) was strongly supported. There are three long branches
representing three ancient mountainous species with
unresolved relationships to other groups (M. sp.
“Nyika” =MOTU 1, M. imberbis =MOTU 2, and M. sp.
“Harenna” =MOTU 3) and five well supported species
groups. We call them hereafter triton, setulosus, baoulei,
sorella, and minutoides groups, based on the previous use
of these names, representing the best known species
within particular clades. Each group contains several
distinct lineages that may represent separate species; the
most diversified is the minutoides group. The relation-
ships among species groups are not well resolved, but
in most topologies the triton group is non-significantly
clustered with three ancient species, while all other
species groups cluster together. Within the latter, the
setulosus group separates the first, and the baoulei
group is the sister of the sorella group (Figure 2).
Number of potential species and their distribution
The application of the GMYC model provided the de-
limitation of 49 maximum likelihood entities (hereafter
GMYC-species; 95% CI = 42–62 entities) based on the
ML estimate of speciation-coalescence threshold at 0.46
(0.27–0.86) Mya. Figure 3a depicts support for the “in-
traspecific” basal splits as coalescences as well as support
for “interspecific” splits as speciation events. In both
cases white circles indicate support < 0.95 and black cir-
cles > 0.95. Low “intraspecific” support suggests there
may be more species present, whereas low “interspecific”
support suggests the two sister clades may be in fact
conspecific populations. Where two neighbouring “inter-
specific” and “intraspecific” supports are low, the
speciation-coalescence transition is blurred.
K2P distances among the GMYC-species (3.16-20.77%)
were not overlapping with “intraspecific” distances (0.12-
2,38%) (Additional file 4). The detailed analysis of
geographical distribution of GMYC-species showed that
many sister groups among them are parapatric, i.e. most
probably representing the results of allopatric differenti-
ation and secondary contacts. For example, in the clade
corresponding to M. minutoides in previous studies (e.g.
[9]), the GMYC method delimited 12 GMYC-species with
prevailing parapatric distribution pattern and with “inter-
specific” K2P distances 3.27-6.96%. Using the threshold
value of 7.3%, we grouped these lineages and considered
them as phylogeographical differentiation within the single
species M. minutoides (see Figure 1f for the distribution of
phylogeographical lineages that roughly correspond to
“species” identified by GMYC method). Using this com-
bined approach (i.e. analysis of geographic distribution
of GMYC-species and threshold of K2P distances), we
reduced 49 GMYC-species to 27 highly supported molecu-
lar operational taxonomic units (MOTUs, Figure 3a), which
are further discussed below. Genetic distances among 27
MOTUs were always significantly higher and did not over-
lap with those within MOTUs (Additional file 4).
There were 17 MOTUs that exactly matched a single
GMYC-species, 11 of them represented by more than
one sequence. 7 MOTUs comprised two GMYC-species,
2 MOTUs were composed of three GMYC-species and a
single MOTU, MOTU 27 =M. minutoides, comprised
12 GMYC-species (Figure 3a). In 12 cases, however,
there was strong support for the presence of multiple
species within a single MOTU (marked by black circles
left of the GMYC threshold in Figure 3a).
Below we follow the nomenclature of [10] that recognizes
18 valid species. Possible names for newly recognized
MOTUs are discussed in the text.
Bryja et al. BMC Evolutionary Biology (2014) 14:256 Page 6 of 20

67
Tatiana Aghová / Ph.D. dissertation (2018)
supported by both ML (>75) and BI (>0.95) analyses
supported by only one analysis
MOTU 3 („Harenna“)MOTU 2 (imberbis)MOTU 1 („Nyika“)outgroups
MOTU 6 (cf. callewaerti)
MOTU 5 („Kikwit“)
MOTU 4 (triton)
MOTU 16 (sorella)MOTU 15 („Koi River“)
MOTU 17 (neavei)
MOTU 14 („Dakawa“)MOTU 13 (cf. baoulei„West“)
MOTU 12 (baoulei)
MOTU 11 (mahomet)
MOTU 10 (bufo)
MOTU 9 (cf. setulosus„West“)
MOTU 8 (setulosus)
MOTU 7 (cf. proconodon)
MOTU 27 (minutoides)
MOTU 26 (musculoides)
MOTU 22 (indutus)
MOTU 21 (cf. kasaicus)
MOTU 20 (mattheyi)
MOTU 19 (haussa)MOTU 18 („Zakouma“)
MOTU 25 (cf. tenellus)
MOTU 24 (cf. gerbillus)
MOTU 23 (cf. gratus)
min
uto
ides g
roup
baoulei
group
sorella
group
setulosus
group
triton
group
Figure 2 (See legend on next page.)
Bryja et al. BMC Evolutionary Biology (2014) 14:256 Page 7 of 20
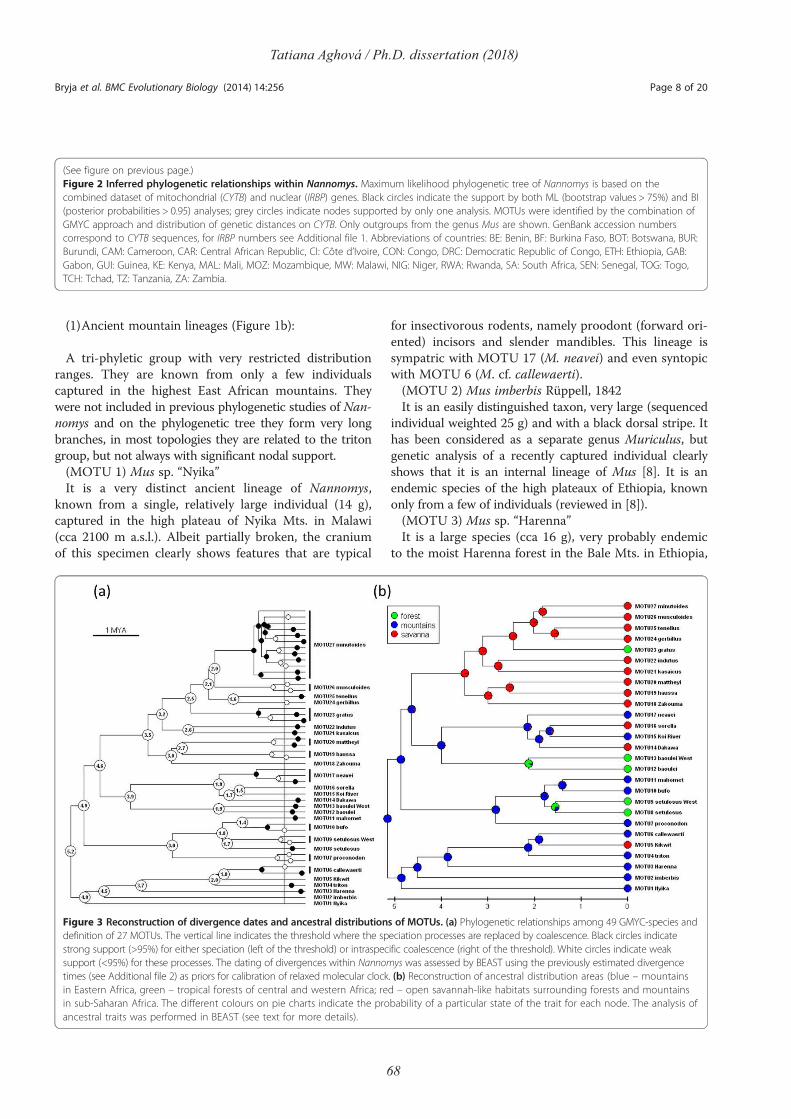
68
Tatiana Aghová / Ph.D. dissertation (2018)
(1)Ancient mountain lineages (Figure 1b):
A tri-phyletic group with very restricted distribution
ranges. They are known from only a few individuals
captured in the highest East African mountains. They
were not included in previous phylogenetic studies of Nan-
nomys and on the phylogenetic tree they form very long
branches, in most topologies they are related to the triton
group, but not always with significant nodal support.
(MOTU 1) Mus sp. “Nyika”
It is a very distinct ancient lineage of Nannomys,
known from a single, relatively large individual (14 g),
captured in the high plateau of Nyika Mts. in Malawi
(cca 2100 m a.s.l.). Albeit partially broken, the cranium
of this specimen clearly shows features that are typical
for insectivorous rodents, namely proodont (forward ori-
ented) incisors and slender mandibles. This lineage is
sympatric with MOTU 17 (M. neavei) and even syntopic
with MOTU 6 (M. cf. callewaerti).
(MOTU 2) Mus imberbis Rüppell, 1842
It is an easily distinguished taxon, very large (sequenced
individual weighted 25 g) and with a black dorsal stripe. It
has been considered as a separate genus Muriculus, but
genetic analysis of a recently captured individual clearly
shows that it is an internal lineage of Mus [8]. It is an
endemic species of the high plateaux of Ethiopia, known
only from a few of individuals (reviewed in [8]).
(MOTU 3) Mus sp. “Harenna”
It is a large species (cca 16 g), very probably endemic
to the moist Harenna forest in the Bale Mts. in Ethiopia,
Figure 3 Reconstruction of divergence dates and ancestral distributions of MOTUs. (a) Phylogenetic relationships among 49 GMYC-species and
definition of 27 MOTUs. The vertical line indicates the threshold where the speciation processes are replaced by coalescence. Black circles indicate
strong support (>95%) for either speciation (left of the threshold) or intraspecific coalescence (right of the threshold). White circles indicate weak
support (<95%) for these processes. The dating of divergences within Nannomys was assessed by BEAST using the previously estimated divergence
times (see Additional file 2) as priors for calibration of relaxed molecular clock. (b) Reconstruction of ancestral distribution areas (blue – mountains
in Eastern Africa, green – tropical forests of central and western Africa; red – open savannah-like habitats surrounding forests and mountains
in sub-Saharan Africa. The different colours on pie charts indicate the probability of a particular state of the trait for each node. The analysis of
ancestral traits was performed in BEAST (see text for more details).
(See figure on previous page.)
Figure 2 Inferred phylogenetic relationships within Nannomys. Maximum likelihood phylogenetic tree of Nannomys is based on the
combined dataset of mitochondrial (CYTB) and nuclear (IRBP) genes. Black circles indicate the support by both ML (bootstrap values > 75%) and BI
(posterior probabilities > 0.95) analyses; grey circles indicate nodes supported by only one analysis. MOTUs were identified by the combination of
GMYC approach and distribution of genetic distances on CYTB. Only outgroups from the genus Mus are shown. GenBank accession numbers
correspond to CYTB sequences, for IRBP numbers see Additional file 1. Abbreviations of countries: BE: Benin, BF: Burkina Faso, BOT: Botswana, BUR:
Burundi, CAM: Cameroon, CAR: Central African Republic, CI: Côte d’Ivoire, CON: Congo, DRC: Democratic Republic of Congo, ETH: Ethiopia, GAB:
Gabon, GUI: Guinea, KE: Kenya, MAL: Mali, MOZ: Mozambique, MW: Malawi, NIG: Niger, RWA: Rwanda, SA: South Africa, SEN: Senegal, TOG: Togo,
TCH: Tchad, TZ: Tanzania, ZA: Zambia.
Bryja et al. BMC Evolutionary Biology (2014) 14:256 Page 8 of 20

69
Tatiana Aghová / Ph.D. dissertation (2018)
a region with very pronounced endemicity [50,51]. Based
on morphometry this taxon was previously reported as
M. triton [50] and in most topologies it is also the sister
taxon to the triton group. Genetically it is a very distinct
lineage (13.5-14.4% K2P distance to taxa of the triton
group) with a remarkably different karyotype than M.
triton [52]. Earlier studies have already suggested that
this taxon represents a valid species [51]. It can be sym-
patric with M. mahomet, but differs in habitat preferences;
M. sp. “Harenna” lives mostly in the forests, while M.
mahomet inhabits more open grassy habitats [[53]; L.
Lavrenchenko, pers. obs.].
(2)The triton group (Figure 1b):
It is the group of MOTUs of relatively large body size,
distributed mostly south of the equator (largely parapa-
tric with the setulosus group - see Figure 1b vs. 1c).
Genetic data suggest important cryptic variability (K2P
distance among three MOTUs = 8.80-11.05%). Only
nominotypical MOTU has a clear valid name, remaining
lineages require further taxonomic studies.
(MOTU 4) Mus triton (Thomas, 1909)
This species was described from Mt. Elgon in Kenya
and we provide the sequence from the type locality. It is
distributed in the Kenyan highlands and northern part
of Albertine rift. The same species probably occurs in
southern Sudan also (described as M. imatongensis) [54]),
but this should be confirmed by barcoding Sudanese
specimens.
(MOTU 5) Mus sp. “Kikwit”
This distinct genetic lineage within the triton group
was detected in two localities in south-western Demo-
cratic Republic of Congo (DRC). It may represent a new
species, but more material and analyses are necessary to
substantiate this claim. This MOTU supports important
biogeographical distinctiveness of the Kikwit region in
DRC (see also MOTU 21 from the minutoides group).
The type locality of Mus callewaerti (Thomas, 1925)
(Kananga, Kasaï occidental, DRC) is relatively near, so it
is possible that they are conspecific, but a comparison
with the type material will be necessary before a final
conclusion can be reached (see also MOTU 6).
(MOTU 6) Mus cf. callewaerti
This taxon forms a well-supported separate lineage
within the triton group. Its distribution range comprises
a fairly important area situated between the Tanzanian
Eastern Arc Mountains, through Southern Rift Moun-
tains and northern Zambia till the Angolan highlands. In
miombo woodlands of north-western Tanzania, it may
have overlapping distribution ranges with M. triton, but
no locality with sympatric occurrence was found in our
study. The Angolan specimens were recently reported
as M. callewaerti (Thomas, 1925) [14]. It is therefore
possible that the whole clade should belong to M. calle-
waerti, but a comparison with type material will be neces-
sary. The taxon prefers the miombo woodland or
montane forest edges. There is important genetic variabil-
ity within this taxon, with animals from Eastern Arc
Mountains forming a distinct clade supported as a separ-
ate GMYC-species (Figure 3a).
(3)The setulosus group (Figure 1c):
We recognized five MOTUs within this highly supported
monophyletic lineage. It includes relatively large-bodied
species, with distribution ranges mostly north of the equa-
tor, i.e. largely parapatric with the triton group. Two of
these MOTUs were only recorded in Ethiopia.
(MOTU 7) Mus cf. proconodon
It represents a lineage probably endemic to Ethiopia,
where it mainly occurs in lowlands of the Rift Valley.
We suggest assigning this MOTU to the species M.
proconodon Rhoads, 1896, i.e. the Ethiopian taxon that
was synonymised with M. setulosus [10] even if genetic-
ally it represents the most distinct lineage of the whole
setulosus group.
(MOTU 8) Mus setulosus Peters, 1876
This highly supported MOTU from western-central
Africa (north-west of the Congo River) represents the
true M. setulosus (type locality is Victoria, Cameroon).
The western border of its distribution likely lies in the
dry region of the Dahomey gap. In the north-east (i.e.
southern Central African Republic (CAR)), it is probably
in contact with M. bufo (MOTU 10), and it is worthy of
further study to analyse the possible contact zone and
reproductive barriers between these two taxa in CAR.
(MOTU 9) Mus cf. setulosus “West”
MOTUs 8–11 form a monophyletic group of four
strongly supported lineages with roughly parapatric dis-
tribution (Figure 1c). Two of them (MOTUs 8 and 9) have
been previously named M. setulosus (e.g. [9]). MOTU 8 is
distributed in central African forests, while MOTU 9 in
western Africa (west of the Dahomey gap). MOTUs 10
and 11 represent valid species M. bufo (Thomas, 1906)
and M. mahomet Rhoads, 1896, respectively. The topology
and genetic distances (K2P distance = 8.1%) suggest that
MOTUs 8 and 9 should be given different names. Because
M. setulosus was described from Cameroon (i.e. distribu-
tion area of MOTU 8), we suggest that the West African
populations of M. cf. setulosus, i.e. MOTU 9, may repre-
sent a separate new species, but this claim needs to be
substantiated by further taxonomic work.
(MOTU 10) Mus bufo (Thomas, 1906)
The species was described from Ruwenzori Mts. in
Uganda and it was considered endemic to the Albertine
Rift. There are few sequences identified as M. bufo in Gen-
Bank. The first (Acc. no. DQ789905) from Bujumbura in
Bryja et al. BMC Evolutionary Biology (2014) 14:256 Page 9 of 20
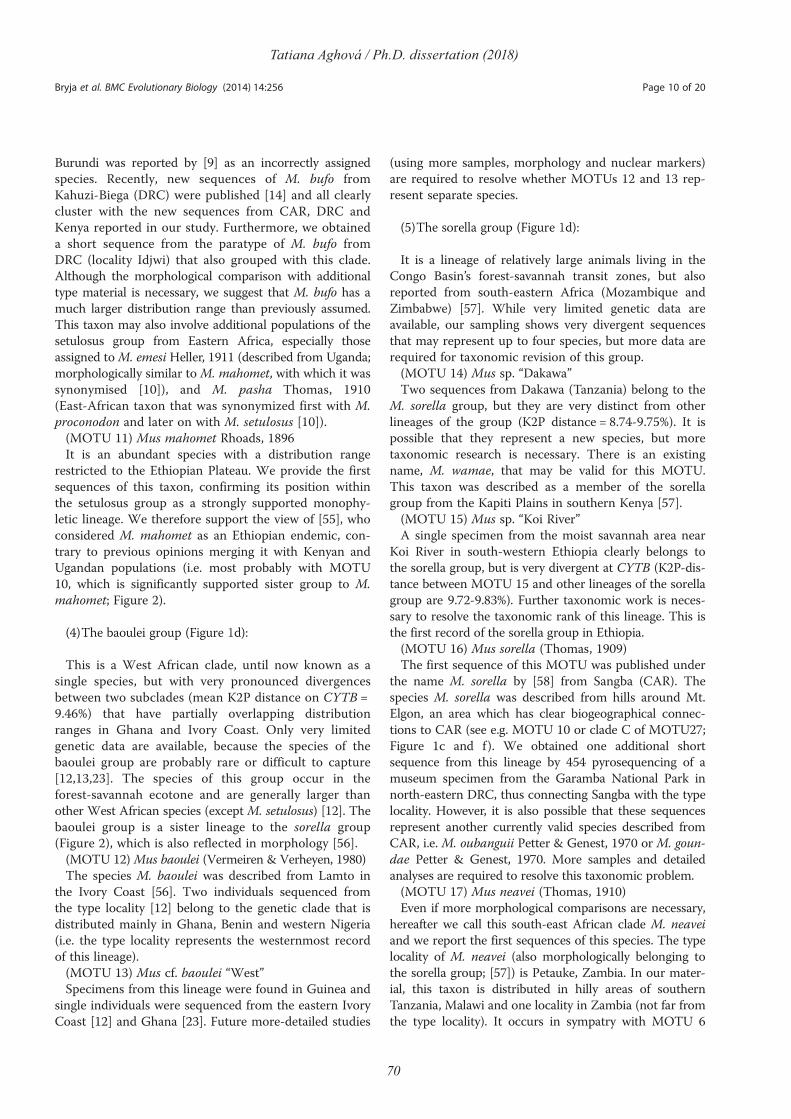
70
Tatiana Aghová / Ph.D. dissertation (2018)
Burundi was reported by [9] as an incorrectly assigned
species. Recently, new sequences of M. bufo from
Kahuzi-Biega (DRC) were published [14] and all clearly
cluster with the new sequences from CAR, DRC and
Kenya reported in our study. Furthermore, we obtained
a short sequence from the paratype of M. bufo from
DRC (locality Idjwi) that also grouped with this clade.
Although the morphological comparison with additional
type material is necessary, we suggest that M. bufo has a
much larger distribution range than previously assumed.
This taxon may also involve additional populations of the
setulosus group from Eastern Africa, especially those
assigned toM. emesi Heller, 1911 (described from Uganda;
morphologically similar to M. mahomet, with which it was
synonymised [10]), and M. pasha Thomas, 1910
(East-African taxon that was synonymized first with M.
proconodon and later on with M. setulosus [10]).
(MOTU 11) Mus mahomet Rhoads, 1896
It is an abundant species with a distribution range
restricted to the Ethiopian Plateau. We provide the first
sequences of this taxon, confirming its position within
the setulosus group as a strongly supported monophy-
letic lineage. We therefore support the view of [55], who
considered M. mahomet as an Ethiopian endemic, con-
trary to previous opinions merging it with Kenyan and
Ugandan populations (i.e. most probably with MOTU
10, which is significantly supported sister group to M.
mahomet; Figure 2).
(4)The baoulei group (Figure 1d):
This is a West African clade, until now known as a
single species, but with very pronounced divergences
between two subclades (mean K2P distance on CYTB =
9.46%) that have partially overlapping distribution
ranges in Ghana and Ivory Coast. Only very limited
genetic data are available, because the species of the
baoulei group are probably rare or difficult to capture
[12,13,23]. The species of this group occur in the
forest-savannah ecotone and are generally larger than
other West African species (except M. setulosus) [12]. The
baoulei group is a sister lineage to the sorella group
(Figure 2), which is also reflected in morphology [56].
(MOTU 12) Mus baoulei (Vermeiren & Verheyen, 1980)
The species M. baoulei was described from Lamto in
the Ivory Coast [56]. Two individuals sequenced from
the type locality [12] belong to the genetic clade that is
distributed mainly in Ghana, Benin and western Nigeria
(i.e. the type locality represents the westernmost record
of this lineage).
(MOTU 13) Mus cf. baoulei “West”
Specimens from this lineage were found in Guinea and
single individuals were sequenced from the eastern Ivory
Coast [12] and Ghana [23]. Future more-detailed studies
(using more samples, morphology and nuclear markers)
are required to resolve whether MOTUs 12 and 13 rep-
resent separate species.
(5)The sorella group (Figure 1d):
It is a lineage of relatively large animals living in the
Congo Basin’s forest-savannah transit zones, but also
reported from south-eastern Africa (Mozambique and
Zimbabwe) [57]. While very limited genetic data are
available, our sampling shows very divergent sequences
that may represent up to four species, but more data are
required for taxonomic revision of this group.
(MOTU 14) Mus sp. “Dakawa”
Two sequences from Dakawa (Tanzania) belong to the
M. sorella group, but they are very distinct from other
lineages of the group (K2P distance = 8.74-9.75%). It is
possible that they represent a new species, but more
taxonomic research is necessary. There is an existing
name, M. wamae, that may be valid for this MOTU.
This taxon was described as a member of the sorella
group from the Kapiti Plains in southern Kenya [57].
(MOTU 15) Mus sp. “Koi River”
A single specimen from the moist savannah area near
Koi River in south-western Ethiopia clearly belongs to
the sorella group, but is very divergent at CYTB (K2P-dis-
tance between MOTU 15 and other lineages of the sorella
group are 9.72-9.83%). Further taxonomic work is neces-
sary to resolve the taxonomic rank of this lineage. This is
the first record of the sorella group in Ethiopia.
(MOTU 16) Mus sorella (Thomas, 1909)
The first sequence of this MOTU was published under
the name M. sorella by [58] from Sangba (CAR). The
species M. sorella was described from hills around Mt.
Elgon, an area which has clear biogeographical connec-
tions to CAR (see e.g. MOTU 10 or clade C of MOTU27;
Figure 1c and f). We obtained one additional short
sequence from this lineage by 454 pyrosequencing of a
museum specimen from the Garamba National Park in
north-eastern DRC, thus connecting Sangba with the type
locality. However, it is also possible that these sequences
represent another currently valid species described from
CAR, i.e. M. oubanguii Petter & Genest, 1970 or M. goun-
dae Petter & Genest, 1970. More samples and detailed
analyses are required to resolve this taxonomic problem.
(MOTU 17) Mus neavei (Thomas, 1910)
Even if more morphological comparisons are necessary,
hereafter we call this south-east African clade M. neavei
and we report the first sequences of this species. The type
locality of M. neavei (also morphologically belonging to
the sorella group; [57]) is Petauke, Zambia. In our mater-
ial, this taxon is distributed in hilly areas of southern
Tanzania, Malawi and one locality in Zambia (not far from
the type locality). It occurs in sympatry with MOTU 6
Bryja et al. BMC Evolutionary Biology (2014) 14:256 Page 10 of 20
71
Tatiana Aghová / Ph.D. dissertation (2018)
from the triton group [57] and in the Nyika Mountains
in Malawi also with MOTU 1. The records from South
African Republic (SAR) are not yet confirmed genetically;
the specimen mentioned by [14] was finally identified as
M. minutoides and no other sequences of M. neavei were
obtained despite intensive recent sampling efforts in SAR
(F. Veyrunes, pers. comm.)
(6)The minutoides group (Figures 1e-f ):
This is the most diversified group within Nannomys,
inhabiting various, mostly open habitats of sub-Saharan
Africa. It harbours the real “pygmy” mice, i.e. the rodents
with the smallest body size (some of them with body
mass < 5 g). Most previous published genetic studies of
Nannomys mainly targeted representatives of this group.
Our phylogenetic analysis reveals three clear subgroups:
subgroup 1 (MOTUs 18 to 20), subgroup 2 (MOTUs 21
and 22), and subgroup 3 (MOTUs 23 to 27).
(MOTU 18) Mus sp. “Zakouma”
A single specimen of this taxon was captured in the
Zakouma National Park in south-eastern Chad [11]. It
is genetically very distinct from its sister species, M.
mattheyi F. Petter, 1969 and M. haussa (Thomas &
Hinton, 1920), and further taxonomic work on more
material from southern Chad may confirm it as a new
distinct species. Together with M. mattheyi and M.
haussa, this species forms a monophyletic group that
diverged in West African savannahs.
(MOTU 19) Mus haussa (Thomas & Hinton, 1920)
It is a Sahelian taxon, recorded in the belt from Senegal
to western Chad [9]. Similarly as in M. mattheyi and other
West African savannah species of rodents [59-61], there
is also indication of longitudinal genetic structure in M.
haussa, but more detailed data are needed for more
conclusive phylogeographical inferences.
(MOTU 20) Mus mattheyi F. Petter, 1969
M. mattheyi is typical species of Guinean savannah-forest
mosaic from westernmost Africa (Senegal) to the Dahomey
gap, the relatively dry region separating Guinean and
Congolese forest blocks [9]. It is divided into western
and eastern phylogeographic subclades with a presum-
able contact zone in the Ivory Coast (not shown). It is
often the most abundant Nannomys in the rodent
assemblages [13,23].
(MOTU 21) Mus cf. kasaicus
Two sequenced individuals from the Kikwit region
(DRC) formed this genetically very distinct genetic MOTU.
There are also indications from other rodent groups that
the Kikwit area is a local centre of endemism (see e.g.
MOTU 5 or [62]). There is an existing name, M. kasaicus
(Cabrera, 1924), described from Kasaï Occidental Province,
Kananga, DRC, for the taxon belonging morphologically to
M. minutoides group [10], that may apply to this MOTU.
(MOTU 22) Mus indutus (Thomas, 1910)
M. indutus is a south African species, found in a rela-
tively large area from northern Botswana to southern
SAR [11,14,63,64]. Records from Zambia and Malawi are
based on genotyping of old museum material [64] and
should be taken with caution. It is probably sympatric
with M. minutoides Smith, 1834 (= MOTU 27) in most
of its distribution range.
(MOTU 23) Mus cf. gratus
Specimens from this taxon were typically captured in
forest clearings and the ecotone between forest and open
habitats in equatorial Africa. There are three distinct
clades with clear west–east geographical structure: (i) a
single specimen from lowland tropical forest in Congo
(K2P distance to two remaining clades is cca 7%); (ii) the
Kisangani region in DRC; and (iii) both montane and
lowland tropical forests in southern Kenya and northern
Tanzania. More taxonomic work is necessary to link this
clade to an existing species; possibly M. gratus (Thomas &
Wroughton, 1910), a taxon from the minutoides group
described from eastern Ruwenzori, “upper Congo” and
Virunga mountains. Again, the comparison with the types
will be required to verify this hypothesis.
(MOTU 24) Mus cf. gerbillus
This taxon is distributed in dry Somali-Maasai savannah
in Kenya and Tanzania. In all phylogenetic analyses, it
is a sister clade to the Ethiopian MOTU 25 (mean K2P
distance between these two clades is 8.87%). Further
taxonomic work is necessary, but M. gerbillus (G.M. Allen
& Loveridge, 1933) (currently the synonym for Tanzanian
populations of M. tenellus) is an available name that may
apply to this lineage.
(MOTU 25) Mus cf. tenellus
This lineage was found at two close localities in northern
Ethiopia - in Hagere Selam and in the Mekelle University
campus. It may represent true M. tenellus (Thomas, 1903)
described from Blue Nile in Sudan, but the comparison
with the type material is necessary. On the contrary, mor-
phological studies of museum material suggested that most
published Ethiopian records of M. tenellus were actually
M. minutoides [10].
(MOTU 26) Mus musculoides Temminck, 1853
It is a typical species of the Sudanian savannah belt. It
was previously reported from western Africa [11,12,17]
and northern Cameroon [65]. We provide a new very
distant record from western Ethiopia, representing the
easternmost genetically confirmed locality of the species.
Very probably it is also present in poorly sampled coun-
tries such as Chad, northern CAR and South Sudan.
(MOTU 27) Mus minutoides Smith, 1834
M. minutoides is a widely distributed species in most
of sub-Saharan Africa (probably except continuously for-
ested areas in the Congo Basin and deserts; Figure 1f ).
This MOTU also includes specimens from southern
Bryja et al. BMC Evolutionary Biology (2014) 14:256 Page 11 of 20
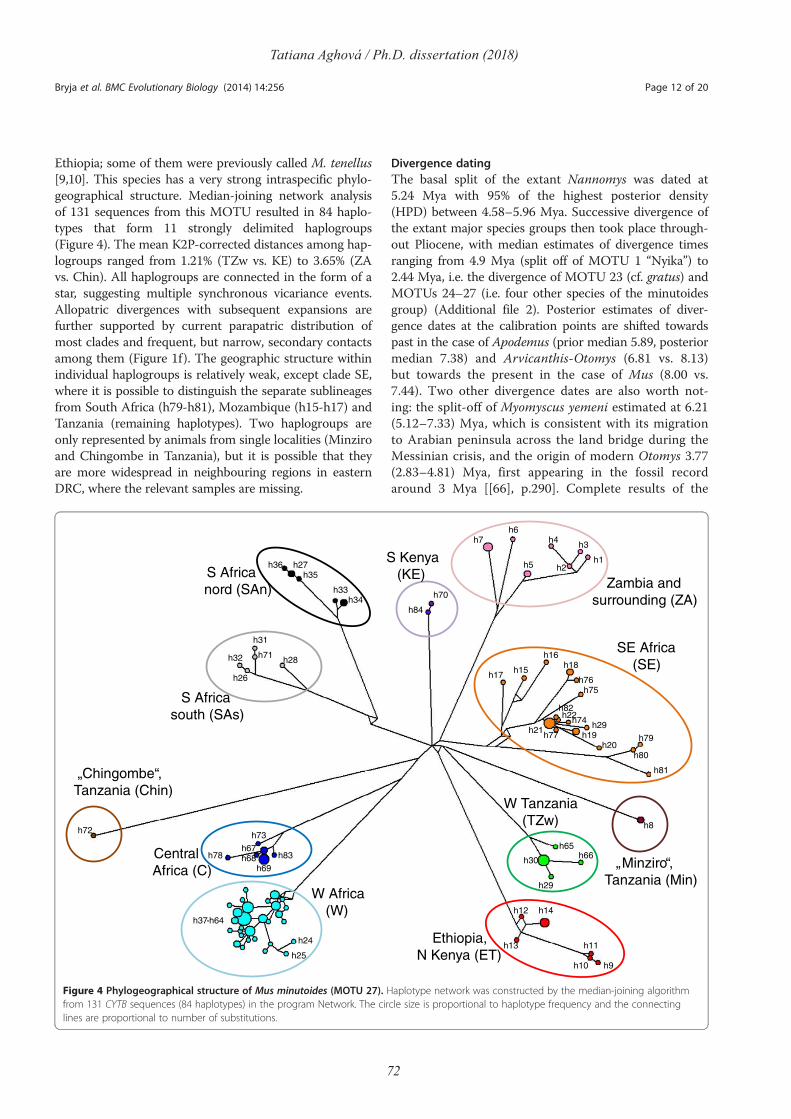
72
Tatiana Aghová / Ph.D. dissertation (2018)
Ethiopia; some of them were previously called M. tenellus
[9,10]. This species has a very strong intraspecific phylo-
geographical structure. Median-joining network analysis
of 131 sequences from this MOTU resulted in 84 haplo-
types that form 11 strongly delimited haplogroups
(Figure 4). The mean K2P-corrected distances among hap-
logroups ranged from 1.21% (TZw vs. KE) to 3.65% (ZA
vs. Chin). All haplogroups are connected in the form of a
star, suggesting multiple synchronous vicariance events.
Allopatric divergences with subsequent expansions are
further supported by current parapatric distribution of
most clades and frequent, but narrow, secondary contacts
among them (Figure 1f). The geographic structure within
individual haplogroups is relatively weak, except clade SE,
where it is possible to distinguish the separate sublineages
from South Africa (h79-h81), Mozambique (h15-h17) and
Tanzania (remaining haplotypes). Two haplogroups are
only represented by animals from single localities (Minziro
and Chingombe in Tanzania), but it is possible that they
are more widespread in neighbouring regions in eastern
DRC, where the relevant samples are missing.
Divergence dating
The basal split of the extant Nannomys was dated at
5.24 Mya with 95% of the highest posterior density
(HPD) between 4.58–5.96 Mya. Successive divergence of
the extant major species groups then took place through-
out Pliocene, with median estimates of divergence times
ranging from 4.9 Mya (split off of MOTU 1 “Nyika”) to
2.44 Mya, i.e. the divergence of MOTU 23 (cf. gratus) and
MOTUs 24–27 (i.e. four other species of the minutoides
group) (Additional file 2). Posterior estimates of diver-
gence dates at the calibration points are shifted towards
past in the case of Apodemus (prior median 5.89, posterior
median 7.38) and Arvicanthis-Otomys (6.81 vs. 8.13)
but towards the present in the case of Mus (8.00 vs.
7.44). Two other divergence dates are also worth not-
ing: the split-off of Myomyscus yemeni estimated at 6.21
(5.12–7.33) Mya, which is consistent with its migration
to Arabian peninsula across the land bridge during the
Messinian crisis, and the origin of modern Otomys 3.77
(2.83–4.81) Mya, first appearing in the fossil record
around 3 Mya [[66], p.290]. Complete results of the
h36h35
h33h34
h31
h28h71h32
h7
h26
h27
h84
h70
h5
h6h4
h2
h3
h1
h15h17
h16h18
h76h75
h21h77
h22h82
h74h29
h19h20
h79
h80
h81
h8
h25
h24
h37-h64
h78
h69
h67h68
h73h72
h83
h9
h65
h10
h11h13
h14h12
h66
h29
h30
S Africa
nord (SAn)
S Africa
south (SAs)
S Kenya
(KE)Zambia and
surrounding (ZA)
SE Africa
(SE)
„Chingombe“,
Tanzania (Chin)
Ethiopia,
N Kenya (ET)
Central
Africa (C)
W Africa
(W)
W Tanzania
(TZw)
„Minziro“,
Tanzania (Min)
Figure 4 Phylogeographical structure of Mus minutoides (MOTU 27). Haplotype network was constructed by the median-joining algorithm
from 131 CYTB sequences (84 haplotypes) in the program Network. The circle size is proportional to haplotype frequency and the connecting
lines are proportional to number of substitutions.
Bryja et al. BMC Evolutionary Biology (2014) 14:256 Page 12 of 20

73
Tatiana Aghová / Ph.D. dissertation (2018)
divergence dating analysis are reported in Additional
file 2.
The full set of branching times between 27 MOTUs is
given in Figure 3a. It is based on the secondary dating of
the ultrametric tree for GMYC, but the posterior esti-
mates of divergence dates are consistent with previous
analysis (compare Figure 3a and Additional file 2). Main
species lineages diverged in lower Pliocene (5.2-4.5 Mya)
and an intensive period of speciation is also visible in
the lower Pleistocene (2.1-1.6 Mya), when many extant
lineages within main species groups appeared.
Biogeographical analysis
Bayesian analysis of discrete traits in BEAST revealed that
the most ancestral distribution (98% support) of Nan-
nomys included mountains of Eastern Africa (Figure 3b).
This type of distribution is currently present in all three
ancient monotypic lineages (MOTUs 1–3), as well as in
numerous lineages of the triton and setulosus groups.
There are two major habitat shifts in the Nannomys
evolution. (1) The lineage leading to the baoulei group
colonized the forests (and forest-savannah mosaic) in
western Africa cca 4 Mya, where it split to western and
eastern sublineages later on; (2) the minutoides group
descended from mountains, adapted to more arid open
habitats, and started to radiate across the whole sub-
Saharan Africa cca 3.5 Mya. In the first radiation phase,
MOTUs 18–27 speciated in savannah-like habitats over
all of Africa (approx. 3.5-1.6 Mya). Geographically similar,
but much more recent (cca 1 Mya) radiation occurred
inside MOTU 27, i.e. M. minutoides (Figures 1f, 3a, and 4).
Very similar results were obtained by the maximum
likelihood approach in Lagrange (Additional file 5). Most
basal splits occurred with the highest probability in the
mountains of East Africa, also where most of the MOTUs
from the triton group diverged. The first clear shifts to
other habitats are visible in the ancestors of the baoulei
group (to the forests or forest edges, where both MOTUs
from this group occur until today) and in the ancestors
of the minutoides group (to the savannah). The most
intensive radiation in the latter took place in savannahs,
with one shift to the forest habitat detected in MOTU
23 (M. cf. gratus). The estimates of ancestral ranges are
less clear in the setulosus and the sorella groups. While
the former started to diverge most probably in mountains
(with subsequent spreading of two “setulosus” MOTUs to
forests of central and eastern Africa), the latter had ances-
tors occurring with similar support either in savannahs or
in hills of Eastern Africa.
Discussion
For the purpose of our study, we compiled new and
existing sequences into the largest genetic dataset to
date of the subgenus Nannomys and performed the first
phylogenetic analysis of the group that contains most of
the currently recognized valid species across the whole
sub-Saharan Africa. We detected a surprisingly high
amount of cryptic diversity, with numerous candidates for
new species. Wide geographical sampling also allowed
the first empirical definition of the distribution areas of
all the detected lineages based on physically present
genotyped individuals. Using several calibration points
and the current distributional data, we also carried out
biogeographical analysis and reconstructed the possible
evolutionary scenario of this highly successful group of
sub-Saharan murines.
Species concepts and estimation of the number of
Nannomys species
Species diversity crucially depends on the adopted species
concept. Widely used concepts of typological or biological
species are not always applicable for species delimitation
because of frequent convergent evolution, cryptic species,
and the impossibility of proving reproductive isolation
among allopatric populations. Together with the rapidly
increasing amount of genetic data from free-living popula-
tions, these concepts are often complemented by genetic
[37] or phylogenetic [3] species concepts, creating the so-
called integrative taxonomic approach. Although genetic
approaches can sometimes lead to an unjustified increase
in the number of species (so-called taxonomic inflation
[2,67]), they often detect cryptic diversity within evolu-
tionary lineages that can be generally important from
the taxonomic as well as conservation point of view. In
our study, we used the combination of maximum likeli-
hood delimitation of phylogenetic species and the
genetic distances to estimate the number of MOTUs
(= putative species) of Nannomys in Africa. We are
aware of the drawbacks of these approaches (e.g. the
use of only maternally inherited mtDNA), however,
our aim was not to perform the taxonomic changes
based solely on limited genetic data, but rather to
identify the taxa and regions of high cryptic diversity
requiring more detailed taxonomic studies.
The combination of different approaches revealed the
existence of 27 MOTUs. This is considerably more than
the 18 currently accepted Nannomys species [9,10], sug-
gesting that numerous putative species have so far
remained undetected, and therefore undescribed. Most of
the genetic data of Nannomys that have been collected to
date originate from Western and Southern Africa, where
the taxonomy of this group has been intensively explored
(reviewed by [9]). The number of candidates for potential
new species in western Africa revealed by our study is
therefore relatively low (only M. cf. setulosus “West” or M.
cf. baoulei “West”) and it is also possible that these
MOTUs just represent marked phylogeographical struc-
ture of within-species lineages with parapatric distribution
Bryja et al. BMC Evolutionary Biology (2014) 14:256 Page 13 of 20
74
Tatiana Aghová / Ph.D. dissertation (2018)
(but see [12] that already suggested M. setulosus as a
species complex).
The situation is completely different in Eastern Africa,
from where only fragmentary genetic data were available
prior to this study. Our results may lead to the description
of more than 10 new species that are already now
sufficiently delimited using the combination of genetic,
ecological and geographic data. Many of these so far
undescribed taxa occur in mountains or highland habitats,
but a few other potential new species (like M. cf. gerbillus)
are typical inhabitants of dry savannahs. The taxonomic
diversity of Nannomys is probably the highest in Ethiopia.
As for many other organisms, the Ethiopian highlands
represent an important hot-spot of African endemism for
Mus. We have revealed the presence of 8 MOTUs in this
country, and only two of them (M. minutoides and M.
musculoides) have also been recorded outside Ethiopia.
The six remaining species are probably endemic, mak-
ing Mus the genus with the second highest number of
Ethiopian mammal endemics (after Lophuromys with 9
endemic species; [68]).
Even if we have not sequenced the type material of
most currently valid taxa (except paratypes of M. bufo),
we have been able to assign the most probable species
names to 13–14 MOTUs based on previous genetic
studies (including karyotypes; [11,12]), geographical dis-
tribution (i.e. sequences from the type locality or close
neighbourhood) and external morphology. Therefore,
the genetic dataset from this study represents a solid
basis for future identification of morphologically similar
Nannomys species via DNA barcoding (using e.g. evolu-
tionary placement algorithm; [69]). Unfortunately, our
dataset lacks sequences of four valid species. M. oubanguii
Peter & Genest, 1970 and M. goundae Peter & Genest,
1970 represent two species from the sorella group known
only from few localities in the Central African Republic.
They were described mainly on the basis of external
morphology [57] and their specific status has been ques-
tioned previously ([10]; but see conspicuous differences in
karyotypes of these two species - reviewed in [9]). The
whole sorella group requires a profound revision including
new sampling in savannahs north of the Congo Basin and
additional genetic data. We found high genetic variation
within the sorella group, but most clades are represented
by only one or two localities (except M. neavei) and in
most cases it is not possible to assign the particular clades
to currently valid species names. M. setzeri Petter, 1978 is
a rare taxon with limited distribution in dry areas of
Namibia, Botswana and western Zambia [70,71]; it is
probably a valid species as it can be morphologically
distinguished from sympatric Nannomys species [63,72].
M. orangiae Roberts, 1926 is the fourth species that is
currently valid and missing from our dataset. It also is a
southern African species with unclear taxonomical status.
It was previously considered a subspecies of either M.
setzeri or M. minutoides [10] and may just represent one
of the cytotypes of the latter [9].
Phylogenetic estimate of species richness of Nannomys
in our study (25–30 MOTUs that may represent separ-
ate species) suggests that it is one of the most speciose
groups of African terrestrial mammals. Similarly well
studied species-rich genera of African rodents usually
have a lower number of monophyletic genetic lineages
considered as species, e.g. Praomys (16–20 species; [73])
or Hylomyscus (21 species, including undescribed and
recently described taxa; [74], J. Kennis et al., submitted).
The only genus with higher described species richness is
Lophuromys (29 species; [10,68,75]). However, this genus
is specialized to tropical forests and ecotones and it is
likely that intensive genetic drift in fragmented forest
habitats (especially in Eastern Africa) caused morpho-
logical distinctiveness allowing differentiation of a high
number of genetically similar morphospecies [68,75]. It
is also worth to note that in comparison with the above-
mentioned genera, Nannomys colonized a much wider
spectrum of habitats (from Afroalpine meadows and
mountain forests to very arid savannah).
Mus minutoides as a model for pan-African phylogeography
The MOTU with the largest distribution of all Nannomys
is M. minutoides (=MOTU 27). There are only a very few
such widespread savannah-forest mosaic species distrib-
uted across almost complete sub-Saharan Africa. Among
rodents, only the ubiquitous Mastomys natalensis had
held this habitat breadth, and it was considered the rodent
species with the largest distribution area in Africa [10].
Our genetic data confirm that M. minutoides has very
similar and probably even larger distribution than M.
natalensis. It can be argued that MOTU 27 does not rep-
resent a single species but rather a species complex, which
may be supported by the GMYC analysis revealing signifi-
cant support for additional speciation events within this
clade (see Figure 3a). However, in absence of more de-
tailed evidence, we prefer to maintain all genetic lineages
of MOTU 27 within the species M. minutoides. They do
not show visible external differences (although detailed
morphological analysis of genotyped material is still miss-
ing), they radiated relatively recently (last 1 Mya) and the
Tamura-Nei corrected genetic distances among clades
(1.21-3.65% on CYTB) are comparable with those among
clades of M. natalensis (2.1-3.8%; [76]), i.e. much lower
than usual genetic distances between sister species of
rodents [37]. Further detailed studies should focus on the
contact zones of divergent clades to reveal whether they
can interbreed or not.
Species with large distributions and strong affinities to
open habitats can serve as possible models for comparative
pan-African phylogeography of the savannah-like biomes.
Bryja et al. BMC Evolutionary Biology (2014) 14:256 Page 14 of 20
75
Tatiana Aghová / Ph.D. dissertation (2018)
Recent phylogeographic studies of M. natalensis showed
that populations were strongly influenced by Pleistocene
climate fluctuations [76]. The presence of genetically
divergent clades with parapatric distribution is congru-
ent with the scenario invoking allopatric fragmentation
and vicariance. Almost the exact same geographic pattern
of genetic differentiation is visible in M. minutoides (com-
pare Figure 1f in this study with Figure 1 in [76]). The
phylogeographic pattern suggests at least 11 different
savannah refugia approximately 1 Mya, i.e. in the period
of very strong climatic instability [77]). The genetic line-
ages evolved in allopatry and subsequently spread during
suitable periods of savannah expansion. Further research
should focus on precise localization of refugia by combin-
ing information from population genetics with modelling
of past ecological conditions [78]).
A new biogeographical scenario of Nannomys radiation in
Africa - from mountains to lowland forests, savannahs
and arid Sahelian environments
More complete taxon sampling from the whole sub-
Saharan Africa now allows significant modification and
increased precision of the previously proposed biogeo-
graphical scenario of Nannomys radiation in Africa [11].
Our molecular dating based on plausible paleontological
calibration and taxon-unbiased phylogenetic tree suggests
that the divergence of the genus Mus to the current sub-
genera occurred in Asia in the late Miocene (cca 6.8-7.4
Mya), which is in good agreement with previous studies
[7,11,44]. The colonization of Africa by Mus occurred very
probably in the Messinian period (7.3-5.3 Mya) when the
temporary land bridge connected Africa and southwest
Arabia. In this period, many faunal exchanges between
Africa and Asia are well documented [79-81]. It is there-
fore highly probable that Mus was already in Africa at the
beginning of the Pliocene. The basic split of the extant
Nannomys was dated at 5.24 Mya (95% HPD 4.58–5.96
Mya), i.e. very soon after a land bridge between Africa and
Southwest Arabia disappeared (5.3-6 Mya; [82,83]). The
oldest fossil evidence of the genus Mus in Africa was from
the early to middle Pliocene in Ethiopia (the Omo valley
in the south of the Ethiopian Rift Valley and Hadar in the
east, 5–2.5 Mya; [84,85]) and Kenya (4.5 Mya; [27]).
Due to incomplete sampling (mainly in eastern Africa)
previous studies could not adequately explore the evo-
lutionary history of Nannomys, especially since our
biogeographical reconstructions demonstrate that the
first divergence of Nannomys occurred in eastern Africa.
Paleoclimatic and paleoanthropological research in eastern
Africa suggested repeated association of critical events
in hominin evolution with the most prolonged intervals
of high climate variability. Potts (2013) [77] defined
eight intervals of predicted high climate variability in
the last 5 My and argued that most important events in
hominin evolution occurred within these periods. Three of
the most prolonged intervals of predicted high climate vari-
ability are 2.79-2.47 Ma, 1.89-1.69 Ma, and 1.12-0.92 Ma
and they largely overlap with the previously defined periods
of the occurrence of large lakes [86] as well as with inferred
aridity phases based on dust records, paleosol δ13C, and
the prevalence of grazing bovids [87].
Clear associations between periods of climatic instability
and divergence events are also visible in phylogenetic
reconstructions of Nannomys. The first splits leading
to ancestors of most current species groups probably
occurred in eastern Africa in the period 5.2-4.5 Mya
(Figure 3a), which corresponds to the longest era of
strong wet-dry variability [77]. Nothing is known about
the ecology of the extinct Mus taxa, but surviving
ancient lineages (MOTUs 1–3) may provide some clues.
They can be considered “living fossils”, i.e. monotypic rel-
ict taxa living in very restricted areas in Eastern African
mountains. The period 4–3.5 Mya is considered relatively
stable with few documented evolutionary events [77] and
we observed only two vicariance events in Nannomys
during this period. The first is the north–south split of
MOTU 3 (M. sp. “Harenna”) and the triton group, and
the second is the west–east split of the baoulei and the
sorella groups (see Figure 3a and compare it with distri-
butions at Figure 1). The most intensive radiation of
Nannomys is dated into the period 3.5-1.4 Mya (see
Figure 3a), when most current MOTUs (i.e. putative
species) appeared. The beginning of this period coin-
cides with the start of a cooling and aridification trend
[88]. The open savannah-like habitats were spreading
intensively and at the same time the climate was very
variable (four prolonged periods of strong wet-dry variabil-
ity are dated into this range; [77]). This variable climate
likely yielded environmental changes that increased the fre-
quency of evolutionary responses like adaptation, dispersal
(especially in open habitats), and ultimately, speciation (for
example it was also the period with the highest number
of hominin taxa; [89]). Our biogeographic analyses are
consistent with these findings because the most intensive
radiation occurred in the minutoides lineage in savannahs.
The presumed shift from mountains to more arid and
open habitats was clearly linked with the decrease of the
body size in the minutoides lineage. The ancient M.
imberbis (MOTU 2) has a body size of 25 g [8], MOTU 1
(M. sp. “Nyika”) has 14 g, MOTU 3 (M. sp. “Harenna”)
has cca 16 g (our unpublished data) and the members of
other non-minutoides groups weight 8–13 g [9]. In
contrast, all species of the minutoides clade have body size
3–8 g, making them one of the smallest mammals in the
world [9]. The last period of climatic instability is dated to
1.12-0.92 Mya, which coincides with the likely simultan-
eous split of the MOTU 27, i.e. Mus minutoides, into 11
distinct genetic lineages (see above).
Bryja et al. BMC Evolutionary Biology (2014) 14:256 Page 15 of 20
76
Tatiana Aghová / Ph.D. dissertation (2018)
Ecological constraints and multi-species sympatry
Previous studies revealed that at several sites more than
one species of Nannomys occurs in sympatry [12,13,23].
Their observations are in agreement with the distribution
ranges based on genotyped individuals (Figure 1) showing
largely overlapping distribution areas of many species.
However, if we exclude widely distributed M. minutoides
(MOTU 27), the distribution of individual species within
the same species group is predominantly parapatric (most
illustrative in Figure 1b, c, d), while sympatry is typical for
species from different species groups. This suggests that
the species groups might have evolved specific morpho-
logical adaptations that allow their sympatric occurrence
with the members of other Nannomys lineages. Although
detailed morphological analysis of genetically identified
specimens is still missing, preliminary data suggest clear
differences in the skull morphology among the species
groups ([12], E. Verheyen et al., unpublished data), with
possible functional consequences in separation of eco-
logical niches (for example dietary).
Even if the distribution areas of two or more species
from the same species group overlap, closer examination
of our data provide evidence for the preference of differ-
ent habitats. For example two Ethiopian endemics from
the setulosus group, M. cf. proconodon (MOTU 7) and
M. mahomet (MOTU 11), have never been captured at
the same locality; the former prefers lowland habitats in
the Rift Valley, while the latter is common species across
the Ethiopian highlands. Up to four species of the minu-
toides group can be found in western Africa, but their
ecological requirements are probably different. Based on
the data summarized at Figure 1 and published records,
it seems that M. minutoides is able to live in Western
Africa in relatively humid places, M. mattheyi prefers
dry Guinean savannah and the transition zone between
forest and savannah, M. musculoides is a typical inhabitant
of Sudanian savannah belt from Guinea to western
Ethiopia and M. haussa lives in arid Sahelian environment
([12,65], figure one in this study). Similarly M. minutoides
can occasionally be found in the same localities as M.
indutus in southern Africa, but the latter probably prefers
drier habitats ([63,64] and references therein).
Relevance to the understanding of karyotype evolution
and sex determination
The subgenus Nannomys has previously been used as a
suitable model for studies of karyotype evolution due to
very high variability of chromosomal rearrangements
[11,17,90,91]. The ancestral karyotype of the pygmy mice
was composed of 36 acrocentric chromosomes [17,92], but
the wide spectrum of mutational mechanisms modified
the chromosomal constitution. Besides relatively frequent
Robertsonian translocations, other chromosomal rearrange-
ments were described in Nannomys, including variable
sex-autosome translocations, pericentric inversions, tandem
fusions and WARTs (Whole-Arm-Reciprocal Transloca-
tion) [9]. Pan-African phylogeny based on more complete
taxon sampling presented in our study can help to under-
stand the karyotype evolution in general and sex determin-
ation mechanisms in particular. The mapping of karyotype
features on the phylogenetic tree can help to define spe-
cific predictions that can be further verified by sampling
focussed on particular species and geographical areas.
For example, tandem fusions - one of the rarest
chromosomal rearrangements - were evidenced in M.
triton (MOTU 4) and M. sp. “Harenna” (MOTU 3) that
in most phylogenies cluster together. Even if they were
suspected in two other species of the sorella group in
the CAR (M. goundae and M. oubangui, not sampled in
our study; [9]), further detailed studies of these rare
mutations should direct their focus on widely distributed
and common MOTU 6 belonging to the triton group. One
of the most conspicuous features of Nannomys karyotypes
is the fusions of autosomes and sex-chromosomes. These
fusions were most frequently studied in two terminal taxa
of the minutoides group (MOTU 26 - musculoides and
MOTU 27 - minutoides), but they were also observed in
M. goundae and M. oubangui (very probably belonging
to the sorella group) and in M. triton (MOTU 4) [9].
Since they appeared several times independently, it is
therefore clear that predispositions for translocations of
sex chromosomes exist in more lineages of Nannomys,
yet these translocations are not a general feature of the
whole subgenus, as, for example the setulosus group is
very conservative and all MOTUs karyotyped until
today have the ancestral karyotype (2n = 36, NF =36)
([78] and references in [9]). Future research on East
African species of the minutoides group (MOTUs 23–25,
i.e. M. cf. tenellus, M. cf. gerbillus, and M. cf. gratus), the
sorella group and the triton group could thus potentially
bring interesting new insights on the evolution and poly-
morphism of sex-autosome translocations. Finally, the
phylogeographic pattern described in our study for the
most karyotypically variable species, M. minutoides, can
help to design further sampling of chromosomal data in
lineages, where the karyotypes are not yet known. The
haplotype network suggests 11 main lineages that prob-
ably differentiated in small allopatric populations at the
same time, which could have led to establishment and fix-
ation of important karyotypic differences [64,90]), possibly
involving presently unknown means of sex determination
[91]. If such karyotype differences among genetic lineages
exist, it would be also extremely interesting to study the
possible contact zones among them (see Figure 1f).
Consequences for future epidemiological studies
Rodents are reservoir hosts of important human patho-
gens, of which some can cause serious diseases. Most
Bryja et al. BMC Evolutionary Biology (2014) 14:256 Page 16 of 20
77
Tatiana Aghová / Ph.D. dissertation (2018)
recent examples of emerging and re-emerging diseases
have been caused by RNA viruses [93] and understanding
of their evolution and epidemiology is essential for pre-
dicting future emergences and designing interventions (e.
g. vaccinations). Among RNA viruses hosted primarily by
African rodents, the Lassa arenavirus has received most
attention, because it is responsible for Lassa hemorrhagic
fever in West Africa, which causes thousands of human
deaths each year [94]. The host specificity of arenaviruses
is thought to be relatively strict with often a single species
described as the primary reservoir host [21]. A long-term
evolutionary history between arenaviruses and their hosts
(co-evolution) was originally suggested due to the almost
perfect sorting of arenavirus lineages into rodent clades
(e.g. [95]). Recent studies suggest that pygmy mice are
frequent hosts of arenaviruses (and probably also other
important parasites) and they often live close to human
habitations (e.g. [13]). The pan-African phylogeny of
Nannomys proposed in this paper can help to describe
the co-evolutionary patterns of arenaviruses and their hosts
and even provide the potential clues for understanding the
occasional disease outbreaks.
The first virus found in Nannomys was the virus Kodoko,
described from Mus minutoides in western Africa, and
belonging to the lineage of lymphocytic choriomeningitis
virus (LCMV) that is hosted by the house mouse [20]. This
finding (followed by description of new Kodoko strain in
Eastern African, [21]) thus supported a co-evolutionary sce-
nario, because all arenaviruses known from African murine
hosts at that time grouped according to taxonomic position
of theirs hosts (i.e. three main lineages of African arena-
viruses were hosted by rodents of three tribes, Praomyini,
Arvicanthini and Murini; Lecompte et al. 2007, Gouy de
Belocq et al. 2010). However, the next arenavirus, called
Gbagroube and described from Mus cf. setulosus (MOTU 9
in this study) from the Ivory Coast, does not belong to the
LCMV lineage (specific to Mus), but surprisingly clusters
with the Lassa virus strains [22]. Very recently, two other
arenaviruses were found in Nannomys in Ghana [23]. The
virus Natorduori is hosted by M. mattheyi (MOTU 20, the
minutoides group) and clusters clearly into Mus-specific
LCMV lineage. In contrast, the virus Jirandogo, the first
arenavirus reported fromM. baoulei, in various phylogenies
based on its different genome segments belongs to the
Lassa virus group (similarly as Gbagroube virus). African
pygmy mice are therefore the first group of African rodents
that host two very different lineages of arenaviruses; one of
them seems to be Mus-specific (in Africa now reported
from two species in the minutoides group), but the second
forms the sister lineage of the highly pathogenic Lassa virus
(hosted by species from the setulosus and the baoulei
groups). Further surveillance for new arenaviruses focussed
preferentially on Nannomys lineages where no viruses have
yet been found (e.g. the triton or sorella groups widely
distributed in central and eastern Africa) can increase un-
derstanding of the evolution of these pathogens and predict
the regions of possible epidemiological importance.
Conclusions
The known species diversity of tropical organisms is highly
underestimated even for relatively well known animals like
mammals. Here we performed a phylogenetic analysis of
the largest available set of genetic data collected from the
only indigenous African lineage of the genus Mus, called
Nannomys. A conservative definition of MOTUs suggests
that the number of species described to date represents
only approximately 60% of possible species diversity and
intensive taxonomic work is now required to allow the for-
mal description of genetically divergent lineages. We also
provide the first reliable genotype-based distribution ranges
of particular MOTUs that can aid in future species inven-
tories in different parts of Africa. The dating of divergences
and biogeographical analyses strongly suggest that ances-
tors of Nannomys colonized Africa at the end of Miocene
and diverged to ancestors of the main species groups in
mountains of Eastern Africa in lower Pliocene. The aridifi-
cation that started in Africa cca 3 Mya led to spreading of
open habitats and provided new ecological niches that were
fully utilized by Nannomys. In particular, the so-called
minutoides lineage underwent an exceptionally intensive
radiation in savannah-like habitats and occupied almost
whole sub-Saharan Africa in several colonization waves.
The combination of a detailed phylogeny based on an
almost complete taxon sampling combined with genotype-
based distributional data of lineages, taxa and valid species
provides a solid foundation to address specific ecologically-
explicit evolutionary hypotheses using Nannomys as a
model system, i.e. in evolution of sex determination and
host-virus co-evolution.
Availability of supporting data
The newly produced sequences were submitted to GenBank
under accession numbers KJ935741-KJ935873 (CYTB) and
KJ935874-KJ935905 (IRBP) (see Additional file 1 for more
details). The final alignment of concatenated sequences
used in phylogenetic analyses is in Additional file 6.
Additional files
Additional file 1: Details on collecting localities and genetic data
for all Nannomys specimens.
Additional file 2: List of sequences used for divergence dating and
resulting fossil-calibrated timetree.
Additional file 3: Maximum likelihood phylogeny of Nannomys
based on separate analyses of mitochondrial CYTB and nuclear IRBP
genes.
Additional file 4: Distribution of genetic distances at CYTB within
and among taxa delimited by different methods.
Bryja et al. BMC Evolutionary Biology (2014) 14:256 Page 17 of 20

78
Tatiana Aghová / Ph.D. dissertation (2018)
Additional file 5: Biogeographical reconstruction of ancestral
distribution of Nannomys lineages using maximum likelihood in
Lagrange.
Additional file 6: Alignment of 179 ingroup and 7 outgroup
concatenated sequences of CYTB and IRBP.
Abbreviations
CYTB: Mitochondrial gene for cytochrome b; IRBP: Gene for interphotoreceptor
binding protein; Mya: Million years ago; mtDNA: Mitochondrial DNA;
ML: Maximum likelihood; BI: Bayesian inference; MOTU: Molecular operational
taxonomic unit; GMYC: Generalized mixed Yule-coalescent model;
PCR: Polymerase chain reaction; AIC: Akaike information criterion;
LCMV: Lymphocytic choriomeningitis virus.
Competing interests
The authors declare that they have no competing interests.
Authors’ contributions
JB, RŠ and EV conceived and designed the study, JB, RŠ, VM, YM, LL, KW, NO,
JM, NA, MC, HL collected important part of samples, TA and YM performed
laboratory analyses, JB and OM analysed data (phylogenetic and
biogeographic analyses), and JB (with help of OM) wrote the first draft of the
manuscript. All authors contributed to the final version of the paper. All
authors read and approved the final manuscript.
Authors’ information
JB is head of molecular ecology group at Institute of Vertebrate Biology ASCR,
generally interested in factors affecting evolution of vertebrate populations. His
actual topics include phylogeography and speciation in Africa, conservation
genetics and mechanisms of host-parasite co-evolution. OM and TA are post-doc
and PhD student in JB's lab, respectively. RŠ, YM, LL, HL and EV are leaders of
research groups studying ecology and evolution of vertebrates, mainly mammals
and especially rodents, in different parts of Africa. VM, NO, JM, KW, NA and MC
are African and European collaborators of above-mentioned researchers, with
joint interest in biodiversity of African rodents.
Acknowledgements
This study was supported by the projects of the Czech Science Foundation, no.
P506-10-0983 (JB and RŠ), the Russian Foundation for Basic Research, no. 12-04-
01283 (LL), and the Belgian Science Policy project 'Evaluating the effect of Pleis-
tocene climate changes on speciation patterns in selected African vertebrates’
(EV). For help in the field, we acknowledge H. Patzenhauerová-Konvičková, J.
Šklíba, M. Lövy, C. Sabuni, G. Mhamphi, F. Sedláček, S. Šafarčíková, A. Konečný, S.
Gambalemoke Mbalitini, and all local collaborators. The assistance of R. Makundi,
W.N. Chitaukali, B. Dudu Akaibe and late W. Verheyen with project logistics and
sample collection is highly appreciated. H. Patzenhauerová-Konvičková and L.
Piálek helped with genotyping and E. Fichet-Calvet and S. Gryseels provided
unpublished sequences. For permission to carry out the research and to collect
specimens we are obliged to the National Research Council and Forestry
Department in Malawi, the National Council for Science and Technology, the
Kenyan Forest Service and the Kenyan Wildlife Service, the Ethiopian Wildlife
Conservation Authority, Zambian Wildlife Authority, Sokoine University of
Agriculture, and the ‘Centre de surveillance de la biodiversité’ in Kisangani, RD
Congo. We would also like to thank the curators of the museums (G. Csorba, N.
Duncan, V. Nicolas and W. Wendelen) for allowing us to study the material in
their care, and two anonymous reviewers and J.C. Winternitz for comments on
the previous version of the manuscript.
Author details1Institute of Vertebrate Biology, Academy of Sciences of the Czech Republic,
Brno, Czech Republic. 2Department of Botany and Zoology, Faculty of
Science, Masaryk University, Brno, Czech Republic. 3Institute of Animal
Physiology and Genetics, Academy of Sciences of the Czech Republic, Brno,
Czech Republic. 4Department of Zoology, Faculty of Science, University of
South Bohemia, České Budějovice, Czech Republic. 5Department of Biology,
College of Natural and Computational Sciences, Mekelle University, Tigray,
Ethiopia. 6A.N.Severtsov Institute of Ecology and Evolution RAS, Moscow,
Russia. 7Earth Watch Institute, Nairobi, Kenya. 8College of Agriculture and
Veterinary Sciences, University of Nairobi, Nairobi, Kenya. 9University of
Kisangani, Eastern Province, Kisangani, DR, Congo. 10CNRS UMR 6552/53,
Université de Rennes 1, Station Biologique, Paimpont, France. 11Evolutionary
Ecology Group, Biology Department, University of Antwerp, Antwerpen,
Belgium. 12Royal Belgian Institute for Natural Sciences, Operational Direction
Taxonomy and Phylogeny, Brussels, Belgium. 13Institute of Vertebrate Biology,
Academy of Sciences of the Czech Republic, Research Facility Studenec,
Studenec 122, 675 02 Koněšín, Czech Republic.
Received: 30 May 2014 Accepted: 27 November 2014
References
1. Mora C, Tittensor DP, Adl S, Simpson AGB, Worm B: How many species are
there on earth and in the ocean? PLoS Biol 2011, 9(8):e1001127.
2. Zachos FE, Apollonio M, Bärmann EV, Festa-Bianchet M, Göhlich U, Habel JC,
Haring E, Kruckenhauser L, Lovari S, McDevitt AD, Pertoldi C, Rössner GE,
Sánchez-Villagra MR, Scandura M, Suchentrunk F: Species inflation and
taxonomic artefacts - A critical comment on recent trends in mammalian
classification. Mamm Biol 2013, 78:1–6.
3. Groves CP: The nature of species: A rejoinder to Zachos et al. Mamm Biol
2013, 78:7–9.
4. Krishna Krishnamurthy P, Francis RA: A critical review on the utility of DNA
barcoding in biodiversity conservation. Biodivers Conserv 2012, 21:1907–1919.
5. Hoffmann M, Grubb P, Groves CP, Hutterer R, Van der Straeten E, Simmons
N, Bergmans W: A synthesis of African and western Indian Ocean Island
mammal taxa (Class: Mammalia) described between 1988 and 2008: an
update to Allen (1939) and Ansell (1989). Zootaxa 2009, 2205:1–36.
6. Macholán M, Baird SJE, Munclinger P, Piálek J: Evolution of the house mouse.
New York: Cambridge University Press; 2012.
7. Chevret P, Veyrunes F, Britton-Davidian J: Molecular phylogeny of the
genus Mus (Rodentia: Murinae) based on mitochondrial and nuclear
data. Biol J Linnean Soc 2005, 84:417–427.
8. Meheretu Y, Šumbera R, Bryja J: Enigmatic Ethiopian endemic rodent
Muriculus imberbis (Rüppell 1842) represents a separate lineage within
genus Mus. Mammalia 2014, in press (doi:10.1515/mammalia-2013-0119).
9. Britton-Davidian J, Robinson TJ, Veyrunes F: Systematics and evolution of
the African pygmy mice, subgenus Nannomys: A review. Acta Oecol 2012,
2012(42):41–49.
10. Musser GG, Carleton MD: Superfamily Muroidea. In Mammal Species of the
World: A Taxonomic and Geographic Reference. Edited by Wilson DE, Reeder
DM. Baltimore: Johns Hopkins University Press; 2005:894–1531.
11. Veyrunes F, Britton-Davidian J, Robinson TJ, Calvet E, Denys C, Chevret P:
Molecular phylogeny of the African pygmy mice, subgenus Nannomys
(Rodentia, Murinae, Mus): implications for chromosomal evolution. Mol
Phylogenet Evol 2005, 36:358–369.
12. Kan Kouassi S, Nicolas V, Aniskine V, Lalis A, Cruaud C, Couloux A, Colyn M,
Dosso M, Koivogui L, Verheyen E, Akoua-Koffi C, Denys C: Taxonomy and
biogeography of the African Pygmy mice, Subgenus Nannomys (Roden-
tia, Murinae, Mus) in Ivory Coast and Guinea (West Africa). Mammalia
2008, 72:237–252.
13. Fichet-Calvet E, Audenaert L, Barrière P, Verheyen E: Diversity, dynamics
and reproduction in a community of small mammals in Upper Guinea,
with emphasis on pygmy mice ecology. Afr J Ecol 2009, 48:600–614.
14. Lamb J, Downs S, Eiseb S, Taylor PJ: Increased geographic sampling
reveals considerable new genetic diversity in morphologically
conservative African Pygmy Mice (Genus Mus; Subgenus Nannomys).
Mamm Biol 2014, 79:24–35.
15. Matthey R: L'eventail robertsonien chez les Mus (Leggada) africains du
groupe minutoides-musculoides. Rev Suisse Zool 1970, 77(3):625–629.
16. Jotterand M: Un nouveau système polymorphe chez une nouvelle
espèce de Leggada (Mus goundae Petter). Experientia 1970, 26:1360–1361.
17. Veyrunes F, Catalan J, Sicard B, Robinson TJ, Duplantier JM, Granjon L,
Dobigny G, Britton-Davidian J: Autosome and sex chromosome diversity
among the African pygmy mice, subgenus Nannomys. Chromosome Res
2004, 12:369–382.
18. Veyrunes F, Watson J, Robinson TJ, Britton-Davidian J: Accumulation of rare
sex chromosome rearrangements in the African pygmy mouse, Mus
(Nannomys) minutoides: a whole-arm reciprocal translocation (WART)
involving a X-autosome fusion. Chromosome Res 2007, 15:223–230.
19. Veyrunes F, Chevret P, Catalan J, Castiglia R, Watson J, Dobigny G, Robinson
TJ, Britton-Davidian J: A novel sex determination system in a close relative
of the house mouse. Proc R Soc B 2010, 277:1049–1056.
Bryja et al. BMC Evolutionary Biology (2014) 14:256 Page 18 of 20
79
Tatiana Aghová / Ph.D. dissertation (2018)
20. Lecompte E, ter Meulen J, Emonet S, Daffis S, Charrel RN: Genetic identificationof Kodoko virus, a novel arenavirus of the African pigmy mouse (Mus
Nannomys minutoides) in West Africa. Virology 2007, 364:178–183.21. de Bellocq JG, Borremans B, Katakweba A, Makundi R, Baird SJE, Becker-Ziaja
B, Günther S, Leirs L: Sympatric occurrence of 3 arenaviruses, Tanzania.
Emerg Infect Dis 2010, 16(4):692–695.22. Coulibaly-N’Golo D, Allali B, Kan Kouassi S, Fichet-Calvet E, Becker-Ziaja B,
Rieger T, Ölschläger S, Dosso H, Denys C, ter Meulen J, Akoua-Koffi C,Günther S: Novel arenavirus sequences in Hylomyscus sp. and Mus
(Nannomys) setulosus from Cote d'Ivoire: Implications for evolution of
arenaviruses in Africa. PLoS One 2011, 6:e20893.23. Kronmann KC, Nimo-Paintsil S, Guirguis F, Kronmann LC, Bonney K, Obiri-Danso
K, Ampofo W, Fichet-Calvet E: Two novel arenaviruses detected in Pygmy
mice, Ghana. Emerg Infect Dis 2013, 19(11):1832–1835.24. Winkler AJ: Neogene paleobiogeography and East African
paleoenvironments: contributions from the Tugen Hills rodents and
lagomorphs. J Hum Evol 2002, 42:237–256.25. Lecompte E, Granjon L, Peterhans JK, Denys C: Cytochrome b-based
phylogeny of the Praomys group (Rodentia, Murinae): a new African
radiation? C R Biol 2002, 325(7):827–840.26. Stanhope MJ, Czelusniak J, Si JS, Nickeson J, Goodman M: A molecular
perspective on mammalian evolution from the gene encoding
interphotoreceptor retinoid binding protein, with convincing evidence
for bat monophyly. Mol Phylogenet Evol 1992, 1:148–160.27. Galan M, Pagès M, Cosson JF: Next-generation sequencing for rodent
barcoding: species identification from fresh, degraded and
environmental samples. PLoS One 2012, 7(11):e48374.28. Stamatakis A: RAxML Version 8: A tool for phylogenetic analysis and post-
analysis of large phylogenies. Bioinformatics 2014, 30(9):1312–1313.29. Ronquist F, Huelsenbeck JP: MrBayes 3: Bayesian phylogenetic inference
under mixed models. Bioinformatics 2003, 19:1572–1574.30. Rambaut A, Drummond AJ: Tracer v1.5. 2007 [http://beast.bio.ed.ac.uk/Tracer]31. Librado P, Rozas J: DnaSP v5: a software for comprehensive analysis of
DNA polymorphism data. Bioinformatics 2009, 25:1451–1452.32. Pons J, Barraclough TG, Gomez-Zurita J, Cardoso A, Duran DP, Hazell S,
Kamoun S, Sumlin WD, Vogler AP: Sequence-based species delimitation for
the DNA taxonomy of undescribed insects. Syst Biol 2006, 55(4):595–609.33. Powel JR: Accounting for uncertainty in species delineation during the
analysis of environmental DNA sequence data. Methods Ecol Evol 2012,3:1–11.
34. Fujisawa T, Barraclough TG: Delimiting species using single-locus data and
the Generalized Mixed Yule Coalescent approach: A revised method and
evaluation on simulated data sets. Syst Biol 2013, 62(5):707–724.35. Drummond AJ, Suchard MA, Xie D, Rambaut A: Bayesian phylogenetics
with BEAUti and the BEAST 1.7. Mol Biol Evol 2012, 29:1969–1973.36. Tamura K, Peterson D, Peterson N, Stecher G, Nei M, Kumar S: MEGA5:
Molecular evolutionary genetics analysis using maximum likelihood,
evolutionary distance, and maximum parsimony methods. Mol Biol Evol
2011, 28:2731–2739.37. Baker RJ, Bradley RD: Speciation in mammals and the Genetic Species
Concept. J Mammal 2006, 87:643–662.38. Lecompte E, Aplin K, Denys C, Catzeflis F, Chades M, Chevret P: Phylogeny
and biogeography of African Murinae based on mitochondrial and
nuclear gene sequences with a new tribal classification of the subfamily.
BMC Evol Biol 2008, 8:e199.39. Schenk JJ, Rowe KC, Steppan SJ: Ecological opportunity and incumbency
in the diversification of repeated continental colonizations by muroid
rodents. Syst Biol 2013, 62:837–864.40. Jacobs LL, Flynn LJ: Of mice… again: the Siwalik rodent record, murine
distribution, and molecular clocks. In Interpreting the past: essays on
human, primate and mammal evolution. Edited by Lieberman D, Smith R,Kelley J. Leiden: Brill Academic Publishers; 2005:63–80.
41. Denys C: Deux nouvelles espèces d’Aethomys (Rodentia, Muridae) à
Langebaanweg (Pliocène, Afrique du Sud): Implications phylogénétiques.
Annales de Paléontologie 1990, 76:41–69.42. Ambrose SH, Bell CJ, Bernor RL, Boisserie J-R, Darwent CM, Degusta D, Deino
A, Garcia N, Haile-Selassie Y, Head JJ, Howell FC, Kyule MD, Manthi FK,Mathu EM, Nyamai CM, Saegusa H, Stidham TA, Williams MAJ, Hlusko LJ:The paleoecology and paleogeographic context of Lemudong'o locality
1, a Late Miocene terrestrial fossil site in southern Kenya. Kirtlandia 2007,56:38–52.
43. Mein P, Pickford M, Senut B: Late Miocene micromammals from the
Harasib karst deposits, Namibia: Part 2b. Cricetomyidae, Dendromuridae
and Muridae, with an addendum on the Myocricetodontinae. Commun
Geological Surv Namibia 2004, 13:43–61.44. Fabre PH, Hautier L, Dimitrov D, Douzery EJP: A glimpse on the pattern
of rodent diversification: a phylogenetic approach. BMC Evol Biol 2012,12:e88.
45. Lemey P, Rambaut A, Drummond AJ, Suchard MA: Bayesianphylogeography finds its roots. PLoS Comput Biol 2009, 5:e1000520.
46. Ree RH, Smith SA: Maximum likelihood inference of geographic range
evolution by dispersal, local extinction, and cladogenesis. Syst Biol 2008,57(1):4–14.
47. Ree RH, Moore BR, Webb CO, Donoghue MJ: A likelihood framework for
inferring the evolution of geographic range in phylogenetic trees.
Evolution 2005, 59(11):2299–2311.48. R Core Team: R: A language and environment for statistical computing. Vienna,
Austria: R Foundation for Statistical Computing; 2013 [http://www.R-project.org/]49. Galtier N, Gouy M, Gautier C: SEAVIEW and PHYLO_WIN: two graphic tools
for sequence alignment and molecular phylogeny. Comput Appl Biosci
1996, 12:543–548.50. Yalden DW: Small mammals of the Bale Mountains, Ethiopia. Afr J Ecol
1988, 26:281–294.51. Lavrenchenko LA: The mammals of the isolated Harenna Forest (southern
Ethiopia): structure and history of the fauna. In Isolated Vertebrate
Communities in the Tropics, Proc. 4th Int. Symp. Bonn, Bonn Zool Monogr.Edited by Rheinwald G. ; 2000. 46:223-231.
52. Aniskin VM, Lavrenchenko LA, Varshavskii AA, Milishnikov AN: Karyotypesand cytogenetic differentiation of two African mouse species of genus
Mus (Rodentia, Muridae). Rus J Genet 1998, 34(1):80–85.53. Yalden DW, Largen MJ, Kock D, Hillman JC: Catalogue of the mammals of
Ethiopia and Eritrea. 7. Revised checklist, zoogeography and
conservation. Trop Zool 1996, 9:73–164.54. Dieterlen F, Happold DCD: Mus triton Grey-bellied Pygmy Mouse. In
Mammals of Africa, Volume III Rodents, hares and rabbits. Edited by HappoldDCD. London and New York: Bloomsbury Publishing; 2013:497–499.
55. Yalden DW, Largen MJ: The endemic mammals of Ethiopia. Mamm Rev
1992, 22:115–150.56. Vermeiren L, Verheyen WN: Notes sur les Leggada de Lamto, Cote d'Ivoire,
avec la description de Leggada baoulei sp. n. (Mammalia, Muridae). Revue
de Zoologie Africaine 1980, 94:570–590.57. Petter F: Les souris africaines du groupe sorella (Rongeurs, Muridés).
Mammalia 1981, 45(3):313–320.58. Mboumba JF, Deleporte P, Colyn M, Nicolas V: Phylogeography of Mus
(Nannomys) minutoides (Rodentia, Muridae) in West Central African
savannahs: singular vicariance in neighbouring populations. J Zool Syst
Evol Res 2011, 49(1):77–85.59. Brouat C, Tatard C, Bâ K, Cosson JF, Dobigny G, Fichet-Calvet E, Granjon L,
Lecompte E, Loiseau A, Mouline K, Duplantier JM: Phylogeography of the
Guinea Multimammate Mouse (Mastomys erythroleucus): a case study for
Sahelian species in West Africa. J Biogeogr 2009, 36:2237–2250.60. Bryja J, Patzenhauerová H, Granjon L, Dobigny G, Konečný A, Duplantier JM,
Gauthier P, Colyn M, Durnez L, Lalis A, Nicolas V: Plio-Pleistocene history of
West African Sudanian savanna and the phylogeography of the Praomys
daltoni complex (Rodentia): the environment/geography/genetic
interplay. Mol Ecol 2010, 19:4783–4799.61. Dobigny G, Tatard C, Gauthier P, Ba K, Duplantier JM, Granjon L, Kergoat GJ:
Mitochondrial and nuclear genes-based phylogeography of Arvicanthis
niloticus (Murinae) and sub-Saharan open habitats Pleistocene history.
PLoS One 2013, 8(11):e77815.62. Colangelo P, Corti M, Verheyen E, Annesi F, Oguge N, Makundi RH,
Verheyen W: Mitochondrial phylogeny reveals differential modes of
chromosomal evolution in the genus Tatera (Rodentia: Gerbillinae) in
Africa. Mol Phylogenet Evol 2005, 35:556–568.63. McDonough MM, Sotero-Caio CG, Ferguson AW, Lewis PJ, Tswiio M,
Thies ML: Mitochondrial DNA and karyotypic data confirm the presence
of Mus indutus and Mus minutoides (Mammalia, Rodentia, Muridae,
Nannomys) in Botswana. Zookeys 2013, 359:35–51.64. Chevret P, Robinson TJ, Perez J, Veyrunes F, Britton-Davidian J: A
phylogeographic survey of the Pygmy mouse Mus minutoides in
South Africa: Taxonomic and karyotypic inference from cytochrome
b sequences of museum specimens. PLoS One 2014, 9(6):e98499.
Bryja et al. BMC Evolutionary Biology (2014) 14:256 Page 19 of 20
80
Tatiana Aghová / Ph.D. dissertation (2018)
65. Dobigny G, Tatard C, Kane M, Gauthier P, Brouat C, Ba K, Duplantier JM: A
cytotaxonomic and DNA-based survey of rodents from Northern
Cameroon and Western Chad. Mammal Biol 2011, 76(4):417–427.
66. Winkler AJ, Denys C, Avery MD: Rodentia. In Cenozoic Mammals of Africa.
Edited by Werdelin L, Sanders WJ. Berkeley: University of California Press;
2010:263–304.
67. Isaac JB, Mallet J, Mace GM: Taxonomic inflation: its influence on
macroecology and conservation. Trends Ecol Evol 2004, 19:464–469.
68. Lavrenchenko LA, Verheyen WN, Verheyen E, Hulselmans J, Leirs H:
Morphometric and genetic study of Ethiopian Lophuromys
flavopunctatus Thomas, 1888 species complex with description of three
new 70-chromosomal species (Muridae, Rodentia). Bulletin de l’Insitut
Royal des Sciences Naturelles de Belgique, Biologie 2007, 77:77–117.
69. Berger SA, Krompass D, Stamatakis A: Performance, accuracy, and web
server for evolutionary placement of short sequence reads under
maximum likelihood. Syst Biol 2011, 60:291–302.
70. Skinner JD, Chimimba CT: The Mammals of the Southern African Subregion.
3rd edition. Cambridge, UK: Cambridge University Press; 2005.
71. Monadjem A: Mus setzeri Setzer’s Pygmy Mouse. In Mammals of Africa,
Volume III Rodents, hares and rabbits. Edited by Happold DCD. London and
New York: Bloomsbury Publishing; 2013:493–494.
72. Vermeiren L, Verheyen WN: Additional data on Mus setzeri Petter
(Mammalia, Muridae). Annales Musée Royal de l'Afrique Centrale, ser 8
(Sciences Zoologiques) 1983, 237:137–141.
73. Missoup AD, Nicolas V, Wendelen W, Keming E, Bilong Bilong CF, Couloux A,
Atanga E, Hutterer R, Denys C: Systematics and diversification of Praomys
species (Rodentia: Muridae) endemic to the Cameroon Volcanic Line (West
Central Africa). Zool Scr 2012, 41:327–345.
74. Demos TC, Agwanda B, Hickerson MJ: Integrative taxonomy within the
Hylomyscus denniae complex (Rodentia: Muridae) and a new species
from Kenya. J Mamm 2014, 95(1):1–15.
75. Verheyen WN, Hulselmans JLJ, Dierckx T, Mulungu L, Verheyen E, Corti M,
Kerbis JP, Leirs H: Craniometric,cytogenetic and genetic characterization
of the Kilimanjaro Lophuromys aquilus True 1892 population, its
implications for the taxonomy of the Lophuromys flavopunctatus species
complex and description of five new taxa. (Rodentia-Muridae-Africa).
Bulletin de l’Insitut Royal des Sciences Naturelles de Belgique, Biologie 2007,
77:23–75.
76. Colangelo P, Verheyen E, Leirs H, Tatard C, Denys C, Dobigny G, Duplantier
JM, Brouat C, Granjon L, Lecompte E: A mitochondrial phylogeographic
scenario for the most widespread African rodent, Mastomys natalensis.
Biol J Linn Soc 2013, 108(4):901–916.
77. Potts R: Hominin evolution in settings of strong environmental
variability. Quat Sci Rev 2013, 73:1–13.
78. Alvarado-Serrano DF, Knowles LL: Ecological niche models in
phylogeographic studies: applications, advances and precautions. Mol
Ecol Resour 2014, 14:233–248.
79. Šmíd J, Carranza S, Kratochvíl L, Gvoždík V, Nasher AK, Moravec J: Out of
Arabia: A complex biogeographic history of multiple vicariance and
dispersal events in the gecko genus Hemidactylus (Reptilia: Gekkonidae).
PLoS One 2013, 8(5):e64018.
80. Portik DM, Papenfuss TJ: Monitors cross the Red Sea: The biogeographic
history of Varanus yemenensis. Mol Phylogenet Evol 2012, 62:561–565.
81. Winney BJ, Hammond RL, Macasero W, Flores B, Boug A, Biquand V, Biquand S,
Bruford MW: Crossing the Red Sea: phylogeography of the hamadryas
baboon, Papio hamadryas hamadryas. Mol Ecol 2004, 13:2819–2927.
82. Bosworth W, Huchon P, McClay K: The red sea and gulf of aden basins.
J Afr Earth Sci 2005, 43:334–378.
83. Fernandes CA, Rohling EJ, Siddall M: Absence of post-Miocene Red Sea
land bridges: biogeographic implications. J Biogeogr 2006, 33:961–966.
84. Catzeflis FM, Denys C: The African Nannomys (Muridae): an early offshoot
from the Mus lineage - Evidence from scnDNA hybridization experiments
and compared morphology. Isr J Zool 1992, 38:219–231.
85. Denys C: Of mice and men: Evolution in East and South Africa during
Plio-Pleistocene times. In African Biogeography, Climate Change, and
Human Evolution. Edited by Bromage TG, Schrenk F. Oxford: Oxford
University Press; 1999:226–252.
86. Trauth MH, Maslin MA, Deino AL, Strecker MR, Bergner AGN, Dühnforth M:
High- and low-latitude forcing of Plio-Pleistocene East African climate
and human evolution. J Hum Evol 2007, 53:475–486.
87. de Menocal PB: African climate change and faunal evolution during the
Pliocene-Pleistocene. Earth Planet Sc Lett 2004, 220:3–24.
88. Zachos J, Pagani M, Sloan L, Thomas E, Billups K: Trends, rhythms, and
abberations in global climate 65 Ma to present. Science 2001, 292:686–693.
89. Schultz S, Maslin M: Early human speciation, brain expansion and dispersal
influenced by African climate pulses. PLoS One 2013, 8(10):e76750.
90. Veyrunes F, Catalan J, Tatard C, Cellier-Holzem E, Watson J, Chevret P,
Robinson TJ, Britton-Davidian J: Mitochondrial and chromosomal insights
into karyotypic evolution of the pygmy mouse, Mus minutoides, in South
Africa. Chromosome Res 2010, 18:563–574.
91. Veyrunes F, Perez J, Paintsil SNC, Fichet-Calvet E, Britton-Davidian J: Insights
into the evolutionary history of the X-linked sex reversal mutation in
Mus minutoides: clues from sequence analyses of the Y-linked Sry gene.
Sex Dev 2013, 7(5):244–252.
92. Matthey R: Nouvelles contributions à la cytogénétique des Mus africaines
du sous-genre Leggada. Experientia 1966, 22(6):400–401.
93. Nichol ST, Arikawa J, Kawaoka Y: Emerging viral diseases. Proc Natl Acad Sci
U S A 2000, 2000(97):12411–12412.
94. Günther S, Lenz O: Lassa virus. Crit Rev Clin Lab Sci 2004, 41:339–390.
95. Hugot JP, Gonzales JP, Denys C: Evolution of the Old World Arenaviridae and
their rodent hosts: generalized host-transfer or association by descent?
Infect Genet Evol 2001, 1:13–20.
Submit your next manuscript to BioMed Centraland take full advantage of:
• Convenient online submission
• Thorough peer review
• No space constraints or color figure charges
• Immediate publication on acceptance
• Inclusion in PubMed, CAS, Scopus and Google Scholar
• Research which is freely available for redistribution
Submit your manuscript at www.biomedcentral.com/submit
Bryja et al. BMC Evolutionary Biology (2014) 14:256 Page 20 of 20

81
Tatiana Aghová / Ph.D. dissertation (2018)
Evolutionary history and species
diversity of African Pouched Mice of the
genus Saccostomus (Rodentia:
Nesomyidae)
Mikula, O., umbera, R., Aghová, T., Mbau, J.S., Bryja, J.,
2016. Zoologica Scripta, 45(6), 595-617.
https://doi.org/10.1111/zsc.12179
Study design: OM, JB
Collecting material: RS, TA, JM, JB
Laboratory analysis: TA
Data analysis: OM
Writing: OM, JB
My contribution: 20%
Paper
II
Paper
II


83
Tatiana Aghová / Ph.D. dissertation (2018)
Evolutionary history and species diversity of African pouched
mice (Rodentia: Nesomyidae: Saccostomus)OND�REJ MIKULA, RADIM �SUMBERA, TATIANA AGHOV A, JUDITH S. MBAU, ABDUL S. KATAKWEBA,CHRISTOPHER A. SABUNI & JOSEF BRYJA
Submitted: 21 October 2015Accepted: 11 February 2016doi:10.1111/zsc.12179
Mikula, O., �Sumbera, R., Aghov a, T., Mbau, J.S., Katakweba, A.S., Sabuni, C.A., Bryja, J.
(2016). Evolutionary history and species diversity of African pouched mice (Rodentia:
Nesomyidae: Saccostomus). — Zoologica Scripta, 45, 595–617.
We explore diversity of African pouched mice, genus Saccostomus (Rodentia, Nesomyidae),
by sampling molecular and morphological variation across their continental-scale distribu-
tion in southern and eastern African savannahs and woodlands. Both mitochondrial (cy-
tochrome b) and nuclear DNA (IRBP, RAG1) as well as skull morphology confirm the
distinction between two recognized species, S. campestris and S. mearnsi, with disjunct distri-
bution in the Zambezian and Somali–Maasai bioregions, respectively. Molecular dating sug-
gests the divergence of these taxa occurred in the Early Pliocene, 3.9 Ma before present,
whereas the deepest divergences within each of them are only as old as 2.0 Ma for
S. mearnsi and 1.4 Ma for S. campestris. Based on cytochrome b phylogeny, we defined five
clades (three within S. campestris, two in S. mearnsi) whose species status was considered in
the light of nuclear DNA markers and morphology. We conclude that S. campestris group
consists of two subspecies S. campestris campestris (Peters, 1846; comprising two cytochrome
b clades) and S. campestris mashonae (de Winton, 1897) that are moderately differentiated,
albeit distinct in IRBP and skull form. They likely hybridize to a limited extent along the
Kafue–Zambezi Rivers. Saccostomus mearnsi group consists of two species, S. mearnsi (Heller,
1910) and S. umbriventer (Miller, 1910), that are markedly differentiated in both nuclear
markers and skull form and may possibly co-occur in south-western Kenya and north-east-
ern Tanzania. Analysis of historical demography suggests both subspecies of S. campestris
experienced population expansion dated to the Last Glacial. In the present range of S. cam-
pestris group, the distribution modelling suggests a moderate fragmentation of suitable habi-
tats during the last glacial cycle, whereas in the range of S. mearnsi group it predicts
substantial shifts of its occurrence in the same period.
Corresponding author: Ond�rej Mikula, Institute of Animal Physiology and Genetics, Academy of
Sciences of the Czech Republic, Veve�r ı 97, 60200 Brno, Czech Republic. E-mail: onmikula@gmail.
com
Ond�rej Mikula, Institute of Vertebrate Biology, Academy of Sciences of the Czech Republic, Brno,
Czech Republic and Institute of Animal Physiology and Genetics, Academy of Sciences of the Czech
Republic, Brno, Czech Republic. E-mail: [email protected]
Radim �Sumbera, Department of Zoology, Faculty of Science, University of South Bohemia, �Cesk e
Bud�ejovice, Czech Republic. E-mail: [email protected]
Tatiana Aghov a, Institute of Vertebrate Biology, Academy of Sciences of the Czech Republic, Brno,
Czech Republic and Department of Botany and Zoology, Faculty of Science, Masaryk University,
Brno, Czech Republic. E-mail: [email protected]
Judith S. Mbau, College of Agriculture and Veterinary Sciences, University of Nairobi, Nairobi,
Kenya.
Abdul S. Katakweba, Pest Management Center, Sokoine University of Agriculture, Morogoro,
Tanzania. E-mail: [email protected]
Christopher A. Sabuni, Pest Management Center, Sokoine University of Agriculture, Morogoro,
Tanzania. E-mail: [email protected]
Josef Bryja, Institute of Vertebrate Biology, Academy of Sciences of the Czech Republic, Brno, Czech
Republic and Department of Botany and Zoology, Faculty of Science, Masaryk University, Brno,
Czech Republic. E-mail: [email protected]
ª 2016 Royal Swedish Academy of Sciences, 45, 6, November 2016, pp 595–617 595
Zoologica Scripta
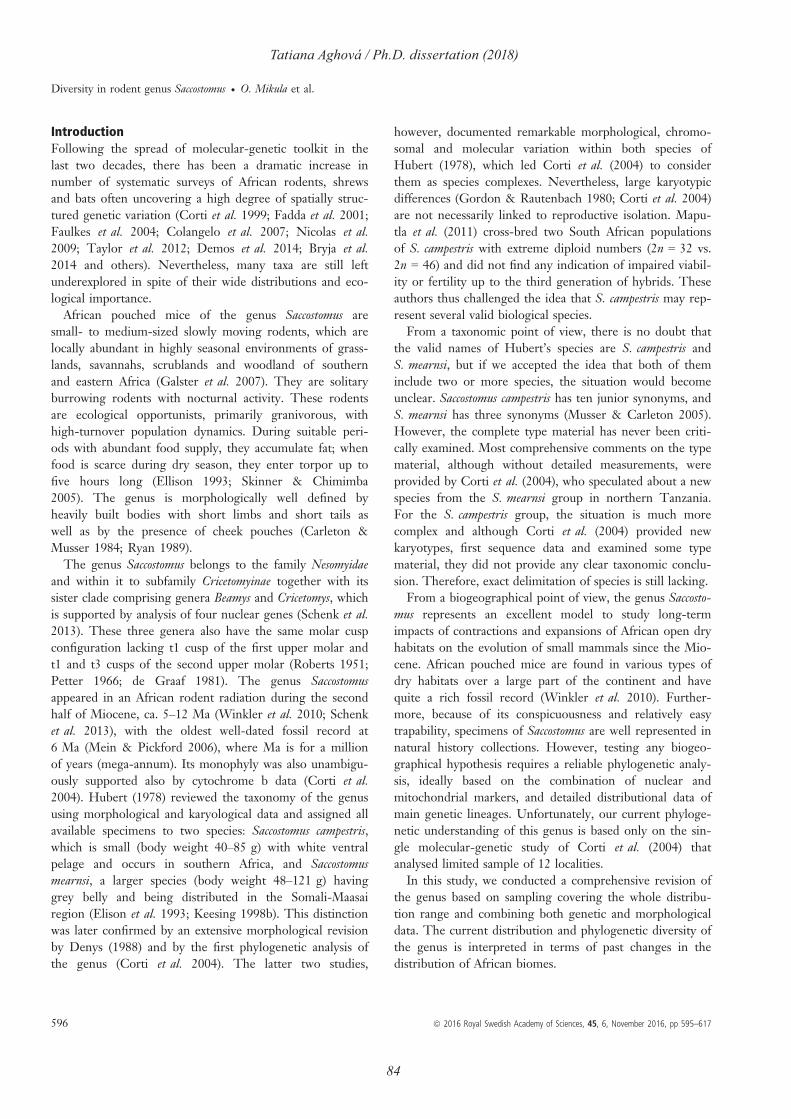
84
Tatiana Aghová / Ph.D. dissertation (2018)
Introduction
Following the spread of molecular-genetic toolkit in the
last two decades, there has been a dramatic increase in
number of systematic surveys of African rodents, shrews
and bats often uncovering a high degree of spatially struc-
tured genetic variation (Corti et al. 1999; Fadda et al. 2001;
Faulkes et al. 2004; Colangelo et al. 2007; Nicolas et al.
2009; Taylor et al. 2012; Demos et al. 2014; Bryja et al.
2014 and others). Nevertheless, many taxa are still left
underexplored in spite of their wide distributions and eco-
logical importance.
African pouched mice of the genus Saccostomus are
small- to medium-sized slowly moving rodents, which are
locally abundant in highly seasonal environments of grass-
lands, savannahs, scrublands and woodland of southern
and eastern Africa (Galster et al. 2007). They are solitary
burrowing rodents with nocturnal activity. These rodents
are ecological opportunists, primarily granivorous, with
high-turnover population dynamics. During suitable peri-
ods with abundant food supply, they accumulate fat; when
food is scarce during dry season, they enter torpor up to
five hours long (Ellison 1993; Skinner & Chimimba
2005). The genus is morphologically well defined by
heavily built bodies with short limbs and short tails as
well as by the presence of cheek pouches (Carleton &
Musser 1984; Ryan 1989).
The genus Saccostomus belongs to the family Nesomyidae
and within it to subfamily Cricetomyinae together with its
sister clade comprising genera Beamys and Cricetomys, which
is supported by analysis of four nuclear genes (Schenk et al.
2013). These three genera also have the same molar cusp
configuration lacking t1 cusp of the first upper molar and
t1 and t3 cusps of the second upper molar (Roberts 1951;
Petter 1966; de Graaf 1981). The genus Saccostomus
appeared in an African rodent radiation during the second
half of Miocene, ca. 5–12 Ma (Winkler et al. 2010; Schenk
et al. 2013), with the oldest well-dated fossil record at
6 Ma (Mein & Pickford 2006), where Ma is for a million
of years (mega-annum). Its monophyly was also unambigu-
ously supported also by cytochrome b data (Corti et al.
2004). Hubert (1978) reviewed the taxonomy of the genus
using morphological and karyological data and assigned all
available specimens to two species: Saccostomus campestris,
which is small (body weight 40–85 g) with white ventral
pelage and occurs in southern Africa, and Saccostomus
mearnsi, a larger species (body weight 48–121 g) having
grey belly and being distributed in the Somali-Maasai
region (Elison et al. 1993; Keesing 1998b). This distinction
was later confirmed by an extensive morphological revision
by Denys (1988) and by the first phylogenetic analysis of
the genus (Corti et al. 2004). The latter two studies,
however, documented remarkable morphological, chromo-
somal and molecular variation within both species of
Hubert (1978), which led Corti et al. (2004) to consider
them as species complexes. Nevertheless, large karyotypic
differences (Gordon & Rautenbach 1980; Corti et al. 2004)
are not necessarily linked to reproductive isolation. Mapu-
tla et al. (2011) cross-bred two South African populations
of S. campestris with extreme diploid numbers (2n = 32 vs.
2n = 46) and did not find any indication of impaired viabil-
ity or fertility up to the third generation of hybrids. These
authors thus challenged the idea that S. campestris may rep-
resent several valid biological species.
From a taxonomic point of view, there is no doubt that
the valid names of Hubert’s species are S. campestris and
S. mearnsi, but if we accepted the idea that both of them
include two or more species, the situation would become
unclear. Saccostomus campestris has ten junior synonyms, and
S. mearnsi has three synonyms (Musser & Carleton 2005).
However, the complete type material has never been criti-
cally examined. Most comprehensive comments on the type
material, although without detailed measurements, were
provided by Corti et al. (2004), who speculated about a new
species from the S. mearnsi group in northern Tanzania.
For the S. campestris group, the situation is much more
complex and although Corti et al. (2004) provided new
karyotypes, first sequence data and examined some type
material, they did not provide any clear taxonomic conclu-
sion. Therefore, exact delimitation of species is still lacking.
From a biogeographical point of view, the genus Saccosto-
mus represents an excellent model to study long-term
impacts of contractions and expansions of African open dry
habitats on the evolution of small mammals since the Mio-
cene. African pouched mice are found in various types of
dry habitats over a large part of the continent and have
quite a rich fossil record (Winkler et al. 2010). Further-
more, because of its conspicuousness and relatively easy
trapability, specimens of Saccostomus are well represented in
natural history collections. However, testing any biogeo-
graphical hypothesis requires a reliable phylogenetic analy-
sis, ideally based on the combination of nuclear and
mitochondrial markers, and detailed distributional data of
main genetic lineages. Unfortunately, our current phyloge-
netic understanding of this genus is based only on the sin-
gle molecular-genetic study of Corti et al. (2004) that
analysed limited sample of 12 localities.
In this study, we conducted a comprehensive revision of
the genus based on sampling covering the whole distribu-
tion range and combining both genetic and morphological
data. The current distribution and phylogenetic diversity of
the genus is interpreted in terms of past changes in the
distribution of African biomes.
596 ª 2016 Royal Swedish Academy of Sciences, 45, 6, November 2016, pp 595–617
Diversity in rodent genus Saccostomus � O. Mikula et al.
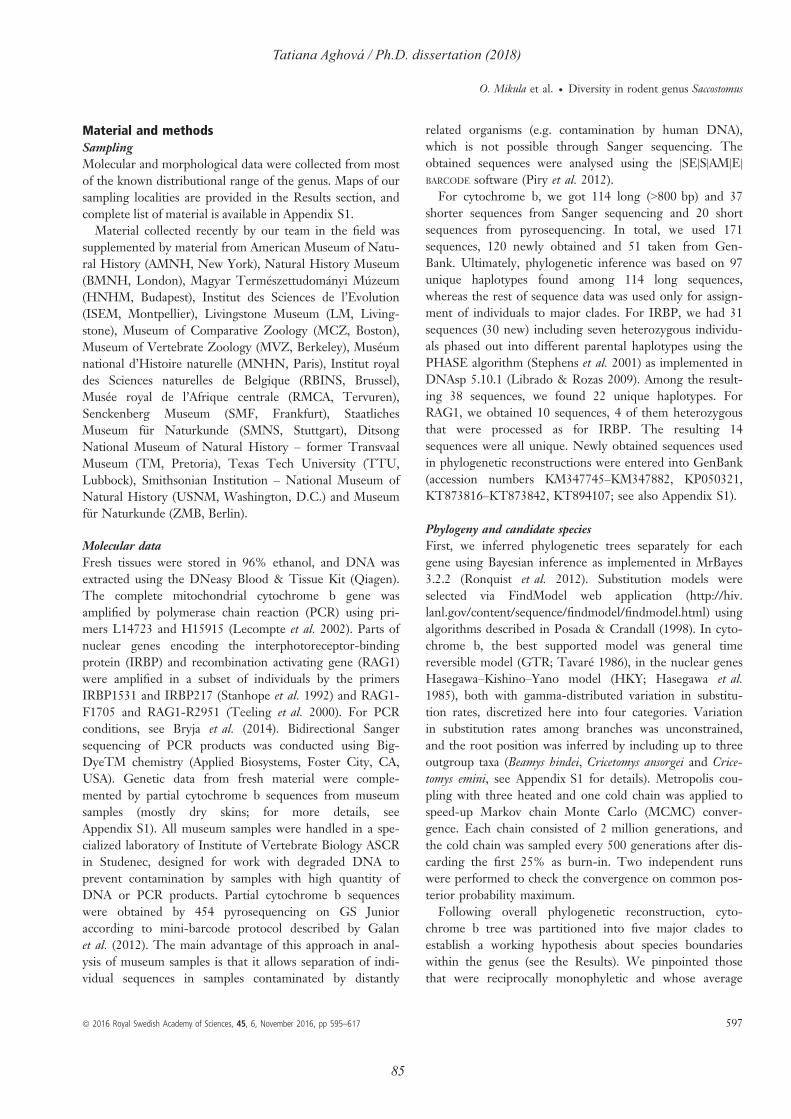
85
Tatiana Aghová / Ph.D. dissertation (2018)
Material and methods
Sampling
Molecular and morphological data were collected from most
of the known distributional range of the genus. Maps of our
sampling localities are provided in the Results section, and
complete list of material is available in Appendix S1.
Material collected recently by our team in the field was
supplemented by material from American Museum of Natu-
ral History (AMNH, New York), Natural History Museum
(BMNH, London), Magyar Term�eszettudom�anyi M�uzeum
(HNHM, Budapest), Institut des Sciences de l’Evolution
(ISEM, Montpellier), Livingstone Museum (LM, Living-
stone), Museum of Comparative Zoology (MCZ, Boston),
Museum of Vertebrate Zoology (MVZ, Berkeley), Mus�eum
national d’Histoire naturelle (MNHN, Paris), Institut royal
des Sciences naturelles de Belgique (RBINS, Brussel),
Mus�ee royal de l’Afrique centrale (RMCA, Tervuren),
Senckenberg Museum (SMF, Frankfurt), Staatliches
Museum f€ur Naturkunde (SMNS, Stuttgart), Ditsong
National Museum of Natural History – former Transvaal
Museum (TM, Pretoria), Texas Tech University (TTU,
Lubbock), Smithsonian Institution – National Museum of
Natural History (USNM, Washington, D.C.) and Museum
f€ur Naturkunde (ZMB, Berlin).
Molecular data
Fresh tissues were stored in 96% ethanol, and DNA was
extracted using the DNeasy Blood & Tissue Kit (Qiagen).
The complete mitochondrial cytochrome b gene was
amplified by polymerase chain reaction (PCR) using pri-
mers L14723 and H15915 (Lecompte et al. 2002). Parts of
nuclear genes encoding the interphotoreceptor-binding
protein (IRBP) and recombination activating gene (RAG1)
were amplified in a subset of individuals by the primers
IRBP1531 and IRBP217 (Stanhope et al. 1992) and RAG1-
F1705 and RAG1-R2951 (Teeling et al. 2000). For PCR
conditions, see Bryja et al. (2014). Bidirectional Sanger
sequencing of PCR products was conducted using Big-
DyeTM chemistry (Applied Biosystems, Foster City, CA,
USA). Genetic data from fresh material were comple-
mented by partial cytochrome b sequences from museum
samples (mostly dry skins; for more details, see
Appendix S1). All museum samples were handled in a spe-
cialized laboratory of Institute of Vertebrate Biology ASCR
in Studenec, designed for work with degraded DNA to
prevent contamination by samples with high quantity of
DNA or PCR products. Partial cytochrome b sequences
were obtained by 454 pyrosequencing on GS Junior
according to mini-barcode protocol described by Galan
et al. (2012). The main advantage of this approach in anal-
ysis of museum samples is that it allows separation of indi-
vidual sequences in samples contaminated by distantly
related organisms (e.g. contamination by human DNA),
which is not possible through Sanger sequencing. The
obtained sequences were analysed using the |SE|S|AM|E|
BARCODE software (Piry et al. 2012).
For cytochrome b, we got 114 long (>800 bp) and 37
shorter sequences from Sanger sequencing and 20 short
sequences from pyrosequencing. In total, we used 171
sequences, 120 newly obtained and 51 taken from Gen-
Bank. Ultimately, phylogenetic inference was based on 97
unique haplotypes found among 114 long sequences,
whereas the rest of sequence data was used only for assign-
ment of individuals to major clades. For IRBP, we had 31
sequences (30 new) including seven heterozygous individu-
als phased out into different parental haplotypes using the
PHASE algorithm (Stephens et al. 2001) as implemented in
DNAsp 5.10.1 (Librado & Rozas 2009). Among the result-
ing 38 sequences, we found 22 unique haplotypes. For
RAG1, we obtained 10 sequences, 4 of them heterozygous
that were processed as for IRBP. The resulting 14
sequences were all unique. Newly obtained sequences used
in phylogenetic reconstructions were entered into GenBank
(accession numbers KM347745–KM347882, KP050321,
KT873816–KT873842, KT894107; see also Appendix S1).
Phylogeny and candidate species
First, we inferred phylogenetic trees separately for each
gene using Bayesian inference as implemented in MrBayes
3.2.2 (Ronquist et al. 2012). Substitution models were
selected via FindModel web application (http://hiv.
lanl.gov/content/sequence/findmodel/findmodel.html) using
algorithms described in Posada & Crandall (1998). In cyto-
chrome b, the best supported model was general time
reversible model (GTR; Tavar�e 1986), in the nuclear genes
Hasegawa–Kishino–Yano model (HKY; Hasegawa et al.
1985), both with gamma-distributed variation in substitu-
tion rates, discretized here into four categories. Variation
in substitution rates among branches was unconstrained,
and the root position was inferred by including up to three
outgroup taxa (Beamys hindei, Cricetomys ansorgei and Crice-
tomys emini, see Appendix S1 for details). Metropolis cou-
pling with three heated and one cold chain was applied to
speed-up Markov chain Monte Carlo (MCMC) conver-
gence. Each chain consisted of 2 million generations, and
the cold chain was sampled every 500 generations after dis-
carding the first 25% as burn-in. Two independent runs
were performed to check the convergence on common pos-
terior probability maximum.
Following overall phylogenetic reconstruction, cyto-
chrome b tree was partitioned into five major clades to
establish a working hypothesis about species boundaries
within the genus (see the Results). We pinpointed those
that were reciprocally monophyletic and whose average
ª 2016 Royal Swedish Academy of Sciences, 45, 6, November 2016, pp 595–617 597
O. Mikula et al. � Diversity in rodent genus Saccostomus
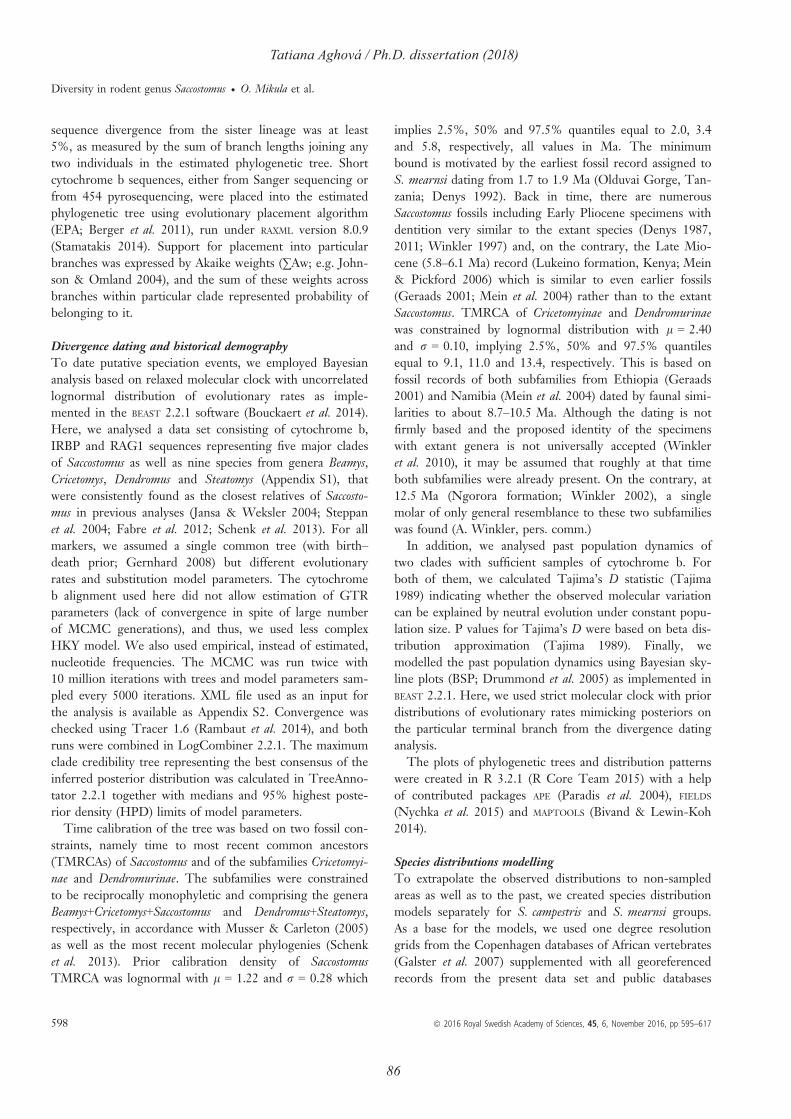
86
Tatiana Aghová / Ph.D. dissertation (2018)
sequence divergence from the sister lineage was at least
5%, as measured by the sum of branch lengths joining any
two individuals in the estimated phylogenetic tree. Short
cytochrome b sequences, either from Sanger sequencing or
from 454 pyrosequencing, were placed into the estimated
phylogenetic tree using evolutionary placement algorithm
(EPA; Berger et al. 2011), run under RAXML version 8.0.9
(Stamatakis 2014). Support for placement into particular
branches was expressed by Akaike weights (∑Aw; e.g. John-
son & Omland 2004), and the sum of these weights across
branches within particular clade represented probability of
belonging to it.
Divergence dating and historical demography
To date putative speciation events, we employed Bayesian
analysis based on relaxed molecular clock with uncorrelated
lognormal distribution of evolutionary rates as imple-
mented in the BEAST 2.2.1 software (Bouckaert et al. 2014).
Here, we analysed a data set consisting of cytochrome b,
IRBP and RAG1 sequences representing five major clades
of Saccostomus as well as nine species from genera Beamys,
Cricetomys, Dendromus and Steatomys (Appendix S1), that
were consistently found as the closest relatives of Saccosto-
mus in previous analyses (Jansa & Weksler 2004; Steppan
et al. 2004; Fabre et al. 2012; Schenk et al. 2013). For all
markers, we assumed a single common tree (with birth–
death prior; Gernhard 2008) but different evolutionary
rates and substitution model parameters. The cytochrome
b alignment used here did not allow estimation of GTR
parameters (lack of convergence in spite of large number
of MCMC generations), and thus, we used less complex
HKY model. We also used empirical, instead of estimated,
nucleotide frequencies. The MCMC was run twice with
10 million iterations with trees and model parameters sam-
pled every 5000 iterations. XML file used as an input for
the analysis is available as Appendix S2. Convergence was
checked using Tracer 1.6 (Rambaut et al. 2014), and both
runs were combined in LogCombiner 2.2.1. The maximum
clade credibility tree representing the best consensus of the
inferred posterior distribution was calculated in TreeAnno-
tator 2.2.1 together with medians and 95% highest poste-
rior density (HPD) limits of model parameters.
Time calibration of the tree was based on two fossil con-
straints, namely time to most recent common ancestors
(TMRCAs) of Saccostomus and of the subfamilies Cricetomyi-
nae and Dendromurinae. The subfamilies were constrained
to be reciprocally monophyletic and comprising the genera
Beamys+Cricetomys+Saccostomus and Dendromus+Steatomys,
respectively, in accordance with Musser & Carleton (2005)
as well as the most recent molecular phylogenies (Schenk
et al. 2013). Prior calibration density of Saccostomus
TMRCA was lognormal with l = 1.22 and r = 0.28 which
implies 2.5%, 50% and 97.5% quantiles equal to 2.0, 3.4
and 5.8, respectively, all values in Ma. The minimum
bound is motivated by the earliest fossil record assigned to
S. mearnsi dating from 1.7 to 1.9 Ma (Olduvai Gorge, Tan-
zania; Denys 1992). Back in time, there are numerous
Saccostomus fossils including Early Pliocene specimens with
dentition very similar to the extant species (Denys 1987,
2011; Winkler 1997) and, on the contrary, the Late Mio-
cene (5.8–6.1 Ma) record (Lukeino formation, Kenya; Mein
& Pickford 2006) which is similar to even earlier fossils
(Geraads 2001; Mein et al. 2004) rather than to the extant
Saccostomus. TMRCA of Cricetomyinae and Dendromurinae
was constrained by lognormal distribution with l = 2.40
and r = 0.10, implying 2.5%, 50% and 97.5% quantiles
equal to 9.1, 11.0 and 13.4, respectively. This is based on
fossil records of both subfamilies from Ethiopia (Geraads
2001) and Namibia (Mein et al. 2004) dated by faunal simi-
larities to about 8.7–10.5 Ma. Although the dating is not
firmly based and the proposed identity of the specimens
with extant genera is not universally accepted (Winkler
et al. 2010), it may be assumed that roughly at that time
both subfamilies were already present. On the contrary, at
12.5 Ma (Ngorora formation; Winkler 2002), a single
molar of only general resemblance to these two subfamilies
was found (A. Winkler, pers. comm.)
In addition, we analysed past population dynamics of
two clades with sufficient samples of cytochrome b. For
both of them, we calculated Tajima’s D statistic (Tajima
1989) indicating whether the observed molecular variation
can be explained by neutral evolution under constant popu-
lation size. P values for Tajima’s D were based on beta dis-
tribution approximation (Tajima 1989). Finally, we
modelled the past population dynamics using Bayesian sky-
line plots (BSP; Drummond et al. 2005) as implemented in
BEAST 2.2.1. Here, we used strict molecular clock with prior
distributions of evolutionary rates mimicking posteriors on
the particular terminal branch from the divergence dating
analysis.
The plots of phylogenetic trees and distribution patterns
were created in R 3.2.1 (R Core Team 2015) with a help
of contributed packages APE (Paradis et al. 2004), FIELDS
(Nychka et al. 2015) and MAPTOOLS (Bivand & Lewin-Koh
2014).
Species distributions modelling
To extrapolate the observed distributions to non-sampled
areas as well as to the past, we created species distribution
models separately for S. campestris and S. mearnsi groups.
As a base for the models, we used one degree resolution
grids from the Copenhagen databases of African vertebrates
(Galster et al. 2007) supplemented with all georeferenced
records from the present data set and public databases
598 ª 2016 Royal Swedish Academy of Sciences, 45, 6, November 2016, pp 595–617
Diversity in rodent genus Saccostomus � O. Mikula et al.
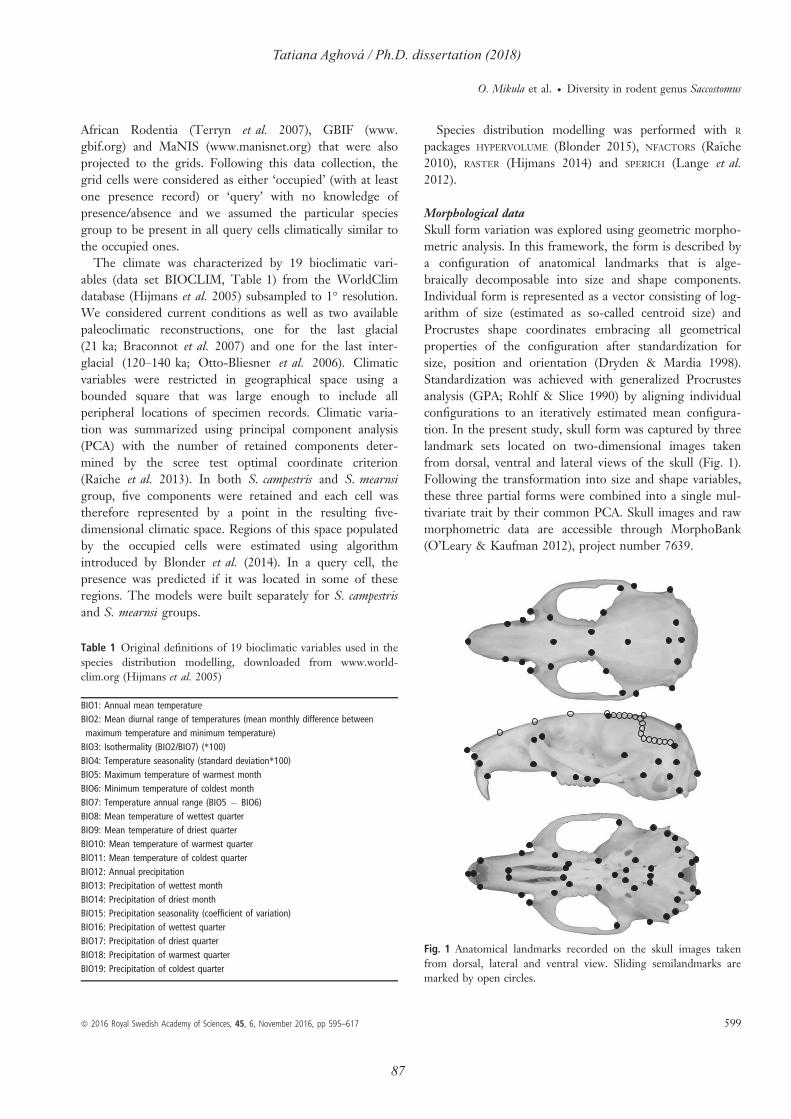
87
Tatiana Aghová / Ph.D. dissertation (2018)
African Rodentia (Terryn et al. 2007), GBIF (www.
gbif.org) and MaNIS (www.manisnet.org) that were also
projected to the grids. Following this data collection, the
grid cells were considered as either ‘occupied’ (with at least
one presence record) or ‘query’ with no knowledge of
presence/absence and we assumed the particular species
group to be present in all query cells climatically similar to
the occupied ones.
The climate was characterized by 19 bioclimatic vari-
ables (data set BIOCLIM, Table 1) from the WorldClim
database (Hijmans et al. 2005) subsampled to 1° resolution.
We considered current conditions as well as two available
paleoclimatic reconstructions, one for the last glacial
(21 ka; Braconnot et al. 2007) and one for the last inter-
glacial (120–140 ka; Otto-Bliesner et al. 2006). Climatic
variables were restricted in geographical space using a
bounded square that was large enough to include all
peripheral locations of specimen records. Climatic varia-
tion was summarized using principal component analysis
(PCA) with the number of retained components deter-
mined by the scree test optimal coordinate criterion
(Raıche et al. 2013). In both S. campestris and S. mearnsi
group, five components were retained and each cell was
therefore represented by a point in the resulting five-
dimensional climatic space. Regions of this space populated
by the occupied cells were estimated using algorithm
introduced by Blonder et al. (2014). In a query cell, the
presence was predicted if it was located in some of these
regions. The models were built separately for S. campestris
and S. mearnsi groups.
Species distribution modelling was performed with R
packages HYPERVOLUME (Blonder 2015), NFACTORS (Raıche
2010), RASTER (Hijmans 2014) and SPERICH (Lange et al.
2012).
Morphological data
Skull form variation was explored using geometric morpho-
metric analysis. In this framework, the form is described by
a configuration of anatomical landmarks that is alge-
braically decomposable into size and shape components.
Individual form is represented as a vector consisting of log-
arithm of size (estimated as so-called centroid size) and
Procrustes shape coordinates embracing all geometrical
properties of the configuration after standardization for
size, position and orientation (Dryden & Mardia 1998).
Standardization was achieved with generalized Procrustes
analysis (GPA; Rohlf & Slice 1990) by aligning individual
configurations to an iteratively estimated mean configura-
tion. In the present study, skull form was captured by three
landmark sets located on two-dimensional images taken
from dorsal, ventral and lateral views of the skull (Fig. 1).
Following the transformation into size and shape variables,
these three partial forms were combined into a single mul-
tivariate trait by their common PCA. Skull images and raw
morphometric data are accessible through MorphoBank
(O’Leary & Kaufman 2012), project number 7639.
Table 1 Original definitions of 19 bioclimatic variables used in the
species distribution modelling, downloaded from www.world-
clim.org (Hijmans et al. 2005)
BIO1: Annual mean temperature
BIO2: Mean diurnal range of temperatures (mean monthly difference between
maximum temperature and minimum temperature)
BIO3: Isothermality (BIO2/BIO7) (*100)
BIO4: Temperature seasonality (standard deviation*100)
BIO5: Maximum temperature of warmest month
BIO6: Minimum temperature of coldest month
BIO7: Temperature annual range (BIO5 � BIO6)
BIO8: Mean temperature of wettest quarter
BIO9: Mean temperature of driest quarter
BIO10: Mean temperature of warmest quarter
BIO11: Mean temperature of coldest quarter
BIO12: Annual precipitation
BIO13: Precipitation of wettest month
BIO14: Precipitation of driest month
BIO15: Precipitation seasonality (coefficient of variation)
BIO16: Precipitation of wettest quarter
BIO17: Precipitation of driest quarter
BIO18: Precipitation of warmest quarter
BIO19: Precipitation of coldest quarter
● ● ● ● ●
●●
●●
●
●
● ●●
●
●●
●●
●
●
● ●●
●
●●
●
●
●
●●
●● ● ●
●
●
●
●
●
●
●
●
●
●
●● ● ● ●
●
● ●
●
●
●
●●
●
●
●
●●
●
●
●
●●
●
● ●
●
●
●
●●
●
●
●
●●
●
●
●
●●
Fig. 1 Anatomical landmarks recorded on the skull images taken
from dorsal, lateral and ventral view. Sliding semilandmarks are
marked by open circles.
ª 2016 Royal Swedish Academy of Sciences, 45, 6, November 2016, pp 595–617 599
O. Mikula et al. Diversity in rodent genus Saccostomus
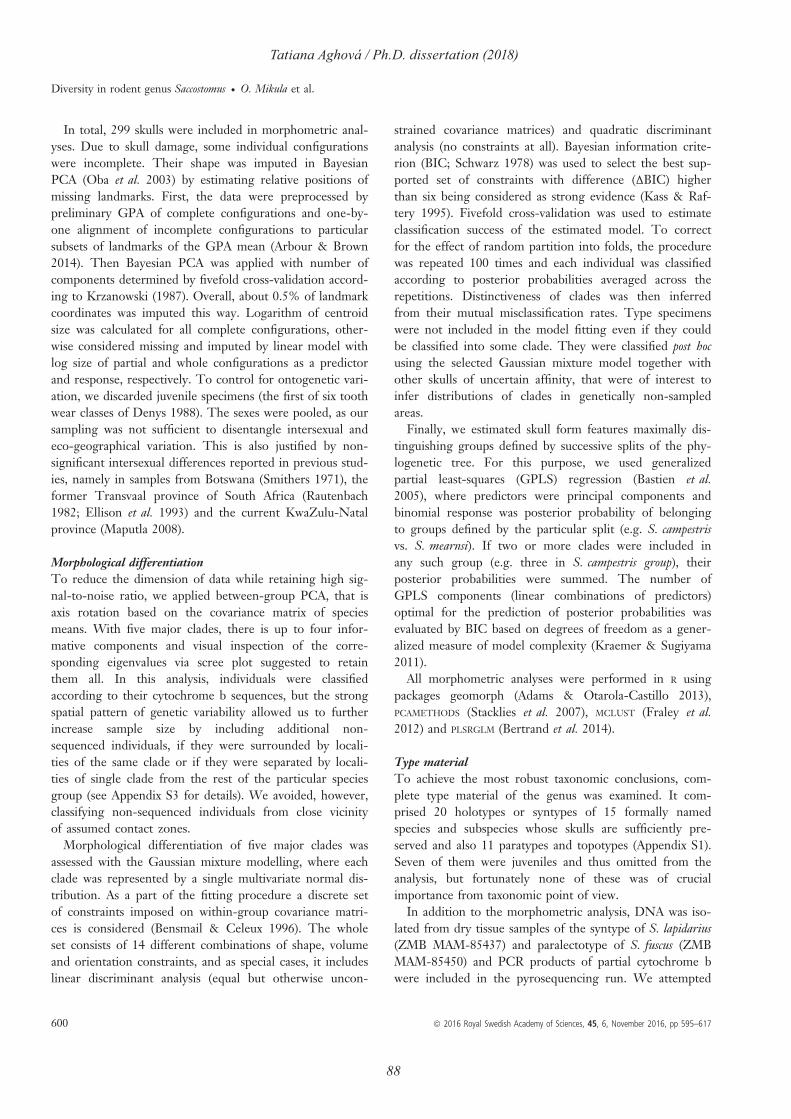
88
Tatiana Aghová / Ph.D. dissertation (2018)
In total, 299 skulls were included in morphometric anal-
yses. Due to skull damage, some individual configurations
were incomplete. Their shape was imputed in Bayesian
PCA (Oba et al. 2003) by estimating relative positions of
missing landmarks. First, the data were preprocessed by
preliminary GPA of complete configurations and one-by-
one alignment of incomplete configurations to particular
subsets of landmarks of the GPA mean (Arbour & Brown
2014). Then Bayesian PCA was applied with number of
components determined by fivefold cross-validation accord-
ing to Krzanowski (1987). Overall, about 0.5% of landmark
coordinates was imputed this way. Logarithm of centroid
size was calculated for all complete configurations, other-
wise considered missing and imputed by linear model with
log size of partial and whole configurations as a predictor
and response, respectively. To control for ontogenetic vari-
ation, we discarded juvenile specimens (the first of six tooth
wear classes of Denys 1988). The sexes were pooled, as our
sampling was not sufficient to disentangle intersexual and
eco-geographical variation. This is also justified by non-
significant intersexual differences reported in previous stud-
ies, namely in samples from Botswana (Smithers 1971), the
former Transvaal province of South Africa (Rautenbach
1982; Ellison et al. 1993) and the current KwaZulu-Natal
province (Maputla 2008).
Morphological differentiation
To reduce the dimension of data while retaining high sig-
nal-to-noise ratio, we applied between-group PCA, that is
axis rotation based on the covariance matrix of species
means. With five major clades, there is up to four infor-
mative components and visual inspection of the corre-
sponding eigenvalues via scree plot suggested to retain
them all. In this analysis, individuals were classified
according to their cytochrome b sequences, but the strong
spatial pattern of genetic variability allowed us to further
increase sample size by including additional non-
sequenced individuals, if they were surrounded by locali-
ties of the same clade or if they were separated by locali-
ties of single clade from the rest of the particular species
group (see Appendix S3 for details). We avoided, however,
classifying non-sequenced individuals from close vicinity
of assumed contact zones.
Morphological differentiation of five major clades was
assessed with the Gaussian mixture modelling, where each
clade was represented by a single multivariate normal dis-
tribution. As a part of the fitting procedure a discrete set
of constraints imposed on within-group covariance matri-
ces is considered (Bensmail & Celeux 1996). The whole
set consists of 14 different combinations of shape, volume
and orientation constraints, and as special cases, it includes
linear discriminant analysis (equal but otherwise uncon-
strained covariance matrices) and quadratic discriminant
analysis (no constraints at all). Bayesian information crite-
rion (BIC; Schwarz 1978) was used to select the best sup-
ported set of constraints with difference (∆BIC) higher
than six being considered as strong evidence (Kass & Raf-
tery 1995). Fivefold cross-validation was used to estimate
classification success of the estimated model. To correct
for the effect of random partition into folds, the procedure
was repeated 100 times and each individual was classified
according to posterior probabilities averaged across the
repetitions. Distinctiveness of clades was then inferred
from their mutual misclassification rates. Type specimens
were not included in the model fitting even if they could
be classified into some clade. They were classified post hoc
using the selected Gaussian mixture model together with
other skulls of uncertain affinity, that were of interest to
infer distributions of clades in genetically non-sampled
areas.
Finally, we estimated skull form features maximally dis-
tinguishing groups defined by successive splits of the phy-
logenetic tree. For this purpose, we used generalized
partial least-squares (GPLS) regression (Bastien et al.
2005), where predictors were principal components and
binomial response was posterior probability of belonging
to groups defined by the particular split (e.g. S. campestris
vs. S. mearnsi). If two or more clades were included in
any such group (e.g. three in S. campestris group), their
posterior probabilities were summed. The number of
GPLS components (linear combinations of predictors)
optimal for the prediction of posterior probabilities was
evaluated by BIC based on degrees of freedom as a gener-
alized measure of model complexity (Kraemer & Sugiyama
2011).
All morphometric analyses were performed in R using
packages geomorph (Adams & Otarola-Castillo 2013),
PCAMETHODS (Stacklies et al. 2007), MCLUST (Fraley et al.
2012) and PLSRGLM (Bertrand et al. 2014).
Type material
To achieve the most robust taxonomic conclusions, com-
plete type material of the genus was examined. It com-
prised 20 holotypes or syntypes of 15 formally named
species and subspecies whose skulls are sufficiently pre-
served and also 11 paratypes and topotypes (Appendix S1).
Seven of them were juveniles and thus omitted from the
analysis, but fortunately none of these was of crucial
importance from taxonomic point of view.
In addition to the morphometric analysis, DNA was iso-
lated from dry tissue samples of the syntype of S. lapidarius
(ZMB MAM-85437) and paralectotype of S. fuscus (ZMB
MAM-85450) and PCR products of partial cytochrome b
were included in the pyrosequencing run. We attempted
600 ª 2016 Royal Swedish Academy of Sciences, 45, 6, November 2016, pp 595–617
Diversity in rodent genus Saccostomus � O. Mikula et al.
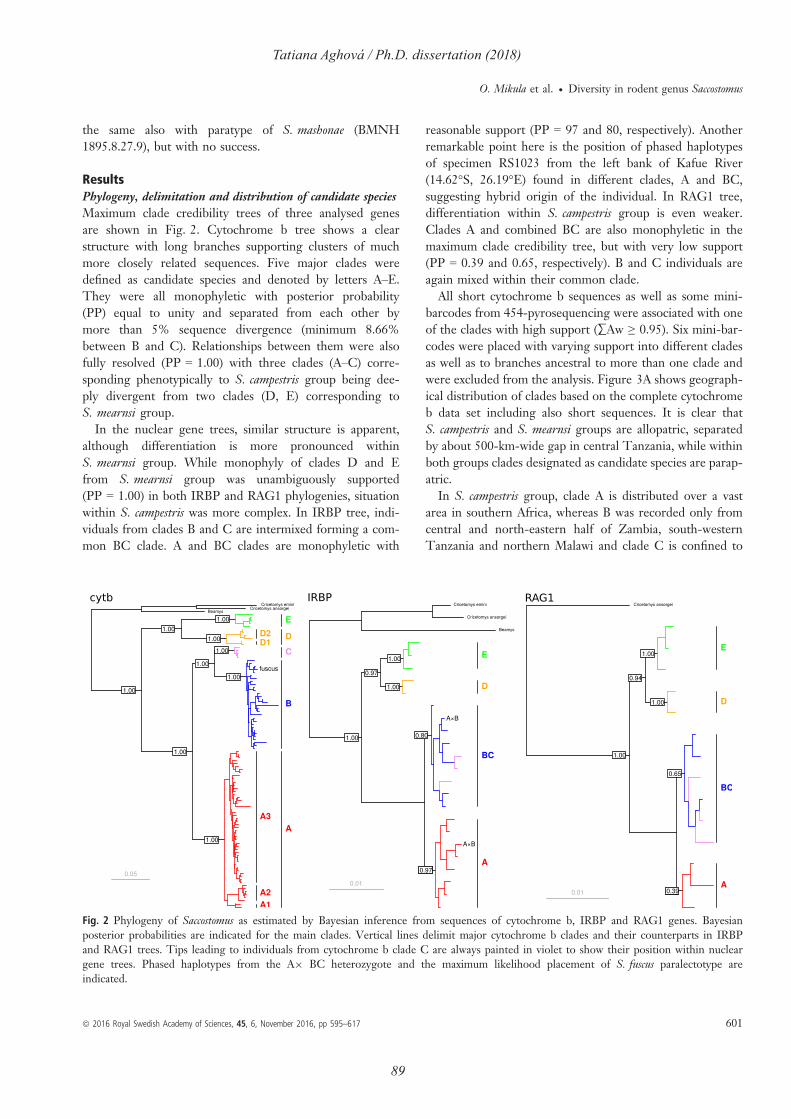
89
Tatiana Aghová / Ph.D. dissertation (2018)
the same also with paratype of S. mashonae (BMNH
1895.8.27.9), but with no success.
Results
Phylogeny, delimitation and distribution of candidate species
Maximum clade credibility trees of three analysed genes
are shown in Fig. 2. Cytochrome b tree shows a clear
structure with long branches supporting clusters of much
more closely related sequences. Five major clades were
defined as candidate species and denoted by letters A–E.
They were all monophyletic with posterior probability
(PP) equal to unity and separated from each other by
more than 5% sequence divergence (minimum 8.66%
between B and C). Relationships between them were also
fully resolved (PP = 1.00) with three clades (A–C) corre-
sponding phenotypically to S. campestris group being dee-
ply divergent from two clades (D, E) corresponding to
S. mearnsi group.
In the nuclear gene trees, similar structure is apparent,
although differentiation is more pronounced within
S. mearnsi group. While monophyly of clades D and E
from S. mearnsi group was unambiguously supported
(PP = 1.00) in both IRBP and RAG1 phylogenies, situation
within S. campestris was more complex. In IRBP tree, indi-
viduals from clades B and C are intermixed forming a com-
mon BC clade. A and BC clades are monophyletic with
reasonable support (PP = 97 and 80, respectively). Another
remarkable point here is the position of phased haplotypes
of specimen RS1023 from the left bank of Kafue River
(14.62°S, 26.19°E) found in different clades, A and BC,
suggesting hybrid origin of the individual. In RAG1 tree,
differentiation within S. campestris group is even weaker.
Clades A and combined BC are also monophyletic in the
maximum clade credibility tree, but with very low support
(PP = 0.39 and 0.65, respectively). B and C individuals are
again mixed within their common clade.
All short cytochrome b sequences as well as some mini-
barcodes from 454-pyrosequencing were associated with one
of the clades with high support (∑Aw ≥ 0.95). Six mini-bar-
codes were placed with varying support into different clades
as well as to branches ancestral to more than one clade and
were excluded from the analysis. Figure 3A shows geograph-
ical distribution of clades based on the complete cytochrome
b data set including also short sequences. It is clear that
S. campestris and S. mearnsi groups are allopatric, separated
by about 500-km-wide gap in central Tanzania, while within
both groups clades designated as candidate species are parap-
atric.
In S. campestris group, clade A is distributed over a vast
area in southern Africa, whereas B was recorded only from
central and north-eastern half of Zambia, south-western
Tanzania and northern Malawi and clade C is confined to
Fig. 2 Phylogeny of Saccostomus as estimated by Bayesian inference from sequences of cytochrome b, IRBP and RAG1 genes. Bayesian
posterior probabilities are indicated for the main clades. Vertical lines delimit major cytochrome b clades and their counterparts in IRBP
and RAG1 trees. Tips leading to individuals from cytochrome b clade C are always painted in violet to show their position within nuclear
gene trees. Phased haplotypes from the A9 BC heterozygote and the maximum likelihood placement of S. fuscus paralectotype are
indicated.
ª 2016 Royal Swedish Academy of Sciences, 45, 6, November 2016, pp 595–617 601
O. Mikula et al. � Diversity in rodent genus Saccostomus

90
Tatiana Aghová / Ph.D. dissertation (2018)
southern Malawi and the adjacent part of Mozambique.
Clades A and BC come into contact at the Kafue River and
Middle to Lower Zambezi, where A is generally present on
their right (western to southern) banks, whereas BC was
found on the left banks (eastern to northern). One individ-
ual having both A and BC haplotypes of IRBP was there-
fore found exactly at the contact line of these clades. It
should be also noted that in spite of being captured on the
left bank of the Kafue River, it possessed A haplotype of
cytochrome b, which might be also interpreted as an
instance of introgression. A single major outlier from this
parapatric pattern is paralectotype of S. fuscus from south-
ern Mozambique whose minibarcode is nested within B
(Fig. 3A). Clade C was found mostly eastward of Lake
Malawi and Shire River (Fig. 3A).
All three clades of S. campestris group show rather shal-
low internal branching. In clade A, however, there is still a
structure of three well defined (PP ≥ 0.79), although not
deeply divergent, subclades (A1–A3). While A1 (two haplo-
types recorded from the coasts of South African KwaZulu-
Natal) and A2 (six haplotypes in western part of Zambia)
are geographically very restricted, the third subclade (A3) is
far most widespread and comprises 51 haplotypes (Figs 2
and 3A). Within B no geographically distinct, close-to-
basal subclade was observed and clade C is a local cluster
of closely related sequences.
In S. mearnsi group, clade D is confined to the narrow
belt in northern Tanzania and south-west of Kenya,
whereas clade E is distributed across the Kenya to southern
Ethiopia and reaching South Sudan and southern Somalia,
where the limits of its distribution are unresolved (Fig. 3A).
The major geographical feature separating the known dis-
tributions of D and E is a mountain chain consisting of
Kilimanjaro, Pare and Usambara mountains. Although
being much less sampled, both D and E contain diver-
gences deeper than observed within clades of S. campestris
group. For example, two basal subclades are geographically
distinct in clade D, one (D1) including specimens from
southern Kenya and Serengeti region and the other one
(D2) from north-east Tanzania (Fig. 3A).
A B
Fig. 3 (A) Geographical distribution of major cytochrome b clades. Distribution of subclades within A and D is marked by thin links to
their labels, except for subclade A3 which comprises the rest of A haplotypes. Type locality of Saccostomus fuscus and sampling site of the
putative A9BC hybrid are also indicated. (B) Geographical distribution of the clades A, BC, D and E as estimated from morphometric data
and smoothed using thin-plate spline. Each point corresponds to a sampling site and colour intensity indicates strength of evidence for the
presence of particular clades (white colour corresponds to entirely ambiguous assignment). Type localities (yellow stars) and records from
central Tanzania (black arrows) are also shown (see more details in the text). Names of central Tanzanian localities are coloured according
to the likely assignment of the specimens.
602 ª 2016 Royal Swedish Academy of Sciences, 45, 6, November 2016, pp 595–617
Diversity in rodent genus Saccostomus � O. Mikula et al.
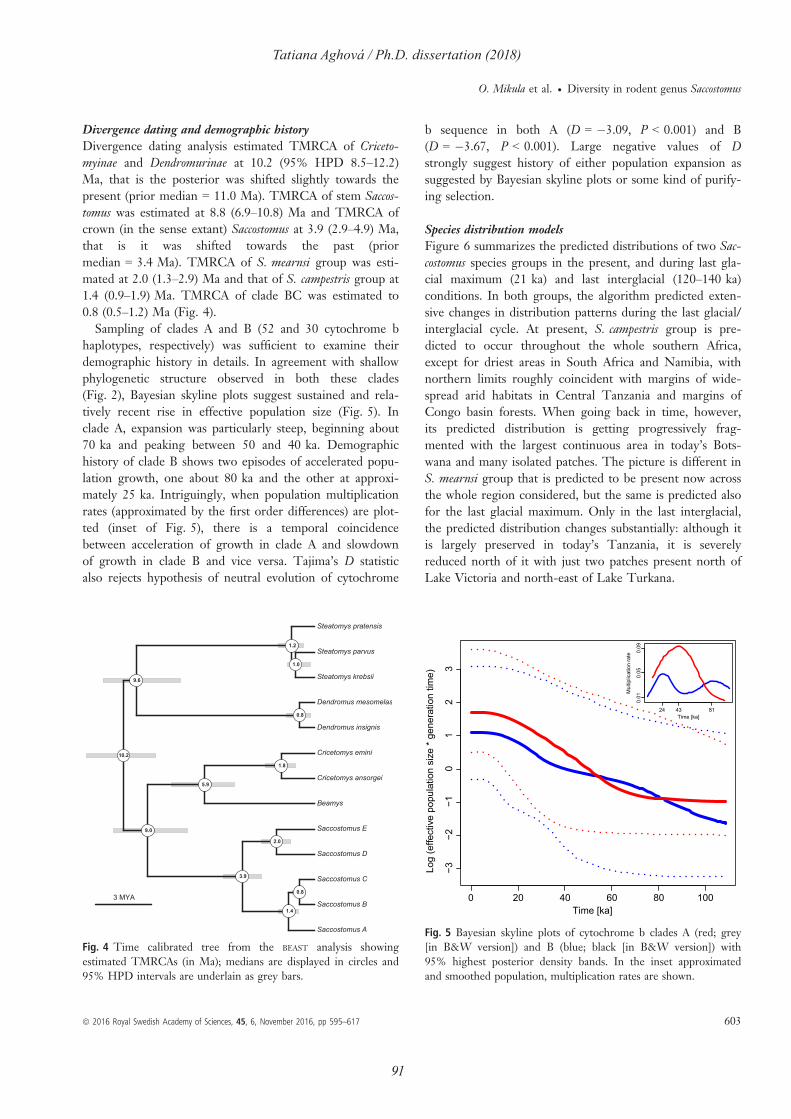
91
Tatiana Aghová / Ph.D. dissertation (2018)
Divergence dating and demographic history
Divergence dating analysis estimated TMRCA of Criceto-
myinae and Dendromurinae at 10.2 (95% HPD 8.5–12.2)
Ma, that is the posterior was shifted slightly towards the
present (prior median = 11.0 Ma). TMRCA of stem Saccos-
tomus was estimated at 8.8 (6.9–10.8) Ma and TMRCA of
crown (in the sense extant) Saccostomus at 3.9 (2.9–4.9) Ma,
that is it was shifted towards the past (prior
median = 3.4 Ma). TMRCA of S. mearnsi group was esti-
mated at 2.0 (1.3–2.9) Ma and that of S. campestris group at
1.4 (0.9–1.9) Ma. TMRCA of clade BC was estimated to
0.8 (0.5–1.2) Ma (Fig. 4).
Sampling of clades A and B (52 and 30 cytochrome b
haplotypes, respectively) was sufficient to examine their
demographic history in details. In agreement with shallow
phylogenetic structure observed in both these clades
(Fig. 2), Bayesian skyline plots suggest sustained and rela-
tively recent rise in effective population size (Fig. 5). In
clade A, expansion was particularly steep, beginning about
70 ka and peaking between 50 and 40 ka. Demographic
history of clade B shows two episodes of accelerated popu-
lation growth, one about 80 ka and the other at approxi-
mately 25 ka. Intriguingly, when population multiplication
rates (approximated by the first order differences) are plot-
ted (inset of Fig. 5), there is a temporal coincidence
between acceleration of growth in clade A and slowdown
of growth in clade B and vice versa. Tajima’s D statistic
also rejects hypothesis of neutral evolution of cytochrome
b sequence in both A (D = �3.09, P < 0.001) and B
(D = �3.67, P < 0.001). Large negative values of D
strongly suggest history of either population expansion as
suggested by Bayesian skyline plots or some kind of purify-
ing selection.
Species distribution models
Figure 6 summarizes the predicted distributions of two Sac-
costomus species groups in the present, and during last gla-
cial maximum (21 ka) and last interglacial (120–140 ka)
conditions. In both groups, the algorithm predicted exten-
sive changes in distribution patterns during the last glacial/
interglacial cycle. At present, S. campestris group is pre-
dicted to occur throughout the whole southern Africa,
except for driest areas in South Africa and Namibia, with
northern limits roughly coincident with margins of wide-
spread arid habitats in Central Tanzania and margins of
Congo basin forests. When going back in time, however,
its predicted distribution is getting progressively frag-
mented with the largest continuous area in today’s Bots-
wana and many isolated patches. The picture is different in
S. mearnsi group that is predicted to be present now across
the whole region considered, but the same is predicted also
for the last glacial maximum. Only in the last interglacial,
the predicted distribution changes substantially: although it
is largely preserved in today’s Tanzania, it is severely
reduced north of it with just two patches present north of
Lake Victoria and north-east of Lake Turkana.
Beamys
Cricetomys ansorgei
Cricetomys emini
Saccostomus A
Saccostomus B
Saccostomus C
Saccostomus D
Saccostomus E
Dendromus insignis
Dendromus mesomelas
Steatomys krebsii
Steatomys parvus
Steatomys pratensis
●
●
●
●
●
●
●
●
●
●
●
●
10.2
9.0
5.9
1.8
3.9
1.4
0.8
2.0
9.6
0.8
1.2
1.0
3 MYA
Fig. 4 Time calibrated tree from the BEAST analysis showing
estimated TMRCAs (in Ma); medians are displayed in circles and
95% HPD intervals are underlain as grey bars.
0 20 40 60 80 100
−3
−2
−1
01
23
Time [ka]
Log (
effective p
opula
tion s
ize *
genera
tion tim
e)
24 43 81
0.0
10
.05
0.0
9
Time [ka]
Mu
ltip
lica
tio
n r
ate
Fig. 5 Bayesian skyline plots of cytochrome b clades A (red; grey
[in B&W version]) and B (blue; black [in B&W version]) with
95% highest posterior density bands. In the inset approximated
and smoothed population, multiplication rates are shown.
ª 2016 Royal Swedish Academy of Sciences, 45, 6, November 2016, pp 595–617 603
O. Mikula et al. Diversity in rodent genus Saccostomus
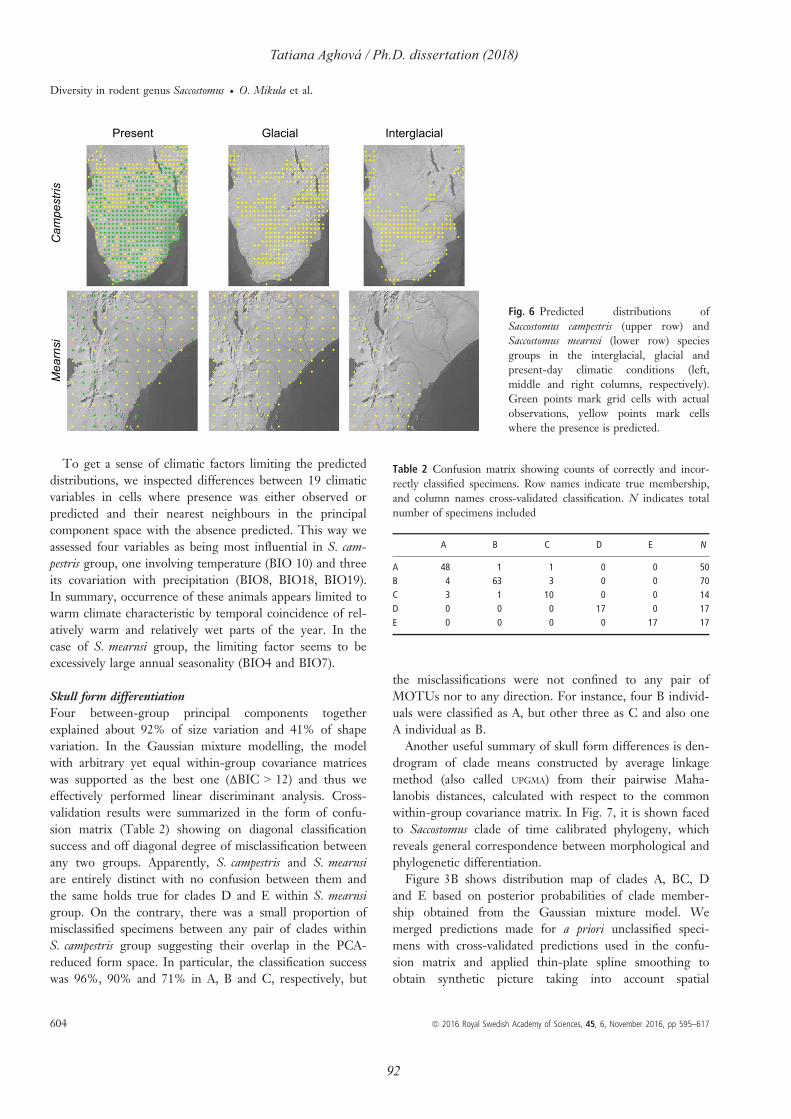
92
Tatiana Aghová / Ph.D. dissertation (2018)
To get a sense of climatic factors limiting the predicted
distributions, we inspected differences between 19 climatic
variables in cells where presence was either observed or
predicted and their nearest neighbours in the principal
component space with the absence predicted. This way we
assessed four variables as being most influential in S. cam-
pestris group, one involving temperature (BIO 10) and three
its covariation with precipitation (BIO8, BIO18, BIO19).
In summary, occurrence of these animals appears limited to
warm climate characteristic by temporal coincidence of rel-
atively warm and relatively wet parts of the year. In the
case of S. mearnsi group, the limiting factor seems to be
excessively large annual seasonality (BIO4 and BIO7).
Skull form differentiation
Four between-group principal components together
explained about 92% of size variation and 41% of shape
variation. In the Gaussian mixture modelling, the model
with arbitrary yet equal within-group covariance matrices
was supported as the best one (∆BIC > 12) and thus we
effectively performed linear discriminant analysis. Cross-
validation results were summarized in the form of confu-
sion matrix (Table 2) showing on diagonal classification
success and off diagonal degree of misclassification between
any two groups. Apparently, S. campestris and S. mearnsi
are entirely distinct with no confusion between them and
the same holds true for clades D and E within S. mearnsi
group. On the contrary, there was a small proportion of
misclassified specimens between any pair of clades within
S. campestris group suggesting their overlap in the PCA-
reduced form space. In particular, the classification success
was 96%, 90% and 71% in A, B and C, respectively, but
the misclassifications were not confined to any pair of
MOTUs nor to any direction. For instance, four B individ-
uals were classified as A, but other three as C and also one
A individual as B.
Another useful summary of skull form differences is den-
drogram of clade means constructed by average linkage
method (also called UPGMA) from their pairwise Maha-
lanobis distances, calculated with respect to the common
within-group covariance matrix. In Fig. 7, it is shown faced
to Saccostomus clade of time calibrated phylogeny, which
reveals general correspondence between morphological and
phylogenetic differentiation.
Figure 3B shows distribution map of clades A, BC, D
and E based on posterior probabilities of clade member-
ship obtained from the Gaussian mixture model. We
merged predictions made for a priori unclassified speci-
mens with cross-validated predictions used in the confu-
sion matrix and applied thin-plate spline smoothing to
obtain synthetic picture taking into account spatial
Campestris
Present Glacial Interglacial
Mearnsi
Fig. 6 Predicted distributions of
Saccostomus campestris (upper row) and
Saccostomus mearnsi (lower row) species
groups in the interglacial, glacial and
present-day climatic conditions (left,
middle and right columns, respectively).
Green points mark grid cells with actual
observations, yellow points mark cells
where the presence is predicted.
Table 2 Confusion matrix showing counts of correctly and incor-
rectly classified specimens. Row names indicate true membership,
and column names cross-validated classification. N indicates total
number of specimens included
A B C D E N
A 48 1 1 0 0 50
B 4 63 3 0 0 70
C 3 1 10 0 0 14
D 0 0 0 17 0 17
E 0 0 0 0 17 17
604 ª 2016 Royal Swedish Academy of Sciences, 45, 6, November 2016, pp 595–617
Diversity in rodent genus Saccostomus � O. Mikula et al.

93
Tatiana Aghová / Ph.D. dissertation (2018)
distribution of (mis-)classifications, including within-site
variation where multiple specimens from the same place
were present. The intensity of colour indicating strength
of evidence reveals a narrow belt along Kafue–Zambezi
where the most of ambiguous or contradicting classifica-
tions to either A or BC were located. The contact line
between A and BC is estimated to continue beyond
genetically investigated areas to Katanga region of Demo-
cratic Republic of Congo (DRC) and perhaps even to
Angola, although this is based on a single specimen
assigned to B. Distinction between D and E ranges is
pretty sharp predicting E to be present also in Uganda,
in the Coastal province of Kenya and in Mkomazi region
of Tanzania area on the northern side of Kilimanjaro–
Pare–Usambara mountain chain. In the Appendix S3, we
also present predicted membership to clades B and C.
Outside the known range of clade C, morphometric sup-
port for its presence was weak.
Figure 8 shows size variation within and between
MOTUs. Centroid sizes calculated on different skull sides
are highly correlated (r > 0.93) and just centroid size of
the dorsal side is therefore presented. Generally, skulls in
S. mearnsi group are larger than in S. campestris group, but
there is a huge variation within MOTUs, especially within
A, where the maximum size was recorded. On average,
skull size decreases from A to B to C in S. campestris and
from E to D in S. mearnsi group.
Skull shape features differentiated between successive
splits of major clades are depicted in Fig. 9. The two main
groups, S. campestris and S. mearnsi, differ in a number of
clearly distinct features. In particular, S. mearnsi group has
relatively narrower interorbital constriction, larger molars,
longer incisive foramens, as well as upward shifted zygo-
matic plate and differently shaped braincase, the latter
being evident on the posterior edge of squamosal and
occipital region of the skull. Clade A differed from BC by
several minor features – relatively smaller interparietal, dif-
ferently shaped auditory bullae and upward shifted skull
basis (seen on molars from the lateral view). Shape differ-
ences between B and C involved differently shaped zygo-
matic plate and relatively shorter incisive foramens in B.
Within S. mearnsi group clade E differed from D especially
by relative position of the posterior edge of squamosal,
skull basis and zygomatic arch.
Affinity of type specimens
Morphometric and where available also molecular classifi-
cation of type material is summarized in Table 3 and
Appendix S1, where further details about type localities are
provided. According to cytochrome b mini-barcodes,
S. lapidarius (Peters, 1852) was placed in clade A
(∑Aw = 1.00), whereas S. fuscus (Peters, 1852) in clade B
(∑Aw = 0.96).
Morphometric classifications are usually in accordance
with expectations based on location of type localities.
There are five exceptions from this: (i) Paralectotype of
S. fuscus (Peters, 1852) from southern Mozambique was
classified to C, which could relate to its small size, but it
could be also related to its genuine affinity to clade BC.
Overall, S. fuscus is special in all respect. Compared to the
Ma
xim
um
cla
de
cre
dib
ility
tre
e
De
nd
rog
ram
ba
se
d o
n M
aha
lan
ob
is d
ista
nce
sA
B
C
D
E
Fig. 7 Dendrogram summarizing Mahalanobis distances between
clade mean forms faced to Saccostomus clade from divergence
dating analysis.4
04
55
05
5
A B C D E
Ce
ntr
oid
siz
e [
mm
]
Fig. 8 Violin plots showing skull size variation within major
cytochrome b clades. Open black dots indicate median values,
violin shapes show probability densities obtained as kernel density
estimates and trimmed to the observed range of values.
ª 2016 Royal Swedish Academy of Sciences, 45, 6, November 2016, pp 595–617 605
O. Mikula et al. � Diversity in rodent genus Saccostomus
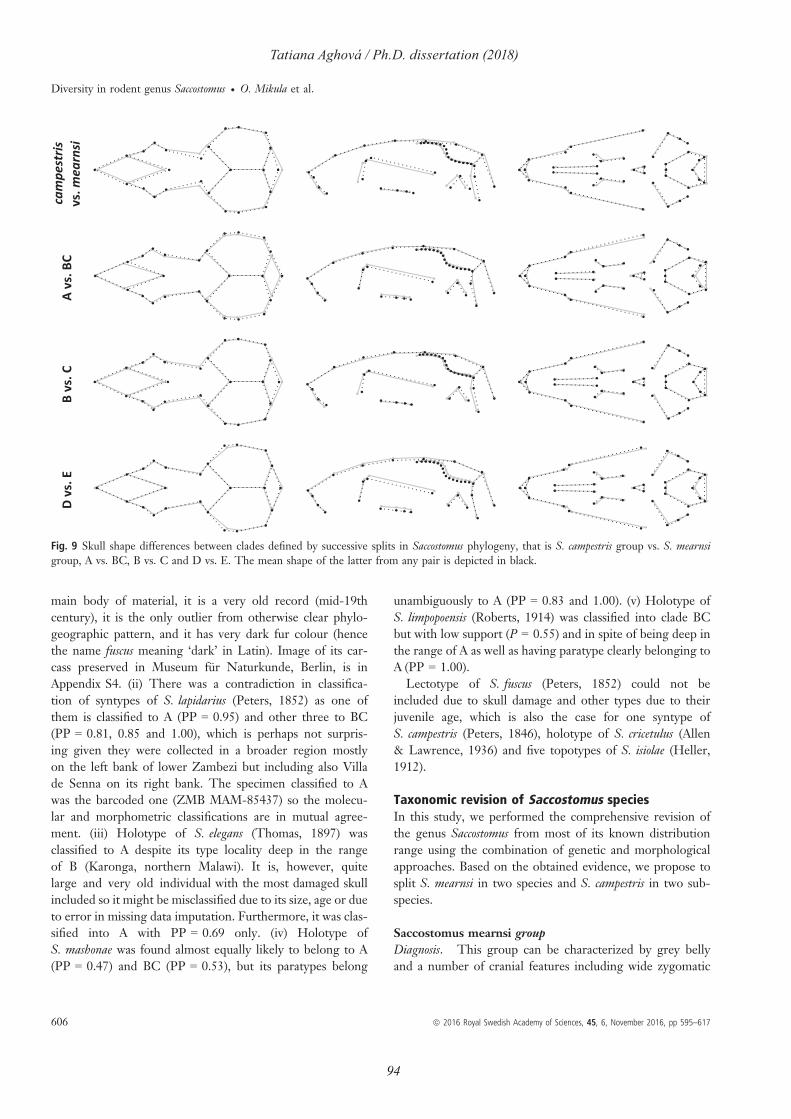
94
Tatiana Aghová / Ph.D. dissertation (2018)
main body of material, it is a very old record (mid-19th
century), it is the only outlier from otherwise clear phylo-
geographic pattern, and it has very dark fur colour (hence
the name fuscus meaning ‘dark’ in Latin). Image of its car-
cass preserved in Museum f€ur Naturkunde, Berlin, is in
Appendix S4. (ii) There was a contradiction in classifica-
tion of syntypes of S. lapidarius (Peters, 1852) as one of
them is classified to A (PP = 0.95) and other three to BC
(PP = 0.81, 0.85 and 1.00), which is perhaps not surpris-
ing given they were collected in a broader region mostly
on the left bank of lower Zambezi but including also Villa
de Senna on its right bank. The specimen classified to A
was the barcoded one (ZMB MAM-85437) so the molecu-
lar and morphometric classifications are in mutual agree-
ment. (iii) Holotype of S. elegans (Thomas, 1897) was
classified to A despite its type locality deep in the range
of B (Karonga, northern Malawi). It is, however, quite
large and very old individual with the most damaged skull
included so it might be misclassified due to its size, age or due
to error in missing data imputation. Furthermore, it was clas-
sified into A with PP = 0.69 only. (iv) Holotype of
S. mashonae was found almost equally likely to belong to A
(PP = 0.47) and BC (PP = 0.53), but its paratypes belong
unambiguously to A (PP = 0.83 and 1.00). (v) Holotype of
S. limpopoensis (Roberts, 1914) was classified into clade BC
but with low support (P = 0.55) and in spite of being deep in
the range of A as well as having paratype clearly belonging to
A (PP = 1.00).
Lectotype of S. fuscus (Peters, 1852) could not be
included due to skull damage and other types due to their
juvenile age, which is also the case for one syntype of
S. campestris (Peters, 1846), holotype of S. cricetulus (Allen
& Lawrence, 1936) and five topotypes of S. isiolae (Heller,
1912).
Taxonomic revision of Saccostomus species
In this study, we performed the comprehensive revision of
the genus Saccostomus from most of its known distribution
range using the combination of genetic and morphological
approaches. Based on the obtained evidence, we propose to
split S. mearnsi in two species and S. campestris in two sub-
species.
Saccostomus mearnsi group
Diagnosis. This group can be characterized by grey belly
and a number of cranial features including wide zygomatic
● ● ● ● ●
●
●
●
●
●
●
● ●
●
●
●
●
●
●
●
●
● ●
●
●
● ● ● ● ●
●
●
●
●
●
●
●●
●
●
●
●
●
●
●
●
●●
●
●
●
●
●
●
●
●
●
● ● ● ●
●
●
●
●
●
●
●
●
●
●
●
●
●●
●● ● ● ● ●●
●
●
●●
● ● ● ● ●
●
●
●
●
●
●●
●● ●
●
●
●
●
●
●
●
●
●
●
●
●
●
● ●
●● ● ● ● ●
●
●
●
●●
● ● ● ● ●
● ● ● ● ●
●
● ●
●
●
●
●●
●
●
●
●
●
●
●
●
●
●
●
● ●
●
●
●
●●
●
●
●
●
●
●
●
●
●
●
● ● ● ● ●
●
● ●
●
●
●
●●
●
●
●
●
●
●
●
●
●●
●
● ●
●
●
●
●●
●
●
●
●
●
●
●
●
●●
● ● ● ● ●
●
●
●
●
●
●
●●
●
●
●
●
●
●
●
●
●●
●
●
● ● ● ● ●
●
●
●
●
●
●
● ●
●
●
●
●
●
●
●
●
● ●
●
●
●
●
●
●
●
●
●
●● ● ●
●
●
●
●
●
●
●
●
●
●
●
●
● ●●● ● ● ● ●
●
●
●
●●
●● ● ● ●
●
●
●
●
●
●●
● ● ● ●
●
●
●
●
●
●
●
●
●
●
●
●
●●
●● ● ● ● ●●
●
●
●●
● ● ● ● ●
● ● ● ● ●
●
● ●
●
●
●
●●
●
●
●
●
●
●
●
●
●●
●
● ●
●
●
●
●●
●
●
●
●
●
●
●
●
●●
● ● ● ● ●
●
● ●
●
●
●
●●
●
●
●
●
●
●
●
●
●
●
●
● ●
●
●
●
●●
●
●
●
●
●
●
●
●
●
●
● ● ● ● ●
●
●
●
●
●
●
● ●
●
●
●
●
●
●
●
●
● ●
●
●
● ● ● ● ●
●
●
●
●
●
●
● ●
●
●
●
●
●
●
●
●
● ●
●
●
●
●
●
●
●
●●
● ● ● ●
●
●
●
●
●
●
●
●
●
●
●
●
●●
●● ● ● ● ●●
●
●
●●
● ● ● ● ●
●
●
●
●
●
●
●
●● ●
●
●
●
●
●
●
●
●
●
●
●
●
●
● ●
●● ● ● ● ●
●●
●
●●
●● ● ● ●
● ● ● ● ●
●
● ●
●
●
●
●●
●
●
●
●
●
●
●
●
●
●
●
● ●
●
●
●
●●
●
●
●
●
●
●
●
●
●
●
● ● ● ● ●
●
●●
●
●
●
●●
●
●
●
●
●
●
●
●
●
●
●
●●
●
●
●
●●
●
●
●
●
●
●
●
●
●
●
● ● ● ● ●
●
●
●
●
●
●
●●
●
●
●
●
●
●
●
●
●●
●
●
● ● ● ● ●
●
●
●
●
●
●
● ●
●
●
●
●
●
●
●
●
● ●
●
●
●
●
●
●
●
●
●
●● ●
●
●
●
●
●
●
●
●
●
●
●
●
●
● ●
●● ● ● ● ● ●●
●
●●
● ● ● ● ●
●
●
●
●
●
●●
●● ● ●
●
●
●
●
●
●
●
●
●
●
●
●
● ●●● ● ● ● ●
●
●
●
●●
●● ● ● ●
● ● ● ● ●
●
●●
●
●
●
●●
●
●
●
●
●
●
●
●
●
●
●
●●
●
●
●
●●
●
●
●
●
●
●
●
●
●
●
● ● ● ● ●
●
● ●
●
●
●
●●
●
●
●
●
●
●
●
●
●
●
●
● ●
●
●
●
●●
●
●
●
●
●
●
●
●
●
●
campestris
vs. mearnsi
A v
s.
BC
B v
s.
CD
vs.
E
Fig. 9 Skull shape differences between clades defined by successive splits in Saccostomus phylogeny, that is S. campestris group vs. S. mearnsi
group, A vs. BC, B vs. C and D vs. E. The mean shape of the latter from any pair is depicted in black.
606 ª 2016 Royal Swedish Academy of Sciences, 45, 6, November 2016, pp 595–617
Diversity in rodent genus Saccostomus � O. Mikula et al.
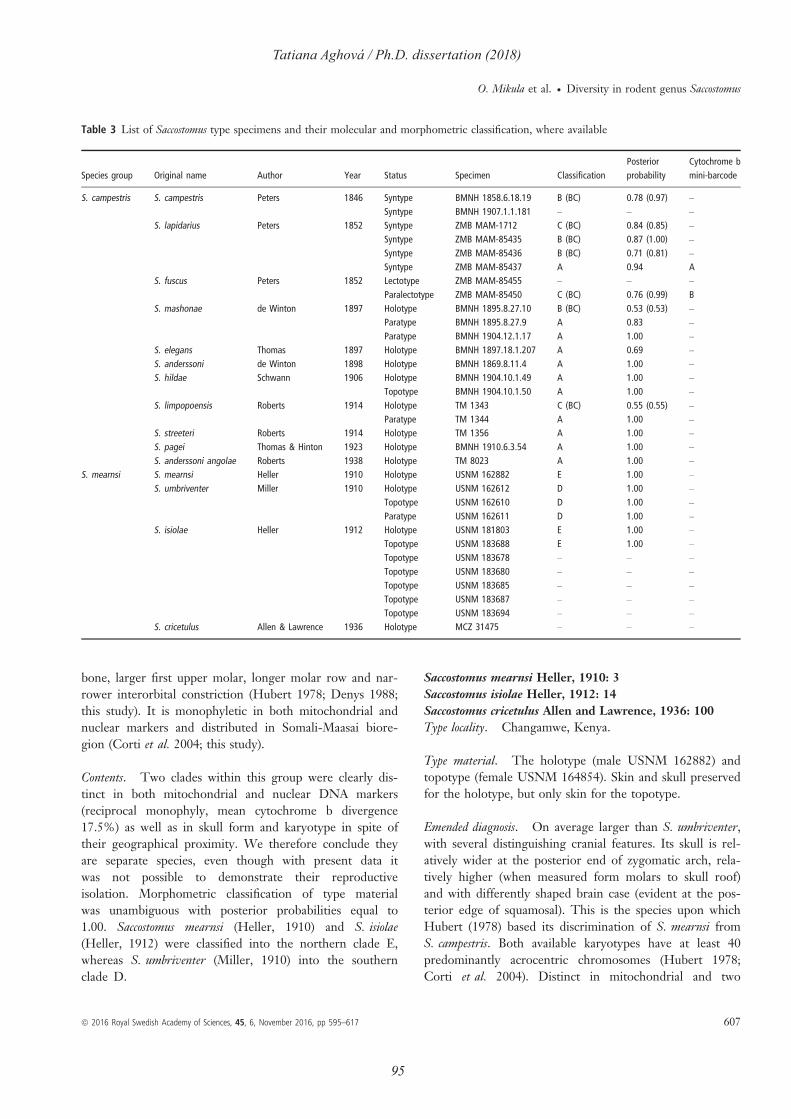
95
Tatiana Aghová / Ph.D. dissertation (2018)
bone, larger first upper molar, longer molar row and nar-
rower interorbital constriction (Hubert 1978; Denys 1988;
this study). It is monophyletic in both mitochondrial and
nuclear markers and distributed in Somali-Maasai biore-
gion (Corti et al. 2004; this study).
Contents. Two clades within this group were clearly dis-
tinct in both mitochondrial and nuclear DNA markers
(reciprocal monophyly, mean cytochrome b divergence
17.5%) as well as in skull form and karyotype in spite of
their geographical proximity. We therefore conclude they
are separate species, even though with present data it
was not possible to demonstrate their reproductive
isolation. Morphometric classification of type material
was unambiguous with posterior probabilities equal to
1.00. Saccostomus mearnsi (Heller, 1910) and S. isiolae
(Heller, 1912) were classified into the northern clade E,
whereas S. umbriventer (Miller, 1910) into the southern
clade D.
Saccostomus mearnsi Heller, 1910: 3
Saccostomus isiolae Heller, 1912: 14
Saccostomus cricetulus Allen and Lawrence, 1936: 100
Type locality. Changamwe, Kenya.
Type material. The holotype (male USNM 162882) and
topotype (female USNM 164854). Skin and skull preserved
for the holotype, but only skin for the topotype.
Emended diagnosis. On average larger than S. umbriventer,
with several distinguishing cranial features. Its skull is rel-
atively wider at the posterior end of zygomatic arch, rela-
tively higher (when measured form molars to skull roof)
and with differently shaped brain case (evident at the pos-
terior edge of squamosal). This is the species upon which
Hubert (1978) based its discrimination of S. mearnsi from
S. campestris. Both available karyotypes have at least 40
predominantly acrocentric chromosomes (Hubert 1978;
Corti et al. 2004). Distinct in mitochondrial and two
Table 3 List of Saccostomus type specimens and their molecular and morphometric classification, where available
Species group Original name Author Year Status Specimen Classification
Posterior
probability
Cytochrome b
mini-barcode
S. campestris S. campestris Peters 1846 Syntype BMNH 1858.6.18.19 B (BC) 0.78 (0.97) –
Syntype BMNH 1907.1.1.181 – – –
S. lapidarius Peters 1852 Syntype ZMB MAM-1712 C (BC) 0.84 (0.85) –
Syntype ZMB MAM-85435 B (BC) 0.87 (1.00) –
Syntype ZMB MAM-85436 B (BC) 0.71 (0.81) –
Syntype ZMB MAM-85437 A 0.94 A
S. fuscus Peters 1852 Lectotype ZMB MAM-85455 – – –
Paralectotype ZMB MAM-85450 C (BC) 0.76 (0.99) B
S. mashonae de Winton 1897 Holotype BMNH 1895.8.27.10 B (BC) 0.53 (0.53) –
Paratype BMNH 1895.8.27.9 A 0.83 –
Paratype BMNH 1904.12.1.17 A 1.00 –
S. elegans Thomas 1897 Holotype BMNH 1897.18.1.207 A 0.69 –
S. anderssoni de Winton 1898 Holotype BMNH 1869.8.11.4 A 1.00 –
S. hildae Schwann 1906 Holotype BMNH 1904.10.1.49 A 1.00 –
Topotype BMNH 1904.10.1.50 A 1.00 –
S. limpopoensis Roberts 1914 Holotype TM 1343 C (BC) 0.55 (0.55) –
Paratype TM 1344 A 1.00 –
S. streeteri Roberts 1914 Holotype TM 1356 A 1.00 –
S. pagei Thomas & Hinton 1923 Holotype BMNH 1910.6.3.54 A 1.00 –
S. anderssoni angolae Roberts 1938 Holotype TM 8023 A 1.00 –
S. mearnsi S. mearnsi Heller 1910 Holotype USNM 162882 E 1.00 –
S. umbriventer Miller 1910 Holotype USNM 162612 D 1.00 –
Topotype USNM 162610 D 1.00 –
Paratype USNM 162611 D 1.00 –
S. isiolae Heller 1912 Holotype USNM 181803 E 1.00 –
Topotype USNM 183688 E 1.00 –
Topotype USNM 183678 – – –
Topotype USNM 183680 – – –
Topotype USNM 183685 – – –
Topotype USNM 183687 – – –
Topotype USNM 183694 – – –
S. cricetulus Allen & Lawrence 1936 Holotype MCZ 31475 – – –
ª 2016 Royal Swedish Academy of Sciences, 45, 6, November 2016, pp 595–617 607
O. Mikula et al. � Diversity in rodent genus Saccostomus

96
Tatiana Aghová / Ph.D. dissertation (2018)
nuclear markers; it corresponds to genetic clade E in this
study.
Distribution. Somali-Maasai bioregion, from northern-
most Tanzania across Kenya to southern Ethiopia and
Somalia, South Sudan and eastern Uganda (Fig. 3). The
precise distribution in South Sudan, Uganda and Somalia
is unresolved. It has parapatric distribution with S. um-
briventer in north-eastern Tanzania and south-western
Kenya, where the two species can meet, but such evidence
is missing.
Notes. Since its first collection (28.11.1909 by E. A.
Mearns), it has never been recorded from the same area,
now Coast Province of Kenya. The holotype of S. cricetulus
(MCZ 31475) is juvenile and its skull is broken but accord-
ing to its type locality in Uganda it was classified to
S. mearnsi rather than S. umbriventer.
Ecological remarks. Dominant rodent species in wooded
grasslands of central Kenya (Mpala Research Center; Kees-
ing 1998a), but it was found by us also in more open grass-
lands in northern Kenya (near Marsabit) and southern
Ethiopia. Extensively studied with respect to its behaviour,
dietary preferences and determinants of its population den-
sity (Keesing 1998b; Metz & Keesing 2001; Keesing &
Young 2014).
Saccostomus umbriventer Miller, 1910: 1
Type locality. Njori Osolali, Guaso Nyiro (now Ewaso
Ngiro), Sotik, Kenya.
Type material. The holotype (female USNM 162612),
two paratypes (females USNM 162611 and 162613) and a
topotype (USNM 162610). Skin and skull preserved for all
of them except for the paratype USNM 162613 whose
skull is unaccounted for.
Emended diagnosis. For its discrimination from S. mearnsi,
see the account of that species. The single available kary-
otype has 2n = 32 with multiple metacentric chromosomes
(Corti et al. 2004). Distinct in mitochondrial and two
nuclear markers; it corresponds to genetic clade D in this
study.
Note. The populations from Massai Steppe in northern
Tanzania were proposed as separate species already by
Denys (1988) and Corti et al. (2004). However, it was sug-
gested by the latter authors to differ from the S. umbriven-
ter type (without providing more details). Geometric
morphometric analysis in our study clearly assigned S. um-
briventer types to genetic clade D that involves also
specimens mentioned by Corti et al. (2004). This is also
consistent with our recent records of specimens belonging
to clade D near the type locality of S. umbriventer in
south-western Kenya.
Distribution. Somali-Maasai bioregion, in a narrow belt in
northern Tanzania and south-western Kenya. Parapatric to
S. mearnsi – see the account of that species.
Ecological remarks. Its record is mostly anecdotal but a lar-
ger sample from Kijungu (=Kujungu, north-eastern Tanza-
nia) in AMNH collections suggests it may be locally
abundant. The other larger sample comes from pellets col-
lected by Reed (2007) in Serengeti, where S. umbriventer
represented 2–3% of small mammals. In our recent trap-
ping in north-western Tanzania, it was the only species
being captured together with Mastomys natalensis in a
mosaic of fields and Massai Steppe.
Saccostomus campestris group
Diagnosis. This group can be characterized by white belly
(apart from aberrant type of S. fuscus) and a number of cra-
nial features including narrow zygomatic bone, relatively
shorter molar row, larger interparietal and wider interor-
bital constriction (Hubert 1978; Denys 1988; this study). It
is monophyletic on both mitochondrial and nuclear mark-
ers and distributed in Zambezian and South African biore-
gions (Corti et al. 2004; this study).
Contents. The genetic clades A, B and C within S. cam-
pestris group were not as strikingly distinct as those
within S. mearnsi group. From the perspective of nuclear
markers, clades A and BC are reciprocally monophyletic
in maximum clade credibility trees but with low support
and clades B and C are not distinct at all. Morphologi-
cally, A, B and C were comparably, yet incompletely dif-
ferentiated from each other and two nuclear genes
supported only split between clades A and BC. On the
other hand, a degree of reproductive isolation is likely
present between A and BC, given coincidence of their
contact with Zambezi–Kafue water flows and congruence
of mitochondrial and nuclear DNA variation, both in face
of episodic evidence of hybridization. Therefore, we sug-
gest clades A and BC to be referred as subspecies unless
it will be convincingly demonstrated they deserve species
status. Morphometric discrimination, even though not
perfect, was still good enough to be useful for classifica-
tion of type material. The oldest available name for BC
clade is shown to be S. campestris (Peters, 1846), as its
syntype belongs to BC with PP = 0.97 (sum of PPs for
B and C) and the oldest name for A clade is S. mashonae
(de Winton, 1897), whose holotype belongs to A with
608 ª 2016 Royal Swedish Academy of Sciences, 45, 6, November 2016, pp 595–617
Diversity in rodent genus Saccostomus � O. Mikula et al.
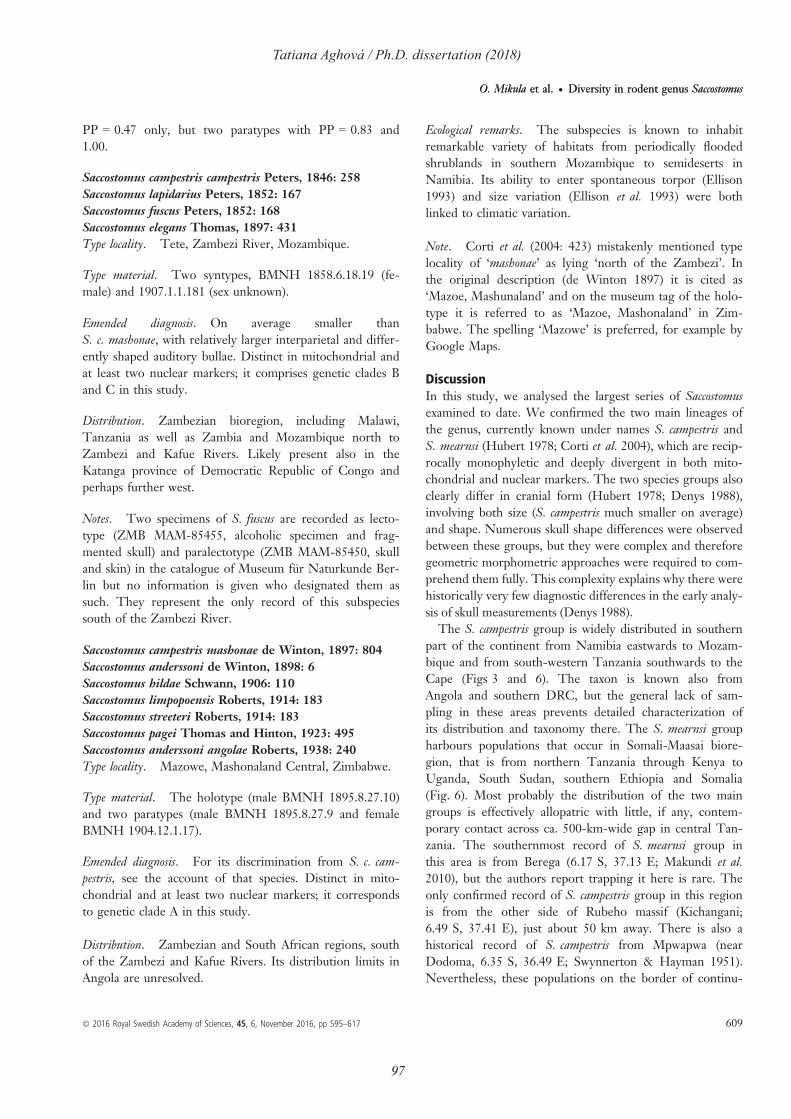
97
Tatiana Aghová / Ph.D. dissertation (2018)
PP = 0.47 only, but two paratypes with PP = 0.83 and
1.00.
Saccostomus campestris campestris Peters, 1846: 258
Saccostomus lapidarius Peters, 1852: 167
Saccostomus fuscus Peters, 1852: 168
Saccostomus elegans Thomas, 1897: 431
Type locality. Tete, Zambezi River, Mozambique.
Type material. Two syntypes, BMNH 1858.6.18.19 (fe-
male) and 1907.1.1.181 (sex unknown).
Emended diagnosis. On average smaller than
S. c. mashonae, with relatively larger interparietal and differ-
ently shaped auditory bullae. Distinct in mitochondrial and
at least two nuclear markers; it comprises genetic clades B
and C in this study.
Distribution. Zambezian bioregion, including Malawi,
Tanzania as well as Zambia and Mozambique north to
Zambezi and Kafue Rivers. Likely present also in the
Katanga province of Democratic Republic of Congo and
perhaps further west.
Notes. Two specimens of S. fuscus are recorded as lecto-
type (ZMB MAM-85455, alcoholic specimen and frag-
mented skull) and paralectotype (ZMB MAM-85450, skull
and skin) in the catalogue of Museum f€ur Naturkunde Ber-
lin but no information is given who designated them as
such. They represent the only record of this subspecies
south of the Zambezi River.
Saccostomus campestris mashonae de Winton, 1897: 804
Saccostomus anderssoni de Winton, 1898: 6
Saccostomus hildae Schwann, 1906: 110
Saccostomus limpopoensis Roberts, 1914: 183
Saccostomus streeteri Roberts, 1914: 183
Saccostomus pagei Thomas and Hinton, 1923: 495
Saccostomus anderssoni angolae Roberts, 1938: 240
Type locality. Mazowe, Mashonaland Central, Zimbabwe.
Type material. The holotype (male BMNH 1895.8.27.10)
and two paratypes (male BMNH 1895.8.27.9 and female
BMNH 1904.12.1.17).
Emended diagnosis. For its discrimination from S. c. cam-
pestris, see the account of that species. Distinct in mito-
chondrial and at least two nuclear markers; it corresponds
to genetic clade A in this study.
Distribution. Zambezian and South African regions, south
of the Zambezi and Kafue Rivers. Its distribution limits in
Angola are unresolved.
Ecological remarks. The subspecies is known to inhabit
remarkable variety of habitats from periodically flooded
shrublands in southern Mozambique to semideserts in
Namibia. Its ability to enter spontaneous torpor (Ellison
1993) and size variation (Ellison et al. 1993) were both
linked to climatic variation.
Note. Corti et al. (2004: 423) mistakenly mentioned type
locality of ‘mashonae’ as lying ‘north of the Zambezi’. In
the original description (de Winton 1897) it is cited as
‘Mazoe, Mashunaland’ and on the museum tag of the holo-
type it is referred to as ‘Mazoe, Mashonaland’ in Zim-
babwe. The spelling ‘Mazowe’ is preferred, for example by
Google Maps.
Discussion
In this study, we analysed the largest series of Saccostomus
examined to date. We confirmed the two main lineages of
the genus, currently known under names S. campestris and
S. mearnsi (Hubert 1978; Corti et al. 2004), which are recip-
rocally monophyletic and deeply divergent in both mito-
chondrial and nuclear markers. The two species groups also
clearly differ in cranial form (Hubert 1978; Denys 1988),
involving both size (S. campestris much smaller on average)
and shape. Numerous skull shape differences were observed
between these groups, but they were complex and therefore
geometric morphometric approaches were required to com-
prehend them fully. This complexity explains why there were
historically very few diagnostic differences in the early analy-
sis of skull measurements (Denys 1988).
The S. campestris group is widely distributed in southern
part of the continent from Namibia eastwards to Mozam-
bique and from south-western Tanzania southwards to the
Cape (Figs 3 and 6). The taxon is known also from
Angola and southern DRC, but the general lack of sam-
pling in these areas prevents detailed characterization of
its distribution and taxonomy there. The S. mearnsi group
harbours populations that occur in Somali-Maasai biore-
gion, that is from northern Tanzania through Kenya to
Uganda, South Sudan, southern Ethiopia and Somalia
(Fig. 6). Most probably the distribution of the two main
groups is effectively allopatric with little, if any, contem-
porary contact across ca. 500-km-wide gap in central Tan-
zania. The southernmost record of S. mearnsi group in
this area is from Berega (6.17 S, 37.13 E; Makundi et al.
2010), but the authors report trapping it here is rare. The
only confirmed record of S. campestris group in this region
is from the other side of Rubeho massif (Kichangani;
6.49 S, 37.41 E), just about 50 km away. There is also a
historical record of S. campestris from Mpwapwa (near
Dodoma, 6.35 S, 36.49 E; Swynnerton & Hayman 1951).
Nevertheless, these populations on the border of continu-
O. Mikula et al. � Diversity in rodent genus Saccostomus
ª 2016 Royal Swedish Academy of Sciences, 45, 6, November 2016, pp 595–617 609
O. Mikula et al. � Diversity in rodent genus Saccostomus
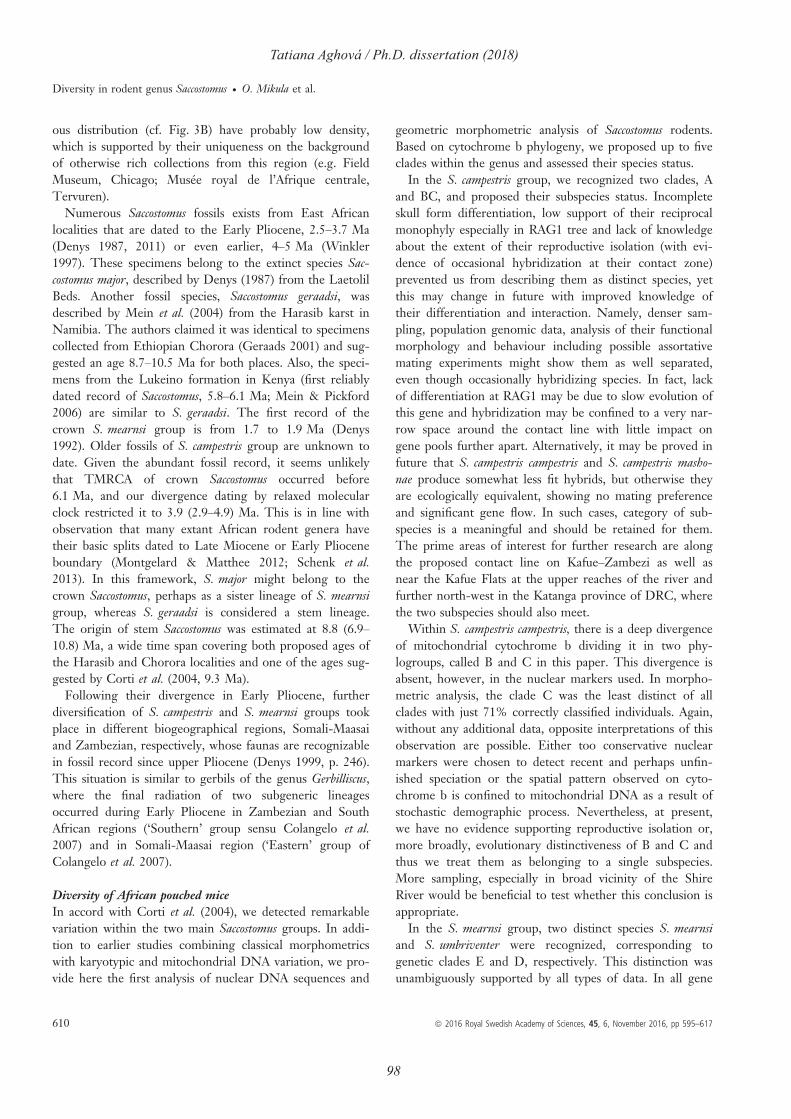
98
Tatiana Aghová / Ph.D. dissertation (2018)
ous distribution (cf. Fig. 3B) have probably low density,
which is supported by their uniqueness on the background
of otherwise rich collections from this region (e.g. Field
Museum, Chicago; Mus�ee royal de l’Afrique centrale,
Tervuren).
Numerous Saccostomus fossils exists from East African
localities that are dated to the Early Pliocene, 2.5–3.7 Ma
(Denys 1987, 2011) or even earlier, 4–5 Ma (Winkler
1997). These specimens belong to the extinct species Sac-
costomus major, described by Denys (1987) from the Laetolil
Beds. Another fossil species, Saccostomus geraadsi, was
described by Mein et al. (2004) from the Harasib karst in
Namibia. The authors claimed it was identical to specimens
collected from Ethiopian Chorora (Geraads 2001) and sug-
gested an age 8.7–10.5 Ma for both places. Also, the speci-
mens from the Lukeino formation in Kenya (first reliably
dated record of Saccostomus, 5.8–6.1 Ma; Mein & Pickford
2006) are similar to S. geraadsi. The first record of the
crown S. mearnsi group is from 1.7 to 1.9 Ma (Denys
1992). Older fossils of S. campestris group are unknown to
date. Given the abundant fossil record, it seems unlikely
that TMRCA of crown Saccostomus occurred before
6.1 Ma, and our divergence dating by relaxed molecular
clock restricted it to 3.9 (2.9–4.9) Ma. This is in line with
observation that many extant African rodent genera have
their basic splits dated to Late Miocene or Early Pliocene
boundary (Montgelard & Matthee 2012; Schenk et al.
2013). In this framework, S. major might belong to the
crown Saccostomus, perhaps as a sister lineage of S. mearnsi
group, whereas S. geraadsi is considered a stem lineage.
The origin of stem Saccostomus was estimated at 8.8 (6.9–
10.8) Ma, a wide time span covering both proposed ages of
the Harasib and Chorora localities and one of the ages sug-
gested by Corti et al. (2004, 9.3 Ma).
Following their divergence in Early Pliocene, further
diversification of S. campestris and S. mearnsi groups took
place in different biogeographical regions, Somali-Maasai
and Zambezian, respectively, whose faunas are recognizable
in fossil record since upper Pliocene (Denys 1999, p. 246).
This situation is similar to gerbils of the genus Gerbilliscus,
where the final radiation of two subgeneric lineages
occurred during Early Pliocene in Zambezian and South
African regions (‘Southern’ group sensu Colangelo et al.
2007) and in Somali-Maasai region (‘Eastern’ group of
Colangelo et al. 2007).
Diversity of African pouched mice
In accord with Corti et al. (2004), we detected remarkable
variation within the two main Saccostomus groups. In addi-
tion to earlier studies combining classical morphometrics
with karyotypic and mitochondrial DNA variation, we pro-
vide here the first analysis of nuclear DNA sequences and
geometric morphometric analysis of Saccostomus rodents.
Based on cytochrome b phylogeny, we proposed up to five
clades within the genus and assessed their species status.
In the S. campestris group, we recognized two clades, A
and BC, and proposed their subspecies status. Incomplete
skull form differentiation, low support of their reciprocal
monophyly especially in RAG1 tree and lack of knowledge
about the extent of their reproductive isolation (with evi-
dence of occasional hybridization at their contact zone)
prevented us from describing them as distinct species, yet
this may change in future with improved knowledge of
their differentiation and interaction. Namely, denser sam-
pling, population genomic data, analysis of their functional
morphology and behaviour including possible assortative
mating experiments might show them as well separated,
even though occasionally hybridizing species. In fact, lack
of differentiation at RAG1 may be due to slow evolution of
this gene and hybridization may be confined to a very nar-
row space around the contact line with little impact on
gene pools further apart. Alternatively, it may be proved in
future that S. campestris campestris and S. campestris masho-
nae produce somewhat less fit hybrids, but otherwise they
are ecologically equivalent, showing no mating preference
and significant gene flow. In such cases, category of sub-
species is a meaningful and should be retained for them.
The prime areas of interest for further research are along
the proposed contact line on Kafue–Zambezi as well as
near the Kafue Flats at the upper reaches of the river and
further north-west in the Katanga province of DRC, where
the two subspecies should also meet.
Within S. campestris campestris, there is a deep divergence
of mitochondrial cytochrome b dividing it in two phy-
logroups, called B and C in this paper. This divergence is
absent, however, in the nuclear markers used. In morpho-
metric analysis, the clade C was the least distinct of all
clades with just 71% correctly classified individuals. Again,
without any additional data, opposite interpretations of this
observation are possible. Either too conservative nuclear
markers were chosen to detect recent and perhaps unfin-
ished speciation or the spatial pattern observed on cyto-
chrome b is confined to mitochondrial DNA as a result of
stochastic demographic process. Nevertheless, at present,
we have no evidence supporting reproductive isolation or,
more broadly, evolutionary distinctiveness of B and C and
thus we treat them as belonging to a single subspecies.
More sampling, especially in broad vicinity of the Shire
River would be beneficial to test whether this conclusion is
appropriate.
In the S. mearnsi group, two distinct species S. mearnsi
and S. umbriventer were recognized, corresponding to
genetic clades E and D, respectively. This distinction was
unambiguously supported by all types of data. In all gene
610 ª 2016 Royal Swedish Academy of Sciences, 45, 6, November 2016, pp 595–617
Diversity in rodent genus Saccostomus � O. Mikula et al.
99
Tatiana Aghová / Ph.D. dissertation (2018)
trees, they were reciprocally monophyletic with PP = 1.00
and their skull form is so distinct that all specimens were
correctly classified. At the same time, they occur in a close
geographical proximity and so they most likely represent
well-separated species. Nevertheless, it would be still desir-
able and interesting to study them in direct contact that
should take place in south-western Kenya and possibly also
in north-eastern Tanzania.
In both main groups of Saccostomus, there is large kary-
otypic variability that was earlier proposed to serve as a
basis for species delimitations (Gordon & Watson 1986).
In the S. campestris group, diploid number of chromosomes
(2n) varies from 32 to 46 (reviewed by Corti et al. 2004;
Maputla 2008), but most of this variability was due to
Robertsonian fan in S. campestris mashonae (Gordon &
Rautenbach 1980). However, Corti et al. (2004, 2005) also
described conservative G- and C-banded karyotypes
(2n = 44) from southern Tanzania and northern Zambia
(S. campestris campestris). It is therefore evident that in this
group there is no clear relationship between DNA-based
phylogenetic clades and karyotypic variability. Further-
more, absence of evidence for hybrid disadvantage in
hybridization experiments in populations with 2n = 32 and
2n = 46 (Maputla et al. 2011) suggests that karyotypes are
unlikely to play important role in speciation of Saccostomus.
The first karyotypes, although low quality, for the
S. mearnsi group were provided by Hubert (1978) from
individuals in southern Ethiopia (2n = 40–42). More
recently, Corti et al. (2004) provided two very distinct kary-
otypes from Somalia (2n = 44) and northern Tanzania
(2n = 32). Both have NFa = 44 (incorrectly reported in
their Table 1 as 42 or 48), and even if the banding pattern
was not provided for the Somali individual, the changes
between the karyotypes can be explained by multiple
Robertsonian fusions. Therefore, variability of karyotypes
is consistent with our phylogenetic reconstructions. The
northern species S. mearnsi has high numbers of predomi-
nantly acrocentric chromosomes and the southern species
S. umbriventer has 2n = 32 with seven pairs of biarmed
chromosomes (Corti et al. 2004). It does not imply, how-
ever, that chromosomal evolution is driving speciation here.
Robertsonian fusions may have no direct impact on repro-
ductive success (Maputla et al. 2011; Horn et al. 2012), and
we are also unaware of actual karyotypic variability within
either of the species.
Phylogeographic scenarios for S. campestris group
Representatives of the S. campestris group are widespread,
closely associated with drier habitat types (woodlands,
grassland and scrubland savannah), abundant and easy to
capture providing an excellent opportunity to use them as
phylogeographic models for analyses of historical processes
affecting evolution of biota in the Zambezian bioregion.
This region provides rich information about fossil Mam-
malian fauna (Werdelin & Sanders 2010), paleoclimatic
variables for the last 5 Ma (de Menocal 2004; Trauth et al.
2010; Potts 2013; etc.), and drainage evolution data (Stan-
kiewicz & de Wit 2006; Moore et al. 2007, 2012). The
Pleistocene splits within the S. campestris group are dated
to intervals 1.9–0.9 Ma (S. c. campestris vs. S. c. mashonae)
and 1.2–0.5 Ma (clades B and C within S. c. campestris). In
this time span, two periods of high climatic variability took
place (Potts 2013), promoting diversification and speciation
by rapid and repeated shifts, merger and fragmentation of
suitable habitats. Also emerging and disappearing geomor-
phological features like paleolake Deception in the area of
recent Okavango delta and Chambeshi–Kafue–Zambezi
River system (Moore et al. 2012) might play a role in frag-
mentation of ancestral distribution area of S. campestris
group.
Today, S. c. campestris and S. c. mashonae are separated
by the Zambezi and Kafue Rivers. These two rivers are
obvious barriers to gene flow and have been implicated in
shaping genetic diversity in organisms as diverse as killi-
fishes (Bart�akov�a et al. 2015), gerbils (McDonough et al.
2015), baboons (Keller et al. 2010) and several species of
antelopes (Cotterill 2003). It does not necessarily mean that
Saccostomus is unable to cross these massive water flows, but
rather that rivers are likely to impede migration and thus
they can easily trap moving hybrid zones (Barton 1979).
Indeed, the contact of S. c. campestris and S. c. mashonae
at the Zambezi-Kafue line might be established relatively
recently. Shallow structures in cytochrome b genealogies
within both subspecies and distribution of nucleotide varia-
tion suggest recent population expansion, which was dated
to the last glacial. Moreover, distribution of suitable habi-
tats was presumably fragmented during the last interglacial
(Fig. 6). Large distribution gap is predicted for that period
in place of the current contact line, consistent with several
intervals of extreme aridity in the Lake Malawi region
between 135 and 90 ka (Cohen et al. 2007). Palynological
analyses provided the evidence of high pollen accumulation
of Poaceae grasses, especially in 105–90 ka (Beuning et al.
2011). This episode of a megadrought was so severe that
even dominant miombo trees like Brachystegia completely
disappeared from the pollen source area of Lake Malawi
(Beuning et al. 2011), which might have caused the disap-
pearance of Saccostomus from a large part of its current dis-
tribution. The next period is characterized by the
vegetation recovery and by 85–80 ka there was a resur-
gence of savannah woodland habitat documented in the
pollen core at Lake Malawi (Beuning et al. 2011), which
possibly promoted population expansion from relatively
small source populations.
O. Mikula et al. � Diversity in rodent genus Saccostomus
ª 2016 Royal Swedish Academy of Sciences, 45, 6, November 2016, pp 595–617 611
O. Mikula et al. � Diversity in rodent genus Saccostomus

100
Tatiana Aghová / Ph.D. dissertation (2018)
It is also intriguing that according to Bayesian skyline
plots, the steepest population growth in S. c. mashonae took
place precisely when the growth slowed down in S. c. cam-
pestris and the growth in S. c. campestris was accelerated
again when it slowed down in S. c. mashonae. This might
be interpreted, for instance, as a signature of direct interac-
tion between the subspecies in a moving hybrid zone, but
with data in hand we cannot test this hypothesis. Similarly,
we do not know whether subclade A3 became dominant
within S. c. mashonae due to its selective superiority on
either gene or organismal level. Nevertheless, such
hypotheses might be tested in a future with genomic data
and more intensive sampling, for example by a method of
Peter & Slatkin (2013) that is tracking changes in frequen-
cies of numerous biallelic markers.
A significant exception from the pattern of parapatric
distributions is the paralectotype of S. fuscus collected near
Inhambane in southern Mozambique, which is placed to
S. c. campestris by its cytochrome b mini-barcode as well as
by its skull form. Occurrence of relict population of
S. c. campestris deep in the range of S. c. mashonae would
have important phylogeographic implications, but we are
hesitant to draw far-reaching conclusions from a single
observation, even though intriguing (e.g. dark belly of
S. fuscus). In any case, it would be beneficial to obtain more
molecular data from the paralectotype and/or lectotype as
well as to enlarge skull form data set and explicitly model
allometric (size-correlated) shape variation within both sub-
species to assess whether morphometric classification of the
paralectotype might be due to its subadult age. No Saccosto-
mus were captured recently near Inhambane town despite
our extensive trapping effort. It can be explained by the
fact that the environs in this area are currently highly
degraded and in many places changed to oil palm planta-
tions, so it is also possible that the original, possibly
unique, population went extinct.
More data are also needed to assess nature and origin of
B vs. C divergence of cytochrome b within S. c. campestris.
Future field work and employment of rapidly evolving
nuclear markers are necessary to assess how much mito-
chondrial gene pools are separated, whether this distinction
is apparent also in some nuclear loci and what is the role
of geomorphological features (most notably Lake Malawi
and Shire River) in shaping patterns of molecular variation
of Saccostomus in this region. Geographically distinct clade
C might arise in situ by a series of bottlenecks in repeat-
edly fragmented populations as well as by a founder event
following colonization either cross the Shire River or
through the migration corridor between lakes Malawi and
Rukwa called ‘Mbeya triple junction’. The latter area was
used for colonization of Tanzania, for example by mole-
rats of the genus Fukomys approximately 1 Ma (Faulkes
et al. 2010). Both population fragmentation and range shifts
might take place in a dry climatic period taking place 135–
90 ka in the region (Cohen et al. 2007).
Phylogeographic scenarios for S. mearnsi group
Saccostomus mearnsi and S. umbriventer are separated by the
mountains in northern Tanzania (e.g. Kilimanjaro, Pare
and Usambara), although they probably come together in
south-west of Kenya, where more detailed sampling is
required (Fig. 3B). This phylogeographic pattern has not
been described yet, which is related to lack of detailed
genetic data from Somali-Maasai bioregion. It is also
unclear whether observed separation is due to general lack
of suitable habitats along that mountain chain or due to
specialization to, for instance, different climate or micro-
habitats on its northern and southern side. Our species dis-
tribution model suggests fragmentation of the continuous
distribution of S. mearnsi group in the last interglacial with
conditions being unsuitable over the large portion of its
present range in Ethiopia and Kenya including the area of
presumed contemporary contact between S. mearnsi and
S. umbriventer (Fig. 6), which suggests possible separation
of the two species by climatic fluctuations.
In addition, a spatial substructure is visible within S. um-
briventer with different haplotype clusters on the western
(D1) and eastern (D2) side of the Rift Valley (Fig. 3A).
Similar pattern we observed also in a preliminary analysis
of cytochrome b variation in Gerbilliscus vicinus, another
rodent species living in similar habitats as Saccostomus (T.
Aghov�a et al. in prep.) Tendency to such differentiation
might be caused by amplifier lakes repeatedly appearing in
the Rift Valley during humid climatic periods (Trauth et al.
2010) and serving as an effective migration barrier. At pre-
sent, however, our sampling is too scarce to allow testing
of this hypothesis using Saccostomus data.
Genus Saccostomus and modern taxonomy
In our present revision of genus Saccostomus, we addressed
earlier suggestions (Denys 1988; Corti et al. 2004) that
each of the species described by Hubert (1978) may be in
fact a group of morphologically cryptic species. Based on
the joint molecular and morphometric analysis, we con-
clude there are cryptic taxa within the genus although there
are probably not as many of them as might be supposed.
Namely we recognized two species within S. mearnsi group
and two subspecies in S. campestris group that are cryptic in
the sense ‘not easily recognized’ yet showing signatures of
at least partial reproductive isolation and independent evo-
lution. This conclusion is perhaps typical for taxonomic
endeavour of the last few decades. The consensus is grow-
ing that even good species may be extremely similar in fea-
tures apparent to humans (‘cryptic species’) but on the
612 ª 2016 Royal Swedish Academy of Sciences, 45, 6, November 2016, pp 595–617
Diversity in rodent genus Saccostomus � O. Mikula et al.

101
Tatiana Aghová / Ph.D. dissertation (2018)
other hand there is also a growing recognition that even
large karyotypic changes and striking genetic divergences
do not automatically imply species status.
Acknowledgements
This study was supported by the projects of the GACR
Czech Science Foundation, nos. P506-10-0983 and 15-
20229S. For help in the field and with logistics, we
acknowledge W.N. Chitaukali, H. Konvi�ckov a-
Patzenhauerov a, J. Kr asov a, M. L€ovy, R. Makundi, V.
Mazoch, J. �Skl ıba, J. Vrbov a Kom arkov a and all local col-
laborators. A. Bryjov a, D. Chovanec and H. Konvi�ckov a-
Patzenhauerov a helped with genotyping. For permission to
carry out the research and to collect specimens, we are
obliged to the National Research Council and Forestry
Department in Malawi, the National Council for Science
and Technology, the Kenyan Forest Service and the Ken-
yan Wildlife Service, the Ethiopian Wildlife Conservation
Authority, Sokoine University in Morogoro, and Zambian
Wildlife Authority. We would also like to thank the cura-
tors of the collections, R. Baker (TTU), J. Britton-Davi-
dian (ISEM), J. Chupasko (MCZ), C. Conroy (MVZ), G.
Csorba (HNHM), N. Duncan (AMNH), P. Jenkins
(BMNH), T. Kerney (TM), D. Lunde (USNM), C.
Mateke (LM), F. Mayer (ZMB), D. Moerike (SMNS), V.
Nicolas (MNHN), E. Verheyen (RBINS), V. Volpato
(SMF) and W. Wendelen (RMCA), for providing us with
tissue samples and allowing us to study the skeletal material
in their care. T. Kearney (TM), N. Lange (ZMB) and M.
Omura (MCZ) contributed by taking images of type mate-
rial. We thank M. McDonough for language correction
and comments on the earlier version of the manuscript.
The paper was also significantly improved by comments of
M. Carleton, C. Denys and one anonymous reviewer.
ReferencesAdams, D. C. & Otarola-Castillo, E. (2013). geomorph: An R
package for the collection and analysis of geometric morphomet-
ric shape data. Methods in Ecology and Evolution, 4, 393–399.Allen, G. M. & Lawrence, B. (1936). Reports on the scientific
results of an expedition to rain forest regions in eastern Africa.
Bulletin of the Museum of Comparative Zoology at Harvard College,79, 100–102.
Arbour, J. H. & Brown, C. M. (2014). Incomplete specimens in
geometric morphometric analyses. Methods in Ecology and Evolu-tion, 5, 16–26.
Bart akov a, V., Reichard, M., Bla�zek, R., Pola�cik, M. & Bryja, J.
(2015). Terrestrial fishes: rivers are barriers to gene flow in
annual fishes from the African savanna. Journal of Biogeography,42, 1832–1844.
Barton, N. H. (1979). Gene flow past a cline. Heredity, 43, 333–339.Bastien, P., Esposito-Vinzi, V. & Tenenhaus, M. (2005). PLS gen-
eralised linear regression. Computational Statistics & Data Analysis,48, 17–46.
Bensmail, H. & Celeux, G. (1996). Regularized Gaussian discrimi-
nant analysis through eigenvalue decomposition. Journal of theAmerican Statistical Association, 91, 1743–1748.
Berger, S. A., Krompass, D. & Stamatakis, A. (2011). Performance,
accuracy, and web server for evolutionary placement of short
sequence reads under maximum likelihood. Systematic Biology, 60,291–302.
Bertrand, F., Meyer, N. & Maumy-Bertrand, M. (2014). Partial
least squares regression for generalized linear models. R package
version 1.1.1.
Beuning, K. R. M., Zimmerman, K. A., Ivory, S. J. & Cohen, A.
S. (2011). Vegetation response to glacial-interglacial climate vari-
ability near Lake Malawi in the southern African tropics. Palaeo-geography Palaeoclimatology Palaeoecology, 303, 81–92.
Bivand, R. & Lewin-Koh, N. (2014). maptools: Tools for reading
and handling spatial objects. R package version 0.8-29.
Blonder, B. (2015). hypervolume: High-dimensional kernel density
estimation and geometry operations. R package version 1.3.0.
Blonder, B., Lamanna, C., Violle, C. & Enquist, B. J. (2014). The
n-dimensional hypervolume. Global Ecology and Biogeography, 23,595–609.
Bouckaert, R., Heled, J., K€uhnert, D., Vaughan, T., Wu, C.-H.,
Xie, D., Suchard, M. A., Rambaut, A. & Drummond, A. J.
(2014). BEAST 2: A software platform for Bayesian evolutionary
analysis. PLoS Computational Biology, 10, e1003537.Braconnot, P., Otto-Bliesner, B., Harrison, S., Joussaume, S.,
Peterchmitt, J. Y., Abe-Ouchi, A., Crucifix, M., Driesschaert E,
Fichefet, T., Hewitt, C. D., Kageyama, M., Kitoh, A., Laine, A.,
Loutre, M.-F., Marti, O., Merkel, U., Ramstein, G., Valdes, P.,
Weber, S..L., Yu, Y. & Zhao, Y. (2007). Results of PMIP2 cou-
pled simulations of the Mid-Holocene and Last Glacial Maxi-
mum – Part 1: Experiments and large-scale features. Climate ofthe Past, 3, 261–277.
Bryja, J., Mikula, O., �Sumbera, R., Meheretu, Y., Aghov a, T., Lav-
renchenko, L. A., Mazoch, V., Oguge, N., Mbau, J. S., Weleger-
ima, K., Amundala, N., Colyn, M., Leirs, H. & Verheyen, E.
(2014). Pan-African phylogeny of Mus (subgenus Nannomys)reveals one of the most successful mammal radiations in Africa.
BMC Evolutionary Biology, 14, 256.Carleton, M. D. & Musser, G. G. (1984). Muroid rodents. In S.
Anderson & J. K. Jones Jr (Eds) Orders and Families of RecentMammals of the World (pp. 289–379). New York: John Wiley
and Sons.
Cohen, A. S., Stone, J. R., Beuning, K. R. M., Park, L. E., Rein-
thal, P. N., Dettman, D., Scholz, C. A., Johnson, T. C., King, J.
W., Talbot, M. R., Brown, E. T. & Ivory, S. J. (2007). Ecologi-
cal consequences of early Late Pleistocene megadroughts in
tropical Africa. Proceedings of the National Academy of Sciences ofthe United States of America, 104, 16422–16427.
Colangelo, P., Granjon, L., Taylor, P. J. & Corti, M. (2007). Evo-
lutionary systematics in African gerbilline rodents of the genus
Gerbilliscus: inference from mitochondrial genes. Molecular Phylo-genetics and Evolution, 42, 797–806.
Corti, M., Scanzani, A., Rossi, A. R., Civitelli, M. V., Bekele, A. &
Capanna, E. (1999). Karyotypic and genetic divergence in the
Ethiopian Myomys-Stenocephalemys complex (Mammalia, Roden-
tia). Italian Journal of Zoology, 66, 341–349.Corti, M., Castiglia, R., Annesi, F. & Verheyen, W. (2004). Mito-
chondrial sequences and karyotypes reveal hidden diversity in
O. Mikula et al. � Diversity in rodent genus Saccostomus
ª 2016 Royal Swedish Academy of Sciences, 45, 6, November 2016, pp 595–617 613
O. Mikula et al. � Diversity in rodent genus Saccostomus

102
Tatiana Aghová / Ph.D. dissertation (2018)
African pouched mice (subfamily Cricetomyinae, genus Saccosto-mus). Journal of Zoology, 262, 413–424.
Corti, M., Castiglia, R., Colangelo, P., Capanna, E., Beolchini, F.,
Bekele, A., Oguge, N. O., Makundi, R. H., Sichilima, A. M.,
Leirs, H., Verheyen, W. & Verhagen, R. (2005). Cytotaxonomy
of rodent species from Ethiopia, Kenya, Tanzania and Zambia.
Belgian Journal Zoology, 135(Suppl.), 197–216.Cotterill, F. P. D. (2003). Geomorphological influences on vicar-
iant evolution in some African mammals in the Zambezi basin:
some lessons for conservation. In: Plowman A, ed. Ecology andConservation of Small Antelope. Proceedings of an International Sym-posium on Duiker and Dwarf Antelope in Africa. F€urth: FilanderVerlag, 11–58.
Demos, T. C., Peterhans, J. C. K., Agwanda, B. & Hickerson, M.
J. (2014). Uncovering cryptic diversity and refugial persistence
among small mammal lineages across the Eastern Afromontane
biodiversity hotspot. Molecular Phylogenetics and Evolution, 71,41–54.
Denys, C. (1987). Rodentia and Lagomorpha. 6.1. Fossil rodents
(other than Pedetidae) from Laetoli. In M. D. Leakey & J. M.
Harris (Eds) Laetoli, a Pliocene Site in Northern Tanzania (pp.
118–170). Oxford: Clarendon Press.
Denys, C. (1988). Apports de l’analyse morphometrique a la deter-
mination des especes actuelles et fossils du genre Saccostomus(Cricetomyinae, Rodentia). Mammalia, 52, 497–532.
Denys, C. (1992). Pr!esence de Saccostomus (Rodentia, Mammalia)
a Olduvai Bed-I (Tanzanie, Pl!eistoc ene inf!erieur). Implica-
tions phyl!etiques et pal!eobiog!eographiques. Geobios, 25, 145–
154.
Denys, C. (1999). Of mice and men. Evolution in East and South
Africa during Plio-Pleistocene times. In T. Bromage & F.
Schrenk (Eds) African Biogeography, Climate Change & HumanEvolution (pp. 226–252). Oxford: Oxford University Press.
Denys, C. (2011). Rodents. In T. Harrison (Ed.) Paleontology andGeology of Laetoli: Human Evolution in Context: Fossil Homininsand the Associated Fauna (vol. 2, pp. 15–53). Dordrecht: Springer.
Drummond, A. J., Rambaut, A., Shapiro, B. & Pybus, O. G.
(2005). Bayesian coalescent inference of past population dynam-
ics from molecular sequences. Molecular Biology and Evolution, 22,1185–1192.
Dryden, I. L. & Mardia, K. V. (1998). Statistical Shape Analysis.Chichester: Wiley.
Ellison, G. T. H. (1993). Evidence of climatic adaptation in spon-
taneous torpor among Pouched mice Saccostomus campestris fromsouthern Africa. Acta Theriologica, 38, 49–59.
Ellison, G. T. H., Taylor, P. J., Nix, H. A., Bronner, G. N. &
McMahon, J. P. (1993). Climatic adaptation of body size among
pouched mice (Saccostomus campestris, Cricetidae) in the southern
African subregion. Global Ecology and Biogeography Letters, 3, 41–47.
Fabre, P.-H., Hautier, L., Dimitrov, D. & Douzery, E. J. P.
(2012). A glimpse on the pattern of rodent diversification: a phy-
logenetic approach. BMC Evolutionary Biology, 12: 88.Fadda, C., Corti, M. & Verheyen, E. (2001). Molecular phylogeny
of Myomys/Stenocephalemys complex and its relationships with
related African genera. Biochemical Systematics and Ecology, 29,585–596.
Faulkes, C. G., Verheyen, E., Verheyen, W., Jarvis, J. U. M. &
Bennett, N. C. (2004). Phylogeographical patterns of genetic
divergence and speciation in African mole-rats (Family: Bathy-
ergidae). Molecular Ecology, 13, 613–629.Faulkes, C. G., Mgode, G. F., Le Comber, S. C. & Bennett, N. C.
(2010). Cladogenesis and endemism in Tanzanian mole-rats,
genus Fukomys: (Rodentia Bathyergidae): a role for tectonics?
Biological Journal of the Linnean Society, 100, 337–352.Fraley, C., Raftery, A. E., Murphy, T. B. & Scrucca, L. (2012)
mclust Version 4 for R: Normal Mixture Modeling for Model-
Based Clustering, Classification, and Density Estimation. Tech-
nical Report No. 597, Department of Statistics, University of
Washington.
Galan, M., Pages, M. & Cosson, J.-F. (2012). Next-generation
sequencing for rodent barcoding: species identification from
fresh, degraded and environmental samples. PLoS One, 7:e48374.
Galster, S., Burgess, N. D., Fjelds"a, J., Hansen, L. A. & Rahbek,
C. (2007). One Degree Resolution Databases of the Distribution of1085 Species of Mammals in Sub-Saharan Africa. On-line data
source-Version 1.00. Denmark: Zoological Museum, University
of Copenhagen. Available via http://www.daim.snm.ku.dk/afri-
can-vertebrates-search
Geraads, D. (2001). Rodents of the Upper Miocene of Chorora,
Ethiopia: Murinae, Dendromurinae and conclusions. Palaeoverte-brata (Montpellier), 30, 89–109.
Gernhard, T. (2008). The conditioned reconstructed process. Jour-nal of Theoretical Biology, 253, 769–778.
Gordon, D. H. & Rautenbach, I. L. (1980). Species complexes in
medically important rodents – chromosome studies of Aethomys,Tatera and Saccostomus (Rodentia, Muridae, Cricetidae). SouthAfrican Journal of Science, 76, 559–561.
Gordon, D. H. & Watson, C. R. B. (1986). Identification of cryptic
species of rodents (Mastomys, Aethomys, Saccostomus) in the Kruger
National Park. South African Journal of Zoology, 21, 95–99.de Graaff, G. (1981). The Rodents of Southern Africa. Durban: But-
terworths.
Hasegawa, M., Kishino, H. & Yano, T. A. (1985). Dating of the
Human-Ape splitting by a molecular clock of mitochondrial
DNA. Journal of Molecular Evolution, 22, 160–174.Heller, E. (1910). Five new rodents from British East Africa.
Smithsonian Miscellaneous Collections, 54, 3.Heller, E. (1912). New rodents from British East Africa. Smithso-nian Miscellaneous Collections, 59, 14–15.
Hijmans, R. J. (2014). raster: Geographic data analysis and model-
ing. R package version 2.2-31.
Hijmans, R. J., Cameron, S. E., Parra, J. L., Jones, P. G. & Jarvis, A.
(2005). Very high resolution interpolated climate surfaces for glo-
bal land areas. International Journal of Climatology, 25, 1965–1978.Horn, A., Basset, P., Yannic, G., Banaszek, A., Borodin, P. M.,
Bulatova, N. S., Jadwiszczak, K., Jones, R. M., Polyakov, A. V.,
Ratkiewicz, M., Searle, J. B., Shchipanov, N. A., Zima, J. &
Hausser, J. (2012). Chromosomal rearrangements do not seem
to affect the gene flow in hybrid zones between karyotypic races
of the Common Shrew (Sorex araneus). Evolution, 66, 882–889.Hubert, B. (1978). Revision of the genus Saccostomus (Rodentia,
Cricetomyinae), with new morphological and chromosomal data
from specimens from the lower Omo Valley, Ethiopia. Bulletinof Carnegie Museum of Natural History, 6, 48–52.
Jansa, S. A. & Weksler, M. (2004). Phylogeny of muroid rodents:
relationships within and among major lineages as determined by
614 ª 2016 Royal Swedish Academy of Sciences, 45, 6, November 2016, pp 595–617
Diversity in rodent genus Saccostomus � O. Mikula et al.
103
Tatiana Aghová / Ph.D. dissertation (2018)
IRBP gene sequences. Molecular Phylogenetics and Evolution, 31,256–276.
Johnson, J. B. & Omland, K. S. (2004). Model selection in ecology
and evolution. Trends in Ecology & Evolution, 19, 101–108.Kass, R. E. & Raftery, A. E. (1995). Bayes Factors. Journal of theAmerican Statistical Association, 90, 773–795.
Keesing, F. (1998a). Impacts of ungulates on the demography and
diversity of small mammals in central Kenya. Oecologia, 116,381–389.
Keesing, F. (1998b). Ecology and behavior of the pouched mouse,
Saccostomus mearnsi, in central Kenya. Journal of Mammalogy, 79,919–931.
Keesing, F. & Young, T. P. (2014). Cascading consequences of the
loss of large mammals in an African savanna. BioScience, 64, 487–495.
Keller, C., Roos, C., Groeneveld, L. F., Fischer, J. & Zinner, D.
(2010). Introgressive hybridization in southern African baboons
shapes patterns of mtDNA variation. American Journal of PhysicalAnthropology, 142, 125–136.
Kraemer, N. & Sugiyama, M. (2011). The degrees of freedom of
partial least squares regression. Journal of the American StatisticalAssociation, 106, 697–705.
Krzanowski, W. J. (1987). Cross-validation in principal component
analysis. Biometrics, 43, 575–584.Lange, M., Lautenbach, S. & Raedig, C. (2012). sperich: Auxiliary
functions to estimate centers of biodiversity. R package version
1.5-5.
Lecompte, E., Granjon, L., Peterhans, J. K. & Denys, C. (2002).
Cytochrome b-based phylogeny of the Praomys group (Rodentia,
Murinae): a new African radiation? Comptes Rendus Biologies, 325,827–840.
Librado, P. & Rozas, J. (2009). Dnasp v5: A software for compre-
hensive analysis of DNA polymorphism data. Bioinformatics, 25,1451–1452.
Makundi, R. H., Massawe, A. W., Mulungu, L. S. & Katakweba,
A. (2010). Species diversity and population dynamics of rodents
in a farm-fallow field mosaic system in central Tanzania. AfricanJournal of Ecology, 48, 313–320.
Maputla, N. W. (2008). Taxonomic status of Saccostomus cam-pestris (Rodentia: Cricetomyinae) from southern Africa: a multi-
disciplinary approach. MSc thesis, Pretoria: University of
Pretoria.
Maputla, N. W., Dempster, E. R., Raman, J. & Ferguson, J. W.
H. (2011). Strong hybrid viability between two widely divergent
chromosomal forms of the pouched mouse. Journal of Zoology,285, 180–187.
McDonough, M., �Sumbera, R., Mazoch, V., Ferguson, A. W.,
Phillips, C. D. & Bryja, J. (2015). Multilocus phylogeography
of a widespread savanna-woodland adapted rodent reveals the
influence of Pleistocene geomorphology and climate change in
Africa’s Zambezi region. Molecular Ecology. 24, 5248–5266.Mein, P. & Pickford, M. (2006). Late Miocene micromammals
from the Lukeino formation (6.1 to 5.8 Ma), Kenya. BulletinMensuel de la Societe Linneenne de Lyon, 75, 183–223.
Mein, P., Pickford, M. & Senut, B. (2004). Late Miocene micro-
mammals from the Harasib karst deposits, Namibia. Part 2b –
Cricetomyidae, Dendromuridae and Muridae, with an addendum
on the Myocricetodontidae. Communications of the GeologicalSurvey of Namibia, 13, 43–61.
de Menocal, P. B. (2004). African climate change and faunal evolu-
tion during the Pliocene-Pleistocene. Earth and Planetary ScienceLetters, 220, 3–24.
Metz, M. R. & Keesing, F. (2001). Dietary choices of the pouched
mouse (Saccostomus mearnsi) in central Kenya. Biotropica, 33, 182–187.
Miller, G. S. (1910). A new rodent of the genus Saccostomus from
British East Africa. Smithsonian Miscellaneous Collections, 54, 1–3.Montgelard, C. & Matthee, C. A. (2012). Tempo of genetic diver-
sification in southern African rodents: the role of Plio-Pleisto-
cene climatic oscillations as drivers for speciation. ActaOecologica-International Journal of Ecology, 42, 50–57.
Moore, A. E., Cotterill, F. P. D., Main, M. P. L. & Williams, H.
B. (2007). The Zambezi River. In A. Gupta (Ed.) Large Rivers:Geomorphology and Management (pp. 311–332). New-York:
Wiley.
Moore, A. E., Blenkinsop, T. & Cotterill, F. P. D. (2012).
Dynamic evolution of the Zambezi-Limpopo watershed, central
Zimbabwe. South African Journal of Geology, 115, 551–560.Musser, G. G. & Carleton, M. D. (2005). Superfamily Muroidea.
In D. E. Wilson & D.-A. M. Reeder (Eds) Mammal Species of theWorld. A Taxonomic and Geographic Reference (3rd edn, Vol. 2,
pp. 894–1531). Baltimore: John Hopkins University Press.
Nicolas, V., Granjon, L., Duplantier, J.-M., Cruaud, C. &
Dobigny, G. (2009). Phylogeography of spiny mice (genus
Acomys, Rodentia: Muridae) from the south-western margin of
the Sahara with taxonomic implications. Biological Journal of theLinnean Society, 98, 29–46.
Nychka, D., Furrer, R. & Sain, S. (2015). fields: Tools for spatial
data. R package version 8.2-1.
Oba, S., Sato, M., Takemasa, I., Monden, M., Matsubara, K. &
Ishii, S. (2003). A Bayesian missing value estimation method for
gene expression profile data. Bioinformatics, 19, 2088–2096.O’Leary, M. A. & Kaufman, S. G. (2012). MorphoBank 3.0: Web
application for morphological phylogenetics and taxonomy.
Available via http://www.morphobank.org.
Otto-Bliesner, B. L., Marsha, S. J., Overpeck, J. T., Miller, G. H.,
Hu, A. X. & Mem, C. L. I. P. (2006). Simulating Arctic climate
warmth and icefield retreat in the last interglaciation. Science,311, 1751–1753.
Paradis, E., Claude, J. & Strimmer, K. (2004). APE: analyses of
phylogenetics and evolution in R language. Bioinformatics, 20,289–290.
Peter, B. & Slatkin, M. (2013). Detecting range expansion from
genetic data. Evolution, 67, 3274–3289.Peters, W. C. H. (1846). Bericht €uber die zur BekanntmachungGeeigneten Verhandlungen (pp. 257–258). Berlin: K€oniglichen
Preussien Akademie der Wissenschaften.
Peters, W. C. H. (1852). Reise Nach Mossambique. I. S€augethiere(pp. 167–168). Berlin: Druck & Verlag.
Petter, F. (1966). Affinites des genres Beamys, Saccostomus et Crice-tomys (Rongeurs, Cricetomyinae). Annales Mus ee Royal de l’Afri-que Centrale, ser. 8 (Sciences Zoologiques), 144, 13–25.
Piry, S., Guivier, E., Realini, A. & Martin, J. F. (2012). |SE|S|AM|
E| Barcode: NGS-oriented software for amplicon characteriza-
tion – application to species and environmental barcoding.
Molecular Ecology Resources, 12, 1151–1157.Posada, D. & Crandall, K. A. (1998). MODELTEST: testing the
model of DNA substitution. Bioinformatics, 14, 817–818.
O. Mikula et al. � Diversity in rodent genus Saccostomus
ª 2016 Royal Swedish Academy of Sciences, 45, 6, November 2016, pp 595–617 615
O. Mikula et al. � Diversity in rodent genus Saccostomus

104
Tatiana Aghová / Ph.D. dissertation (2018)
Potts, R. (2013). Hominin evolution in settings of strong environ-
mental variability. Quaternary Science Reviews, 73, 1–13.
R Core Team (2015). R: A Language and Environment for Statistical
Computing. Vienna, Austria: R Foundation for Statistical Com-
puting. Available via http://www.R-project.org
Raıche, G. (2010). nFactors: An R package for parallel analysis and
non graphical solutions to the Cattell scree test. R package
version 2.3.3.
Raıche, G., Walls, T. A., Magis, D., Riopel, M. & Blais, J.-G.
(2013). Non-graphical solutions for Cattell’s scree test. Methodol-
ogy-European Journal of Research Methods for the Behavioral and
Social Sciences, 9, 23–29.
Rambaut, A., Suchard, M. A., Xie, D. & Drummond, A. J. (2014)
Tracer v1.6. Available from http://beast.bio.ed.ac.uk/Tracer
Rautenbach, I. L. (1982). Mammals of the Transvaal. Pretoria: Eco-
plan.
Reed, D. N. (2007). Serengeti micromammals and their implica-
tions for Olduvai paleoenvironments. In R. Bobe, Z. Alemseged
& A. K. Behrensmeyer (Eds) Hominin Environments in the East
African Pliocene: An Assessment of the Faunal Evidence (pp. 217–
255). Book Series: Vertebrate Paleobiology and Paleoanthropol-
ogy. Dordrecht: Springer.
Roberts, A. (1914). Supplementary list of African mammals in the
collection of the Transvaal Museum, with descriptions of some
new species. Annals of the Transvaal Museum, 4, 183.
Roberts, A. (1938). Descriptions of new forms of mammals. Annals
of the Transvaal Museum, 19, 240.
Roberts, A. (1951). The Mammals of South Africa (700 pp.). Johan-
nesburg: Trustees of “The mammals of South Africa” Book
Fund.
Rohlf, F. J. & Slice, D. (1990). Extensions of the Procrustes
method for the optimal superimposition of landmarks. Systematic
Zoology, 39, 40–59.
Ronquist, F., Teslenko, M., van der Mark, P., Ayres, D. L., Dar-
ling, A., Hohna, S., Larget, B., Liu, L., Suchard, M. A. &
Huelsenbeck, J. P. (2012). MrBayes 3.2: Efficient Bayesian phy-
logenetic inference and model choice across a large model space.
Systematic Biology, 61, 539–542.
Ryan, J. M. (1989). Evolution of cheek pouches in African pouched
rats (Rodentia: Cricetomyinae). Journal of Mammalogy, 70, 267–
274.
Schenk, J. J., Rowe, K. C. & Steppan, S. J. (2013). Ecological
opportunity and incumbency in the diversification of repeated
continental colonizations by muroid rodents. Systematic Biology,
62, 837–864.
Schwann, H. (1906). A list of the mammals obtained by Messrs. R.
B. Woosnam and R. E. Dent in Bechuanaland. Proceedings of the
Zoological Society, London, 1906, 110.
Schwarz, G. E. (1978). Estimating the dimension of a model.
Annals of Statistics, 6, 461–464.
Skinner, J. D. & Chimimba, C. T. (2005). The Mammals of the
Southern African Subregion (3rd edn). Cambridge: Cambridge
University press.
Smithers, R. H. N. (1971). The mammals of Botswana. Museum
Memoir, National Museums of Rhodesia, Salisbury, 4, 1–340.
Stacklies, W., Redestig, H., Scholz, M., Walther, D. & Selbig, J.
(2007). pcaMethods – A Bioconductor package providing PCA
methods for incomplete data. Bioinformatics, 23, 1164–1167.
Stamatakis, A. (2014). RAxML version 8: A tool for phylogenetic
analysis and post-analysis of large phylogenies. Bioinformatics, 30,
1312–1313.
Stanhope, M. J., Czelusniak, J., Si, J.-S., Nickerson, J. & Good-
man, M. (1992). A molecular perspective on Mammalian evolu-
tion from the gene encoding interphotoreceptor retinoid
binding protein, with convincing evidence for bat monophyly.
Molecular Phylogenetics and Evolution, 1, 148–160.
Stankiewicz, J. & de Wit, M. J. (2006). A proposed drainage evolu-
tion model for Central Africa – did the Congo flow east? Journal
of African Earth Sciences, 44, 75–84.
Stephens, M., Smith, N. J. & Donnelly, P. (2001). A new statistical
method for haplotype reconstruction from population data.
American Journal of Human Genetics, 68, 978–989.
Steppan, S. J., Adkins, R. M. & Anderson, J. (2004). Phylogeny
and divergence-date estimates of rapid radiations in muroid
rodents based on multiple nuclear genes. Systematic Biology, 53,
533–553.
Swynnerton, G. H. & Hayman, R. W. (1951). A checklist of the
land mammals of the Tanganyika Territory and the Zanzibar
Protectorate. Journal of the East African Natural History Society,
20, 274–392.
Tajima, F. (1989). Statistical method for testing the neutral
mutation hypothesis by DNA polymorphism. Genetics, 123,
585–595.
Tavar!e, S. (1986). Some probabilistic and statistical problems in
the analysis of DNA sequences. Lectures on Mathematics in the
Life Sciences (American Mathematical Society), 17, 57–86.
Taylor, P. J., Stoffberg, S., Monadjem, A., Schoeman, M. C., Bay-
liss, J. & Cotterill, F. P. D. (2012). Four new bat species (Rhi-
nolophus hildebrandtii complex) reflect Plio-Pleistocene divergence
of dwarfs and giants across an afromontane archipelago. PLoS
One, 7, e41744.
Teeling, E. C., Scally, M., Kao, D. J., Romagnoli, M. L., Springer,
M. S. & Stanhope, M. J. (2000). Molecular evidence regarding
the origin of echolocation and flight in bats. Nature, 403, 188–
192.
Terryn, L., Wendelen, W., Leirs, H., Lenglet, G. & Verheyen, E.
(2007). African Rodentia, Available via http://projects.biodiver-
sity.be/africanrodentia
Thomas, O. (1897). Exhibition of small mammals collected by Mr.
Alexander Whyte during his expedition to the Nyika plateau and
Masuka Mountains, NR Nyasa. Proceedings of the Zoological Soci-
ety, London, 1897, 431.
Thomas, O. & Hinton, M. A. C. (1923). On mammals collected
by Captain Shortridge during the Percy Sladen and Kaffrarien
museum expedition to the Orange River. Proceedings of the
Zoological Society, London, 1923, 495–496.
Trauth, M. H., Maslin, M. A., Deino, A. L., Junginger, A., Leso-
loyia, M., Odada, E. O., Olagof, O., Olakaa, L. A., Streckera,
M. R. & Tiedemanng, R. (2010). Human evolution in a variable
environment: the amplifier lakes of Eastern Africa. Quaternary
Science Reviews, 29, 2981–2988.
Werdelin, L. & Sanders, W. J., Eds. (2010). Cenozoic Mammals of
Africa. Berkeley & London: University of California Press.
Winkler, A. J. (1997). Systematics, paleobiogeography, and pale-
oenvironmental significance of rodents from the Ibole member,
Manonga valley, Tanzania. Topics in Geobiology, 14, 311–332.
616 ª 2016 Royal Swedish Academy of Sciences, 45, 6, November 2016, pp 595–617
Diversity in rodent genus Saccostomus � O. Mikula et al.

105
Tatiana Aghová / Ph.D. dissertation (2018)
Winkler, A. J. (2002). Neogene paleobiogeography and east African
paleoenvironments: contributions from the Tugen hills rodents
and lagomorphs. Journal of Human Evolution, 42, 237–256.
Winkler, A. J., Denys, C. & Avery, D. M. (2010). Rodentia. In L.
Werdelin & W. J. Sanders (Eds) Cenozoic Mammals of Africa (pp.
263–304). Berkeley & London: University of California Press.
de Winton, W. E. (1897). On collections of rodents made by Mr.
J. ffolliott Darling in Mashunaland and Mr. F. C. Selous in
Matabeleland, with short field-notes by the collectors. Proceedings
of the Zoological Society, London, 1896, 804.
de Winton, W. E. (1898). On the nomenclature and distribution
of some of the rodents of South Africa, with descriptions of new
species. Annals and Magazine of Natural History, 7, 6.
Supporting Information
Additional Supporting Information may be found in the
online version of this article:
Appendix S1. Complete lists of material used in molecu-
lar and morphological analyses.
Appendix S2. Input file for divergence dating in
BEAST.
Appendix S3. A priori classification of morphometric
specimens.
Appendix S4. Lectotype of Saccostomus fuscus..
O. Mikula et al. � Diversity in rodent genus Saccostomus
ª 2016 Royal Swedish Academy of Sciences, 45, 6, November 2016, pp 595–617 617
O. Mikula et al. � Diversity in rodent genus Saccostomus

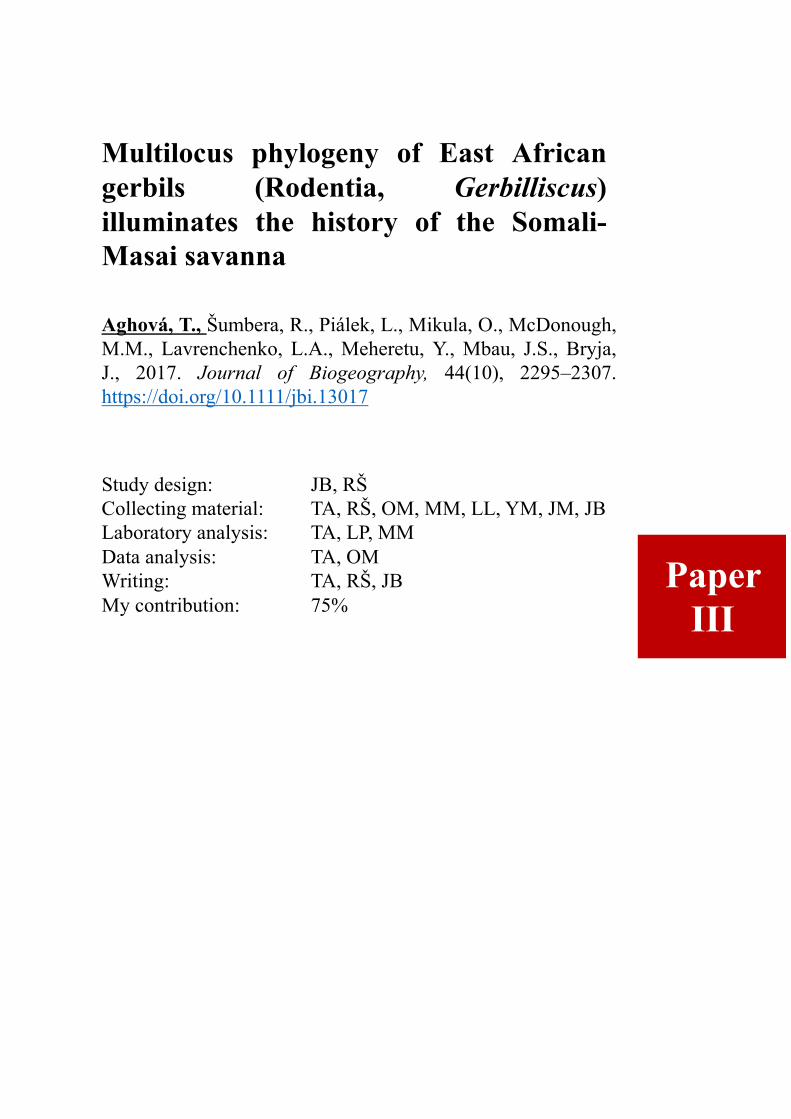
107
Tatiana Aghová / Ph.D. dissertation (2018)
Multilocus phylogeny of East African
gerbils (Rodentia, Gerbilliscus)
illuminates the history of the Somali-
Masai savanna
Aghová, T., umbera, R., Piálek, L., Mikula, O., McDonough,
M.M., Lavrenchenko, L.A., Meheretu, Y., Mbau, J.S., Bryja,
J., 2017. Journal of Biogeography, 44(10), 2295–2307.
https://doi.org/10.1111/jbi.13017
Study design: JB, R
Collecting material: TA, R , OM, MM, LL, YM, JM, JB
Laboratory analysis: TA, LP, MM
Data analysis: TA, OM
Writing: TA, R , JB
My contribution: 75%
Paper
III


109
Tatiana Aghová / Ph.D. dissertation (2018)
ORIGINALARTICLE
Multilocus phylogeny of East Africangerbils (Rodentia, Gerbilliscus)illuminates the history of theSomali-Masai savanna
Tatiana Aghov�a1,2* , Radim Sumbera3, Lubom�ır Pi�alek3,
Ond rej Mikula1,4, Molly M. McDonough5,6, Leonid A. Lavrenchenko7,
Yonas Meheretu8, Judith S. Mbau9 and Josef Bryja1,2
1Institute of Vertebrate Biology of the Czech
Academy of Sciences, 603 65 Brno, Czech
Republic, 2Department of Botany and
Zoology, Faculty of Science, Masaryk
University, 602 00 Brno, Czech Republic,3Department of Zoology, Faculty of Science,
University of South Bohemia, 370 05 �Cesk e
Bud�ejovice, Czech Republic, 4Institute of
Animal Physiology and Genetics of the Czech
Academy of Sciences, 602 00 Brno, Czech
Republic, 5Center for Conservation Genomics,
Smithsonian Conservation Biology Institute,
National Zoo, Washington, DC 20008, USA,6Department of Vertebrate Zoology, National
Museum of Natural History, Smithsonian
Institution, Washington, DC 20560-0108,
USA, 7A.N. Severtsov Institute of Ecology and
Evolution RAS, 119081 Moscow, Russia,8Department of Biology, College of Natural
and Computational Sciences, Mekelle
University, Mekelle, Tigray, Ethiopia,9Department of Land Resource Management
and Agricultural Technology, College of
Agriculture and Veterinary Sciences,
University of Nairobi, Nairobi, Kenya
*Correspondence: Tatiana Aghov�a, Institute of
Vertebrate Biology ASCR, Research Facility
Studenec, 675 02 Studenec, Czech Republic.
Current address: Department of Zoology,
National Museum, 115 79 Prague, Czech
Republic.
E-mail: [email protected]
Dedication
We dedicate this paper to the late Bill Stanley
who devoted much of his career to the study
of small mammals in East Africa. Bill
facilitated acquiring numerous samples used in
this study and the promise of future
collaborations was cut short as Bill passed
away unexpectedly during his field trip in
Ethiopia in 6 October 2015.
ABSTRACT
Aim The rodent genus Gerbilliscus is widespread in savannas throughout sub-
Saharan Africa. The eastern clade comprises four species with distributions cen-
tred in the Somali-Masai biogeographical region of East Africa. We investigated
the genetic diversity of the group with a view to illuminating the historical
(Plio-Pleistocene) processes that formed contemporary biota of the understud-
ied Somali-Masai region.
Location Somali-Masai savanna, East Africa.
Methods We performed multilocus genetic analyses of 240 samples from 112
localities, combining genotyping of recently collected samples (N = 145), 454-
pyrosequencing of museum material (N = 34) and published sequences
(N = 61). We used Bayesian and maximum likelihood approaches for phyloge-
netic reconstructions, and coalescent-based methods to delimit species. We also
estimated divergence times and modelled recent and past distributions to
reconstruct the major evolutionary influences in the Somali-Masai region dur-
ing the Plio-Pleistocene.
Results Genetic analyses provided evidence for six lineages, possibly corre-
sponding to distinct species. The two main species groups (with two and four
putative species, respectively) have overlapping distributions, but species within
each group are distributed parapatrically. The origin of the eastern clade dates
back to the Pliocene, while individual species diverged in the Pleistocene. The
distribution of genetic diversity and ecological niche modelling point to the
importance of the Rift Valley and the presence of unsuitable xeric habitats in
the allopatric diversification of Gerbilliscus in the Somali-Masai savanna within
the last 5 Myr.
Conclusions This is the first detailed phylo(bio-)geographical study of ani-
mals with predominant distribution in the Somali-Masai region. It revealed
currently underestimated diversity of eastern clade of Gerbilliscus and proposed
a scenario of its evolution during Plio-Pleistocene. Conspicuous genetic struc-
ture of these taxa can be now used to test detailed phylogeographical hypothe-
ses related to Plio-Pleistocene history of gerbils and, to some extent, also biota
of Somali-Masai bioregion in general.
Keywords
biogeography, Gerbillinae, historical DNA, murid rodents, phylogeography,
Plio-Pleistocene climate change, pyrosequencing, Rift Valley, species delimita-
tion, tropical Africa
ª 2017 John Wiley & Sons Ltd http://wileyonlinelibrary.com/journal/jbi 2295doi:10.1111/jbi.13017
Journal of Biogeography (J. Biogeogr.) (2017) 44, 2295–2307

110
Tatiana Aghová / Ph.D. dissertation (2018)
INTRODUCTION
Tropical grasslands, savannas and shrublands are the most
widespread terrestrial habitats in sub-Saharan Africa (Sayre
et al., 2013). These ecosystems, hosting some of the most
abundant and diverse mammalian communities on Earth,
are threatened by increased human activities (Craigie et al.,
2010). Within the continent they can be divided into four
main bioregions (sensu Linder et al., 2012): South African,
Zambezian, Sudanian and Somali-Masai, with the last one
corresponding to the ‘Somalia-Masai’ region, originally pro-
posed by White (1983) as a distinct dry phytochorion,
extending from Eritrea to Tanzania (Fig. 1). International
Vegetation Classification (IVC; naturserve.org; Faber-Langen-
doen et al., 2014) identifies this division as Eastern Africa
Xeric Scrub and Grassland with four ecoregions: (1) Somali,
(2) Southern, (3) Northern Acacia-Commiphora bushlands
and thickets and (4) Masai xeric grasslands and shrublands
(Dixon et al., 2014), referred to herein as Somali-Masai
savanna (Fig. 1). The major geomorphological feature here is
the East African Rift system which has had a long-term
influence on the climatic regime in Africa (Sepulchre et al.,
2006). While this region has relatively low floristic and fau-
nistic species diversity, a high level of endemism exists for
plants (Thulin, 1993), reptiles (Burgess et al., 2007) and
rodents (Varshavsky et al., 2007). This region is home to the
Horn of Africa biodiversity hotspot, which ranks among the
oldest and most stable arid regions of Africa (Kingdon,
1990). In addition, it is one of the least known African
bioregions and possibly also one of the most threatened due
to the rapid increase in human populations and climatic
changes (Geist & Lambin, 2004).
Despite the biogeographical uniqueness of the Somali-
Masai region, genetic data on organisms living here are
scarce and fragmentary – usually included as part of large-
scale phylogenetic reconstructions with under-representative
geographical sampling. Previous studies found that taxa from
this region are phylogenetically distinct, thereby providing
Figure 1 Distribution of species and intraspecific haplogroups of Gerbilliscus in East Africa. Species of the eastern clade are represented
with different colours and intraspecific haplogroups are indicated by different symbol shapes. Empty squares represent genetically
confirmed records of Gerbilliscus species from the western clade, empty circles those from the southern clade (sensu Granjon et al.,
2012), and black crosses indicate localities where Gerbilliscus was not captured during our recent field trappings. The map is based on
data from Colangelo et al. (2007, 2010), McDonough et al. (2015), this study and our unpublished data of DNA-barcoded specimens
from western and southern clades. Orange background indicates the extent of Somali-Masai savanna, i.e. the distribution of Somali,
Northern and Southern Acacia-Commiphora bushlands and thickets (based on WWF records http://www.eoearth.org/). [Colour figure
can be viewed at wileyonlinelibrary.com]
Journal of Biogeography 44, 2295–2307
ª 2017 John Wiley & Sons Ltd
2296
T. Aghov�a et al.
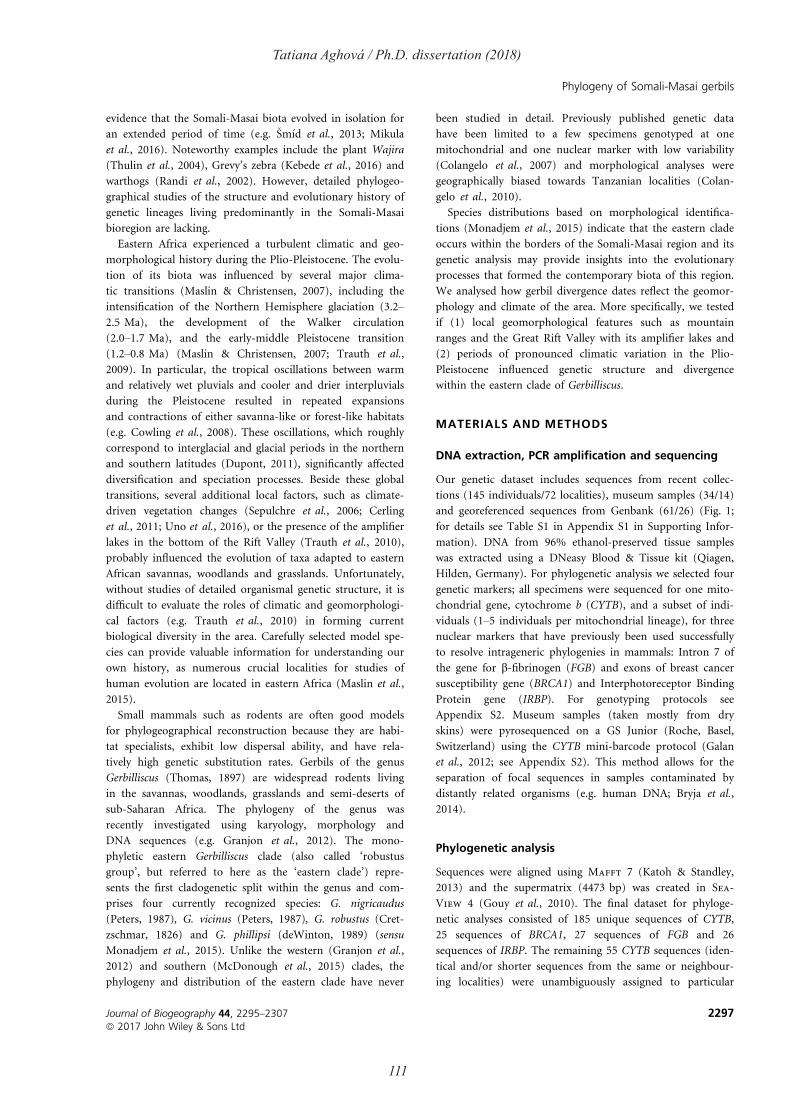
111
Tatiana Aghová / Ph.D. dissertation (2018)
evidence that the Somali-Masai biota evolved in isolation for
an extended period of time (e.g. �Sm ıd et al., 2013; Mikula
et al., 2016). Noteworthy examples include the plant Wajira
(Thulin et al., 2004), Grevy’s zebra (Kebede et al., 2016) and
warthogs (Randi et al., 2002). However, detailed phylogeo-
graphical studies of the structure and evolutionary history of
genetic lineages living predominantly in the Somali-Masai
bioregion are lacking.
Eastern Africa experienced a turbulent climatic and geo-
morphological history during the Plio-Pleistocene. The evolu-
tion of its biota was influenced by several major clima-
tic transitions (Maslin & Christensen, 2007), including the
intensification of the Northern Hemisphere glaciation (3.2–
2.5 Ma), the development of the Walker circulation
(2.0–1.7 Ma), and the early-middle Pleistocene transition
(1.2–0.8 Ma) (Maslin & Christensen, 2007; Trauth et al.,
2009). In particular, the tropical oscillations between warm
and relatively wet pluvials and cooler and drier interpluvials
during the Pleistocene resulted in repeated expansions
and contractions of either savanna-like or forest-like habitats
(e.g. Cowling et al., 2008). These oscillations, which roughly
correspond to interglacial and glacial periods in the northern
and southern latitudes (Dupont, 2011), significantly affected
diversification and speciation processes. Beside these global
transitions, several additional local factors, such as climate-
driven vegetation changes (Sepulchre et al., 2006; Cerling
et al., 2011; Uno et al., 2016), or the presence of the amplifier
lakes in the bottom of the Rift Valley (Trauth et al., 2010),
probably influenced the evolution of taxa adapted to eastern
African savannas, woodlands and grasslands. Unfortunately,
without studies of detailed organismal genetic structure, it is
difficult to evaluate the roles of climatic and geomorphologi-
cal factors (e.g. Trauth et al., 2010) in forming current
biological diversity in the area. Carefully selected model spe-
cies can provide valuable information for understanding our
own history, as numerous crucial localities for studies of
human evolution are located in eastern Africa (Maslin et al.,
2015).
Small mammals such as rodents are often good models
for phylogeographical reconstruction because they are habi-
tat specialists, exhibit low dispersal ability, and have rela-
tively high genetic substitution rates. Gerbils of the genus
Gerbilliscus (Thomas, 1897) are widespread rodents living
in the savannas, woodlands, grasslands and semi-deserts of
sub-Saharan Africa. The phylogeny of the genus was
recently investigated using karyology, morphology and
DNA sequences (e.g. Granjon et al., 2012). The mono-
phyletic eastern Gerbilliscus clade (also called ‘robustus
group’, but referred to here as the ‘eastern clade’) repre-
sents the first cladogenetic split within the genus and com-
prises four currently recognized species: G. nigricaudus
(Peters, 1987), G. vicinus (Peters, 1987), G. robustus (Cret-
zschmar, 1826) and G. phillipsi (deWinton, 1989) (sensu
Monadjem et al., 2015). Unlike the western (Granjon et al.,
2012) and southern (McDonough et al., 2015) clades, the
phylogeny and distribution of the eastern clade have never
been studied in detail. Previously published genetic data
have been limited to a few specimens genotyped at one
mitochondrial and one nuclear marker with low variability
(Colangelo et al., 2007) and morphological analyses were
geographically biased towards Tanzanian localities (Colan-
gelo et al., 2010).
Species distributions based on morphological identifica-
tions (Monadjem et al., 2015) indicate that the eastern clade
occurs within the borders of the Somali-Masai region and its
genetic analysis may provide insights into the evolutionary
processes that formed the contemporary biota of this region.
We analysed how gerbil divergence dates reflect the geomor-
phology and climate of the area. More specifically, we tested
if (1) local geomorphological features such as mountain
ranges and the Great Rift Valley with its amplifier lakes and
(2) periods of pronounced climatic variation in the Plio-
Pleistocene influenced genetic structure and divergence
within the eastern clade of Gerbilliscus.
MATERIALS AND METHODS
DNA extraction, PCR amplification and sequencing
Our genetic dataset includes sequences from recent collec-
tions (145 individuals/72 localities), museum samples (34/14)
and georeferenced sequences from Genbank (61/26) (Fig. 1;
for details see Table S1 in Appendix S1 in Supporting Infor-
mation). DNA from 96% ethanol-preserved tissue samples
was extracted using a DNeasy Blood & Tissue kit (Qiagen,
Hilden, Germany). For phylogenetic analysis we selected four
genetic markers; all specimens were sequenced for one mito-
chondrial gene, cytochrome b (CYTB), and a subset of indi-
viduals (1–5 individuals per mitochondrial lineage), for three
nuclear markers that have previously been used successfully
to resolve intrageneric phylogenies in mammals: Intron 7 of
the gene for b-fibrinogen (FGB) and exons of breast cancer
susceptibility gene (BRCA1) and Interphotoreceptor Binding
Protein gene (IRBP). For genotyping protocols see
Appendix S2. Museum samples (taken mostly from dry
skins) were pyrosequenced on a GS Junior (Roche, Basel,
Switzerland) using the CYTB mini-barcode protocol (Galan
et al., 2012; see Appendix S2). This method allows for the
separation of focal sequences in samples contaminated by
distantly related organisms (e.g. human DNA; Bryja et al.,
2014).
Phylogenetic analysis
Sequences were aligned using Mafft 7 (Katoh & Standley,
2013) and the supermatrix (4473 bp) was created in Sea-
View 4 (Gouy et al., 2010). The final dataset for phyloge-
netic analyses consisted of 185 unique sequences of CYTB,
25 sequences of BRCA1, 27 sequences of FGB and 26
sequences of IRBP. The remaining 55 CYTB sequences (iden-
tical and/or shorter sequences from the same or neighbour-
ing localities) were unambiguously assigned to particular
Journal of Biogeography 44, 2295–2307
ª 2017 John Wiley & Sons Ltd
2297
Phylogeny of Somali-Masai gerbils

112
Tatiana Aghová / Ph.D. dissertation (2018)
lineages in RAxML 7.2.8 (Stamatakis, 2006). These data were
used to increase the precision with which we mapped the
geographical distribution of clades and assigned type material
to particular genetic groups. As outgroups we used two
sequences of G. giffardi from western clade, which is the sis-
ter lineage to eastern Gerbilliscus (see Table S1 in
Appendix S1 for the GenBank numbers).
The best partitioning scheme and substitution models were
determined using PartitionFinder 1.1.1 (Lanfear et al.,
2014). Evolutionary relationships were estimated using maxi-
mum likelihood (ML) in RAxML 7.2.8 (Stamatakis, 2006)
and Bayesian inference (BI) in MrBayes 3.2.2 (Ronquist
et al., 2012) (see Appendix S2). For visualization of
intraspecific structure we also constructed haplotype net-
works for the two most numerous species, G. vicinus and G.
nigricaudus. Haplotype files were produced in DnaSP 5
(Librado & Rozas, 2009) and median-joining networks in
Network 4.6.1.3 (Bandelt et al., 1999).
Species delimitation
Our results indicated six lineages that might represent sepa-
rate species. We tested the distinctiveness of their gene pools
using the three nuclear loci in a Bayesian framework and
BP&P 3 (Yang & Rannala, 2014), which samples shared phy-
logenetic space and possible mergers of predefined candidate
species under assumptions of a multispecific coalescent
model (Degnan & Rosenberg, 2009). The analysis was run
with three combinations of gamma priors for root age (s0)
and effective population size (h). First, we used G(10,1300)
as an informative prior for s0, based on an assumption that
deeply divergent and broadly sympatric G. nigricaudus and
G. vicinus are heterospecific and s0 is approximately equal to
half of their mean divergence in terms of Jukes-Cantor dis-
tance (see Table S6-S8, Appendix S3). We have no specific
information about h and hence our prior was either diffuse,
G(2,300), and hence uninformative, or suggestive of large
values, G(10,1300) and hence conservative (tending to lump
the species). Finally, we used the diffuse prior for h in com-
bination with diffuse prior for s0, G(0.5,25). Dirichlet distri-
bution with a = 1 is fixed in the software as a prior for
internal branch lengths and we also used it as a prior for
between-gene variability in evolutionary rates. Each analysis
was run twice to check if it converged on a similar posterior
distribution.
Species tree
The species tree was calculated under the Bayesian frame-
work implemented in *BEAST package (Heled & Drum-
mond, 2010), an extension of BEAST 1.8.2 (Drummond
et al., 2012). Alignments for each of the four genes were
imported into BEAUti 1.8.2 where they were assigned sepa-
rate and unlinked substitution, clock and tree models.
Sequences were assigned to species as delimited by the best
model in BP&P. Two independent runs were carried out for
10 9 106 generations with sampling every 1000 generations
in beast. We discarded first 25% as burn-in and the result-
ing parameter and tree files were examined for convergence
and effective sample sizes (> 200) in Tracer 1.6 (Rambaut
et al., 2014). The two runs were combined in LogCombiner
1.8.2 and the species tree was visualized in DensiTree
(Bouckaert, 2010).
Molecular dating
The times to most recent common ancestors (TMRCA) were
inferred in BEAST 1.8.2 from a three-locus dataset (CYTB,
BRCA1, IRBP); sequences of FGB were excluded because of a
lack of sequenced outgroup taxa. The final dataset consisted
of 17 species of Gerbilliscus as well as Desmodillus auricularis
and Tatera indica, their closest relatives in the phylogeny of
gerbillines (Granjon et al., 2012). Sequences analysed are
listed in Table S2 in Appendix S1. We used partition-specific
substitution models (see Table S4 in Appendix S2), gene-spe-
cific lognormal relaxed clocks (Drummond et al., 2006) and
birth–death tree priors (Gernhard, 2008), as well as three fos-
sil calibrations: (1) Abudhabia pakistanensis from the Potwar
Plateau, Pakistan (Flynn & Jacobs, 1999) for the whole Ger-
billiscus-Tatera-Desmodillus clade (Denys & Winkler, 2015);
(2) Gerbilliscus sp. from Lemudong0o, Kenya (Manthi, 2007)
for Gerbilliscus and (3) Gerbilliscus sp. from Hadar, Ethiopia
(Sabatier, 1982) for the eastern clade. The calibration density
was always lognormal (Mean in real space = 1.6, SD = 0.9)
with an offset corresponding to the particular fossil age,
which is 8.6 million years (Ma) for Abudhabia (Flynn &
Jacobs, 1999), 6.1 Ma for the Lemudong0o Gerbilliscus
(Deino & Ambrose, 2007) and 3.3 Ma for the Hadar Gerbil-
liscus (Reed & Geraads 2012). For more details see
Appendix S2.
Species distribution modelling
The present distribution of the East African Gerbilliscus clade
was predicted by maximum entropy (MaxEnt) modelling
(Phillips et al., 2006) interfaced with R computing environ-
ment by packages ‘dismo’ (Hijmans et al., 2016) and ‘ENMe-
val’ (Muscarella et al., 2014). Only CYTB-barcoded
specimens were included to avoid taxonomic confusion
resulting in 66 unique presence records (in 0.5° resolution).
We focused on climatic conditions as predictors of relative
occurrence rates (RORs). More specifically, we used 19 BIO-
CLIM variables downloaded from the WorldClim website
(Hijmans et al., 2005). Following corrected Akaike informa-
tion criterion (AICc) based model selection (Warren & Sei-
fert, 2011) we used linear and quadratic features
(transformations of original variables) and a regularization
coefficient of 1.68 (see Appendix S2 for details). Under these
parameters, RORs were predicted for all background sites as
well as the corresponding sites in palaeoclimatic layers pro-
vided by WorldClim for climatic conditions during the Last
Glacial Maximum (21 ka) and during the last interglacial
Journal of Biogeography 44, 2295–2307
ª 2017 John Wiley & Sons Ltd
2298
T. Aghov�a et al.
113
Tatiana Aghová / Ph.D. dissertation (2018)
(140–120 ka). These layers were produced as estimates from
global circulation models built by Braconnot et al. (2007) for
the last glacial and by Otto-Bliesner (2006) for the last inter-
glacial. The results were visualized using the R packages
‘maptools’ (Bivand & Lewin-Koh, 2016) and ‘raster’ (Hij-
mans, 2015). The importance of each predictor was quanti-
fied by its spatial randomization, calculating the Spearman
correlation (rs) of predictions before and after randomization
and subtracting it from unity.
RESULTS
Phylogeny, distribution and species delimitation of
East African Gerbilliscus
Both BI (Fig. 2) and ML (see Fig. S2, Fig. S5 in
Appendix S3) phylogenetic analyses recovered six main lin-
eages whose relationships were only partly resolved. The first
split separated the eastern Gerbilliscus into the nigricaudus
group (consisting of two lineages G. nigricaudus and G. cf.
bayeri; see Discussion for more details on the use of names
for particular lineages) and the robustus group (consisting of
four lineages G. vicinus, G. phillipsi, G. robustus, G. sp. n.
(Babile)). The distribution of the eastern clade is largely con-
cordant with the borders of the Somali-Masai region and
parapatric with respect to western and southern clades of
Gerbilliscus. The only exceptions are records of G. robustus in
Sudan and Chad, where they may be sympatric with species
of the western clade (Fig. 1).
The BP&P analysis supported all six main lineages as phylo-
genetically distinct entities (putative species) regardless of the
combination of priors (posterior probability > 0.98 in all
cases). Posterior samples of both s0 and mean h were substan-
tially narrower than the corresponding priors, largely coinci-
dent across analyses, and their median corresponded to 0.23–
0.40 quantile of prior density (see Fig. S3 in Appendix S3).
Thus, the support for distinctiveness of our candidate species
was neither due to some specific priors nor due to the sam-
pling getting stuck at an extreme combination of large diver-
gence times and low effective population sizes. The *BEAST
species tree of these six lineages recovered a fully resolved
topology showing that G. sp. n. (Babile) is the sister species of
G. robustus and G. phillipsi is sister to G. vicinus (Fig. 3).
Phylogenetic analysis (Fig. 2) as well as haplotype net-
works (see Fig. S1 in Appendix S3) revealed significant
genetic variation within the three species. We defined two
haplogroups for G. robustus, and four for both G. vicinus
and G. nigricaudus; genetic K2P distances among intraspeci-
fic haplogroups ranged from 0.036 to 0.100 (Table 1). In G.
robustus, one haplogroup occurred in the Rift Valley in
Ethiopia (R1), while the second was found in Chad and
Sudan (R2). In the two remaining species, the distribution
of intraspecific lineages was mostly parapatric, either sepa-
rated by the Rift Valley (e.g. V2 versus V1, V3,V4) or along
the north-south axis (e.g. N4-N2-N1-N3) (Fig. 2, see
Fig. S1 in Appendix S3).
Divergence time estimates
Divergence dating in BEAST estimated the TMRCA of the
genus Gerbilliscus in the Late Miocene (7.03 Ma; 95% HPD:
6.17–10.13; Fig. 4). TMRCA of the eastern clade, i.e. the split
between the nigricaudus and robustus groups, was estimated
as 4.17 Ma (95% HPD: 3.38–6.78) and the basal split in the
robustus group as 2.42 Ma (95% HPD: 1.50–4.30). Three
pairs of sister species diverged almost simultaneously about
1.70 Ma: G. robustus and G. sp. n. (Babile) at 1.62 Ma (95%
HPD: 0.73–2.95), G. vicinus and G. phillipsi at 1.75 Ma (95%
HPD: 0.73–3.31) and G. nigricaudus and G. cf. bayeri at
1.80 Ma (95% HPD: 0.86–3.53).
Species distribution modelling
The suitability of climatic conditions for the eastern Gerbillis-
cus clade appears to have deteriorated from the last inter-
glacial, through the last glacial to the present (Fig. 5).
According to our model the Horn of Africa was more suitable
in the last interglacial, and less so from the last glacial maxi-
mum to the present. In Tanzania, on the southern border of
the Somali-Masai area (see Fig. 1) the suitability of condi-
tions also fluctuated. Nevertheless, in the core of the present
day distribution (Somali-Masai savanna on both sides of the
Rift Valley) climate was apparently favourable during the last
glacial cycle. The most important variable affecting the mod-
elled distribution was precipitation during the wettest quarter
(importance = 0.76), but the effect of mean temperature dur-
ing the coldest quarter, precipitation during the wettest
month and annual precipitation were also significant (impor-
tance ≥ 0.20; see Fig. S4 in Appendix S3 for details).
DISCUSSION
Cryptic diversity and distribution of the eastern
clade of Gerbilliscus
In this study, we used multi-locus genetic data to reconstruct
the evolutionary history of the eastern African clade of ger-
bils, genus Gerbilliscus, distributed mostly in the Somali-
Masai region. Because of a previous lack of sampling and
genetic data, precise distributions and phylogenetic relation-
ships of four currently recognized species in this clade (i.e.
G. nigricaudus, G. robustus, G. vicinus, G. phillipsi; sensu
Colangelo et al., 2005) remained obscure. Using phylogenetic
and species delimitation approaches we evaluated the status
of these four species, analysed their intraspecific variability
and provided details on their distributions.
In accordance with previous work (Colangelo et al., 2005,
2007; Granjon et al., 2012), we identified two lineages that
may represent separate but unrecognized species. The first,
Gerbilliscus sp. n. (Babile), was first reported as a genetically
distinct lineage (12.5–17.6% CYTB genetic distance from
other species in the eastern clade; see Table 1) from the
Babile Elephant Sanctuary in eastern Ethiopia (Lavrenchenko
Journal of Biogeography 44, 2295–2307
ª 2017 John Wiley & Sons Ltd
2299
Phylogeny of Somali-Masai gerbils
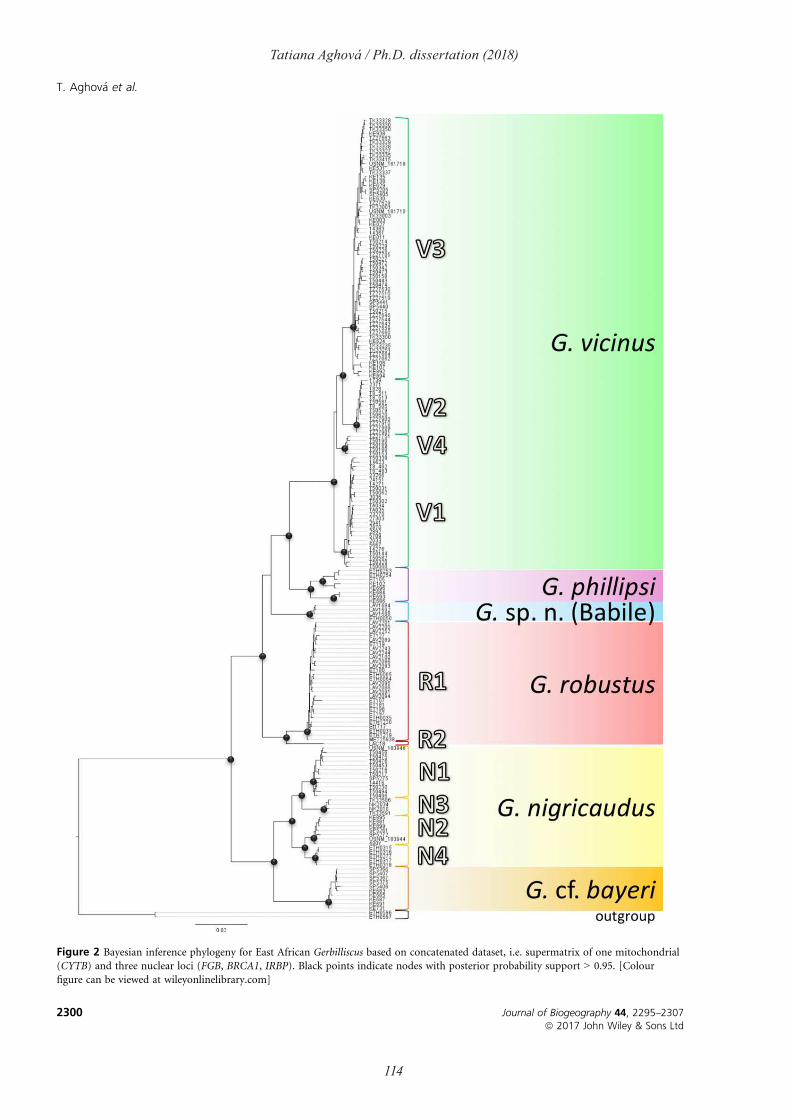
114
Tatiana Aghová / Ph.D. dissertation (2018)
Figure 2 Bayesian inference phylogeny for East African Gerbilliscus based on concatenated dataset, i.e. supermatrix of one mitochondrial
(CYTB) and three nuclear loci (FGB, BRCA1, IRBP). Black points indicate nodes with posterior probability support > 0.95. [Colour
figure can be viewed at wileyonlinelibrary.com]
Journal of Biogeography 44, 2295–2307
ª 2017 John Wiley & Sons Ltd
2300
T. Aghov�a et al.

115
Tatiana Aghová / Ph.D. dissertation (2018)
et al., 2010). We captured additional individuals at the same
site, and increased our sample by adding museum specimens
from additional localities in Ethiopia and Somalia. A coales-
cence-based species tree demonstrated that G. sp. n. (Babile)
is a sister lineage to G. robustus, from which it seems to be
separated by a mountain ridge in the eastern Ethiopian high-
lands (Fig. 1). The second currently unrecognized species we
referred to as G. cf. bayeri. We sequenced a syntype of G.
nigricaudus bayeri (RMCA5183-M) from Maroon River in
western Kenya, and it clustered within a clade distributed
west of the Rift Valley, as sister to G. nigricaudus. Based on
the results of a coalescent species delimitation and high
CYTB genetic distances (13.4–15.1% from G. nigricaudus),
this clade may deserve the status of a distinct species status
(see also Bates, 1988). Taxonomic revision of the group,
including morphological analyses and formal descriptions of
these taxa, is currently in preparation and will be published
elsewhere (M.M. McDonough et al., unpublished data).
Three taxa, G. sp. n. (Babile), G. phillipsi and G. cf. bayeri,
exhibited relatively small geographical distributions (Fig. 1),
although this could be a result of limited sampling in some
regions. For example, G. sp. n. (Babile) may be more wide-
spread in southeastern Ethiopia and part of Somalia, and
museum records of G. robustus or G. phillipsi from Somalia
(Monadjem et al., 2015) may in fact represent this species
(M.M. McDonough et al., unpublished data). On the other
hand, present records of G. sp. n. (Babile) suggest its occur-
rence is associated with transitional semi-evergreen bushland
(van Breugel et al., 2016), which is localized only in the nar-
row belt along mountain chains in Ethiopia. Gerbilliscus cf.
bayeri has a limited distribution in western Kenya and South
Sudan (and potentially also in northern Uganda). On the
Figure 3 Coalescent based species tree for Gerbilliscus in East
Africa generated using *BEAST, visualized by DensiTree.
Posterior probability of nodes is indicated in boxes.
Figure 4 Ultrametric Bayesian tree generated using BEAST with dated divergences for East African Gerbilliscus (i.e. TMRCAs) and 95%
highest posterior densities (HPDs). Stars indicate the position of palaeontological records used for calibration of the tree.
Journal of Biogeography 44, 2295–2307
ª 2017 John Wiley & Sons Ltd
2301
Phylogeny of Somali-Masai gerbils

116
Tatiana Aghová / Ph.D. dissertation (2018)
other hand, the three remaining species (G. robustus, G. vici-
nus, G. nigricaudus) have large distributions. Conspicuous
intraspecific structure of these species (e.g. Fig. S1 in
Appendix S3) can be used to propose and test phylogeo-
graphical hypotheses related to the Plio-Pleistocene history
of gerbils and, to some extent, also the biota of the Somali-
Masai bioregion in general.
Evolutionary history of the eastern clade of
Gebilliscus and a scenario of diversification in the
Somali-Masai savanna
This study is the first, to our knowledge, to focus on the
detailed phylogeography of any group living predominantly
in the Somali-Masai savanna. We estimated the origin of the
genus Gerbilliscus as dating back to the late Miocene. Previ-
ous estimates of TMRCA varied, according the calibration
points and genetic markers used, between 6.3 and 8.5 Ma
(Chevret & Dobigny, 2005; Colangelo et al., 2005, 2007),
which is in agreement with our results. Based on our esti-
mated divergence dates, the Plio-Pleistocene evolution of the
eastern Gerbilliscus clade seems to have been influenced by
several major climatic events. Very little is known about the
effect of the Messinian salinity crisis on eastern African cli-
mate (Maslin & Christensen, 2007), but it is generally held
that overall aridification at the Miocene/Pliocene boundary
promoted the expansion of very dry habitats (Hodell et al.,
2001). Due to the fact that arid parts of the extant Somali-
Masai savanna (e.g. Masai-xeric shrubland) are likely to by
uninhabitable by Gerbilliscus (as is northern Kenya today;
Figs 1 & 5), we hypothesize that such aridification led to the
early-Pliocene split between the robustus group in the north
and the nigricaudus group in the south.
The intensification of Northern Hemisphere glaciation is
likely to have had similar effects, reflected in the African as
an increase in aridity c. 2.7 Ma (deMenocal, 2004). Our esti-
mates of divergence dates suggest that prolonged intervals of
wet-dry climatic oscillations (Potts, 2013) generated direc-
tional selection pressures driven by the expansion and con-
traction of grasslands. The oldest divergence within the
robustus group occurred around 2.5 Ma. Two Pleistocene
climatic transitions, the development of the Walker circula-
tion (2.0–1.7 Ma; Ravelo et al., 2004) and the early-middle
Pleistocene transition (1.2–0.8 Ma; Berger & Jansen, 1994),
also significantly affected the ecosystems in eastern Africa.
The Walker circulation increased the interannual variation in
rainfall and the early-mid Pleistocene transition prolonged
and intensified glacial-interglacial climatic cycles. Both transi-
tions also helped the spread of C4 plants (Cerling et al.,
1988). Both hominins (Homo ergaster and Homo erectus) and
a number of ungulate species associated with grassland habi-
tats first appeared between 2.0 and 1.9 Ma (Bobe, 2004). In
eastern Gerbilliscus, this period seems to be associated with
synchronous diversification of extant sister species (Fig. 4),
while the subsequent intensification of climatic cycles appar-
ently affected allopatric divergences within species with large
distribution areas (see e.g. Fig. S1 in Appendix S3).
Additionally, the local geomorphology played an impor-
tant role in evolution of the East African biota. For example,
Gerbilliscus robustus is separated from G. sp. n. (Babile) by a
mountain chain that apparently prevents the dispersal of
both taxa across high altitude areas with very different envi-
ronmental conditions (Fig. 1). One of most influential land-
scape features in the evolution of small mammals in the
Somali-Masai region is the Rift Valley (Trauth et al., 2010).
Rifting generated numerous depressions which were repeat-
edly filled with water, and which were highly sensitive to
changes in the local precipitation-evaporation regime (Maslin
et al., 2014). Rift basins, either filled with water or extremely
dry with halophytic vegetation (White, 1983) could prevent
the dispersal of small terrestrial animals (Trauth et al., 2010).
Gerbilliscus biogeography appears to reflect the influence of
the Rift Valley both from east to west (G. cf. bayeri versus G.
nigricaudus, G. nigricaudus N2 versus N4 and N1 versus N3,
Figure 5 MaxEnt results of (a) the present distribution of suitable habitats for East African Gerbilliscus clade as typical representatives
of Somali-Masai fauna (red dots indicate confirmed presence data); (b) MaxEnt prediction for last glacial maximum (21 ka). (c)
MaxEnt prediction for last interglacial period (120–140 ka). Green colour represent habitats that are suitable for the eastern
Gerbilliscus, while yellow-orange are not. [Colour figure can be viewed at wileyonlinelibrary.com]
Journal of Biogeography 44, 2295–2307
ª 2017 John Wiley & Sons Ltd
2302
T. Aghov�a et al.
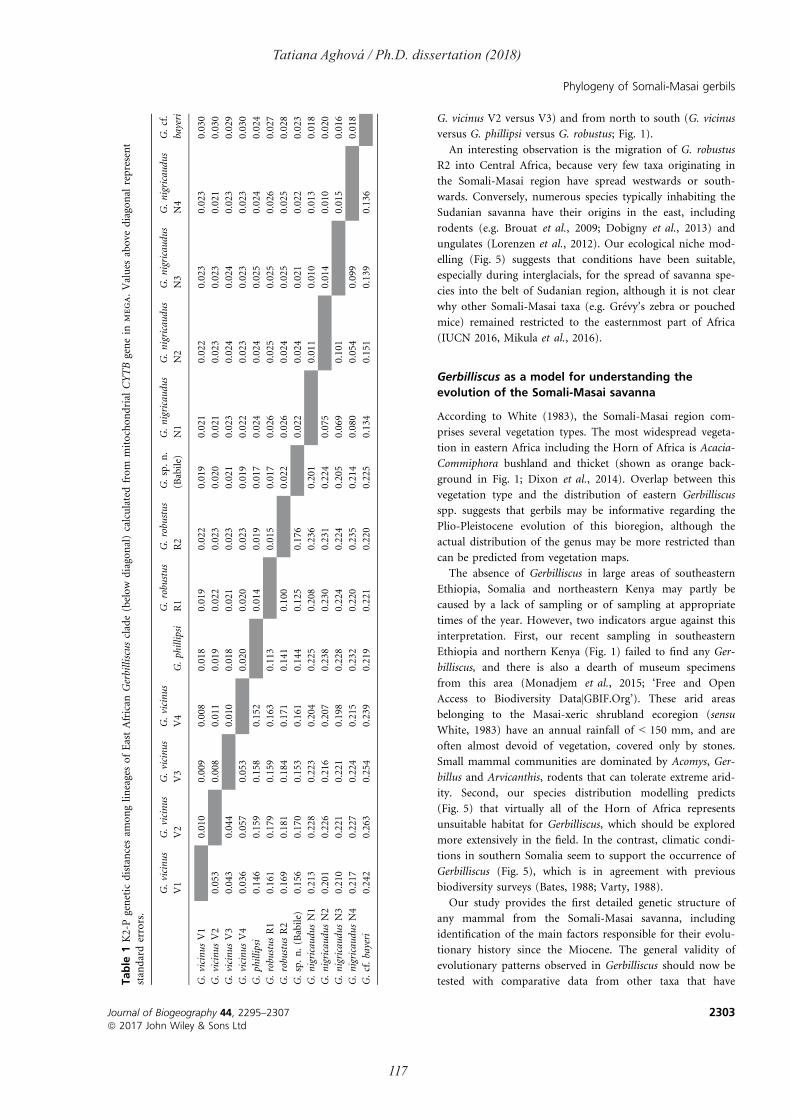
117
Tatiana Aghová / Ph.D. dissertation (2018)
G. vicinus V2 versus V3) and from north to south (G. vicinus
versus G. phillipsi versus G. robustus; Fig. 1).
An interesting observation is the migration of G. robustus
R2 into Central Africa, because very few taxa originating in
the Somali-Masai region have spread westwards or south-
wards. Conversely, numerous species typically inhabiting the
Sudanian savanna have their origins in the east, including
rodents (e.g. Brouat et al., 2009; Dobigny et al., 2013) and
ungulates (Lorenzen et al., 2012). Our ecological niche mod-
elling (Fig. 5) suggests that conditions have been suitable,
especially during interglacials, for the spread of savanna spe-
cies into the belt of Sudanian region, although it is not clear
why other Somali-Masai taxa (e.g. Gr�evy’s zebra or pouched
mice) remained restricted to the easternmost part of Africa
(IUCN 2016, Mikula et al., 2016).
Gerbilliscus as a model for understanding the
evolution of the Somali-Masai savanna
According to White (1983), the Somali-Masai region com-
prises several vegetation types. The most widespread vegeta-
tion in eastern Africa including the Horn of Africa is Acacia-
Commiphora bushland and thicket (shown as orange back-
ground in Fig. 1; Dixon et al., 2014). Overlap between this
vegetation type and the distribution of eastern Gerbilliscus
spp. suggests that gerbils may be informative regarding the
Plio-Pleistocene evolution of this bioregion, although the
actual distribution of the genus may be more restricted than
can be predicted from vegetation maps.
The absence of Gerbilliscus in large areas of southeastern
Ethiopia, Somalia and northeastern Kenya may partly be
caused by a lack of sampling or of sampling at appropriate
times of the year. However, two indicators argue against this
interpretation. First, our recent sampling in southeastern
Ethiopia and northern Kenya (Fig. 1) failed to find any Ger-
billiscus, and there is also a dearth of museum specimens
from this area (Monadjem et al., 2015; ‘Free and Open
Access to Biodiversity Data|GBIF.Org’). These arid areas
belonging to the Masai-xeric shrubland ecoregion (sensu
White, 1983) have an annual rainfall of < 150 mm, and are
often almost devoid of vegetation, covered only by stones.
Small mammal communities are dominated by Acomys, Ger-
billus and Arvicanthis, rodents that can tolerate extreme arid-
ity. Second, our species distribution modelling predicts
(Fig. 5) that virtually all of the Horn of Africa represents
unsuitable habitat for Gerbilliscus, which should be explored
more extensively in the field. In the contrast, climatic condi-
tions in southern Somalia seem to support the occurrence of
Gerbilliscus (Fig. 5), which is in agreement with previous
biodiversity surveys (Bates, 1988; Varty, 1988).
Our study provides the first detailed genetic structure of
any mammal from the Somali-Masai savanna, including
identification of the main factors responsible for their evolu-
tionary history since the Miocene. The general validity of
evolutionary patterns observed in Gerbilliscus should now be
tested with comparative data from other taxa that haveTable
1K2-Pgenetic
distancesam
onglineagesofEastAfrican
Gerbilliscusclade(below
diagonal)calculatedfrom
mitochondrial
CYTBgenein
mega.Values
above
diagonal
represent
standarderrors.
G.vicinus
V1
G.vicinus
V2
G.vicinus
V3
G.vicinus
V4
G.phillipsi
G.robustus
R1
G.robustus
R2
G.sp.n.
(Babile)
G.nigricaudus
N1
G.nigricaudus
N2
G.nigricaudus
N3
G.nigricaudus
N4
G.cf.
bayeri
G.vicinusV1
0.010
0.009
0.008
0.018
0.019
0.022
0.019
0.021
0.022
0.023
0.023
0.030
G.vicinusV2
0.053
0.008
0.011
0.019
0.022
0.023
0.020
0.021
0.023
0.023
0.021
0.030
G.vicinusV3
0.043
0.044
0.010
0.018
0.021
0.023
0.021
0.023
0.024
0.024
0.023
0.029
G.vicinusV4
0.036
0.057
0.053
0.020
0.020
0.023
0.019
0.022
0.023
0.023
0.023
0.030
G.phillipsi
0.146
0.159
0.158
0.152
0.014
0.019
0.017
0.024
0.024
0.025
0.024
0.024
G.robustusR1
0.161
0.179
0.159
0.163
0.113
0.015
0.017
0.026
0.025
0.025
0.026
0.027
G.robustusR2
0.169
0.181
0.184
0.171
0.141
0.100
0.022
0.026
0.024
0.025
0.025
0.028
G.sp.n.(Babile)
0.156
0.170
0.153
0.161
0.144
0.125
0.176
0.022
0.024
0.021
0.022
0.023
G.nigricaudusN1
0.213
0.228
0.223
0.204
0.225
0.208
0.236
0.201
0.011
0.010
0.013
0.018
G.nigricaudusN2
0.201
0.226
0.216
0.207
0.238
0.230
0.231
0.224
0.075
0.014
0.010
0.020
G.nigricaudusN3
0.210
0.221
0.221
0.198
0.228
0.224
0.224
0.205
0.069
0.101
0.015
0.016
G.nigricaudusN4
0.217
0.227
0.224
0.215
0.232
0.220
0.235
0.214
0.080
0.054
0.099
0.018
G.cf.bayeri
0.242
0.263
0.254
0.239
0.219
0.221
0.220
0.225
0.134
0.151
0.139
0.136
Journal of Biogeography 44, 2295–2307
ª 2017 John Wiley & Sons Ltd
2303
Phylogeny of Somali-Masai gerbils

118
Tatiana Aghová / Ph.D. dissertation (2018)
similar ecological requirements distributions (‘community
phylogeography; e.g. Hickerson & Meyer, 2008). Several
other small mammals associated with Somali-Masai savanna
habitats (e.g. spiny mice, genus Acomys; grass rats, Arvican-
this; meadow mice, Myomyscus; arid-adapted shrews, genus
Crocidura) are suitable models for such studies. The results
of a comparative study could provide robust conclusions
regarding biogeographical processes operating during the
Plio-Pleistocene in these dry and endangered ecosystems in
northeastern Africa.
ACKNOWLEDGEMENTS
This study was supported by two projects of the Czech Science
Foundation, nos. P506/10/0983 and 15-20229S, the Ministry
of Culture of the Czech Republic (DKRVO 2017/15, National
Museum, 00023272) and the Russian Foundation for Basic
Research (project no. 15-04-03801-a). For help during the
field work we acknowledge V. Mazoch, H. Konvi ckov!a, J.
Vrbov!a Kom!arkov!a, J. Kr!asov!a, A. H!anov!a, A. Kone cn!y, L.
Cuypers, C. Sabuni, A. Katakweba, A. Massawe, J. Skl!ıba, K.
Welegerima, A. Ribas, F. Sedl!a cek and all local collaborators.
We would like to thank also J. Vot!ypka and S. Gryseels for
providing samples. For help with genotyping we acknowledge
H. Konvi ckov!a and A. Bryjov!a. A. Dehne-Garcia, G. J. Ker-
goat, J. Sm!ıd and A. Drummond helped with the design of
data analysis. We thank P.J.J. Bates, P. van Breugel and I. Friis
for additional information. Most analyses were run on the
Czech-grid infrastructure METACENTRUM, minor part then
on CIPRES Gateway or CBGP cluster. We also thank the cura-
tors that allowed us to study the tissue collections in their
care: J. Phelps and B. Stanley (FMNH), N. Duncan (AMNH),
D. Moerike (SMNS), and W. Wendelen (RMCA). We also
would like to thank Judith Masters and four anonymous
reviewers for their useful comments on an earlier version of
the manuscript.
REFERENCES
Bandelt, H.J., Forster, P. & R€ohl, A. (1999) Median-joining
networks for inferring intraspecific phylogenies. Molecular
Biology and Evolution, 16, 37–48.
Bates, P.J.J. (1988) Systematics and zoogeography of Tatera
(Rodentia: Gerbillinae) of north-east Africa and Asia. Bon-
ner zoologische Beitr€age, 39, 265–303.
Berger, W.H. & Jansen, E. (1994) Mid-Pleistocene climate
shift: the Nansen connection. The polar oceans and their
role in shaping the global environment (ed. by O.M. Johan-
nessen, R.D. Muench and J.E. Overland). AGU Geophysical
Monograph Series, 85, 295–311.
Bivand, R. & Lewin-Koh, N. (2016) maptools: Tools for
reading and handling spatial objects. R package version
0.8-39. Available at https://CRAN.R-project.org/package=
maptools
Bobe, R. (2004) The expansion of grassland ecosystems in
Africa in relation to mammalian evolution and the origin
of the genus Homo. Palaeogeography, Palaeoclimatology,
Palaeoecology, 207, 399–420.
Bouckaert, R.R. (2010) DensiTree: making sense of sets of
phylogenetic trees. Bioinformatics, 26, 1372–1373.
Braconnot, P., Otto-Bliesner, B., Harrison, S. et al. (2007)
Results of PMIP2 coupled simulations of the Mid-Holo-
cene and Last Glacial Maximum - Part 1: experiments and
large-scale features. Climate of the Past, 3, 261–277.
van Breugel, P., Friis, I. & Demissew, S. (2016) The transi-
tional semi-evergreen bushland in Ethiopia : characteriza-
tion and mapping of its distribution using predictive
modelling. Applied Vegetation Science, 19, 355–367.
Brouat, C., Tatard, C., Ba, K., Cosson, J.-F., Dobigny, G.,
Fichet-Calvet, E., Granjon, L., Lecompte, E., Loiseau, A.,
Mouline, K., Piry, S. & Duplantier, J.-M. (2009) Phylo-
geography of the Guinea multimammate mouse (Masto-
mys erythroleucus): a case study for Sahelian species in
West Africa. Journal of Biogeography, 36, 2237–2250.
Bryja, J., Mikula, O., Sumbera, R., Meheretu, Y., Aghov!a, T.,
Lavrenchenko, L.A., Mazoch, V., Oguge, N., Mbau, J.S.,
Welegerima, K., Amundala, N., Colyn, M., Leirs, H. &
Verheyen, E. (2014) Pan-African phylogeny of Mus (sub-
genus Nannomys) reveals one of the most successful mam-
mal radiations in Africa. BMC Evolutionary Biology, 14,
256.
Burgess, N.D., Butynski, T.M., Cordeiro, N.J., Doggart, N.H.,
Fjelds, J., Howell, K.M., Kilahama, F.B., Loader, S.P.,
Lovett, J.C., Mbilinyi, B., Menegon, M., Moyer, D.C.,
Nashanda, E., Perkin, A., Rovero, F., Stanley, W.T. & Stu-
art, S.N. (2007) The biological importance of the Eastern
Arc Mountains of Tanzania and Kenya. Biological Conser-
vation, 134, 209–231.
Cerling, T.E., Bowman, J.R. & O’Neil, J.R. (1988) An iso-
topic study of a fluvial-lacustrine sequence: the Plio-Pleis-
tocene koobi fora sequence, East Africa. Palaeogeography,
Palaeoclimatology, Palaeoecology, 63, 335–356.
Cerling, T.E., Wynn, J.G., Andanje, S.A., Bird, M.I., Korir,
D.K., Levin, N.E., Mace, W., Macharia, A.N., Quade, J.
& Remien, C.H. (2011) Woody cover and hominin
environments in the past 6 million years. Nature, 476,
51–56.
Chevret, P. & Dobigny, G. (2005) Systematics and evolution
of the subfamily Gerbillinae (Mammalia, Rodentia, Muri-
dae). Molecular Phylogenetics and Evolution, 35, 674–688.
Colangelo, P., Corti, M., Verheyen, E., Annesi, F., Oguge,
N., Makundi, R.H. & Verheyen, W. (2005) Mitochon-
drial phylogeny reveals differential modes of chromoso-
mal evolution in the genus Tatera (Rodentia:
Gerbillinae) in Africa. Molecular Phylogenetics and Evolu-
tion, 35, 556–568.
Colangelo, P., Granjon, L., Taylor, P.J. & Corti, M. (2007)
Evolutionary systematics in African gerbilline rodents of
the genus Gerbilliscus: inference from mitochondrial genes.
Molecular Phylogenetics and Evolution, 42, 797–806.
Colangelo, P., Castiglia, R., Franchini, P. & Solano, E. (2010)
Pattern of shape variation in the eastern African gerbils of
Journal of Biogeography 44, 2295–2307
ª 2017 John Wiley & Sons Ltd
2304
T. Aghov!a et al.
119
Tatiana Aghová / Ph.D. dissertation (2018)
the genus Gerbilliscus (Rodentia, Muridae): environmental
correlations and implication for taxonomy and systemat-
ics. Mammalian Biology – Zeitschrift f€ur S€augetierkunde,
75, 302–310.
Cowling, S.A., Cox, P.M., Jones, C.D., Maslin, M.A., Peros,
M. & Spall, S.A. (2008) Simulated glacial and interglacial
vegetation across Africa: implications for species phyloge-
nies and trans-African migration of plants and animals.
Global Change Biology, 14, 827–840.
Craigie, I.D., Baillie, J.E.M., Balmford, A., Carbone, C., Col-
len, B., Green, R.E. & Hutton, J.M. (2010) Large mammal
population declines in Africa’s protected areas. Biological
Conservation, 143, 2221–2228.
Degnan, J. H., & Rosenberg, N. A. (2009). Gene tree discor-
dance, phylogenetic inference and the multispecies coales-
cent. Trends in Ecology & Evolution, 24, 332–340.
deMenocal, P.B. (2004) African climate change and faunal
evolution during the Pliocene-Pleistocene. Earth and Plan-
etary Science Letters, 220, 3–24.
Dixon, A.P., Faber-Langendoen, D., Josse, C., Morrison, J. &
Loucks, C.J. (2014) Distribution mapping of world grass-
land types. Journal of Biogeography, 41, 2003–2019.
Dobigny, G., Tatard, C., Gauthier, P., Ba, K., Duplantier,
J.M., Granjon, L. & Kergoat, G.J. (2013) Mitochondrial
and nuclear genes-based phylogeography of Arvicanthis
niloticus (Murinae) and sub-Saharan open habitats Pleis-
tocene history. PLoS ONE, 8, e77815.
Drummond, A.J., Ho, S.Y.W., Phillips, M.J., & Rambaut, A.
(2006). Relaxed phylogenetics and dating with confidence.
PLoS Biology, 4, e88.
Drummond, A.J. & Rambaut, A. (2007) BEAST: Bayesian
evolutionary analysis by sampling trees. BMC Evolutionary
Biology, 7, 214.
Drummond, A.J., Suchard, M.A., Xie, D. & Rambaut, A.
(2012) Bayesian phylogenetics with BEAUti and the BEAST
1.7. Molecular Biology and Evolution, 29, 1969–1973.
Dupont, L. (2011) Orbital scale vegetation change in Africa.
Quaternary Science Reviews, 30, 3589–3602.
Faber-Langendoen, D., Keeler-Wolf, T., Meidinger, D., Tart,
D., Hoagland, B., Josse, C., Navarro, G., Ponomarenko, S.,
Saucier, J.P., Weakley, A. & Comer, P. (2014) EcoVeg: a
new approach to vegetation description and classification.
Ecological Monographs, 84, 533–561.
Galan, M., Page, M. & Cosson, J.F. (2012) Next-gseneration
sequencing for rodent barcoding: species identification
from fresh. Degraded and environmental samples. PloS
ONE, 7, e48374.
Geist, H.J. & Lambin, E.F. (2004) Dynamic causal patterns of
desertification. BioScience, 54, 817.
Gernhard, T. (2008) The conditioned reconstructed process.
Journal of Theoretical Biology, 253, 769–778.
Gouy, M., Guindon, S. & Gascuel, O. (2010) SeaView Ver-
sion 4: a multiplatform graphical user interface for
sequence alignment and phylogenetic tree building. Molec-
ular Biology and Evolution, 27, 221–224.
Granjon, L., Colangelo, P., Tatard, C., Colyn, M., Dobigny,
G. & Nicolas, V. (2012) Intrageneric relationships within
Gerbilliscus (Rodentia, Muridae, Gerbillinae), with charac-
terization of an additional West African species. Zootaxa,
25, 1–25.
Heled, J. & Drummond, A.J. (2010) Bayesian inference of
species trees from multilocus data. Molecular Biology and
Evolution, 27, 570–580.
Hickerson, M.J. & Meyer, C.P. (2008) Testing comparative
phylogeographic models of marine vicariance and dispersal
using a hierarchical Bayesian approach. BMC Evolutionary
Biology, 8, 322.
Hijmans, R.J. (2015) raster: Geographic data analysis and
modeling. R package version 2.5-2. Available at: https://
CRAN.R-project.org/package=raster
Hijmans, R.J., Cameron, S.E., Parra, J.L., Jones, P.G. & Jarvis,
A. (2005) Very high resolution interpolated climate sur-
faces for global land areas. International Journal of Clima-
tology, 25, 1965–1978.
Hijmans, R.J., Phillips, S., Leathwick, J. & Elith, J. (2016) dismo:
Species distribution modeling. R package version 1.0-15.
Available at: https://CRAN.R-project.org/package=dismo
Hodell, D.A., Curtis, J.H., Sierro, F.J. & Raymo, M.E. (2001)
Correlation of Late Miocene to Early Pliocene sequences
between the Mediterranean and North Atlantic. Paleo-
ceanography, 16, 164–178.
IUCN (2016) The IUCN red list of threatened species. Version
2016-2. Available at: www.iucnredlist.org (accessed 4
November 2016).
Katoh, K. & Standley, D.M. (2013) MAFFT Multiple
Sequence Alignment Software Version 7: improvements in
performance and usability. Molecular Biology and Evolu-
tion, 30, 772–780.
Kebede, F., Rosenbom, S., Khalatbari, L., Moehlman, P.D.,
Beja-Pereira, A., & Bekele, A. (2016). Genetic diversity of
the Ethiopian Grevy’s zebra (Equus grevyi) populations
that includes a unique population of the Alledeghi Plain.
Mitochondrial DNA Part A, 27, 397–400.
Kingdon, J. (1990) Island Africa: the evolution of Africa’s rare
animals and plants. Collins, London.
Lanfear, R., Calcott, B., Kainer, D., Mayer, C. & Sta-
matakis, A. (2014) Selecting optimal partitioning
schemes for phylogenomic datasets. BMC Evolutionary
Biology, 14, 1.
Lavrenchenko, L.A., Kruskop, S.V., Bekele, A., Belay, G.,
Morozov, P.N., Ivlev, Y.F. & Warshavsky, A.A. (2010)
Mammals of the Babille elephant sanctuary (Eastern Ethio-
pia). sRussian Journal of Theriology, 9, 47–60.
Librado, P. & Rozas, J. (2009) DnaSP v5: a software for com-
prehensive analysis of DNA polymorphism data. Bioinfor-
matics, 25, 1451–1452.
Linder, H.P., de Klerk, H.M., Born, J., Burgess, N.D., Fjelds!a,
J. & Rahbek, C. (2012) The partitioning of Africa: statisti-
cally defined biogeographical regions in sub-Saharan
Africa. Journal of Biogeography, 39, 1189–1205.
Journal of Biogeography 44, 2295–2307
ª 2017 John Wiley & Sons Ltd
2305
Phylogeny of Somali-Masai gerbils
120
Tatiana Aghová / Ph.D. dissertation (2018)
Lorenzen, E.D., Heller, R., & Siegismund, H.R. (2012). Com-
parative phylogeography of African savannah ungulates.
Molecular Ecology, 21, 3656–3670.
Maslin, M.A. & Christensen, B. (2007) Tectonics, orbital
forcing, global climate change, and human evolution in
Africa: introduction to the African paleoclimate special
volume. Journal of Human Evolution, 53, 443–464.
Maslin, M.A., Brierley, C.M., Milner, A.M., Shultz, S.,
Trauth, M.H. & Wilson, K.E. (2014) East african climate
pulses and early human evolution. Quaternary Science
Reviews, 101, 1–17.
Maslin, M.A., Shultz, S. & Trauth, M.H. (2015) A synthesis
of the theories and concepts of early human evolution.
Philosophical Transactions of the Royal Society B: Biological
Sciences, 370, 20140064.
McDonough, M.M., Sumbera, R., Mazoch, V., Ferguson,
A.W., Phillips, C.D. & Bryja, J. (2015) Multilocus phylo-
geography of a widespread savanna-woodland-adapted
rodent reveals the influence of Pleistocene geomorphology
and climate change in Africa’s Zambezi region. Molecular
Ecology, 24, 5248–5266.
Mikula, O., Sumbera, R., Aghov!a, T., Mbau, J.S., Katak-
weba, A.S., Sabuni, C.A., & Bryja, J. (2016). Evolution-
ary history and species diversity of African pouched
mice (Rodentia: Nesomyidae: Saccostomus). Zoologica
Scripta, 45, 595–617.
Monadjem, A., Taylor, P.J., Denys, C. & Cotterill, F.P.D.
(2015) Rodents of Sub-Saharan Africa. A biographic and
taxonomic synthesis. Walter de Gruyter GmbH, Berlin/
Munich/Boston.
Muscarella, R., Galante, P.J., Soley-Guardia, M., Boria, R.A.,
Kass, J.M., Uriarte, M. & Anderson, R.P. (2014) ENMeval:
an R package for conducting spatially independent evalua-
tions and estimating optimal model complexity for Max-
ent ecological niche models. Methods in Ecology and
Evolution, 5, 1198–1205.
Otto-Bliesner, B.L. (2006) Simulating Arctic climate warmth
and icefield retreat in the last interglaciation. Science, 311,
1751–1753.
Phillips, S.J., Anderson, R.P. & Schapire, R.E. (2006) Maxi-
mum entropy modeling of species geographic distribu-
tions. Ecological Modelling, 190, 231–259.
Potts, R. (2013) Hominin evolution in setings of strong envi-
ronmental variability. Quaternary Science Reviews, 73, 1–13.
Rambaut, A., Suchard, M.A., Xie, D. & Drummond, A.J.
(2014) Tracer v1.6. Available at: http://beast.bio.ed.ac.uk/
Tracer.
Randi, E., D’Huart, J.P., Lucchini, V. & Aman, R. (2002)
Evidence of two genetically deeply divergent species of
warhthog, Phacochoerus africanus and P. aethiopicus
(Artiodactyla: Suiformes) in Eastern Africa. Mammalian
Biology, 67, 91–96.
Ravelo, A.C., Andreasen, D.H., Lyle, M., Olivarez Lyle, A. &
Wara, M.W. (2004) Regional climate shifts caused by
gradual global cooling in the Pliocene epoch. Nature, 429,
263–267.
Ronquist, F., Teslenko, M., van der Mark, P., Ayres, D.L.,
Darling, A., H€ohna, S., Larget, B., Liu, L., Suchard, M.A.
& Huelsenbeck, J.P. (2012) MrBayes 3.2: efficient Bayesian
phylogenetic inference and model choice across a large
model space. Systematic Biology, 61, 539–542.
Sayre, R., Comer, P., Hak, J., et al. (2013). A new map of
standardized terrestrial ecosystems of Africa. Washington,
DC: Association of American Geographers. 24 pp.
Sepulchre, P., Ramstein, G., Fluteau, F., Schuster, M., Tierce-
lin, J.-J. & Brunet, M. (2006) Tectonic uplift and Eastern
Africa aridification. Science, 313, 1419–1423. Sm!ıd, J., Carranza, S., Kratochv!ıl, L., Gvo zd!ık, V., Nasher,
A.K. & Moravec, J. (2013) Out of Arabia: a complex bio-
geographic history of multiple vicariance and dispersal
events in the gecko genus Hemidactylus (Reptilia: Gekkoni-
dae). PLoS ONE, 8, e64018.
Stamatakis, A. (2006) RAxML-VI-HPC: maximum likeli-
hood-based phylogenetic analyses with thousands of taxa
and mixed models. Bioinformatics (Oxford, England), 22,
2688–2690.
Thulin, M. (ed.) (1993) Flora of Somalia: Vol. 1 – Pterido-
phyta; Gymnospermae; Angiospermae (Annonaceae-Faba-
ceae). Royal Botanic Gardens, Kew.
Thulin, M., Lavin, M., Pasquet, R. & Delgado-Salinas, A.
(2004) Phylogeny and biogeography of Wajira (Legumi-
nosae): a monophyletic segregate of Vigna centred in the
Horn of Africa region. Systematic Botany, 29, 903–920.
Trauth, M.H., Larrasoa~na, J.C. & Mudelsee, M. (2009)
Trends, rhythms and events in Plio-Pleistocene African cli-
mate. Quaternary Science Reviews, 28, 399–411.
Trauth, M.H., Maslin, M.A., Deino, A.L., Junginger, A.,
Lesoloyia, M., Odada, E.O., Olago, D.O., Olaka, L.A.,
Strecker, M.R. & Tiedemann, R. (2010) Human evolution
in a variable environment: the amplifier lakes of Eastern
Africa. Quaternary Science Reviews, 29, 2981–2988.
Uno, K.T., Pratigya, J.P. & Jackson, K.E. (2016) Neogene
biomarker record of vegetation change in eastern Africa.
Proceedings of the National Academy of Sciences USA, 113,
6355–6363.
Varshavsky, A.A., Karimova, T.Y. & Neronov, V.M. (2007)
Specific features of the rodent fauna formation in Somali
Peninsula. Zoologichesky Zhurnal, 86, 1498–1506.
Varty, N. (1988) Mammals and problems of their conserva-
tion in the riverine forests of the Jubba Valley, southern
Somalia. Tropical Zoology, 6975, 179–192.
Warren, D.L. & Seifert, S.N. (2011) Ecological niche model-
ing in Maxent : the importance of model complexity and
the performance of model selection criteria. Ecological
Applications, 21, 335–342.
White, F. (1983) Vegetation of Africa – A descriptive memoir
to accompany the UNESCO/AETFAT/UNSO vegetation map
of Africa. Natural Resources Research Report XX.
UNESCO, Paris.
Yang, Z. & Rannala, B. (2014) Unguided species delimitation
using DNA sequence data from multiple loci. Molecular
Biology and Evolution, 31, 3125–3135.
Journal of Biogeography 44, 2295–2307
ª 2017 John Wiley & Sons Ltd
2306
T. Aghov!a et al.
121
Tatiana Aghová / Ph.D. dissertation (2018)
SUPPORTING INFORMATION
Additional Supporting Information may be found in the
online version of this article:
Appendix S1 Details on used individuals.
Appendix S2 Additions to materials and methods.
Appendix S3 Additions to results.
DATA ACCESSIBILITY
New sequences used in this study are available in GenBank
under accession numbers KU965898–KU966133 and
KY352044–KY352064. Further details on used specimens
and museum vouchers are specified in Table S1 in
Appendix S1.
BIOSKETCH
Tatiana Aghov�a is PhD student working on phylogeogra-
phy of African savanna ecosystems using rodents as a model
organism, under supervision of Josef Bryja and Radim Sumbera.
Author contributions: J.B. and R.S. conceived the idea; T.A.,
R.S., O.M., M.M., L.L., Y.M., J.M. and J.B. participated to
sampling in the field; T.A., L.P. and M.M. genotyped the
material. T.A. and O.M. analysed the data, T.A., R.S. and
J.B. wrote the first version of the manuscript that was
approved by all authors.
Editor: Judith Masters
Journal of Biogeography 44, 2295–2307
ª 2017 John Wiley & Sons Ltd
2307
Phylogeny of Somali-Masai gerbils

123
Tatiana Aghová / Ph.D. dissertation (2018)
Fossils know it best: using a new set of
fossil calibrations to improve the
temporal phylogenetic framework of
murid rodents (Rodentia: Myomorpha:
Muroidea: Muridae)
Aghová T., Kimura Y, Bryja J., Dobigny G., Granjon L.,
Kergoat G.J. (Molecular Phylogenetics and Evolution, Major
revision); bioRxiv 180398, https://doi.org/10.1101/180398
Study design: GJK, GD, LG, JB
Collecting genetic data: TA
Collecting paleontological
data: TA, YK
Data analysis: TA, GK
Writing: TA, JB, GJK
My contribution: 80%
Paper
IV
Paper


125
Tatiana Aghová / Ph.D. dissertation (2018)
1
Title 1
Fossils know it best: using a new set of fossil calibrations to improve the temporal 2
phylogenetic framework of murid rodents (Rodentia: Myomorpha: Muroidea: 3
Muridae) 4
5
Authors 6
Tatiana Aghováa,b,c*, Yuri Kimurad, Josef Bryjaa,c, Gauthier Dobignye,f, Laurent Granjone, Gael 7
J. Kergoatg 8
9
Authors’ affiliations 10
a Institute of Vertebrate Biology of the Czech Academy of Sciences, !"#$%&'(&603 65, Brno, 11
Czech Republic 12
b Department of Zoology, National Museum, )%*+,!-./&$%0"-#1& 2'(& 334&56(&Prague, Czech 13
Republic 14
c Department of Botany and Zoology, Faculty of Science, Masaryk University, 7#+%8-.%&9(&611 15
37, Brno, Czech Republic 16
d Department of Geology and Paleontology, National Museum of Nature and Science, 4-1-1 17
Amakubo, Tsukuba, 305-0005 Ibaraki, Japan 18
e CBGP, IRD, CIRAD, INRA, Montpellier SupAgro, Univ. Montpellier, Montpellier, France 19
f :*7+;& <7+=#;*>$?@A;& BCDE70;=-Calavi, Abomey-Calavi University, 01BP2009, Cotonou, 20
Benin 21
g CBGP, INRA, CIRAD, IRD, Montpellier SupAgro, Univ. Montpellier, Montpellier, France 22
*Corresponding author: [email protected] 23
24
Running title: Dated phylogeny of Muridae 25
126
Tatiana Aghová / Ph.D. dissertation (2018)
2
Abstract 26
Murid rodents (Rodentia: Myomorpha: Muroidea: Muridae) represent the most diverse and 27
abundant mammalian group. In this study, we reconstruct a dated phylogeny of the family using 28
a multilocus dataset (six nuclear and nine mitochondrial gene fragments) encompassing 160 29
species representing 82 distinct murid genera from four extant subfamilies (Deomyinae, 30
Gerbillinae, Lophiomyinae, and Murinae). In comparison with previous studies on murid or 31
muroid rodents, our work stands out for the implementation of multiple fossil constraints within 32
the Muridae thanks to a thorough review of the fossil record. Before being assigned to specific 33
nodes of the phylogeny, all potential fossil constraints were carefully assessed; they were also 34
subjected to several cross-validation analyses. The resulting phylogeny is consistent with 35
previous phylogenetic studies on murids, and recovers the monophyly of all sampled murid 36
subfamilies and tribes. Based on nine controlled fossil calibrations, our inferred temporal 37
timeframe indicates that the murid family likely originated in the course of the Early Miocene, 38
23.0-16.0 million years ago (Ma), and that most major lineages (i.e. tribes) have started 39
diversifying ca. 10 Ma. Historical biogeography analyses support the Paleotropical origin for 40
the family, with an initial internal split (vicariance event) followed by subsequent migrations 41
between Afrotropical and Indomalayan lineages. During the course of their diversification, the 42
biogeographic pattern of murids is marked by several dispersal events toward the Australasian 43
and the Palearctic regions, mostly from the Indomalaya. The Afrotropical region was also 44
secondarily colonized at least three times from the Indomalaya, indicating that the latter region 45
has acted as a major centre of diversification for the family. 46
47
Keywords 48
Fossils, historical biogeography, molecular dating, Muridae, Mus, Rattus 49
50
127
Tatiana Aghová / Ph.D. dissertation (2018)
3
1. Introduction 51
With about 150 genera and more than 730 recognized species, Muridae is the most diverse 52
family of mammals (Musser and Carleton, 2005). Collectively murids have colonized highly 53
distinct ecological niches, adapting to a wide array of environments ranging from warm (deserts 54
or tropical forests) to cold habitats (high altitude mountain ranges, tundra; Vaughan et al., 55
2011). Life habits in murids are also diverse, as the family encompasses amphibious, arboreal, 56
fossorial, or terrestrial taxa (Michaux et al., 2007; Musser and Carleton, 2005). 57
All murid species are native to the Old World (Musser and Carleton, 2005), but some 58
species (especially the black rat Rattus rattus Linnaeus, the Norway rat Rattus norvegicus 59
(Berkenhout) and the house mouse Mus musculus Linnaeus) now have a worldwide distribution 60
due to commensalism and dissemination by humans. Murid species diversity is especially high 61
in the Australasian and Indomalayan regions which accommodate half of the species diversity 62
of the family (Rowe et al., 2016a). Second to that is the species diversity in the Afrotropical 63
region (more than 200 species; Musser and Carleton, 2005). By contrast, there are much less 64
native murid taxa in the Palearctic region (e.g. Apodemus Kaup, Diplothrix Thomas, or 65
Tokudaia Kuroda). 66
The history of murid systematics is complex and convoluted with numerous changes 67
occurring in the past sixty years (see Table 1 for a summary). Simpson (1945) divided 68
representatives of family Muridae (as currently understood) into two separate families: 69
Cricetidae (with subfamilies Gerbillinae, Lophiomyinae and others) and Muridae (subfamilies 70
Murinae and Otomyinae). Chaline et al. (1977) considered “murid” rodents to belong to four 71
families: Cricetidae (including Lophiomyinae), Gerbillidae, Muridae (exclusively Murinae) 72
and Nesomyidae (including Otomyinae). Lavocat (1978) simplified this classification by 73
recognizing only two families: Muridae (Murinae) and Nesomyidae (in which he included 74
Gerbillinae, Lophiomyinae and Otomyinae). Another major change was later made by Carleton 75

128
Tatiana Aghová / Ph.D. dissertation (2018)
4
and Musser (1984), who defined family Muridae in the broad sense with no less than 14 76
subfamilies (including Gerbillinae, Lophiomyinae, Murinae and Otomyinae). Following the 77
introduction of molecular systematics, changes in the classification of family Muridae 78
continued at a fast rate. Using molecular phylogenetics Chevret et al. (1993a) demonstrated that 79
Acomys I. Geoffroy is not a member of the subfamily Murinae but belongs to a separate 80
monophyletic clade including Deomys Thomas, Lophuromys Peters and Uranomys Dollman. 81
All four genera were assigned to the subfamily Deomyinae, which is closely related to the 82
Gerbillinae. In another study, Chevret et al. (1993b) showed that Otomyinae are closely allied 83
to the tribe Arvicanthini, thus unequivocally constituting a subset of the subfamily Murinae at 84
the tribe level (Ducroz et al., 2001; Jansa and Weksler, 2004). Jansa and Weksler (2004) also 85
strongly suggested that Lophiomyinae belonged to the Muridae. Only part of these proposals 86
was followed by Musser and Carleton (2005) who recognized the following five subfamilies in 87
the family Muridae: Deomyinae, Gerbillinae, Leimacomyinae, Murinae and Otomyinae. 88
Nowadays the most consensual classification agrees on five subfamilies: Deomyinae (four 89
genera and ca. 42 species), Gerbillinae (16 genera and ca. 103 species), Leimacomyinae (only 90
one species, possibly extinct; Kingdon, 2015), Lophiomyinae (only one species) and Murinae 91
(129 genera and ca. 584 species; see the review of Granjon and Montgelard, 2012). 92
Musser and Carleton's (2005) comprehensive catalogue listed 730 species in the family 93
Muridae. Estimates of species diversity in this family are very likely not definitive, as new 94
murid taxa are being regularly described (e.g. Carleton et al., 2015; Esselstyn et al., 2015; 95
Missoup et al., 2016; Mortelliti et al., 2016; Rowe et al., 2016a). Expected and ongoing raise in 96
species number can be accounted for by an increased focus on poorly known regions with high 97
levels of endemism, especially in tropical Asia and Africa. It is also linked with the 98
development of integrative taxonomy studies, where molecular genetic approaches are able to 99
129
Tatiana Aghová / Ph.D. dissertation (2018)
5
detect taxa and geographical regions with high cryptic diversity (e.g. Bryja et al., 2014, 2017; 100
Ndiaye et al., 2016). 101
Because of the high species richness of the family, determining the precise timing of its 102
radiation is of particular paleobiogeographic interest. Several dated estimates for the age of 103
Muridae are available owing to studies either focusing on the order Rodentia (Adkins et al., 104
2001, 2003; Fabre et al., 2012; Montgelard et al., 2008), on the superfamily Muroidea 105
(Muroidea; Schenk et al., 2013 ; Steppan et al., 2004) or on various murid subsets (e.g. Bryja 106
et al., 2014; Chevret and Dobigny, 2005; Dobigny et al., 2013; Fabre et al., 2013; Pagès et al., 107
2016; Rowe et al., 2008, 2011, 2016b). However, no clear consensus could be reached for the 108
age of the family Muridae. Indeed, age estimates derived from all aforementioned studies are 109
far from being congruent, likely because their datasets have not been designed for this particular 110
purpose. In addition, all these studies used very diverse dating procedures, some of them relying 111
on substitution rate calibrations (e.g. Arbogast et al., 2001; Nicolas et al., 2008) whereas others 112
used fixed ages (e.g. the putative Mus/Rattus split at 12 Ma; Steppan et al., 2004), very distant 113
fossil constrains (Adkins et al., 2003; Fabre et al., 2012; Montgelard et al., 2008) or primary 114
calibrations using various fossil constraints within or outside the family Muridae (e.g. Bryja et 115
al., 2014; Pagès et al., 2016; Rowe et al., 2016b; Schenk et al., 2013). 116
For fossil-based calibrations of molecular clocks, it is crucial: (i) to properly assign and 117
place fossils on the tree, and (ii) to correctly estimate the age of fossil-bearing formations 118
(Parham et al., 2012; Sauquet et al., 2012). Unfortunately the fossil record of oldest murids is 119
quite fragmentary and mostly consists of isolated teeth and mandible remains, thus sometimes 120
making taxonomic identification difficult. The earliest representatives for the family Muridae 121
include the tribe Myocricetodontini with genera such as †Myocricetodon Lavocat, †Dakkamys 122
Jaeger and †Mellalomys Jaeger (Jacobs and Flynn, 2005; Lazzari et al., 2011). Extinct members 123
of the genus †Potwarmus Lindsey could be considered as a stem group of the subfamily 124

130
Tatiana Aghová / Ph.D. dissertation (2018)
6
Murinae based on detailed analyses of dental morphology (Lazzari et al., 2011; López 125
Antoñanzas, 2009; Wessels, 2009). The earliest unequivocal representative of the subfamily 126
Murinae is the genus †Antemus Jacobs (Jacobs and Downs, 1994; Jacobs and Flynn, 2005; 127
Kimura et al., 2015). †Antemus possesses a new cusp (anterostyle, also known as t1), which is 128
a synapomorphy of Murinae. The earliest record of †Antemus chinjiensis is dated at 13.8 Ma 129
(Jacobs et al., 1990) based on specimens from the locality YGSP 491, Chinji Formation in the 130
Potwar Plateau, Pakistan (Jacobs, 1977). In the fossil record of the Potwar Plateau, two more 131
derived fossil genera are of particular interest: †Karnimata Jacobs and †Progonomys Schaub. 132
Based on the relative position of the anterostyle to the lingual anterocone on M1, Jacobs (1978) 133
hypothesized that †Karnimata is related to Rattus and that †Progonomys is a member of the 134
lineage including Mus. Hence, their first stratigraphic occurrence has been used to define the 135
widely used Mus/Rattus calibration (ca. 12 My; Jacobs and Downs, 1994). However, in 2015, 136
Kimura et al. revisited these fossils from a paleontological perspective and proved this 137
calibration point to be controversial. They showed that †Karnimata is a member of the 138
Arvicanthini-Millardini-Otomyini clade rather than a member of the lineage encompassing the 139
genus Rattus and its relatives (i.e. tribe Rattini). Therefore, they demonstrated that the 140
continuous fossil record of the murine rodents from the Potwar Plateau actually provides a 141
minimum age for the most recent common ancestor of the lineages leading to Arvicanthis 142
Lesson and Mus (= Mus/Arvicanthis split). 143
Recent progresses in divergence dating analyses lead us to revisit results previously 144
obtained by favouring the implementation of a new set of well-justified primary fossil 145
calibrations within a Bayesian framework. In comparison to previous studies (listed above), our 146
study can be considered as medium-sized in terms of taxonomic sampling, and essentially 147
focused on the family Muridae. But our study stands out for rigorous evaluation of the fossil 148
data for this highly diverse mammalian family. The present study has four main objectives: (i) 149

131
Tatiana Aghová / Ph.D. dissertation (2018)
7
to design a comprehensive multi-marker molecular dataset for the family Muridae, (ii) to review 150
the murid fossil record in order to identify reliable and suitable primary fossil calibrations, (iii) 151
to provide a reliable estimate of the timing of diversification of the family using multiple fossil 152
calibrations, and (iv) to lean on the resulting dated phylogeny to reconstruct the biogeographic 153
history of the family using up-to-date analytical approaches. 154
155
2. Material and Methods 156
2.1. Taxon sampling 157
For this study, new DNA sequences were generated for five murid species (Acomys cf. 158
cineraceus, Acomys subspinosus (Waterhouse), Acomys wilsoni Thomas, Arvicanthis niloticus 159
(Desmarest), Arvicanthis neumanni (Matschie) see Appendix A). Though we largely relied on 160
GenBank data for this work, it is worth underlining that our research group generated thousands 161
of murid sequences (all deposited in GenBank) in the past 15 years (we used some of these 162
sequences for 44 species included in this study). In total, our dataset (Appendix A) encompasses 163
160 murid species representing 82 of the 151 known murid genera. All four extant subfamilies 164
(if considering the Togo mouse from Leimacomyinae to be extinct) of Muridae are included. 165
For the largest subfamily Murinae, we included representatives of all 10 tribes that have been 166
defined by Lecompte et al. (2008): Apodemini, Arvicanthini, Hydromyini, Malacomyini, 167
Millardini, Murini, Otomyini, Phloeomyini, Praomyini and Rattini. As outgroup taxa, we 168
selected five species of the family Cricetidae (from subfamilies Arvicolinae, Cricetinae, 169
Neotomyinae and Tylomyinae), which constitutes the sister group of Muridae (Fabre et al., 170
2012). Finally, the tree was rooted using Calomyscus baluchi Thomas, a representative of the 171
more distant family Calomyscidae (Fabre et al., 2012). All species names followed Musser and 172
Carleton (2005) and Monadjem et al. (2015). 173
174

132
Tatiana Aghová / Ph.D. dissertation (2018)
8
2.2. DNA extraction, sequencing and molecular matrix 175
DNA was extracted using a Qiagen® DNeasy Blood and Tissue kit (Qiagen, Hilden, 176
Germany) following the manufacturer’s instructions. Two nuclear gene fragments were 177
targeted using the following combinations of polymerase chain reactions (PCR) primers: 178
IRBP217 and IRBP1531 (Stanhope et al., 1992) for the fragment of the ‘interphotoreceptor 179
retinoid binding’ (IRBP) gene; RAG1F1705 and RAG1R2951 (Teeling et al., 2000) for a 180
fragment of the ‘recombination activating gene 1’ (RAG1) gene. For PCR protocols, see Bryja 181
et al. (2017) and Teeling et al. (2000), respectively. PCR products were Sanger sequenced in 182
both directions using the BigDye® Terminator chemistry (Thermo Fisher Scientific) either in 183
the Institute of Vertebrate Biology on an ‘Applied Biosystems® 3130xl Genetic Analyzer’, or 184
commercially through the GATC Biotech company (Konstanz, Germany). New sequences were 185
deposited in GenBank under accession numbers KY634246 to KY634250. 186
The newly generated sequences were further combined with data from GenBank. The 187
resulting matrix (see Appendix A) encompasses the following six nuclear and nine 188
mitochondrial gene fragments: ‘acid phosphatase 5’ (AP5), BRCA1, intronic portion of 189
‘Peripheral benzodiazapine receptor variant’ (BZRP), ‘growth hormone receptor’ (GHR), IRBP 190
and RAG1, for the nuclear genes, and ‘12S ribosomal RNA’ (12S), ‘16S ribosomal RNA’ 191
(16S), ‘ATP synthase 8’ (ATPase8), ‘cytochrome c oxidase I’ (COI), ‘cytochrome oxidase II’ 192
(COII), ‘cytochrome b’ (Cytb), ‘Aspartic acid transfer RNA’ (tRNA-Asp), ‘Lysine transfer 193
RNA’ (tRNA-Lys), ‘Serine transfer RNA’ (tRNA-Ser), for the mitochondrial genes. For nine 194
taxa (Acomys cf. cineraceus, Acomys wilsoni Thomas, Aethomys chrysophilus (de Winton), 195
Aethomys hindei (Thomas), Aethomys kaiseri (Noack), Aethomys silindensis Roberts, 196
Arvicanthis nairobae J.A. Allen, Arvicanthis neumanni and Thallomys paedulcus (Sundevall), 197
gene fragments were concatenated from two individuals to minimize the amount of missing 198
data. For all protein-coding genes, we used Mesquite 3.2 (Maddison and Maddison, 2007) to 199

133
Tatiana Aghová / Ph.D. dissertation (2018)
9
check the coding frame for possible errors or stop codons. The sequences of several markers 200
(i.e. 12S, 16S, intronic portion of BZRP, tRNA-Asp, tRNA-Lys and tRNA-Ser) were variable 201
in length; their alignment was accomplished using MUSCLE (Edgar, 2004) with default 202
settings. 203
204
2.3. Phylogenetic analyses 205
Phylogenetic analyses were conducted using both Bayesian inference (BI) and 206
maximum likelihood (ML). Analyses were performed on the online computer cluster CIPRES 207
Science Gateway (Miller et al., 2010; www.phylo.org) and on the high performance computing 208
(HPC) cluster hosted in the Centre de Biologie pour la Gestion des Populations (CBGP) in 209
Montferrier-sur-Lez, France. For both phylogenetic analytical approaches, we carried out 210
partitioned analyses to improve phylogenetic accuracy (Nylander et al., 2004). The molecular 211
dataset was divided a priori into 33 partitions: we used three partitions for each of the protein-212
coding genes (AP5, ATPase8, BRCA1, COI, COII, Cytb, GHR, IRBP and RAG1) and one 213
partition for each of the rRNA-tRNA genes (12S, 16S, tRNA-Asp, tRNA-Lys and tRNA-Ser) 214
as well as the BZRP intronic portion. The best partitioning scheme and substitution models 215
were determined with PartitionFinder 1.1.1 (Lanfear et al., 2014) using a greedy heuristic 216
algorithm; because of the risk of over-parameterization associated with the high number of 217
specified partitions, the ‘unlinked branch lengths’ option was chosen over the ‘linked branch 218
lengths’ option. The Bayesian information criterion (BIC) was also preferentially used to 219
compare partitioning schemes and substitution models following the recommendation of 220
Ripplinger and Sullivan (2008). 221
PartitionFinder (based on BIC) identified the same three partitions for both BI and ML 222
analyses: two partitions are associated with a Generalized-Time-Reversible ( !"#$%#$&) model 223
134
Tatiana Aghová / Ph.D. dissertation (2018)
10
and one partition is associated with a Hasegawa-Kishino-Yano ( !"#$%#$&) model (see Table 224
2). 225
Bayesian inference analyses were carried out using MrBayes v3.2.6 (Ronquist et al., 226
2012b). Two independent runs with four MCMC (one cold and three incrementally heated 227
chains) were conducted: they ran for 50 million generations, with trees sampled every 1,000 228
generations. A conservative 25% burn-in was applied after checking for stability on the log-229
likelihood curves and the split-frequencies of the runs. Support of nodes for MrBayes analyses 230
was provided by clade posterior probabilities (PP) as directly estimated from the majority-rule 231
consensus topology. Following Erixon et al. (2003), nodes supported by PP 0.95 were 232
considered strongly supported. 233
Maximum likelihood analyses were performed using RAxML v8.2.8 (Stamatakis, 2014). 234
Because this software does not allow simpler substitution models, we used three partitions with 235
a General Time Reversible ('()#$%#$&) model (see Table 2). The best ML tree was obtained 236
using heuristic searches with 100 random addition replicates. Clade support was then assessed 237
using a non-parametric bootstrap procedure with 1,000 replicates. Following Hillis and Bull 238
(1993), nodes supported by bootstrap values (BV) 70 were considered strongly supported. 239
240
2.4. Evaluation of suitable fossil calibrations 241
Following the recommended criteria of Parham et al. (2012) for fossil calibrations, we 242
rigorously compiled a list of potential candidates from the paleontological literature and 243
eventually retained 18 candidate fossils (see Table 3). The candidate fossils possess the 244
information for the collection site, unique identification number, and the state of preservation 245
along with justification for the age of the fossil (i.e., age of fossil-bearing formation and 246
stratigraphic level, preferably with an absolute age by radiometric dating and/or reliable relative 247
age estimates, for example, by magnetostratigraphy). 248

135
Tatiana Aghová / Ph.D. dissertation (2018)
11
In the next step, diagnostic morphological characters were reassessed to determine 249
whether they could be reliably used as minimum age constraints in our phylogeny, either as 250
crown or stem calibrations. Seven fossils were discarded following this step (see the ‘Results’ 251
section). 252
For the remaining 11 fossils, we used the cross-validation procedure developed by Near 253
and Sanderson (2004) and Near et al. (2005). The following approach was used: (i) we 254
identified potential inconsistencies within the 11 remaining fossil calibrations, and (ii) we 255
explored the impact of the inclusion of each of these fossils on our divergence time estimates. 256
Each of the 11 fossil constraints was enforced at a time in a specific Bayesian relaxed-clock 257
(BRC) analysis to estimate the ages of the remaining nodes (see also section 2.5). First, the sum 258
of the squared differences between the molecular and fossil age estimates (SS) was calculated 259
(for more details see Near and Sanderson, 2004). All calibration points were then ranked based 260
on the magnitude of its SS score; here the fossil with the greatest SS score is assumed to be the 261
most inconsistent with respect to all other fossils in the analysis (Near and Sanderson, 2004). 262
Second, we calculated the average squared deviation, s, for all fossil calibrations in the analysis. 263
Following the method of Near et al. (2005), we removed the fossil with the greatest SS score 264
and recalculated s with the remaining fossil calibration points. This process was pursued until 265
only the two fossil calibration points with the lowest and second lowest magnitudes of SS 266
remained (Near and Sanderson, 2004). The rationale behind this procedure is to assess whether 267
calibration points are approximately equally informative and accurate (Near et al., 2005): if it 268
is the case the magnitude of s should only decrease by a small fraction whenever a fossil 269
calibration is removed. 270
271
2.5. Bayesian relaxed-clock analyses 272

136
Tatiana Aghová / Ph.D. dissertation (2018)
12
Although divergence time dating is now a well-established cornerstone of evolutionary 273
biology, there is still no widely accepted objective methodology for converting data from the 274
fossil record to calibration information of use in molecular phylogenies (Drummond and 275
Bouckaert, 2015). In the last few years, several methodological approaches to better implement 276
fossil calibrations have been developed, for instance allowing one to directly include fossil 277
lineages in phylogenies (‘total-evidence dating’; Pyron, 2010; Ronquist et al. 2012a) or to 278
account for information on the density of the fossil record (‘fossilized birth-death (FBD) 279
process’; Stadler, 2010; Heath et al., 2014). However, for our study, a ‘total evidence dating’ 280
approach was not applicable since it would have required the coding of a morphological matrix 281
for both fossils and extant taxa, which is problematic given the fragmentary nature of muroid 282
fossils. The use of the FBD methodology was also not envisioned because the fossil record of 283
muroid rodents is too sparse. Instead, we relied on a node-dating approach in which fossil 284
information is enforced on specific nodes through the use of parametric distributions. 285
Following our assessment of the murid fossil record and the results of cross-validation 286
analyses, nine fossil calibrations were finally retained for the dating procedure (for more 287
information, see Tables 3 and 4, and Appendix B). Five of them were defined based on fossil 288
material collected in the Siwalik Group of Pakistan (†Antemus chinjiensis, †Karnimata darwini 289
Jacobs, †cf. Karnimata sp., †Mus sp. and †Abudhabia pakistanensis Flynn and Jacobs). Three 290
additional accepted fossils originate from 6.1 Ma fossils discovered in the Lemudong'o locality 291
in Kenya (†Aethomys sp., †Arvicanthis sp. and †Gerbilliscus sp.), and the last retained fossil 292
calibration constraint is defined by the 9.6 Ma fossil of †Parapodemus lungdunensis Schaub. 293
Priors for fossil constraints were defined by using either uniform or lognormal statistical 294
distributions in two separate analyses. Statistical distributions were bounded by the minimum 295
ages provided by the fossil constraints and a conservative maximum age (ca. 25 Ma) for the 296
root derived from the study of Schenk et al. (2013; see Table 4). In a preliminary way (see 297

137
Tatiana Aghová / Ph.D. dissertation (2018)
13
section 2.4 of the Material and Methods), BRC analyses were also conducted using one fossil 298
constraint at a time to carry out cross-validation analyses. 299
Bayesian relaxed-clock analyses were conducted with BEAST v1.8.4 (Drummond et al., 300
2012) using uncorrelated lognormal relaxed clocks (Drummond et al., 2006). To limit the risk 301
of over-parameterization: (i) we used three clock models (based on PartitionFinder results, 302
Table 2); and (ii) we enforced a guide tree that corresponds to the topology with the best clade 303
support (this topology corresponds to the topology obtained with MrBayes; see the ‘Results’ 304
section). For the tree speciation model, a birth death process (Gernhard, 2008) was used in order 305
to better account for extinct and missing lineages. 306
BEAST .xml files were modified to implement the path-sampling procedure for Bayes 307
factor (BF) estimation following the recommendations of Baele et al. (2013). Out of the two 308
calibrations, the calibration procedure with lognormal prior has the best harmonic mean (-309
208117.74 versus -208262.58 for the procedure with a uniform prior) and is recovered as the 310
best-fit calibration procedure with a statistically significant BF of 289.68 (BF 10, Kass and 311
Raftery, 1995). The final analysis (with nine verified fossil constraints and lognormal prior 312
distribution for calibration constraints) was carried out by two independent runs each with 50 313
million generations and trees sampled every 5,000 generations. We used a conservative burn-314
in of 12.5 million generations per run. Post burn-in trees from both analyses were further 315
combined using the LogCombiner module of BEAST. Convergence of runs was assessed 316
graphically under Tracer v.1.6 and by examining the ESS of parameters. 317
318
2.6. Historical biogeography 319
Ancestral biogeography was reconstructed using the R package ‘BioGeoBEARS’ 320
(Matzke, 2013). Data for species’ ranges were obtained from the International Union for 321
Conservation of Nature website (https://www.iucn.org/). Five major biogeographic areas were 322
138
Tatiana Aghová / Ph.D. dissertation (2018)
14
defined on the basis of Olson et al. (2001): A, West Palearctic (from Western Europe to the 323
Ural Mountains, including North Africa); B, East Palearctic (from the Urals to Japan); C, 324
Indomalaya (from Afghanistan through the Indian subcontinent and Southeast Asia to lowland 325
southern China, and through Indonesia as far as Java, Bali, and Borneo, west of the Wallace 326
line); D, Australasia (Australia, New-Zealand, Papua-New-Guinea and neighbouring small 327
islands); E, Afrotropics (Africa, northern part excluded). Dispersal rate between adjacent areas 328
was fixed to 1 (A-B; B-C), whereas the dispersal of 0.7 (A-E; C-D) and 0.3 (B-D; B-E) was 329
specified for long-distance dispersal or whenever a geographical barrier had to be crossed. 330
Dispersal was disallowed between geographical areas separated by two or more areas (A-D; D-331
E). Six models of geographic range evolution were compared in a likelihood framework: (i) 332
Dispersal-Extinction Cladogenesis model (DEC) similar to Lagrange (Ree and Smith, 2008), 333
which parameterizes dispersal and extinction; (ii) DEC +J model (Matzke, 2013; 2014), which 334
adds founder-event speciation with long-distance dispersal (cladogenesis, where daughter 335
lineage is allowed to jump to a new range outside the range of the ancestor; Matzke, 2013) to 336
the DEC framework; (iii) Dispersal Vicariance Analysis (DIVA; Ronquist, 1997); (iv) DIVA 337
with long-distance dispersal (DIVA +J; Matzke, 2013); (v) Bayesian inference of historical 338
biogeography for discrete areas (BayArea; Landis et al., 2013); and (vi) BayArea with long-339
distance dispersal (BayArea +J; Matzke, 2013). Model fit was assessed using the Akaike 340
information criterion (AIC) and likelihood-ratio tests (LRT). 341
342
3. Results 343
3.1. Phylogeny of Muridae 344
Our multilocus dataset representing all major lineages of the family Muridae is 10,482 bp 345
long with 42.5% missing data. Both BI and ML analyses yield similar topologies (see Fig. 1 for 346
the topology inferred under BI, and Fig. S1 in Appendix D for the best-fit ML tree), as indicated 347

139
Tatiana Aghová / Ph.D. dissertation (2018)
15
by a high proportion of shared nodes (160 out of 162). BI and ML analyses differ only in the 348
position of Pelomys fallax (Peters) and Zyzomys argurus (Thomas), but their placements are 349
not significantly supported in either analysis. Clade support is moderate to high on average; if 350
considering the number of nodes that are supported by PP ! 0.95 or BV ! 70%, BI analyses 351
yield a slightly more robust topology (135 well-supported nodes) compared to the ML tree (122 352
well-supported nodes). 353
Phylogenetic analyses confirm the monophyly of the family Muridae, of all its four 354
constituent subfamilies, as well as of the previously defined tribes of the subfamily Murinae 355
(Fig. 1). On the contrary, the phylogenetic position of some genera (e.g. Acomys I. Geoffroy, 356
Dasymys Peters, Golunda Gray, Melomys Thomas, Micaelamys Ellerman, Pelomys Peters, 357
Oenomys Thomas and Otomys F. Cuvier) within particular tribes was only partly supported. 358
359
3.2. Evaluation of suitable fossil calibrations 360
We summarized all fossils considered in this study in Table 3 and Appendix B regarding 361
taxonomic information and specification for prior settings (see also Figure 2 for their respective 362
positions within the tree). Five out of 18 preselected fossils (i.e. †Parapelomys robertsi Jacobs, 363
†Potwarmus primitivus, †Preacomys kikiae Geraads, †cf. Progonomys sp. Schaub and †aff. 364
Stenocephalomys Frick) were excluded from further analyses because the scarcity of 365
paleontological interpretation about their phylogenetic relationships impeded assigning them to 366
specific nodes of the phylogeny (Appendix B). We also excluded fossils of Acomys and 367
Lemniscomys Trouessart from the Lemudong’O locality, Kenya (Manthi, 2007), because first 368
upper molars, which possess the most diagnostic characters in the murine dentition, are not 369
described from the locality (Table 3; see more details also in Appendix B). The two-step cross-370
validation procedure resulted in a further reduction of the fossil set of possible calibration 371
points. Specifically, we excluded two fossils: one is a 2.4 Ma fossil identified as the genus 372
140
Tatiana Aghová / Ph.D. dissertation (2018)
16
Gerbillus Desmarest, while the other one corresponds to a 6.1 Ma fossil identified as the genus 373
Mastomys Thomas (Appendix C). The rationale is that (i) these two fossil calibrations exhibited 374
the largest magnitude of SS, and that (ii) their removal also resulted in a very high (fivefold) 375
decrease in s (see Appendix C for more details). As a result of the latter series of selection steps, 376
nine fossils were finally retained for divergence dating (see Figure 2 for their position on the 377
tree, Table 4 for specification of priors, and Appendix B for more details on all considered 378
fossils). 379
380
3.3 Historical biogeography and divergence dating 381
Among the six models of geographic-range evolution compared in a likelihood 382
framework in BioGeoBEARS, the Dispersal-Extinction Cladogenesis model with founder-383
event speciation (DEC +J) was chosen because of its best likelihood and AICc associated scores 384
(lnL=-117.1, AICc=240.4; Table 5). 385
The dated tree resulting from the BRC analyses is shown in Figure 2 while dating 386
estimates for all internal nodes are provided in Table 6, and results of ancestral distribution 387
reconstructions are presented in Figure 3. The most recent common ancestor (MRCA) of 388
Muridae originated during the early Miocene (median age of 19.3 Ma; 95% highest posterior 389
density (HPD): 17.06-21.92 Ma) in the Afrotropical and Indomalayan bioregions. 390
Three subfamilies (Deomyinae, Gerbillinae and Lophiomyinae) belonging to the same 391
clade started their diversification in the Afrotropics. Within this clade, a first split occurred ca. 392
18.6 Ma (95% HPD: 16.35-21.11 Ma) between the Lophiomyinae and the clade encompassing 393
the Deomyinae and Gerbillinae. Deomyinae started their diversification ca. 14.6 Ma (95% 394
HPD: 12.68-16.82 Ma) while Gerbillinae started theirs ca. 12.2 Ma (95% HPD: 10.46-14.16 395
Ma). In Deomyinae and Gerbillinae, several lineages were able to colonize the Palearctic region 396
141
Tatiana Aghová / Ph.D. dissertation (2018)
17
from the Afrotropics (in our dataset, this concerns Acomys russatus (Wagner) and Gerbillus 397
gerbillus Olivier). 398
The subfamily Murinae originated in the Indomalayan region during the middle Miocene 399
(median age of 14.2 Ma; 95% HPD: 12.70-16.07 Ma); the corresponding basal split separated 400
the Phloeomyini and all remaining murines (‘core murines’ sensu Steppan et al. 2005). The 401
next major split occurred in the Indomalaya between Rattini and the remaining tribes of 402
Murinae (median age of 12.3 Ma; 95% HPD: 11.28-13.62 Ma), with an origin of Rattini 403
estimated at 10.4 Ma (95% HPD: 9.23-11.93 Ma). The ancestral area of Rattini was also 404
inferred to be the Indomalaya; during the course of their diversification, a few taxa colonized 405
Australasia (e.g. Bunomys andrewsi (J.A. Allen), Melasmothrix naso Miller and Hollister, 406
Paruromys dominator Thomas and Rattus leucopus (Gray)) as well as the West and East 407
Palearctic (e.g. Micromys minutus (Pallas) and Diplothrix legata (Thomas)). The Hydromyini 408
split from the remaining Murinae at ca. 11.9 Ma (95% HPD: 10.95-13.10 Ma); although basal 409
lineages of this tribe are currently found in the Indomalaya (e.g. Archboldomys luzonenzis 410
Musser, Apomys datae (Meyer), Apomys hylocoetes Mearns, Chrotomys gonzalesi Rickart and 411
Heaney, Chiropodomys gliroides (Blyth) and Rhynchomys isarogensis Musser and Freeman), 412
a specific and diverse lineage of Hydromyini also colonized and radiated in the Australasia ca. 413
8.1 Ma (95% HPD: 7.22-9.09 Ma). The clade gathering Apodemini, Malacomyini, Murini and 414
Praomyini likely originated in the Afrotropics, with several lineages secondarily colonizing the 415
Indomalaya and the West and East Palearctic. The split between Malacomyini (which remained 416
in the Afrotropics) and Apodemini (which dispersed and differentiated mainly in the West and 417
East Palaearctic) is estimated at ca. 10.2 Ma (95% HPD: 9.33-11.39 Ma). Murini started to 418
diversify in the Indomalaya at ca. 7.2 Ma (95% HPD: 6.24-9.29 Ma). The intense radiation (51 419
extant species, Monadjem et al., 2015) of Praomyini occurred in the Afrotropics (median age 420
of 6.8 Ma for the MRCA of Praomyini; 95% HPD: 6.06-7.77 Ma). The Indomalayan Millardini 421

142
Tatiana Aghová / Ph.D. dissertation (2018)
18
split from the predominantly Afrotropical Arvicanthini + Otomyini tribes at ca. 10.8 Ma (95% 422
HPD: 9.88-12.04 Ma). The respective first diversifications within Arvicanthini, Millardini and 423
Otomyini are estimated at ca. 8.8 Ma (95% HPD: 7.92-9.72 Ma), 9.2 Ma (95% HPD: 7.72-424
10.75 Ma) and 4.9 Ma (95% HPD: 4.12-5.98 Ma), respectively. The position of Asian Golunda 425
within Arvicanthini is not resolved (Fig. 1); the dispersal to Indomalaya of the lineage leading 426
to the extant Golunda species at ca. 8.5 Ma (95% HPD: 7.33-9.57 Ma; as suggested in Fig. 3) 427
should therefore be taken with caution. 428
4. Discussion 429
4.1. Selection of taxa and molecular markers 430
Our sampling of 160 species from 82 genera represents 22% of known murid species 431
diversity and more than half of the generic diversity of the family Muridae. When one compares 432
our sampling effort to previous studies (Table 7), only the study of Fabre et al. (2012) relied on 433
a better sampling for the family Muridae (302 species from 105 genera, i.e. about 41% of known 434
species diversity). In the study of Schenk et al. (2013), 18% of murid species are included. The 435
number of sampled murid species is also lower in Lecompte et al. (2008) and Rowe et al. (2008) 436
because their studies focussed on specific tribes and subfamilies. 437
438
4.2. Calibration of molecular clock and divergence dating 439
Using the classical Mus/Rattus calibration as prior for divergence dating often lead to an 440
underestimation of the age of the subfamily Murinae, inferring median ages that are generally 441
comprised between 13.3 to 12.0 Ma. Only the most recent studies (e.g. Rowe et al., 2016b) used 442
the correct Mus/Arvicanthis calibration with a prior median age of 11.1 Ma (as suggested by 443
Kimura et al., 2015). This resulted in the estimation of Murinae age of ca. 14.0 Ma (Rowe et 444
al., 2016b), which is consistent with our study (Table 6). 445
143
Tatiana Aghová / Ph.D. dissertation (2018)
19
Other fossils frequently used for molecular clock calibration are from the genus 446
†Parapodemus. Recent studies used these fossils in two ways: the first occurrence of 447
†Parapodemus sp. (Martín-Suáres and Mein, 1998) in the late Miocene in Europe (Lungu, 448
1981; see Appendix B) was used to calibrate the MRCA of ‘Apodemurini’ (representing the 449
split between Apodemini+Malacomyini and Murini+Praomyini; Fabre et al., 2013; Rowe et al., 450
2011). Another calibration point is based on the discovery of †Parapodemus pasquierae 451
Aguilar and Michaux, from ‘Lo Fournas 6’ site (Roussillon, France). Authors postulated that 452
the latter species and the smaller †Parapodemus lugdunensis co-occurred during the same time 453
period ‘MN10’ (Aguilar et al., 1999; Montuire et al., 2006), dated approximately at 9.7 Ma 454
(Mein, 2003). Michaux et al. (2002) considered the differences between these two species as 455
representative of the split between the large Apodemus mystacinus Danford and Alston and all 456
smaller Apodemus species from the subgenus Sylvaemus, but they used a younger age of 7.0 457
Ma as a prior for their divergence. Numerous authors followed this calibration (e.g. Bryja et al., 458
2014; Fabre et al., 2013; Lecompte et al., 2008; Schenk et al., 2013) even if there is no clear 459
rationale for it. The estimated dates of MRCA of Apodemini range from 7.5 Ma (Rowe et al. 460
2016b; Schenk et al., 2013) to 9.6 Ma (Bryja et al., 2014; Michaux et al., 2002; Lecompte et 461
al., 2008). In our study, we conservatively used the †Parapodemus lugdunensis fossil as a stem 462
constraint for Apodemini and this placement resulted in an estimation of their MRCA at 9.0 Ma 463
(95% HPD: 7.92-10.13 Ma). 464
There are several localities in Africa (e.g. Lukeino Formation, Winkler, 2002; 465
Lemudong’o, Ambrose et al., 2007; Manthi, 2007) where fossil representatives of Arvicanthis 466
were identified. These fossils were used for molecular clock calibration in several studies with 467
a prior MRCA for the genus at 6.1 Ma (e.g. Fabre et al., 2013; Rowe et al., 2011). The fossils 468
from Lemudong’o were also used, in a less conservative way, by Bryja et al. (2014): based on 469
early records of †Otomys sp. (ca. 5.0 Ma; Denys, 1990), †Aethomys sp., †Arvicanthis sp., 470
144
Tatiana Aghová / Ph.D. dissertation (2018)
20
†Lemniscomys sp. (from Lemudong’o = 6.1 Ma; Ambrose et al., 2007; Manthi et al., 2007) and 471
other relevant samples where these and related genera were absent (9.50-10.50 Ma; Mein et al. 472
2004), they set the split between Arvicanthini and Otomyini within 6.08-9.54 Ma. This 473
calibration resulted in an estimation of the MRCA for the tribe Arvicanthini at 7.8 Ma (Bryja 474
et al., 2014), which is about 1 million year younger than our own estimate (Table 6). Rowe et 475
al. (2016b) used as minimum age 8.7 Ma for the split between Arvicanthis and Otomys based 476
on the study of Kimura et al. (2015) that set minimum and maximum ages for locality Y388, 477
where †Karnimata darwini was found. This calibration resulted in an estimated MRCA of 478
Arvicanthini at 8.5 Ma. In our study, we instead used the age of an older locality (Y182; median 479
age of 9.2 Ma) where †Karnimata darwini was also found (Jacobs, 1978; Kimura et al., 2015), 480
in order to set a crown calibration for the Arvicanthini/Millardini/Otomyini clade. This 481
placement resulted in an estimation of their MRCA at 8.8 Ma (95% HPD: 7.92-9.72 Ma) (Table 482
6). 483
484
4.3. Historical biogeography with focus on faunal exchanges between the Afrotropics and 485
the Indomalaya 486
Our study could not resolve the origin of murid rodents, but it was either in the Afrotropics 487
or in the Indomalaya. Our inferred ancestral tropical range for the MRCA of murids is consistent 488
with the fact that most extant murid taxa are still distributed in warm and moist tropical areas. 489
During the Early Miocene (23.0-16.0 Ma), the rotation of Africa and Arabia, and finally the 490
collision with Eurasia formed a landbridge between Africa and Eurasia (the so-called 491
‘Gomphotherium landbridge’; Rögl, 1999). During this time period, early murids colonized 492
both geographical regions. The subsequent reopening of the Mediterranean-Indo-Pacific 493
seaway (‘Indo-Pacific recurrence’; Rögl, 1999) separated Africa from Eurasia again, thus 494
giving rise to the main clades of Afrotropics and Indomalaya rodents. Three subfamilies, 495
145
Tatiana Aghová / Ph.D. dissertation (2018)
21
Deomyinae, Gerbillinae and Lophiomyinae, then likely diversified in the Afrotropics (Chevret 496
and Dobigny, 2005; Ndiaye et al., 2016; Schenk et al., 2013, this study; Figure 3). This 497
hypothesis is supported by paleontological records since the oldest fossils tied to these 498
subfamilies were found in the Afrotropics (e.g. late Miocene Acomys, Gerbilliscus, Lophiomys 499
and †Preacomys from East Africa; Winkler et al. 2010 and references therein). The subfamily 500
Murinae started to diversify in Indomalaya, most probably in Southeast Asia, where we can 501
also find the hitherto highest phylogenetic diversity, including the oldest offshoots of this clade 502
(e.g. the ancestor of Phloeomyini probably lived in the Philippines, those of Rattini and 503
Hydromyini in South-east Asia, etc.; Fabre et al., 2013). 504
During the Middle Miocene (16.0-11.6 Ma), the Mediterranean-Indo-Pacific seaway 505
closed again at the beginning of the Serravallian ca. 13.8 Ma (‘Parathethys Salinity Crisis’; 506
Rögl, 1999), co-incidentally with a global cooling that caused vegetation shifts and a general 507
aridification (Prista et al., 2015). The newly formed landbridge (Rögl, 1999) allowed repeated 508
dispersals of murine rodents from Asia to both Africa and Eurasia. Murine fossil records 509
provide clear evidence for connections between the Indomalaya, the Palearctic, and the 510
Afrotropics. Among them, there are two conspicuous examples: (i) †Progonomys was recorded 511
in many Indomalayan Middle Miocene localities (Jacobs and Flynn, 2005) as well as in the 512
Palearctic region (Algeria: Wessels, 2009; China: Qiu et al., 2004; Egypt: Heissig, 1982; 513
France: Mein et al., 1993; Spain: Weerd, 1976); and (ii) the oldest records of †Parapelomys 514
spp. were found synchronously in Africa (8.5 Ma; Chorora, Ethiopia; Geraads, 2001) and in 515
Pakistan (ca. 8.0 Ma; Jacobs and Flynn, 2005). During this period, representatives of several 516
murine tribes occurred in the Afrotropics (Arvicanthini, Malacomyini, Otomyini and 517
Praomyini) and the Indomalaya (Millardini, Murini, Rattini, and basal lineages of Hydromyini). 518
The last faunal interchange of murid taxa between Africa, Asia and Western Palearctic 519
(Benammi et al., 1996; Sabatier, 1982; Sen, 1977, 1983; Winkler, 2002) is coincident with 520

146
Tatiana Aghová / Ph.D. dissertation (2018)
22
Messinian Salinity Crisis ca. 6 Ma during the Late Miocene (Hsü et al., 1973, 1978). During 521
this period of global sea level depression (Haq et al., 1987) Africa and Arabia were reconnected 522
through Neguev-Sinai landbridge (‘Levantine corridor’, Fernandes et al., 2006) and landbridge 523
in the Bab-el-Mandeb (Bosworth et al., 2005). In murids, evidence to support this faunal 524
exchange can be found in the African subgenus Nannomys (genus Mus), which colonized 525
Afrotropics and started there its radiation ca. 5.2 Ma (Bryja et al., 2014). A possible example 526
for an opposite west-to-east migration is the genus Golunda, which belongs to the Arvicanthini 527
tribe. In a predominantly Afrotropical clade, Golunda is the only genus that occurs in the 528
Indomalaya, probably since the end of Miocene (Ducroz et al., 2001; Fig. 3). However, one 529
should be cautious with this scenario since the position of Golunda within Arvicanthini is not 530
well supported (Fig. 1). Africa-to-Asia dispersals at the Miocene/Pliocene boundary have been 531
also recorded in other taxa, such as rodents (e.g. Myomyscus yemeni (Sanborn and Hoogstraal); 532
our unpubl. data), reptiles (e.g. Varanus yemenensis: Böhme et al., 2003, Portik and Papenfuss 533
2012; Hemidactylus geckos: Šmíd et al. 2013; Echis vipers: Pook et al. 2009) and hamadryas 534
baboons (Winney et al. 2004). 535
536
5. Conclusion and perspectives 537
In this study, we provided an improved multilocus dated phylogeny for the highly 538
speciose family Muridae. Both our dating and historical biogeography analyses suggest that the 539
family originated during the Early Miocene, and subsequently gave rise to four extant 540
subfamilies: three in the Afrotropical region (Deomyinae, Gerbillinae and Lophiomyinae) and 541
one in the Indomalaya (Murinae). Our study also supports a dynamic biogeographic scenario 542
in which repeated colonisation events occurred in the Australasian (Hydromyini, Rattini), 543
Afrotropical (Malacomyini, Praomyini, Arvicanthini, Otomyini) and Palearctic (Apodemini) 544
regions. One of the strong aspects of this study lies in the assessment and treatment of fossil 545
147
Tatiana Aghová / Ph.D. dissertation (2018)
23
data (Appendix B); such data is likely to be useful for further studies investigating the timing 546
of diversification of rodents, or even mammals in general. For an easy access to all 547
corresponding fossil records, we have made data available on the Date-a-Clade Website 548
(http://palaeo.gly.bris.ac.uk/fossilrecord2/dateaclade/index.html), Paleobiology Database 549
(http://fossilworks.org/) and TimeTree Database (http://timetree.org). 550
551
Acknowledgments 552
This study was supported by two projects of the Czech Science Foundation, no. 15-553
20229S, the Ministry of Culture of the Czech Republic (DKRVO 2017/15, National Museum, 554
00023272) and JSPS KAKENHI JP15H06884 (Grant-in-Aid for Young Scientists Start-up). 555
Most analyses were run on CBGP HPC computational platform, while a minor part was 556
performed on CIPRES Gateway. We thank Alexandre Dehne Garcia for his help on the HPC 557
CBGP cluster and Nick J. Matzke for introduction into BioGeoBEARS analysis. We would 558
also like to thank Alisa Winkler and Christiane Denys for discussion about some 559
paleontological aspects, as well as Arame Ndiaye and Pascal Chevret for providing additional 560
sequences. We are grateful to Vincent Lazzari, Fredrick K. Manthi, Pierre Mein, Rajeev 561
Pantanik and Sevket Sen who provided permission for the reproduction of the figures in 562
Appendix B. 563
564
Authors´ contributions: GJK, GD, LG, JB conceived the ideas; TA collected genetic 565
data (including new genotyping); YK, TA collected and analysed paleontological data; TA, 566
GJK performed phylogenetic analyses; TA, JB, GJK wrote the first version of the manuscript 567
that was then implemented by all authors. 568
569
148
Tatiana Aghová / Ph.D. dissertation (2018)
24
References 570
Adkins, R.M., Gelke, E.L., Rowe, D., Honeycutt, R.L., 2001. Molecular phylogeny and 571
divergence time estimates for major rodent groups: evidence from multiple genes. Mol. 572
Biol. Evol. 18, 777–91. 573
Adkins, R.M., Walton, A.H., Honeycutt, R.L., 2003. Higher-level systematics of rodents and 574
divergence time estimates based on two congruent nuclear genes. Mol. Phylogenet. Evol. 575
26, 409–420. 576
Aguilar, J.P., Escarguel, G., Michaux, J., 1999. A succession of Miocene rodent assemblages 577
from fissure fillings in southern France: Palaeoenvironmental interpretation and 578
comparison with Spain. Palaeogeogr. Palaeoclimatol. Palaeoecol. 145, 215–230. 579
Ameur, A., 1984. Découverte de nouveaux Rongeurs dans la formation miocène de Bou 580
Hanifia (Algérie occidentale). Géobios, 17, 167-175. 581
Ambrose, S.H., Nyamai, C.M., Mathu, E.M., Williams, M.A.J., 2007. Geology, Geochemistry, 582
and Stratigraphy of the Lemudong’o Formation, Kenya Rift Valley. Kirtlandia, Clevel. 583
Museum Nat. Hist. 53–64. 584
Arbogast, B. S., Browne, R. A., Weigl, P. D., 2001. Evolutionary genetics and Pleistocene 585
biogeography of North American tree squirrels (Tamiasciurus). J. Mammal. 82, 302-319. 586
Baele, G., Li, W.L.S., Drummond, A.J., Suchard, M. A., Lemey, P., 2013. Accurate model 587
selection of relaxed molecular clocks in bayesian phylogenetics. Mol. Biol. Evol. 30, 239–588
43. 589
Benammi, M., Calvo, M., Prévot, M., Jaeger, J.-J., 1996. Magnetostratigraphy and 590
paleontology of Ait Kandoula Basin (High Atlas, Morocco) and the African-European late 591
Miocene terrestrial fauna exchanges. Earth Planet. Sci. Lett. 145, 15-29. 592
Bernor, R.L., Brunet M., Ginsburg, L., Mein, P., Pickford, M., Rögl, F., Sen, S., Steininger F., 593
Thomas, H., 1987. A consideration of some major topics concerning old world Miocene 594
149
Tatiana Aghová / Ph.D. dissertation (2018)
25
mammalian chronology, migrations and paleogeography. Geobios. 20, 431-439. 595
Blanga-Kanfi, S., Miranda, H., Penn, O., Pupko, T., DeBry, R.W., Huchon, D., 2009. Rodent 596
phylogeny revised: analysis of six nuclear genes from all major rodent clades. BMC Evol. 597
Biol. 9, 71. 598
Bosworth, W., Huchon, P., McClay, K., 2005. The Red Sea and Gulf of Aden Basins. J. Afr. 599
Earth Sci. 43, 334–378. 600
Böhme, W., 2003. Checklist of the living monitor lizards of the world (family Varanidae). Zool. 601
Verhandel. 341, 1–43. 602
Bryja, J., Aghova, T., Bryjova, A., Denys, C., Verheyen, E., 2017. Evolutionary history of the 603
thicket rats (genus Grammomys) mirrors the evolution of African forests since late 604
Miocene. J. Biogeogr. 44, 182–194. 605
Bryja, J., Mikula, O.E., Umbera, R., Meheretu, Y., Aghová, T., Lavrenchenko, L. A, Mazoch, 606
V., Oguge, N., Mbau, J.S., Welegerima, K., Amundala, N., Colyn, M., Leirs, H., 607
Verheyen, E., 2014. Pan-African phylogeny of Mus (subgenus Nannomys) reveals one of 608
the most successful mammal radiations in Africa. BMC Evol. Biol. 14, 256. 609
Campisano, C.J., Feibel, C.S., 2008. Depositional environments and stratigraphic summary of 610
the Pliocene Hadar formation at Hadar, Afar Depression, Ethiopia. in: Quade, J., Wynn, 611
J.G. (Eds.), The Geology of Early Humans in the Horn of Africa. Geol. Soc. Am., vol. 612
446, pp. 179-201. 613
Carleton M.D., Musser G.G., 1984. Muroid rodents. in: Anderson S., Jones J.K., Jr., (Eds.), 614
Orders and families of recent mammals of the world. Wiley, New York, pp. 289–379. 615
Chaline, J., 1977. Les rongeurs au pilori? Analyse critique des reconstitutions paléoécologiques 616
en microthériodontologie. Approche écologique de l’Homme fossile. Paris, 77-81. 617
Cheema, I. U., S.Mahmood Raza, L. J. Flynn, A. R. Rapjar, Tomida, Y., 2000. Miocene 618
smallmammals from Jalalpur, Pakistan, and their biochronologic implications. Bull. Natl. 619

150
Tatiana Aghová / Ph.D. dissertation (2018)
26
Sci. Mus., Tokyo, C 26, 57–77. 620
Chevret, P., Denys, C., Jaeger, J.J., Michaux, J., Catzeflis, F.M., 1993a. Molecular evidence 621
that the spiny mouse (Acomys) is more closely related to gerbils (Gerbillinae) than to true 622
mice (Murinae). Proc. Natl. Acad. Sci. U.S.A. 90, 3433–3436. 623
Chevret, P., Denys, C., Jaeger, J.-J., Michaux, J., Catzeflis, F., 1993b. Molecular and 624
palaeontological aspects of the tempo and mode of evolution in Otomys (Otomyinae: 625
Muridae: Mammalia). Biochem. Syst. Ecol. 21, 123–131. 626
Chevret, P., Dobigny, G., 2005. Systematics and evolution of the subfamily Gerbillinae 627
(Mammalia, Rodentia, Muridae). Mol. Phylogenet. Evol. 35, 674–688. 628
Daxner-Höck, G., 2003. Cricetodon meini and other rodents from the Mühlbach and Grund, 629
Lower Austria (Middle Miocene, late MN5). Ann. Nat.hist. Mus. Wien (A) 104, 267-291. 630
DeBry, R.W., 2003. Identifying conflicting signal in a multigene analysis reveals a highly 631
resolved tree: the phylogeny of Rodentia (Mammalia). Syst. Biol. 52, 604–617. 632
Deino, A.L., Ambrose, S.H., 2007. 40Ar/39Ar dating of the Lemudong’o late Miocene fossil 633
assemblages, southern Kenya rift. Kirtlandia. 56, 65–71. 634
Denys, C., 1990. The oldest Acomys (Rodentia, Muridae) from the lower Pliocene of South 635
Africa and the problem of its murid affinities. Paleontogr. Abt. A, 210, 79–91. 636
Denys, C., Michaux, J., Catzeflis, F., Ducroq, S., Chevret, P., 1995. Morphological and 637
molecular data against the monophyly of Dendromurinae (Muridae:Rodentia). Bönner 638
Zool. Beitr. 45, 173–190. 639
Dobigny, G., Tatard, C., Gauthier, P., Ba, K., Duplantier, J., Granjon, L., Kergoat, G.J., 2013. 640
Mitochondrial and Nuclear Genes-Based Phylogeography of Arvicanthis niloticus 641
(Murinae) and Sub-Saharan Open Habitats Pleistocene History. PLoS One 8. 642
Donoghue, P. C., Benton, M. J., 2007. Rocks and clocks: calibrating the Tree of Life using 643
fossils and molecules. Trends Ecol. Evol. 22, 424-431. 644
151
Tatiana Aghová / Ph.D. dissertation (2018)
27
Drummond, A.J., Bouckaert, R.R., 2015. Bayesian evolutionary analysis with BEAST 2. 645
Cambridge University press. 646
Drummond, A.J., Ho, S.Y.W., Phillips, M.J., Rambaut, A., 2006. Relaxed phylogenetics and 647
dating with confidence. PLoS Biol. 4, e88. 648
Drummond, A. J., Suchard, M. A., Xie, D., Rambaut, A. 2012. Bayesian phylogenetics with 649
BEAUti and the BEAST 1.7. Mol. Biol. Evol. 29, 1969-1973. 650
Ducroz, J.F., Volobouev, V., Granjon, L., 2001. An Assessment of the Systematics of 651
!"#$%&'(#&)* +,-)&'.* /.#&0* 1#',$(,&-!#%2* 34 * 5)67)&$).89* :",27'#,&%!y and 652
Biogeographical Implications J. Mammal. Evol. 8, 173-206. 653
Edgar, R.C., 2004. MUSCLE: multiple sequence alignment with high accuracy and high 654
throughput. Nucleic Acids Res. 32, 1792–7. 655
Erixon, P., Svennblad, B., Britton, T., Oxelman, B., 2003. Reliability of Bayesian posterior 656
probabilities and bootstrap frequencies in phylogenetics. Syst. Biol. 52, 665–673. 657
Fabre, P.H., Hautier, L., Dimitrov, D., Douzery, E.J., 2012. A glimpse on the pattern of rodent 658
diversification: a phylogenetic approach. BMC evolutionary biology, 12(1), 88. 659
Fabre, P.H., Pagès, M., Musser, G.G., Fitriana, Y.S., Fjeldså, J., Jennings, A., Jønsson, K. A., 660
Kennedy, J., Michaux, J., Semiadi, G., Supriatna, N., Helgen, K.M., 2013. A new genus 661
of rodent from wallacea (Rodentia: Muridae: Murinae: Rattini), and its implication for 662
biogeography and Indo-Pacific Rattini systematics. Zool. J. Linn. Soc. 169, 408–447. 663
Fernandes, C.A., Rohling, E.J., Siddall, M., 2006. Absence of post-Miocene Red Sea land 664
bridges: Biogeographic implications. J. Biogeogr. 33, 961–966. 665
Flynn, L.J., Jacobs, L.L., 1999. Late Miocene small mammal faunal dynamics: the crossroads 666
of the Arabian peninsula. in: Whybrow, P.J., Hill, A., (Eds.), Fossil vertebrates of Arabia. 667
Yale University Press, New Haven, pp. 412–419. 668
Gavryushkina, A., Heath, T. A., Ksepka, D. T., Stadler, T., Welch, D., Drummond, A. J., 2017. 669
152
Tatiana Aghová / Ph.D. dissertation (2018)
28
Bayesian total-evidence dating reveals the recent crown radiation of penguins. Syst. 670
Biol. 66, 57-73. 671
Geraads, D., 2001. Rongeurs du Miocene superieur de Chorora (Ethiopie): Dendromuridae, 672
Muridae et conclusions. Palaeovertebrata. 30, 89–109. 673
Geraads, D., Alemseged, Z., Bellon, H., 2002. The late Miocene mammalian fauna of Chorora, 674
Awash basin, Ethiopia: systematics, biochronology and the 40K–40Ar ages of the 675
associated volcanics. Tertiary Research. 21, 113–127. 676
Gernhard, T., 2008. The conditioned reconstructed process. J. Theor. Biol. 253, 769–778. 677
Granjon, L., Colangelo, P., Tatard, C., Colyn, M., Dobigny, G., Nicolas, V., 2012. Intrageneric 678
relationships within Gerbilliscus (Rodentia, Muridae, Gerbillinae), with characterization 679
of an additional West African species. Zootaxa. 25, 1–25. 680
Granjon, L., Montgelard, C., 2012. The Input of DNA Sequences to Animal Systematics: 681
Rodents as Study Cases. in: Munshi, A. (Ed.), DNA Sequencing - Methods and 682
Applications, InTech, pp. 104-140. 683
Haq, B.U., Hardenbol, J., Vail, P.R., 1987. Chronology of fluctuating sea levels since the 684
Triassic. Science. 235, 1156-1167. 685
Heath, T. A., Huelsenbeck, J.P., Stadler, T., 2014. The fossilized birth-death process for 686
coherent calibration of divergence-time estimates. Proc. Natl. Acad. Sci. U.S.A. 111, 687
E2957-66. 688
Heissig, K., 1982. Kleinsäuger aus einer obermiozänen (Vallesium) Karstfüllung Ägyptens. 689
Mitt. Bayer. Staatssamml. Paläontol. Hist. Geol. 22, 97-101. 690
Hillis, D.M., Bull, J.J., 1993. An empirical test of bootstrapping as a method for assessing 691
confidence in phylogenetic analysis. Syst. Biol. 42, 182–192. 692
Hsü, K.J., 1978. Stratigraphy of the lacustrine sedimentation in the Black Sea. Initial Reports 693
of the DSDP. 42B, 509–524. 694
153
Tatiana Aghová / Ph.D. dissertation (2018)
29
Hsü, K.J., Cita, M.B., Ryan, W.B.F., 1973. The origin of the Mediterranean evaporites. Initial 695
Reports of the DSDP. 42, 1203–1231. 696
Jacobs, L. L. 1977. A new genus of murid rodent from the miocene of Pakistan and comments 697
on the origin of the Muridae. PaleoBios. 25, 1–11 698
Jacobs, L. L., 1978. Fossil rodents (Rhizomyidae and Muridae) from Neogene Siwalk deposits, 699
Pakistan. Mus. North. Ariz. Bull. 52, 1–103. 700
Jacobs, L.L., Downs, W.R., 1994. The evolution of murine rodents in Asia. Natl. Sci. Museum 701
Monogr. 8, 149–156. 702
Jacobs, L. L., Flynn, L.J., Downs, W.R., 1989. Neogene Rodentia of Southern Asia. in: Black, 703
C.C., Dawson, M.R. (Eds.), Papers on fossil rodents in honor of Albert Elmer Wood. 704
Natural History Museum, Los Angeles County, Science Series No. 33, pp. 157–177. 705
Jacobs, L., Flynn, L., Downs, W., Barry, J., 1990. Quo vadis Antemus? The Siwalik muroid 706
record. in: Lindsay, E.H, Fahlbusch, V., Mein, P. (Eds.), European Neogene Mammal 707
Chronology. Plenum Press. New York. pp. 573–586. 708
Jacobs L.L., Flynn J.J., 2005. Of mice ... again: the Siwalik rodent record, murine distribution, 709
and molecular clocks. in: Leiberman. D.E., Smith, R.J,, Kelley, J., (Eds.), Interpreting the 710
past: essays on human, primate, and mammal evolution in honor of David Pilbeam. Brill 711
Academic Publishers Inc, Boston. pp. 63–80. 712
Jaeger, J.-J., 1977. Les rongeurs du Miocène moyen et supérieur du Maghreb. Palaeovertebrata. 713
8, 3–166. 714
Jansa, S. A, Weksler, M., 2004. Phylogeny of muroid rodents: relationships within and among 715
major lineages as determined by IRBP gene sequences. Mol. Phylogenet. Evol. 31, 256–716
76. 717
Kass, R. E., Raftery, A. E., 1995. Bayes factors. J. Am. Stat. Assoc. 90, 773-795. 718
Kimbel, W., Walter, R., Johanson, D., Reed, K., Aronson, J., Assefa, Z., Marean, C.W., Eck, 719
154
Tatiana Aghová / Ph.D. dissertation (2018)
30
G., Bobe, R., Hovers, E., Rak, Y., Vondra, C., Yemane, T., York, D., Chen, Y., Evensen, 720
N., Smith, P., 1996. Late Pliocene Homo and Oldowan tools from the Hadar formation 721
(Kada Hadar member), Ethiopia. J. Hum. Evol. 31, 549-561. 722
Kimura, Y., Hawkins, M.T.R., McDonough, M.M., Jacobs, L.L., Flynn, L.J., 2015. Corrected 723
placement of Mus-Rattus fossil calibration forces precision in the molecular tree of 724
rodents. Nat. Publ. Gr. 1–9. 725
Kimura, Y., Jacobs, L.L., Cerling, T.E., Uno, K.T., Ferguson, K.M., Flynn, L.J., Patnaik, R., 726
2013. Fossil Mice and Rats Show Isotopic Evidence of Niche Partitioning and Change in 727
Dental Ecomorphology Related to Dietary Shift in Late Miocene of Pakistan. PLoS One 728
8, 1–10. 729
Kingdon, J., 2015. The Kingdon field guide to African mammals. Bloomsbury Publishing, 730
London. 731
Lavocat, R., 1978. Rodentia and Lagomorpha. in: Maglio, V.J., Cooke, H.B.S. (Eds.), Evolution 732
of African mammals. Harvard University Press, Cambridge. pp. 68-89. 733
Landis, M.J., Matzke, N.J., Moore, B.R., Huelsenbeck, J.P., 2013. Bayesian analysis of 734
biogeography when the number of areas is large. Syst. Biol. 62, 789–804. 735
Lanfear, R., Calcott, B., Kainer, D., Mayer, C., Stamatakis, A., 2014. Selecting optimal 736
partitioning schemes for phylogenomic datasets. BMC Evol. Biol. 14, 82. 737
Lazzari, V., Tafforeau, P., Michaux, J., 2011. When homologous cusps display non-738
homologous wear facets: An occlusal reorganization ensures functional continuity during 739
dental evolution of Murinae (Rodentia, Mammalia). Arch. Oral Biol. 56, 194–204. 740
Lecompte, E., Aplin, K., Denys, C., Catzeflis, F., Chades, M., Chevret, P., 2008. Phylogeny 741
and biogeography of African Murinae based on mitochondrial and nuclear gene sequences, 742
with a new tribal classification of the subfamily. BMC Evol. Biol. 8, 199. 743
Lindsay, E.H., 1988. Cricetid Rodents from Siwalik Deposits near Chinji Village. Part 1: 744

155
Tatiana Aghová / Ph.D. dissertation (2018)
31
Megacricetodontinae, Myocricetodontinae and Dendromurinae. Palaeovertebrata. 18, 95-745
154. 746
López Antoñanzas, R., 2009. First potwarmus from the miocene of Saudi Arabia and the early 747
phylogeny of murines (Rodentia: Muroidea). Zool. J. Linn. Soc. 156, 664–679. 748
Lungu, A. N., 1981. Hipparion Fauna of Middle Sarmatian of Moldavia (Insectivora, 749
Lagomorpha and Rodentia). State Tiraspol Institut Pedagogiki Publ. 1557, 1-137. 750
Maddison, W. P. and Maddison, D.R., 2017. Mesquite: a modular system for evolutionary 751
analysis. Version 3.2 http://mesquiteproject.org 752
Macholán, M., 2012, (Ed.),Evolution of the house mouse (No. 3). Cambridge University Press. 753
Manthi, F.K., 2007. A preliminary review of the rodent fauna from Lemudong’o, southwestern 754
Kenya, and its implication to the late Miocene paleoenvironments. Kirtlandia. 56, 92–105. 755
Martín-Suáres, E., Mein, P., 1998. Revision of the genera Parapodemus, Apodemus Rhagamys 756
and Rhagapodemus (Rodentia, Mammalia). Geobios. 31, 87–97. 757
Matzke, N.J., 2013. Probabilistic historical biogeography: new models for founder-event 758
speciation, imperfect detection, and fossils allow improved accurancy and model-testing. 759
Berkeley Plan. J. 26, 217–220. 760
Matzke, N.J., 2014. Model selection in historical biogeography reveals that founder-event 761
speciation is a crucial process in island clades. Syst. Biol. 63, 951–970. 762
Mein, P., Martín-Suárez, E., Agustí, J. 1993. Progonomys Schaub, 1938 and Huerzelerimys 763
gen. nov.(Rodentia); their evolution in Western Europe. Scripta Geol. 103, 41-64. 764
Mein, P., 2003. On Neogene rodents of Eurasia: distributions and migrations - in: Reumer, 765
J.W.F., Wessels, W. (Eds.), Distribution and migration of Tertiary mammals in Eurasia. 766
A volume in honour of Hans de Bruijn. Natuurmuseum Rotterdam. pp. 407-418. 767
Mein, P., Pickford, M., Senut, B., 2004. Late Miocene micromammals from the Harasib karst 768
deposits, Namibia. Part 2b-Cricetomyidae, Dendromuridae and Muridae, with an 769
156
Tatiana Aghová / Ph.D. dissertation (2018)
32
addendum on the Myocricetodontinae. Communs. Geol. Surv. Namibia. 13, 43–63. 770
Michaux, J. R., Chevret, P., Filippucci, M. G., Macholán, M., 2002. Phylogeny of the genus 771
Apodemus with a special emphasis on the subgenus Sylvaemus using the nuclear IRBP 772
gene and two mitochondrial markers: cytochrome b and 12S rRNA. Mol. Phylogenet. 773
Evol. 23, 123-136. 774
Michaux, J., Chevret, P., Renaud, S., 2007. Morphological diversity of Old World rats and mice 775
(Rodentia, Muridae) mandible in relation with phylogeny and adaptation. J. Zool. Syst. 776
Evol. Res. 45 (3), 263-279. 777
Miller, M.A., Pfeiffer, W., Schwartz, T., 2010. Creating the CIPRES Science Gateway for 778
inference of large phylogenetic trees, in: 2010 Gateway Computing Environments 779
Workshop, GCE 2010. pp. 1–8. 780
Monadjem, A., Taylor, P. J., Denys, C., Cotterill, F. P., 2015. Rodents of sub-Saharan Africa: 781
a biogeographic and taxonomic synthesis. Walter de Gruyter GmbH, 782
Berlin/Munich/Boston. 783
Montgelard, C., Forty, E., Arnal, V., Matthee, C. A., 2008. Suprafamilial relationships among 784
Rodentia and the phylogenetic effect of removing fast-evolving nucleotides in 785
mitochondrial, exon and intron fragments. BMC Evol. Biol. 8, 321. 786
Montuire, S., Maridet, O., Legendre, S., 2006. Late Miocene–Early Pliocene temperature 787
estimates in Europe using rodents. Palaeogeogr. Palaeoclimatol. Palaeoecol. 238, 247-788
262. 789
Munthe, J., 1987. Small-mammal fossils from the Pliocene Sahabi Formation of Libya. in. 790
Boaz, N.T., El-Arnauti,A., Gaziry, A.W, de Heinzelin, J., Boaz, D.D, (Eds.), Neogene 791
Paleontology and Geology of Sahabi, Alan R. Liss. New York. pp. 135–144. 792
Musser, G.G., Carleton M.D., 2005. Superfamily Muroidea, in: Wilson, D.E., Reeder, D.A.M. 793
(Eds.), Mammal Species of the World. A Taxonomic and Geographic Reference. The 794

157
Tatiana Aghová / Ph.D. dissertation (2018)
33
Johns Hopkins University Press. Baltimore. pp. 894–1531. 795
Ndiaye, A., Chevret, P., Dobigny, G., Granjon, L., 2016. Evolutionary systematics and 796
biogeography of the arid habitat-adapted rodent genus Gerbillus (Rodentia, Muridae): a 797
mostly Plio-Pleistocene African history. J. Zool. Syst. Evol. Res. 54, 299-317. 798
Near, T.J., Meylan, P. A., Shaffer, H.B., 2005. Assessing concordance of fossil calibration 799
points in molecular clock studies: an example using turtles. Am. Nat. 165, 137–146. 800
Near, T.J., Sanderson, M.J., 2004. Assessing the quality of molecular divergence time estimates 801
by fossil calibrations and fossil-based model selection. Philos. Trans. R. Soc. Lond. B. 802
Biol. Sci. 359, 1477–1483. 803
Nicolas, V., Mboumba, J.F., Verheyen, E., Denys, C., Lecompte, E., Olayemi, A., Missoup, 804
A.D., Katuala, P., Colyn, M., 2008. Phylogeographic structure and regional history of 805
Lemniscomys striatus (Rodentia: Muridae) in tropical Africa. J. Biogeogr. 35, 2074–2089. 806
Nylander, J.A.A., Ronquist, F., Huelsenbeck, J.P., Nieves-Aldrey, J.L., 2004. Bayesian 807
Phylogenetic Analysis of Combined Data. Syst. Biol. 53, 47–67. 808
Ogg, J. G., Smith, A. G., 2004. Geologic Time Scale 2004. in: Gradstein, F. M., Ogg, J. G., 809
Smith, A. G.A (Eds.), Cambridge University Press. pp. 63–86. 810
Olson, D.M., Dinerstein, E., Wikramanayake, E.D., Burgess, N.D., Powell, G.V.N., 811
Underwood, E.C., D’amico, J. A., Itoua, I., Strand, H.E., Morrison, J.C., Loucks, C.J., 812
Allnutt, T.F., Ricketts, T.H., Kura, Y., Lamoreux, J.F., Wettengel, W.W., Hedao, P., 813
Kassem, K.R., 2001. Terrestrial Ecoregions of the World: A New Map of Life on Earth. 814
Bioscience 51, 933. 815
Pagès, M., Fabre, P.-H., Chaval, Y., Mortelliti, A., Nicolas, V., Wells, K., Michaux, J.R., 816
Lazzari, V., 2016. Molecular phylogeny of Southeast Asian arboreal murine rodents. Zool. 817
Scr. 45, 349-364. 818
Parham, J.F., Donoghue, P.C.J., Bell, C.J., Calway, T.D., Head, J.J., Holroyd, P. A., Inoue, 819

158
Tatiana Aghová / Ph.D. dissertation (2018)
34
J.G., Irmis, R.B., Joyce, W.G., Ksepka, D.T., Patané, J.S.L., Smith, N.D., Tarver, J.E., 820
Van Tuinen, M., Yang, Z., Angielczyk, K.D., Greenwood, J.M., Hipsley, C. A., Jacobs, 821
L., Makovicky, P.J., Müller, J., Smith, K.T., Theodor, J.M., Warnock, R.C.M., Benton, 822
M.J., 2012. Best practices for justifying fossil calibrations. Syst. Biol. 61, 346–359. 823
Pook, C. E., Joger, U., Stümpel, N., Wüster, W., 2009. When continents collide: phylogeny, 824
historical biogeography and systematics of the medically important viper genus Echis 825
(Squamata: Serpentes: Viperidae). Mol. Phylogenet. Evol. 53, 792-807. 826
Portik, D. M., Papenfuss, T. J., 2012. Monitors cross the Red Sea: the biogeographic history 827
of Varanus yemenensis. Mol. Phylogenet. Evol. 62, 561-565. 828
Prista, G.A., Agostinho, R.J., Cachão, M.A., 2015. Observing the past to better understand the 829
future: A synthesis of the Neogene climate in Europe and its perspectives on present 830
climate change. Open Geosci. 7, 65–83. 831
Pyron, R.A., 2010. A likelihood method for assessing molecular divergence time estimates and 832
the placement of fossil calibrations. Syst. Biol. 59, 185–194. 833
Qiu, Z., Zheng, S., Zhang, Z., 2004. Murids from the late Miocene Bahe formation, Lantian, 834
Shaanxi. Vertebrata Pal. Asiatica, 42, 67-76. 835
Ree, R.H., Smith, S. A., 2008. Maximum likelihood inference of geographic range evolution 836
by dispersal, local extinction, and cladogenesis. Syst. Biol. 57, 4–14. 837
Reed, D. N., 2011. New murid (Mammalia, Rodentia) fossils from a late Pliocene (2.4 Ma) 838
locality, Hadar A. L. 894, Afar Region, Ethiopia. J. Vert. Paleontol. 31, 1326–1337. 839
Renaud, S., Michaux, J., Mein, P., Aguilar, J.P., Auffray, J.C., 1999. Patterns of size and shape 840
differentiation during the evolutionary radiation of the European Miocene murine rodents. 841
Lethaia 32, 61–71. 842
Ripplinger, J., Sullivan, J., 2008. Does choice in model selection affect maximum likelihood 843
analysis? Syst. Biol. 57, 76–85. 844
159
Tatiana Aghová / Ph.D. dissertation (2018)
35
Ronquist, F., 1997. Dispersal-Vicariance Analysis: A New Approach to the Quantification of 845
Historical Biogeography. Syst. Biol. 46, 195. 846
Ronquist, F., Klopfstein, S., Vilhelmsen, L., Schulmeister, S., Murray, D.L., Rasnitsyn, A.P., 847
2012a. A total-evidence approach to dating with fossils, applied to the early radiation of 848
the hymenoptera. Syst. Biol. 61, 973–999. 849
Ronquist, F., Teslenko, M., van der Mark, P., Ayres, D.L., Darling, A., Höhna, S., Larget, B., 850
Liu, L., Suchard, M. A, Huelsenbeck, J.P., 2012b. MrBayes 3.2: efficient Bayesian 851
phylogenetic inference and model choice across a large model space. Syst. Biol. 61, 539–852
42. 853
Rowe, K.C., Achmadi, A.S., Esselstyn, J.A., 2016a. A new genus and species of omnivorous 854
rodent (Muridae: Murinae) from Sulawesi, nested within a clade of endemic carnivores. J. 855
Mammal. 97, 978-991. 856
Rowe, K.C., Achmadi, A.S., Esselstyn, J.A., 2016b. Repeated evolution of carnivory among 857
Indo-Australian rodents. Evolution. 70, 653-665. 858
Rowe, K.C., Aplin, K.P., Baverstock, P.R., Moritz, C., 2011. Recent and rapid speciation with 859
limited morphological disparity in the genus rattus. Syst. Biol. 60, 188–203. 860
Rowe, K.C., Reno, M.L., Richmond, D.M., Adkins, R.M., Steppan, S.J., 2008. Pliocene 861
colonization and adaptive radiations in Australia and New Guinea (Sahul): Multilocus 862
systematics of the old endemic rodents (Muroidea: Murinae). Mol. Phylogenet. Evol. 47, 863
84–101. 864
Rögl, F., 1999. Mediterranean and Paratethys. Facts and hypotheses of an Oligocene to 865
Miocene paleogeography (short overview). Geol. Carpathica. 50, 339–349. 866
Sabatier, M., 1982. Les rongeurs du site Pliocène à Hominidés de Hadar (Ethiopie). 867
Palaeovertebrata. 12. 1–56. 868
Sauquet, H., Ho, S.Y.W., Gandolfo, M.A., Jordan, G.J., Wilf, P., Cantrill, D.J., Bayly, M.J., 869
160
Tatiana Aghová / Ph.D. dissertation (2018)
36
Bromham, L., Brown, G.K., Carpenter, R.J., Lee, D.M., Murphy, D.J., Sniderman, J.M.K., 870
Udovicic, F., 2012. Testing the impact of calibration on molecular divergence times using 871
a fossil-rich group: The case of nothofagus (Fagales). Syst. Biol. 61, 289–313. 872
Sen, S. 1977. La faune de rongeurs Pliocenes de Calta (Ankara, Turquie). Bull. Mus. Natl. Hist. 873
Nat. Sci. Terre. 465, 1–171. 874
Sen, S., 1983. Rongeurs et lagomorphes du gisement pliocène de Pul-e Charkhi, bassin de 875
Kabul, Afghanistan. Bull. Mus. Natl. Hist. Nat. 5, 33-74. 876
Schenk, J. J., Rowe, K. C., Steppan, S. J., 2013. Ecological opportunity and incumbency in the 877
diversification of repeated continental colonizations by muroid rodents. Syst. Biol. 62, 878
837-864. 879
Simpson, G. G., 1945. The principles of classification and a new classi- fication of mammals. 880
Bull. Am. Mus. Nat. Hist. 85, 1–350. 881
Stadler, T., 2010. Sampling-through-time in birth-death trees. J. Theor. Biol. 267, 396–404. 882
Stamatakis, A., 2014. RAxML version 8 a tool for phylogenetic analysis and post-analysis of 883
large phylogenies. Bioinformatics. 30, 1312-1313. 884
Stanhope, M. J., Czelusniak, J., Si, J. S., Nickerson, J., Goodman, M., 1992. A molecular 885
perspective on mammalian evolution from the gene encoding interphotoreceptor retinoid 886
binding protein, with convincing evidence for bat monophyly. Mol. Phylogenet. Evol. 1, 887
148-160. 888
Steppan, S., Adkins, R., Anderson, J., 2004. Phylogeny and divergence-date estimates of rapid 889
radiations in muroid rodents based on multiple nuclear genes. Syst. Biol. 53, 533–553. 890
Steppan, S.J., Adkins, R.M., Spinks, P.Q., Hale, C., 2005. Multigene phylogeny of the Old 891
World mice, Murinae, reveals distinct geographic lineages and the declining utility of 892
mitochondrial genes compared to nuclear genes. Mol. Phylogenet. Evol. 37, 370–88. 893
Suwa, G., Beyene, Y., Nakaya, H., Bernor, R. L., Boisserie, J. R., Bibi, F., ... & Asfaw, B. 2015. 894
161
Tatiana Aghová / Ph.D. dissertation (2018)
37
Newly discovered cercopithecid, equid and other mammalian fossils from the Chorora 895
Formation, Ethiopia. J. Anthropol. Sci. 123, 19-39. 896
!"#$%&'$%()**)+,)$%-'$%.*)/0123"4$%5'$%6307#"8$%9'$%:);2<*$%='.'$%>0*)3<1$%&'$%?@AB'%CD/%0E%897
Arabia: a complex biogeographic history of multiple vicariance and dispersal events in the 898
gecko genus Hemidactylus (Reptilia: Gekkonidae). PLoS One. 8, e64018. 899
Teeling, E.C., Scally, M., Kao, D.J., Romagnoli, M.L., Springer, M.S., Stanhope, M.J., 2000. 900
Molecular evidence regarding the origin of echolocation and flight in bats. Nature, 403, 901
188–192. 902
Vangengeim, E.A., Lungu, A.N., Tesakov, A.S., 2006. Age of the Vallesian Lower Boundary 903
(Continental Miocene of Europe). Stratigr. Geol. Correl. 14, 655-667. 904
Vaughan, T.A., Ryan, J.M., Czaplewski, N.J., 2011. Mammology. 5th ed. Jones and Bartlett 905
Publishers, Sudbury. 906
Vrba, E. S. 1995. On the connections between paleo- climate and evolution. in: Vrba, E.S., 907
Denton, G.H., Partridge,T.C., Burckle, L.H. (Eds.), Paleoclimate and Evolution with 908
Emphasis on Human Origins. Yale University Press. New Haven. pp. 24–48. 909
Weerd, A. D., 1976. Rodent faunas of the Mio-Pliocene continental sediments of the Teruel-910
Alfambra region, Spain. Doctoral dissertation, Utrecht University. 911
Wessels, W., 2009. Miocene rodent evolution and migration. Muroidea from Pakistan, Turkey 912
and Northern Africa. Geologica Ultraiectina 307. Doctoral dissertation, Departement 913
Aardwetenschappen. 914
Winkler, A.J., 2002. Neogene paleobiogeography and East African paleoenvironments: 915
contributions from the Tugen Hills rodents and lagomorphs. J. Hum. Evol. 42, 237–256. 916
Winkler, A.J., Denys, C., Avery, D.M., 2010. Rodentia, in: Werdelin, L., Sanders, W.J. (Eds.), 917
Cenozoic mammals of Africa. Univ of California Press. pp. 261–304. 918
Winney, B. J., Hammond, R. L., Macasero, W., Flores, B., Boug, A., Biquand, V., ... & Bruford, 919
162
Tatiana Aghová / Ph.D. dissertation (2018)
38
M. W. 2004. Crossing the Red Sea: phylogeography of the hamadryas baboon, Papio 920
hamadryas hamadryas. Mol. Ecol. 13, 2819-2827. 921
922
923
Figure titles 924
Figure 1. Molecular phylogeny of family Muridae based on Bayesian inference (BI) in 925
MrBayes. Very similar topology was obtained also by maximum likelihood (ML) 926
analysis in RAxML (see Appendix D). Red points show nodes supported in BI 927
analysis (posterior probability PP !0.95), blue points show high bootstrap support 928
in ML analysis (bootstrap BV 0.70). Violet nodes are supported by both analyses. 929
Figure 2. Divergence dating analysis of family Muridae. Nodes show medians of times to most 930
recent common ancestor (MRCA), node bars indicate 95% HPD intervals. Latin 931
numbers in yellow squares indicate positions of fossil constrains selected by 932
multiple-step evaluation and used for final analysis (see Table 4 for more details). 933
Figure 3. Ancestral reconstruction for family Muridae with BioGeoBEARS (DEC+J; d=0.008; 934
e=0; j=0.0246; LnL=-117.11). Five biogeographical areas are represented using 935
different colours: A, West Palearctic (dark blue); B, East Palearctic (light blue); C, 936
Indomalaya (green); D, Australasia (yellow); E, Afrotropics (red). 937
938
939
940
163
Tatiana Aghová / Ph.D. dissertation (2018)
39
Tables: 941
Table 1: Brief summary of taxonomic changes in the family Muridae. The taxonomic position 942
of particular lineages has changed significantly and they were either considered as 943
separate families, or included in other families outside Muridae (names of families 944
are in bold). 945
Table 2: PartitionFinder results showing optimum partitioning schemes and best fit models 946
for each analysis (RAxML, MrBayes, BEAST). Settings: BIC, unlinked branch 947
lengths, greedy algorithm. 948
Table 3: Overview of 18 candidate fossils with stratigraphic age, locality and relevant references. For 949
more details see Appendix B. 950
Table 4: Overview of fossils finally selected for divergence dating, with parameters of uniform 951
and lognormal prior distribution. 952
Table 5: Comparison of models used for BioGeoBEARS; likelihood scores (LnL), number of 953
parameters (numparams), dispersal rate (d), extinction rate (e), free parameter controlling 954
the relative probability of founder-event speciation events at cladogenesis (j), corrected 955
Akaike Information Criterion (AICc), and AICc model weights. 956
Table 6: Results of divergence dating analysis. Time to the most common ancestor (MRCA) is 957
shown as median in Ma, with 95% highest posterior density (HPD). Estimates from 958
previous studies dealing with divergence dating of murid rodents are reviewed here 959
for comparison. 960
Table 7: Comparison between previous relevant studies. 961
962 963

164
Tatiana Aghová / Ph.D. dissertation (2018)
40
Supplementary material 964
Appendix A. List of taxa and genetic markers. 965
Appendix B. Description of considered fossils. 966
Appendix C. Results of cross-validation of fossil constraints. 967
Appendix D. Maximum likelihood phylogenetic tree. 968
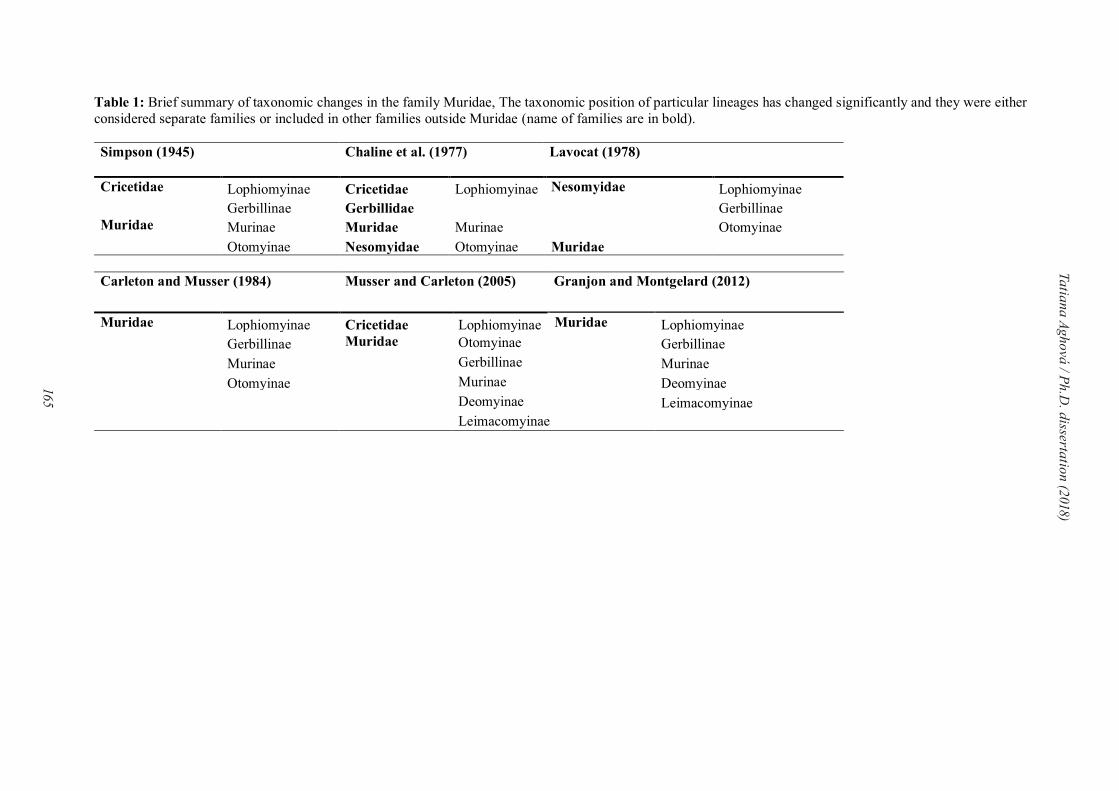
165
Ta
tian
a A
gh
ová
/ Ph
.D. d
isserta
tion
(2018
)
Table 1: Brief summary of taxonomic changes in the family Muridae, The taxonomic position of particular lineages has changed significantly and they were either considered separate families or included in other families outside Muridae (name of families are in bold). Simpson (1945)
Chaline et al. (1977)
Lavocat (1978)
Cricetidae Lophiomyinae Cricetidae Lophiomyinae Nesomyidae Lophiomyinae Gerbillinae Gerbillidae
Gerbillinae Muridae Murinae Muridae Murinae Otomyinae
Otomyinae Nesomyidae Otomyinae Muridae Carleton and Musser (1984) Musser and Carleton (2005) Granjon and Montgelard (2012)
Muridae Lophiomyinae Cricetidae Lophiomyinae Muridae Lophiomyinae Gerbillinae Muridae Otomyinae Gerbillinae Murinae Gerbillinae Murinae Otomyinae Murinae Deomyinae
Deomyinae Leimacomyinae Leimacomyinae
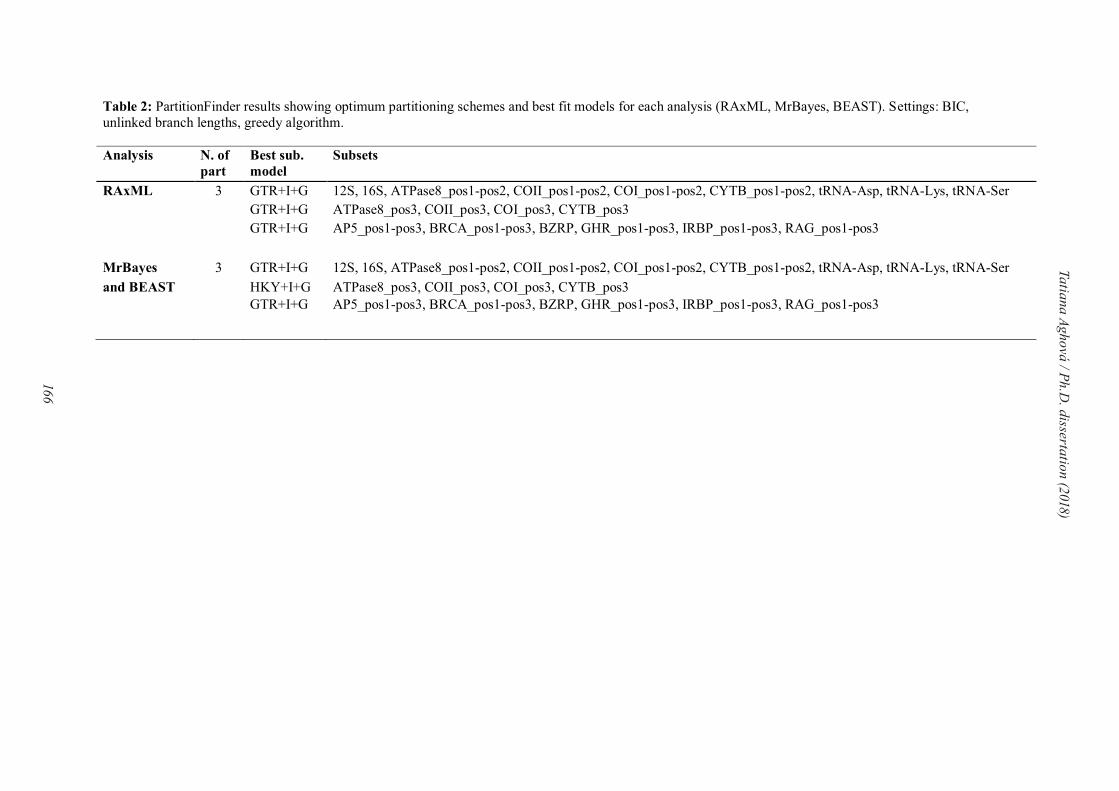
166
Ta
tian
a A
gh
ová
/ Ph
.D. d
isserta
tion
(2018
)
Table 2: PartitionFinder results showing optimum partitioning schemes and best fit models for each analysis (RAxML, MrBayes, BEAST). Settings: BIC, unlinked branch lengths, greedy algorithm. Analysis N. of
part
Best sub.
model
Subsets
RAxML 3 GTR+I+G 12S, 16S, ATPase8_pos1-pos2, COII_pos1-pos2, COI_pos1-pos2, CYTB_pos1-pos2, tRNA-Asp, tRNA-Lys, tRNA-Ser GTR+I+G ATPase8_pos3, COII_pos3, COI_pos3, CYTB_pos3 GTR+I+G AP5_pos1-pos3, BRCA_pos1-pos3, BZRP, GHR_pos1-pos3, IRBP_pos1-pos3, RAG_pos1-pos3
MrBayes 3 GTR+I+G 12S, 16S, ATPase8_pos1-pos2, COII_pos1-pos2, COI_pos1-pos2, CYTB_pos1-pos2, tRNA-Asp, tRNA-Lys, tRNA-Ser
and BEAST HKY+I+G ATPase8_pos3, COII_pos3, COI_pos3, CYTB_pos3 GTR+I+G AP5_pos1-pos3, BRCA_pos1-pos3, BZRP, GHR_pos1-pos3, IRBP_pos1-pos3, RAG_pos1-pos3
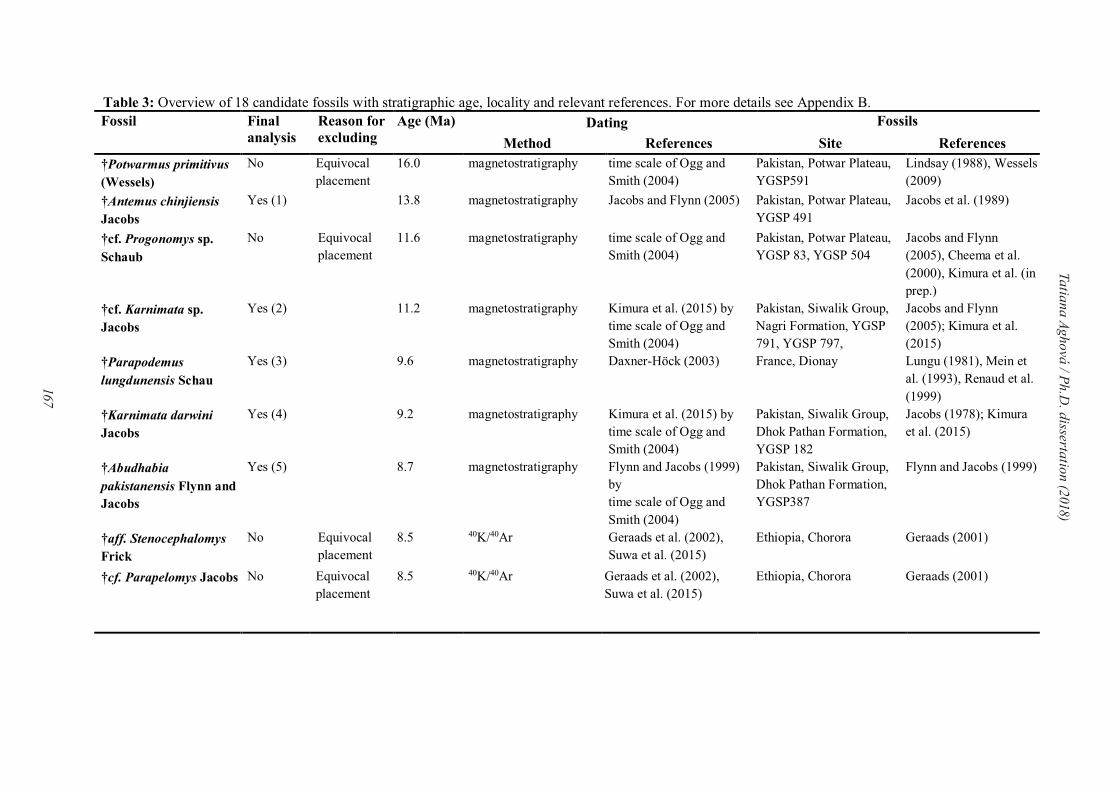
167
Ta
tian
a A
gh
ová
/ Ph
.D. d
isserta
tion
(2018
)
Table 3: Overview of 18 candidate fossils with stratigraphic age, locality and relevant references. For more details see Appendix B. Fossil Final
analysis
Reason for
excluding
Age (Ma) Dating Fossils
Method References Site References
†Potwarmus primitivus
(Wessels)
No Equivocal placement
16.0 magnetostratigraphy time scale of Ogg and Smith (2004)
Pakistan, Potwar Plateau, YGSP591
Lindsay (1988), Wessels (2009)
†Antemus chinjiensis
Jacobs
Yes (1) 13.8 magnetostratigraphy Jacobs and Flynn (2005) Pakistan, Potwar Plateau, YGSP 491
Jacobs et al. (1989)
†cf. Progonomys sp.
Schaub
No Equivocal placement
11.6 magnetostratigraphy time scale of Ogg and Smith (2004)
Pakistan, Potwar Plateau, YGSP 83, YGSP 504
Jacobs and Flynn (2005), Cheema et al. (2000), Kimura et al. (in prep.)
†cf. Karnimata sp.
Jacobs
Yes (2) 11.2 magnetostratigraphy Kimura et al. (2015) by time scale of Ogg and Smith (2004)
Pakistan, Siwalik Group, Nagri Formation, YGSP 791, YGSP 797,
Jacobs and Flynn (2005); Kimura et al. (2015)
†Parapodemus
lungdunensis Schau
Yes (3) 9.6 magnetostratigraphy Daxner-Höck (2003) France, Dionay Lungu (1981), Mein et al. (1993), Renaud et al. (1999)
†Karnimata darwini
Jacobs
Yes (4) 9.2 magnetostratigraphy Kimura et al. (2015) by time scale of Ogg and Smith (2004)
Pakistan, Siwalik Group, Dhok Pathan Formation, YGSP 182
Jacobs (1978); Kimura et al. (2015)
†Abudhabia
pakistanensis Flynn and
Jacobs
Yes (5) 8.7 magnetostratigraphy Flynn and Jacobs (1999) by time scale of Ogg and Smith (2004)
Pakistan, Siwalik Group, Dhok Pathan Formation, YGSP387
Flynn and Jacobs (1999)
†aff. Stenocephalomys
Frick
No Equivocal placement
8.5 40K/40Ar Geraads et al. (2002), Suwa et al. (2015)
Ethiopia, Chorora Geraads (2001)
†cf. Parapelomys Jacobs No Equivocal placement
8.5 40K/40Ar Geraads et al. (2002), Suwa et al. (2015)
Ethiopia, Chorora Geraads (2001)

168
Ta
tian
a A
gh
ová
/ Ph
.D. d
isserta
tion
(2018
)
Table 3 (continued)
Fossil Final
analysis
Reason for
excluding
Age (Ma) Dating Fossils
Method References Site References
†Preacomys kikiae
Geraads
No Equivocal placement
8.5 40K/40Ar Geraads et al. (2002), Suwa et al. (2015)
Ethiopia, Chorora Geraads (2001)
†Mus sp. Linneaus Yes (6) 8.0 magnetostratigraphy Kimura et al. (2015) by time scale of Ogg and Smith (2004)
Pakistan, Siwalik Group, Dhok Pathan Formation, YGSP 547
Kimura et al. (2013; 2015)
†Acomys sp. I. Geoffroy No missing M1 6.1 40Ar / 39Ar Deino and Ambrose (2007)
Kenya, Lemudong’o,
locality 1 Manthi (2007)
†Aethomys sp.Thomas Yes (7) 6.1 40Ar / 39Ar Deino and Ambrose (2007)
Kenya, Lemudong'o, locality 1
Manthi (2007)
†Arvicanthis sp. Lesson Yes (8) 6.1 40Ar / 39Ar Deino and Ambrose (2007)
Kenya, Lemudong’o,
locality 1 Manthi (2007)
†Gerbilliscus sp.
(Thomas)
Yes (9) 6,1 40Ar / 39Ar Deino and Ambrose (2007)
Kenya, Lemudong'o, locality 1
Manthi (2007)
†Lemniscomys sp.
Trouessart
No missing M1 6.1 40Ar / 39Ar Deino and Ambrose (2007)
Kenya, Lemudong’o,
locality 1 Manthi (2007)
†Mastomys sp. Thomas No cross-validation
6.1 40Ar / 39Ar Deino and Ambrose (2007)
Kenya, Lemudong’o,
locality 1 Manthi (2007)
†Gerbillus sp.
Desmarest
No cross-validation
2.4 geochronology (BKT-3 tephra), 40K/40Ar, 40Ar / 39Ar; sedimentology
Kimbel et al. (1996), Campisano and Feibel (2008)
Ethiopia, Hadar, AL894 Reed (2011)
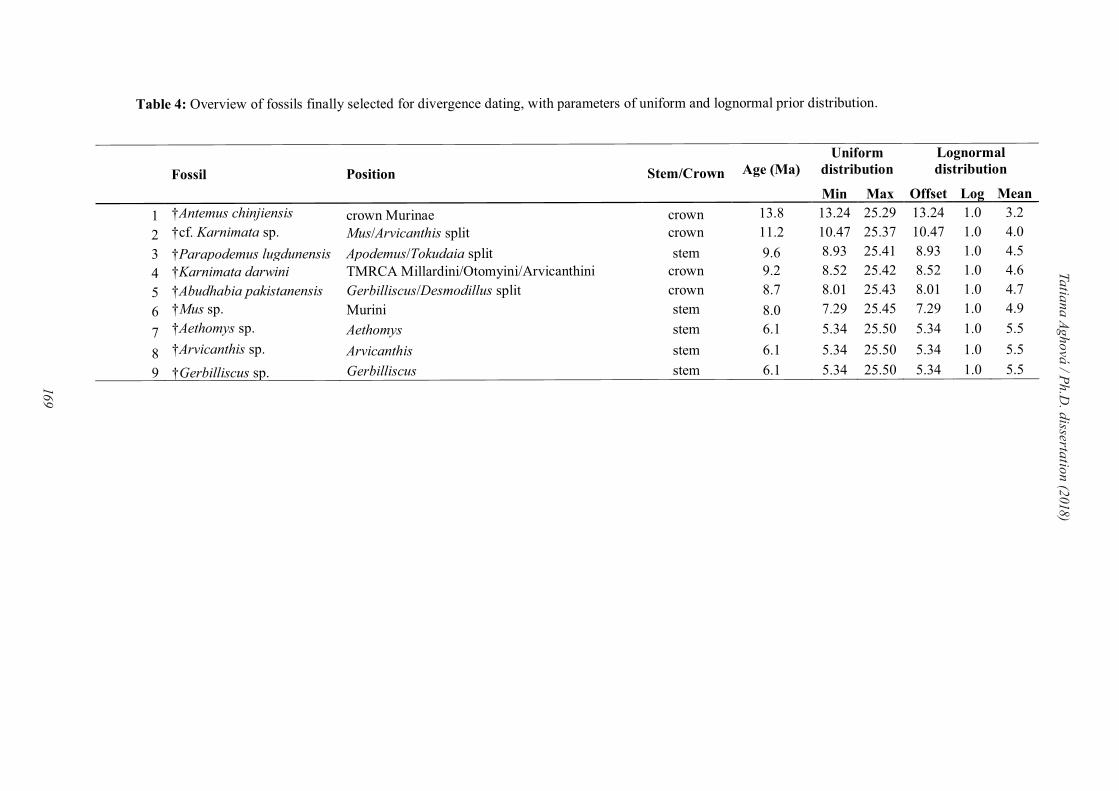
169
Ta
tian
a A
gh
ová
/ Ph
.D. d
isserta
tion
(2018
)
Table 4: Overview of fossils finally selected for divergence dating, with parameters of uniform and lognormal prior distribution.
Fossil Position Stem/Crown
Age (Ma)
Uniform
distribution
Lognormal
distribution
Min Max Offset Log Mean
1 †Antemus chinjiensis crown Murinae crown 13.8 13.24 25.29 13.24 1.0 3.2
2 †cf. Karnimata sp. Mus/Arvicanthis split crown 11.2 10.47 25.37 10.47 1.0 4.0
3 †Parapodemus lugdunensis Apodemus/Tokudaia split stem 9.6 8.93 25.41 8.93 1.0 4.5
4 †Karnimata darwini TMRCA Millardini/Otomyini/Arvicanthini crown 9.2 8.52 25.42 8.52 1.0 4.6
5 †Abudhabia pakistanensis Gerbilliscus/Desmodillus split crown 8.7 8.01 25.43 8.01 1.0 4.7
6 †Mus sp. Murini stem 8.0 7.29 25.45 7.29 1.0 4.9
7 †Aethomys sp. Aethomys stem 6.1 5.34 25.50 5.34 1.0 5.5
8 †Arvicanthis sp. Arvicanthis stem 6.1 5.34 25.50 5.34 1.0 5.5
9 †Gerbilliscus sp. Gerbilliscus stem 6.1 5.34 25.50 5.34 1.0 5.5
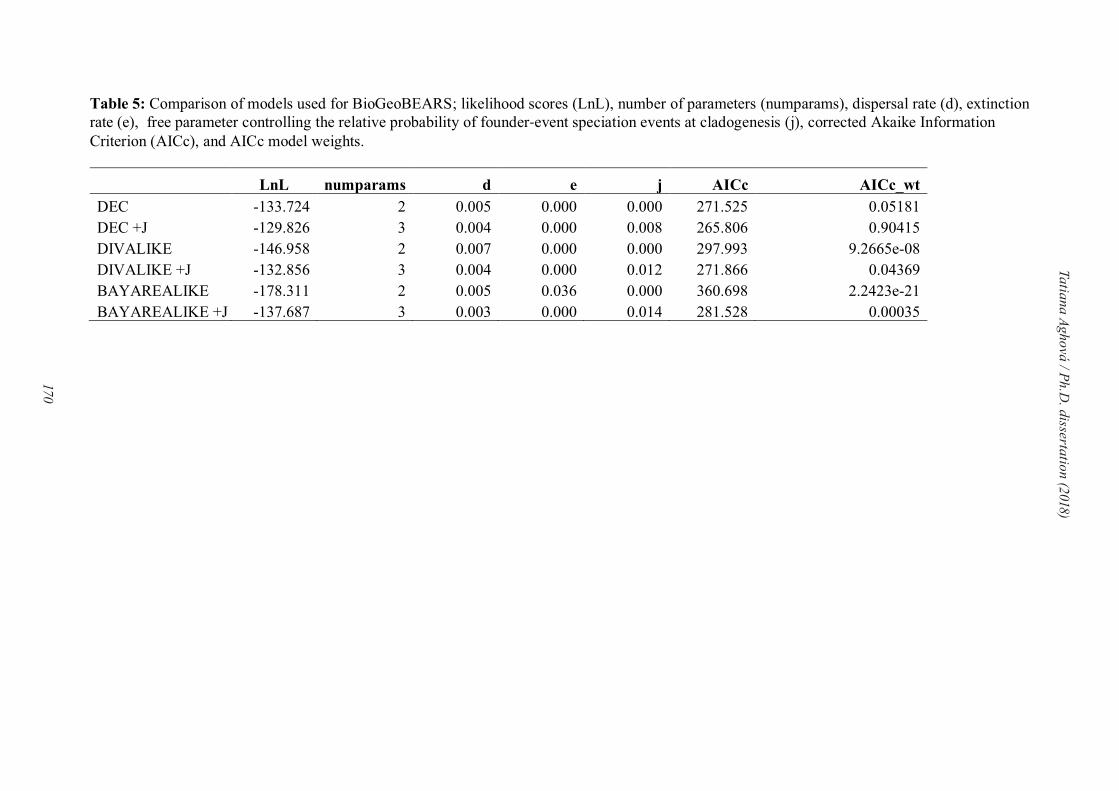
170
Ta
tian
a A
gh
ová
/ Ph
.D. d
isserta
tion
(2018
)
Table 5: Comparison of models used for BioGeoBEARS; likelihood scores (LnL), number of parameters (numparams), dispersal rate (d), extinction rate (e), free parameter controlling the relative probability of founder-event speciation events at cladogenesis (j), corrected Akaike Information Criterion (AICc), and AICc model weights.
LnL numparams d e j AICc AICc_wt
DEC -133.724 2 0.005 0.000 0.000 271.525 0.05181 DEC +J -129.826 3 0.004 0.000 0.008 265.806 0.90415 DIVALIKE -146.958 2 0.007 0.000 0.000 297.993 9.2665e-08 DIVALIKE +J -132.856 3 0.004 0.000 0.012 271.866 0.04369 BAYAREALIKE -178.311 2 0.005 0.036 0.000 360.698 2.2423e-21 BAYAREALIKE +J -137.687 3 0.003 0.000 0.014 281.528 0.00035
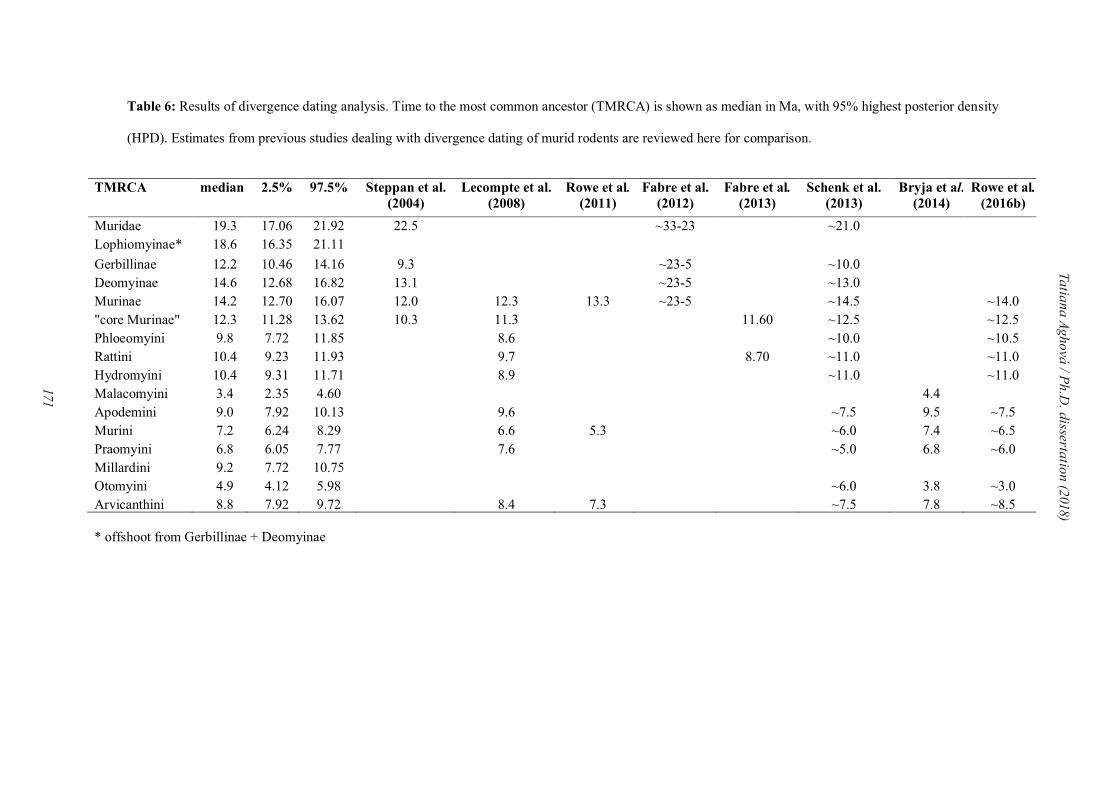
171
Ta
tian
a A
gh
ová
/ Ph
.D. d
isserta
tion
(2018
)
Table 6: Results of divergence dating analysis. Time to the most common ancestor (TMRCA) is shown as median in Ma, with 95% highest posterior density
(HPD). Estimates from previous studies dealing with divergence dating of murid rodents are reviewed here for comparison.
TMRCA median 2.5% 97.5% Steppan et al.
(2004)
Lecompte et al.
(2008)
Rowe et al.
(2011)
Fabre et al.
(2012)
Fabre et al.
(2013)
Schenk et al.
(2013)
Bryja et al.
(2014)
Rowe et al.
(2016b)
Muridae 19.3 17.06 21.92 22.5 ~33-23 ~21.0 Lophiomyinae* 18.6 16.35 21.11
Gerbillinae 12.2 10.46 14.16 9.3 ~23-5 ~10.0 Deomyinae 14.6 12.68 16.82 13.1 ~23-5 ~13.0 Murinae 14.2 12.70 16.07 12.0 12.3 13.3 ~23-5 ~14.5 ~14.0 "core Murinae" 12.3 11.28 13.62 10.3 11.3 11.60 ~12.5 ~12.5 Phloeomyini 9.8 7.72 11.85 8.6 ~10.0 ~10.5 Rattini 10.4 9.23 11.93 9.7 8.70 ~11.0 ~11.0 Hydromyini 10.4 9.31 11.71 8.9 ~11.0 ~11.0 Malacomyini 3.4 2.35 4.60 4.4 Apodemini 9.0 7.92 10.13 9.6 ~7.5 9.5 ~7.5 Murini 7.2 6.24 8.29 6.6 5.3 ~6.0 7.4 ~6.5 Praomyini 6.8 6.05 7.77 7.6 ~5.0 6.8 ~6.0 Millardini 9.2 7.72 10.75 Otomyini 4.9 4.12 5.98 ~6.0 3.8 ~3.0 Arvicanthini 8.8 7.92 9.72 8.4 7.3 ~7.5 7.8 ~8.5 * offshoot from Gerbillinae + Deomyinae
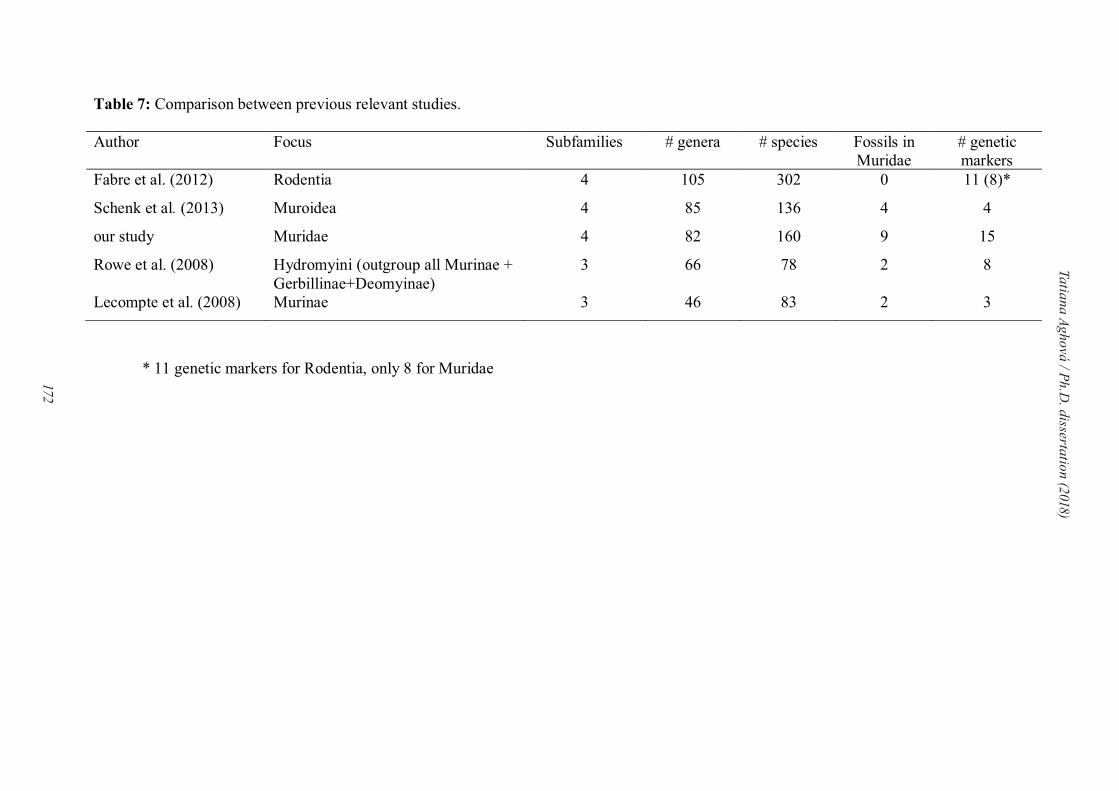
172
Ta
tian
a A
gh
ová
/ Ph
.D. d
isserta
tion
(2018
)
Table 7: Comparison between previous relevant studies. Author Focus Subfamilies # genera # species Fossils in
Muridae # genetic markers
Fabre et al. (2012) Rodentia 4 105 302 0 11 (8)*
Schenk et al. (2013) Muroidea 4 85 136 4 4
our study Muridae 4 82 160 9 15
Rowe et al. (2008) Hydromyini (outgroup all Murinae + Gerbillinae+Deomyinae)
3 66 78 2 8
Lecompte et al. (2008) Murinae 3 46 83 2 3
* 11 genetic markers for Rodentia, only 8 for Muridae
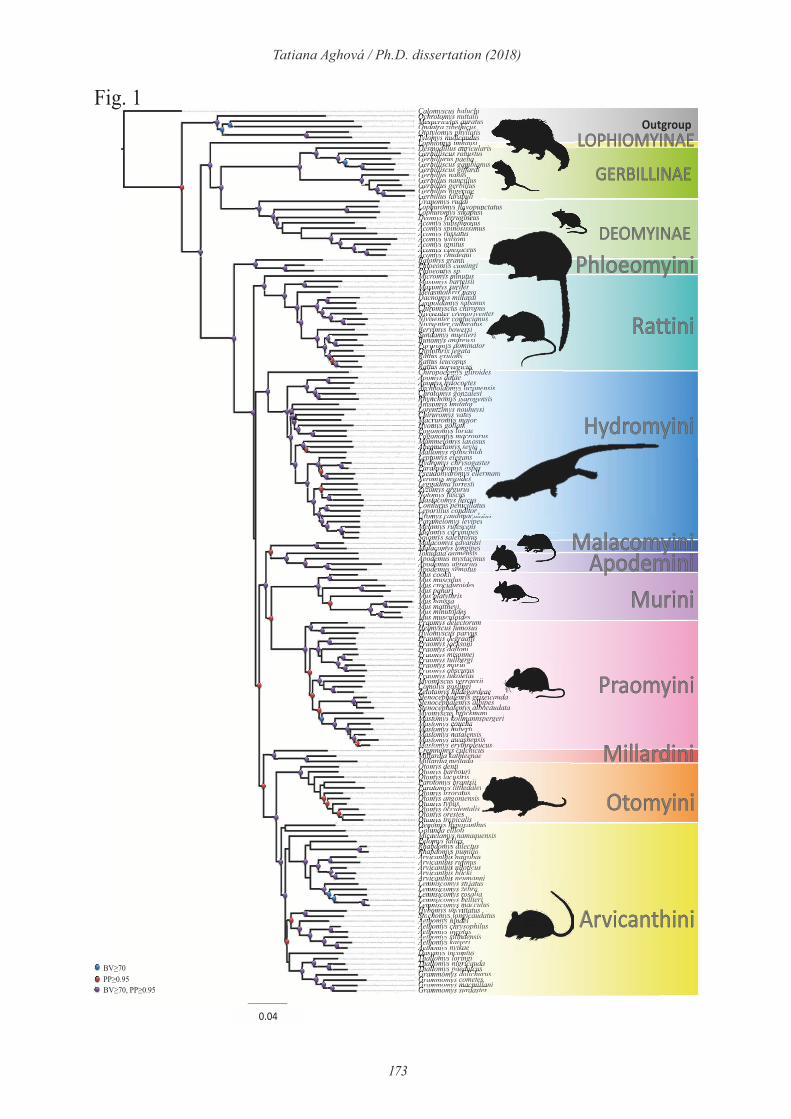
173
Tatiana Aghová / Ph.D. dissertation (2018)
Calomyscus baluchiOchrotomys nuttalliMesocricetus auratusOndatra zibethicusOtotylomys phyllotisTylomys nudicaudusLophiomys imhausiDesmodillus auricularisGerbilliscus robustusGerbillurus paebaGerbilliscus gambianusGerbilliscus giffardiGerbillus nanusGerbillus nancillusGerbillus gerbillusGerbillus nigeriaeGerbillus tarabuliUranomys ruddiLophuromys flavopunctatusLophuromys sikapusiDeomys ferrugineusAcomys subspinosusAcomys spinosissimusAcomys russatusAcomys wilsoniAcomys ignitusAcomys cineraceusAcomys chudeauiBatomys grantiPhloeomys cumingiPhloeomys sp.Micromys minutusMaxomys bartelsiiMaxomys suriferMelasmothrix nasoDacnomys millardiLeopoldamys sabanusChiromyscus chiropusNiviventer cremoriventerNiviventer confucianusNiviventer culturatusBerylmys bowersiSundamys muelleriBunomys andrewsiParuromys dominatorDiplothrix legataRattus exulansRattus leucopusRattus norvegicusChiropodomys gliroidesApomys dataeApomys hylocoetesArchboldomys luzonensisChrotomys gonzalesiRhynchomys isarogensisAnisomys imitatorLorentzimys nouhuysiChiruromys vatesMacruromys majorHyomys goliathPogonomys loriaePogonomys macrourusMammelomys lanosusAbeomelomys seviaMallomys rothschildiLeptomys elegansHydromys chrysogasterParahydromys asperPseudohydromys ellermaniXeromys myoidesLeggadina forrestiZyzomys argurusNotomys fuscusMastacomys fuscusConilurus penicillatusLeporillus conditorUromys caudimaculatusParamelomys levipesMelomys rufescensMelomys cervinipesSolomys salebrosusMalacomys edvardsiMalacomys longipesTokudaia osimensisApodemus mystacinusApodemus agrariusApodemus semotusMus cookiiMus musculusMus crociduroidesMus pahariMus platythrixMus haussaMus mattheyiMus minutoidesMus musculoidesPraomys delectorumHeimyscus fumosusHylomyscus parvusPraomys degraaffiPraomys jacksoniPraomys daltoniPraomys misonneiPraomys tullbergiPraomys morioPraomys obscurusPraomys lukolelaeMyomyscus verrauxiiComolys goslingiZelotomys hildegardeaeStenocephalemys griseicaudaStenocephalemys albipesStenocephalemys albocaudataMyomyscus brockmaniMastomys kollmannspergeriMastomys couchaMastomys hubertiMastomys natalensisMastomys awashensisMastomys erythroleucusCremnomys cutchicusMillardia kathleenaeMillardia meltadaOtomys dentiOtomys barbouriOtomys lacustrisParotomys brantsiiParotomys littledaleiOtomys irroratusOtomys angoniensisOtomys typusOtomys occidentalisOtomys orestesOtomys tropicalisOenomys hypoxanthusGolunda elliotiMicaelamys namaquensisPelomys fallaxRhabdomys dilectusRhabdomys pumilioArvicanthis nairobaeArvicanthis rufinusArvicanthis niloticusArvicanthis blickiArvicanthis neumanniLemniscomys striatusLemnsicomys zebraLemnsicomys rosaliaLemnsicomys bellieriLemniscomys macculusHybomys univittatusStochomys longicaudatusAethomys hindeiAethomys chrysophilusAethomys ineptusAethomys silindensisAethomys kaiseriAethomys nyikaeDasymys incomtusThallomys loringiThallomys nigricaudaThallomys paedulcusGrammomys dolichurusGrammomys cometesGrammomys macmillaniGrammomys surdaster
CalCalCalomyomyomyscuscuscus balbalbalbalbalbaluchuchuchuchuchiiOchOchOchrotrotrotomyomyomysCalCalomyomyomyscuscuscusCalCalomyomyomy s
nutnutnuttaltallibalbalbaluchuchiuchi
MesMesMesMesocrocrocriceicetustusOchOchrotrotrotomyomyomysOch omyomyomys nut
auraurauratuatusOndOndOndatratraMesMesocrocrocriceMesMesocrocr
zibzibzibethethethicuicusiceicetustustus aurauratuauraur
OtoOtotyltyltylomyomyssOndOndOndatratraOndatra zibzibzib
phyphyphyllollotistiszibethethethicuicuszibethicus
TylomyomyomyomysOtoOtotyltyltylomyOtotyltyltylomy
nudnudnudnudicaicaicauduudussomyomyssomyomy phyphyphyllollotistisphyphyphyllotis
LopLopLopLopLopLophiohiohiohiohiomysmysmysmysTylTylomyomyomyomyomyomysTylTylomyomyomyomyomys nudnudnudnud
imhimhimhimhimhimhimhausausausausausausiiinudicaicaicauduudusnudicaicaudus
DesDesDesDesDesDesmodmodmodmodmodillillillillillusususususLopLopLopLopLopLophiohiohiomysmysmysmysLopLopLopLopLop mysmysmys imhimh
auraurauraurauraurauricuicuicuicuicuicuicuicuicularlarlarlarlarlarlarlarimhausausausausi
GerGerbilbilbilliscuscuscusDesDesmodmodillillillusDesDesmodmod
robrobrobrobustustusususaurauraurauricuicularlaraur
GerGerbilbilbillurlurususGerGerbilbilbilliscuscuscusGerGerbilbilbillis
paepaepaepaepaebabacus robrobrobustustrobustust
GerGerbilbilbilliscuscuscusGerGerbilbilbillurlurususGerGerbilbilbillur paepae
gamgamgamgamgamgambiabiabianusnusnuspaepaepaepaepaepaebabapaepaepaepaebaba
GerGerbilbilbilliscuscuscusGerGerbilbilbilliscuscuscusGerGerbilbilbillis
gifgifgifgifgifgiffarfarfarfardididigamgamgamgamgambiabiabianusgamgamgamgambiabiabianus
GerGerbilbilbilluslusGerGerbilbilbilliscuscusGerGerbilbilbillis
nannannanusususususgifgifgifgifgiffarfarfargifgifgifgifgiffarfarfar
GerGerbilbilbilluslusGerGerbilbilluslusGerGerbilbillus
nannannancilcilcilcilcilluslusnannannanusususususus
GerGerbilbilbilluslusGerGerbilbilluslusGerGerbilbillus
gergergergerbilbilbilbilbilbilluslusnannancilcilcilcilluslusnancilcilcilcillus
GerGerbilbilbilluslusGerGerbilbilbilluslusGerGerbilbilbillus
nignignigerierierierieriaeaegergergerbilbilbilluslusgergerbillus
GerGerGerGerbilbilbilbilbilluslusluslusGerGerbilbilbilluslusGerGerbilbilbillus
tartartartarabuabuabuabuabuabuabulililinignignigerierierieriaeaenignignigerieriae
UraUraUraUranomnomnomysysysGerbillusGer tar
rudrudrudruddididitartarabuabu
LopLophurhuromyomysUraUranomnomnomysUraUranomys rud
flaflavopvopunctatusususruddiruddi
LopLophurhuromyomysLopLophurhuromyomysLopLophurhuromyomys
sikapuapusiflavopvopuncflavopvopunc
DeoDeomysmysLopLophurhuromyomyLopLop omyomy
ferrugrugineineusomysomys sikapuapusisikapuapusi
AcoAcomysmysDeoDeomysmysDeomysmys
subspispinosnosusferrugrugineineusferrugrugineus
AcoAcomysmysAcoAcomysmysAcomysmys
spinosnosississimussubspispinosnosussubspispinosnosus
AcoAcomysmysAcoAcomysmysAcomysmys
russatsatusspinosnosissspinosnosiss
AcoAcomysmysAcoAcomysmysAco
wilsonsonirussatsatusrussatus
AcoAcomysmysAcoAcomysmysAcomysmys
ignituitusAcoAcomysmysAcoAcomysmysAcomysmys
cineraeraceuceusignituitusign s
AcoAcomysmysAcoAcomysmysAcomysmys
chudeadeauiuicineraeraceucineraceu
BatBatBatBatBatomyomyomyomyomyssssAcoAcoAcomysmysAcoAcomysmys chu
gragragrantintintintintintiPhlPhlPhloeooeooeomysmysmysBatBatBatomyomyomyomysssBatBatBatomyomyomyomy gragra
cumcumcumingingingigrantintintigra
PhlPhlPhlPhloeooeooeooeooeooeomysmysmysmysmysPhlPhlPhloeooeooeooeomysmysmysPhlPhlPhloeooeooeooeomysmysmys
spcumcum.
MicMicMicromromromysysysPhloeooeooeomysmysmysPhl mys
minminminutuutuutuutuutuutuutussmysmysmysmys spspspspspsp
MaxMaxMaxomyomyomyssMicMicMicromromromysysMic ysys
barbarteltelteltelsiiminminutuutuutusminutus
MaxMaxMaxomyomyomyssMaxMaxMaxomyomyomyssMaxomyomyomy
surifeifeifeiferbarteltelteltelsiibarteltelsii
MelMelMelasmasmasmothothothrixMaxMaxMaxomyomyomyssMaxMaxomyomyomy surifesurife
nasnasoifeifeifeife
DacDacDacnomnomnomysysysMelMelMelasmasmasmothothothMel
milmillarlarlardirixrix nasnasonasnaso
LeoLeoLeopolpolpoldamdamdamysDacDacDacnomnomnomysysysDacnomysysys mil
sabsabsabanumilmillarlarlardilardi
ChiChiChiromromromyscyscyscusLeoLeoLeopolpolpoldamdamdamysLeoLeopolpolpol ys
chichichichiropsabsabanusabanu
NivNivNiviveiveivententerrChiChiChiromromromyscyscyscusChiromyscyscyscus
crecremormormormormoriveyscusyscus chichichichiroprop
NivNivNiviveiveivententerrNivNivNiviveiveivententerrNivNivive
conconfucfucfuciancremormormormorivecremor
NivNivNiviveiveivententerrNivNivNiviveiveivententerrNivNivive
culculturturturturatuconconfucfucfucianconfucfucfucian
BerBerBerylmylmylmysNivNivNiviveiveiventerNiviveivente
bowbowersersersersirr culculturturturatu
SunSunSundamdamdamysysysBerBerBerylmylmylmysBerylmylmylmys bow
muemuemuemuellelleribowbowersersersiersi
BunBunBunomyomyomysSunSunSundamdamdamysSun ys
andandrewrewrewrewsiys muemuemuellellerimue ri
ParParParurourouromysmysmysBunBunBunomyomyomysBunomyomyomys and
domdomdomdominatorandrewrewrewrewsiand
DipDipDiplotlotlothrihrixxParParParurourouromysmysmysParParParurouromysmysmys
leglegataataataatadomdomdomdominadomdomdomdom
RatRatRattustustusDipDipDiplotlothriDipDipDiplothri
exuexuexulansshrihrixx legatalegata
RatRatRattustustusRatRatRattustustusRatRatRat
leuleuleucopususususexuexuexulanssexu
RatRatRattustustusRatRatRattustustusRat
nornornorvegvegicuicuicuicuicuicusleuleuleucopusususcopus
ChiChiChiChiChiropropropropropodoodoodomysmysmysmysRatRatRattustustusRat nornornornorvegvegicuicuicunornornorvegicu
gligligligligliroiroiroiroiroidesdesdesdesdesicuicuicusssicuicusss
ApoApoApomysmysmysChiChiropropropodoChiropropropodo
datdatdataeodoodomysmysodomysmys
ApoApoApomysmysmysApoApoApomysmysmysApoApoApomysmysmys
hylhylhylocoocoeteeteetesdatdatdataedatdatae
ArcArcArchbohbohboldoldomysmysApoApoApomysmysmysApoApomysmysmys hylhylhylocohylhylhyloco
luzluzluzoneoneonensinsisocoeteeteetesocoeteetes
ChrChrotootootomysmysArcArchbohbohboldoldomysArchbo mys
gongonzalzalzalesiesiesimysmys luzluzluzoneoneoneluzoneone
RhyRhynchnchnchomyomyomysChrChrotootootomysmysChrotomysmys gongon
isaisaisarogrogrogensensisisgongonzalzalzalesiesiesigon
AniAniAnisomsomsomysRhyRhynchnchnchomyRhyRhy omy
imiimitattattatororomyomysomyomys isaisaisarogrogisaisarogrog
LorLorentententzimzimysysAniAnisomsomsomysAnisomsomys imiimi
nounounouhuyhuyhuyhuysiimitattattatororor
ChiChirurrurruromyomyssLorLorentententzimzimysysLorLorentententzimzimysys
vatvatesesnounounouhuynounounouhuy
MacMacrurrurruromyomyomysChiChirurrurruromyomyssChi omyomy vat
majmajmajororHyoHyomysmysmysMacMacrurrurruromyMac omy
golgolgoliathhomyomyomysomyomyomys majmajmajmaj
PogPogonoonoonomysmysmysHyoHyomysmysmysHyoHyomysmysmys golgolgoliatgolgolgoliat
lorlorloriaeiaeiaeiathhiath
PogPogonoonoonomysmysmysPogPogonoonoonomysmysmysPogPog mysmysmys
macmacmacrourouMamMamMammelmelomyomyomysPogPogonoonoonomysmysmysPogPog mysmysmys mac
lanlanlanosuosumacmacrouroumac
AbeAbeAbeomeomeomelomlomlomysMamMamMammelmelomyomyomysMammelomyomyomys
sevsevsevseviaMalMallomlomlomysysAbeAbeomeomeomelomlomAbeAbeome
rotrothschschschilhillomlomysys sevsevsevseviasevsevia
LepLeptomtomtomysMalMallomlomlomysMalMallomys
eleeleganganganssrotrothschschschilrot
HydHydromromromysysLepLeptomtomtomysLepLeptomys
chrysoysoysoysogasgaseleganganganselegangangans
ParParahyahyahydrodromysmysHydHydromromromysysHydHydromromysys chrysochryso
aspaspaspysoysogasysoysogas
PsePseudoudoudohydhydhydromromromysysParParahyahyahydrodromysmysParParahyahyahydrodromysmys aspaspaspasp
ellasp
XerXerXeromyomyomysPsePseudoudoudohydPse hyd
myomyomyoideideideshydhydhydromromromysyshydhydhydromromysys
LegLeggadgadgadinainaXerXeromyomyomysXeromyomyomys myomyomyo
forresresrestitimyoideideidesmyo s
ZyzZyzomyomyomysLegLeggadgadgadinaLegLeggadgadgadina
argargarguruuruurusinainaina forresresrestiforresresresti
NotNotomyomyomysZyzZyzomyomyomysZyzZyzomyomyomys
fusfusfuscuscuscusargargarguruuruargargarg
MasMastactactacomyomyomysNotNotomyomyomysNotomyomyomys fusfusfuscusfusfusfuscus
fusfusfuscuscusfuscuscusfuscus
ConConiluiluilurusrusMasMastactactacomyomyMastactacomyomy
penpeniciiciicillallaomyomysomys fusfusfuscuscusfusfusfuscuscus
LepLeporioriorillussConConiluiluilurusrusConilurus
conditditditororpeniciiciicillallapeniciicilla
UroUromysmysmysLepLeporioriorilluLepLep llu
caucaucaudimdimdimacuaculatlatususllusslluss conditditditororcon
ParParameameamelomlomlomysUroUromysmysmysUromysmys caucaucaudimcau
levlevlevipeipeipeipesdimdimdimacuaculatlatdimdimacuacu
MelMelomyomyomysParParParameameamelomParParamelom
rufrufescescensenslomlomysys levlevlevipeipeipeipe
MelMelomyomyomysMelMelomyomyomysMelMelomyomyomys
cercervinvinvinipeipessrufrufescescensensrufrufescens
SolSolSolomyomyomyomysMelMelomyomyomysMelMelomyomyomys
salsalsalsalsalebrebrebrosuosuosuosuosuosuosusss cercervinvinvinipeipescervinipeipes
MalMalMalMalMalacoacoacoacomysmysmysmysmysmysSolomyomyomyomysSolomyomyomys sal
edvedvedvedvedvedvedvardardardardardsisalebrosuosussalebrosuosus
MalMalMalacoacoacomysmysmysmysMalMalMalacoacoacomysmysmysMalMalacomysmysmys
lonlonlongipesedvedvedvardedvard
TokTokTokudaudaudaudaudaiaiaiaMalMalMalacoacoacomysmysMalMalacomysmys
osiosiosiosiosimenmenmenmenmenmenmensissismysmysmysmys lonlonlongipgipgipeslongipgipes
ApoApoApoApodemdemdemususTokTokudaudaudaudaiaTokuda osi
mysmysmystacinuApoApoApoApodemdemdemususApoApoApodemdemdemususApoApodem
agragrariariusmysmysmystacinumysmystacinu
ApoApoApoApoApodemdemdemdemususApoApoApodemdemdemususApoApodem
semsemsemotusagragrariariusagragrariarius
MusMusMusApoApodemApodem
coocookiikiikiikiidemdemdemdemusususdemususus
MusMusMusMusMusMusMusMus
musculculuscookiikii
MusMusMusMusMusMusMusMus
crocidcidurouroidesmusculculusmusculus
MusMusMusMusMusMusMusMus
pahpahariaricrocidcidurocrocidciduro
MusMusMusMusMusMusMusMus
plaplatyttythrixxpahpahariaripahpahariari
MusMusMusMusMusMusMusMus
haussassaplatyttythriplatyttythri
MusMusMusMusMusMusMusMus
matthetheyihaussassahaussa
MusMusMusMusMusMusMusMus
minutoutoideideidesmatthetheyimatthetheyi
MusMusMusMusMusMusMusMus
musmusculculoidoidoidesminutoutoideideidesutoideides
PraPraPraomyomyomyssMusMus musmus
deldeldeldeldelectectectectoruorummculculoidoidoidesculculoid
HeiHeiHeimysmyscusPraPraPraomyomysPraPraPraomyomys del
fumfumfumosusdeldelectectorumdel
HylHylHylomyomyscuscusHeiHeiHeimysmyscusHeiHeiHeimysmyscus fumfum
parparvusfumfumosusfumfumosus
PraPraPraomyomysHylHylHylomyomyscuHylHylHylomyomyscu
degdegdegraaraaffiscuscusscuscus parparvusparparvus
PraPraPraomyomysPraPraPraomyomysPraPra s
jacjacjacksoksonidegdegdegraaraaffidegdegdegraaffi
PraPraPraomyomysPraPraPraomyomysPraPraomyomys
daldaldaltontonijacjacjacksoksonijacjacjacksoni
PraPraPraomyomysPraPraPraomyomysPraPraomyomys
mismismisonnonneiPraPraPraomyomysPraPraPraomyomysPraPraomyomys
tultultullbelbergimismismisonnonneimismisonnei
PraPraPraomyomysPraPraPraomyomysPraPraomyomys
mormormorioiotultultullbelbergilbergi
PraPraPraomyomysPraPraPraomyomysPraPraomyomys
obsobsobscurcurusmormormorioiomor
PraPraPraomyomysPraPraPraomyomysPraPraomyomys
lukluklukoleolelaeobsobsobscurcurusobsobsobscurcurus
MyoMyoMyomysmyscuscusPraPraPraomyomysPraomyomys lukluk
ververrauxiiComComComolyolysMyoMyoMyomysmyscusMyoMyoMyomysmyscus
gosgosgoslinlingicuscus ververrauverrau
ZelZelotootootomysComComComolyolysComComComolyolys gosgos
hilhildegdegardeaeeaeeaegosgoslinlingigosgoslinlingi
SteStenocnocnocephalealealemysmysZelZelotootootomysZelZel mys hilhildegdegardhilhildegdegard
griseiseiseicaucaudaardeaeeaeeaeardeaeeae
SteStenocnocnocephalealealemysmysSteStenocnocnocephalealealemysmysSteSte ephalealemysmys
albipeipeipesgriseiseiseicaugriseiseicau
SteStenocnocnocephalealealemysmysStenocnocnocephalealealemysmysSte ephalealemysmys
albocaocaocaudaudataalbipeipeipesalbipeipes
MyoMyoMyomysmyscuscusSteStenocnocnocephalealeSteSte eph
brobrockmanianialemysmysalemysmys albocaoca
MasMasMastomtomysMyoMyoMyomysmyscusMyoMyoMyomysmyscus
kolkollmalmannsperperpergergericuscus brobrockmanianibrockm
MasMasMastomtomysMasMasMastomtomysMasMastomys
coucouchachakolkollmalmannslmanns
MasMasMastomtomysMasMasMastomtomysMasMastomys
hubhuberterticoucouchachacoucoucha
MasMasMastomtomysMasMasMastomtomysMasMastomys
natnatalealensishubhubertertiert
MasMasMastomtomysMasMasMastomtomysMastomys
awaawaawashensissnatnatalealensisalensi
MasMasMastomtomysMasMasMastomtomysMasMastomys
eryeryerythrthroleucuucuucusawaawaawashensissawashensi
CreCreCreCremnomnomnomysmysmysmysMasMasMastomtomysysMasMas ys eryeryery
cutcutcutcutchichichichicuscuscuscuscuseryerythrthroleucuucuerythrole
MilMillarlarlardiadiaCreCremnomnomysmysCreCremnomnomysmys
kathlehlehlehleenaenaeemysmys cutcutcutchichicuscuscuscutcutcut
MilMilMilMillarlarlarlardiadiadiadiaMilMillarlardiadiaMilMillardia
melmeltadtadtadtadtadtadaaaakathlehlehlehleenaenakathleena
OtoOtoOtoOtomysmysmysMilMillardiadiaMil
dendendendendendentitidiadia mel
OtoOtoOtomysmysmysOtoOtomysmysmysOtomysmysmys
barbarbarbarbouboubouridendendendentidendenti
OtoOtomysmysmysOtoOtomysmysOtomysmys
laclaclacustustrisrisbarbarbarbarboubouribarbarbouri
ParParotootootootomysmysmysOtoOtomysmysmysOtomysmysmys laclaclac
brabrabrantsiilacustrisrislacust
ParParotootootootomysmysmysParParotootootomysmysmysParoto
litlittletledalbrabrabrantsiibrabrabrantsii
OtoOtoOtomysmysmysParParotootomysPar mys
irrirrirroraoratustusmysmysmysmysmysmys
OtoOtoOtomysmysmysOtoOtomysmysmysOtomysmys
angangangangonionioniensisOtoOtomysmysmysOtoOtomysmysmysOtomysmysmys
typtyptypususangangangangangang
OtoOtomysmysmysOtoOtomysmysmysOtomysmysmys
occoccoccoccideideidentalistyptyptypusustyptypus
OtoOtoOtomysmysmysOtoOtomysmysmysOtomysmysmys
oreoreorestestessOtoOtoOtoOtoOtomysmysmysmysOtoOtomysmysmysOtomysmysmys
trotrotrotropicpicpicpicalialialissoreoreorestestessoreoreoresteste
OenOenOenOenomyomyomyomysssOtoOtoOtomysmysmysmysOtoOtomysmysmys trotro
hyphyphypoxaoxaoxaoxaoxaoxaoxanthnthnthnthnthusususustropicalialistropic s
GolGolGolundundaOenOenOenomyomysOenOenOenomyomys
ellelliotiihyphypoxaoxahyphypoxaoxa
MicMicMicaelaelamyamyamyamysGolGolGolundundaGolunda ellelliot
namnamnamnamaquaquensensensensisisPelPelomyomyomysMicMicMicaelaelamyMicMic amy
falfalfalfallaxamyamyamyamysamyamyamys namnam
RhaRhaRhabdobdomysmysmysmysPelPelomyomyomysPelomyomys falfalfalfallaxfalfalfalfallax
dildilectectectuslaxlax
RhaRhaRhabdobdomysmysmysmysRhaRhaRhabdobdomysmysmysmysRhaRhabdobdomysmysmysmys
pumpumpumiliodildilectectectusectus
ArvArvicaicaicanthnthnthisisRhaRhaRhabdobdomysmysmysmysRhaRhabdomysmysmysmys
nainainairobrobaeaepumpumpumpumiliopumpumpumpumilio
ArvArvicaicaicanthnthnthisisArvArvicaicaicanthnthnthisisArvicanthnthis
rufrufrufinuinuinusnainainairobrobaenainairob
ArvArvicaicaicanthnthnthisisArvArvicaicaicanthnthnthisisArv nthnth
nilnilotiotioticuscusrufrufrufinuinuinusrufrufrufinuinus
ArvArvicaicaicanthnthnthisisArvArvicaicaicanthnthnthisisArvicanthnthis
bliblickickickinilnilotiotioticusniloticus
ArvArvicaicaicanthnthnthisisArvArvicaicaicanthnthnthisisArv nthnth
neuneuneumanmanniniLemLemLemnisniscomcomcomcomysArvArvicaicaicanthnthnthisisArvica neu
strstrstrstriatususLemLemLemnsinsicomcomcomcomysLemLemLemnisniscomcomcomcomysLemniscomys
zebzebzebzebrastrstrstrstriatusstriat
LemLemLemnsinsicomcomcomcomysLemLemLemnsinsicomcomcomcomysLemnsicomys
rosrosrosrosaliaaazebzebzebzebrara
LemLemLemnsinsicomcomcomcomysLemLemLemnsinsicomcomcomcomysLemnsicomys
belbelbelbellieririrosrosrosrosaliaaarosrosrosali
LemLemLemnisniscomcomcomcomysLemLemLemnsinsicomcomcomcomysLemnsi ys
macmacmacmacculculusususususbelbelbelbellieririlieri
HybHybHybomyomysLemLemLemnisniscomLemLemLem com
uniunivitvitvittattatususcomcomysys
StoStochochochomysmysmysHybHybHybomyomysHybHybHybomyomys uni
longicgicgicgicaudaudaudatuatuatuatusunivitvitvittattatususuni tat
AetAethomhomhomysysStoStochochochomysmysStoStochochochomysmys
hinhindeideideideimysmys longicgicgicgiclongicgicgicgic
AetAethomhomhomysysAetAethomhomhomysysAetAethomhomysys
chrchrysoysoysoysophiphiluslusluslushinhindeideideideihin
AetAethomhomhomysysAetAethomhomhomysysAetAethomhomysys
ineineptuptuptuptuschrchrysoysoysoysophichrchrysoysoysoysophi
AetAethomhomhomysysAetAethomhomhomysysAetAethomhomysys
silsilindindindindensisisineineptuptuptuptusineptuptuptus
AetAethomhomhomysysAetAethomhomhomysysAetAethomhomysys
kaikaiserserserserisilsilindindindindenssilsilindens
AetAethomhomhomysysAetAethomhomhomysysAetAethomhomysys
nyinyikaekaekaekaekaikaiserserserserikaiser
DasDasDasymyymysAetAethomhomhomysAet ys
incincomtomtomtomtusnyinyikaekaekaekaenyinyikae
ThaThaThallollomysmysmysDasDasDasymyymysDasDasymyymys inc
loringingingingiincomtomtomtomtusincomtus
ThaThaThallollomysmysmysThaThaThallollomysmysmysThaThaThallollomysmysmys
nigricricricricaudaudaaloringingingingiloringingingingi
ThaThaThallollomysmysmysmysThaThaThallollomysmysmysThaThallollomysmysmys
paepaeduldulduldulcuscuscusnigricricricricaudaudaanigricricaud
GraGraGrammommomysmysmysmysThaThaThallollomysmysmysTha mysmysmys paepaepaepae
doldoldolichuruuruuruuruuruspaeduldulduldulcuscuscuspaedulduldulcus
GraGraGrammommomysmysmysmysGraGraGrammommomysmysmysmysGra mysmysmysmys
comcomcometeetesGraGraGrammommomysmysmysmysGraGraGrammommomysmysmysmysGra mysmysmysmys
macmacmacmilmillanlanlanlanicomcomcometeeteseteetes
GraGraGrammommomysmysmysmysGraGraGrammommomysmysmysmysGra
sursursurdasdastertertertertermacmacmacmilmillanlanlanlanmacmil
imus
ingi
anuanussropropususanuanuss
iveivententerropropususroprop
ianianususiveiventente
atuatusianianusus
inatortortor
iidaleieieiiiii
ensisis
ntalislis
unctatususus
nterusnte
iaerourourusrusosuosuosusrourourusrus
iahildididiiaia
gasgasgasterteraspererergasgasgasgasgasgas
ellellellermermanianiasperereraspererer
ti
cusllatustuscuscus
orllatusllatus
aculatlatususor
ardardsisisisigipesesesardsisisi
sissississisgipgipesesgipgipes
tacinuinuinuinusususus
tacinuinuinutac
otuotussssusus
cauda
!"#$%!&
larlarlarlarisisisis
nus
larlarlarlarisisisisis
nus
BV 70, PP 0.95
PP 0.95
BV 70
! "
Fig. 1
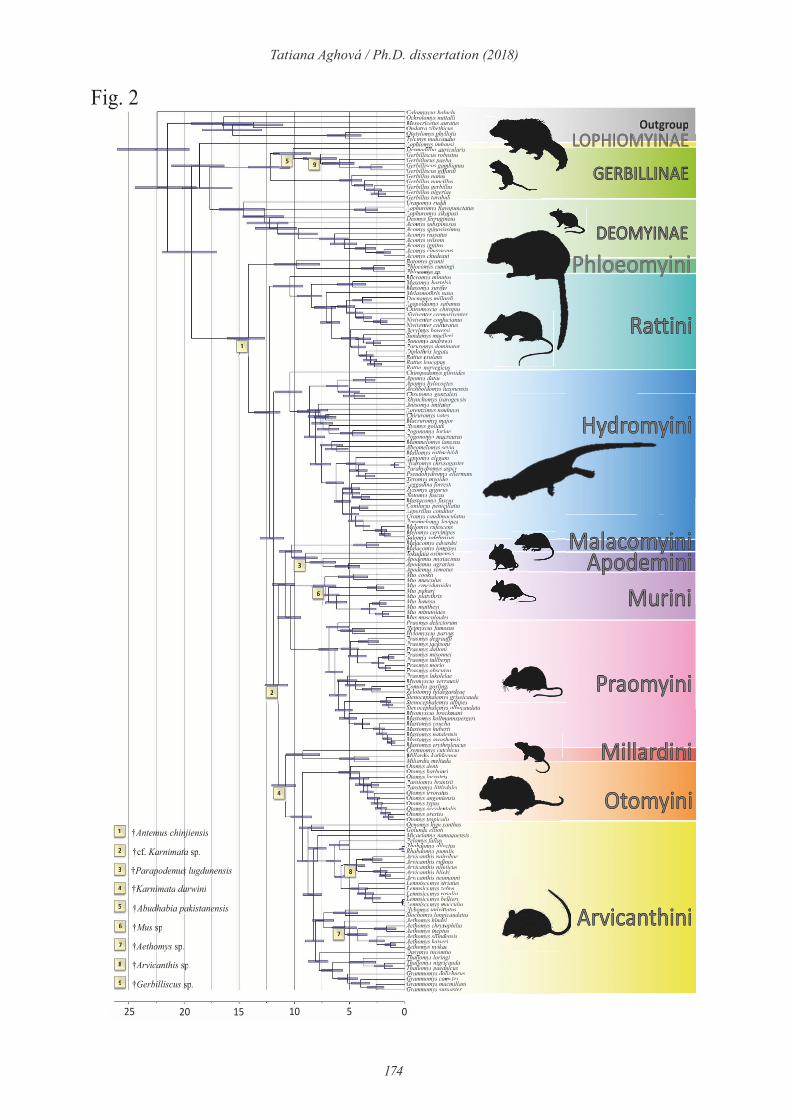
174
Tatiana Aghová / Ph.D. dissertation (2018)
Calomyscus baluchiOchrotomys nuttalliMesocricetus auratusOndatra zibethicusOtotylomys phyllotisTylomys nudicaudusLophiomys imhausiDesmodillus auricularisGerbilliscus robustusGerbillurus paebaGerbilliscus gambianusGerbilliscus giffardiGerbillus nanusGerbillus nancillusGerbillus gerbillusGerbillus nigeriaeGerbillus tarabuliUranomys ruddiLophuromys flavopunctatusLophuromys sikapusiDeomys ferrugineusAcomys subspinosusAcomys spinosissimusAcomys russatusAcomys wilsoniAcomys ignitusAcomys cineraceusAcomys chudeauiBatomys grantiPhloeomys cumingiPhloeomys sp.Micromys minutusMaxomys bartelsiiMaxomys suriferMelasmothrix nasoDacnomys millardiLeopoldamys sabanusChiromyscus chiropusNiviventer cremoriventerNiviventer confucianusNiviventer culturatusBerylmys bowersiSundamys muelleriBunomys andrewsiParuromys dominatorDiplothrix legataRattus exulansRattus leucopusRattus norvegicusChiropodomys gliroidesApomys dataeApomys hylocoetesArchboldomys luzonensisChrotomys gonzalesiRhynchomys isarogensisAnisomys imitatorLorentzimys nouhuysiChiruromys vatesMacruromys majorHyomys goliathPogonomys loriaePogonomys macrourusMammelomys lanosusAbeomelomys seviaMallomys rothschildiLeptomys elegansHydromys chrysogasterParahydromys asperPseudohydromys ellermaniXeromys myoidesLeggadina forrestiZyzomys argurusNotomys fuscusMastacomys fuscusConilurus penicillatusLeporillus conditorUromys caudimaculatusParamelomys levipesMelomys rufescensMelomys cervinipesSolomys salebrosusMalacomys edvardsiMalacomys longipesTokudaia osimensisApodemus mystacinusApodemus agrariusApodemus semotusMus cookiiMus musculusMus crociduroidesMus pahariMus platythrixMus haussaMus mattheyiMus minutoidesMus musculoidesPraomys delectorumHeimyscus fumosusHylomyscus parvusPraomys degraaffiPraomys jacksoniPraomys daltoniPraomys misonneiPraomys tullbergiPraomys morioPraomys obscurusPraomys lukolelaeMyomyscus verrauxiiComolys goslingiZelotomys hildegardeaeStenocephalemys griseicaudaStenocephalemys albipesStenocephalemys albocaudataMyomyscus brockmaniMastomys kollmannspergeriMastomys couchaMastomys hubertiMastomys natalensisMastomys awashensisMastomys erythroleucusCremnomys cutchicusMillardia kathleenaeMillardia meltadaOtomys dentiOtomys barbouriOtomys lacustrisParotomys brantsiiParotomys littledaleiOtomys irroratusOtomys angoniensisOtomys typusOtomys occidentalisOtomys orestesOtomys tropicalisOenomys hypoxanthusGolunda elliotiMicaelamys namaquensisPelomys fallaxRhabdomys dilectusRhabdomys pumilioArvicanthis nairobaeArvicanthis rufinusArvicanthis niloticusArvicanthis blickiArvicanthis neumanniLemniscomys striatusLemnsicomys zebraLemnsicomys rosaliaLemnsicomys bellieriLemniscomys macculusHybomys univittatusStochomys longicaudatusAethomys hindeiAethomys chrysophilusAethomys ineptusAethomys silindensisAethomys kaiseriAethomys nyikaeDasymys incomtusThallomys loringiThallomys nigricaudaThallomys paedulcusGrammomys dolichurusGrammomys cometesGrammomys macmillaniGrammomys surdaster
!"#$%!&
' †Antemus chinjiensis
( †cf. Karnimata sp.
†Parapodemus lugdunensis
†Mus sp.
†Abudhabia pakistanensis
†Gerbilliscus sp.
†Aethomys sp.
†Arvicanthis sp.
)
*
+
,
-
†Karnimata darwini.
'
(
)
.
*
+
,
-
/
CaloCaloCalomyscmyscmyscusus balubalubaluchiOchrOchrOchrotomotomotomotomysys
myscmyscmyscnuttnuttnuttalli
MesoMesoMesocriccriccricetusetusOchrOchrOchrotomotomotomotomysysOchrOchrotomotom
auraauraauratustusOndaOndaOndatratratra zibezibethicthicthicusOtotOtotOtotylomylomylomylomysys phylphyllotilotissTyloTyloTyloTylomysmysmysmysmysOtotOtotOtotylomylomOtotOtotOtot
nudinudinudinudicaudcaudcaudususylomysys phylphyllotilotisphylloti
LophLophLophLophLophiomyiomyiomyiomyiomysssTyloTylomysTyloTylomys
imhaimhaimhaimhausiusiusiusiusiDesmDesmDesmDesmodilodilodilodilodilodilluslusLophLophiomyiomysLophiomyiomys
auriauriauriauriculaculaculaculacularisrisrisrisrisGerbGerbGerbilliilliscusscus roburoburobustusstusstusGerbGerbGerbilluillurusrus paebpaebpaebaGerbGerbGerbilliilliscusscus
paebgambgambianuianuianuianuianuianusspaebpaebpaebaa
GerbGerbGerbilliilliscusscus giffgiffardiardiardigambgambianuianuianugambgambianuianu
GerbGerbGerbilluillus nanussGerbGerbGerbilluillus nancilluillusGerbGerbGerbilluillus gerbilluillusGerbGerbGerbilluillus nigeriaeriae
gerbilluillusgerbillu
GerbGerbGerbGerbGerbGerbGerbilluilluilluilluilluilluss tarataratarabulibulibulibulinigeriaeriaenigeriaeriae
UranUranUranomys ruddruddruddiLophLophLophuromysysUranUranomysUranUranomys
flavflavopunopunctatctatusLophLophLophuromysysLophLophuromysysLophLophurom
sikasikapusipusiflavflavopunopunflavopun
DeomDeomDeomysLophLophLoph
ferrferruginugineuseusuromysysuromys sikasikapusipusisika
AcomAcomysDeomDeomysDeom
subssubspinopinosussusferrferruginugineuseusferrugin
AcomAcomysAcomAcomAcomysAcom
spinspinosisosissimusimussubssubspinopinosussussubspinosus
AcomAcomAcomysysrussrussatusatus
AcomAcomAcomysAcomAcomAcomysAcom
wilswilsonioniAcomAcomAcomysAcomAcomysAcom
igniignitustusAcomAcomAcomys
yscinecineraceraceusigniigniigni
AcomAcomAcomysysysAcomAcomAcomysAcom
chudchudchudchudeauieauieauieauiBatoBatoBatomysmysmys
ysgrangrangrantititi
PhloPhloeomyeomyeomyssBatoBatomysmysmysBatoBato grangran
cumicumicumingigrangrantiti
PhloPhloPhloPhloeomyeomyeomyeomyeomyeomysssPhloPhloeomyeomyeomyeomyssPhloPhlo
spspsp.MicrMicrMicromysomysomys
eomyeomyeomyminuminuminuminutustusspsp
MaxoMaxoMaxomysmysmysMicrMicrMicromysomysomysMicrMicr
bartelsielsiiMaxoMaxoMaxomysmysmysMaxoMaxoMaxomysmysmysMaxoMaxo
suriferferMelaMelaMelasmotsmotsmotsmothrixhrixMaxoMaxoMaxomysmysmysMaxoMaxoMaxo surifersuri
nasonasonasoDacnDacnDacnomysomysomysomysomys millardiardiLeopLeopLeopoldaoldaoldamysmysmysDacnDacnDacnomysomysomysomysomysDacnomysomysomys
sabasabasabanusnusnusChirChirChiromysomysomysomyscuscusLeopLeopLeop mysmysmysLeopLeopLeop
chirchirchiropusopusopusNiviNiviNiviventventventerererChirChirChiromysomysomysomyscusChirChirChir
cremcremcremoriventeenteenteentercus chirchirchiropusopusopusopus
NiviNiviNiviventventventererer confconfconfucianusnusnusnusNiviNiviNiviventventventererer culturaturatus
confconfconfucianusconfucia
BeryBeryBerylmyslmyslmys bowersirsiSundSundSundamysamysamysamysBeryBeryBerylmyslmyslmysBeryBerylmys
muelmuelleriBunoBunoBunomysmysmysSundSundSundamysamysamysSund
andrandrewsiewsiamys
ParuParuParuromyromyromyromyssBunoBunoBunomysmysmysBuno
domidomidominatorrrDiplDiplDiplothrothrothrixixixParuParuParuromyromyromyromyssParuParuParuromyromyromy
legalegalegataRattRattRattusDiplDiplDiplothrDipl
exulexulexulexulansothrothrixixix legalega
RattRattRattus leucleucleucleucopusopusRattRattRattRattusus norvnorvnorvnorvnorvnorvegicegicegicegicegicegicegicusus
opusopusopus
ChirChirChirChiropodopodopodopodopodomysomysnorvnorvegicnorv
glirglirglirglirgliroideoideoideoidessegicususegicus
ApomApomApomysysopodopod
datadatadataeopodopodomysomysopodopodomys
ApomApomApomysysApomApomApomysysApom
hylohylohylocoetcoetesesArchArchArchboldboldomysomysomysApomApomApomysysApomApomysys hylohylohylocoethylo
luzoluzoluzonensnensnensisiscoetcoetesescoetcoet
ChroChroChrotomytomytomysArchArchArchboldboldomysomysArchArch
gonzgonzalesalesiomys
RhynRhynRhynchomchomchomysysChroChroChrotomytomytomysChrotomytomy gonz
isarisarogenogensissisgonzgonzalesalesigonz
AnisAnisAnisomysomysRhynRhynRhynchomchomRhynRhyn
imitimitatoratoratorchomysyschomys isarisarogenogenisarisar
LoreLoreLorentzintzimysmysmysomysomysomys
nouhnouhnouhuysiChirChirChiruromuromuromysysLoreLoreLorentzintzimysmysmysLoreLoreLore
vatevatessMacrMacrMacruromuromuromysysChirChirChiruromuromuromysysChirChir
majomajomajorHyomHyomHyomysys goligoligoliath
ysysysys majomajo
PogoPogoPogonomynomynomyssHyomHyomHyomysysHyom goligoligoli
loriloriaeaeaegoliathgoliath
PogoPogoPogonomynomynomyssPogoPogoPogonomynomynomyssPogo
macrmacrmacrouruourusMammMammMammelomelomelomysPogoPogoPogonomynomynomyPogoPogonomy
lanolanolanosusAbeoAbeoAbeomelomelomelomysmysMammMammMammelomelomelomysMammMammelom
seviseviseviaMallMallMallomysomysAbeoAbeoAbeomelomelomysAbeoAbeoAbeo
rothrothschischischildimysmysmys
LeptLeptLeptomysomysMallMallMallomysomysMall
elegelegansansansHydrHydrHydromysomysomysLeptLeptLeptomysomysLeptLeptomys
chrychrysogasogasogasterstersterelegelegansansanseleg
ParaParaParahydrhydrhydromysomysHydrHydrHydromysomysomysHydrHydromysomys chrychry
aspeaspeasperPseuPseuPseudohydohydohydromdromysysParaParaParahydrhydrhydromysomysParahydrhydromys aspeaspe
ellermanrmanrmanrmaniasperasper
XeroXeroXeromysmysPseuPseuPseudohydohyPseuPseu
myoimyoimyoidesdesdesdohydohydromdromysysdromysys
LeggLeggLeggadinadinaaXeroXeroXeromysmysXeromys myoimyoi
forrforrestiestiestiestimyoimyoidesdesmyoi
ZyzoZyzoZyzomysmysLeggLeggLeggadinadinLegg
arguarguargurusrusrusNotoNotoNotomysmysZyzoZyzoZyzomysmysZyzo
fuscfuscfuscusarguarguargurusargu
MastMastMastacomacomacomysysmysmys fuscfuscfusc
fuscfuscususfuscfusc
ConiConiConilurulurusMastMastMastacomacomMastMastMastacom
penipenicillcillcillcillatusacomysys fuscfuscususfuscfuscusus
LepoLepoLeporillrillusus condcondcondconditoritoritorpenipenicillcillcillatuscill
UromUromUromysysLepoLepoLeporillrillusLepo
caudcaudcaudimacimacimacimaculatulatusususus
ParaParaParamelomelomelomysmysUromUromUromysysUrom
levilevilevipesMeloMeloMelomysmysParaParaParamelomeloParaParaPara
ruferufescenscenscensmelomysmysmys levilevilevipes
MeloMeloMelomysmysMeloMeloMelomysmysMeloMeloMelo
cervcervinipinipinipesruferufescenscenscensscenscen
SoloSoloSoloSoloSolomysmysmysmysmysMeloMeloMelomysmysMeloMeloMelo
salesalesalesalebrosbrosbrosbrosususmys cervcervinipinipinipescervcerv
MalaMalaMalacomycomycomycomycomysSoloSoloSolomysmysmysSoloSoloSolo
edvaedvaedvardsirdsirdsiMalaMalaMalacomycomycomycomycomycomyssMalaMalaMalacomycomycomycomycomysMalaMalaMala
longlonglongipesipesipesipesipesipesTokuTokuTokuTokuTokuTokudaiadaiadaiadaiadaiaMalaMalacomyMalaMalacomy
osimosimosimensiensiensiensiensiensiscomys longipeslongipes
ApodApodApodemusemusemusemusemus mystmystacinacinususApodApodApodemusemusemusemusemusApodApodApodemusemusemusemusApodApodemus
agraagrariusriusmystmystacinacinacinacin
ApodApodApodApodApodApodemusemusemusemusemusemusemusApodApodApodemusemusemusemusApodApodemus
semosemosemosemosemosemotustustustusMusApodApod
cookcookcookiiiiApodemusemusemusemusemus
Mus muscmusculusulusMus croccrociduriduroideoidesMus pahapahapahaririMus platplatplatythrythrix
pahapahapahariripahari
Mus haushaussasaplatplatythrythrplat
Mus mattmattheyiheyiMus minuminuminutoidtoides
mattmattheyiheyimattheyi
MusMus muscmuscmuscmusculoiuloiuloiuloidesdesdesPraoPraomysmys deledelectorctorumumHeimHeimyscuyscuss
mysmysfumosussussus
HyloHylomyscmyscmyscususHeimHeimyscuyscussHeim fumo
parvususPraoPraomysmysHylomyscmyscmyscHylo
degrdegraaffaaffimyscususmyscus parvusparvus
PraoPraomysmysmysmys
jackjacksonisonidegrdegraaffaaffidegrdegraaffi
PraoPraomysmysPraomysmysPrao
daltdaltonijackjacksonijacksoni
PraomysmysPraomysmysPrao
misomisonneinneiPraomysmys
mysmystulltullbergbergi
PraoPraomysmysPraomysmysPrao
morimoriotulltullbergberg
PraoPraomysmysPraomysmysPrao
obscobscurusurusPraoPraomysmys
mysmyslukolukolelalelae
MyomMyomyscuyscuyscusPraomysmysPrao
verrauxiauxiauxiiComoComolyslysMyomMyomyscuyscuMyomyscu
goslgoslingiingiyscuyscus
ZeloZelotomytomytomyslyslys gosl
hildegaregaregardeaedeaegoslingiingigoslingi
StenocepocepocephalehalemysZelotomytomytomysZelotomys hildegarhild
grisgriseicaeicaudaegaregardeaedeaedeaedeae
StenocepocepocephalehalemysStenocepocepocephalehalemysStenocephalehalemys
albialbipespesgrisgriseicaeicagriseica
StenStenocepocepocephalehalemysStenocepocepocephalehalemysStenocephalehalemys
alboalboalbocaudataalbialbipespesalbi
MyomMyomyscuyscuyscusStenocepocepocephalehaleSten
brockmankmankmankmanihalemyshalemys
MastMastomysomysMyomMyomyscuyscuMyom
kollmannmannmannsperspergeriyscusyscus
MastMastomysomysMastMastomysomysMast
couchahakollmannmannkollmann
MastMastomysomysMastMastomysomysMast
hubertirtiMastMastomysomys
omysomysnatalenslenslensis
MastMastomysomysMastMastomysomysMast
awashenshenshensisMastMastomysomysomysomysMastMastomysomysMast
eryterythrolhrolhroleucueucusCremCremCremCremnomynomynomynomynomys
omys erytcutccutccutccutccutccutchicuhicuhicuseryteryt
MillMillMillardiardiardiaCremCremCremnomynomynomyCremCremCremnomynomynomy
kathleenleenleenaenomysnomys
MillMillMillMillardiardiardiardiardiaaa meltmeltmeltmeltadaadaadaadaadaOtomOtomOtomys dentdentdentiOtomOtomOtomysOtomOtomOtomysOtomOtom
barbbarbbarbouriouriouriOtomOtomOtomysOtomOtomOtomysOtomOtom
laculaculacustristristrisParoParoParotomytomytomytomyssOtomOtomOtomysOtomOtom
branbrantsiitsiiParoParoParotomytomytomytomyssParoParoParotomytomytomytomyssParoParo
littledaledaledaledaleileiOtomOtomOtomysParoParoParotomyParoParo
irroirroirroraturaturatustomytomytomy
OtomOtomOtomysOtomOtomOtomysOtomOtom
angoangoangoniennienniensissisOtomOtomOtomysOtomOtomOtomysOtomOtom
typutyputypusOtomOtomOtomys
ysoccioccioccidentdentdentalisalistyputyputyputypu
OtomOtomOtomysOtomOtomOtomysOtomOtom
oresoresorestestesOtomOtomOtomOtomOtomysysysOtomOtomOtomysOtomOtom
troptroptroptroptroptroptropicalicalicalicalicalisisOenoOenoOenomysmysmys
ys troptrophypohypoxantxantxantxantxanthushushustroptroptrop
GoluGoluGolundandandaOenoOenoOenomysmysmysOenoOenoOenomys
ellielliotihypoxanthypoxant
MicaMicaMicaelamelamelamelamys namanamanamaquenquenquenquensissisPeloPeloPelomysmysMicaMicaMicaelamelamMicaMicaMica
fallfallaxelamelamyselamelamys nama
RhabRhabRhabdomydomydomydomysPeloPeloPelomysmysPeloPeloPelomys fallfall
dilediledilectusctusfallaxfallax
RhabRhabRhabdomydomydomydomysRhabRhabRhabdomydomydomydomysRhabRhabRhabdomy
pumipumipumilioArviArviArvicantcantcanthishisRhabRhabRhabdomydomydomydomysRhabRhabdomydomys
nairnairnairobaeobaepumipumiliopumipumilio
ArviArviArvicantcantcanthishis rufirufinusnusArviArviArvicantcantcanthishis niloniloticuticus
rufirufirufi
ArviArviArvicantcantcanthishis blicblickikiArviArviArvicantcantcanthishis neumneumneumanniLemnLemnLemniscoiscoiscomys stristristriatusLemnLemnLemnsicosicosicomysLemnLemnLemniscoiscoiscomysLemniscoisco
zebrzebrzebrzebraaLemnLemnLemnsicosicosicomysLemnLemnLemnsicosicosicomysLemnsicosico
rosarosarosaliaLemnLemnLemnsicosicosicomysLemnLemnLemnsicosicosicomysLemnsicosico
bellbellbellbellieriLemnLemnLemniscoiscoiscomysLemnLemnLemnsicosicosicomysLemnsico
maccmaccmacculusulusulusHyboHyboHybomysmysmysLemnLemnLemniscoiscoiscoLemnLemnLemn
univittaittaittatusmysmys
StocStocStochomyhomyhomyhomysHyboHyboHybomysmysmysHyboHybomys
longlongicauicaudatudatudatudatusAethAethAethomysomysomysStocStocStochomyhomyhomysStocStoc
hindeieieis longlongicaulongicau
AethAethAethomysomysomysomysomysomys
chrysophsophsophilusilusilusAethAethAethomysomysomysAethAethAethomysomysomysAethAeth
ineptustustuschrysophsophchry
AethAethAethomysomysomysAethAethAethomysomysomysAethAeth
silindenndenndensissisineptustustusineptustus
AethAethAethomysomysomysomysomysomys
kaiserierieriAethAethAethomysomysomysAethAethAethomysomysomysAethAeth
nyikaeaeDasyDasyDasymysmysmysAethAethAethomysomysomysAeth
incomtusmtusmtusnyik
ThalThalThallomylomylomyssDasyDasyDasymysmysmysDasyDasyDasymys
loringingingiThalThalThallomylomylomyssThalThalThallomylomylomyssThalThalThallomy
nigricauicauicaudaloringingingiloringi
ThalThalThallomylomylomyssThalThalThallomylomylomyssThalThalThallomy
paedpaedpaedulcuulcusnigricauicauicaudanigricauicau
GramGramGrammomymomymomymomysThalThalThallomylomylomyssThalThal paed
dolidolichurchurusususpaedpaedpaedulcuulcuspaedpaedulcuulcus
GramGramGrammomymomymomymomysGramGramGrammomymomymomymomysGramGram
comecomecometestesGramGramGrammomymomymomymomys
momymomymomymomymacmmacmmacmillaillaillanini
GramGramGrammomymomymomymomysGramGramGrammomymomymomymomysGramGram
surdsurdsurdsurdasteasterrr
CaloOchrMesoOchrOchr
OndaOtotTyloTyloOtotOtot
LophLophTyloTylo
DesmDesmLophLoph
GerbGerbGerbGerbGerbGerbGerbGerbGerbGerbGerbUranUranLophUranUran
LophLophLophLoph
DeomDeomLophLoph
AcomAcomDeom
AcomAcomAcom
AcomAcomAcomAcomAcom
AcomAcomAcom
AcomAcomAcomAcomAcomAcom
BatoPhloBatoBato
PhloPhloPhloPhlo
MicrMicrMaxoMaxoMicrMicr
MaxoMaxoMaxoMaxo
MelaMelaMaxoMaxo
DacnDacnLeopLeopDacnDacn
ChirChirLeop
NiviNiviChirChir
NiviNiviNiviNiviBeryBerySundSundBeryBery
BunoBunoSundSund
ParuParuBunoBuno
DiplDiplParuParu
RattRattDiplDipl
RattRattRattRattChirChirApomApomApom
ArchApom
ChroArch
RhynChroChro
AnisRhyn
LoreChirLore
MacrChirChir
HyomPogoHyomHyom
PogoPogoPogo
MammPogoPogo
AbeoMamm
MallAbeoAbeo
LeptMallMall
HydrLeptLept
ParaHydrHydr
PseuParaPara
XeroPseuPseu
LeggXeroXero
ZyzoLeggLegg
NotoZyzoZyzo
MastConiMast
LepoUromLepoLepo
ParaUromUrom
MeloParaPara
MeloMeloMelo
SoloSoloMeloMelo
MalaSoloSolo
MalaMalaMala
TokuTokuMalaMala
ApodApodApod
ApodApodApodApod
MusApodApod
MusMusMusMusMusMusMusMusMusPraoHeimHyloHeimHeim
PraoHyloHylo
PraoPraoPraoPrao
PraoPraoPrao
PraoPraoPraoPrao
PraoPraoPrao
PraoMyomPraoPrao
ComoMyom
ZeloStenZeloZelo
StenStenSten
StenStenSten
MyomStenSten
MastMyomMyom
MastMastMast
MastMastMast
MastMastMastMast
MastMastMast
CremCremMillCremCrem
MillMillOtomOtomOtom
OtomOtom
ParoOtomOtom
ParoParoParo
OtomParo
OtomOtom
OtomOtom
OtomOtomOtom
OtomOtomOtom
OenoGoluOeno
MicaPeloMicaMica
RhabPeloPelo
RhabRhabRhab
ArviRhab
ArviArviArviArviLemnLemnLemnLemn
LemnLemnLemn
LemnLemnLemn
LemnLemnLemn
HyboLemnLemn
StocHyboHybo
AethStoc
AethAethAeth
AethAeth
AethAethAeth
DasyAethAeth
ThalDasyDasy
ThalThalThal
ThalThalThal
GramThal
GramGram
GramGramGram
rmani
!"#$%!&
' †Antemus chinjiensis
( †cf. cfcf Karnimata sp.
†Parapodemus lugdunensis
†Mus sp.
†Abudhabia pakistanensis
†Gerbilliscus sp.
†Aethomys sp.
†Arvicanthis sp.
)
*
+
,
-
†Karnimata darwini.
'
(
)
.
*
+
,
-
/
/
!" "!# #!
Fig. 2

175
Tatiana Aghová / Ph.D. dissertation (2018)
Lophiomys_imhausiDesmodillus_auricularisGerbilliscus_robustusGerbillurus_paebaGerbilliscus_gambianusGerbilliscus_giffardiGerbillus_nanusGerbillus_nancillusGerbillus_gerbillusGerbillus_nigeriaeGerbillus_tarabuliUranomys_ruddiLophuromys_flavopunctatusLophuromys_sikapusiDeomys_ferrugineusAcomys_subspinosusAcomys_spinosissimusAcomys_russatusAcomys_wilsoniAcomys_ignitusAcomys_cf.cineraceusAcomys_chudeauiBatomys_grantiPhloeomys_cumingiPhloeomys_sp.Micromys_minutusMaxomys_bartelsiiMaxomys_suriferMelasmothrix_nasoDacnomys_millardiLeopoldamys_sabanusChiromyscus_chiropusNiviventer_cremoriventerNiviventer_confucianusNiviventer_culturatusBerylmys_bowersiSundamys_muelleriBunomys_andrewsiParuromys_dominatorDiplothrix_legataRattus_exulansRattus_leucopusRattus_norvegicusChiropodomys_gliroidesApomys_dataeApomys_hylocoetesArchboldomys_luzonensisChrotomys_gonzalesiRhynchomys_isarogensisAnisomys_imitatorLorentzimys_nouhuysiChiruromys_vatesMacruromys_majorHyomys_goliathPogonomys_loriaePogonomys_macrourusMammelomys_lanosusAbeomelomys_seviaMallomys_rothschildiLeptomys_elegansHydromys_chrysogasterParahydromys_asperPseudohydromys_ellermaniXeromys_myoidesLeggadina_forrestiZyzomys_argurusMastacomys_fuscusNotomys_fuscusConilurus_penicillatusLeporillus_conditorUromys_caudimaculatusParamelomys_levipesMelomys_rufescensMelomys_cervinipesSolomys_salebrosusMalacomys_edwardsiMalacomys_longipesTokudaia_osimensisApodemus_mystacinusApodemus_agrariusApodemus_semotusMus_cookiiMus_musculusMus_crociduroidesMus_pahariMus_platythrixMus_haussaMus_mattheyiMus_minutoidesMus_musculoidesPraomys_delectorumHeimyscus_fumosusHylomyscus_parvusPraomys_degraaffiPraomys_jacksoniPraomys_daltoniPraomys_misonneiPraomys_tullbergiPraomys_morioPraomys_obscurusPraomys_lukolelaeMyomyscus_verreauxiiColomys_goslingiZelotomys_hildegardeaeStenocephalemys_griseicaudaStenocephalemys_albipesStenocephalemys_albocaudataMyomyscus_brockmaniMastomys_kollmanspergeriMastomys_couchaMastomys_hubertiMastomys_natalensisMastomys_awashensisMastomys_erythroleucusCremnomys_cutchicusMillardia_kathleenaeMillardia_meltadaOtomys_dentiOtomys_barbouriOtomys_lacustrisParotomys_brantsiiParotomys_littledaleiOtomys_irroratusOtomys_angoniensisOtomys_typusOtomys_occidentalisOtomys_orestesOtomys_tropicalisOenomys_hypoxanthusGolunda_elliotiMicaelamys_namaquensisPelomys_fallaxRhabdomys_dilectusRhabdomys_pumilioArvicanthis_nairobaeArvicanthis_rufinusArvicanthis_niloticusArvicanthis_blickiArvicanthis_somalicusLemniscomys_striatusLemniscomys_zebraLemniscomys_rosaliaLemniscomys_bellieriLemniscomys_macculusHybomys_univittatusStochomys_longicaudatusAethomys_hindeiAethomys_chrysophilusAethomys_ineptusAethomys_silindensisAethomys_kaiseriAethomys_nyikaeDasymys_incomtusThallomys_loringiThallomys_nigricaudaThallomys_paedulcusGrammomys_dolichurusGrammomys_cometesGrammomys_macmillaniGrammomys_surdaster
20 15 10 5 0
Millions of years ago
EEEEEE
ABEEAEAEEEEEEEEEEECCC
ABCCCDCCCC
BCCCCDDBCD
ABCCDCCCCCDDDDDDDDDDDDDDDDDDDDDDDDDDEEBA
ABCC
ABCCCCEEEEEEEEEEEEEEEEEEEEEEEEEEEECCCEEEEEEEEEEEECEEEEEEEEEEEEEEEEEEEEEEEEEEEEEE !"##$#%& &'!("&)*!
!"##$#%& #"+#,--".,
!"##$#%& +$#*)*&
!"##$#%& ($-,+/'!'&
0/"--$#%& 1"*('-+'&
0/"--$#%& .,2!,+"'("
0/"--$#%& -$!,.2,
3"&%#%& ,.+$#)'&
4*)/$#%& .%,5"*
4*)/$#%& 5",&*!,
4*)/$#%& &,-,.(*.&,&
4*)/$#%& ,.*1)'&
4*)/$#%& +/!%&$1/,-'&
4*)/$#%& /,.(*,
6&)$+/$#%& -$.2,+"'('&
7%8$#%& '.9,))")'&
:*#.,&+$#%& #"++'-'&
:*#.,&+$#%& 8*--,*!,
:*#.,&+$#%& !$&"-,"
:*#.,&+$#%& ;*8!"
:*#.,&+$#%& &)!,")'&
4!9,+".)/,& .*'#"..,
4!9,+".)/,& 8-,+5,
4!9,+".)/,& .,-$),+'&
4!9,+".)/,& !'<,.'&
4!9,+".)/,& .",!$8"*
=/"8($#%& 1'#,-,$
=/"8($#%& (,-*+)'&
>*-$#%& <"--"?
@,+"*-"#%& ."#"A'*.&,&
$-'.(" *--,$),
B*.$#%& /%1$?".)/'&
B)$#%& )!$1,+"-,&
B)$#%& $!*&)*&
B)$#%& $++,(*.)"-,&
B)$#%& )%1'&
B)$#%& ".2$.,*.&,&
B)$#%& ,!!$!")'&
>"!$)$#%& -,))-*("-*,
>"!$)$#%& 8!".)&,,
B)$#%& -"+'&)!,&
B)$#%& 8"!8$'!,
B)$#%& (*.),
@,--"!(," #*)-"("
@,--"!(," 5")/-**."*
C!*#.$#%& +')+/,+'&
@"&)$#%& *!%)/!$-*'+'&
@"&)$#%& "D"&/*.&,&
@"&)$#%& .")"-*.&,&
@"&)$#%& /'8*!),
@"&)$#%& +$'+/"
@"&)$#%& 5$--#".&1*!2*!,
@%$#%&+'& 8!$+5#".,
6)*.$+*1/"-*#%& "-8$+"'(")"
6)*.$+*1/"-*#%& "-8,1*&
6)*.$+*1/"-*#%& 2!,&*,+"'("
E*-$)$#%& /,-(*2"!(*"*
C$-$#%& 2$&-,.2,
@%$#%&+'& 9*!!*"'?,,
>!"$#%& -'5$-*-"*
>!"$#%& $8&+'!'&
>!"$#%& #$!,$
>!"$#%& )'--8*!2,
>!"$#%& #,&$..*,
>!"$#%& ("-)$.,
>!"$#%& F"+5&$.,
>!"$#%& (*2!""<<,
7%-$#%&+'& 1"!9'&
7*,#%&+'& <'#$&'&
>!"$#%& (*-*+)$!'#
@'&G#'&+'-$,(*&
@'&G#,.')$,(*&
@'&G#"))/*%,
@'&G/"'&&"
@'&G1-")%)/!,?
@'&G1"/"!,
@'&G+!$+,('!$,(*&
@'&G#'&+'-'&
@'&G+$$5,,
41$(*#'& &*#$)'&
41$(*#'& "2!"!,'&
41$(*#'& #%&)"+,.'&
0$5'("," $&,#*.&,&
@"-"+$#%& -$.2,1*&
@"-"+$#%& *(D"!(&,
6$-$#%& &"-*8!$&'&
@*-$#%& +*!9,.,1*&
@*-$#%& !'<*&+*.&
>"!"#*-$#%& -*9,1*&
H!$#%& +"'(,#"+'-")'&
:*1$!,--'& +$.(,)$!
C$.,-'!'& 1*.,+,--")'&
I$)$#%& <'&+'&
@"&)"+$#%& <'&+'&
E%;$#%& "!2'!'&
:*22"(,." <$!!*&),
J*!$#%& #%$,(*&
>&*'($/%(!$#%& *--*!#".,
>"!"/%(!$#%& "&1*!
7%(!$#%& +/!%&$2"&)*!
:*1)$#%& *-*2".&
@"--$#%& !$)/&+/,-(,
48*$#*-$#%& &*9,"
@"##*-$#%& -".$&'&
>$2$.$#%& #"+!$'!'&
>$2$.$#%& -$!,"*
7%$#%& 2$-,")/
@"+!'!$#%& #"F$!
C/,!'!$#%& 9")*&
:$!*.);,#%& .$'/'%&,
4.,&$#%& ,#,)")$!
=/%.+/$#%& ,&"!$2*.&,&
C/!$)$#%& 2$.;"-*&,
4!+/8$-($#%& -';$.*.&,&
41$#%& /%-$+$*)*&
41$#%& (")"*
C/,!$1$($#%& 2-,!$,(*&
="))'& .$!9*2,+'&
="))'& -*'+$1'&
="))'& *?'-".&
3,1-$)/!,? -*2")"
>"!'!$#%& ($#,.")$!
K'.$#%& ".(!*D&,
6'.("#%& #'*--*!,
K*!%-#%& 8$D*!&,
I,9,9*.)*! +'-)'!")'&
I,9,9*.)*! +$.<'+,".'&
I,9,9*.)*! +!*#$!,9*.)*!
C/,!$#%&+'& +/,!$1'&
:*$1$-("#%& &"8".'&
3"+.$#%& #,--"!(,
@*-"&#$)/!,? ."&$
@"?$#%& &'!,<*!
@"?$#%& 8"!)*-&,,
@,+!$#%& #,.')'&
>/-$*$#%& &1L
>/-$*$#%& +'#,.2,
K")$#%& 2!".),
4+$#%& +/'(*"',
4+$#%& +<LG+,.*!"+*'&
4+$#%& ,2.,)'&
4+$#%& D,-&$.,
4+$#%& !'&&")'&
4+$#%& &1,.$&,&&,#'&
4+$#%& &'8&1,.$&'&
3*$#%& <*!!'2,.*'&
:$1/'!$#%& &,5"1'&,
:$1/'!$#%& <-"9$1'.+)")'&
H!".$#%& !'((,
*!8,--'& )"!"8'-,
*!8,--'& .,2*!,"*
*!8,--'& 2*!8,--'&
*!8,--'& .".+,--'&
*!8,--'& .".'&
*!8,--,&+'& 2,<"!(,
*!8,--,&+'& 2"#8,".'&
*!8,--'!'& 1"*8"
*!8,--,&+'& !$8'&)'&
3*&#$(,--'& "'!,+'-"!,&
:$1/,$#%& ,#/"'&,
Fig. 3
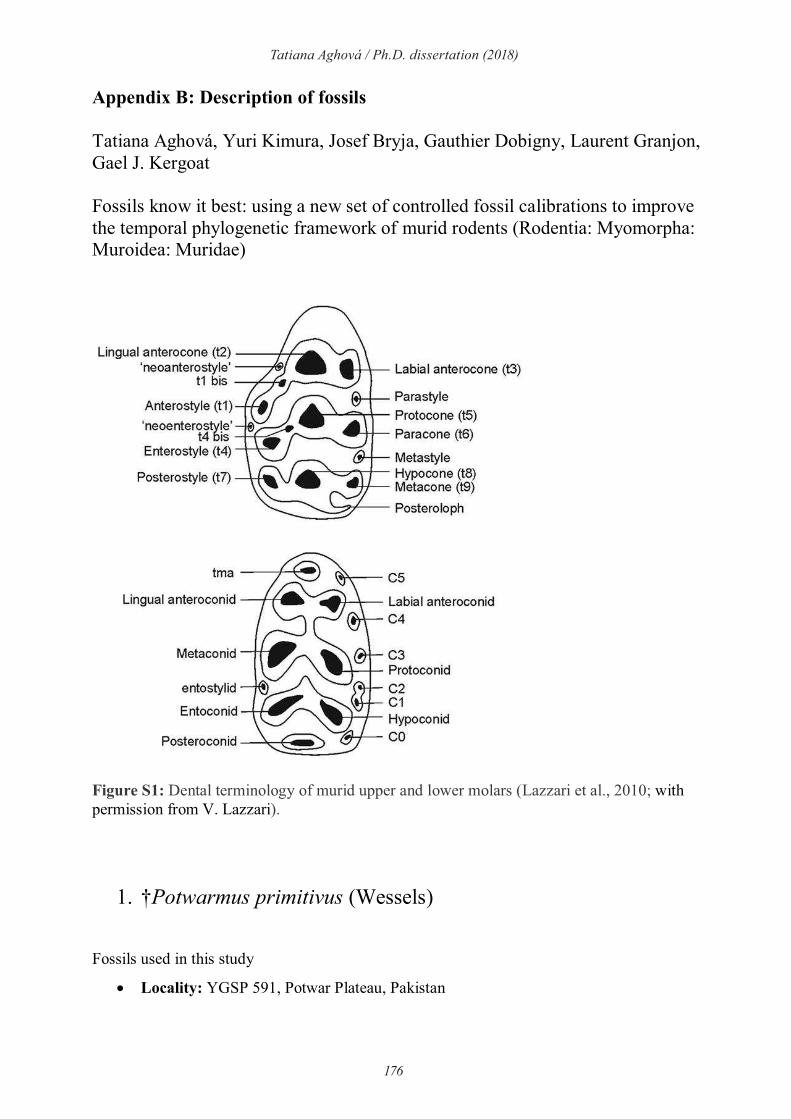
176
Tatiana Aghová / Ph.D. dissertation (2018)
Appendix B: Description of fossils
Tatiana Aghová, Yuri Kimura, Josef Bryja, Gauthier Dobigny, Laurent Granjon, Gael J. Kergoat Fossils know it best: using a new set of controlled fossil calibrations to improve the temporal phylogenetic framework of murid rodents (Rodentia: Myomorpha: Muroidea: Muridae)
Figure S1: Dental terminology of murid upper and lower molars (Lazzari et al., 2010; with permission from V. Lazzari).
1. †Potwarmus primitivus (Wessels)
Fossils used in this study
Locality: YGSP 591, Potwar Plateau, Pakistan

177
Tatiana Aghová / Ph.D. dissertation (2018)
Age: 16.0 Ma (median age), determined based on magnetostratigraphy, correlated to
the Geomagnetic Polarity Time Scale of Ogg and Smith (2004).
References of the fossils: Lindsay (1988)
Paleontological event: The earliest stratigraphic occurrence of the species, interpreted
to as transition between cricetine and murine dental plan.
Proposed for the fossil calibration point by: Not used.
Taxonomic Information: The genus †Potwarmus is considered to be a primitive
dendromurine (Lindsay, 1988) or more recently to be a stem murine (Wessels, 2009; Lopez-
Antonanzas, 2009). This genus represents four valid species: †Potwarmus primitivus
(Wessels) (Figure S2), originaly described as Antemus primitivus from Chinji Formation,
Pakistan; †Potwarmus thailandicus (Jaeger et al.) originaly described as Antemus thailandicus
from Li Basin, Thailand †Potwarmus flynni Lopéz Antonanzas form Al Jadidah, Saudi Arabia
and †Potwarmus minimus Lindsay. The absence of the anterostyle (t1) in the upper molar in
†Potwarmus, which is otherwise very similar to †Antemus, has been reasoned for exclusion of
the genus from the Murinae. By combining molecular data and the molar structure regarding
two or three longitudinal rows with cusps, Jansa and Weksler (2004) showed that three
longitudinal rows occur in Murinae, Acomyinae, Dendromurinae and the Cricetomyinae. This
suggests that a murine plan evolved at least four times from the cricetine plan. †Potwarmus
could be interpreted in all of these subfamilies as a stem representative although recently
Wessels (2009) and Lazzari et al., (2011) consider †Potwarmus as a stem Murinae.
Reasons to be chosen in the analysis: Because of indefinitive taxonomic assignment, we
excluded this fossil from analysis.
Figure S2: Upper and lower molar of †Potwarmus primitivus without scale (from Patnaik,
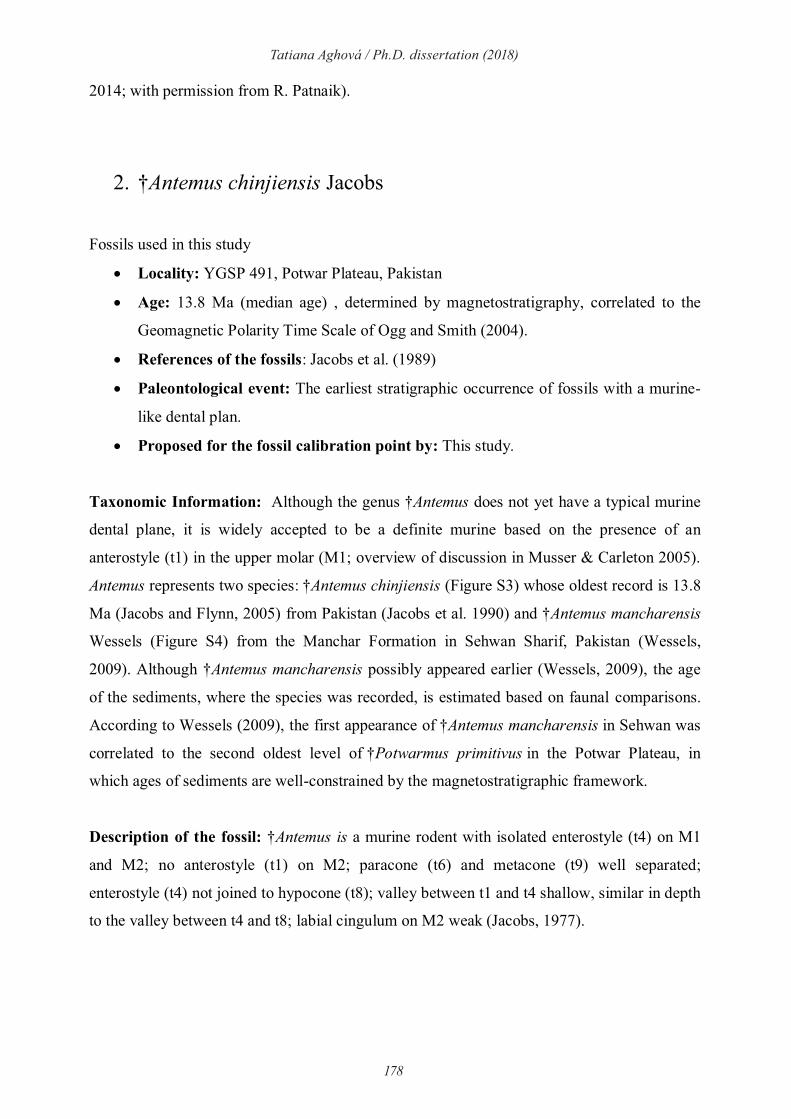
178
Tatiana Aghová / Ph.D. dissertation (2018)
2014; with permission from R. Patnaik).
2. †Antemus chinjiensis Jacobs
Fossils used in this study
Locality: YGSP 491, Potwar Plateau, Pakistan
Age: 13.8 Ma (median age) , determined by magnetostratigraphy, correlated to the
Geomagnetic Polarity Time Scale of Ogg and Smith (2004).
References of the fossils: Jacobs et al. (1989)
Paleontological event: The earliest stratigraphic occurrence of fossils with a murine-
like dental plan.
Proposed for the fossil calibration point by: This study.
Taxonomic Information: Although the genus †Antemus does not yet have a typical murine
dental plane, it is widely accepted to be a definite murine based on the presence of an
anterostyle (t1) in the upper molar (M1; overview of discussion in Musser & Carleton 2005).
Antemus represents two species: †Antemus chinjiensis (Figure S3) whose oldest record is 13.8
Ma (Jacobs and Flynn, 2005) from Pakistan (Jacobs et al. 1990) and †Antemus mancharensis
Wessels (Figure S4) from the Manchar Formation in Sehwan Sharif, Pakistan (Wessels,
2009). Although †Antemus mancharensis possibly appeared earlier (Wessels, 2009), the age
of the sediments, where the species was recorded, is estimated based on faunal comparisons.
According to Wessels (2009), the first appearance of †Antemus mancharensis in Sehwan was
correlated to the second oldest level of †Potwarmus primitivus in the Potwar Plateau, in
which ages of sediments are well-constrained by the magnetostratigraphic framework.
Description of the fossil: †Antemus is a murine rodent with isolated enterostyle (t4) on M1
and M2; no anterostyle (t1) on M2; paracone (t6) and metacone (t9) well separated;
enterostyle (t4) not joined to hypocone (t8); valley between t1 and t4 shallow, similar in depth
to the valley between t4 and t8; labial cingulum on M2 weak (Jacobs, 1977).
179
Tatiana Aghová / Ph.D. dissertation (2018)
How was used for analysis: †Antemus chinjiensis is the oldest rodent classified as a murine,
therefore we assign this fossil as Murinae crown with lognormal prior distribution (offset
13.24, log 1.0, mean 3.2).
Figure S3: Upper and lower molar of †Antemus chinjiensis without scale (from Patnaik,
2014; with permission from R. Patnaik).
3. †cf. Progonomys sp. Schaub
Fossils used in this study
Locality: Pakistan, YGSP 83, 504, Potwar Plateau
Age: 11.6 Ma, determined based on magnetostratigraphy correlated to the
Geomagnetic Polarity Time Scale of Ogg (2012).
References of the fossils: Kimura et al. (2017)
Paleontological event: The earliest stratigraphic occurrence of the genus, which has a
typical murine dental plan.
Proposed for the fossil calibration point by: This study.
Note: The fossils from YGSP 83, YGSP 504 used to be assigned to †Progonomys
hussaini (Jacobs and Flynn, 2005). Kimura et al. (2017) examined murine materials
from the same region but younger ages (10-11 Ma) and concluded that †Progonomys
fossils from the younger age are †Progonomys hussaini but that those from YGSP 83,
YGSP 504 represent species that are not yet known. They tentatively named these
fossils †cf. Progonomys sp.
Description of the genus: †Progonomys is originally named based on fossils from Europe

180
Tatiana Aghová / Ph.D. dissertation (2018)
but is later recognized in southern Asia, and thereby this genus (or its hypothetical precursor)
is considered to be an important biogeographic and biochronologic role as the earliest
dispersals of murines (Jacobs and Flynn, 2005). †Progonomys includes six described species:
†Progonomys cathalai Shaub, †Progonomys debruiji, †Progonomys woelferi Bachmayer &
Wilson, †Progonomys hussaini Cheema et al., 2000 ; †Progonomys sinensis Qiu et al., 2004;
†Progonomys morganae Kimura et al. (2017).
Description of the fossil: †Progonomys differs from †Antemus in having connections of
enterostyle (t4) to protocone (t5). The M2 has and in having the anterostyle (t1) on M2.
How was used for analysis: Because of indefinitive taxonomic assignment, we excluded this
fossil from analysis.
Figure S4: Upper molar of †Progonomys cathalai without scale (from Sen, 2003; with
permission from S. Sen).
4. †cf. Karnimata Jacobs
Fossils used in this study
Locality: Pakistan, YGSP 791, YGSP 797, Nagri Formation, Siwalik Group
Age: 11.2 Ma (median age), determined based on magnetostratigraphy correlated to
the Geomagnetic Polarity Time Scale of Ogg (2012).
References of the fossils: Jacobs and Flynn, 2005; Kimura et al., 2015, 2013a
181
Tatiana Aghová / Ph.D. dissertation (2018)
Paleontological event: The earliest occurrence of the informal group, interpreted to
be close to the initial split between Arvicanthis and Mus.
Proposed for the fossil calibration point by: Kimura et al. (2015)
Note: The systematic assignment of †cf. Karnimata is yet informal due to the
difficulty of assessing its dental morphology based on limited isolated teeth.
Description of the genus: Stratigraphically first record of association of two morphotypes
†Karnimata and †Progonomys is found in Siwalik Group (11.1 Ma; Kimura et al., 2015). At
the appearance of the two morphotypes, they share 49% overlap area (Kimura et al., 2013b) .
This two fossils candidate for evidence of the Mus/Rattus split (Jacobs and Flynn, 2005) until
recently. Kimura et al. (2015) corrected placement of this fossils and show, that the dental
pattern and root structure of molar teeth in †Karnimata indicate a relationship closer to
Arvicanthis and †Progonomys is close related to Mus.
Description of the fossil: The first appearance of †?Karnimata, interpreted to be close to the
initiation of lineage separation between the †Progonomys and †Karnimata clades (Kimura et
al., 2015).
How was used for analysis: As suggested in Kimura et al., (2015) we placed this fossil as a
crown for Mus/Arvicanthis split with lognormal prior distribution (offset 10.47, log 1.0, mean
4.0).
5. †Parapodemus lugdunensis Schaub
Fossils used in this study
Locality: France, Dionay
Age: 9.6 Ma, Chron C4Ar.2n (Aguilar et al., 2004), determined by
magnetostratigraphy
References of the fossils: Lungu (1981); Mein et al (1993); Renaud et al. (1999)
Paleontological event: The oldest reliable age of well represented Parapodemus
lugdunensis
182
Tatiana Aghová / Ph.D. dissertation (2018)
Proposed for the fossil calibration point by: Rowe et al. 2011, Fabre et al. 2013,
Missoup et al. 2016, this study.
Description of the genus: Martín-Suáres and Mein (1998) proposed transfer all
†Parapodemus species (except †Parapodemus gaudryi (Dames) to Apodemus, based on
morphological continuity in development of diagnostic molars. In contrast, de Bruijn et al.
(1999) and Sen (2003) agreed, that genus †Parapodemus is valid with four species:
†Parapodemus gaudryi (Dames); †Parapodemus lugdunensis Schaub; †Parapodemus
barbarae Van de Weerd; and †Parapodemus meini Martin Suarez and Freudenthal.
Description of the fossil: The first representative of †Parapodemus is found from Buzhor 1
in Moldavia (Lungu, 1981). This specimen was originally identified as genus †Progonomys
cathalai, but later Mein et al. (1993) noticed that the specimen closely follows the taxonomic
definition of †Parapodemus (also see Martín-Suárez and Mein, 1998). The single specimen
possesses a complete stephanodonty (the cusps enterostyle (t4), protocone (t5), paracone (t6),
metacone (t9) and hypocone (t8) united in a continuous loop) and lacks posterostyle (t7)
although there is a continuous high crest between enterostyle and hypocone (Mein et al.,
1993; Figure S5).
How was used for analysis: The single specimen from Buzhor1 has been applied to the split
between the Apodemurini-Malacomyini clade and the Praomyini-Murini clade (e.g., Rowe et
al. 2011, Fabre et al. 2013, Missoup et al. 2016). However, as summarized in Sinitsa and
Delinschi (2016), the locality Buzhor1, which used to be considered in the early Vallesian age
(~11-10 Ma), is now interpreted to lie in the late Vallesian age (~10-9 Ma). The largest
diversity of Muridae recorded in the Late Vallesian is found in the locality Dionay (Mein,
1984). The material of †Parapodemus lugdunensis were studied by Renaud et al. (1999) and
the age of this locality was interpolated as 9.6 Ma (Aguilar et al., 2004; Renaud et al., 2005).
Thus, we decided to use these fossils for our analysis. We assigned this fossil as a stem
calibration of tribe Apodemini (Apodemus/Tokudaia split) with lognormal prior distribution
(offset 8.93, log 1.0, mean 4.5).

183
Tatiana Aghová / Ph.D. dissertation (2018)
Figure S5: Upper molar of †Parapodemus from locality Buzhor without scale (Mein et al.,
1993; with permission from P. Mein).
6. †Karnimata darwini Jacobs
Fossils used in this study
Locality: Pakistan, YGSP 182, Dhok Pathan Formation, Siwalik Group
Age: 9.2 Ma (median age), determined based on magnetostratigraphy correlated to the
Geomagnetic Polarity Time Scale of Ogg (2012).
References of the fossils: Jacobs (1978)
Paleontological event: The first occurrence of the derived condition (small, vertical)
of the metacone in a chronoclinal assemblage of the Karnimata clade, interpreted to be
a most common recent ancestor of Millardini/Otomyini/Arvicanthini clade
Proposed for the fossil calibration point by: Kimura et al. (2015).
Taxonomic Information: The descendant of †cf. Karnimata is considered †Karnimata
darwini (Figure S6) from Siwalik Group, Pakistan (Jacobs, 1978; Kimura et al., 2015). Mein
et al. (1993) and Wöger (2011) synonymized †Karnimata darwini from Siwalik to be
†Progonomys woelferi Bachmayer and Wilson, which is otherwise distributed only in Europe.
Storch and Ni (2002) pointed out that †Karnimata darwini differs from †Progonomys
woelferi in having enterostyle (t4) on M1 in a more anterior, symmetrical position relative to
paracone (t6), and anterostyle (t1) more closely approaching lingual antercone (t2). They
suggest that these different morphologies reflect an early divergence of two separate clades.
This view is followed by Kimura et al. (2017).
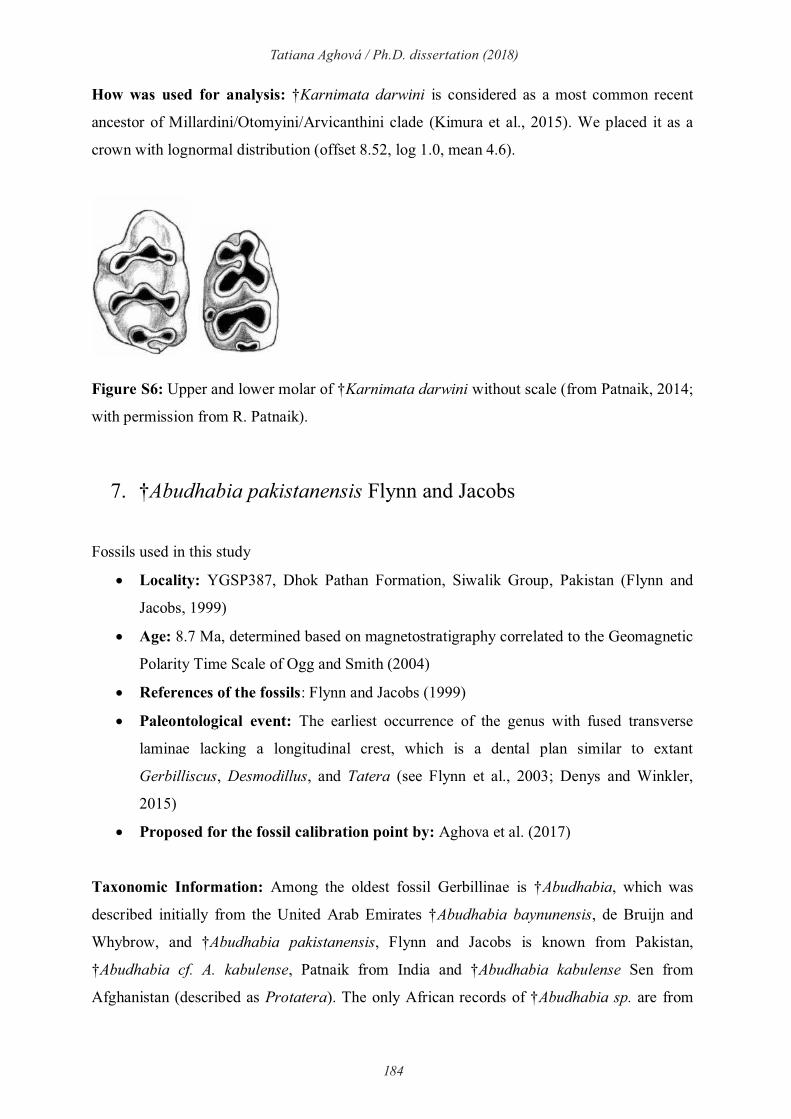
184
Tatiana Aghová / Ph.D. dissertation (2018)
How was used for analysis: †Karnimata darwini is considered as a most common recent
ancestor of Millardini/Otomyini/Arvicanthini clade (Kimura et al., 2015). We placed it as a
crown with lognormal distribution (offset 8.52, log 1.0, mean 4.6).
Figure S6: Upper and lower molar of †Karnimata darwini without scale (from Patnaik, 2014;
with permission from R. Patnaik).
7. †Abudhabia pakistanensis Flynn and Jacobs
Fossils used in this study
Locality: YGSP387, Dhok Pathan Formation, Siwalik Group, Pakistan (Flynn and
Jacobs, 1999)
Age: 8.7 Ma, determined based on magnetostratigraphy correlated to the Geomagnetic
Polarity Time Scale of Ogg and Smith (2004)
References of the fossils: Flynn and Jacobs (1999)
Paleontological event: The earliest occurrence of the genus with fused transverse
laminae lacking a longitudinal crest, which is a dental plan similar to extant
Gerbilliscus, Desmodillus, and Tatera (see Flynn et al., 2003; Denys and Winkler,
2015)
Proposed for the fossil calibration point by: Aghova et al. (2017)
Taxonomic Information: Among the oldest fossil Gerbillinae is †Abudhabia, which was
described initially from the United Arab Emirates †Abudhabia baynunensis, de Bruijn and
Whybrow, and †Abudhabia pakistanensis, Flynn and Jacobs is known from Pakistan,
†Abudhabia cf. A. kabulense, Patnaik from India and †Abudhabia kabulense Sen from
Afghanistan (described as Protatera). The only African records of †Abudhabia sp. are from
185
Tatiana Aghová / Ph.D. dissertation (2018)
the late Miocene of Kenya (Lothagam: Winkler, 2003; Lukeino Fm.: Mein and Pickford,
2006).
How was used for analysis: We select †Abudhabia pakistanensis as a most common recent
ancestor for Gerbillinae. We used lognormal prior distribution (offset 8.01, log 1.0, mean 4.7)
and we set this calibration point as crown for Gerbilliscus/Desmodillus split.
8. †Aff. Stenocephalomys Frick
Fossils used in this study
Locality: Chorora, Ethiopia
Age: 8.5 Ma, 40K/40Ar (Geraads, 2002; Suwa et al., 2015)
References of the fossils: Geraads (2001)
Paleontological event: The first occurrence of dental plan similar to extant genus
Stenocephalemys.
Proposed for the fossil calibration by: Not used.
How was used for analysis: †Aff. Stenocephalomys was not included in the final analysis,
because it was not clear assignment to the phylogeny.
9. †cf. Parapelomys Jacobs
Fossils used in this study
Locality: Ethiopia, Chorora
Age: 8.5 Ma, determined by 40K/40Ar dating (Geraads, 2002; Suwa et al., 2015)
References of the fossils: Geraads (2001)
Paleontological event: The first occurrence of fossils comparable to †Parapelomys
Proposed for the fossil calibration point by: Not used.
Taxonomic Information: Among the earliest fossil of †Parapelomys is from Ethiopia as
identified to be cf. Parapelomys (Geraads, 2001). First occurrence of true †Parapelomys is

186
Tatiana Aghová / Ph.D. dissertation (2018)
represented by Siwalik fossils older than 8 Ma, co-occurring with †Progonomys and
†Karnimata (Jacobs and Flynn, 2005). Till now we recognize three species: †Parapelomys
robertsi Jacobs (Figure S8), †Parapelomys orientalis Sen and †Parapelomys charkhensis
Patnaik. †Parapelomys, which is considered to be derived from a species of †Karnimata
(Jacobs and Downs, 1994) † Parapelomys displays the arvicanthine characters of well-aligned
cusps of the upper M1 prelobe, bunodont cusps and large molars (Sen, 1983; Jacobs, 1978).
There is a anterostyle (t1) and labial anterocone (t3) on the upper M2 and the upper M3 is
long (Denys and Winkler, 2015).
How was used for analysis: This fossil was not used in our analysis, because it was difficult
to assigned it to a specific node in the current topology although there is a consistent
agreement that †Parapelomys is an arvicanthine rodent (e.g., Sen, 1983; Jacobs, 1978;
Musser, 1987; Patnaik, 1997).
10. †Preacomys kikiae Geraads
Fossils used in this study
Locality: Chorora, Ethiopia
Age: 8.5 Ma, 40K/40Ar (Geraads, 2002; Suwa et al., 2015)
References of the fossils: Geraads (2001)
Paleontological event: The first occurrence of dental plan similar to extant genus
Acomys.
Proposed for the fossil calibration point by: Not used.
Taxonomic Information: The earliest deomyine rodent occurred in Africa in the Late
Miocene, represented by one extinct genus †Preacomys (Geraads, 2001; Mein et al., 2004).
Three species of †Preacomys have been described: †Preacomys kikiae Geraads (Figure S9),
†Preacomys karsticus Mein and †Preacomys griffini Mein. The latter two were reported from
Namibia (Mein et al., 2004). †Preacomys kikiae, was found at Chorora (8.5 Ma; Suwa et al.,
2015), Lukeino (as †Preacomys cf. kikiae; Mein and Pickford, 2006) and Harasib 3a (Mein et
al., 2004). Based on morphological evaluation, it seems that †Preacomys karsticus is possibly
ancestral to Acomys spinosissimus, †Preacomys griffini is a possible ancestor of Acomys
subspinosus (Denys and Winkler, 2015).
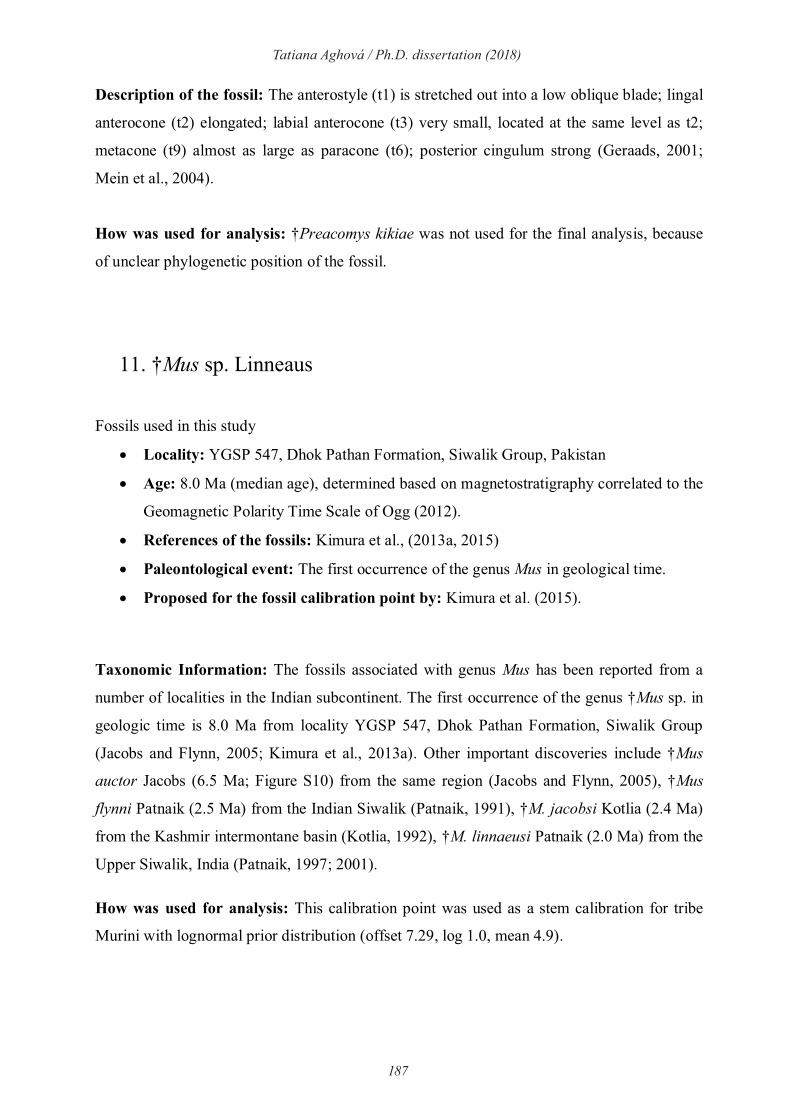
187
Tatiana Aghová / Ph.D. dissertation (2018)
Description of the fossil: The anterostyle (t1) is stretched out into a low oblique blade; lingal
anterocone (t2) elongated; labial anterocone (t3) very small, located at the same level as t2;
metacone (t9) almost as large as paracone (t6); posterior cingulum strong (Geraads, 2001;
Mein et al., 2004).
How was used for analysis: †Preacomys kikiae was not used for the final analysis, because
of unclear phylogenetic position of the fossil.
11. †Mus sp. Linneaus
Fossils used in this study
Locality: YGSP 547, Dhok Pathan Formation, Siwalik Group, Pakistan
Age: 8.0 Ma (median age), determined based on magnetostratigraphy correlated to the
Geomagnetic Polarity Time Scale of Ogg (2012).
References of the fossils: Kimura et al., (2013a, 2015)
Paleontological event: The first occurrence of the genus Mus in geological time.
Proposed for the fossil calibration point by: Kimura et al. (2015).
Taxonomic Information: The fossils associated with genus Mus has been reported from a
number of localities in the Indian subcontinent. The first occurrence of the genus †Mus sp. in
geologic time is 8.0 Ma from locality YGSP 547, Dhok Pathan Formation, Siwalik Group
(Jacobs and Flynn, 2005; Kimura et al., 2013a). Other important discoveries include †Mus
auctor Jacobs (6.5 Ma; Figure S10) from the same region (Jacobs and Flynn, 2005), †Mus
flynni Patnaik (2.5 Ma) from the Indian Siwalik (Patnaik, 1991), †M. jacobsi Kotlia (2.4 Ma)
from the Kashmir intermontane basin (Kotlia, 1992), †M. linnaeusi Patnaik (2.0 Ma) from the
Upper Siwalik, India (Patnaik, 1997; 2001).
How was used for analysis: This calibration point was used as a stem calibration for tribe
Murini with lognormal prior distribution (offset 7.29, log 1.0, mean 4.9).
188
Tatiana Aghová / Ph.D. dissertation (2018)
12. †Acomys sp. I. Geoffroy
Fossils used in this study
Locality: Lemudong’o, locality 1, Kenya
Age: 6.1 Ma, 40Ar/39Ar (Deino and Ambrose, 2007)
References of the fossils: Manthi (2007)
Paleontological event: The first occurrence of Acomys in geological time.
Proposed for the fossil calibration point: Not used.
How was used for analysis: The Acomys fossil was exluded from our final analysis, because
upper first molars (M1), which are the most diagnostic tooth element for the taxonomy of the
Muridae, are not yet found from the locality. The presence of M1 was added to our criteria for
selection of fossils.
Figure S7: Left mandibular fragment with m1-2 Acomys KNM-NK 42315 (from Manthi,
2007; with permission from F. K. Manthi).
13. †Aethomys sp. Thomas
Fossils used in this study
Locality: Lemudong’o, locality 1, Kenya
Age: 6.1 Ma, 40Ar/39Ar (Deino and Ambrose, 2007)
References of the fossils: Manthi (2007)
189
Tatiana Aghová / Ph.D. dissertation (2018)
Paleontological event: The first occurrence of Aethomys similar in geological time
Proposed for the fossil calibration point: This study.
How was used for analysis: The Aethomys fossil was used as stem calibration for genus
Aethomys with lognormal prior distribution (offset 5.34, log 1.0, mean 5.5).
14. †Arvicanthis sp. Lesson
Fossils used in this study
Locality: Lemudong’o, locality 1, Kenya
Age: 6.1 Ma, 40Ar/39Ar (Deino and Ambrose, 2007)
References of the fossils: Manthi (2007)
Paleontological event: The first occurrence of Arvicanthis similar in geological time.
Proposed for the fossil calibration point: Rowe et al. (2011), Fabre et al. (2013)
How was used for analysis: The Arvicanthis fossil was used as stem calibration for genus
Arvicanthis with lognormal prior distribution (offset 5.34, log 1.0, mean 5.5).
15. †Gerbilliscus sp. (Thomas)
Fossils used in this study
Locality: Lemudong’o, locality 1, Kenya
Age: 6.1 Ma, 40Ar/39Ar (Deino and Ambrose, 2007)
References of the fossils: Manthi (2007)
Paleontological event: The first occurrence of Gerbilliscus similar to extant species.
Proposed for the fossil calibration point: Aghova et al. (2017)
How was used for analysis: The Gerbilliscus fossil was used as stem calibration for genus
Gerbilliscus with lognormal prior distribution (offset 5.34, log 1.0, mean 5.5).
190
Tatiana Aghová / Ph.D. dissertation (2018)
16. †Lemniscomys sp. Trouessart
Fossils used in this study
Locality: Lemudong’o, locality 1, Kenya
Age: 6.1 Ma, 40Ar/39Ar (Deino and Ambrose, 2007)
References of the fossils: Manthi (2007)
Paleontological event: The first occurrence of Lemniscomys similar to extant species.
Proposed for the fossil calibration point: Not used.
How was used for analysis: The Lemniscomys fossil was excluded from final analysis,
because the fossils lack the most diagnostic tooth elements, upper first molars.
17. †Mastomys sp. Thomas
Fossils used in this study
Locality: Lemudong’o, locality 1, Kenya
Age: 6.1 Ma, 40Ar/39Ar (Deino and Ambrose, 2007)
References of the fossils: Manthi (2007)
Paleontological event: The first occurrence of Mastomys similar in geological time.
Proposed for the fossil calibration point: Not used.
How was used for analysis: Mastomys fossil was excluded after cross-validation.
18. †Gerbillus sp. Desmarest
Fossils used in this study
Locality: A.L. 894, Hadar, Ethiopia
Age: 2.4 Ma, geochronology (BKT-3 tephra), 40K/40Ar, 40Ar/39Ar, sedimentology
(Campisano and Feibel, 2008; Kimbel et al., 1996)
References of the fossils: Reed, 2011; Reed and Geraads, 2012
Paleontological event: The first occurrence of Mastomys in geological time.
191
Tatiana Aghová / Ph.D. dissertation (2018)
Proposed for the fossil calibration point: Not used.
Taxonomic Information: Although the larger varieties of gerbils such as Gerbilliscus are
present in Mio-Pliocene deposits in East Africa (e.g., Lemudong’o; Laetoli), the smaller,
more arid adapated taxa, such as Gerbillus, do not appear in the East African fossil record
until Member F times in the Omo Shungura Formation (Wesselman, 1984).
Description of the fossil: The material from A.L. 894 is similar in size to the Gerbillus sp.
indet. from Omo Shungura, Member F (Wessleman, 1984), but differs from the latter in
having a longitudinal crest connecting the anterior and middle laminae of M1, similar to that
present in extant Gerbillus. At ca. 2.4 Ma the A.L. 894 specimens likely predate the Omo
material and thus represent the oldest occurrence of Gerbillus in East Africa (Reed, 2011;
Reed and Geraads, 2012). The coincident appearance Gerbillus at A.L. 894 in North-east
Ethiopia and also in Member F at Omo Shungura, Ethiopia, supports the hypothesis of a
synchronized transition in the faunas in East Africa between 3.2 and 2.4 Ma, and provides
some evidence for a transition to a more arid regional paleoenvironment (Reed and Geraads,
2012).
How was used for analysis: Gerbillus sp. was excluded after cross-validation.
References
Aghová, T., Šumbera, R., Piálek, L., Mikula, O., McDonough, M. M., Lavrenchenko, L. A.,
Meheretu, Y., Mbau, J.S., Bryja, J., 2017. Multilocus phylogeny of East African gerbils
(Rodentia, Gerbilliscus) illuminates the history of the Somali-Masai savanna. J.
Biogeogr. doi:10.1111/jbi.13017
Aguilar, J.-P., W. A. Berggren, M.-P. Aubry, D. V. Kent, G. Clauzon, M. Benammi, and
Michaux, J., 2004. Mid Neogene Mediterranean marine-continental correlations: an
alternative interpretation. Palaeogeogr. Palaeoclimatol. Palaeoecol. 204, 165–186.
Campisano, C.J., Feibel, C.S., 2008. Depositional environments and stratigraphic summary of
the Pliocene Hadar Formation at Hadar, Afar Depression, Ethiopia. Geol. Early Humans
Horn Africa 179–201.
Campisano, C. J., Feibel, C. S., 2008. Depositional environments and stratigraphic summary
of the Pliocene Hadar formation at Hadar, Afar depression, Ethiopia. Geol. Soc. Spec.
192
Tatiana Aghová / Ph.D. dissertation (2018)
Pap. 446, 179-201.
Cheema, I. U., S.Mahmood Raza, L. J. Flynn, A. R. Rapjar, Tomida, Y., 2000. Miocene
smallmammals from Jalalpur, Pakistan, and their biochronologic implications. Bull. Natl.
Sci. Mus., Tokyo, 26, 57–77.
de Bruijn, H., G. Saraç, L. W. Hoek Ostende, and Roussiakis, S., 1999. The status of the
genus name Parapodemus Schaub, 1938: New data bearing on an old controversy, in:
Reumer, J.W.F, de Vos, J. (Eds.), Elephants have a snorkel! Papers in honor of Paul Y.
Sondaar, DEINSEA 7: Annual of the Natural History Museum of Rotterdam. Rotterdam,
pp. 95–112.
Deino, A.L., Ambrose, S.H., 2007. 40Ar/39Ar dating of the Lemudong’o late Miocene fossil
assemblages, southern Kenya rift. Kirtlandia 56, 65–71.
Denys, C., Winkler, A.J., 2015. Advances in integrative taxonomy and evolution of African
!"#$% "&$'()*+,% -&.% &"/-&0&1#230% )"''*% -#$'% )-'% &0'2!03"% 4&"'*)5% #(,% 6&75% 89:95%
Hautier, L. (Eds.), Evolution of the Rodents: Advances in Phylogeny, Functional
Morphology and Development. Campridge University Press, pp. 186–220.
Fabre, P.H., Pagès, M., Musser, G.G., Fitriana, Y.S., Fjeldså, J., Jennings, A., Jønsson, K. A.,
Kennedy, J., Michaux, J., Semiadi, G., Supriatna, N., Helgen, K.M., 2013. A new genus
of rodent from wallacea (Rodentia: Muridae: Murinae: Rattini), and its implication for
biogeography and Indo-Pacific Rattini systematics. Zool. J. Linn. Soc. 169, 408–447.
Flynn, L.J., Jacobs, L.L., 1999. Late Miocene small mammal faunal dynamics: the crossroads
of the Arabian peninsula. in: Whybrow, P.J., Hill, A., (Eds.), Fossil vertebrates of
Arabia. Yale University Press, New Haven. pp. 412–419.
Flynn, L. J., Winkler, A. J., Jacobs, L. L., Downs, W., 2003. Chapter 23: Tedford's Gerbils
from Afghanistan. Bulletin of the American Museum of Natural History. pp. 603-624.
Geraads, D., 2001. Rongeurs du Miocene superieur de Chorora (Ethiopie): Dendromuridae,
Muridae et conclusions. Palaeovertebrata 30, 89–109.
Geraads, D., 2002. Plio-Pleistocene mammalian biostratigraphy of Atlantic
Morocco. Quaternaire. 13, 43-53.
Jacobs, L. L. 1977. A new genus of murid rodent from the miocene of Pakistan and comments
on the origin of the Muridae. PaleoBios. 25, 1–11
Jacobs, L. L., 1978. Fossil rodents (Rhizomyidae and Muridae) from Neogene Siwalk
deposits, Pakistan. Mus. North. Ariz. Bull. 52, 1–103.
Jacobs, L.L., Downs, W.R., 1994. The evolution of murine rodents in Asia. Natl. Sci.
Museum Monogr. 8, 149–156.
193
Tatiana Aghová / Ph.D. dissertation (2018)
Jacobs, L. L., L. J. Flynn, Downs, W.R., 1989. Neogene Rodentia of Southern Asia. in: Black,
C.C., Dawson, M.R. (Eds.), Papers on fossil rodents in honor of Albert Elmer Wood.
Natural History Museum, Los Angeles. pp. 157–177.
Jacobs, L., Flynn, L., Downs, W., Barry, J., 1990. Quo vadis Antemus? The Siwalik muroid
record. in: Lindsay, E.H, Fahlbusch, V., Mein, P. (Eds.), European Neogene Mammal
Chronology. Plenum Press. New York. pp. 573–586.
Jacobs L.L., Flynn J.J., 2005. Of mice ... again: the Siwalik rodent record, murine distribution,
and molecular clocks. in: Leiberman. D.E., Smith, R.J,, Kelley, J., (Eds.), Interpreting
the past: essays on human, primate, and mammal evolution in honor of David Pilbeam.
Brill Academic Publishers Inc, Boston. pp. 63–80.
Jansa, S. A., Weksler, M., 2004. Phylogeny of muroid rodents: Relationships within and
among major lineages as determined by IRBP gene sequences. Mol. Phylogenet. Evol.
31, 256–276.
Kimbel, W.H., Walter, R.C., Johanson, D.C., Reed, K.E., Aronson, J.L., Assefa, Z., Marean,
C.W., Eck, G.G., Bobe, R., Hovers, E., Rak, Y., Vondra, C., Yemane, T., York, D., Y
Chen, Evensen, N.M., Smith, P.E., 1996. Late Pliocene Homo and Oldowan Tools from
the Hadar Formation (Kada Hadar Member), Ethiopia. J. Hum. Evol. 31, 549–561.
Kimura, Y., Hawkins, M.T.R., McDonough, M.M., Jacobs, L.L., Flynn, L.J., 2015. Corrected
placement of Mus-Rattus fossil calibration forces precision in the molecular tree of
rodents. Nat. Publ. Gr. 1–9.
Kimura, Y., Jacobs, L.L., Cerling, T.E., Uno, K.T., Ferguson, K.M., Flynn, L.J., Patnaik, R.,
2013a. Fossil Mice and Rats Show Isotopic Evidence of Niche Partitioning and Change
in Dental Ecomorphology Related to Dietary Shift in Late Miocene of Pakistan. PLoS
One 8, 1–10.
Kimura, Y., Jacobs, L.L., Flynn, L.J., 2013b. Lineage-Specific Responses of Tooth Shape in
Murine Rodents (Murinae, Rodentia) to Late Miocene Dietary Change in the Siwaliks of
Pakistan. PLoS One 8.
Kimura, Y., Flynn, L. J., Jacobs, L. L. 2017. Early Late Miocene Murine Rodents from the
Upper Part of the Nagri Formation, Siwalik Group, Pakistan, with a new fossil
calibration point for the Tribe Apodemurini (Apodemus/Tokudaia). Fossil Imprint, 73.
197–212.
Kotlia, B.S., 1992. Pliocene murids (Rodentia, Mammalia) from Kashmir Basin, northwestern
India. N. JB. Geol. Palaeont. 184, 339-357.
Lazzari, V., Aguilar, J.-P., Michaux, J., 2010. Intraspecific variation and micro-
194
Tatiana Aghová / Ph.D. dissertation (2018)
macroevolution connection: illustration with the late Miocene genus Progonomys
(Rodentia, Muridae). Paleobiology 36, 641–657.
Lazzari, V., Tafforeau, P., Michaux, J., 2011. When homologous cusps display non-
homologous wear facets: An occlusal reorganization ensures functional continuity during
dental evolution of Murinae (Rodentia, Mammalia). Arch. Oral Biol. 56, 194–204.
Lindsay, E.H., 1988. Cricetid Rodents from Siwalik Deposits near Chinji Village. Part 1:
Megacricetodontinae, Myocricetodontinae and Dendromurinae. Palaeovertebrata. 18, 95-
154.
López Antoñanzas, R., 2009. First potwarmus from the miocene of Saudi Arabia and the early
phylogeny of murines (Rodentia: Muroidea). Zool. J. Linn. Soc. 156, 664–679.
Lungu, A. N., 1981. Hipparion Fauna of Middle Sarmatian of Moldavia (Insectivora,
Lagomorpha and Rodentia). State Tiraspol Institut Pedagogiki Publ. 1557, 1-137.
Manthi, F.K., 2007. A preliminary review of the rodent fauna from Lemudong’o,
southwestern Kenya, and its implication to the late Miocene paleoenvironments.
Kirtlandia. 56, 92–105.
Martín-Suáres, E., Mein, P., 1998. Revision of the genera Parapodemus, Apodemus
Rhagamys and Rhagapodemus (Rodentia, Mammalia). Geobios 31, 87–97.
Mein, P., 1984. Composition quantitative des faunes de mammifères du Miocène moyen et
supérieur de la région lyonnaise. Paléobiologie continentale, 14, 339-346.
Mein, P., Pickford, M., Senut, B., 2004. Late Miocene micromammals from the Harasib karst
deposits, Namibia. Part 2b-Cricetomyidae, Dendromuridae and Muridae, with an
addendum on the Myocricetodontinae. Communs. Geol. Surv. Namibia. 13, 43–63.
Mein, P., Pickford, M., 2006. Late Miocene micromammals from the Lukeino Formation (6.1
to 5.8 Ma), Kenya. Bull. Mens. Soc. Linn. Lyon. 75, 183–223.
Mein, P., Martín-Suárez, E., Agustí, J., 1993. Progonomys Schaub, 1938 and Huerzilerimys
gen. nov. (Rodentia); their Evolution in Western Europe, Scripta Geol. 103, 41-64.
Missoup, A.D., Nicolas, V., Eiseb, S., Chung, E.K., Denys, C., 2016. Phylogenetic position of
the endemic Mount Oku rat, Lamottemys okuensis (Rodentia: Muridae), based on
molecular and morphological data. Zool. J. Linn. Soc. 177, 209–226.
Musser, G.G., 1987. The first occurence of Hadromys (Rodentia: Muridae) in early Pleistocen
Siwalik strata in northern Pakistan and its bearing on biogeographic affinities between
indian and northeastern african murine faunas. Am. Mus. Novit. 2883, 1–36.
Musser, G.G., Carleton M.D., 2005. Superfamily Muroidea, in: Wilson, D.E., Reeder, D.A.M.
(Eds.), Mammal Species of the World. A Taxonomic and Geographic Reference. The
195
Tatiana Aghová / Ph.D. dissertation (2018)
Johns Hopkins University Press. Baltimore. pp. 894–1531.
Ogg, J. G., Smith, A. G., 2004. Geologic Time Scale 2004. in: Gradstein, F. M., Ogg, J. G.,
Smith, A. G.A (Eds.), Cambridge University Press. pp. 63–86.
Ogg, J. G., 2012. Geomagnetic Polarity Time Scale. In: Gradstein, F. M., Ogg, J. G., Schmitz,
M., & Ogg, G. (Eds.), The geologic time scale 2012. Elsevier.
Patnaik, R., 1991. Micropalaeontology, biostratigraphy and palaeoenvironmental analysis of
the Siwalik sequences in the Saketi-Nahan area (Himachal Pradesh). Ph.D thesis. Panjab
University, Chandigarh.
Patnaik, R., 1997. New murids and gerbillids (Rodentia, Mammalia) from Pliocene Siwalik
sediments of India. Palaeovertebrata 26, 129–165.
Patnaik, R., 2001. Late Pliocene micromammals from Tatrot Formation (Upper Siwaliks)
exposed near Village Saketi, Himachal Pradesh, India. Palaeontographica 261, 55-81.
Patnaik, R., 2014. Phylogeny of siwalik murine rodents: implications for Mus-Rattus
divergence time. J. Paleontol. Soc. Ind. 59,15–27.
Qiu, Z., Zheng, S., Zhang, Z., 2004. Murids from the late Miocene Bahe formation, Lantian,
Shaanxi. Vertebrata Pal. Asiatica, 42, 67-76.
Reed, D.N., 2011. New murid (Mammalia, Rodentia) fossils from a late Pliocene (2.4 Ma)
locality, Hadar A.L. 894 , Afar Region, Ethiopia. J. Vertebr. Paleontol. 31, 1326–1337.
Reed, D.N., Geraads, D., 2012. Evidence for a Late Pliocene faunal transition based on a new
rodent assemblage from Oldowan locality Hadar A.L. 894, Afar Region, Ethiopia. J.
Hum. Evol. 62, 328–337.
Renaud, S., Michaux, J., Mein, P., Aguilar, J.P., Auffray, J.C., 1999. Patterns of size and
shape differentiation during the evolutionary radiation of the European Miocene murine
rodents. Lethaia 32, 61–71.
Renaud S, Michaux J, Schmidt D, Aguilar J, Mein P, Auffray J. 2005. Morphological
evolution, ecological diversification and climate change in rodents. Proc. R. Soc. London
Ser. B 272, 609–17.
Rowe, K.C., Aplin, K.P., Baverstock, P.R., Moritz, C., 2011. Recent and rapid speciation with
limited morphological disparity in the genus rattus. Syst. Biol. 60, 188–203.
Sen, S., 1983. Rongeurs et lagomorphes du gisement pliocène de Pul-e Charkhi, bassin de
Kabul, Afghanistan. Bull. Mus. Natl. Hist. Nat. 5, 33-74.
Sen, S., 2003. Muridae and Gerbillidae (Rodentia). in: Fortelius, M., Kappelman, J., Sen, S.,
Bernor, R. L., (Eds.), Geology and Paleontology of the Miocene Sinap Formation,
Turkey. Columbia University Press, New York City. pp. 125–140.
196
Tatiana Aghová / Ph.D. dissertation (2018)
Sinitsa, M. V., Delinschi, A., 2016. The earliest member of Neocricetodon (Rodentia:
Cricetidae): a redescription of N. moldavicus from Eastern Europe, and its bearing on the
evolution of the genus. J. Paleontol. 90, 771-784.
Storch, G., Ni, X., 2002. New Late Miocene murids from China ( Mammalia , Rodentia )
Nouveaux muridés (Mammifères, Rongeurs) du Miocène supérieur de Chine. Geobios
35, 515–521.
Suwa, G., Beyene, Y., Nakaya, H., Bernor, R.L., Boisserie, J.-R., Bibi, F., Ambrose, S.H.,
Sano, K., Katoh, S., Asfaw, B., 2015. Newly discovered cercopithecid, equid and other
mammalian fossils from the Chorora Formation, Ethiopia. Anthropol. Sci. 123, 19–39.
Wesselman, H.B., 1984. The Omo micromammals: systematics and paleoecology of early
man sites from Ethiopia. Contrib. Vertebr. Evol. 7, 1–219.
Wessels,W., 2009. Miocene rodent evolution and migration: Muroidea from Pakistan, Turkey
and North Africa. Geologia Ultraiectina, 307, 1–290.
Winkler, A.J., 2003. Rodents and lagomorphs from the Miocene and Pliocene of Lothagam,
northern Kenya. in: Leakey, M.G., Harris, J.M., (Eds.), Lothagam, the Dawn of
Humanity in Eastern Africa. Columbia University Press, New York, pp. 169–198.
Wöger, J.A., 2011. A Revision of the Murinae (Rodentia, Mammalia) of Kohfidisch (Upper-
Miocene, Burgenland, Austria). Diplomarbeit. Universität Wien.
Copyright © 2022 FDOKUMEN