Comparative Microbial Modules Resource: Generation and Visualization of Multi-species Biclusters
13
Comparative Microbial Modules Resource: Generation and Visualization of Multi-species Biclusters Thadeous Kacmarczyk 1. , Peter Waltman 2,3. , Ashley Bate 1 , Patrick Eichenberger 1 , Richard Bonneau 1,2,3 * 1 Center for Genomics and Systems Biology, Department of Biology, New York University, New York, New York, United States of America, 2 Computer Science Department, Courant Institute for Mathematical Sciences, New York University, New York, New York, United States of America, 3 Computational Biology Program, New York University, New York, New York, United States of America Abstract The increasing abundance of large-scale, high-throughput datasets for many closely related organisms provides opportunities for comparative analysis via the simultaneous biclustering of datasets from multiple species. These analyses require a reformulation of how to organize multi-species datasets and visualize comparative genomics data analyses results. Recently, we developed a method, multi-species cMonkey, which integrates heterogeneous high-throughput datatypes from multiple species to identify conserved regulatory modules. Here we present an integrated data visualization system, built upon the Gaggle, enabling exploration of our method’s results (available at http://meatwad.bio.nyu.edu/cmmr.html). The system can also be used to explore other comparative genomics datasets and outputs from other data analysis procedures – results from other multiple-species clustering programs or from independent clustering of different single- species datasets. We provide an example use of our system for two bacteria, Escherichia coli and Salmonella Typhimurium. We illustrate the use of our system by exploring conserved biclusters involved in nitrogen metabolism, uncovering a putative function for yjjI, a currently uncharacterized gene that we predict to be involved in nitrogen assimilation. Citation: Kacmarczyk T, Waltman P, Bate A, Eichenberger P, Bonneau R (2011) Comparative Microbial Modules Resource: Generation and Visualization of Multi- species Biclusters. PLoS Comput Biol 7(12): e1002228. doi:10.1371/journal.pcbi.1002228 Editor: Jason A. Papin, University of Virginia, United States of America Received May 5, 2011; Accepted August 29, 2011; Published December 1, 2011 Copyright: ß 2011 Kacmarczyk et al. This is an open-access article distributed under the terms of the Creative Commons Attribution License, which permits unrestricted use, distribution, and reproduction in any medium, provided the original author and source are credited. Funding: We acknowledge the financial support of NIH grant GM081571 to PE, GM092616 to RB and PE and Department of the Army award number W81XWH- 04-1-0307 to RB and PE. The content of this material does not necessarily reflect the position or the policy of the US Government and no official endorsement should be inferred. The funders had no role in study design, data collection and analysis, decision to publish, or preparation of the manuscript. Competing Interests: The authors have declared that no competing interests exist. * E-mail: [email protected] . These authors contributed equally to this work. Introduction It is now routine to have genomics data for multiple organisms of interest. For example, data may be available for both an organism of primary relevance to a specific study, as well as data for related species. Tools and algorithms for comparative analysis of multi-species datasets are therefore in high demand. Compar- ative analysis of gene sequences is a mainstay in computational biology [1], but comparative methods for genomics and transcriptomics data analysis are relatively new, primarily due to the fact that only recently have researchers had access to large- scale datasets from multiple species [2,3,4,5,6,7]. A number of tools are being developed for interpreting and exploring large-scale biological networks, such as: PathSys [8], NAViGaTOR [9], BIOZON [10,11], BN++ [12], ONDEX [13], Cytoscape, and Osprey [14]. For a review of visualization tools for systems biology see [15]. Most tools focus on automated methods for integrating interaction datasets and displaying them graphi- cally as network diagrams. Some contain novel data structures and data models, connections to databases, and many can incorporate additional data such as, abundance, sequence, literature derived and text mining derived data. These tools often contain functions for highlighting differences in the collected datasets. While the CMMR overlaps and encompasses many of the functionalities of these previously described tools, for example visualizing network graphs from a collected data compendium, its primary function is displaying the results of multiple-species integrated biclustering analysis. Several recent studies have shown that comparative genomics analysis improves our ability to learn regulatory interactions, co- regulated groups, and to delineate the conserved components of fundamental pathways and modules [2,16,17,18,19,20]. In particular, multiple-species clustering and biclustering can be used to detect conserved co-regulated gene groups and serve as a foundation to begin characterizing key differences in the regulatory programs of related species. In this work we present a data visualization system that enables the visualization and exploration of integrative multi-species biclustering analysis [20]. Our interface is built on a loosely coupled system architecture that connects multiple tools and databases using the Gaggle [21], Sungear [22], and Cytoscape [23]. This interface provides coordinated access to multiple-species clusters, biclusters and networks derived from comparative genomics analysis tools such as multi-species cMonkey (MScM) [20]. The challenges of visualizing multiple species data The analysis of multiple species datasets presents several challenges not encountered when analyzing single species datasets. In addition to the display and exploration of multiple datatypes, such as interaction networks, cis-regulatory sequences, transcrip- tome and proteome data, we add the challenge of tracking connections between orthologous groups of genes. In this work we PLoS Computational Biology | www.ploscompbiol.org 1 December 2011 | Volume 7 | Issue 12 | e1002228
-
Upload
rockefeller -
Category
Documents
-
view
1 -
download
0
Transcript of Comparative Microbial Modules Resource: Generation and Visualization of Multi-species Biclusters

Comparative Microbial Modules Resource: Generationand Visualization of Multi-species BiclustersThadeous Kacmarczyk1., Peter Waltman2,3., Ashley Bate1, Patrick Eichenberger1, Richard Bonneau1,2,3*
1 Center for Genomics and Systems Biology, Department of Biology, New York University, New York, New York, United States of America, 2 Computer Science
Department, Courant Institute for Mathematical Sciences, New York University, New York, New York, United States of America, 3 Computational Biology Program, New
York University, New York, New York, United States of America
Abstract
The increasing abundance of large-scale, high-throughput datasets for many closely related organisms providesopportunities for comparative analysis via the simultaneous biclustering of datasets from multiple species. These analysesrequire a reformulation of how to organize multi-species datasets and visualize comparative genomics data analyses results.Recently, we developed a method, multi-species cMonkey, which integrates heterogeneous high-throughput datatypesfrom multiple species to identify conserved regulatory modules. Here we present an integrated data visualization system,built upon the Gaggle, enabling exploration of our method’s results (available at http://meatwad.bio.nyu.edu/cmmr.html).The system can also be used to explore other comparative genomics datasets and outputs from other data analysisprocedures – results from other multiple-species clustering programs or from independent clustering of different single-species datasets. We provide an example use of our system for two bacteria, Escherichia coli and Salmonella Typhimurium.We illustrate the use of our system by exploring conserved biclusters involved in nitrogen metabolism, uncovering aputative function for yjjI, a currently uncharacterized gene that we predict to be involved in nitrogen assimilation.
Citation: Kacmarczyk T, Waltman P, Bate A, Eichenberger P, Bonneau R (2011) Comparative Microbial Modules Resource: Generation and Visualization of Multi-species Biclusters. PLoS Comput Biol 7(12): e1002228. doi:10.1371/journal.pcbi.1002228
Editor: Jason A. Papin, University of Virginia, United States of America
Received May 5, 2011; Accepted August 29, 2011; Published December 1, 2011
Copyright: � 2011 Kacmarczyk et al. This is an open-access article distributed under the terms of the Creative Commons Attribution License, which permitsunrestricted use, distribution, and reproduction in any medium, provided the original author and source are credited.
Funding: We acknowledge the financial support of NIH grant GM081571 to PE, GM092616 to RB and PE and Department of the Army award number W81XWH-04-1-0307 to RB and PE. The content of this material does not necessarily reflect the position or the policy of the US Government and no official endorsementshould be inferred. The funders had no role in study design, data collection and analysis, decision to publish, or preparation of the manuscript.
Competing Interests: The authors have declared that no competing interests exist.
* E-mail: [email protected]
. These authors contributed equally to this work.
Introduction
It is now routine to have genomics data for multiple organisms
of interest. For example, data may be available for both an
organism of primary relevance to a specific study, as well as data
for related species. Tools and algorithms for comparative analysis
of multi-species datasets are therefore in high demand. Compar-
ative analysis of gene sequences is a mainstay in computational
biology [1], but comparative methods for genomics and
transcriptomics data analysis are relatively new, primarily due to
the fact that only recently have researchers had access to large-
scale datasets from multiple species [2,3,4,5,6,7].
A number of tools are being developed for interpreting and
exploring large-scale biological networks, such as: PathSys [8],
NAViGaTOR [9], BIOZON [10,11], BN++ [12], ONDEX [13],
Cytoscape, and Osprey [14]. For a review of visualization tools for
systems biology see [15]. Most tools focus on automated methods
for integrating interaction datasets and displaying them graphi-
cally as network diagrams. Some contain novel data structures and
data models, connections to databases, and many can incorporate
additional data such as, abundance, sequence, literature derived
and text mining derived data. These tools often contain functions
for highlighting differences in the collected datasets. While the
CMMR overlaps and encompasses many of the functionalities of
these previously described tools, for example visualizing network
graphs from a collected data compendium, its primary function is
displaying the results of multiple-species integrated biclustering
analysis.
Several recent studies have shown that comparative genomics
analysis improves our ability to learn regulatory interactions, co-
regulated groups, and to delineate the conserved components of
fundamental pathways and modules [2,16,17,18,19,20]. In
particular, multiple-species clustering and biclustering can be used
to detect conserved co-regulated gene groups and serve as a
foundation to begin characterizing key differences in the
regulatory programs of related species. In this work we present a
data visualization system that enables the visualization and
exploration of integrative multi-species biclustering analysis [20].
Our interface is built on a loosely coupled system architecture that
connects multiple tools and databases using the Gaggle [21],
Sungear [22], and Cytoscape [23]. This interface provides
coordinated access to multiple-species clusters, biclusters and
networks derived from comparative genomics analysis tools such
as multi-species cMonkey (MScM) [20].
The challenges of visualizing multiple species dataThe analysis of multiple species datasets presents several
challenges not encountered when analyzing single species datasets.
In addition to the display and exploration of multiple datatypes,
such as interaction networks, cis-regulatory sequences, transcrip-
tome and proteome data, we add the challenge of tracking
connections between orthologous groups of genes. In this work we
PLoS Computational Biology | www.ploscompbiol.org 1 December 2011 | Volume 7 | Issue 12 | e1002228

focus on exploring sets of multi-species biclusters generated with
MScM. A typical multi-species biclustering (set of biclusters) will
consist of:
1. The source data used to:
a. Compute the biclustering. For each species, its protein
association networks, upstream sequences and expression data
b. Perform post-analytic evaluations, such as enrichment of
ontology terms, i.e. GO functions and KEGG pathways
2. A set of conserved biclusters. Biclusters composed of pairs of
orthologous genes spanning both species
3. Species-specific elaborations of the conserved biclusters.
Following the initial generation of the conserved core of the
biclusters, genes added to conserved biclusters based on
evidence in a single species – including genes lacking putative
orthologs in the other species
4. Species-specific biclusters. Biclusters composed entirely of
genes lacking detectable orthology relationships between the
two species
Our system to navigate this analysis enables exploration of both
conserved biclusters, in the context of both species, and species
specific additions to conserved biclusters, in the context of each
individual species dataset, and illustrates general strategies for
building loosely coupled systems for exploring other multi-species
genomics analysis.
Data integration across multiple speciesHigh-throughput data exists for many microbial organisms on
multiple information levels (i.e. genome sequences, transcrip-
tomics, proteomics, metabolomics, networks of pathways and
interactions). Collecting and integrating diverse and heterogeneous
datasets from disparate databases is not trivial and poses a number
of barriers to automating the process. One of the most significant
barriers to automation of data-import is the inconsistency among
the naming schemes for loci, mRNA and protein products that are
employed by the major public repositories such as NCBI, Uniprot
and EMBL. Versioning can also be an issue if a given data source
is delayed in updating their annotations. Our resource integrates
diverse data from microarray experiments, genomic sequences,
and various functional associations. It utilizes a database for
translating gene names across datatypes and disparate resources
and ortholog names across species, and is linked to the Gaggle. We
will focus our examples on two closely related c-Proteobacteria: E.
coli and S. Typhimurium.
Multi-species integrated biclusteringClustering and biclustering are typically used to identify groups
of co-expressed genes that, ideally, represent true regulatory
modules and co-functional groups such as pathways and
complexes. Biclustering groups genes into condition-specific gene
clusters, and can allow genes to participate in more than one
bicluster. Many biclustering methods have been previously
described, for example, SAMBA [24], QUBIC [25], ISA
[26], BIMAX [27], and NNN [28], and other algorithms
[4,29,30,31,32]. Recent integrative biclustering methods, such as
MATISSE [33], the recent version of SAMBA [19], and cMonkey
[18,20] have shown that incorporating additional datatypes, such
as protein interactions and cis-acting regulatory sites, improves the
performance of identifying of co-functional putative co-regulated
modules. There are many benefits to comparing elements among
species considering that a high fraction of co-regulated modules
are conserved, in whole or in part, across species [3,34]. Recent
access to multiple genomics datasets from multiple species has
allowed for new comparative analyses of genomics data, for
example discovering regulatory elements [35] and the MScM
algorithm [20] used here. MScM learns coregulated modules by
integrating expression data across subsets of experimental condi-
tions, co-occurrence of putative cis-acting regulatory motifs in the
regulatory regions of bicluster members, functional associations and
physical interactions. The output consists of condition dependent
conserved modules of orthologous gene groups as well as species-
specific elaborations of these conserved groups. The method is a
true biclustering method: a typical conserved bicluster is typically
supported by a subset of the input data for each species.
Component tools used by our systemTo enable exploration of a multi-species integrative biclustering
result, we have constructed a system using the Gaggle and MScM
(Figure 1). The Gaggle is a Java program that integrates tools by
broadcasting gene, network and data selections between tools. For
example, nodes selected in Cytoscape are sent to the Gaggle, which
then sends the selections to all tools, which then automatically mirror
those selections. The Gaggle has been shown to enable efficient
creation of multi-tool systems to explore complex datasets and
associated analysis [36]. Also, the loosely coupled visualization
systems the Gaggle enables have several advantages including:
systems-performance advantages – one tool crashing does not disable
the whole system, development advantages – existing tools need not
be reengineered and can be incorporated with small development
costs, and maintenance advantages – due to the modularity of the
resulting systems. We have extended the gaggle tools and built a
corresponding database to give the user the ability to mirror gene
selections in tools populated with results for one organism with the
corresponding selection of the correct orthologs in the network, data,
and bicluster views of another organism. Several component tools
and databases are compatible with the Gaggle, or have been made
compatible as part of this work, including: Sungear, Cytoscape,
Cytoscape plugins such as BioNetBuilder [37], a Global Synonym/
Ortholog Translator, and several tools designed to enable
exploration of the genomics data available for each species (e.g.
Author Summary
Advancing high-throughput experimental technologiesare providing access to genome-wide measurements formultiple related species on multiple information levels(e.g. mRNA, protein, interactions, functional assays, etc.).We present a biclustering algorithm and an associatedvisualization system for generating and exploring regula-tory modules derived from analysis of integrated multi-species genomics datasets. We use multi-species-cMonkey,an algorithm of our own construction that can integratediverse systems-biology datatypes from multiple speciesto form biclusters, or condition-dependent regulatorymodules, that are conserved across both the multiplespecies analyzed and biclusters that are specific to subsetsof the processed species. Our resource is an integratedweb and java based system that allows biologists toexplore both conserved and species-specific biclusters inthe context of the data, associated networks for bothspecies, and existing annotations for both species. Ourfocus in this work is on the use of the integrated systemwith examples drawn from exploring modules associatedwith nitrogen metabolism in two Gram-negative bacteria,E. coli and S. Typhimurium.
Comparative Microbial Modules Resource
PLoS Computational Biology | www.ploscompbiol.org 2 December 2011 | Volume 7 | Issue 12 | e1002228

Figure 1. Overview of the Comparative Microbial Module Resource components (CMMR). The CMMR consists of an integrated suite ofweb components for visualizing the diverse aspects of the multi-species, multi-datatype analysis; facilitating access to each organism’s dataset. (A)Written descriptions of the individual components for hypothetical Organism 1. (B) The corresponding graphics of each component goose displayingexample data, for hypothetical Organism 2. Each of the components fetches information from the data compendium (MScM results, and raw data).(C) The CMMR integrative components: the FireGoose allows transfer of data between web pages and gaggled software, the Gaggle Boss acts as ahub for passing communications among the geese, and the Global Synonym/Ortholog Translator converts among gene annotations, accessions and
Comparative Microbial Modules Resource
PLoS Computational Biology | www.ploscompbiol.org 3 December 2011 | Volume 7 | Issue 12 | e1002228

the data matrix viewer (DMV) and annotations viewer). Interactions
among the CMMR, Gaggle tools and several online public databases
containing annotations and genomic sequence is accomplished via a
FireFox browser plugin called, the FireGoose [38] (available: http://
gaggle.systemsbiology.net/docs/geese/firegoose). Selections in any
tool are sent to the Gaggle which broadcasts both those gene
selections to all tools for the organism in which the original selection
was made and the orthologs in the other species of the selected genes.
We show that this simple strategy enables effective exploration of this
multi-datatype, multi-species integrative analysis.
Materials and Methods
We present an overview of the MScM algorithm, and the
system we have constructed for visualizing the resulting multiple-
species biclusters. Further methodological detail, additional
validation of our method, and a full description of the dataset
used to demonstrate our resource can be found in the
supplemental section (Text S1).
Datasets acquisition, integration and import to oursystem
Microarray data was acquired from several large, public
repositories such as the Gene Expression Omnibus (GEO)
[39,40], ArrayExpress [41,42], Stanford Microarray Database
(SMD) [43,44], Many Microbes Microarray database (M3D) [45],
and KEGG Expression [46], with newer datasets manually
obtained from individual publications. Genomic sequences
corresponding to the upstream promoter regions of each predicted
gene in each genome were retrieved from Regulatory Sequence
Analysis Tools (RSAT) [47,48]. Lastly, functional associations, in
the form of interaction networks, were automatically acquired
from multiple sources including Prolinks [49], Predictome [50],
STRING [51,52], and MicrobesOnline [53]. We have created a
data compendium containing all publicly available data for a
number of microbial species including several Gram negative
species Escherichia coli, Salmonella Typhimurium, Vibrio cholerae,
Helicobacter pylori, Desulfovibrio vulgaris; three related Gram positive
species Bacillus subtilis, Bacillus anthracis, Listeria monocytogenes, and the
archeon Halobacterium salinarum; within this compendium all name
translations have been curated to minimize error due to incorrect
translation of gene synonyms. In selecting this group of microbial
species, we decided to start with the two most extensively studied
bacterial model organisms, E. coli and B. subtilis, and included
several closely related species and some representatives from
important clades of the microbial tree of life. Additional species
will be included in future versions of the database, as a sufficient
amount of large-scale data becomes available for those species. A
translates orthologous genes between organisms. The arrows represent information flow between tools, primarily as broadcasts between tools andthe Gaggle boss.doi:10.1371/journal.pcbi.1002228.g001
Figure 2. CMMR Query Page and BiclusterCard. The CMMR web interface allows users to search for biclusters of interest, with each resultingbicluster displayed in a BiclusterCard format. (A) The CMMR search page showing the title links to the CMMR wiki, query form button, upload formbutton, and input fields. Shown is the query form with an example search for narG in the core set (check box) of bicluster gene members for a MScMrun of E. coli – S. Typhimurium. (B) The result page from this search – a user has access to the CMMR wiki, tutorials, a brief description of the searchquery, the resulting bicluster list and BiclusterCards. The BiclusterCard contains links to Gaggle tools, and expandable/collapsible tabs to display thebicluster’s diverse supporting information. There are help icons with mouseover tooltips for descriptions and information.doi:10.1371/journal.pcbi.1002228.g002
Comparative Microbial Modules Resource
PLoS Computational Biology | www.ploscompbiol.org 4 December 2011 | Volume 7 | Issue 12 | e1002228

Figure 3. BiclusterCard components I: Statistics, Enrichment Summary, Core Gene Table, KEGG Pathway Enrichment. TheBiclusterCard is a summary of the information supporting a bicluster, including links to online tools and source data. Shown in the figure are theexpanded tabs for: statistics, enrichment summary from COG, GO and KEGG enrichment analysis, KEGG pathway enrichment, and core gene table formulti-species bicluster E. coli – S. Typhimurium bicluster 57. (A) Statistics tab for eco57 (left) and stm57 (right) displays a table with the followingcolumns: Property and Value. The information contained in this table includes: the number of core and elaborated genes, fraction of conditions in the
Comparative Microbial Modules Resource
PLoS Computational Biology | www.ploscompbiol.org 5 December 2011 | Volume 7 | Issue 12 | e1002228

full listing of all datasets used in this study for both species,
including references to papers describing both original collection
and several databases that aided the import and curation of the
datasets, are provided in the supplemental materials (Text S1).
Multi-species cMonkeyThe MScM algorithm consists of four main steps. Beginning with
step 1, putative orthologous relationships between genes in each
species are identified using InParanoid [54]. InParanoid identifies
not only single gene pair relationships (one-to-one) but also families
of homologous genes (one-to-many, many-to-many). This allows for
flexibility when considering which orthologous gene pairs to cluster.
Genes are often in several putative orthology relationships and
selection of orthologous pairs, one pair per putative orthology
relationship, is driven by the genomics data (see Text S1 for details).
After defining the set of gene pairs spanning the two species, or
orthologous core, step 2 identifies the conserved biclusters via an
iterative Monte Carlo optimization of the MScM score. To
determine the likelihood of an orthologous gene pair belonging to
a bicluster, we first simultaneously compute single-species cMonkey
scores for each gene supported by each organism’s individual data
space (expression, common sequence motif, and connected
subnetwork). Then, we compute a single, multi-species score based
on the combined single-species scores. The putative-orthology
based gene coupling between species is removed in step 3, where
each detected conserved bicluster is split into its two constituent
single-species biclusters, then species-specific additions are made
separately for each species using the single-species cMonkey score.
The conserved core of the bicluster detected in step 2 is kept static
while species-specific additions, including both non-orthologous and
orthologous genes, to the conserved biclusters are discovered via this
iterative optimization. An optional step 4, not carried out in this
study, identifies purely species-specific biclusters for each organism
using the original cMonkey algorithm applied to genes not yet in
any conserved bicluster.
We have made the cMonkey and MScM code available including
tools for automating many of the data acquisition and processing
steps required for assembling an integrated dataset [55]. These tools
facilitate automatic queries to online biological databases for
association and upstream data, such as BioNetBuilder, Microbe-
sOnline [53], Prolinks [49], STRING [51,52] and RSAT [47,48].
All input and output are stored in a MySQL database to facilitate
use of the integrated dataset and MScM results by other tools. We
also include a manual mode with example inputs for the algorithm
both as flat files and as R data objects for those wishing to use data
not in public databases. These key changes to how data is imported
and stored in the MScM database and the core data-object for
cMonkey and MScM are critical novel changes to the code that are
required for multi-species integration and scaling of the code to
much larger datasets and organisms.
Visualizing multi-species clustering and biclustersWe created a database containing the MScM biclustering
analysis data compendium for a number of microbial species. Our
pipeline begins with several post-processing steps to convert
cMonkey output to Gaggle compatible formats. Enrichment of
functional annotations within biclusters is determined for each
bicluster and the bicluster is assigned any significant annotations
(p-values,0.05). A score is computed from the statistical
components of each bicluster (e.g. residual, functional enrichment
significance values). Specifically, the bicluster score is computed
using Stouffer’s z-score method for meta-analysis from a collection
of bicluster statistics. Data files are generated for the complete
bicluster network and the subnetwork of related biclusters before
the website for a result is generated. Lists of orthologous genes
between each species are generated as part of the analysis and
loaded into the synonym/ortholog database.
Multi-species extension of the GaggleTo mirror selections simultaneously in several tools that
visualize different aspects of the data, the results and the
comparison between species we utilize the Gaggle, a loosely
coupled system of web applications (geese) [21]. The Gaggle is a
software framework that integrates independent application tools
and biological data into an environment that allows the exchange
of data among tools. All of the tools employed in our resource are
Java web-starts or directly integrated into the web interface, thus
removing any barrier to use based on tool compatibility,
installation or data-transfer. The Gaggle also serves to coordinate
the deployment and interoperation of these Java Web Start tools.
Each individual application, or goose, can be launched with the
click of a button on the BiclusterCard. The geese included in the
resource are: a Global Synonym/Ortholog Translator, BioNet-
Builder (Cytoscape plug-in), the FireGoose, Data Matrix Viewer,
Annotations viewer, Cytoscape – bicluster network and gene
network viewers, and Sungear. All the tools are connected through
a communication hub called the Gaggle Boss, which passes simple
messages among the geese, called broadcasting, summarized in
Figure 1. When a broadcast is received, the goose will display the
relevant information for the data. BiclusterCards and online
databases (e.g. STRING, KEGG, etc.) connect to the tools
through the FireGoose, a browser plug-in for Firefox adding the
capability to communicate with the Gaggle. Embedded in each
BiclusterCard is microformat code containing metadata for
properties such as gene names, bicluster nodes, and condition
names that can be broadcasted to other geese. The Bicluster
Network viewer is a Cytoscape goose that displays a network of
bicluster interactions, where nodes are biclusters, and edges are
any shared properties (e.g. functional annotation, gene overlap,
etc). Similarly the Gene Associations viewer is a Cytoscape goose
that displays the gene associations from the data compendium. A
Data Matrix Viewer goose acts as a spreadsheet program that can
display and plot gene expression values. The Annotations goose
displays a table of the genes and their various annotations specific
to a single organism, for example, locus tag, gene name, protein id,
and gene id accession. There is a Global Synonyn/Ortholog
Translator that, given a list of genes from one species, can display
the orthologous genes from another species. Lastly, the MScM
output showing gene expression, gene subnetwork, sequence
bicluster, the bicluster score, bicluster residual, bicluster mean p-value (mean of all motifs found in the promoter sequences), and the E-value for eachmotif found in the bicluster. (B) Enrichment Summary tab for eco57 (top) and stm57 (bottom) displays a table with the following columns: Term/Pathway and Description. This table lists the most significant annotations from ontological enrichment tests of COG, KEGG pathway, and GOannotations. (C) The Functional Enrichment tab displays tables listing the significant annotations from the COG, GO and KEGG enrichment analyses.Shown is the KEGG pathway enrichment table for eco57 (top) and stm57 (bottom). The table consists of the following columns: Pathway, Description,and p-value. Each column can be sorted. (D) Core Gene tab for eco57 (top) and stm57 (bottom), showing the number of core genes (51), and a tablecontaining the following columns: Locus Tag, Gene Name, Description, GO annotations, KEGG annotations, and COG annotations. Locus Tag, GeneName and Description columns can be sorted.doi:10.1371/journal.pcbi.1002228.g003
Comparative Microbial Modules Resource
PLoS Computational Biology | www.ploscompbiol.org 6 December 2011 | Volume 7 | Issue 12 | e1002228

Figure 4. BiclusterCard components II: Bicluster Motifs, Upstream Patterns, Plots. Shown in the figure are, the expanded tab for Plotsdisplaying a gene expression heatmap, the expanded tab for Bicluster Motifs, and an example of the upstream motif patterns for multi-speciesbicluster E. coli – S. Typhimurium bicluster 57. (A) Example plot of a gene expression heatmap for the bicluster genes and conditions in eco57 (left)and stm57 (right); upregulated expression (green) and downregulated expression (red). (B) Putative regulatory sequence motifs found in biclustergene member promoters for eco57 (left) and stm57 (right). The table displays a row for each motif found and columns for the motif number, E-value,sequence logo, matches to any known motifs, and a link to motif pattern page. Eco57 motif #1 matches the known FNR binding sequence and motif#3 matches the known NarP binding sequence. (C) The promoter motif patterns for the motifs shown in (B) for eco57 (left) and stm57 (right). Thelocation of the motifs are represented by colored rectangles on the promoter sequence (black line) and the colors correspond to the logo bordercolors seen in (B); motif #1 (red), motif #2 (green) motif #3 (blue). For the bicluster gene members shown, bicluster motifs #1 and #3 appear in the
Comparative Microbial Modules Resource
PLoS Computational Biology | www.ploscompbiol.org 7 December 2011 | Volume 7 | Issue 12 | e1002228

motifs, and motif locations in promoter sequence, can be displayed
in the ClusterInfo Viewer.
The web and Gaggle interface to our multi-speciesbiclustering
A web interface was implemented to facilitate exploration of the
multi-species biclusters. The starting page allows users to create
several types of queries and contains a text box to input a gene
name or group of genes, select boxes to choose bicluster sets from
single and, core or elaborated MScM analyses, and a submit
button to begin the search for biclusters containing the gene or
genes of interest from the selected biclustering analyses (Figure 2A).
Any biclusters returned from a search are presented as a list
ranked by bicluster score. A first step in organizing the diverse
information contained in, and supporting each bicluster was to
create a system for generating bicluster summaries that link to
online tools and source data. To this end, for each bicluster, our
system creates a ‘BiclusterCard’. Each BiclusterCard provides the
following information in the form of expandable/collapsible tabs
(Figure 2B):
N Gaggle tools: Embedded links to integrated software tools
N Statistics: The number of genes and conditions in the bicluster,
score, residual, mean motifs p-value, motif E-values
N Enrichment Summary: based on the most significant annota-
tions from COG, KEGG and GO enrichment analysis
N Core Genes: Genes table for conserved core members of the
bicluster– including GO, KEGG, and COG gene annotations
N Elaborated Genes: Same as above, but for elaborated members
of the bicluster
N Experiments: Table with links to the meta-data and primary
articles
N Bicluster Motifs: if any motifs were found, the sequence logo is
displayed here along with matches to any known motifs
N Enrichment Analysis: Tables for GO, KEGG, and COG
annotation enrichment – with description and significance
values
N Related Biclusters: Table with links to biclusters with similar
functional/pathway annotations, similar motifs, or overlapping
gene members
N Plots: Bicluster plots for gene expression profiles, mean gene
expression, and expression heatmap
Each element of the bicluster card is generated automatically by
our system, is compatible with outputs from other widely used
biclustering tools, and provides links to descriptions/tutorials for
using the linked tools or databases.
Results/Discussion
Visualizing the entire multiple-species dataset and integrative
biclustering analysis at once, in a single view or tool, is
cumbersome and ineffective at conveying biologically useful
information due to the scale and multitude of different
relationships in the data and analysis. Therefore, a main goal of
our resource is to design an interface that provides access to the
MScM results and collected data compendium via multiple queries
(e.g. query by pathway, gene, network neighborhood, bicluster or
ontology term). Although multiple queries are possible it is
envisioned that a user will typically begin by querying for a gene
or group of genes and browse MScM gene modules. A user can
then begin exploring relationships between datasets for individual
genes, subnetworks of genes, among modules, or among modules
with particular shared attributes, such as, functional annotation.
The system also allows high-level manipulation of queries, i.e.
queries and operation on results of past queries, via Sungear.
Examining the intersections, complements, and unions of module
gene memberships, or identifying common promoter elements
among genes in a module or among modules can be performed
using Sungear following several broadcasts of gene lists. Gene lists
are typically the results of queries, neighbors in a network loaded
into the cytoscape goose, or the members of biclusters. These are
just few examples of how a user can use the resource. Moreover,
all of this functionality is automatically performed (mirrored)
across species multiple species datasets.
To demonstrate our resource’s capabilities, we explore nitrogen
metabolism associated multi-species biclusters with the specific
biological goal of identifying new genes functionally associated
with nitrogen metabolism in E. coli and S. Typhimurium. For a
global validation of our multi-species biclustering method and a
detailed comparison of our method to several other methods, as
well as a detailed description of the complete dataset used in this
study see the supplemental section (Text S1) provided in the
electronic version of this article. The CMMR is available at
http://meatwad.bio.nyu.edu/cmmr.html.
Exploring nitrogen metabolism in an E. coli and S.Typhimurium integrated genomics dataset
Nitrogen is an essential input into several metabolic pathways
including amino acid and nucleotide biosynthesis, and can act as a
terminal electron acceptor in dissimilatory nitrate reactions [56]. It
is common for some microbes including E. coli to use nitrogen for
energy-harvesting purposes in anaerobic and nutrient depleted
conditions [56]. A central component of nitrogen assimilation and
metabolism is nitrate reductase, a membrane bound enzyme that
catalyzes the conversion of nitrate to nitrite. The narGHJI operon
encodes the multiple subunits of nitrate reductase A in E. coli. The
following section sequentially guides the reader through using our
system to explore biclusters containing genes in the nar operon and
other nitrogen metabolism associated genes. A web tutorial for the
use of our system can also be found at: http://meatwad.bio.nyu.
edu/psbr/index.php/Tutorials
Identifying a potential role for unknown genes inbiclusters containing nar genes
We begin our exploration of identifying conserved biclusters
containing nar genes by searching for ‘‘narG’’ in the core set of
genes from an E. coli and S. Typhimurium MScM bicluster set
(Figure 2A). Explicitly, typing ‘narG’ into the gene-name textbox,
selecting the core checkbox and clicking ‘submit’ on the CMMR
start page, will retrieve any biclusters containing narG in the core
set of genes. The results page returned following our ‘‘narG’’
query includes a header with links to the CMMR wiki, links to
tutorials, a description of the search query and a list of any
retrieved biclusters, in this case 3 biclusters were found (Figure 2B).
There is a button for each bicluster that will display its
promoter regions of the eco57 members, whereas all three bicluster motifs appear in the promoters for the stm57 members. The identical motifpattern indicates MScM has determined them to be in an operon. It is known that narGHJI exist as an operon, but MScM has determined that yjjI is inan operon with yjjW (this is also predicted by [62]). However, yjjW is found only in the elaborated gene set of eco57 and it is not found in stm57.doi:10.1371/journal.pcbi.1002228.g004
Comparative Microbial Modules Resource
PLoS Computational Biology | www.ploscompbiol.org 8 December 2011 | Volume 7 | Issue 12 | e1002228

Figure 5. CMMR linked Gaggled tools I: Gene Network, Data Matrix Viewer, Bicluster Network. Expanding the Gaggle tools tab on theBiclusterCard for multi-species bicluster E. coli – S. Typhimurium bicluster 57, reveals a list of links (buttons) to the various Gaggle tools. (A) The GeneAssociations button opens a Cytoscape goose that displays the core genes subnetwork for eco57 (top) and stm57 (bottom). The nodes representgenes and edges represent associations based on data from the compendium, indicated in yellow is gene yjjI. Edges are shared annotations: COGcode (pink), Prolinks phylogenetic profile (purple), metabolic pathway (blue), operon (light cyan), and Predictome phylogenetic pattern (dark cyan).(B) The expression profiles for the genes and conditions from eco57 (top) and stm57 (bottom) can be explored by opening the Data Matrix Viewer.Using the FireGoose, the bicluster’s genes and conditions can be broadcast from the BiclusterCard. We can see how the expression profile of gene yjjI(indicated by the colored line) matches other profiles in the bicluster. (C) The Bicluster Network button opens a Cytoscape goose to display thecomplete bicluster network where each node is a bicluster (width and height proportional to number of genes and conditions, respectively) andedges represent any shared properties and annotations. We can explore the related bicluster subnetwork for bicluster 57 (yellow), eco57 (left) andstm57 (right), by broadcasting the list of related biclusters (using the FireGoose) from the BiclusterCard to select those biclusters and display them in
Comparative Microbial Modules Resource
PLoS Computational Biology | www.ploscompbiol.org 9 December 2011 | Volume 7 | Issue 12 | e1002228

BiclusterCard (see materials and methods). Looking at the first
BiclusterCard for E. coli bicluster-57 (eco57), we will click on the
‘Coupled Bicluster’ button to open the BiclusterCard for S.
Typhimurium bicluster 57 (stm57). Expanding the ‘Statistics’ tab
shows that eco57 contains 75 genes (51 core genes, 24 elaborated
genes), 226 experiments, whereas stm57 contains 66 genes (51 core
genes, 15 elaborated genes) and 43 experiments (Figure 3A). This
first table highlights differences in gene membership of the two
biclusters. The ‘Enrichment Summary’ shows similar but not
identical annotations involved in various metabolic activities
related to anaerobic respiration and energy production from
nitrogen for both biclusters (Figure 3B). The ‘Experiments’ tab
shows that expression of these genes changes under a variety of
conditions including: stress, growth on minimal media, anaerobic
metabolism, and DNA damage. Expanding the ‘Enrichment
Analysis’ tab displays tables containing significant COG, GO and
KEGG annotations. We can see that eco57 and stm57 differ in the
ranking of the KEGG pathway annotations and stm57 includes an
additional pathway (Figure 3C). This could reflect slightly different
uses of these modules in these organisms or discrepancies in the
gene annotations.
Then, looking at the gene GO, KEGG and COG annotations
by expanding the ‘Core Genes’ tab we see many genes have the
same or similar annotations and some have either none or
different annotations such as narG and yjjI (Figure 3D). Finally,
under the ‘Plots’ tab we can view plots for gene expression profiles,
bicluster mean expression, and an expression heatmap – to
visualize differences in clustering bicluster gene members
(Figure 4A).
Expanding the ‘Bicluster Motifs’ tab displays the motifs detected
in the bicluster. Two of the detected motifs for eco57 show
similarity to known nitrate/nitrite response transcriptional regu-
lator binding motifs (Figure 4B). Motif #1 matches the E. coli FNR
(fumarate and nitrate reduction) binding consensus sequence
(TTGAT N4 ATCAA) [57] and eco57 motif #3 corresponds to
the NarP binding sequence [58,59]. The sequence motifs of stm57
show no notable similarity to known motifs. The FNR homolog in
S. Typhimurium, oxaR, has a similar but less defined consensus
sequence [60], which could account for the lack of association with
stm57 motif #1. The promoter motif patterns display which gene
members share common motifs and the location in the gene’s
upstream sequence. Identical motif patterns indicate they are an
operon, such as operon narGHJI (Figure 4C). MScM and
MicrobesOnline [61,62] predict yjjI and yjjW to be in an operon,
which is reflected in eco57 (yjjW is present in the elaborated gene
set) but not stm57 (Figure 4C). Exploring the correspondence of
the MScM detected motifs with known nitrogen metabolism
motifs increases our level of confidence that this bicluster is truly
coregulated in both organisms.
Among the core gene list for this bicluster, yjjI is described only
as encoding a conserved protein with no functional annotation
(Figure 3D). To examine this gene in the context of multiple
network-types, the original data, and the biclustering, we now
open several Gaggle tools, including the bicluster and gene
network Cytoscape geese, Data Matrix Viewer and BioNetBuilder.
First, we explore associations between core gene members of
eco57 and stm57. For the 51 genes in the core gene member
subnetworks, eco57 has 518 associations and stm57 has 420 edges,
with no associations for yjjI (Figure 5A; associations shown are
operon edges, metabolic pathway edges, phylogenetic profile
edges, and protein interaction edges between genes in different
biclusters). Next, we explore the expression profiles of the bicluster
gene members and conditions by broadcasting them to the Data
Matrix Viewer. Selecting yjjI, we can see that it has similar
expression to other bicluster gene members (Figure 5B). Thus, the
data (sequence motifs, associations, expression) supports eco57 and
stm57 as coherent, putatively coregulated gene groups, and gene
yjjI, while lacking associations, is supported by common motifs and
correlated expression. We can use more Gaggle tools to search for
additional information characterizing the bicluster gene members,
particularly yjjI. For example, broadcasting the gene members to
BioNetBuilder, we can browse protein structure and functional
predictions. YjjI is predicted to have a domain structure that
matches a ‘‘Class III anaerobic ribonucleotide reductase NRDD
subunit’’ [63] and a function prediction of oxidoreductase activity
[64,65]. If we broadcast yjjI to other online databases such as
Entrez Gene [66], we find that yjjI is adjacent to yjjW, but no
information that they are in an operon. As mentioned above, both
MScM and MicrobesOnline have predicted them to be in an
operon. There is further information from EcoGene [67] reporting
yjjI as an ortholog of H. influenzae hi0521, which is a pflB homolog
and coding for a formate acetyltransferase [68]. Taken together,
this information suggests a role for YjjI in nitrogen metabolism. It
is important to note that a corresponding single-species bicluster in
E. coli was not found (in the E. coli single species cMonkey run we
find no bicluster with significant gene overlap to this significant
conserved bicluster), further illustrating the importance of the
MScM method. However, the species-specific elaborations of the
bicluster may display additional information, such as, individual
adaptations to this metabolic process.
Another possible use of our system is the exploration of
collections of biclusters to identify novel interactions among
modules. In the context of this example we can extract the
subnetwork of biclusters related to the nar bicluster described
above from a network that displays associations among biclusters
by broadcasting the list of biclusters related to the orthologous core
from the BiclusterCard to the Bicluster Network Viewer
(Figure 5C). Biclusters are nodes with width and height
proportional to the number of genes and conditions, respectively,
and shared significant KEGG pathway, COG function, and GO
function annotations are edges. The subnetwork shows 38 related
biclusters for E. coli and 33 biclusters for S. Typhimurium. In this
subnetwork there are several biclusters containing gene modules
highlighting complementary interactions such as: amino acid
biosynthesis/metabolism pathways and glutamate metabolism
(bicluster-61); NADH dehydrogenase, succinate dehydrogenase
(bicluster-43), citrate fermentation (bicluster-147), and amino acid
ABC-type transporters (bicluster-148). This highlights the presence
of conserved core interactions among eco57 and stm57 with other
modules and independent species-specific modifications within
these modules.
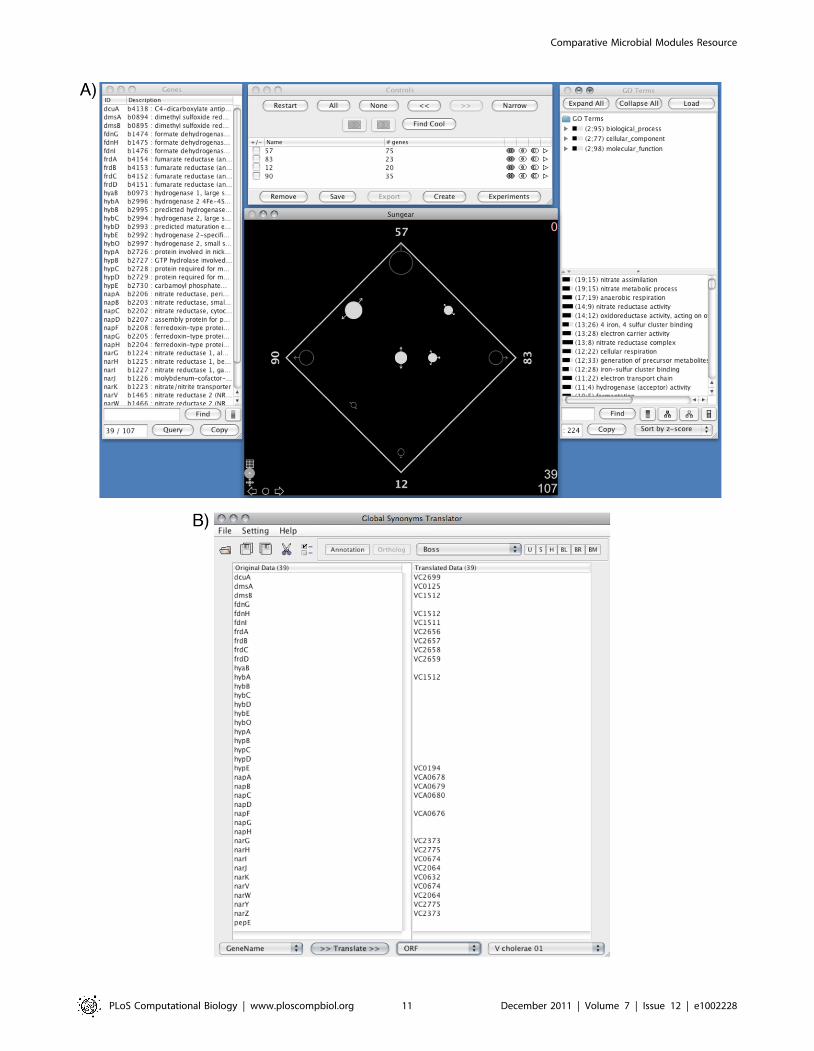
We can further explore nitrogen metabolism in the context of V.
cholerae. First, we launch the Sungear goose and the Global
Synonym/Ortholog Translator. From the subnetwork of related
biclusters we select bicluster 57 and the top 3 overlapping
biclusters (based on the ‘Related Biclusters -. Core Related’ table:
12, 83, 90). We then broadcast these 4 biclusters to the Sungear
goose, select all groups and create a Sungear plot (Figure 6A). Next
a new window. There are 10 additional biclusters in the eco57 subnetwork. Node fill color represents significant COG annotation, border colorrepresents significant GO annotation, node border thickness represents residual, and edge color represents shared COG (green) KEGG (red), or GO(blue) annotations.doi:10.1371/journal.pcbi.1002228.g005
Comparative Microbial Modules Resource
PLoS Computational Biology | www.ploscompbiol.org 10 December 2011 | Volume 7 | Issue 12 | e1002228
Comparative Microbial Modules Resource
PLoS Computational Biology | www.ploscompbiol.org 11 December 2011 | Volume 7 | Issue 12 | e1002228

we select the vessels that have intersections with bicluster 57,
yielding 39 genes. These E. coli genes are then broadcast to the
Global Synonym/Ortholog Translator where we obtain 24
orthologs in V. cholerae (Figure 6B). Now, we launch the V. cholerae
Bicluster Network Viewer by clincking the ‘B’ button on the
CMMR start page next to the E. coli – V. cholerae MScM analysis.
After the network has loaded, we highlight any biclusters
containing those genes by broadcasting the translated orthologs
to the bicluster network. This reveals 27 biclusters, of which only 3
are enriched for genes involved in nitrogen metabolism. Further
investigation of the E. coli – V. cholerae MScM analysis shows that
bicluster 109, a highly significant bicluster enriched for nitrogen
metabolism in E. coli (eco109) but not V. cholerae (vch109), is absent
from this list. Rather, vch109 is enriched for genes involved in
molybdate ion transport and sulfur metabolism. The genes
involved in nitrogen metabolism in eco109 are found in the
elaborated set and not in the conserved core. This could represent
a possible species-specific difference between these two organisms.
Using the CMMR, much knowledge was uncovered from the
search of just a single gene, narG. In one case, for a currently
uncharacterized gene, yjjI, the gathering of diverse information
such as: putative orthology between two species, co-expression and
common putative regulatory motifs with other bicluster genes, and
a prediction for the protein’s structure and function, was facilitated
by the various BiclusterCards and Gaggle tools.
ConclusionsWe have developed a publicly accessible web resource for
comparative genomics studies of several prokaryotic organisms,
with plans to expand this resource over time. As described above,
in our example with coupled E. coli – S. Typhimurium bicluster 57,
the combination of our method for simultaneously biclustering
multiple datasets from multiple species and easy to use exploration
system quickly led to novel biological insights and generate an
informed hypothesis about the involvement of gene yjjI, a currently
uncharacterized gene, in nitrogen metabolism. The complexity
and richness of the results of comparative genomics data analysis
requires a system like the one presented here. We present specific
examples of the use of our system in the hopes of sparking
discussion about what the next generations of comparative
genomics analysis and visualization systems should look like.
Our paper focuses on the combined, multi-tool interface required
by biologists wishing to explore the biological significance and
function of multi-species, multi-datatype biclusters and their
species-specific elaborations and deletions. An important aspect
of our system is the ability to submit new data for analysis and
integrate the results into the resource for public access. We provide
multiple avenues for researchers wishing to build this system for
their species of interest, such as publicly available tools and code,
and/or we will run our analysis and build this system for
researchers without computational resources.
The CMMR wiki is intended to be a platform for information
exchange, encouraging the contributions of researchers who use
the resource, whether via curation or suggestions of new tools.
Improvements to the resource could be made 1) in method
development, for example, further optimization of the MScM
algorithm and inclusion of additional analysis methods, 2) as
datasets become available, increasing the number of included
species, and 3) as further development and invention of intuitive
visualization and exploration tools manifest. This effort could also
serve as a framework for applications to comparative biclustering
of eukaryotic organisms.
Supporting Information
Text S1 Supporting information. The supporting informa-
tion file includes descriptions of: the E. coli – S. Typhimurium
dataset analyzed, pseudocode for the MScM algorithm, validation
of the method’s performance on the E. coli – S. Typhimurium
dataset, and the highlighted biclusters.
(DOC)
Author Contributions
Conceived and designed the experiments: TK PW RB. Performed the
experiments: TK PW. Analyzed the data: TK PW. Wrote the paper: TK
PE RB. Designed the CMMR and BiclusterCards, collected and
standardized datasets analyzed, generated results visualizations: TK.
Implemented and tested the method: PW. Aided in the testing the
resource: AB. Oversaw all biological aspects of the project, contributed to
the validation and visualization of the results: PE. Oversaw all aspects of
the project: RB.
References
1. Altschul SF, Madden TL, Schaffer AA, Zhang J, Zhang Z, et al. (1997) Gapped
BLAST and PSI-BLAST: a new generation of protein database search
programs. Nucleic Acids Res 25: 3389–3402.
2. Chikina MD, Troyanskaya OG (2011) Accurate quantification of functional
analogy among close homologs. PLoS Comput Biol 7: e1001074.
3. Ihmels J, Bergmann S, Berman J, Barkai N (2005) Comparative gene expression
analysis by differential clustering approach: application to the Candida albicans
transcription program. PLoS Genet 1: e39.
4. Lu Y, Huggins P, Bar-Joseph Z (2009) Cross species analysis of microarray
expression data. Bioinformatics 25: 1476–1483.
5. Stuart JM, Segal E, Koller D, Kim SK (2003) A gene-coexpression network for
global discovery of conserved genetic modules. Science 302: 249–255.
6. Tanay A, Regev A, Shamir R (2005) Conservation and evolvability in regulatory
networks: the evolution of ribosomal regulation in yeast. Proc Natl Acad Sci U S A
102: 7203–7208.
7. Tirosh I, Bilu Y, Barkai N (2007) Comparative biology: beyond sequence
analysis. Curr Opin Biotechnol 18: 371–377.
8. Baitaluk M, Qian X, Godbole S, Raval A, Ray A, et al. (2006) PathSys: integrating
molecular interaction graphs for systems biology. BMC Bioinformatics 7: 55.
9. Brown KR, Otasek D, Ali M, McGuffin MJ, Xie W, et al. (2009) NAViGaTOR:
Network Analysis, Visualization and Graphing Toronto. Bioinformatics 25:
3327–3329.
10. Birkland A, Yona G (2006) BIOZON: a system for unification, management and
analysis of heterogeneous biological data. BMC Bioinformatics 7: 70.
Figure 6. CMMR linked Gaggled tools II: Sungear and Global Synonym/Ortholog Translator. The Sungear goose is a visualization toolcapable of displaying set relationships and operations (intersections, complements, unions). In this case, sets are gene lists from a gaggle broadcast.(A) Four biclusters were broadcast to Sungear: eco57, eco83, eco12, and eco90. Each bicluster is represented as a vertex or anchor on the square andthe circles, called vessels, represent the intersection of elements, in this case, bicluster gene members (bottom center window). Selected are fourcircles (filled circles) representing the intersections of gene members for bicluster 57 with the other three biclusters, 83, 12, and 90. The list of genesfrom the selected sets is seen in the gene list window (left window). Manipulation of the sets is done through the control window (top centerwindow). Over representation of GO terms are shown in the GO term window (right window). (B) The list of 39 E. coli genes (left panel) was broadcastto the Global Synonym/Ortholog Translator to find 24 putative orthologous genes (right panel) in V. cholerae.doi:10.1371/journal.pcbi.1002228.g006
Comparative Microbial Modules Resource
PLoS Computational Biology | www.ploscompbiol.org 12 December 2011 | Volume 7 | Issue 12 | e1002228

11. Birkland A, Yona G (2006) BIOZON: a hub of heterogeneous biological data.
Nucleic Acids Res 34: D235–242.12. Kuntzer J, Blum T, Gerasch A, Backes C, Hildebrandt A, et al. (2006) BN++ -A
Biological Information System. J Integr Bioinformatics 3: 34.
13. Kohler J, Baumbach J, Taubert J, Specht M, Skusa A, et al. (2006) Graph-basedanalysis and visualization of experimental results with ONDEX. Bioinformatics
22: 1383–1390.14. Breitkreutz BJ, Stark C, Tyers M (2003) Osprey: a network visualization system.
Genome Biol 4: R22.
15. Gehlenborg N, O’Donoghue SI, Baliga NS, Goesmann A, Hibbs MA, et al.(2010) Visualization of omics data for systems biology. Nat Methods 7: S56–68.
16. Berg J, Lassig M (2006) Cross-species analysis of biological networks by Bayesianalignment. Proc Natl Acad Sci U S A 103: 10967–10972.
17. Bergmann S, Ihmels J, Barkai N (2004) Similarities and differences in genome-wide expression data of six organisms. PLoS Biol 2: E9.
18. Reiss DJ, Baliga NS, Bonneau R (2006) Integrated biclustering of heterogeneous
genome-wide datasets for the inference of global regulatory networks. BMCBioinformatics 7: 280.
19. Tanay A, Sharan R, Kupiec M, Shamir R (2004) Revealing modularity andorganization in the yeast molecular network by integrated analysis of highly
heterogeneous genomewide data. Proc Natl Acad Sci U S A 101: 2981–2986.
20. Waltman P, Kacmarczyk T, Bate AR, Eichenberger P, Bonneau R (2010) Multi-species integrative biclustering. Genome Biol 11: R96.
21. Shannon PT, Reiss DJ, Bonneau R, Baliga NS (2006) The Gaggle: an open-source software system for integrating bioinformatics software and data sources.
BMC Bioinformatics 7: 176.22. Poultney CS, Gutierrez RA, Katari MS, Gifford ML, Paley WB, et al. (2007)
Sungear: interactive visualization and functional analysis of genomic datasets.
Bioinformatics 23: 259–261.23. Cline MS, Smoot M, Cerami E, Kuchinsky A, Landys N, et al. (2007)
Integration of biological networks and gene expression data using Cytoscape.Nat Protoc 2: 2366–2382.
24. Tanay A, Sharan R, Shamir R (2002) Discovering statistically significant
biclusters in gene expression data. Bioinformatics 18 Suppl 1: S136–144.25. Li G, Ma Q, Tang H, Paterson AH, Xu Y (2009) QUBIC: a qualitative
biclustering algorithm for analyses of gene expression data. Nucleic Acids Res37: e101.
26. Ihmels J, Bergmann S, Barkai N (2004) Defining transcription modules usinglarge-scale gene expression data. Bioinformatics 20: 1993–2003.
27. Prelic A, Bleuler S, Zimmermann P, Wille A, Buhlmann P, et al. (2006) A
systematic comparison and evaluation of biclustering methods for geneexpression data. Bioinformatics 22: 1122–1129.
28. Huttenhower C, Flamholz AI, Landis JN, Sahi S, Myers CL, et al. (2007)Nearest Neighbor Networks: clustering expression data based on gene
neighborhoods. BMC Bioinformatics 8: 250.
29. Ben-Dor A, Chor B, Karp R, Yakhini Z (2003) Discovering local structure ingene expression data: the order-preserving submatrix problem. J Comput Biol
10: 373–384.30. Cheng Y, Church GM (2000) Biclustering of expression data. Proc Int Conf
Intell Syst Mol Biol 8: 93–103.31. Kluger Y, Basri R, Chang JT, Gerstein M (2003) Spectral biclustering of
microarray data: coclustering genes and conditions. Genome Res 13: 703–716.
32. Supper J, Strauch M, Wanke D, Harter K, Zell A (2007) EDISA: extractingbiclusters from multiple time-series of gene expression profiles. BMC Bioinfor-
matics 8: 334.33. Ulitsky I, Shamir R (2007) Identification of functional modules using network
topology and high-throughput data. BMC Syst Biol 1: 8.
34. Tirosh I, Barkai N (2007) Comparative analysis indicates regulatory neofunctio-nalization of yeast duplicates. Genome Biol 8: R50.
35. Elemento O, Slonim N, Tavazoie S (2007) A universal framework for regulatoryelement discovery across all genomes and data types. Mol Cell 28: 337–350.
36. Bonneau R, Facciotti MT, Reiss DJ, Schmid AK, Pan M, et al. (2007) A
predictive model for transcriptional control of physiology in a free living cell.Cell 131: 1354–1365.
37. Avila-Campillo I, Drew K, Lin J, Reiss DJ, Bonneau R (2007) BioNetBuilder:automatic integration of biological networks. Bioinformatics 23: 392–393.
38. Bare JC, Shannon PT, Schmid AK, Baliga NS (2007) The Firegoose: two-wayintegration of diverse data from different bioinformatics web resources with
desktop applications. BMC Bioinformatics 8: 456.
39. Barrett T, Edgar R (2006) Gene expression omnibus: microarray data storage,submission, retrieval, and analysis. Methods Enzymol 411: 352–369.
40. Edgar R, Domrachev M, Lash AE (2002) Gene Expression Omnibus: NCBIgene expression and hybridization array data repository. Nucleic Acids Res 30:
207–210.
41. Brazma A, Parkinson H, Sarkans U, Shojatalab M, Vilo J, et al. (2003)ArrayExpress–a public repository for microarray gene expression data at the
EBI. Nucleic Acids Res 31: 68–71.
42. Parkinson H, Kapushesky M, Kolesnikov N, Rustici G, Shojatalab M, et al.
(2009) ArrayExpress update–from an archive of functional genomics experi-
ments to the atlas of gene expression. Nucleic Acids Res 37: D868–872.
43. Hubble J, Demeter J, Jin H, Mao M, Nitzberg M, et al. (2009) Implementation
of GenePattern within the Stanford Microarray Database. Nucleic Acids Res 37:
D898–901.
44. Sherlock G, Hernandez-Boussard T, Kasarskis A, Binkley G, Matese JC, et al.
(2001) The Stanford Microarray Database. Nucleic Acids Res 29: 152–155.
45. Faith JJ, Driscoll ME, Fusaro VA, Cosgrove EJ, Hayete B, et al. (2008) Many
Microbe Microarrays Database: uniformly normalized Affymetrix compendia
with structured experimental metadata. Nucleic Acids Res 36: D866–870.
46. Kanehisa M, Goto S, Kawashima S, Nakaya A (2002) The KEGG databases at
GenomeNet. Nucleic Acids Res 30: 42–46.
47. Thomas-Chollier M, Sand O, Turatsinze JV, Janky R, Defrance M, et al. (2008)
RSAT: regulatory sequence analysis tools. Nucleic Acids Res 36: W119–127.
48. van Helden J (2003) Regulatory sequence analysis tools. Nucleic Acids Res 31:
3593–3596.
49. Bowers PM, Pellegrini M, Thompson MJ, Fierro J, Yeates TO, et al. (2004)
Prolinks: a database of protein functional linkages derived from coevolution.
Genome Biol 5: R35.
50. Mellor JC, Yanai I, Clodfelter KH, Mintseris J, DeLisi C (2002) Predictome: a
database of putative functional links between proteins. Nucleic Acids Res 30:
306–309.
51. Jensen LJ, Kuhn M, Stark M, Chaffron S, Creevey C, et al. (2009) STRING 8–a
global view on proteins and their functional interactions in 630 organisms.
Nucleic Acids Res 37: D412–416.
52. Snel B, Lehmann G, Bork P, Huynen MA (2000) STRING: a web-server to
retrieve and display the repeatedly occurring neighbourhood of a gene. Nucleic
Acids Res 28: 3442–3444.
53. Dehal PS, Joachimiak MP, Price MN, Bates JT, Baumohl JK, et al. (2009)
MicrobesOnline: an integrated portal for comparative and functional genomics.
Nucleic Acids Res. pp gkp919.
54. Remm M, Storm CE, Sonnhammer EL (2001) Automatic clustering of orthologs
and in-paralogs from pairwise species comparisons. J Mol Biol 314: 1041–1052.
55. Waltman P, Kuppusamy TK, Bonneau R (2010) cMonkey2. Available: http://
billy.cs.nyu.edu/projects/cmonkey.
56. Stanley JT, Gunsalus RP, Lory S, Perry JJ (2007) Biosynthesis of Monomers,
Nitrogen Assimilation. In: Stanley JT, ed. Microbial Life. Second Edition ed.
SunderlandMA: Sinauer Associates Inc. pp 278–282.
57. Winteler HV, Haas D (1996) The homologous regulators ANR of Pseudomonas
aeruginosa and FNR of Escherichia coli have overlapping but distinct
specificities for anaerobically inducible promoters. Microbiology 142(Pt 3):
685–693.
58. Kazakov AE, Cipriano MJ, Novichkov PS, Minovitsky S, Vinogradov DV, et al.
(2007) RegTransBase–a database of regulatory sequences and interactions in a
wide range of prokaryotic genomes. Nucleic Acids Res 35: D407–412.
59. Gama-Castro S, Salgado H, Peralta-Gil M, Santos-Zavaleta A, Muniz-
Rascado L, et al. (2011) RegulonDB version 7.0: transcriptional regulation of
Escherichia coli K-12 integrated within genetic sensory response units (Gensor
Units). Nucleic Acids Res 39: D98–105.
60. Fink RC, Evans MR, Porwollik S, Vazquez-Torres A, Jones-Carson J, et al.
(2007) FNR is a global regulator of virulence and anaerobic metabolism in
Salmonella enterica serovar Typhimurium (ATCC 14028s). J Bacteriol 189:
2262–2273.
61. Alm EJ, Huang KH, Price MN, Koche RP, Keller K, et al. (2005) The
MicrobesOnline Web site for comparative genomics. Genome Res 15:
1015–1022.
62. Price MN, Huang KH, Alm EJ, Arkin AP (2005) MicrobesOnline Operon
Predictions for Escherichia coli str. K-12 substr. MG1655. Available: http://
www.microbesonline.org/operons/gnc511145.html.
63. Fontecave M, Eliasson R, Reichard P (1989) Oxygen-sensitive ribonucleoside
triphosphate reductase is present in anaerobic Escherichia coli. Proc Natl Acad
Sci U S A 86: 2147–2151.
64. Malmstrom L, Riffle M, Strauss CE, Chivian D, Davis TN, et al. (2007)
Superfamily assignments for the yeast proteome through integration of structure
prediction with the gene ontology. PLoS Biol 5: e76.
65. Riffle M, Malmstrom L, Davis TN (2005) The Yeast Resource Center Public
Data Repository. Nucleic Acids Res 33: D378–382.
66. Maglott D, Ostell J, Pruitt KD, Tatusova T (2005) Entrez Gene: gene-centered
information at NCBI. Nucleic Acids Res 33: D54–58.
67. Rudd KE (2000) EcoGene: a genome sequence database for Escherichia coli K-
12. Nucleic Acids Res 28: 60–64.
68. Kolker E, Makarova KS, Shabalina S, Picone AF, Purvine S, et al. (2004)
Identification and functional analysis of ‘hypothetical’ genes expressed in
Haemophilus influenzae. Nucleic Acids Res 32: 2353–2361.
Comparative Microbial Modules Resource
PLoS Computational Biology | www.ploscompbiol.org 13 December 2011 | Volume 7 | Issue 12 | e1002228