Comparative genome analysis of a large Dutch Legionella pneumophila strain collection identifies...
11
Yzerman et al. BMC Genomics 2010, 11:433 http://www.biomedcentral.com/1471-2164/11/433 Open Access RESEARCH ARTICLE © 2010 Yzerman et al; licensee BioMed Central Ltd. This is an Open Access article distributed under the terms of the Creative Commons Attribution License (http://creativecommons.org/licenses/by/2.0), which permits unrestricted use, distribution, and reproduction in any medium, provided the original work is properly cited. Research article Comparative genome analysis of a large Dutch Legionella pneumophila strain collection identifies five markers highly correlated with clinical strains Ed Yzerman , Jeroen W Den Boer , Martien Caspers , Arpit Almal , Bill Worzel , Walter van der Meer , Roy Montijn and 1 1 2 3 3 4 2 Frank Schuren* 2 Abstract Background: Discrimination between clinical and environmental strains within many bacterial species is currently underexplored. Genomic analyses have clearly shown the enormous variability in genome composition between different strains of a bacterial species. In this study we have used Legionella pneumophila, the causative agent of Legionnaire's disease, to search for genomic markers related to pathogenicity. During a large surveillance study in The Netherlands well-characterized patient-derived strains and environmental strains were collected. We have used a mixed-genome microarray to perform comparative-genome analysis of 257 strains from this collection. Results: Microarray analysis indicated that 480 DNA markers (out of in total 3360 markers) showed clear variation in presence between individual strains and these were therefore selected for further analysis. Unsupervised statistical analysis of these markers showed the enormous genomic variation within the species but did not show any correlation with a pathogenic phenotype. We therefore used supervised statistical analysis to identify discriminating markers. Genetic programming was used both to identify predictive markers and to define their interrelationships. A model consisting of five markers was developed that together correctly predicted 100% of the clinical strains and 69% of the environmental strains. Conclusions: A novel approach for identifying predictive markers enabling discrimination between clinical and environmental isolates of L. pneumophila is presented. Out of over 3000 possible markers, five were selected that together enabled correct prediction of all the clinical strains included in this study. This novel approach for identifying predictive markers can be applied to all bacterial species, allowing for better discrimination between strains well equipped to cause human disease and relatively harmless strains. Background Identifying the genetic factors that influence the patho- genic potential of microorganisms is of the greatest importance in trying to gain better control of infectious diseases. Legionella pneumophila, the causative micro- organism of Legionnaires' disease (LD), is an aquatic bac- terium that can be found in numerous water sources. Several aerosol-producing systems have become associ- ated with LD outbreaks (including cooling towers, sau- nas, and whirlpool spas). The financial, economic and social impacts of these outbreaks can be enormous and many countries have implemented governmental laws or guidelines to prevent the growth of Legionella bacteria in potential sources. In most regulations, disinfection strat- egies are used independent of the isolated Legionella strains, as there is no reliable method for differentiating between clinical and environmental strains. In The Neth- erlands, this has led to a confounding situation in which, despite an estimated expenditure of several billion euros since 1999 (when 32 people died in a single outbreak of LD; [1]) the incidence of LD has steadily increased [2]. One explanation for this might be the lack of focus in combating Legionella risks: all Legionella species are con- sidered equally dangerous, with no attention being given to clinical data on LD, even though over 95% of LD cases * Correspondence: [email protected] 2 Department of Microbiology, TNO, Zeist, the Netherlands Full list of author information is available at the end of the article
Transcript of Comparative genome analysis of a large Dutch Legionella pneumophila strain collection identifies...

Yzerman et al. BMC Genomics 2010, 11:433http://www.biomedcentral.com/1471-2164/11/433
Open AccessR E S E A R C H A R T I C L E
Research articleComparative genome analysis of a large Dutch Legionella pneumophila strain collection identifies five markers highly correlated with clinical strainsEd Yzerman , Jeroen W Den Boer , Martien Caspers , Arpit Almal , Bill Worzel , Walter van der Meer , Roy Montijn and 1 1 2 3 3 4 2
Frank Schuren*2
AbstractBackground: Discrimination between clinical and environmental strains within many bacterial species is currently underexplored. Genomic analyses have clearly shown the enormous variability in genome composition between different strains of a bacterial species. In this study we have used Legionella pneumophila, the causative agent of Legionnaire's disease, to search for genomic markers related to pathogenicity. During a large surveillance study in The Netherlands well-characterized patient-derived strains and environmental strains were collected. We have used a mixed-genome microarray to perform comparative-genome analysis of 257 strains from this collection.
Results: Microarray analysis indicated that 480 DNA markers (out of in total 3360 markers) showed clear variation in presence between individual strains and these were therefore selected for further analysis. Unsupervised statistical analysis of these markers showed the enormous genomic variation within the species but did not show any correlation with a pathogenic phenotype. We therefore used supervised statistical analysis to identify discriminating markers. Genetic programming was used both to identify predictive markers and to define their interrelationships. A model consisting of five markers was developed that together correctly predicted 100% of the clinical strains and 69% of the environmental strains.
Conclusions: A novel approach for identifying predictive markers enabling discrimination between clinical and environmental isolates of L. pneumophila is presented. Out of over 3000 possible markers, five were selected that together enabled correct prediction of all the clinical strains included in this study. This novel approach for identifying predictive markers can be applied to all bacterial species, allowing for better discrimination between strains well equipped to cause human disease and relatively harmless strains.
BackgroundIdentifying the genetic factors that influence the patho-genic potential of microorganisms is of the greatestimportance in trying to gain better control of infectiousdiseases. Legionella pneumophila, the causative micro-organism of Legionnaires' disease (LD), is an aquatic bac-terium that can be found in numerous water sources.Several aerosol-producing systems have become associ-ated with LD outbreaks (including cooling towers, sau-nas, and whirlpool spas). The financial, economic andsocial impacts of these outbreaks can be enormous and
many countries have implemented governmental laws orguidelines to prevent the growth of Legionella bacteria inpotential sources. In most regulations, disinfection strat-egies are used independent of the isolated Legionellastrains, as there is no reliable method for differentiatingbetween clinical and environmental strains. In The Neth-erlands, this has led to a confounding situation in which,despite an estimated expenditure of several billion eurossince 1999 (when 32 people died in a single outbreak ofLD; [1]) the incidence of LD has steadily increased [2].One explanation for this might be the lack of focus incombating Legionella risks: all Legionella species are con-sidered equally dangerous, with no attention being givento clinical data on LD, even though over 95% of LD cases
* Correspondence: [email protected] Department of Microbiology, TNO, Zeist, the NetherlandsFull list of author information is available at the end of the article
© 2010 Yzerman et al; licensee BioMed Central Ltd. This is an Open Access article distributed under the terms of the Creative CommonsAttribution License (http://creativecommons.org/licenses/by/2.0), which permits unrestricted use, distribution, and reproduction inany medium, provided the original work is properly cited.
Yzerman et al. BMC Genomics 2010, 11:433http://www.biomedcentral.com/1471-2164/11/433
Page 2 of 11
are caused by L. pneumophila. Furthermore, within thespecies L. pneumophila, serogroup 1 is involved in over80% of cases [3]. As has already been demonstrated withguinea pig models in the 1980s, some serogroup 1 sub-types are more virulent than others [4]. This difference invirulence across serogroups and subtypes appears to bedue mainly to the better-developed replicating and apop-tosis skills of L. pneumophila strains, especially in sero-group 1 [5]. Epidemiological studies have also providedsome clues on virulence. A particular lipopolysaccharideepitope, recognized as MAb 2 by typing with a panel ofmonoclonal antibodies obtained from a range of geo-graphical locations, is more frequently expressed onpatient derived isolates than on environmental isolates ofserogroup 1 strains. Furthermore, fingerprinting of L.pneumophila strains has shown that the genotypes of iso-lates from patients and from the environment differmarkedly [6] indicating that a genetic base for differencesin virulence does exist. However, the nature of thisgenetic base has been fully unclear until now. Alsogenomic analysis of 217 L. pneumophila strains collectedworld-wide could not identify specific hybridization pro-files differentiating clinical and environmental strains [7].To identify molecular markers related to virulent behav-ior, we have combined two different worlds. We usedcomparative genome hybridization (CGH) based on amixed-strain microarray containing genetic informationfrom both clinical and environmental isolates. Thismolecular analysis was performed with a large collectionof well-described bacterial isolates derived from a largesurveillance study in The Netherlands in which bothpatient-derived strains and environmental strains werecollected. We investigated whether the application ofsuch a molecular analysis on a well-defined strain collec-tion was capable of identifying DNA markers that wouldallow for discrimination between clinical and environ-mental isolates. In this way we have identified five mark-ers that together constitute a model highly predictive forclinical strains.
ResultsStrain collectionThe basis of this study is formed by the strain collectionfrom the Dutch Legionella surveillance program. Thiscollection encompasses all patient-derived strains fromnotified cases in The Netherlands in the period from2002-2006 and all environmental strains that were col-lected in an attempt to identify the source of infection forthose patients. The L. pneumophila isolates from thepatients' environments were genotypically comparedwith the patient strain. Non-matching isolates from theenvironment were defined as environmental. Patientstrains and matching isolates from the environment weredefined as clinical. The collection of environmental
strains was completed with isolates from sources locatedin surroundings geographically free of LD patientsaccording to the registration history of notified cases. AllL. pneumophila strains were serotyped, and the sero-group 1 isolates were analyzed by Amplified FragmentLength Polymorphism (AFLP) analysis according to theEuropean Working Group on Legionella Infections(EWGLI) format [8]. In total, 257 strains from this collec-tion of clinical and environmental L. pneumophila iso-lates were selected for further analysis in this study (seeadditional file 1). A representative part of this selection(102 isolates) was analyzed by AFLP (Figure 1). A broadvariety of patterns is present, indicating the genomicdiversity within this species and the random selection ofthe isolates from the natural genomic diversity of L. pneu-mophila strains.
Microarray construction and unsupervised analysisComparative genome hybridization experiments wereperformed with a mixed-genome L. pneumophilamicroarray. For the construction of this microarray, eightL. pneumophila strains were selected based on theirdiversity (both patient-derived and environmental strainswere used; for details see additional file 1). This microar-ray consisting of 3360 genomic fragments was used toanalyze the genome composition of the collection of 257unique L. pneumophila strains by comparing labeledDNA from each strain with a reference containing labeledDNA from the mixture of strains used for array construc-tion. In total, 346 datasets were generated each represent-ing a fingerprint encompassing over 3000 differentmarkers. The data for all spots on all microarrays werecalculated as ratios between the tester strain and the ref-erence with normalization for experimental differences(for details see methods section). These data were usedfor unsupervised statistical analysis of the relationshipsbetween all strains with respect to genomic composition.Principal component analysis of all 346 CGH-data setsresulted in a good overview and allowed us to draw anumber of conclusions important for follow-up work.First, results from repeat experiments (89 in total, repre-senting both technical and biological replicates) showedthe high reproducibility of this approach (data notshown). Next, this analysis also showed that the overallgenomic patterns (consisting of over 3000 markers perstrain) of the environmental L. pneumophila isolates werefound throughout the distribution of the patternsobtained from the patient-derived strains (Figure 2), indi-cating that no genome wide differences between the twogroups exist. Furthermore, no small outlier populationsor single outlier strains were observed with the exceptionof a small number of datasets obtained from Legionellaspecies other than L. pneumophila. These strains werenot present in the 257 strain dataset and were excluded

Yzerman et al. BMC Genomics 2010, 11:433http://www.biomedcentral.com/1471-2164/11/433
Page 3 of 11
from all further analyses. This result indicated to us thatthe genomic diversity of the species was well covered bythe 257 selected strains and that there was no need foranalyzing additional strains.
Marker reduction and binarizationUnsupervised statistical analysis of the data obtained forthe 257 strains did not allow for discrimination betweenclinical and environmental strains. Since these analysesare based on overall trends in data this inability to dis-criminate is not surprising. It is much more likely that asmall part of the genome is involved in a specific genetictrait such as pathogenic potential. Therefore, supervisedmultivariate statistical analysis of the complete data setwas also used in order to find support for the hypothesisthat discrimination between clinical and environmentalstrains is feasible. Although this analysis indicated thatdiscrimination was possible the method used for thisanalysis (partial least square discriminant analysis) wasnot optimally suited for reliable statistical significanceanalysis, nor for selecting a minimal set of predictivemarkers. Therefore, a different data analysis approachwas taken. First, the number of markers was reducedbased on the observation that approximately 80% of the3,000 markers were present in all strains and thereforeencompassed the L. pneumophila core genome. Theremaining 20% of the markers showed clear variation inpresence between individual strains and encompassedthe variable part of the genome. Further reduction of thenumber of markers was achieved by taking only a fewrepresentatives in those cases where multiple markersshowed nearly identical patterns over the complete dataset (strongly suggesting partial overlap or close linkage inthe genome). In total, 480 markers were selected in this
Figure 1 AFLP analysis of L. pneumophila serogroup 1 isolates. AFLP analysis shows genomic diversity between a representative sub-set of 102 L. pneumophila strains used for further analysis in this study. For each strain serogroup type (Sg.) and assigned EWGLI-type are shown. The variety of patterns and presence of several different EWGLI-types indicates the random selection of strains representing the natu-ral genomic diversity within this species.
Figure 2 Genomic diversity based on Principal Component Anal-ysis (PCA). All 346 microarray data sets (linearly distributed values used, based on the selection of 480 markers) were subjected to Princi-pal Component Analysis to determine whether this would lead to sub-grouping of patient-derived or environmental strains of L. pneumophila. Each data set is represented as a single dot in an n-di-mensional space of which the three main components (covering most of the overall variation covered within these data) are shown. It is clear from this analysis that no clear differences between environmental and patient-derived strains are detected based on overall genome composition.

Yzerman et al. BMC Genomics 2010, 11:433http://www.biomedcentral.com/1471-2164/11/433
Page 4 of 11
way and this selection was used for all further analyses(additional files 2 and 3).
Next to reducing the number of markers another pre-processing step was included. Closer examination of theselected markers in most cases suggested a binary distri-bution of values, most likely representing either theapparent presence or absence (or presence but with a lowsequence homology preventing hybridization) of specificgenetic elements. Since this binary distribution probablyrepresents the real-world situation among strains andalso favors the practical applicability of analyzing selectedmarkers, we decided to continue our analyses by convert-ing our linearly distributed data into binary values repre-senting the presence or absence of each marker. Anumber of methods have been described in recent yearsto perform binarization of markers, but none of theseperformed sufficiently well. Some of these methods arerather simple, being based on a preset cut-off (e.g. 0.5) ora standard deviation-based classification. We tried themore advanced GACK approach [9] based on the shapeof signal ratio distributions; although this method workedreasonably well in general, we were not satisfied by itsoverall performance. One possible explanation for this isthe fact that this method was developed for single strain(genome) microarrays whereas the microarray used inthis study is based on multiple genomes. Another expla-nation is the fact that the generalization of cut-off selec-tion, which is also part of this method, leads tounsatisfactory results for part of the data. We thereforehad a closer look at our data and found an alternativesolution which is based on the distribution of all ratios foreach individual marker to determine an individualmarker-dependent cut-off value. In cases where no clearcut-off could be determined all data points were classifiedas being present. In cases where multiple cut-offs werepossible we decided to apply multiple cut-offs by splittingup these markers and using these multiple variants of thesame marker for further data analysis. Other availablebinarization methods tend to ignore this last category inparticular. Some examples of this binarization approachare shown in additional file 4. Binarized data are given inadditional files 5 and 6. Hierarchical clustering of thebinarized data shows the enormous amount of variationstill present in this data set (Figure 3). A number of con-clusions can be drawn from this analysis. First, althoughsome clustering can be observed for the strains for whichAFLP data were generated this clustering does not indi-cate segregation into specific groups (Figure 3). Next, theabsence of clear discrimination between environmentalstrains and patient-derived strains is visualized (Figure 3).Finally, the distribution of strains used as training andtest set (described in more detail in the next section)shows a fair amount of random variation (Figure 3). Nosingle markers were detected which enabled clear dis-
crimination between patient-derived and environmentalstrains based on the overall datasets. Since no clear dis-crimination between environmental and patient-derivedstrains was obtained with these unsupervised analysesattention was shifted towards the application of super-vised analyses. The binary data were used as input datafor these analyses.
Selection of discriminating markersMany supervised statistical analysis methods have beendescribed for analyzing microarray data [10]. A limitationof many of these methods is the fact that they use a datareduction approach which makes it difficult to select aminimal set of markers. We have chosen as a method forselecting a minimal set of predictive markers a machinelearning technique called Genetic Programming [11-13].Genetic Programming (GP) is a machine learningapproach that provides a collection of solutions to biodi-agnostic problems by creating classifier programs using asubset of the available input. A "genetic pool" of candidateclassification programs was created by randomly choos-ing inputs and arithmetic and Boolean operators thatwork with the inputs selected, and evolving successivegenerations of programs were through selection andrecombination. The accuracy of a program in correctlyclassifying the samples according to pre-specified classesis used to calculate a fitness measure for each program.Fitness was determined by calculating the area under thecurve (AUC) for the receiver operating characteristic(ROC) of a program generated by the GP system [14].Evolution was driven by improving the AUC (fitnessscore) so as to yield rules with high sensitivity and speci-ficity. The complexity of the rules generated was alsorestricted to prevent overfitting of the training data. Theprograms were evolved over many generations resultingin progressively better and more accurate programs. Thestopping criterion was either a perfect classifier withinthe limits of program size and complexity, or the genera-tion limit was reached. Table 1 shows a list of the inputs,operators, and GP parameters such as fitness function,population size, crossover and mutation frequencies, etc.
The genetic programming system used is a patentedsystem [15] and adapted for use in bio-classifier problemssuch as that described here. The source code for thisimplementation has not been published, but other thanthe representation of programs, it is a fairly standardimplementation of steady-state genetic programmingusing both crossover and mutational operators on tree-like structures. This system was adapted to evolve classi-fier programs by creating mathematical models andassigning a slice point based on maximizing the AUC forthe model [16].
Reducing the dimensionality of the data is of foremostimportance in most analysis programs. Here we have

Yzerman et al. BMC Genomics 2010, 11:433http://www.biomedcentral.com/1471-2164/11/433
Page 5 of 11
used gene frequency (i.e. the count of 'gene occurrences'in the best performing rules), to identify the markers thatprovide the most value for developing an accurate classi-fier, an approach that borrows from the "symbolic dis-criminant analysis" method [17]. Cross-validation-basedresampling [18] was used to estimate the ability of theclassifier to generalize to unseen samples, giving anapproximation of its robustness. Classifier sets (ensem-bles) are composed from the best rules from each fold.The ensemble is then "polled" with each rule in theensemble voting on whether a sample belongs to a targetclass. If the majority of the rules (in this case four ormore) agree that the sample belongs to the target class (inthis case, clinical), the ensemble predicts the samplebelongs to the target class. Aggregate performance ofthese ensembles on the test folds was taken as the predic-
tor of the classification error, and the selected ensemblewas the one with the smallest test error.
The approach used for the Legionella strain data was asfollows:
First, the data set was split in two: a learning set of 133samples was used for creating a predictive model and areserved validation set consisting of 213 samples was keptapart for testing of the model. Using the 133 samples(representing 109 unique strains) from the learning set,which was classified as approximately 50% clinical and50% environmental, a predictive rule was developed thatidentified clinical strains. The goal was to identify 100%of the clinical strains correctly while keeping the numberof misclassified environmental strains as low as possible(i.e., maximizing sensitivity while minimizing the loss ofspecificity). To do this, the control parameters of the
Figure 3 Genomic diversity based on hierarchical clustering analysis. Hierarchical clustering analysis was performed on all 346 genomic datasets generated in this study. Data were clustered both in columns (representing datasets) and rows (representing 480 spots on the array) with Pearson correlation distances and average linkage. Binarized data were used for this analysis. Yellow represents absence of signal, black represents presence of signal. The color-coded bars on the bottom show the distribution of the strains used for AFLP analysis as shown in Figure 1 (red) and the additional strains (yellow-green), the distribution of patient (orange) and environmental (blue) strains and the distribution of training (purple) and test (green) set strains. In all cases the random distribution of the groups is clearly visible.
Yzerman et al. BMC Genomics 2010, 11:433http://www.biomedcentral.com/1471-2164/11/433
Page 6 of 11
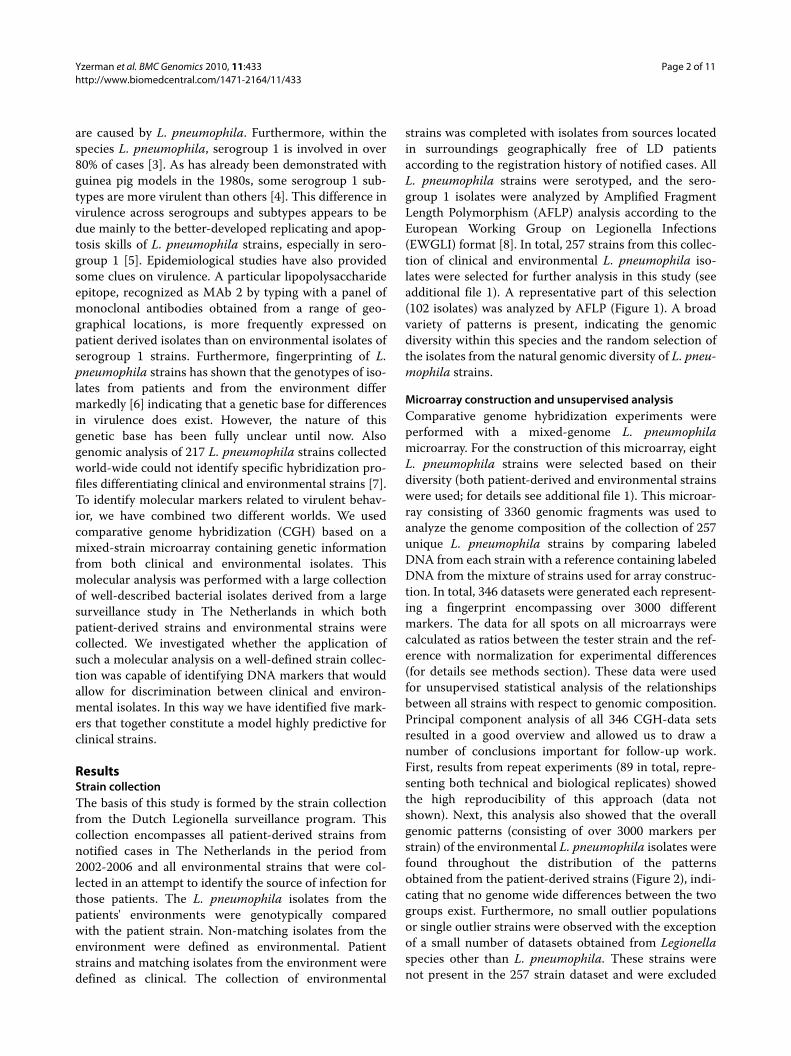
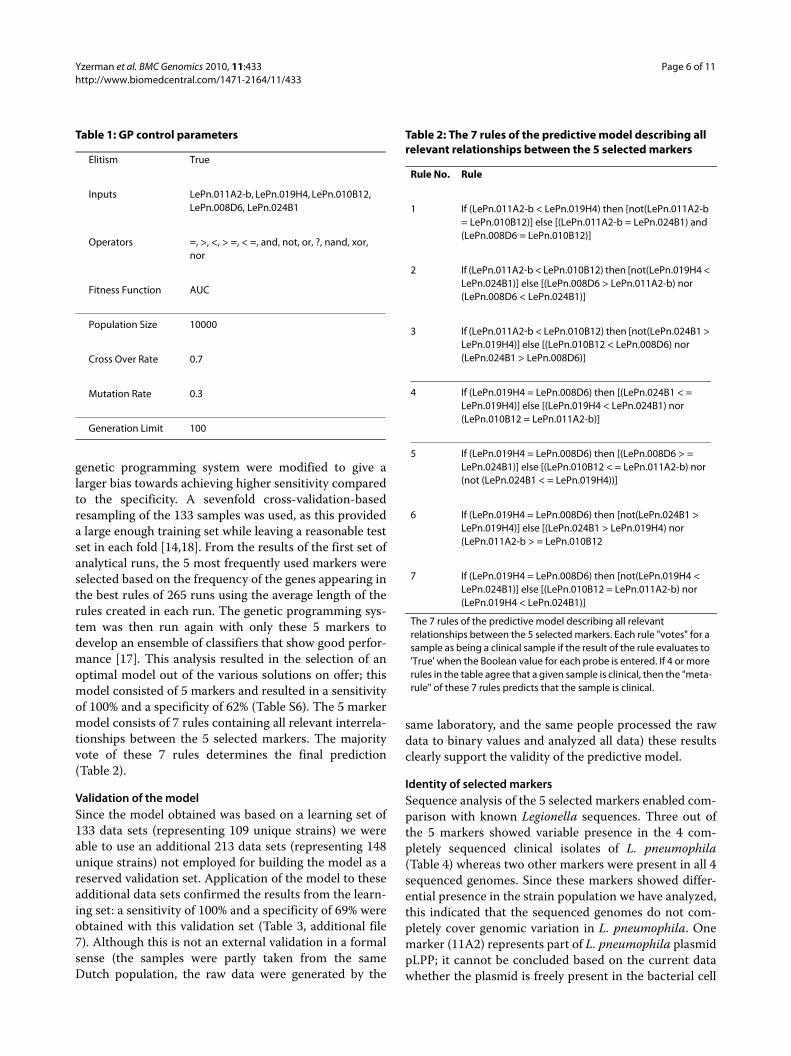
genetic programming system were modified to give alarger bias towards achieving higher sensitivity comparedto the specificity. A sevenfold cross-validation-basedresampling of the 133 samples was used, as this provideda large enough training set while leaving a reasonable testset in each fold [14,18]. From the results of the first set ofanalytical runs, the 5 most frequently used markers wereselected based on the frequency of the genes appearing inthe best rules of 265 runs using the average length of therules created in each run. The genetic programming sys-tem was then run again with only these 5 markers todevelop an ensemble of classifiers that show good perfor-mance [17]. This analysis resulted in the selection of anoptimal model out of the various solutions on offer; thismodel consisted of 5 markers and resulted in a sensitivityof 100% and a specificity of 62% (Table S6). The 5 markermodel consists of 7 rules containing all relevant interrela-tionships between the 5 selected markers. The majorityvote of these 7 rules determines the final prediction(Table 2).
Validation of the modelSince the model obtained was based on a learning set of133 data sets (representing 109 unique strains) we wereable to use an additional 213 data sets (representing 148unique strains) not employed for building the model as areserved validation set. Application of the model to theseadditional data sets confirmed the results from the learn-ing set: a sensitivity of 100% and a specificity of 69% wereobtained with this validation set (Table 3, additional file7). Although this is not an external validation in a formalsense (the samples were partly taken from the sameDutch population, the raw data were generated by the
same laboratory, and the same people processed the rawdata to binary values and analyzed all data) these resultsclearly support the validity of the predictive model.
Identity of selected markersSequence analysis of the 5 selected markers enabled com-parison with known Legionella sequences. Three out ofthe 5 markers showed variable presence in the 4 com-pletely sequenced clinical isolates of L. pneumophila(Table 4) whereas two other markers were present in all 4sequenced genomes. Since these markers showed differ-ential presence in the strain population we have analyzed,this indicated that the sequenced genomes do not com-pletely cover genomic variation in L. pneumophila. Onemarker (11A2) represents part of L. pneumophila plasmidpLPP; it cannot be concluded based on the current datawhether the plasmid is freely present in the bacterial cell
Table 2: The 7 rules of the predictive model describing all relevant relationships between the 5 selected markers
Rule No. Rule
1 If (LePn.011A2-b < LePn.019H4) then [not(LePn.011A2-b = LePn.010B12)] else [(LePn.011A2-b = LePn.024B1) and (LePn.008D6 = LePn.010B12)]
2 If (LePn.011A2-b < LePn.010B12) then [not(LePn.019H4 < LePn.024B1)] else [(LePn.008D6 > LePn.011A2-b) nor (LePn.008D6 < LePn.024B1)]
3 If (LePn.011A2-b < LePn.010B12) then [not(LePn.024B1 > LePn.019H4)] else [(LePn.010B12 < LePn.008D6) nor (LePn.024B1 > LePn.008D6)]
4 If (LePn.019H4 = LePn.008D6) then [(LePn.024B1 < = LePn.019H4)] else [(LePn.019H4 < LePn.024B1) nor (LePn.010B12 = LePn.011A2-b)]
5 If (LePn.019H4 = LePn.008D6) then [(LePn.008D6 > = LePn.024B1)] else [(LePn.010B12 < = LePn.011A2-b) nor (not (LePn.024B1 < = LePn.019H4))]
6 If (LePn.019H4 = LePn.008D6) then [not(LePn.024B1 > LePn.019H4)] else [(LePn.024B1 > LePn.019H4) nor (LePn.011A2-b > = LePn.010B12
7 If (LePn.019H4 = LePn.008D6) then [not(LePn.019H4 < LePn.024B1)] else [(LePn.010B12 = LePn.011A2-b) nor (LePn.019H4 < LePn.024B1)]
The 7 rules of the predictive model describing all relevant relationships between the 5 selected markers. Each rule "votes" for a sample as being a clinical sample if the result of the rule evaluates to 'True' when the Boolean value for each probe is entered. If 4 or more rules in the table agree that a given sample is clinical, then the "meta-rule" of these 7 rules predicts that the sample is clinical.
Table 1: GP control parameters
Elitism True
Inputs LePn.011A2-b, LePn.019H4, LePn.010B12, LePn.008D6, LePn.024B1
Operators =, >, <, > =, < =, and, not, or, ?, nand, xor, nor
Fitness Function AUC
Population Size 10000
Cross Over Rate 0.7
Mutation Rate 0.3
Generation Limit 100

Yzerman et al. BMC Genomics 2010, 11:433http://www.biomedcentral.com/1471-2164/11/433
Page 7 of 11
or whether (part of ) the plasmid DNA is inserted in thegenome. The other 4 markers represent chromosomallyderived fragments probably related to cell wall synthesis(19H4 lipopolysaccharide synthesis, 10B12 CMP-N-acetylneuraminic acid synthetase), conjugative couplingfactor (24B1) and hypothetical (8D6). Details on thesemarkers will be presented elsewhere.
DiscussionTo study the genomic diversity within L. pneumophila inmore detail a mixed-genome microarray was developedfor this species. This approach has shown to be very use-ful for studying genome diversity in other bacterial spe-
cies such as Streptococcus pyogenes and Enterococcusfaecium [19,20]. By selecting clinical as well as environ-mental strains for microarray construction gene loss andacquisition in both groups of strains can be identified.This is a clear advantage over the more commonly usedgenome-sequencing approach which mostly focuses onclinical strains, thereby dismissing the ability to identifydifferences between environmental and clinical strains.Here we show the feasibility of this discrimination for L.pneumophila, the causative microorganism for Legion-naires' disease. Clinical isolates of this bacterial speciescould be identified in 100% of the cases based on a modelconsisting of 5 DNA markers. This result will enable amore detailed analysis of Legionella-contaminated watersources and help to recognize potential public healthdangers before the onset of new LD outbreaks.
To achieve this result, two factors are of utmost impor-tance: the use of an unbiased genomics approach and theavailability of a well-defined and well-characterized bac-terial strain collection. When studying pathogenicity, theavailability of clinical strains is relatively straightforward,especially if a surveillance program is ongoing, as is thecase in The Netherlands for L. pneumophila. Collectingreliable environmental strains, however, is far more diffi-cult. Probably the biggest issue in considering a strain asnon-pathogenic is the question of whether the specificisolate lacks the potential to be pathogenic or just did nothave a chance to exhibit pathogenic behavior. In the caseof the Dutch Legionella surveillance program, not onlywere patient isolates collected, but also attempts weremade to track the infectious source by analyzing the envi-ronment in which a patient lived. This was done by ana-lyzing hot water systems in homes and water systems incaravans used by patients, and analyzing swimmingpools, saunas and other potential sources visited by
Table 3: Prediction results when testing the data obtained on a set of 148 unique L. pneumophila strains with the statistical five marker model built with 109 unique strains
Patient derived Environmental Total
Positive Test result 34 35 69
Negative Test result 0 79 79
Total 34 114 148
sensitivity 100%
specificity 69%
Table 4: Sequence homologies of the 5 predictive markers when compared to available sequences for L. pneumophila strains Paris (lpp), Philadelphia (lpg), Lens (lpl), Corby (LPC) and L. pneumophila str. Paris plasmid (plpp)
Marker name Homologues in available genome sequences
11A2 plpp0001
19H4 lpp0831; lpg0766; lpl0807; LPC_2526
10B12 lpp0816/0817; lpg0750/0751; lpl0787/10788; LPC_2541/2542
24B1 lpp2398/2399; LPC_1880/1881
8D6 lpg0514; lpl0552
Absence of homologues indicates that no high similarity homologue is present. The sequences are accessible through GenBank accession numbers HM584933-HM584937).

Yzerman et al. BMC Genomics 2010, 11:433http://www.biomedcentral.com/1471-2164/11/433
Page 8 of 11
patients shortly before getting ill. In a number of cases amatch could be made between an environmental isolateand the patient isolate but, in most cases, isolates identi-fied in a patient's environment were shown to be differentfrom the patient strain. It seems very likely that thepatient in these cases had been in contact with the spe-cific environmental isolate and did not become ill, but didbecome ill from another isolate; this, in combination withthe registration history of notified cases for those poten-tial sources, leads us to conclude that this is the safest def-inition currently possible for non-pathogenic strains.Therefore, we have used this strain collection for agenomic analysis of differences between clinical and envi-ronmental strains, while understanding that it is still pos-sible for an environmental strain to be pathogenic.
We have generated genomic fingerprints for 257 uniqueL. pneumophila strains and used these to select DNAmarkers enabling discrimination between clinical andenvironmental L. pneumophila strains. The rationalebehind this approach is the hypothesis that bacterial spe-cies are not a homogeneous group of organisms but con-tain significant individual variation at the nucleotide level(single nucleotide polymorphisms) and at the genomecomposition level (one or more genes, operons, and soon). In order to analyze genome composition variation,we have developed our genomotyping platform. Whenapplied to pathogenic micro-organisms this type of analy-sis might lead to more detailed discrimination betweenthe real pathogenic strains within such a species and thenon- (or far less) pathogenic strains. Since genomic dif-ferences between bacterial strains probably lead to physi-ological differences, better ability to discriminatebetween strains may lead to better understanding of thepathogenicity process itself and to more focused diagno-sis, treatment or therapy. In many cases, the major hurdlefor applying this approach is the lack of well-character-ized bacterial strain collections. In the case of L. pneumo-phila, we were fortunate to have access to a very well-characterized strain collection with respect to clinical aswell as non-clinical (environmental) isolates. The use ofthis strain collection combined with our genomotypingplatform and novel way of analyzing genomic data has ledto the selection of five DNA markers that together candiscriminate between clinical and environmental L. pneu-mophila strains with high reliability. Genetic program-ming was instrumental in the selection of this minimalset of predictive markers and in the definition of the rela-tionships between the individual markers. The inclusionof these relationships is an essential step since a univari-ate approach looking at each marker individually wouldnever have selected some of our five markers. In addition,some markers are important because they are nearlyalways absent in clinical strains and would never havebeen identified if environmental strains had not been
included during array construction. These aspects areoften ignored when identifying predictive markers, butthey fit perfectly with the kind of relationships that play acentral role in biology.
Attempts have been made previously to identify patho-genicity markers by, e.g., comparing the complete genomesequences of clinical and environmental strains. The dis-advantage of such an approach is the fact that there areusually dozens to hundreds of differences detected, only afew of which may be important with regard to the prop-erty under study. Furthermore, in most cases there is anemphasis on the clinical strains (for example: fourgenomic sequences are publicly available for L. pneumo-phila, all for clinical strains [21,22]. Without the ability tocompare these to environmental strains it will be very dif-ficult to reach a better understanding of pathogenicity. Toreally start to understand pathogenicity a population-based approach is necessary. This kind of approach hasbeen used for epidemiology research in microbiology, butthe methods used in those cases (Pulsed Field Gel Elec-trophoresis, Restriction Fragment Length Polymorphism,AFLP) have only a limited resolution, or they have a highresolution but focus on genes not involved in pathogenic-ity (Multi Locus Sequence Typing (also known asSequence Based Typing) of core genome/house-keepinggenes [23,24]. Cazalet et al [7] described a multigenomicanalysis of a large number of Legionella strains, but theiraim was not to select a minimal set of predictive markers.Furthermore, their analysis was based on a microarrayderived from genomic sequences of clinical strains only.In the work presented here, a combination of two differ-ent approaches was used, combining a population-basedview with a detailed molecular analysis. When performedas described here, this is a technically feasible and rela-tively inexpensive way to identify predictive markers.There are multiple ways to translate these markers intopractical applications which, in this case, can have a sig-nificant impact on control of LD. Dutch regulations arefocused on finding legionellae in water systems, espe-cially in relation to vulnerable populations in care facili-ties, but also in relation to hotels and public buildings.Positive cultures of water samples call for immediateaction, including implementation of costly measures andpotential closing of wards or buildings. The ability to dif-ferentiate between clinical and environmental strains canbe used as a tool to fine-tune control procedures. Fur-thermore, in the case of L. pneumophila as well as othermicro-organisms, the described technique may act as astarting point for the development of new diagnosticsand therapeutics.
ConclusionsIn conclusion, a novel way of studying the genome com-position of L. pneumophila combined with the availability

Yzerman et al. BMC Genomics 2010, 11:433http://www.biomedcentral.com/1471-2164/11/433
Page 9 of 11
of a L. pneumophila strain collection derived from a sur-veillance program allowed us to search for genomic dif-ferences between patient-derived and environmentalstrains of this bacterium. By using genetic programming5 markers could be selected which together enable a reli-able identification of clinical strains. This opens up theway for novel diagnostic approaches better suited to rec-ognize clinical L. pneumophila strains. This may also helpto improve the confounding situation that despiteincreased awareness and preventive measures the inci-dence of LD is still increasing in The Netherlands. Fur-thermore, detailed analysis of the identified markers maylead to better understanding of L. pneumophila virulenceand to improved protective measures.
MethodsStrainsAll strains used in the research described here are derivedfrom the National Outbreak Detection Program [25].Detailed information on the strains can be found in addi-tional file 1.. In this Table the strains are divided intothree groups: the strains used to construct the genomiclibrary and the microarray, the strains used to develop thepredictive model (also referred to as training set) and thestrains used to test the model (also referred to as test set).
Genomic analysisComparative genome hybridization experiments wereperformed with a mixed-genome L. pneumophilamicroarray. For the construction of this microarray, eightL. pneumophila strains were selected based on theirdiversity (serotype and origin, see additional file 1).Genomic DNA of these strains was isolated, mixed inequimolar amounts, sheared to approximately 1.5 kbfragments and used for construction of a genomic libraryin pSMART (Lucigen), as earlier described [19,20]. Atotal of 3,360 recombinant clones were collected; insertswere amplified and spotted on aldehyde-coated glassslides, as described previously [19,20]. Sequencing ofamplicons of randomly selected clones confirmed thepresence of L. pneumophila specific fragments.
This microarray (which theoretically had more than fullgenome coverage) was used to analyze the genome com-position of the collection of 257 unique Legionella strainsby comparing labeled DNA from each strain with a refer-ence containing labeled DNA from the mixture of strainsused for array construction (see below for labelingdetails). This leads to a fingerprint encompassing over3,000 different markers for each strain. The total numberof experiments performed for the training and test setswere 133 and 213 respectively (adding up to 346 in total),but since this includes replicates (both technical and bio-logical) most calculations are based on a selection ofunique strains only. In total 257 unique strains have been
used for the work described here: 109 strains in the train-ing set and 148 in the test set. In Table S1 all 133 and 213experiments are given together with strain names andreplicate indications. Experiments for which the samestrain name is given multiple times represent technicalreplicates, whereas experiments for which strain namesare different but the same replicate number is shown rep-resent biological replicates (with the exception of repli-cate number 0 which indicates unique data sets).Reproducibility of the analysis was tested by runningmultiple repeat experiments (duplicate or triplicate anal-yses of identical strains).
The genomic DNA of specific L. pneumophila strainswas labeled fluorescently with Cy5-dUTP using theBioPrime system (Invitrogen). Reference DNA (0.5 μgfrom the mix used for microarray construction) waslabeled with Cy3-dUTP. Both sets of samples werehybridized on pre-hybridized microarrays overnight at42°C. For scanning, a ScanArray TM Express (PackardBioScience) was used. Quantification of hybridizationsignals was done using ImaGene version 5.6 software(BioDiscovery).. To correct for differences in labeling,hybridization conditions, slide quality, and scanning cir-cumstances, each slide was normalized independently. Atfirst, ratios of Cy5 minus background to Cy3 minus back-ground were calculated. Filtering was applied to excludespots with flags; for estimating the correction factor innormalization, only spots were included with Cy3 valueslarger than two times background. Mean ratios were thencalculated and applied to each independent ratio result-ing in normalized ratios for each spot. After obtaining fullarray data for 133 isolates, a selection of markers showingvariation between individual strains was made. In total480 markers were selected, 18 of which represented con-stant (always present) markers which were needed to nor-malise data between microarrays. The other 462 markersall represent markers showing clear variation in presencebetween individual strains. The number of 480 markerswas chosen for practical reasons since this number fittedwithin the microarray format used for the further experi-ments which was a multi-well microarray, allowing forhigher throughput. All data for the test set strains wereobtained from those multi-well microarrays. All proto-cols for labeling, hybridization and quantificationremained unchanged. Normalisation between microar-rays was now based on the results obtained for the 18constant markers by calculating mean ratios based onthese markers only and applying the normalisation factorthen to each independent ratio resulting in normalizedratios for each spot. Normalised raw data for both thetraining (133 dataset) and test (213 dataset) sets are givenin additional files 2 and 3.
Hierarchical clustering of differentiating biomarkersfrom all strains was done with TIGR software (available at

Yzerman et al. BMC Genomics 2010, 11:433http://www.biomedcentral.com/1471-2164/11/433
Page 10 of 11
http://www.tigr.org/software/tm4, [26]), using averagelinkage and Pearson correlation as distance matrix.
Conversion of data to binary valuesA closer look at the data obtained for the variable mark-ers showed that the binary nature of the data distributionover the strain population was evident. We developed anovel approach for binarization which works as follows.First, we scaled our data symmetrically around 1 using acalculation (if R > 1 then 2-1/R) in which R is the ratio ofspecific strain signal divided by the reference pool signal(we introduced Rlim for this which was calculated with theExcel formula Rlim = if(R < 1, R, 2-1/R). In this way allratios are in the 0-2 range centered around 1 in which lowvalues are nearing 0 and high values are nearing 2. Then,we ordered all data for each spot in an increasing row andplotted these values (see additional file 4 for examples).We performed this separately for the training set (133values) and the test set (213 values). Next, we empiricallydetermined the cut-off for each spot from these plots andclassified all individual datapoints as being absent (0) orpresent (1), based on this cut-off. In cases where no clearcut-off could be determined, all datapoints were classifiedas being present (1). In cases where multiple cut-offs werepossible, we decided to apply all cut-offs by splitting upthese markers and using all variants for further data anal-ysis. An example of such a situation is shown in addi-tional file 4, panel D, which a data distribution whichclearly suggests a triple distribution of data. It is temptingto speculate that such a distribution could represent amarker which is either absent, present in a single copy orpresent in multiple copies in a specific L. pneumophilastrain. One of the markers in the five marker model(11A2-b) in fact shows this distribution and this markerappears to represent part of a plasmid. Attempts weremade to automate the binarisation process: this workedout for a single cut-off but not for multiple cut-offs. Bina-rized data for both the training (133 dataset) and test (213dataset) sets are given in additional files 5 and 6.
Selection of discriminating markersGenetic programming analysis was performed with 133data sets. Careful examination of all the data showed thatthis set of 133 contained 109 unique strains. The redun-dancy was caused mainly by the inclusion of replicateexperiments (both technically and biologically). Thesame was true for the reserved test set which originallycontained 213 data sets; this decreased to 160 whenremoving replicates and to 148 when data sets overlap-ping the training set were also removed. Additional file 7shows that the inclusion of these replicate data sets didnot significantly influence the stability or predictive valueof the model. A shows the outcome when all individualdata sets were considered unique, B shows the outcome
when replicate experiments were removed and C showsthe outcome when data sets overlapping between thetraining and test sets were removed from the test set.
Additional material
AbbreviationsLD: Legionnaire's disease; CGH: Comparative Genome Hybridization
Authors' contributionsEY, JWdB, WvdM, RM and FS designed the project. EY and JdB collected all bacte-rial strains and collected data, MC, RM and FS developed the microarray, col-lected all microarray data and performed data preprocessing and processing.AA and BW identified predictive markers by performing Genetic programminganalysis on microarray data. FS and EY wrote the paper. All authors discussedthe results and commented on the manuscript.All authors have read and approved the final manuscript
AcknowledgementsWe are indebted to Alie de Kat Angelino, Mieke Havekes, Michel Ossendrijver, Jos van der Vossen, Rik Thijssen, Adrie Atsma, Simon in't Veld and Jacob Bruin for practical support to various aspects of the work described. We would like to thank one of the anonymous reviewers for useful suggestions to further improve the manuscript.
Author Details1Regional Public Health Laboratory of Haarlem, Haarlem, the Netherlands, 2Department of Microbiology, TNO, Zeist, the Netherlands, 3Genetics Squared, Ann Arbor, MI 48108, USA and 4Vitens Research, Leeuwarden, the Netherlands
References1. Den Boer JW, Yzerman EP, Schellekens J, Lettinga KD, Boshuizen HC, Van
Steenbergen JE, Bosman A, Van den Hof S, Van Vliet HA, Peeters MF, Van Ketel RJ, Speelman P, Kool JL, Conyn-Van Spaendonck MA: A large outbreak of Legionnaires' disease at a flower show, the Netherlands, 1999. Emerg Infect Dis 2002, 8:37-43.
2. Versteegh JF, Brandsema PS, Van der Aa NG, Dik HH, De Groot GM: Evaluation of the Dutch Water Supply Act: Legionella prevention. RIVM Report 2007, 703719020: [http://www.rivm.nl/bibliotheek/rapporten/703719020.html].
3. Doleans A, Aurell H, Reyrolle M, Lina G, Freney J, Vandenesch F, Etienne J, Jarraud S: Clinical and environmental distributions of Legionella strains in France are different. J Clin Microbiol 2004, 42:458-460.
4. Bollin GE, Plouffe JF, Para MF, Prior RB: Difference in virulence of environmental isolates of Legionella pneumophila. J Clin Microbiol 1985, 21:674-677.
5. Alli OA, Zink S, Von Lackum NK, Abu-Kwaik Y: Comparative assessment of virulence traits in Legionella spp. Microbiology 2003, 149:631-641.
Additional file 1 SupplTable1 List of strains. list of strains used in this work.Additional file 2 supplTable2 rawdatatrainingset. non-binarized microarray data used as a trainingset for constructing the predictive model.Additional file 3 supplTable3 rawdatatestset. non-binarized microarray data used as a testset for validating the predictive model.Additional file 4 Supplementary Figure 1 binarisation examples. Fig-ure showing examples of the binarization process used for the microarray data.Additional file 5 supplTable4 binarizeddatatrainingset. binarized microarray data used as a trainingset for constructing the predictive model.Additional file 6 supplTable5 binarizeddatatestset. binarized microar-ray data used as a testset for validating the predictive model.Additional file 7 supplementary table 6. performance of the predictive model with different sets of data used.
Received: 23 February 2010 Accepted: 15 July 2010 Published: 15 July 2010This article is available from: http://www.biomedcentral.com/1471-2164/11/433© 2010 Yzerman et al; licensee BioMed Central Ltd. This is an Open Access article distributed under the terms of the Creative Commons Attribution License (http://creativecommons.org/licenses/by/2.0), which permits unrestricted use, distribution, and reproduction in any medium, provided the original work is properly cited.BMC Genomics 2010, 11:433

Yzerman et al. BMC Genomics 2010, 11:433http://www.biomedcentral.com/1471-2164/11/433
Page 11 of 11
6. Harrison TG, Doshi N, Fry NK, Joseph CA: Comparison of clinical and environmental isolates of Legionella pneumophila obtained in the UK over 19 years. Clin Microbiol Infect 2007, 13:78-85.
7. Cazalet C, Jarraud S, Ghavi-Helm Y, Kunst F, Glaser P, Etienne J, Buchrieser C: Multigenome analysis identifies a worldwide distributed epidemic Legionella pneumophila clone that emerged within a highly diverse species. Genome Res 2008, 18:431-441.
8. Fry NK, Bangsborg JM, Bergmans A, Bernander S, Etienne J, Franzin L, Gaia V, Hasenberger P, Baladrón Jiménez B, Jonas D, Lindsay D, Mentula S, Papoutsi A, Struelens M, Uldum SA, Visca P, Wannet W, Harrison TG: Designation of the European Working Group on Legionella Infection (EWGLI) amplified fragment length polymorphism types of Legionella pneumophila serogroup 1 and results of intercentre proficiency testing using a standard protocol. Eur J Clin Microbiol Infect Dis 2002, 21:722-728.
9. Kim CC, Joyce EA, Chan K, Falkow S: Improved analytical methods for microarray-based genome-composition analysis. Genome Biol 2002, 3:RESEARCH0065.
10. Schwender H, Ickstadt K, Rahnenfuehrer J: Classification with high-dimensional genetic data: assigning patients and genetic features to known classes. Biom J 2008, 50:911-926.
11. Mitra AP, Almal AA, George B, Fry DW, Lenehan PF, Pagliarulo V, Cote RJ, Datar RH, Worzel WP: The use of genetic programming in the analysis of quantitative gene expression profiles for identification of nodal status in bladder cancer. BMC Cancer 2006, 6:159.
12. Langdon WB, Buxton BF: Genetic programming for mining DNA chip data from cancer patients. Genetic Programming and Evolvable Machines 2004, 5:251-257.
13. Yu J, Yu J, Almal AA, Dhanasekaran SM, Ghosh D, Worzel WP, Chinnaiyan AM: Feature Selection and Molecular Classification of Cancer Using Genetic Programming. Neoplasia 2007, 9:292-303.
14. Zou KH, Hall WJ, Shapiro DE: Smooth non-parametric receiver operating characteristic (ROC) curves for continuous diagnostic tests. Stat Med 1997, 16:2143-2156.
15. Worzel WP: Method and system for genetic programming. U S Pat 2001. 6,327,582.
16. Driscoll JA, Worzel B, MacLean D: Classification of Gene Expression Data with Genetic Programming. In Genetic Programming Theory and Practice Edited by: Riolo RL, Worzel B. Kluwer; 2003:25-42.
17. Moore JH, Parker JS, Hahn LW: Symbolic Discriminant Analysis for Mining Gene Expression Patterns. Lecture Notes in Artificial Intelligence 2001, 2167:372-381.
18. Schaffer C: Selecting a classification method by cross-validation. Machine Learning 1993, 13:135-143.
19. Vlaminckx BJ, Schuren FH, Montijn RC, Caspers MP, Fluit AC, Wannet WJ, Schouls LM, Verhoef J, Jansen WT: Determination of the relationship between group A streptococcal genome content, M type, and toxic shock syndrome by a mixed genome microarray. Infect Immun 2007, 75:2603-2611.
20. Leavis HL, Willems RJ, Van Wamel WJ, Schuren FH, Caspers MP, Bonten MJ: Insertion sequence-driven diversification creates a globally dispersed emerging multiresistant subspecies of E. faecium. PLoS Pathog 2007, 3:e7.
21. Chien M, Morozova I, Shi S, Sheng H, Chen J, Gomez SM, Asamani G, Hill K, Nuara J, Feder M, Rineer J, Greenberg JJ, Steshenko V, Park SH, Zhao B, Teplitskaya E, Edwards JR, Pampou S, Georghiou A, Chou IC, Iannuccilli W, Ulz ME, Kim DH, Geringer-Sameth A, Goldsberry C, Morozov P, Fischer SG, Segal G, Qu X, Rzhetsky A, Zhang P, Cayanis E, De Jong PJ, Ju J, Kalachikov S, Shuman HA, Russo JJ: The genomic sequence of the accidental pathogen Legionella pneumophila. Science 2004, 305:1966-1968.
22. Cazalet C, Rusniok C, Brüggemann H, Zidane N, Magnier A, Ma L, Tichit M, Jarraud S, Bouchier C, Vandenesch F, Kunst F, Etienne J, Glaser P, Buchrieser C: Evidence in the Legionella pneumophila genome for exploitation of host cell functions and high genome plasticity. Nature Genet 2004, 36:1165-1173.
23. Aurell H, Farge P, Meugnier H, Gouy M, Forey F, Lina G, Vandenesch F, Etienne J, Jarraud S: Clinical and environmental isolates of Legionella pneumophila serogroup 1 cannot be distinguished by sequence analysis of two surface protein genes and three housekeeping genes. Appl Environ Microbiol 2005, 71:282-289.
24. Gaia V, Fry NK, Afshar B, Lück PC, Meugnier H, Etienne J, Peduzzi R, Harrison TG: Consensus sequence-based scheme for epidemiological
typing of clinical and environmental isolates of Legionella pneumophila. J Clin Microbiol 2005, 43:2047-2052.
25. Den Boer J , Bruin JP, Verhoef LP, Van der Zwaluw K, Jansen R, Yzerman EP: Genotypic comparison of clinical Legionella isolates and patient-related environmental isolates in The Netherlands, 2002-2006. Clin Microbiol Infect 2008, 14:459-466.
26. Saeed AI, Sharov V, White J, Li J, Liang W, Bhagabati N, Braisted J, Klapa M, Currier T, Thiagarajan M: TM4: a free, open-source system for microarray data management and analysis. Biotechniques 2003, 34:374-378.
doi: 10.1186/1471-2164-11-433Cite this article as: Yzerman et al., Comparative genome analysis of a large Dutch Legionella pneumophila strain collection identifies five markers highly correlated with clinical strains BMC Genomics 2010, 11:433
W