Comparative Analysis of Surface Urban Heat Island Effect in Central Sydney (DOI:...
12
Journal of Sustainable Development; Vol. 7, No. 3; 2014 ISSN 1913-9063 E-ISSN 1913-9071 Published by Canadian Center of Science and Education 23 Comparative Analysis of Surface Urban Heat Island Effect in Central Sydney Ehsan Sharifi 1 & Steffen Lehmann 2 1 Zero Waste Research Centre for Sustainable Design and Behaviour (sd+b), School of Art, Architecture and Design, University of South Australia, Adelaide, Australia 2 School of Built Environment, Curtin University, Perth , Australia Correspondence: Ehsan Sharifi, School of Art, Architecture and Design, University of South Australia, Adelaide, Australia. Tel: 61-8-8302-0422. E-mail: [email protected] Received: March 14, 2014 Accepted: April 8, 2014 Online Published: April 16, 2014 doi:10.5539/jsd.v7n3p23 URL: http://dx.doi.org/10.5539/jsd.v7n3p23 Abstract The Urban Heat Island (UHI) effect can result in higher urban densities being significantly hotter (frequently more than 4 °C, even up to 10 °C) compared to their peri-urban surroundings. Such artificial heat stress increases the health risk of spending time outdoors and boosts the need for energy consumption, particularly for cooling during summer. Urban structure, land cover and metabolism are underlined as key contributors in city scale. Under question is which urban configurations can make urban precincts and their microclimates more resilient to the surface layer Urban Heat Island (sUHI) effect? The City of Sydney is increasingly experiencing the UHI effect due to its numerous urban development projects and changes in climate. In the Sydney context, this ongoing research aims to explore the most heat resilient urban features at precinct scale. It covers five high density precincts in central Sydney and is based on a nocturnal remote-sensing thermal image of central Sydney taken on 6 February 2009. Comparing the surface temperature of streetscapes and buildings’ rooftops (dominant urban horizontal surfaces), indicates that open public spaces and particularly streetscapes are the most sensitive urban elements to the sUHI effect. The correlations between street network intensity, open public space plot ratio, urban greenery plot ratio and sUHI effect is being analysed in Sydney’s high density precincts. Results indicate that higher open space plot ratio and street network intensity correlate significantly to higher sUHI effect at precinct scale. However, higher urban greenery plot ratio can effectively mitigate the sUHI effect in high density precincts. Keywords: urban heat island effect, urban greenery, public space surface, streetscape, heat stress, Sydney 1. Introduction Cities are anticipated to accommodate up to 70% of the global population by 2050 (DESA, 2012). Compared to the current urbanization rate of 50%, almost all the expected global population growth will be accommodated in cities. Such rapid urbanization means higher densities in existing cities and many more new urban areas to accommodate up to 2 billion new urban dwellers. However, rapid urban development in fast-growing cities tends to overlook the environmental and social aspects of urban life (Girardet, 2008; Lehmann, 2010; Register, 2002). A considerable amount of natural landscape is transformed into building mass and hard surfaces, creating environmental threats for existing and future cities. With huge demands for natural resources (i.e. energy, food, water and materials) cities are contributing up to 80% of greenhouse gas (GhG) emissions, resulting in global warming (UNECE, 2011; UNHS, 2011). Climate change projections indicate a likely increase of 2 to 5 °C in Australian surface temperature by 2050 (CSIRO, 2007; OECD, 2010). Such an increase in temperature will have a severe impact on natural ecosystems and human life in cities, including public health and quality of public space (Guest et al., 1999; Stone, 2012). Cities also suffer from the effect of an additional form of heat, known as the Urban Heat Island (UHI) effect. This human-made heat is trapped in the built environment’s thermal mass and can result in higher densities being significantly hotter, compared to their peri-urban surroundings. The urban-rural temperature difference frequently reaches 4.0 °C and can peak at more than 10 °C (Gartland, 2008; Oke, 2006; Wong & Yu, 2008). Such additional heat can seriously impact citizens’ health and the quality of public life in cities.
Transcript of Comparative Analysis of Surface Urban Heat Island Effect in Central Sydney (DOI:...
Journal of Sustainable Development; Vol. 7, No. 3; 2014 ISSN 1913-9063 E-ISSN 1913-9071
Published by Canadian Center of Science and Education
23
Comparative Analysis of Surface Urban Heat Island Effect in Central Sydney
Ehsan Sharifi1 & Steffen Lehmann2 1 Zero Waste Research Centre for Sustainable Design and Behaviour (sd+b), School of Art, Architecture and Design, University of South Australia, Adelaide, Australia 2 School of Built Environment, Curtin University, Perth , Australia
Correspondence: Ehsan Sharifi, School of Art, Architecture and Design, University of South Australia, Adelaide, Australia. Tel: 61-8-8302-0422. E-mail: [email protected]
Received: March 14, 2014 Accepted: April 8, 2014 Online Published: April 16, 2014
doi:10.5539/jsd.v7n3p23 URL: http://dx.doi.org/10.5539/jsd.v7n3p23
Abstract
The Urban Heat Island (UHI) effect can result in higher urban densities being significantly hotter (frequently more than 4 °C, even up to 10 °C) compared to their peri-urban surroundings. Such artificial heat stress increases the health risk of spending time outdoors and boosts the need for energy consumption, particularly for cooling during summer. Urban structure, land cover and metabolism are underlined as key contributors in city scale. Under question is which urban configurations can make urban precincts and their microclimates more resilient to the surface layer Urban Heat Island (sUHI) effect?
The City of Sydney is increasingly experiencing the UHI effect due to its numerous urban development projects and changes in climate. In the Sydney context, this ongoing research aims to explore the most heat resilient urban features at precinct scale. It covers five high density precincts in central Sydney and is based on a nocturnal remote-sensing thermal image of central Sydney taken on 6 February 2009. Comparing the surface temperature of streetscapes and buildings’ rooftops (dominant urban horizontal surfaces), indicates that open public spaces and particularly streetscapes are the most sensitive urban elements to the sUHI effect. The correlations between street network intensity, open public space plot ratio, urban greenery plot ratio and sUHI effect is being analysed in Sydney’s high density precincts. Results indicate that higher open space plot ratio and street network intensity correlate significantly to higher sUHI effect at precinct scale. However, higher urban greenery plot ratio can effectively mitigate the sUHI effect in high density precincts.
Keywords: urban heat island effect, urban greenery, public space surface, streetscape, heat stress, Sydney
1. Introduction
Cities are anticipated to accommodate up to 70% of the global population by 2050 (DESA, 2012). Compared to the current urbanization rate of 50%, almost all the expected global population growth will be accommodated in cities. Such rapid urbanization means higher densities in existing cities and many more new urban areas to accommodate up to 2 billion new urban dwellers. However, rapid urban development in fast-growing cities tends to overlook the environmental and social aspects of urban life (Girardet, 2008; Lehmann, 2010; Register, 2002). A considerable amount of natural landscape is transformed into building mass and hard surfaces, creating environmental threats for existing and future cities.
With huge demands for natural resources (i.e. energy, food, water and materials) cities are contributing up to 80% of greenhouse gas (GhG) emissions, resulting in global warming (UNECE, 2011; UNHS, 2011). Climate change projections indicate a likely increase of 2 to 5 °C in Australian surface temperature by 2050 (CSIRO, 2007; OECD, 2010). Such an increase in temperature will have a severe impact on natural ecosystems and human life in cities, including public health and quality of public space (Guest et al., 1999; Stone, 2012).
Cities also suffer from the effect of an additional form of heat, known as the Urban Heat Island (UHI) effect. This human-made heat is trapped in the built environment’s thermal mass and can result in higher densities being significantly hotter, compared to their peri-urban surroundings. The urban-rural temperature difference frequently reaches 4.0 °C and can peak at more than 10 °C (Gartland, 2008; Oke, 2006; Wong & Yu, 2008). Such additional heat can seriously impact citizens’ health and the quality of public life in cities.
www.ccsenet.org/jsd Journal of Sustainable Development Vol. 7, No. 3; 2014
24
The higher density of cities can bring efficiency gains, but there is interplay between the increased risk of the urban heat island effect and higher densities, which needs to be understood. Because cities are often covered in heat-absorbing surfaces and materials, such as concrete and bitumen, they absorb and store heat (e.g. through solar radiation), making urban areas warmer than the surrounding hinterland and rural areas, especially at night time.
2. Relevant Scholarship
Since UHI research commenced in the early 19th century, it has been studied extensively by climate scientists and material engineers. Large-scale meteorological investigations are more likely to document the phenomenon itself and contribute mainly to understanding the behaviour of UHIs by comparing city centres and their rural surroundings (Oke, 1978, 1988; Paterson & Apelt, 1989; Tapper, 1990). These initial studies indicate the relatively higher temperature in higher densities and city centres.
Alongside meteorological UHI research, engineering investigations of surface materials’ thermodynamics have focused more on energy budgets, heat exchange and heat balance in the built environment (Ashie, Thanh Ca, & Asaeda, 1999; Gartland, 2008; Harman & Belcher, 2006; Wang, Bou-Zeid, & Smith, 2011). Research on thermal characteristics of urban surface materials at larger scales has been advanced by the development of remote sensing methods, including satellite-based, air-borne and on-the-spot thermal imagery. The understanding of surface materials’ contribution to heat balance in different layers of the atmosphere over 24 hours has been enhanced by comparative studies of surface and ambient temperatures (Gartland, 2008; Oke, 2006). Other investigations aim to model building energy flux based on materials’ thermal specifications (i.e. density, thermal capacity, convection rate, reflection).
The extensive recent literature on the UHI effect indicates that the artificial increase of temperature in cities is happening because of changes in energy and water budget in the built environment (Erell, Pearlmutter, & Williamson, 2011; Gartland, 2008; Oke, 2006; Santamouris & Geros, 2006). This artificial temperature increase affects urban microclimates in different layers of the atmosphere, including the surface layer (buildings and land surfaces), the canopy layer (below the canopy of trees or in human scale) and the boundary layer (up to 1500 meters above the ground surface). These three layers of urban microclimates are tangled in complex climatic systems, while local air circulation in the built environment can moderate the UHI effect by mixing the air in each layer with other adjacent layers (Erell, Pearlmutter, & Williamson, 2011). Oke (2006) argues that the UHI effect has four major contributing factors:
Urban geometry, which alters heat exchange balance in the built environment by affecting shadow and wind patterns. It affects the exposure of materials to sunlight and the consequent heat storage in thermal mass. This complex heat radiation exchange between building mass and adjacent atmosphere can also change the intensity and patterns of airflow in urban canyons.
Urban cover and surface materials, which affect the heat absorption and reflection time-rate in the built environment. Thermodynamic specification, colour, texture and density of materials and their exposure to sunlight can alter the heat flux in outdoor space in complex procedures.
Urban landscape, which affects water and heat exchange balance in the built environment, compared to natural surroundings. Photosynthesis and evaporation processes in urban greenery contribute to decrease the ambient temperature. Urban greenery typology, distribution and intensity also affect lower atmospheric air turbulence.
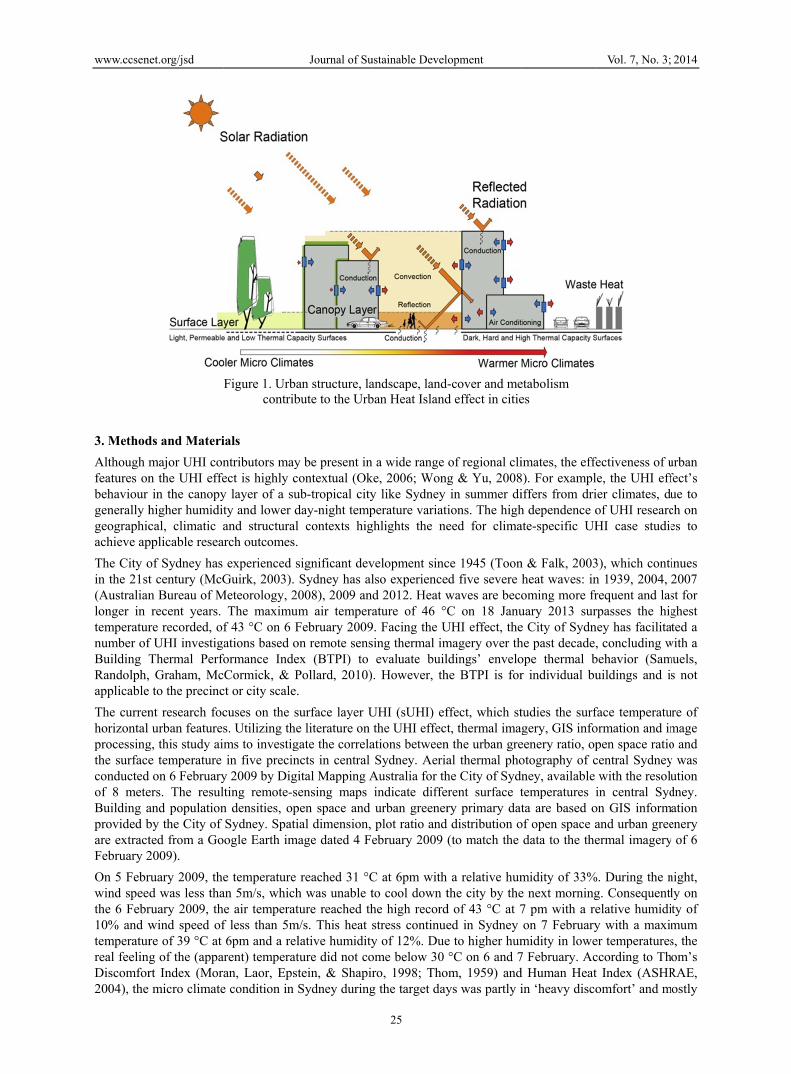
Urban metabolism and anthropogenic (human made) waste heat in cities, which is mainly related to mass energy consumption for indoor air-conditioning and motorized transportation (see Figure 1).
Existing approaches to the UHI effect are more likely to focus on large scale monitoring and mitigation strategies or micro scale material science. More research on the key contributors to the surface layer UHI (sUHI) effect at precinct scale can provide useful links between UHI investigations at city and material scales.
The temperature of some Australian cities, such as Sydney, Melbourne and Adelaide, is already up to 4 °C warmer than surrounding areas. The current investigation discusses ongoing research on the City of Sydney, which is an example of a city facing an increasing UHI effect due to its post-19th century urban development. Due to the city’s sub-tropical climate and the UHI effect, public spaces in the city are already warmer in summer than humans’ thermal comfort, pushing citizens into air-conditioned buildings and creating an ever-increasing rise in outdoor temperatures. Such artificial urban heat stress increases the mortality rate, especially of the elderly (Hu, Becker, McMichael, & Tong, 2007). The aim is to investigate the most effective sUHI mitigation strategies at the precinct scale in Sydney.
www.ccsen
3. Method
Although mfeatures onbehaviour generally hgeographicachieve ap
The City oin the 21st(Australianlonger in temperaturnumber ofBuilding TRandolph,applicable
The currenhorizontal processingthe surfaceconductedof 8 meteBuilding aprovided bare extractFebruary 2
On 5 Febrwind speethe 6 Febr10% and wtemperaturreal feelingDiscomfor2004), the
net.org/jsd
ds and Materi
major UHI conn the UHI effein the canopy
higher humiditcal, climatic a
pplicable resea
of Sydney has t century (McGn Bureau of Mrecent years.
re recorded, off UHI investigThermal Perfo Graham, Mc to the precinc
nt research focurban features
g, this study aime temperature
d on 6 Februaryers. The resuland populationby the City of ted from a Go2009).
ruary 2009, thed was less tharuary 2009, thwind speed ofre of 39 °C at g of the (appart Index (Moramicro climate
Figure 1. Urbacontrib
ials
ntributors mayect is highly cy layer of a suty and lower dand structural
arch outcomes.
experienced sGuirk, 2003).
Meteorology, 20The maximum
f 43 °C on 6 Fations based o
formance IndeCormick, & P
ct or city scale.
cuses on the ss. Utilizing thems to investigin five precin
y 2009 by Digilting remote-sn densities, opSydney. Spatiogle Earth im
e temperature an 5m/s, whiche air temperatf less than 5m6pm and a rel
arent) temperatan, Laor, Epste condition in
Journal of Su
an structure, labute to the Urb
y be present in ontextual (Ok
ub-tropical cityday-night templ contexts hig
significant devSydney has al008), 2009 andm air temperaFebruary 2009on remote sensex (BTPI) to Pollard, 2010).
surface layer Ue literature on
gate the correlancts in central ital Mapping Aensing maps
pen space and ial dimension, age dated 4 Fe
reached 31 °Ch was unable tture reached th
m/s. This heat slative humidityture did not cotein, & ShapirSydney during
ustainable Devel
25
andscape, landban Heat Island
a wide range ke, 2006; Wongy like Sydney perature variatighlights the ne
velopment sinclso experienced 2012. Heat wature of 46 °C
9. Facing the Using thermal im
evaluate buil. However, th
UHI (sUHI) efthe UHI effect
ations betweenSydney. Aeria
Australia for thindicate diffeurban greenerplot ratio and
ebruary 2009
C at 6pm with to cool down the high recordstress continuey of 12%. Dueome below 30ro, 1998; Thog the target day
lopment
-cover and med effect in citie
of regional clig & Yu, 2008in summer diions. The higheed for clima
ce 1945 (Tooned five severe hwaves are becoC on 18 Janu
UHI effect, themagery over thldings’ envelohe BTPI is for
ffect, which stt, thermal imag
n the urban greal thermal phohe City of Sydnerent surface try primary dat
d distribution o(to match the
a relative humthe city by the
d of 43 °C at 7ed in Sydney e to higher hum°C on 6 and 7
om, 1959) andys was partly i
etabolism es
imates, the effe8). For exampliffers from drih dependence oate-specific UH
n & Falk, 2003heat waves: inoming more fruary 2013 sure City of Sydnhe past decade,ope thermal br individual bu
tudies the surfgery, GIS info
eenery ratio, opotography of cney, available temperatures ita are based o
of open space adata to the the
midity of 33%e next morning7 pm with a reon 7 February
midity in lowe7 February. Acd Human Heatin ‘heavy disco
Vol. 7, No. 3;
fectiveness of ue, the UHI effier climates, duof UHI researcHI case studie
3), which contin 1939, 2004, requent and lasrpasses the higney has facilita, concluding w
behavior (Samuildings and i
face temperatuormation and impen space ratiocentral Sydneywith the resolin central Syd
on GIS informand urban greeermal imagery
%. During the ng. Consequentelative humidiy with a maxier temperaturesccording to Tht Index (ASHRomfort’ and m
2014
urban fect’s ue to ch on es to
inues 2007 st for ghest
ated a with a muels,
s not
ure of mage o and y was ution dney.
mation enery y of 6
night, ly on ity of mum s, the om’s RAE,
mostly
www.ccsen
in ‘emerge(Kovats &
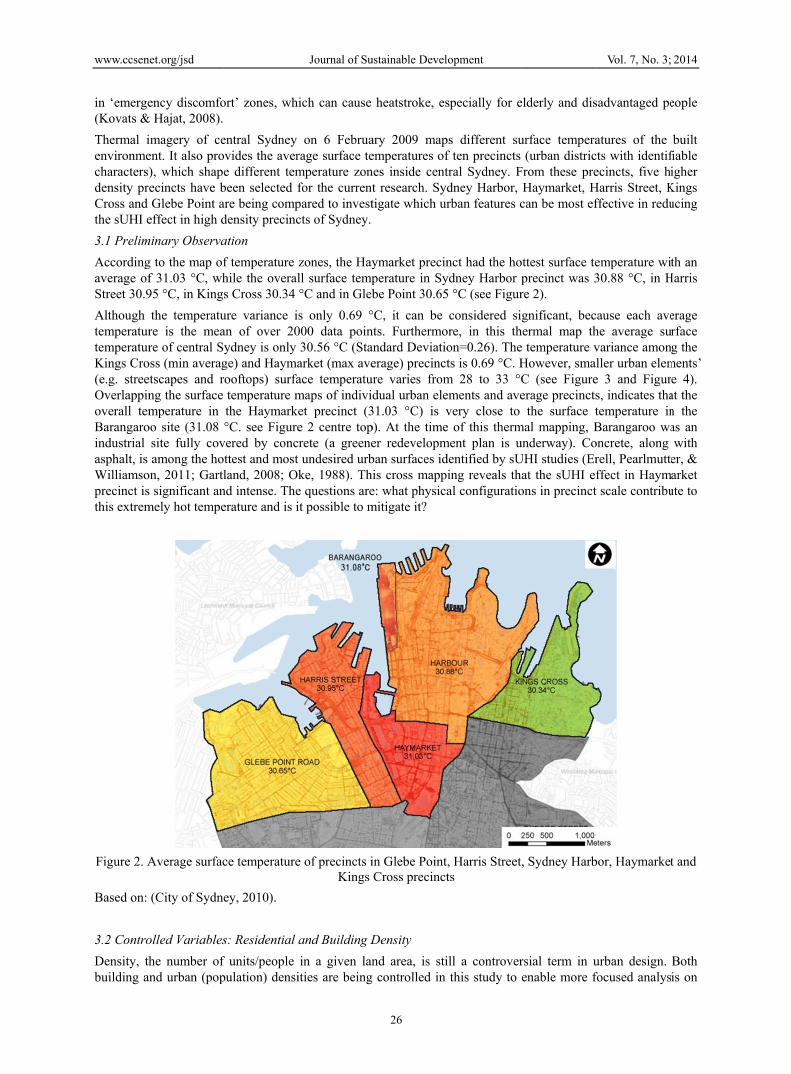
Thermal ienvironmecharacters)density prCross and the sUHI e
3.1 Prelim
Accordingaverage ofStreet 30.9
Although temperaturtemperaturKings Cro(e.g. streeOverlappinoverall temBarangaroindustrial asphalt, is Williamsoprecinct isthis extrem
Figure 2. A
Based on:
3.2 Contro
Density, thbuilding a
net.org/jsd
ency discomfo& Hajat, 2008).
imagery of ceent. It also pro), which shapecincts have bGlebe Point a
effect in high d
minary Observa
g to the map off 31.03 °C, wh95 °C, in King
the temperature is the meare of central S
oss (min averagetscapes and rng the surface mperature in
oo site (31.08 site fully covamong the ho
on, 2011; Gartls significant anmely hot tempe
Average surfac
(City of Sydn
olled Variables
he number of and urban (pop
ort’ zones, wh
entral Sydney ovides the avere different tem
been selected fare being compdensity precinc
ation
f temperature hile the overals Cross 30.34
ure variance ian of over 20ydney is only ge) and Haymarooftops) surfa
temperature mthe Haymark°C. see Figure
vered by concottest and mostland, 2008; O
nd intense. Theerature and is i
ce temperature
ey, 2010).
s: Residential
f units/people pulation) densi
Journal of Su
ich can cause
on 6 Februarage surface temperature zonfor the currentpared to investcts of Sydney.
zones, the Hayll surface temp°C and in Gleb
s only 0.69 °000 data poin30.56 °C (Staarket (max aveace temperatumaps of individet precinct (3e 2 centre top
crete (a greenet undesired urbke, 1988). Thie questions areit possible to m
e of precincts iKings
and Building D
in a given lanities are being
ustainable Devel
26
heatstroke, es
ary 2009 mapemperatures ofnes inside centt research. Sydtigate which ur
ymarket precinperature in Sybe Point 30.65
°C, it can be nts. Furthermoandard Deviatioerage) precinct
ure varies fromdual urban ele
31.03 °C) is vp). At the timeer redevelopmban surfaces idis cross mapp
e: what physicamitigate it?
in Glebe PointCross precinct
Density
nd area, is sti controlled in
lopment
specially for e
ps different suf ten precincts tral Sydney. Fdney Harbor, rban features c
nct had the hoydney Harbor p5 °C (see Figur
considered sigore, in this thon=0.26). Thets is 0.69 °C. H
m 28 to 33 °Cements and avevery close to e of this thermment plan is udentified by sUing reveals thaal configuratio
, Harris Streetts
ill a controverthis study to
elderly and dis
urface tempera(urban distric
From these preHaymarket, Hcan be most ef
ottest surface teprecinct was 3re 2).
gnificant, bechermal map the temperature vHowever, smalC (see Figureerage precincts
the surface tmal mapping, Bunderway). CoUHI studies (Er
at the sUHI efons in precinct
, Sydney Harb
rsial term in uenable more f
Vol. 7, No. 3;
sadvantaged pe
atures of the cts with identifecincts, five h
Harris Street, Kffective in redu
emperature wi30.88 °C, in H
cause each avehe average suvariance amonller urban elem
e 3 and Figurs, indicates thatemperature inBarangaroo waoncrete, along rell, Pearlmuttffect in Haymt scale contribu
bor, Haymarke
urban design. focused analys
2014
eople
built fiable igher
Kings ucing
th an Harris
erage urface
g the ments’ re 4). at the n the as an with
er, & market
ute to
t and
Both is on
www.ccsenet.org/jsd Journal of Sustainable Development Vol. 7, No. 3; 2014
27
urban elements and features in higher densities. Discussion about the effect of building density on the magnitude of sUHI shapes a considerable portion of the urban microclimate literature (Giridharan, Ganesan, & Lau, 2004; Lee, Holst, & Mayer, 2013; Yuan & Chen, 2011). Since the early sUHI studies, it has been argued that higher densities are likely to have higher temperature (Givoni, 1998; Oke, 1988; Tapper, 1990) due to their physical structure.
Background sUHI research indicates that high density building blocks can magnify the sUHI effect in cities by increasing the opportunity for surface materials to absorb direct and reflected sunlight radiation (Erell, Pearlmutter, & Williamson, 2011; Giridharan, Lau, Ganesan, & Givoni, 2007; Priyadarsini, 2009). Generally, reflected solar radiation has more chance to exit the built environment in lower densities and less compact areas (Wong & Yu, 2008). During each reflection phase between building facades and street surfaces, a portion of solar energy is transmitted into built environment surfaces in the form of heat (Erell, Pearlmutter, & Williamson, 2011). Thus the general surface temperature is likely to be higher in higher densities. The five selected precincts have a building density of more than 100 units per acre (Sydney Harbor and Haymarket have up to 200 units per acre). According to Campoli and MacLean’s (2007) classification of building density, over 100 units per acre can be considered as very high building density.
Higher building density can also intensify energy consumption in cities and consequently increase anthropogenic waste heat (Ichinose, Matsumoto, & Kataoka, 2008; Sivam & Karuppannan, 2012). Although population density is not a direct contributor to the UHI effect, it can increase the need for energy consumption for air conditioning and transport. Citizens in higher densities consume a considerable amount of energy in their daily life, especially for indoor air-conditioning and transportation. This higher rate of energy consumption increases the amount of anthropogenic (human-made) waste heat in higher densities and therefor contributes to the UHI effect in cities. However, a clear link between anthropogenic waste heat and sUHI has not been identified yet.
Central Sydney has the highest population density in Australia with an estimated residential population of 180,679 residents living in an area of 4.48 km2 in 2010 (City of Sydney, 2011). The overall urban density of the City of Sydney is 40330 p/km2. However, the five selected sites represent a higher average urban density of over 74136 p/km2. Therefore, the selected case studies have very high urban densities compared to other Australian cities and even other precincts in central Sydney. However, the number of people visiting central Sydney on a daily basis for shopping, entertainment and education reaches up to 483,000. This is in addition to the 385,000 people who arrive every day to work in central Sydney. The considerable proportion of temporary residents compared to permanent dwellers (more than fourfold) makes it difficult to consider residential density as a factor, contributing to the sUHI effect in Sydney. Furthermore, population density is usually discussed regarding to ambient temperature UHI effect, while the current study focusses on the surface layer Urban Heat Island (sUHI) effect. As such the variable of population density is being controlled in the current study.
4. Analysis and Results
Urban features can influence the surface temperature in higher densities by affecting the overall rate of materials’ exposure to sunlight and heat exchange between them (ASHRAE, 2004; Oke, 2006). Specific heat capacity, conductivity and albedo (reflectivity) of materials are the most affective factors, which can cause the built environment to store sunlight energy in the form of heat in its thermal mass and to postpone the energy departure process from the built environment (Ashie, 2008; Dahl, 2010; Oke, 1988). Still the location of materials needs to be carefully considered, as shading can influence the heat absorption and reflection process significantly. Two of the most common places, where the sUHI is being discussed are urban open space (including streetscapes and public space) and buildings’ rooftops.
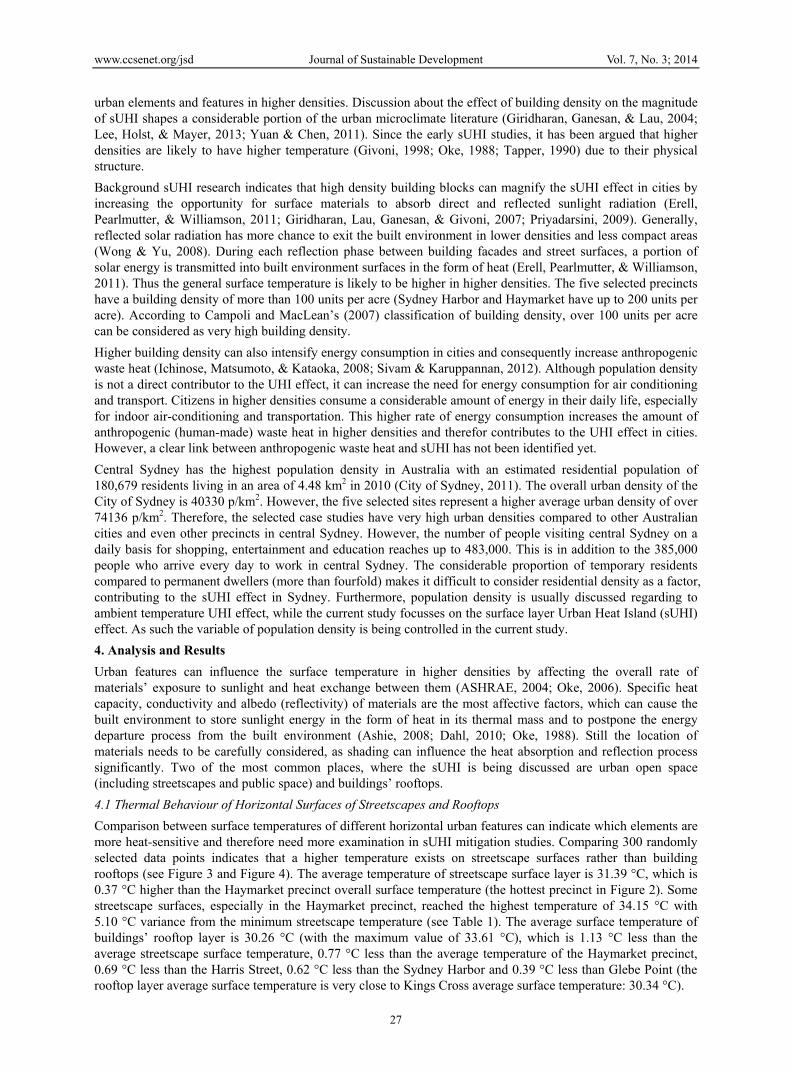
4.1 Thermal Behaviour of Horizontal Surfaces of Streetscapes and Rooftops
Comparison between surface temperatures of different horizontal urban features can indicate which elements are more heat-sensitive and therefore need more examination in sUHI mitigation studies. Comparing 300 randomly selected data points indicates that a higher temperature exists on streetscape surfaces rather than building rooftops (see Figure 3 and Figure 4). The average temperature of streetscape surface layer is 31.39 °C, which is 0.37 °C higher than the Haymarket precinct overall surface temperature (the hottest precinct in Figure 2). Some streetscape surfaces, especially in the Haymarket precinct, reached the highest temperature of 34.15 °C with 5.10 °C variance from the minimum streetscape temperature (see Table 1). The average surface temperature of buildings’ rooftop layer is 30.26 °C (with the maximum value of 33.61 °C), which is 1.13 °C less than the average streetscape surface temperature, 0.77 °C less than the average temperature of the Haymarket precinct, 0.69 °C less than the Harris Street, 0.62 °C less than the Sydney Harbor and 0.39 °C less than Glebe Point (the rooftop layer average surface temperature is very close to Kings Cross average surface temperature: 30.34 °C).
www.ccsen
Based on:
Fig
Based on:
Accordingthan do buscale. To uspace plot
net.org/jsd
Figure 3. Stree
(City of Sydn
gure 4. Roofto
(City of Sydn
g to Table 1 thuilding rooftopundertake morratio.
et surface temp
ey, 2010).
op surface temp
ey, 2010).
he streetscape ps. This underre detailed sU
Journal of Su
perature in fiv
perature in in f
has a considerlines the stree
UHI analysis, th
ustainable Devel
28
e adjacent high
five adjacent h
erably higher etscape as thehe street netw
lopment
h density preci
high density pr
surface tempee more heat-sework intensity
incts in centra
recincts in cent
erature and temensitive urban is compared a
Vol. 7, No. 3;
l Sydney
tral Sydney
mperature varifeature at pre
against open p
2014
iance ecinct ublic
www.ccsen
Table 1. Tcentral Syd
Stre
Buildi
Temp(Stre
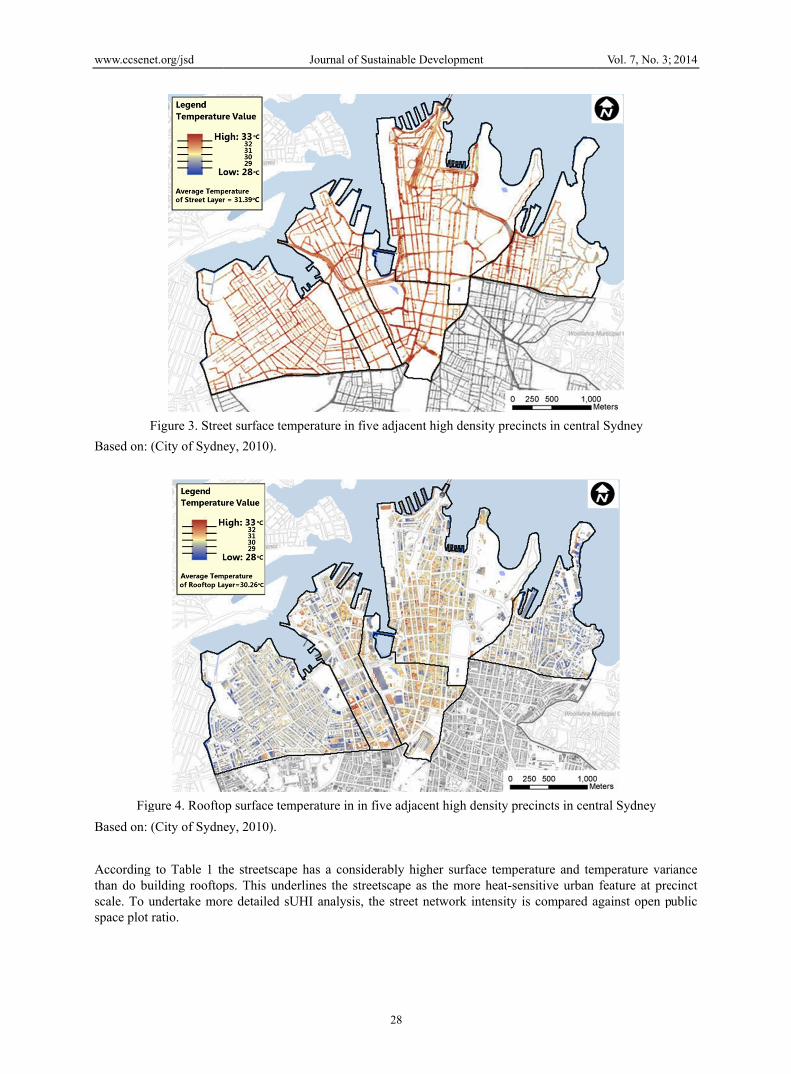
4.2 CorrelEffect
As heat-secorrelationspace are sUHI effecintensity (temperaturtemperatursurfaces cshows com
The open has even coefficientopen spaceresults in athe precin+0.5).
Feature Ex
net.org/jsd
Temperature vdney
eetscape
ing rooftop
p Variance eet-Roof)
lation between
ensitivity is mons between thebeing analysect is a dependstreetscape plore. It means thres in Sydneyan strongly co
mplete correlat
space plot ratmore coeffici
t value indicate (e.g. paved wa relatively lo
nct surface tem
Figur
xtraction from
variance of str
Min Temp. (°C
29.05
27.70
2.65
n Open Space P
ore in betweene open space ged separately ident variable oot ratio) has thhat a higher sty precincts. Thorrelate with ttion).
io (i.e. all harient value of tes strong corrwith concrete wer coefficien
mperature, whi
re 5. Streetscap
Google Earth
Journal of Su
eetscape surfa
C) Max Tem
37.3
33.6
3.6
Plot Ratio, Str
n buildings rathgeneral land usin this sectionf streetscape o
he correlation ctreetscape plothis high and the sUHI effec
rd-landscaped f +0.97 to ovrelation of oveand asphalt).
nt value of +0ich still indica
pe and public s
Imagery 2009
ustainable Devel
29
aces and build
mp. (°C) Av
30
61
69
reet Network In
her than their rse and the sUHn. This correlaor public spacecoefficient (R)t ratio indicatepositive coeff
ct in precinct
open spaces inverall surface erall surface teHowever, sep.64 between thates a higher c
space plot ratio
9, resolution: 1
lopment
ding rooftops i
erage Temp. (°
31.15
30.26
0.89
ntensity, Publi
rooftops, it is wHI effect. Theration analysis e plot ratio. T) value of +0.9es almost direcficient value iscale (the max
ncluding streetemperature i
emperate to tharating other ohe hard-landsccorrelation tha
o in five precin
meter.
in five high d
°C) Temp.
ic Space Plot R
worthwhile to refore, the strecan indicate t
Table 2 shows 94 to the averactly to the higindicates that ximum R valu
etscapes and otin Sydney prhe proportion oopen spaces frcaped public san average (m
ncts of Sydney
Vol. 7, No. 3;
density precinc
variance (°C)
8.25
5.91
2.24
Ratio and the s
analyse furtheeetscape and pto what degrethat street net
age precinct sugher overall su
higher streetsue can be 1, w
ther public sprecincts. This of hard-landscrom the streetspace plot ratio
moderate R val
y
2014
cts of
sUHI
er the ublic e the work
urface rface scape which
aces) high
caped scape o and ue is
www.ccsenet.org/jsd Journal of Sustainable Development Vol. 7, No. 3; 2014
30
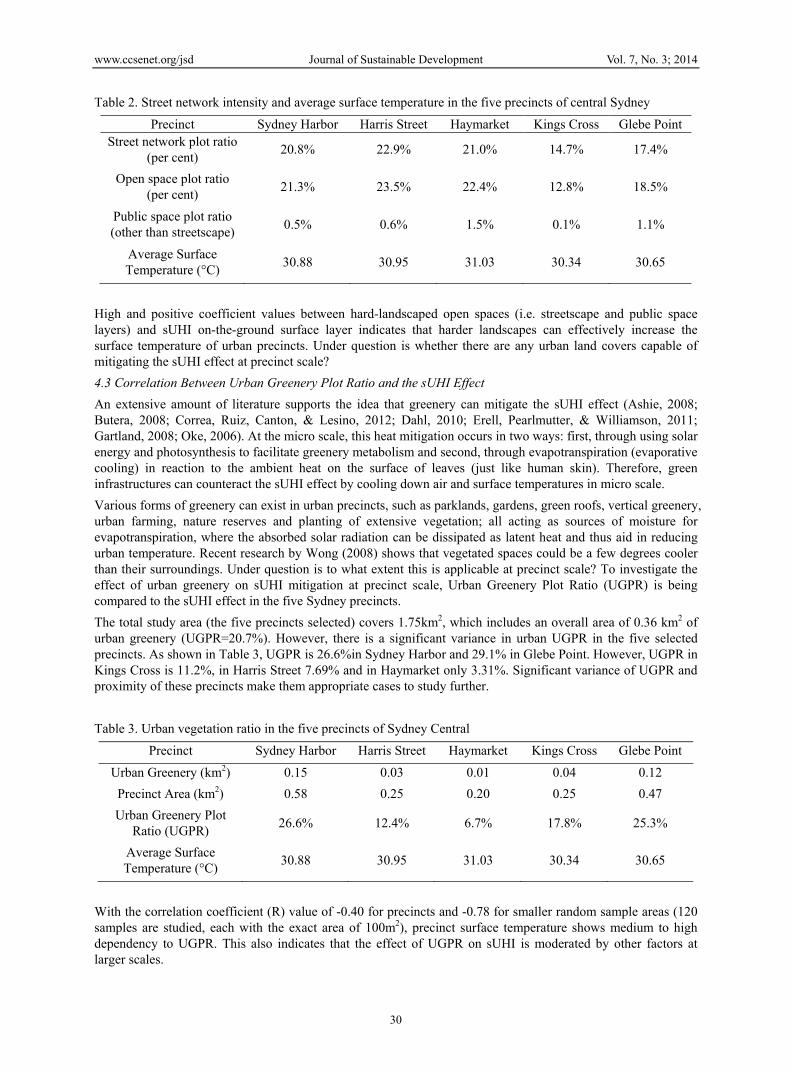
Table 2. Street network intensity and average surface temperature in the five precincts of central Sydney
Precinct Sydney Harbor Harris Street Haymarket Kings Cross Glebe PointStreet network plot ratio
(per cent) 20.8% 22.9% 21.0% 14.7% 17.4%
Open space plot ratio (per cent)
21.3% 23.5% 22.4% 12.8% 18.5%
Public space plot ratio (other than streetscape)
0.5% 0.6% 1.5% 0.1% 1.1%
Average Surface Temperature (°C)
30.88 30.95 31.03 30.34 30.65
High and positive coefficient values between hard-landscaped open spaces (i.e. streetscape and public space layers) and sUHI on-the-ground surface layer indicates that harder landscapes can effectively increase the surface temperature of urban precincts. Under question is whether there are any urban land covers capable of mitigating the sUHI effect at precinct scale?
4.3 Correlation Between Urban Greenery Plot Ratio and the sUHI Effect
An extensive amount of literature supports the idea that greenery can mitigate the sUHI effect (Ashie, 2008; Butera, 2008; Correa, Ruiz, Canton, & Lesino, 2012; Dahl, 2010; Erell, Pearlmutter, & Williamson, 2011; Gartland, 2008; Oke, 2006). At the micro scale, this heat mitigation occurs in two ways: first, through using solar energy and photosynthesis to facilitate greenery metabolism and second, through evapotranspiration (evaporative cooling) in reaction to the ambient heat on the surface of leaves (just like human skin). Therefore, green infrastructures can counteract the sUHI effect by cooling down air and surface temperatures in micro scale.
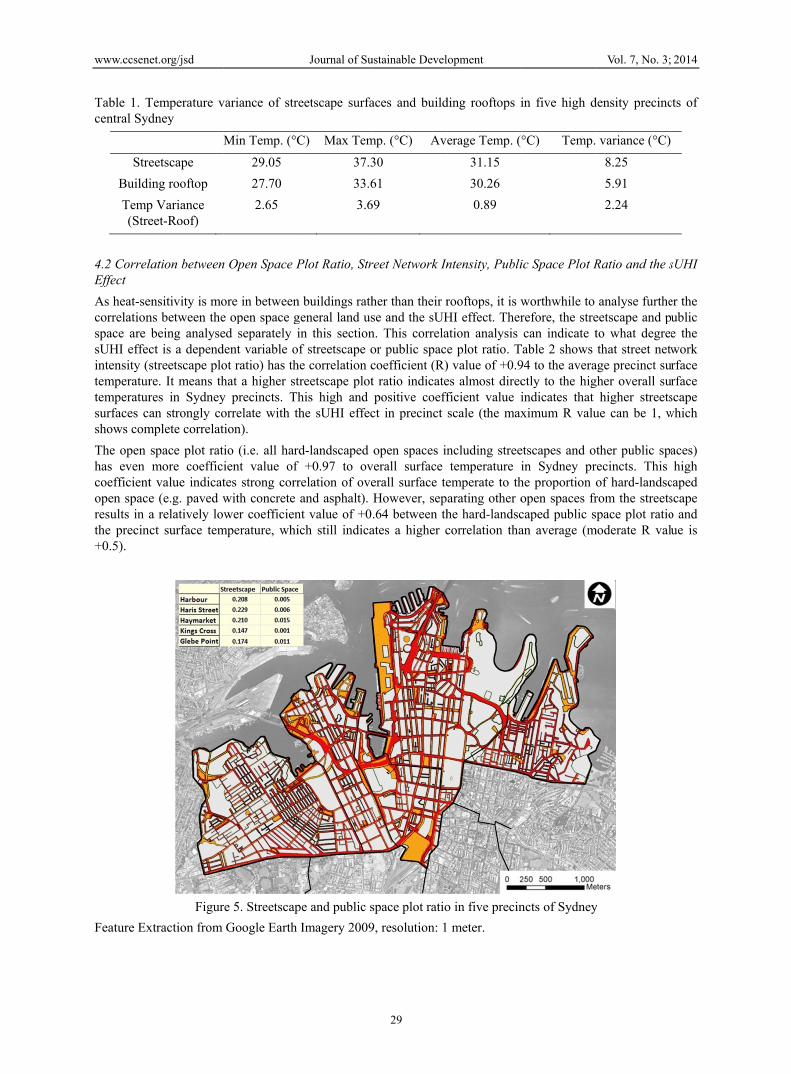
Various forms of greenery can exist in urban precincts, such as parklands, gardens, green roofs, vertical greenery, urban farming, nature reserves and planting of extensive vegetation; all acting as sources of moisture for evapotranspiration, where the absorbed solar radiation can be dissipated as latent heat and thus aid in reducing urban temperature. Recent research by Wong (2008) shows that vegetated spaces could be a few degrees cooler than their surroundings. Under question is to what extent this is applicable at precinct scale? To investigate the effect of urban greenery on sUHI mitigation at precinct scale, Urban Greenery Plot Ratio (UGPR) is being compared to the sUHI effect in the five Sydney precincts.
The total study area (the five precincts selected) covers 1.75km2, which includes an overall area of 0.36 km2 of urban greenery (UGPR=20.7%). However, there is a significant variance in urban UGPR in the five selected precincts. As shown in Table 3, UGPR is 26.6%in Sydney Harbor and 29.1% in Glebe Point. However, UGPR in Kings Cross is 11.2%, in Harris Street 7.69% and in Haymarket only 3.31%. Significant variance of UGPR and proximity of these precincts make them appropriate cases to study further.
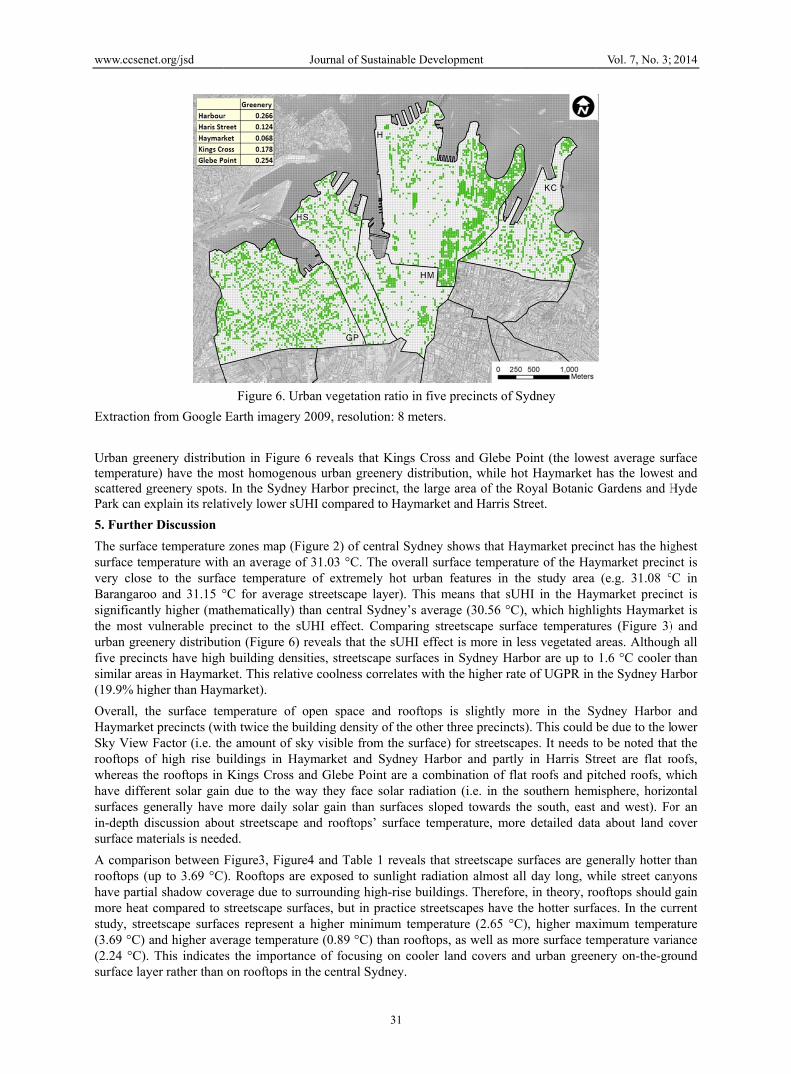
Table 3. Urban vegetation ratio in the five precincts of Sydney Central
Precinct Sydney Harbor Harris Street Haymarket Kings Cross Glebe Point
Urban Greenery (km2) 0.15 0.03 0.01 0.04 0.12
Precinct Area (km2) 0.58 0.25 0.20 0.25 0.47
Urban Greenery Plot Ratio (UGPR)
26.6% 12.4% 6.7% 17.8% 25.3%
Average Surface Temperature (°C)
30.88 30.95 31.03 30.34 30.65
With the correlation coefficient (R) value of -0.40 for precincts and -0.78 for smaller random sample areas (120 samples are studied, each with the exact area of 100m2), precinct surface temperature shows medium to high dependency to UGPR. This also indicates that the effect of UGPR on sUHI is moderated by other factors at larger scales.
www.ccsen
Extraction
Urban gretemperaturscattered gPark can e
5. Further
The surfacsurface temvery closeBarangarosignificantthe most vurban greefive precinsimilar are(19.9% hig
Overall, thHaymarkeSky View rooftops owhereas thhave diffesurfaces gin-depth dsurface ma
A comparirooftops (uhave partiamore heat study, stre(3.69 °C) (2.24 °C). surface lay
net.org/jsd
n from Google
eenery distribure) have the mgreenery spotsexplain its relat
r Discussion
ce temperaturemperature withe to the surfaoo and 31.15 °tly higher (mavulnerable preenery distributncts have higheas in Haymarkgher than Haym
he surface temet precincts (wi
Factor (i.e. thof high rise buhe rooftops in erent solar gaingenerally have discussion aboaterials is need
ison between up to 3.69 °C)al shadow covcompared to
eetscape surfacand higher ave This indicateyer rather than
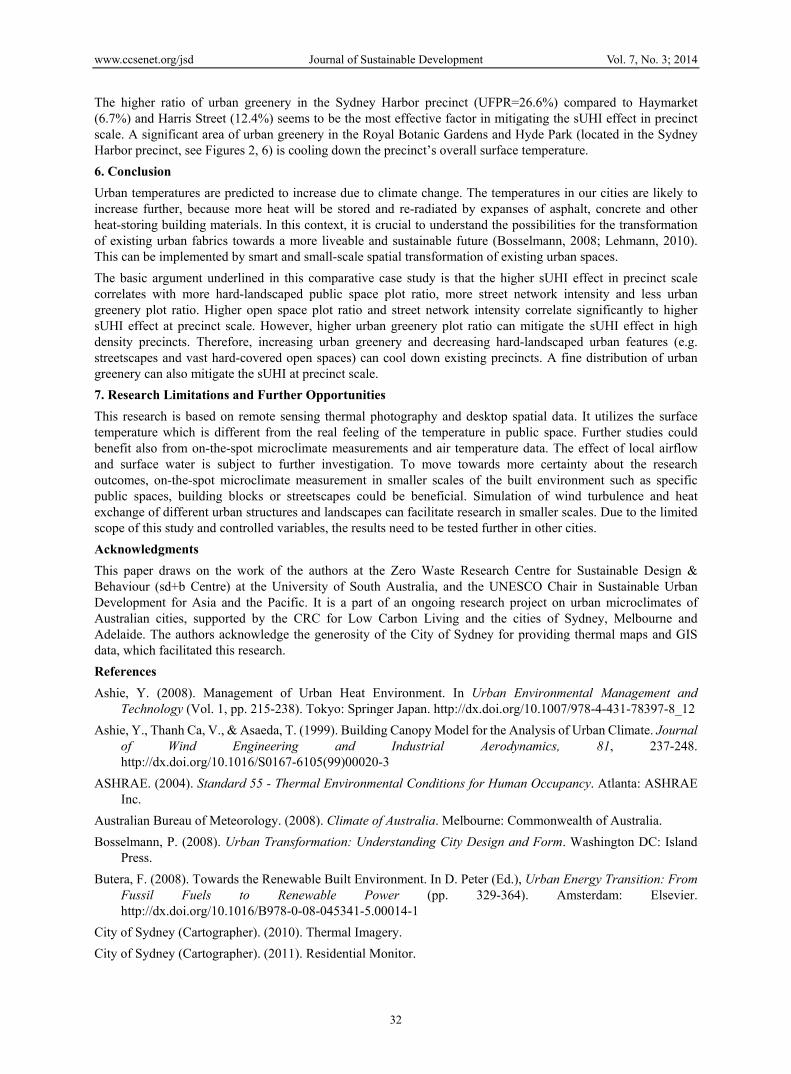
Figure 6. U
Earth imagery
ution in Figuremost homogen. In the Sydnetively lower sU
e zones map (Fh an average o
ace temperatur°C for averageathematically) ecinct to the stion (Figure 6)h building denket. This relatimarket).
mperature of ith twice the b
he amount of suildings in HaKings Cross
n due to the wmore daily so
out streetscapeded.
Figure3, Figur). Rooftops ar
verage due to sstreetscape suces represent erage temperat
es the importanon rooftops in
Journal of Su
Urban vegetatio
y 2009, resolut
e 6 reveals thaous urban gre
ey Harbor precUHI compared
Figure 2) of ceof 31.03 °C. Tre of extremee streetscape than central SsUHI effect. C) reveals that tsities, streetscive coolness co
open space abuilding densitysky visible froaymarket and and Glebe Poway they faceolar gain than and rooftops
re4 and Table re exposed to surrounding hi
urfaces, but in a higher miniture (0.89 °C)nce of focusinn the central Sy
ustainable Devel
31
on ratio in five
tion: 8 meters.
at Kings Crosseenery distribucinct, the larged to Haymarket
entral Sydney The overall surly hot urban layer). This m
Sydney’s averaComparing strthe sUHI effecape surfaces iorrelates with
and rooftops y of the other t
om the surface)Sydney Harb
int are a comb solar radiatio
n surfaces slop’ surface temp
1 reveals thatsunlight radiaigh-rise buildinpractice street
imum tempera than rooftops
ng on cooler lydney.
lopment
precincts of S
s and Glebe Pution, while hoe area of the Rt and Harris St
shows that Harface temperatfeatures in th
means that sUHage (30.56 °C)reetscape surfact is more in len Sydney Harthe higher rate
is slightly mthree precincts) for streetscapbor and partlybination of flaon (i.e. in the ped towards thperature, more
t streetscape sation almost alngs. Thereforetscapes have thature (2.65 °Cs, as well as mland covers an
Sydney
Point (the loweot Haymarket Royal Botanic treet.
aymarket preciture of the Hayhe study area HI in the Hay), which highliace temperatuess vegetated arbor are up to e of UGPR in
more in the Sys). This could bpes. It needs t
y in Harris Strat roofs and pisouthern hem
he south, east e detailed data
surfaces are gell day long, we, in theory, rohe hotter surfa
C), higher maxmore surface temnd urban green
Vol. 7, No. 3;
est average suhas the lowestGardens and H
inct has the higymarket precin(e.g. 31.08 °
ymarket precinights Haymark
ures (Figure 3)areas. Althoug1.6 °C coolerthe Sydney Ha
ydney Harborbe due to the lto be noted thareet are flat ritched roofs, w
misphere, horizand west). Fo
a about land c
enerally hotterwhile street canooftops shouldaces. In the cuximum tempermperature varinery on-the-gr
2014
rface t and Hyde
ghest nct is °C in nct is ket is ) and gh all
than arbor
r and ower
at the roofs, which ontal or an cover
than nyons
gain urrent rature iance round
www.ccsenet.org/jsd Journal of Sustainable Development Vol. 7, No. 3; 2014
32
The higher ratio of urban greenery in the Sydney Harbor precinct (UFPR=26.6%) compared to Haymarket (6.7%) and Harris Street (12.4%) seems to be the most effective factor in mitigating the sUHI effect in precinct scale. A significant area of urban greenery in the Royal Botanic Gardens and Hyde Park (located in the Sydney Harbor precinct, see Figures 2, 6) is cooling down the precinct’s overall surface temperature.
6. Conclusion
Urban temperatures are predicted to increase due to climate change. The temperatures in our cities are likely to increase further, because more heat will be stored and re-radiated by expanses of asphalt, concrete and other heat-storing building materials. In this context, it is crucial to understand the possibilities for the transformation of existing urban fabrics towards a more liveable and sustainable future (Bosselmann, 2008; Lehmann, 2010). This can be implemented by smart and small-scale spatial transformation of existing urban spaces.
The basic argument underlined in this comparative case study is that the higher sUHI effect in precinct scale correlates with more hard-landscaped public space plot ratio, more street network intensity and less urban greenery plot ratio. Higher open space plot ratio and street network intensity correlate significantly to higher sUHI effect at precinct scale. However, higher urban greenery plot ratio can mitigate the sUHI effect in high density precincts. Therefore, increasing urban greenery and decreasing hard-landscaped urban features (e.g. streetscapes and vast hard-covered open spaces) can cool down existing precincts. A fine distribution of urban greenery can also mitigate the sUHI at precinct scale.
7. Research Limitations and Further Opportunities
This research is based on remote sensing thermal photography and desktop spatial data. It utilizes the surface temperature which is different from the real feeling of the temperature in public space. Further studies could benefit also from on-the-spot microclimate measurements and air temperature data. The effect of local airflow and surface water is subject to further investigation. To move towards more certainty about the research outcomes, on-the-spot microclimate measurement in smaller scales of the built environment such as specific public spaces, building blocks or streetscapes could be beneficial. Simulation of wind turbulence and heat exchange of different urban structures and landscapes can facilitate research in smaller scales. Due to the limited scope of this study and controlled variables, the results need to be tested further in other cities.
Acknowledgments
This paper draws on the work of the authors at the Zero Waste Research Centre for Sustainable Design & Behaviour (sd+b Centre) at the University of South Australia, and the UNESCO Chair in Sustainable Urban Development for Asia and the Pacific. It is a part of an ongoing research project on urban microclimates of Australian cities, supported by the CRC for Low Carbon Living and the cities of Sydney, Melbourne and Adelaide. The authors acknowledge the generosity of the City of Sydney for providing thermal maps and GIS data, which facilitated this research.
References
Ashie, Y. (2008). Management of Urban Heat Environment. In Urban Environmental Management and Technology (Vol. 1, pp. 215-238). Tokyo: Springer Japan. http://dx.doi.org/10.1007/978-4-431-78397-8_12
Ashie, Y., Thanh Ca, V., & Asaeda, T. (1999). Building Canopy Model for the Analysis of Urban Climate. Journal of Wind Engineering and Industrial Aerodynamics, 81, 237-248. http://dx.doi.org/10.1016/S0167-6105(99)00020-3
ASHRAE. (2004). Standard 55 - Thermal Environmental Conditions for Human Occupancy. Atlanta: ASHRAE Inc.
Australian Bureau of Meteorology. (2008). Climate of Australia. Melbourne: Commonwealth of Australia.
Bosselmann, P. (2008). Urban Transformation: Understanding City Design and Form. Washington DC: Island Press.
Butera, F. (2008). Towards the Renewable Built Environment. In D. Peter (Ed.), Urban Energy Transition: From Fussil Fuels to Renewable Power (pp. 329-364). Amsterdam: Elsevier. http://dx.doi.org/10.1016/B978-0-08-045341-5.00014-1
City of Sydney (Cartographer). (2010). Thermal Imagery.
City of Sydney (Cartographer). (2011). Residential Monitor.
www.ccsenet.org/jsd Journal of Sustainable Development Vol. 7, No. 3; 2014
33
Correa, E., Ruiz, M. A., Canton, A., & Lesino, G. (2012). Thermal Comfort in Forested Urban Canyons of Low Building Density. An Assessment for the City of Mendoza, Argentina. Building and Environment, 58, 219-230. http://dx.doi.org/10.1016/j.buildenv.2012.06.007
CSIRO. (2007). Climate Change in Australia: Technical Report 2007. Aspendale VIC: CSIRO and Australian Bureau of Meteorology.
Dahl, T. (2010). Climate and Architecture. Milton Park: Routledge.
DESA. (2012). World Urbanization Prospects: The 2011 Revision. New York: United Nations.
Erell, E., Pearlmutter, D., & Williamson, T. (2011). Urban Microclimate: Designing the Spaces between Buildings. London: Earthscan.
Gartland, L. (2008). Heat Islands: Understanding and Mitigating Heat in Urban Areas. Washington, DC: Earthscan.
Girardet, H. (2008). Cities People Planet: Liveable Cities for a Sustainable World. Chichester: John Wiley & Sons.
Giridharan, R., Ganesan, S., & Lau, S. S. Y. (2004). Daytime Urban Heat Island Effect in High-rise and High-density Residential Developments in Hong Kong. Energy & Buildings, 36(6), 525-534. http://dx.doi.org/10.1016/j.enbuild.2003.12.016
Giridharan, R., Lau, S., Ganesan, S., & Givoni, B. (2007). Urban Design Factors Influencing Heat Island Intensity in High-rise High-density Environments of Hong Kong. Building and Environment, 42(10), 3669-3684. http://dx.doi.org/10.1016/j.buildenv.2006.09.011
Givoni, B. (1998). Climate Considerations in Building and Urban Design. New York: Van Nostrand Reinhold.
Guest, C. S., Willson, K., Woodward, A. J., Hennessy, K., Kalkstein, L. S., Skinner, C., & McMichael, A. J. (1999). Climate and Mortality in Australia: Retrospective Study, 1979-1990, and Predicted Impacts in Five Major Cities in 2030. CLIMATE RESEARCH, 13(1), 1-15. http://dx.doi.org/10.3354/cr013001
Harman, I. N., & Belcher, S. E. (2006). The Surface Energy Balance and Boundary Layer over Urban Street Canyons. Quarterly Journal of the Royal Meteorological Society, 132(621), 2749-2768. http://dx.doi.org/10.1256/qj.05.185
Hu, W., Becker, N., McMichael, T., & Tong, S. (2007). Heat-related Mortality during Summer in Sydney, Australia, 1990-2004. Epidemiology, 18(5), S113-S114.
Ichinose, T., Matsumoto, F., & Kataoka, K. (2008). Counteracting Urban Heat Islands in Japan. In D. Peter (Ed.), Urban Energy Transition: From Fussil Fuels to Renewable Power (pp. 365-380). Amsterdam: Elsevier. http://dx.doi.org/10.1016/B978-0-08-045341-5.00015-3
Kovats, R. S., & Hajat, S. (2008). Heat Stress and Public Health: a Critical Review. Annual Review of Public Health, 29(1), 41-55. http://dx.doi.org/10.1146/annurev.publhealth.29.020907.090843
Lee, H., Holst, J., & Mayer, H. (2013). Modification of Human-Biometeorologically Significant Radiant Flux Densities by Shading as Local Method to Mitigate Heat Stress in Summer within Urban Street Canyons. Advances in Meteorology, 2013. http://dx.doi.org/10.1155/2013/312572
Lehmann, S. (2010). The Principles of Green Urbanism: Transforming the City for Sustainability. Washington, DC: Earthscan.
MacLean, A. S., & Campoli, J. (2007). Visualizing Density. Cambridge, Mass. Lincoln Institute of Land Policy.
McGuirk, P. (2003). Planning Central Sydney. In A. MacLaran (Ed.), Making Space: Property Development and Urban Plannin (pp. 118-147). London: Hodder Arnold
Moran, D. S., Laor, A., Epstein, Y., & Shapiro, Y. (1998). A Modified Discomfort Index (MDI) as a Substitute for the Wet Bulb Globe Temperature (WBGT). Medicine & Science in Sports & Exercise, 30(Supplement), 284. http://dx.doi.org/10.1097/00005768-199805001-01614
OECD. (2010). Cities and Climate Change: Organisation for Economic Cooperation and Development (OECD).
Oke, T. R. (1978). Boundary Layer Climates. New York: Wiley. http://dx.doi.org/10.4324/9780203407219
Oke, T. R. (1988). The Urban Energy Balance. Progress in Physical Geography, 12(4), 471-508. http://dx.doi.org/10.1177/030913338801200401
www.ccsenet.org/jsd Journal of Sustainable Development Vol. 7, No. 3; 2014
34
Oke, T. R. (2006). Towards Better Scientific Communication in Urban Climate. Theoretical and Applied Climatology, 84(1), 179-190. http://dx.doi.org/10.1007/s00704-005-0153-0
Paterson, D. A., & Apelt, C. J. (1989). Simulation of Wind Flow around 3-Dimensional Buildings. Building and Environment, 24(1), 39-50. http://dx.doi.org/10.1016/0360-1323(89)90015-2
Priyadarsini, R. (2009). Urban Heat Island and its Impact on Building Energy Consumption. Advances in Building Energy Research, 3(1), 261-261. http://dx.doi.org/10.3763/aber.2009.0310
Register, R. (2002). Ecocities: Building Cities in Balance with Nature. Berkeley, Calif: Distributed by Publishers Group West.
Samuels, R., Randolph, B., Graham, P., McCormick, T., & Pollard, B. (2010). Micro-Urban-Climatic Thermal Emissions in a Medium-Density Residential Precinct. Sydney: University of New South Wales.
Santamouris, M., & Geros, V. (2006). Environmental Design of Urban Buildings: An Integrated Approach. Sterling: Earthscan.
Sivam, A., & Karuppannan, S. (2012). Density, Design and Sustainable Residential Development. In S. Lehmann & R. Crocker (Eds.), Designing for Zero Waste: Consumption, Technologies and the Built Environment (pp. 267-283). New York and London: Earthscan
Stone, B. (2012). CITY and the Coming Climate: Climate Change in the Places we Live. New York: Cambridge University Press. http://dx.doi.org/10.1017/CBO9781139061353
Tapper, N. J. (1990). Urban Influences on Boundary-Layer Temperature and Humidity - Results from Christchurch, New-Zealand. Atmospheric Environment Part B-Urban Atmosphere, 24(1), 19-27. http://dx.doi.org/10.1016/0957-1272(90)90005-F
Thom, E. C. (1959). The Discomfort Index. Weatherwise, 12(2), 57-61. http://dx.doi.org/10.1080/00431672.1959.9926960
Toon, J., & Falk, J. (Eds.). (2003). Sydney: Planning or Politics: Town Planning for Sydney Region Since 1945. Sydney: Planning Research Centre, University of Sydney.
UNECE. (2011). Climate Neutral Cities: How to Make Cities Less Energy and Carbon Intensive and more Resilient to Climatic Challenges. New York and Geneva: United Nations Economic Commission for Europe.
UNHS. (2011). Cities and Climate Change: Global Report on Human Settlements 2011. London: United Nations Human Settlements Programme, Earthscan.
Wang, Z.-H., Bou-Zeid, E., & Smith, J. A. (2011). A Spatially-Analytical Scheme for Surface Temperatures and Conductive Heat Fluxes in Urban Canopy Models. Boundary-Layer Meteorology, 138(2), 171-193. http://dx.doi.org/10.1007/s10546-010-9552-6
Wong, N. H., & Yu, C. (2008). Tropical Urban Heat Islands: Climate, Buildings and Greenery. New York: Taylor & Francis
Yuan, C., & Chen, L. (2011). Mitigating Urban Heat Island Effects in High-density Cities Based on Sky View Factor and Urban Morphological Understanding: A Study of Hong Kong. Architectural Science Review, 54(4), 305. http://dx.doi.org/10.1080/00038628.2011.613644
Copyrights
Copyright for this article is retained by the author(s), with first publication rights granted to the Journal of Sustainable Development.
This is an open-access article distributed under the terms and conditions of the Creative Commons
Attribution license (http://creativecommons.org/licenses/by/3.0/).