Comparability of multiple data types from the Bering Strait region: cranial and dental metrics and...
15
Comparability of Multiple Data Types From the Bering Strait Region: Cranial and Dental Metrics and Nonmetrics, mtDNA, and Y-Chromosome DNA Brianne Herrera, 1 * Tsunehiko Hanihara, 2 and Kanya Godde 3,4 1 Department of Anthropology, The Ohio State University, Columbus, OH 2 Department of Anatomy and Biological Anthropology, Saga Medical School, Saga, Japan 3 Sociology and Anthropology Department, University of La Verne, La Verne, CA 4 Department of Anthropology, University of Tennessee, Knoxville, TN KEY WORDS mantel tests; biological distance; aleut; inuit; procrustes; kinship matrix ABSTRACT Different data types have previously been shown to have the same microevolutionary pat- terns in worldwide data sets. However, peopling of the New World studies have shown a difference in migration paths and timings using multiple types of data, spurring research to understand why this is the case. This study was designed to test the degree of similarity in evolu- tionary patterns by using cranial and dental metric and nonmetric data, along with Y-chromosome DNA and mtDNA. The populations used included Inuits from Alaska, Canada, Siberia, Greenland, and the Aleutian Islands. For comparability, the populations used for the cranial and molecular data were from similar geographic regions or had a shared population history. Distance, R and kinship matrices were generated for use in running Mantel tests, PROTEST analyses, and Procrustes analy- ses. A clear patterning was seen, with the craniometric data being most highly correlated to the mtDNA data and the cranial nonmetric data being most highly corre- lated with the Y-chromosome data, while the phenotypic data were also linked. This patterning is suggestive of a possible male or female inheritance, or the correlated data types are affected by the same or similar evolution- ary forces. The results of this study indicate cranial traits have some degree of heritability. Moreover, com- bining data types leads to a richer knowledge of biologi- cal affinity. This understanding is important for bioarchaeological contexts, in particular, peopling of the New World studies where focusing on reconciling the results from comparing multiple data types is necessary to move forward. Am J Phys Anthropol 000:000–000, 2014. V C 2014 Wiley Periodicals, Inc. Combining different types of data for statistical analy- sis is useful for inferring patterns of population dynam- ics and history. Genetic drift, gene flow, and natural selection are well-known biological and evolutionary influencers of cranial shape and form that are passed down through generations (Relethford and Blangero, 1990; Relethford, 2001; Stojanowski, 2004). Because of this, comparing osteological and molecular data has had interesting results in investigations ranging from kin- ship organization during the Late Stone Age (Haak et al., 2008) to finding familial groups within ancient Mongolians (Ricaut et al., 2010). Gonz alez-Jos e et al. (2008) have also been successful in combining geometric- morphometrics and genetic data for testing different models for the human migration into the Americas. Sim- ilarly, Gonz alez-Jos e et al. (2004) used cranial measure- ments and Alu-insertions to find correlations with genetic and phenotypic distances. The analysis performed here is based on a similar idea. We used osteological metric and nonmetric data, dental metric and nonmetric data, as well as mitochon- drial DNA (mtDNA) haplogroup frequencies and Y- chromosome allele frequency data from different contem- porary, indigenous Arctic and Aleutian populations in order to compare and detect population patterns. Specifi- cally, we are interested in combining multiple biological data types in hopes that the methodology will aid in bio- archaeological investigations, in particular, peopling of the New World studies. Because this work will not address temporal or spatial components associated with these populations and data types, it is not appropriate to directly examine these results for human migration to the New World. Instead, we hope this information will provide a tool for investigators wishing to analyze multi- ple data types in relation to hypothesis testing for peo- pling of the New World. Because of the large variety of data types used for migration studies, it is important to understand the relationship of each data type to each other for researchers to reconcile the results. BACKGROUND Greenland The first migration into Greenland is thought to have occurred via the Canadian High Arctic islands (Mel- gaard, 1976) around 4500–4000 BP (Helgason et al., 2005). Once in Greenland, the original migrants split Additional Supporting Information may be found in the online ver- sion of this article. *Correspondence to: Brianne Herrera, 825 N 4th St #208, Colum- bus, Ohio 43215, USA. E-mail: [email protected] Received 16 August 2013; revised 3 March 2014; accepted 4 March 2014 DOI 10.1002/ajpa.22513 Published online 00 Month 2014 in Wiley Online Library (wileyonlinelibrary.com). Ó 2014 WILEY PERIODICALS, INC. AMERICAN JOURNAL OF PHYSICAL ANTHROPOLOGY 00:00–00 (2014)
Transcript of Comparability of multiple data types from the Bering Strait region: cranial and dental metrics and...
Comparability of Multiple Data Types From the BeringStrait Region: Cranial and Dental Metrics andNonmetrics, mtDNA, and Y-Chromosome DNABrianne Herrera,1* Tsunehiko Hanihara,2 and Kanya Godde3,4
1Department of Anthropology, The Ohio State University, Columbus, OH2Department of Anatomy and Biological Anthropology, Saga Medical School, Saga, Japan3Sociology and Anthropology Department, University of La Verne, La Verne, CA4Department of Anthropology, University of Tennessee, Knoxville, TN
KEY WORDS mantel tests; biological distance; aleut; inuit; procrustes; kinship matrix
ABSTRACT Different data types have previouslybeen shown to have the same microevolutionary pat-terns in worldwide data sets. However, peopling of theNew World studies have shown a difference in migrationpaths and timings using multiple types of data, spurringresearch to understand why this is the case. This studywas designed to test the degree of similarity in evolu-tionary patterns by using cranial and dental metric andnonmetric data, along with Y-chromosome DNA andmtDNA. The populations used included Inuits fromAlaska, Canada, Siberia, Greenland, and the AleutianIslands. For comparability, the populations used for thecranial and molecular data were from similar geographicregions or had a shared population history. Distance, Rand kinship matrices were generated for use in runningMantel tests, PROTEST analyses, and Procrustes analy-
ses. A clear patterning was seen, with the craniometricdata being most highly correlated to the mtDNA dataand the cranial nonmetric data being most highly corre-lated with the Y-chromosome data, while the phenotypicdata were also linked. This patterning is suggestive of apossible male or female inheritance, or the correlateddata types are affected by the same or similar evolution-ary forces. The results of this study indicate cranialtraits have some degree of heritability. Moreover, com-bining data types leads to a richer knowledge of biologi-cal affinity. This understanding is important forbioarchaeological contexts, in particular, peopling of theNew World studies where focusing on reconciling theresults from comparing multiple data types is necessaryto move forward. Am J Phys Anthropol 000:000–000,2014. VC 2014 Wiley Periodicals, Inc.
Combining different types of data for statistical analy-sis is useful for inferring patterns of population dynam-ics and history. Genetic drift, gene flow, and naturalselection are well-known biological and evolutionaryinfluencers of cranial shape and form that are passeddown through generations (Relethford and Blangero,1990; Relethford, 2001; Stojanowski, 2004). Because ofthis, comparing osteological and molecular data has hadinteresting results in investigations ranging from kin-ship organization during the Late Stone Age (Haaket al., 2008) to finding familial groups within ancientMongolians (Ricaut et al., 2010). Gonz!alez-Jos!e et al.(2008) have also been successful in combining geometric-morphometrics and genetic data for testing differentmodels for the human migration into the Americas. Sim-ilarly, Gonz!alez-Jos!e et al. (2004) used cranial measure-ments and Alu-insertions to find correlations withgenetic and phenotypic distances.
The analysis performed here is based on a similaridea. We used osteological metric and nonmetric data,dental metric and nonmetric data, as well as mitochon-drial DNA (mtDNA) haplogroup frequencies and Y-chromosome allele frequency data from different contem-porary, indigenous Arctic and Aleutian populations inorder to compare and detect population patterns. Specifi-cally, we are interested in combining multiple biologicaldata types in hopes that the methodology will aid in bio-archaeological investigations, in particular, peopling ofthe New World studies. Because this work will notaddress temporal or spatial components associated with
these populations and data types, it is not appropriate todirectly examine these results for human migration tothe New World. Instead, we hope this information willprovide a tool for investigators wishing to analyze multi-ple data types in relation to hypothesis testing for peo-pling of the New World. Because of the large variety ofdata types used for migration studies, it is important tounderstand the relationship of each data type to eachother for researchers to reconcile the results.
BACKGROUND
Greenland
The first migration into Greenland is thought to haveoccurred via the Canadian High Arctic islands (Mel-gaard, 1976) around 4500–4000 BP (Helgason et al.,2005). Once in Greenland, the original migrants split
Additional Supporting Information may be found in the online ver-sion of this article.
*Correspondence to: Brianne Herrera, 825 N 4th St #208, Colum-bus, Ohio 43215, USA. E-mail: [email protected]
Received 16 August 2013; revised 3 March 2014; accepted 4March 2014
DOI 10.1002/ajpa.22513Published online 00 Month 2014 in Wiley Online Library
(wileyonlinelibrary.com).
! 2014 WILEY PERIODICALS, INC.
AMERICAN JOURNAL OF PHYSICAL ANTHROPOLOGY 00:00–00 (2014)

and went down the east and west coast until making itto the southern portion. This splitting led to the develop-ment of different cultural groups: Independence I—Saq-qaq, Pre-Dorset, Independence II—Dorset, and Thule(Rasmussen et al., 2010). The Thule later gave rise tothe modern day Alaskan Yupik and Inupiat, as well asCanadian and Greenlandic Inuit (Gilbert et al., 2008).Ancient DNA analysis of a 4,000-year-old Greenlanderfrom Qeqertasussuk, Greenland shows evidence that hewas genetically distinct from the ancestors of modernday Native Americans and Inuit, but shares ancestrywith Arctic north-east Asians (Rasmussen et al., 2010).There may have been a few conflicts with the NativeGreenlanders before the Norse abandoned their Green-land dwellings due to lack of regular contact withEurope, lack of resources, declining population, unstableclimate, and overgrazing (Berglund, 1986). There was alater migration of the Danish, and historical evidenceindicates that the Danish migration consisted of mostlymen who are known to have married native Green-landers (Gad, 1971).
Canada
Paleo-American sites in Canada indicate the first peo-ple arrived at 4500 BP, and over the immediately subse-quent 500 years, population levels were rising (Savelleand Dyke, 2002). There was a peak in the populationbetween 4000 and 3800 BP, followed by a sharp declinewithin a few decades of 3800 BP (Savelle and Dyke,2002). Large populations existed until 3200 BP and thendeclined further, followed by a resurgence during 3000–2800 BP (Savelle and Dyke, 2002). Afterward, anotherdecline occurred, possibly bringing the population downto zero around 2800–2600 BP. A later culture, the Dor-set, developed in the Canadian Arctic around 500 BC(!2500 BP) by the descendants of the people who hadarrived there from Alaska between 1,500 and 1,000years earlier (Savelle and Dyke, 2002).
Siberia
The ancestral Native American population is thoughtto have originated somewhere near the Lake Baikalregion and the Altai Mountains (Malyarchuk et al.,2011; Battaglia et al., 2013). These groups are tradition-ally Turkic-speaking tribes (Zlojutro et al., 2009b). AfterRussian contact, the Yakut expanded beyond the Yaku-tian valley and into territory occupied by the Yakaghirs,Evenks, and Evens (Zlojutro et al., 2009b). Beginningaround early 20th century, the Siberian populationswere reduced to only the southern and northeastern por-tion of the Chukchi Peninsula (Starikovskaya et al.,1998). This reduction in the Siberian population waslikely due to disease from European explorers, withmany of the surviving Chukchi and Yupik people forciblyrelocated (Holzlehner, 2011). Since this occurrence, theSiberian region has been inhabited by three differentYupik-speaking tribes, each of which occasionally inter-bred with various indigenous groups from neighboringislands, such as Little Diomede Island or St. LawrenceIsland (Starikovskaya et al., 1998).
Alaska and Aleutian Islands
The Thule Tradition in Alaska is thought to havestarted in Northern Alaska, eventually spreading to theAlaskan Peninsula sometime around 1000 BP. This
migration of Thule replaced the Norton Culture, whowere present along the Bering Sea Coasts, startingaround 2500 years BP (Britton et al., 2013). During thelate Siberian Paleolithic stage, a group of people crossedinto the Americas from Asia via the Bering land bridge.By !8700 BP, they eventually made it to the AleutianIslands, a group of islands extending westward from theAlaska Peninsula (Smith et al., 2009). In 1791, the Rus-sians made contact with the Aleuts, and after a few con-flicts with the native people, the Russians and Aleutianslived in relative harmony. After the US purchasedAlaska from Russia in 1867, the Aleutians underwent aviolent series of contact (e.g., invasions, internmentcamps during WWII) from the United States and Japan(Sepez et al., 2007; West et al., 2010). The sale alsobrought Scandinavian and Western European fur trad-ers and fisherman (Zlojutro et al., 2009a; Graf et al.,2010; Rey et al., 2010). Intermarriage between Euro-peans and the native Aleut population were high, par-tially due to a law imposed by the US that required aman to be married to an Aleutian to hunt animals typi-cally used for fur (Reedy-Maschner, 2010). Further, theRussian governor encouraged males to marry Aleutianwomen as a way to increase fertility (Rubicz et al.,2010b). The resulting gene flow has been detectable ingenetic studies (Rubicz et al., 2003, 2010b; Zlojutroet al., 2006; Crawford et al., 2010).
Archaeologically, the Aleutian Islands have been agreat source of interesting and useful finds, such asnumerous mummies with soft tissue and clothing stillpresent (Candela, 1939; Zimmerman and Aufderheide,1984; Veltre and Smith, 2010). The earliest site dates to!9,000 years ago, but there are only a few sites datingaround this time frame (Veltre and Smith, 2010). How-ever, archaeologists have found about 1,000 sites datingfrom 3,000 to 4,000 years ago. These sites tend to bewell preserved, allowing archaeologists to learn aboutthe Aleut lifestyle. Hrdlicka collected skeletal materialfrom the Aleutian Islands during one of his expeditions.In 1945, he published a paper suggesting an originalmigration founding the Aleutian isles, and then a latermigration from the mainland of Alaska replacing theoriginal founding population (Hrdlicka, 1945). Thistheory was based on the presence of two distinct cranialmorphologies seen in his collection, but, unfortunately,his excavation did not include stratigraphy or specificgeographic location of the skeletons (Smith et al., 2010).Genetic studies have found evidence both for andagainst this theory (Raff et al., 2010; Rubicz et al.,2010a; Smith et al., 2010) with no consensus as of yet.
Integration of multiple data types
We expect our data types to demonstrate similaritieswhen considering among and between group affinities.This line of thought is based on previous work by Ricautet al. (2010) and Gonz!alez-Jos!e et al. (2008). Ricautet al. (2010) conclude that nonmetric traits are not asuseful for kinship patterns as genetics, but are able toact as a proxy for genetic markers when studying amongor between group affinities. Even though our work willbe utilizing more data types (cranial metric and nonmet-ric, dental metric and nonmetric, Y-chromosome DNA,and mtDNA) than the Ricaut et al. (2010) article, we arestill expecting the same results in terms of group affin-ities. Gonz!alez-Jos!e et al. (2008) propose that models forthe human dispersion into the Americas should be based
2 B. HERRERA ET AL.
American Journal of Physical Anthropology
on both morphology and genetic data. Furthermore, thisproject is justified in light of Hubbe et al. (2009) whostate that cranial morphology can be used to infer phylo-genetic patterns and information.
On the basis of the description of neutral theory byRoseman and Weaver (2007), where the genetic and phe-notypic distances are expected to be similar, we expectto find similarities between the principal components/coordinates of our genetic and cranial data. Harvati andWeaver (2006) similarly suggest that cranial morphologycan retain a population history signal, allowingresearchers to track neutral genetics. However, a poten-tial complication arises when facial shape is consideredbecause the face appears to retain climatic features(Hanihara 1993, 1996). This climatic signal may be pres-ent in arctic populations, and if so, could alter ourresults. Counter to this conclusion by Harvati andWeaver (2006), Hanihara (1997, 2000) and Perez et al.(2007) find that facial morphology can indeed illuminatepopulation structure and history.
MATERIALS AND METHODS
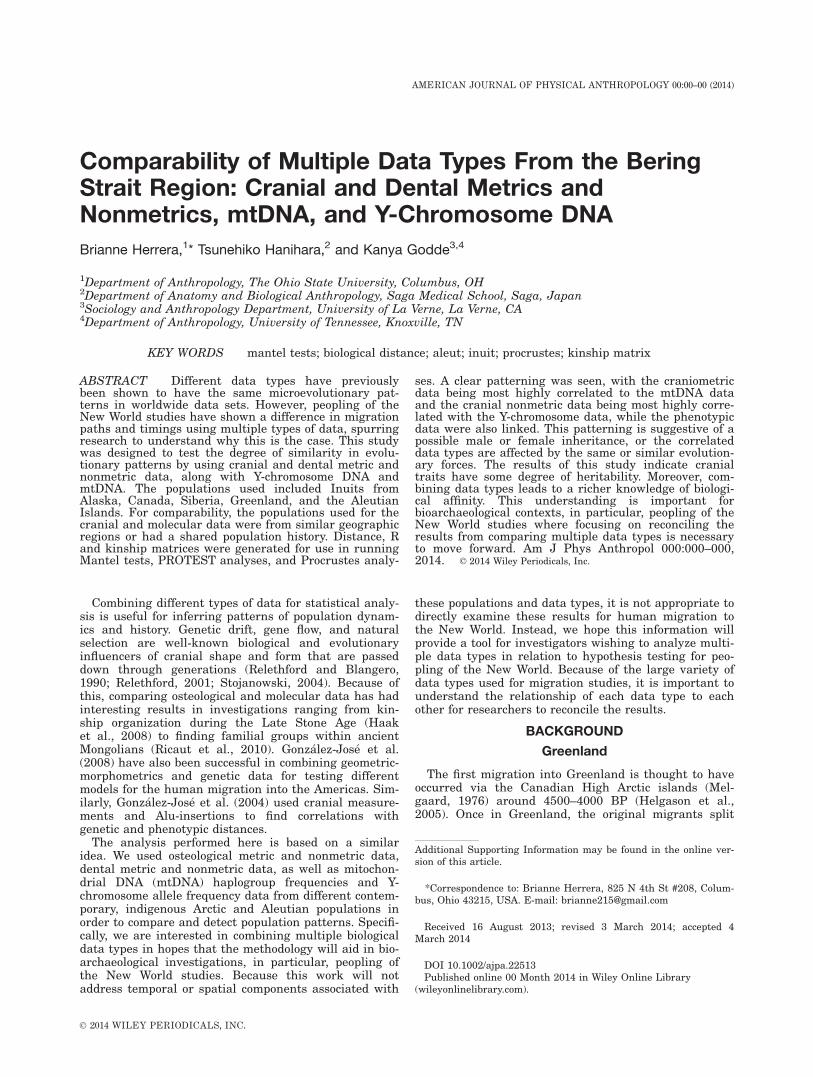
The data sets in this project were comprised of cranio-metric, cranial nonmetric, dental metric, dental nonmet-ric, Y-chromosome, and mtDNA. A map of the locationsfor each population from which each data type wasobtained is provided in Figure 1. The map was madewith data from Natural Earth and constructed in CranR (R Development Core Team, 2005), using the packagesmaptools (Bivand et al., 2013), maps (Becker et al.,2013), and mapproj (McIlroy et al., 2013). To test ournull hypothesis that all data types provide an equivalent
estimation of biological affinity, kinship matrices weregenerated from each separate data type. We followed theprotocol set forth by Spradley (2006) who compared kin-ship matrices among craniometric and allele data usingRMET 5.0 (Relethford, 2003) and Kship (Jantz, n.d.).
Cranial and dental data
Data from cranial and dental markers in contempo-rary samples were collected by the second author (TH).This data set is rich in comparative qualities as manycrania were observed for each of the four phenotypicdata types: craniometric, cranial nonmetric, dental met-ric, and dental nonmetric, with the craniometric datarepresented by Howells’ and Martin’s measurements(Table 1) (Martin and Saller, 1957; Howells, 1973). Thus,the nature of the datasets allowed us to create smallersubsets comprised of identical individuals who had beenobserved/measured for each of the data types.
Metric data and nonmetric data are subject to differ-ent variable selection methods to contend with theattributes of each data type. However, as the goal of thisarticle is comparability of the different data types, simi-larity in variable selection techniques was also necessi-tated. Measurements were scarce in several of thesamples included in this analysis. RMET 5.0 (Relethford,2003) does not process missing data, and thus eitherestimation of missing data must be undertaken, or themissing data eliminated. Traditionally, missing data isestimated. However, as the purpose of this article ismethodological and to provide correlation estimates fromcomparable raw data sources, estimation of missing datacould potentially bias the results and was avoided. Thus,variables and cases with excessive missing data wereeliminated.
Cranial and dental nonmetric data are also subject toa different set of data selection procedures. First, bilat-eral traits must be counted in an appropriate manner.We followed the procedure set forth in Konigsberg (1987)where both sides were observed and asymmetric traitswere randomly selected as to which side was utilized instatistical analyses. Variables with excessive amounts ofmissing data were eliminated, as were individual casespresenting an excessive pattern of missing values, inorder to approximate a similar data set to the metric
Fig. 1. Map of world regions represented by the variouspopulations utilized in this study.
TABLE 1. Howells and Martin cranial measurements used. Measurements starting with an “M” denote that Martin’s guidelineswere followed instead of Howells
Measurementabbr. Measurement description
Measurementabbr. (cont’d) Measurement description
GOLa,b Maximum cranial length OCCa,b Lambda-opisthion chordNOLa,b Nasion-opisthocranion M43a Breadth between
frontomalare temporaleBNLa,b Cranial base length DKBa Interorbital breadthXCBa,b Maximum cranial breadth M51a Orbital breadthM9a Minimum frontal breadth OBHa Orbital heightAUBa,b Biauricular breadth NLBa Nasal breadthASBa,b Biasterionic breadth NLHa Nasal heightBBHa,b Basion-bregma height MDBa Mastoid widthM26a Sagittal frontal arc M431a Frontal chordM27a Sagittal parietal arc M43Ca Frontal subtenseM28a Sagittal occipital arc XFBb Maximum frontal breadthFRCa,b Nasion-bregma chord BPLb Basion prosthion lengthPACa,b Bregma-lambda chord NPHb Nasion prosthion height
a Represents measurements used in matched data sets.b Represents measurements used in unmatched sets.
COMPARABILITY OF MULTIPLE DATA TYPES 3
American Journal of Physical Anthropology

data (these are the unmatched data sets). Once this pro-cedure was followed, the metric and nonmetric data setswere compared and reduced further to create data setswith identical individuals across populations, samples,and data types (deemed the matching data sets). Thus,there are two types of data we worked with: 1) unmatch-ing data sets where the individuals included differedfrom data type to data type, and 2) matching data setswhere data types were extracted from the exact sameindividuals. The final list of the Howells’ and Martin’scranial measurements utilized are listed in Table 1, andthe variables retained for the cranial nonmetric datasets
are located in Table 2. The total sample size for the cra-nial metric data is 708 individuals and the sample sizefor the cranial nonmetric data is 766 individuals, asshown in Table 3. The sample size for the dental metricand nonmetric data is 202 and 210 individuals, respec-tively. This is shown in Tables 4 and 5.
Y-chromosome data
The Y-chromosome contains numerous genes, is onlypaternally inherited, and is only carried by (or present in)males. Data for the Y-chromosome can be found in manyforms: short tandem repeats (STRs), single-nucleotidepolymorphisms (SNPs), haplotypes, haplogroups, andothers (Karafet et al., 1999; Ruiz-Linares et al., 1999;Wozniak et al., 2007). Our particular study utilizes allelefrequencies from Y-linked STRs. All the data used werefrom previously published data, shown in Table 6.Also, as numerated in Table 6, a total of 913 individualswere used in this analysis. The frequencies were calcu-lated by hand in Microsoft Excel (Microsoft, 2012),which were then put into the program Kship (Jantz,n.d.). Using this program, kinship and genetic distancematrices were found.
Mitochondrial DNA
Mitochondrial DNA (mtDNA) is only maternally inher-ited, but is present in both males and females. It is com-monly used in genetic studies because of its fastmutation rate. This allows researchers to more easilytrack new heritable mutations, which are subsequentlypassed along to offspring. These minute differences allowresearchers to more easily distinguish between groups ofpeople (Schurr, 2002, 2004). The data used for the
TABLE 2. The cranial nonmetric traits utilized in the matchedand unmatched analyses
Measurement descriptionMeasurement
abbr.
Nasofrontal and frontomaxillary sutures NFSa
Medial palatine canal MPCa
Hypoglossal canal bridging HGCBa,b
Condylar canal CCAa,b
Tympanic dehiscence TDa,b
Precondylar tubercle PCTa
Ovale-spinosum confluence OSCa
Supraorbital foramen SOFa,b
Transverse zygomatic suture vestige TZSb
Ossicle at lambda OLa
Interparietals (os incae) IPa
Biasterionic suture BASa,b
Accessory mental foramen AMFa
Occipitomastoid bone OMBa
a Represents traits used in matched analyses.b Represents traits used in unmatched analyses.
TABLE 3. Cranial metric and nonmetric data, showing source population, number of individuals location of samples, and thesources
Population Original NaFinal Na
unmatchingFinal Na
matching Location Source
Alaska1 135 and 146 114 and 146 112 and 112 Alaskan Yupik Eskimos from: Togiak;Mumtrak; Tanunak; Bethel; Hooper Bay;Iliamna Lake; Yukon; Kwichak; Nushagakand Kuskokwim River Basin; St LawrenceIsland
TH
Alaska2 107 and 107 101 and 107 101 and 101 Alaskan Inupiat Eskimos from: SewardPeninsula, Shishmaref, Wales, Postolik,Nome, Little Diomede Island, Point Hope
TH
Alaska3 81 and 125 54 and 125 54 and 54 Alaska Eskimos from Point Barrow, Utkia-vik, Nixerak.
TH
Siberia 23 and 21 22 and 21 20 and 20 Port Providence, Plover Bay, Puoten, IndianPoint, NE Siberia.
TH
Canadian 30 and 28 25 and 28 25 and 25 Pond’s Inlet, Sculpin Island, Labrador,Manico Point, Southampton IslandCumberland Golf, Buffin Island
TH
Greenland 112 and 115 96 and 112 93 and 93 Smith Sound, Port Foulke, Western District,Nuussuaq; Ikertok Fiord, North Star Bay,Saunders Island
TH
Aleut1 102 and 102 61 and 102 60 and 60 Amaknak, Unalaska, Unga, Umnak, Wislow,and Shiplock Islands/Fox Islands of Aleu-tian Island chain.
TH
Aleut2 71 and 60 26 and 60 26 and 26 Samalga Island Quad, Kagamil Island. THAleut3 13 and 13 10 and 12 10 and 10 Kanaga, Amlia, Adak, and Atka Islands;
Andreanof Islands.TH
Aleut4 18 and 29 14 and 18 13 and 13 Amchitka and Kiska Islands; Rat Islands. THAleut6 16 and 20 8 and 20 8 and 8 Aleutian Island Chain—unknown locality TH
a The first number represents the sample size from the craniometric data, the second number represents the sample size from thecranial nonmetric data.
4 B. HERRERA ET AL.
American Journal of Physical Anthropology
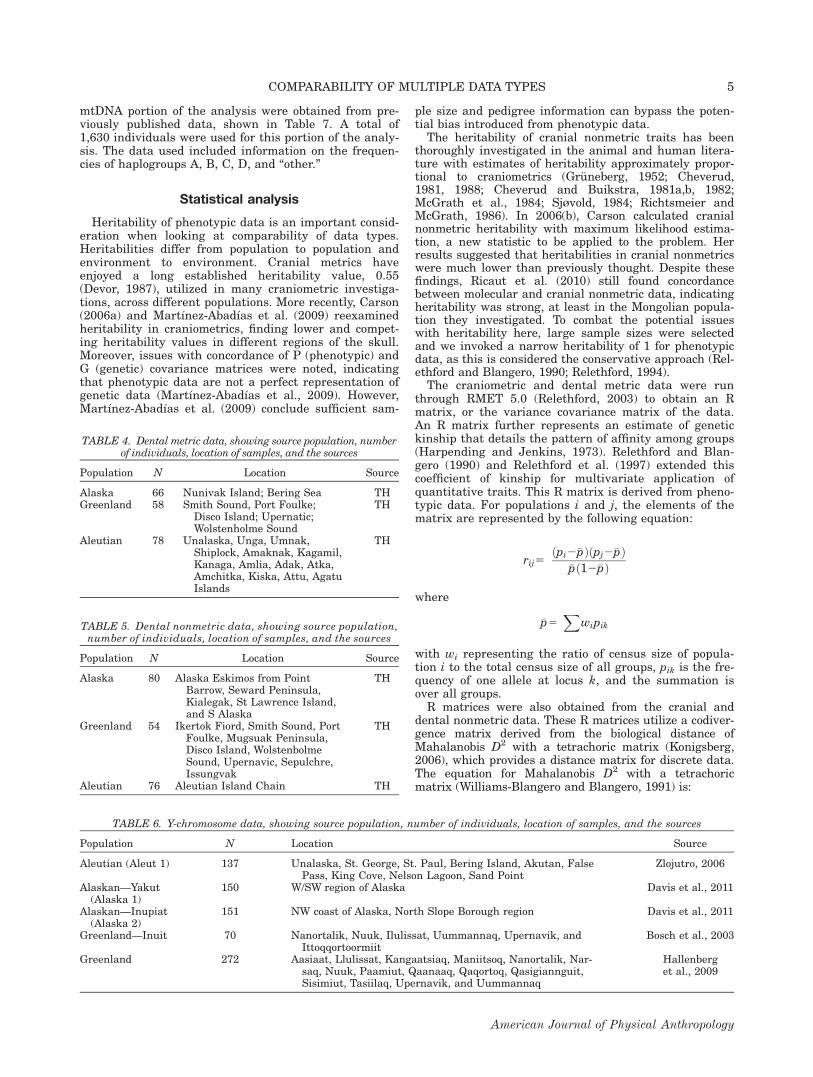
mtDNA portion of the analysis were obtained from pre-viously published data, shown in Table 7. A total of1,630 individuals were used for this portion of the analy-sis. The data used included information on the frequen-cies of haplogroups A, B, C, D, and “other.”
Statistical analysis
Heritability of phenotypic data is an important consid-eration when looking at comparability of data types.Heritabilities differ from population to population andenvironment to environment. Cranial metrics haveenjoyed a long established heritability value, 0.55(Devor, 1987), utilized in many craniometric investiga-tions, across different populations. More recently, Carson(2006a) and Mart!ınez-Abad!ıas et al. (2009) reexaminedheritability in craniometrics, finding lower and compet-ing heritability values in different regions of the skull.Moreover, issues with concordance of P (phenotypic) andG (genetic) covariance matrices were noted, indicatingthat phenotypic data are not a perfect representation ofgenetic data (Mart!ınez-Abad!ıas et al., 2009). However,Mart!ınez-Abad!ıas et al. (2009) conclude sufficient sam-
ple size and pedigree information can bypass the poten-tial bias introduced from phenotypic data.
The heritability of cranial nonmetric traits has beenthoroughly investigated in the animal and human litera-ture with estimates of heritability approximately propor-tional to craniometrics (Gr"uneberg, 1952; Cheverud,1981, 1988; Cheverud and Buikstra, 1981a,b, 1982;McGrath et al., 1984; Sj!vold, 1984; Richtsmeier andMcGrath, 1986). In 2006(b), Carson calculated cranialnonmetric heritability with maximum likelihood estima-tion, a new statistic to be applied to the problem. Herresults suggested that heritabilities in cranial nonmetricswere much lower than previously thought. Despite thesefindings, Ricaut et al. (2010) still found concordancebetween molecular and cranial nonmetric data, indicatingheritability was strong, at least in the Mongolian popula-tion they investigated. To combat the potential issueswith heritability here, large sample sizes were selectedand we invoked a narrow heritability of 1 for phenotypicdata, as this is considered the conservative approach (Rel-ethford and Blangero, 1990; Relethford, 1994).
The craniometric and dental metric data were runthrough RMET 5.0 (Relethford, 2003) to obtain an Rmatrix, or the variance covariance matrix of the data.An R matrix further represents an estimate of genetickinship that details the pattern of affinity among groups(Harpending and Jenkins, 1973). Relethford and Blan-gero (1990) and Relethford et al. (1997) extended thiscoefficient of kinship for multivariate application ofquantitative traits. This R matrix is derived from pheno-typic data. For populations i and j, the elements of thematrix are represented by the following equation:
rij5"pi2#p#"pj2#p#
#p"12#p#
where
#p5X
wipik
with wi representing the ratio of census size of popula-tion i to the total census size of all groups, pik is the fre-quency of one allele at locus k, and the summation isover all groups.
R matrices were also obtained from the cranial anddental nonmetric data. These R matrices utilize a codiver-gence matrix derived from the biological distance ofMahalanobis D2 with a tetrachoric matrix (Konigsberg,2006), which provides a distance matrix for discrete data.The equation for Mahalanobis D2 with a tetrachoricmatrix (Williams-Blangero and Blangero, 1991) is:
TABLE 4. Dental metric data, showing source population, numberof individuals, location of samples, and the sources
Population N Location Source
Alaska 66 Nunivak Island; Bering Sea THGreenland 58 Smith Sound, Port Foulke;
Disco Island; Upernatic;Wolstenholme Sound
TH
Aleutian 78 Unalaska, Unga, Umnak,Shiplock, Amaknak, Kagamil,Kanaga, Amlia, Adak, Atka,Amchitka, Kiska, Attu, AgatuIslands
TH
TABLE 5. Dental nonmetric data, showing source population,number of individuals, location of samples, and the sources
Population N Location Source
Alaska 80 Alaska Eskimos from PointBarrow, Seward Peninsula,Kialegak, St Lawrence Island,and S Alaska
TH
Greenland 54 Ikertok Fiord, Smith Sound, PortFoulke, Mugsuak Peninsula,Disco Island, WolstenbolmeSound, Upernavic, Sepulchre,Issungvak
TH
Aleutian 76 Aleutian Island Chain TH
TABLE 6. Y-chromosome data, showing source population, number of individuals, location of samples, and the sources
Population N Location Source
Aleutian (Aleut 1) 137 Unalaska, St. George, St. Paul, Bering Island, Akutan, FalsePass, King Cove, Nelson Lagoon, Sand Point
Zlojutro, 2006
Alaskan—Yakut(Alaska 1)
150 W/SW region of Alaska Davis et al., 2011
Alaskan—Inupiat(Alaska 2)
151 NW coast of Alaska, North Slope Borough region Davis et al., 2011
Greenland—Inuit 70 Nanortalik, Nuuk, Ilulissat, Uummannaq, Upernavik, andIttoqqortoormiit
Bosch et al., 2003
Greenland 272 Aasiaat, Llulissat, Kangaatsiaq, Maniitsoq, Nanortalik, Nar-saq, Nuuk, Paamiut, Qaanaaq, Qaqortoq, Qasigiannguit,Sisimiut, Tasiilaq, Upernavik, and Uummannaq
Hallenberget al., 2009
COMPARABILITY OF MULTIPLE DATA TYPES 5
American Journal of Physical Anthropology

d2ij5"zik2zjk#
0T21"zik2zjk#
where zik is the threshold for the frequency of trait k ingroup i, zjk is the threshold for the frequency of trait kin group j, and T is the tetrachoric matrix. A narrowheritability of 1 was assumed to be consistent acrossmetric and nonmetric analyses. These distance matrices(cranial nonmetric and dental nonmetric) were computedin Fortran95 with programming provided by Dr. LyleKonigsberg (personal communication). The C and R mat-rices were generated in R (R Development Core Team,2005) with scripts provided by Dr. Lyle Konigsberg (per-sonal communication). A detailed explanation of thismethodology is found in Konigsberg (2006).
All R and kinship matrices were subject to ordination,via a principal coordinates analysis (PCO). The eigenvec-tors were scaled by the square root of their individualeigenvalues. Each kinship or R matrix was subject to aseries of two-way Mantel tests (Mantel, 1967) comparingit to another kinship or R matrix computed from a differ-ent data type. The two-way Mantel tests allow for the esti-mation of the correlation between two matrices andprovide a P value representing the significance of the cor-relation. The Mantel tests were completed in R using thevegan package (Oksanen, 2013; Oksanen et al., 2013).There were ten combinations of data (the matching andunmatching sets of 1) cranial metric and nonmetric, 2)cranial metric and Y-chromosome DNA, 3) cranial metricand mtDNA, 4) cranial nonmetric and Y-chromosomeDNA, 5) cranial nonmetric and mtDNA) used for the Man-tel tests, and subsequent statistical analyses.
The various data types have different units, whichlimits a direct comparison. To adjust for this, a Pro-crustes analyses was performed in R using the veganpackage (Oksanen, 2013; Oksanen et al., 2013). A Pro-crustes analysis is a shape analysis that does a lineartransformation, which can include scaling, reflection,rotation, or translation of the elements in a matrix tobest fit the orientation of a second matrix. Additionally,it minimizes the sum of squares deviations, or the m2
term. In this case, the Procrustes analysis was per-formed on the principal coordinates for different combi-nations of two sets of data, as in Konigsberg andHerrmann (2001). Like Konigsberg and Herrmann(2001) and Konigsberg and Ousley (1995), the resultanttransformed principal coordinates were subsequentlygraphed using scatterplot3D in R (Ligges and M"achler,2003). R scripts written for this manuscript will be madeavailable for download at: https://sites.google.com/site/drgodde/r-scripts.
To determine whether m2 is smaller than what wouldoccur by chance, a PROTEST analysis was run using thevegan package in R (Oksanen, 2013; Oksanen et al.,2013). PROTEST has enjoyed application in ecology/evo-lution studies (e.g., D’Anatro and Lessa, 2011), and morerecently in anthropology (Relethford, 2009), making itan established tool in population genetics. The PRO-TEST performs permutations on the data sets and deter-mines concordance between the data sets morepowerfully than the Mantel test (Peres-Neto and Jack-son, 2001). In other words, if the Mantel test shows nostatistical significance in concordance between data setsbut the PROTEST does, then there is an underlyingrelationship between the two sets that was undetectableby the Mantel test.
The Procrustes analysis can be informative about thevariation of the shape of the data set, but not the indi-vidual points (in this case populations) and should notbe used for such purposes. The Procrustes analysis alsominimizes the shape differences among the differentdata types and uses a least-squares analysis to distrib-ute the variance equally among all of the points. If vari-ation is needed for the individual points rather than theshape of the whole set, a Euclidean Distance MatrixAnalysis (EDMA) should be used instead (Lele, 1993).
RESULTS
The dental data was eliminated from the analysis dueto small sample size and the subsequent failure of the
TABLE 7. MtDNA data showing source population, number of individuals, location of samples, and the sources
Population N Location Source
Aleutians (Aleut 1) 198 Atka, Umnak Island, Unalaska, St. George and St.Paul Islands, Anchorage
Rubicz et al., 2003
Aleutians (Aleut 2) 78 Pribilof Island—St. Paul Merriwether et al., 1995Aleutians (Aleut 3) 35 Bering Island of the Commanders Zlojutro et al., 2006Greenland Eskimo 98 Nanortalik, Nuuk, Ilulissat, Uummannaq, and
Upernavik, Ammassalik and IttoqqortoormiitSaillard et al., 2000;
Shields et al., 1993Siberian Eskimo 90 Chukotka, Nganasan of the Taimir Peninsula, Lower
Amur River in Siberia, Chukchi Peninsula. Chukchiand Siberian Eskimos collected in New Chaplino,Sireniki, Provideniya, and Anadyr.
Derbeneva et al., 2002;Shields et al., 1993;Starikovskaya et al., 1998
Pre AD 1000 Aleuts (Aleut 4) 8 Umnak Island Smith et al., 2009Post AD 1000 Aleuts (Aleut 5) 12 Umnak Island Smith et al., 2009Living Aleuts (Aleut 6) 58 Umnak Island Smith et al., 2009Canada 96 Cambridge Bay (Victoria Island)—Kitikmeot region of
Nunavut in CanadaVolodko et al., 2008
Greenland 385 Ammassalik, Aasiaat, Ilulissat, Maniitsoq, Nanortalik,Narsaq, Nuuk, Paamiut, Qaqortoq, Qasiqiannguit,Qeqertarsuaq, Sisimiut, Uummannaq, and Qaanaaq
Volodko et al., 2008
Alaska1 (Yupik) 25 Akutan, False Pass, King Cove, Nelson Lagoon, andSand Point
Zlojutro et al., 2009b (fromJH Simonson and GHShields, unpublished data)
Alaska2 (Inupiat) 255 Kodiak Island, St. Lawrence Island, and SW Alaska Merriwether et al., 1995Asian (Siberia) 126 Naukan—collected in Lavrentiya (Chukotskiy district,
Chukotkan autonomous Region)Volodko et al., 2008
6 B. HERRERA ET AL.
American Journal of Physical Anthropology
algorithms to converge. Thus, only cranial phenotypicdata will be considered. Two-tailed P values for the Man-tel test were generated, using multiple combinations ofthe data, to test the null hypothesis that these popula-tions are not genetically related. The two-tailed P valuesare listed in Table 8 (all R matrices provided in the Sup-
plementary Information). A two-tailed P value is moreappropriate to use in this case, rather than the one-tailed P value, because the directionality of the relation-ship between the different data sets is not limited to oneside or the other. The null hypothesis for the Mantel testis that the data sets are not correlated. Using this level
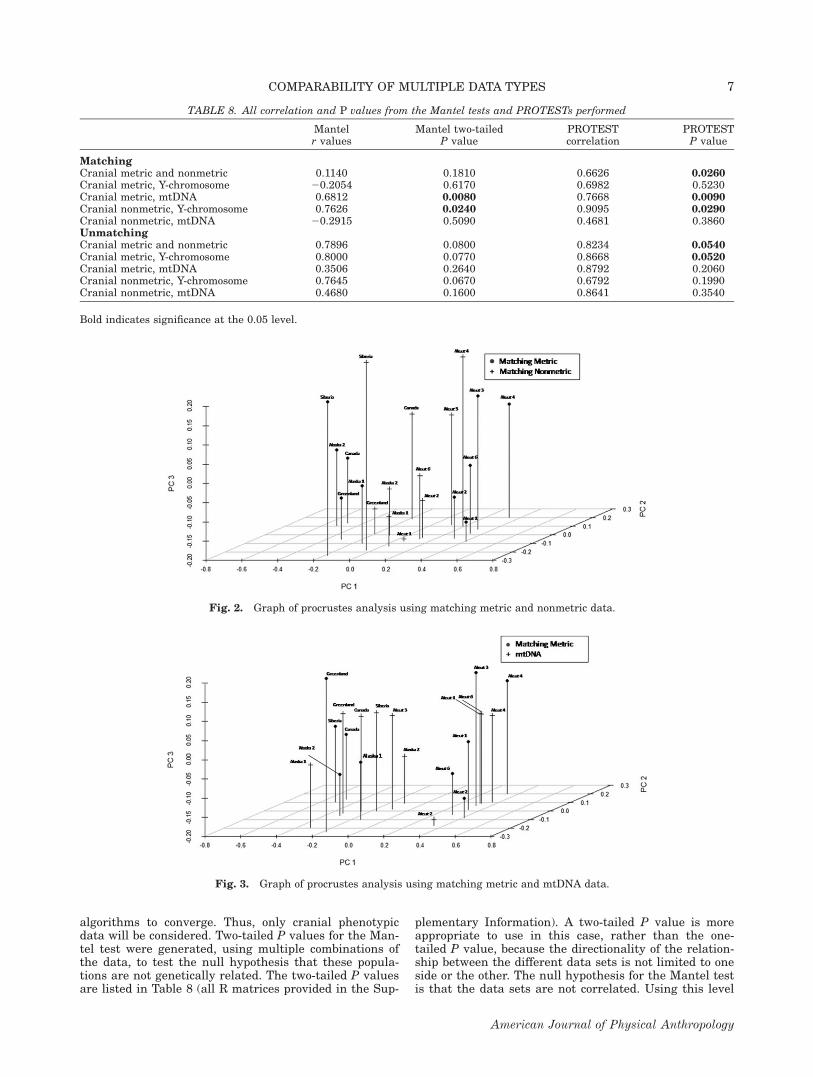
TABLE 8. All correlation and P values from the Mantel tests and PROTESTs performed
Mantelr values
Mantel two-tailedP value
PROTESTcorrelation
PROTESTP value
MatchingCranial metric and nonmetric 0.1140 0.1810 0.6626 0.0260Cranial metric, Y-chromosome 20.2054 0.6170 0.6982 0.5230Cranial metric, mtDNA 0.6812 0.0080 0.7668 0.0090Cranial nonmetric, Y-chromosome 0.7626 0.0240 0.9095 0.0290Cranial nonmetric, mtDNA 20.2915 0.5090 0.4681 0.3860UnmatchingCranial metric and nonmetric 0.7896 0.0800 0.8234 0.0540Cranial metric, Y-chromosome 0.8000 0.0770 0.8668 0.0520Cranial metric, mtDNA 0.3506 0.2640 0.8792 0.2060Cranial nonmetric, Y-chromosome 0.7645 0.0670 0.6792 0.1990Cranial nonmetric, mtDNA 0.4680 0.1600 0.8641 0.3540
Bold indicates significance at the 0.05 level.
Fig. 2. Graph of procrustes analysis using matching metric and nonmetric data.
Fig. 3. Graph of procrustes analysis using matching metric and mtDNA data.
COMPARABILITY OF MULTIPLE DATA TYPES 7
American Journal of Physical Anthropology
of significance, two out of the eleven combinations arestatistically similar (the matching metric and mtDNA,and matching nonmetric and Y-chromosome), allowingus to reject the null hypothesis for these two combina-tions of data. The PROTEST, which is a better determi-nation of the underlying relationship between data sets,demonstrates statistically significant similaritiesbetween an additional combination (the matching metricand nonmetric set). The mtDNA and Y-chromosomeDNA were not run against each other because it would
be a correlation between two different sets of inheri-tance. Except in the case of inbreeding, any correlationsmight be spurious.
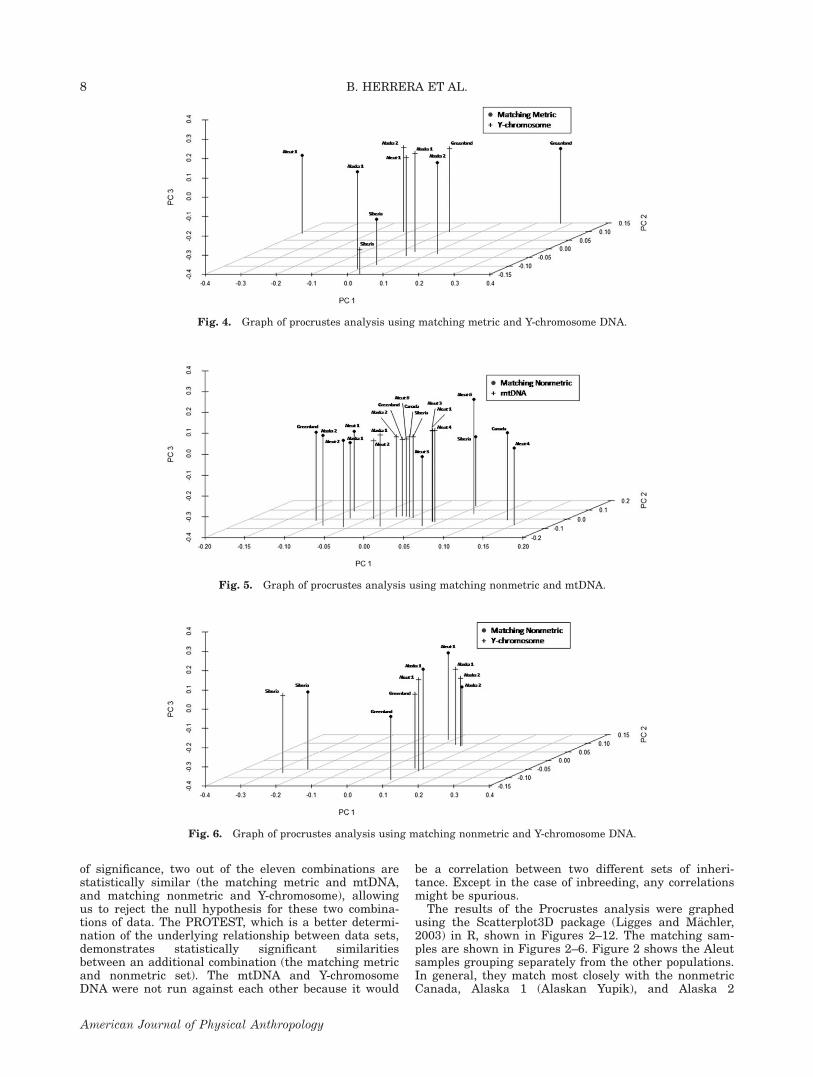
The results of the Procrustes analysis were graphedusing the Scatterplot3D package (Ligges and M"achler,2003) in R, shown in Figures 2–12. The matching sam-ples are shown in Figures 2–6. Figure 2 shows the Aleutsamples grouping separately from the other populations.In general, they match most closely with the nonmetricCanada, Alaska 1 (Alaskan Yupik), and Alaska 2
Fig. 4. Graph of procrustes analysis using matching metric and Y-chromosome DNA.
Fig. 5. Graph of procrustes analysis using matching nonmetric and mtDNA.
Fig. 6. Graph of procrustes analysis using matching nonmetric and Y-chromosome DNA.
8 B. HERRERA ET AL.
American Journal of Physical Anthropology

(Alaskan Inupiat) populations. All samples appear tomatch with their counterpart in all three dimensions—principal coordinates 1, 2, and 3. Figure 3 also shows
the Aleut samples grouping together, with the exceptionof the mtDNA Aleut 3 (Bering Island), which is closestto the mtDNA Siberia sample (Chukchi).
Fig. 7. Graph of procrustes analysis using unmatching metric and nonmetric data.
Fig. 8. Graph of procrustes analysis using unmatching metric and mtDNA.
Fig. 9. Graph of procrustes analysis using unmatching metric and Y-chromosome DNA.
COMPARABILITY OF MULTIPLE DATA TYPES 9
American Journal of Physical Anthropology

Focusing on only the statistically significant combina-tions, the matching metric and mtDNA Procrustes anal-ysis show a clear distinction between the Aleutians andthe rest of the populations, except the Aleut three group.The same is true for the matching metric and nonmetriccombination, with a similarity in location of the pointsin all dimensions from all populations, except in the caseof the Canadian population. The matching nonmetricand Y-chromosome set has very similar locationsbetween all points in all dimensions, with the farthestapart being the Aleut 1 population.
Most of the samples are similar to their counterpart inall three dimensions, with the exception of Alaska 1,Alaska 2, and Aleut 6. Figure 4 does not strongly showthis three-dimensional similarity with the samples used.This represents the higher P values from Table 8. TheAleut 1 metric sample groups away from the others, asdoes the Greenland metric sample. Similarly, the Aleut 1Y-chromosome sample is closest to the Alaska 1 Y-chromosome sample (Yakut). The Greenland Y-chromosome sample (Inuit) is closest to the Alaska 2(Inupiat) metric sample. Figure 5 shows a strongergrouping of data type samples instead of populationsamples. The nonmetric samples have several groupings:Aleut 4 and Canada, Aleut 6 and Siberia, Alaska 2 andGreenland, and finally Aleut 2, Alaska 1, and Aleut 1.
The mtDNA groupings are as follows: Aleut 1, 3, 4, fol-lowed by Alaska 1 and Aleut 2, and Alaska 2, Green-land, Aleut 6, Canada, and Siberia. Figure 6demonstrates similarity in all dimensions between allsample combinations, but the Aleut 1 nonmetric sample(Unalaska) matches most closely with the Alaska 1 Y-chromosome sample (Western Alaskan Yakut). The oppo-site is also true, with the Aleut 1 Y-chromosome sample(Unalaska) matching most closely with the Alaska 1nonmetric sample (Yakut).
The unmatching Procrustes graphs are provided inFigures 7–11. Figure 7 demonstrates similarity in alldimensions for all population pairs. The exception tothis is that there is a large difference in principal coordi-nates 2 and 3 for the Alaska 2 population pair. TheAleut populations cluster separately, but nearby to theother populations. The Greenland population pair is thefarthest removed. Figure 8 has similarities between alldimensions for the population pairs. The Aleutian popu-lations group separately, as do the two Alaskan popula-tion pairs and the Greenland population pair. The sameholds true for Figure 9. In Figure 10, the Aleut 1 andAlaska 1 population pairs group together. Otherwise, themtDNA Alaska 2 (Inupiat) and the mtDNA Greenlandpopulations group together. Lastly, Figure 11 shows mul-tiple groupings: nonmetric Alaska 1 (Yupik) and 2
Fig. 10. Graph of procrustes analysis using unmatching nonmetric and mtDNA.
Fig. 11. Graph of procrustes analysis using unmatching nonmetric and Y-chromosome DNA.
10 B. HERRERA ET AL.
American Journal of Physical Anthropology
(Inupiat) with Y-chromosome Greenland, as well as Y-chromosome Alaska 1 (Yupik) and 2 (Inupiat) with non-metric Greenland Inuit. The Aleut populations groupseparately and match in three-dimensions except forprincipal coordinates 2 and 3 for Aleut 1.
DISCUSSION
P values from Mantel tests of the matching data indi-cate that the craniometric and mtDNA data combinationhave a statistically significant correlation. The sameholds true for the cranial nonmetric and Y-chromosomecombination. More simply stated, the two types of dataprovide similar information. These significant correla-tions extend beyond the phenotype to the genetics; thetwo phenotypes (metric and nonmetric) also demonstratea significant association between them. The concordanceof the skeletal data to the molecular data will bedescribed in detail, below, as well as population affinitiesof the Northern demes and application of this methodol-ogy to peopling of the New World hypothesis testing.
The P values associated with the PROTEST analysisindicate that three combinations (matching cranial met-ric and nonmetric, matching cranial metric and mtDNA,matching cranial nonmetric and Y-chromosome) all canreject the null hypothesis at the 0.05 significance level.Two additional combinations (the unmatching cranialmetric and nonmetric, and the unmatching metric andY-chromosome) are equivalent to 0.05 and still representa significant relationship among the data types. Theseresults are consistent with work by Ricaut et al. (2010)who found similar correlations between nonmetric dataand genetic markers, demonstrating some degree of her-itability with nonmetric traits. Other studies have alsofound some degree of heritability in cranial metric ornonmetric traits (e.g., Sj!vold, 1984; Cheverud, 1988;Relethford, 1994; Sparks and Jantz, 2002; Carson,2006a, 2006b; Mart!ınez-Abad!ıas et al., 2009).
The Mantel and PROTEST results support the neutraltheory of evolution, where genetic and phenotypic dis-tances would be similar or proportional (Roseman andWeaver, 2007). This also supports Mart!ınez-Abad!ıaset al. (2009), in that our mostly large sample sizes mayhave circumvented the issues they noted with discon-cordance in smaller sample sizes. The significant associ-ation between the unmatched cranial metric and Y-chromosome data could be spurious, which is supportedby the lack of significance in the matched cranial metricto Y-chromosome data. However, the sample size anddemes differed between the matched and unmatcheddata sets, which may have led to a difference in signifi-cance between the two. With these conflicting results,the most appropriate interpretation is the conservativeapproach: the association between craniometrics and Y-chromosome data is inconclusive. The confirmed associa-tion between the specific molecular and phenotypic datamay be as a result of similar evolutionary forces. Itappears to be the case that evolutionary forces affectingthe Y-chromosome also affect nonmetric cranial traits.The same may hold true for metric traits and mtDNA.
The Procrustes graphs generally reflect the P valuesshown in Table 8, with the statistically significant com-binations showing more concordance in the graphs.These graphs clearly show a distinction between theAleut and other populations. The demes with the mostsimilarity to the Aleutian ones were, in general, Alaska1 and 2. Most of the demes grouped according to their
counterpart in the corresponding data type. This holdsparticularly true for the combinations that were foundto be statistically significant (see Table 8).
For the most part, the samples clustered by populationaffinity across data types, supporting the respective pop-ulation histories. In general, the graphical differencesamong correlated data types appear to be complimen-tary, rather than competing. Thus, when combined theyprovide a more complete picture of population relation-ships. The Aleutian and Alaskan samples typicallyappeared nearby in the figures, which is consistent withdocumented cultural diffusion (Corbett et al., 1997). Spe-cifically, Figures 2 and 5 show Aleut2 clustered near theAlaskan demes. This Aleut sample is comprised of indi-viduals from east of the Rat Islands. Cultural diffusionis evident all the way to the Rat Islands and the NearIslands, where the level of shared culture decreases dra-matically (Corbett et al., 1997). Thus, the relationship ofAlaskan Inuits with Aleutians east of the Rat Islandsmakes sense in light of the ethnographic and archaeolog-ical evidence. Additionally, Greenland and Alaskandemes clustered together in Figures 2–5 and 8–11.
The Alaskan Yupik, Inupiat, and Greenland Inuit rela-tionship can be confirmed through genetic evidence.There is currently debate about the exact relationshipbetween the Alaskan Thule (ancestors to both the Alas-kan Yupik and Inupiat) and the Greenlandic Inuit (Sail-lard et al., 2000; Melgard et al., 2005; Dulik et al.,2012). This debate centers around whether the Thulealone gave rise to the Greenlandic Inuit, or whether theInuit formed from interactions between the Dorset andThule (Dulik et al., 2012). In either case, there is evi-dence for gene flow between the Thule and Inuit. Thereis some historical evidence as well. The Thule adoptedseveral Dorset technologies, such as snow houses andknives (Stern, 2010). It is also known that the Norsehad interactions with the Thule and Inuit in Greenland(Stern, 2010). These historical and genetic relationshipsare again uncovered by our combination of Y-chromosome and cranial nonmetric data.
No skeletal data type should display a perfect correla-tion with DNA; environmental influence prohibits thisfrom occurring. What is interesting in the findings hereis some correlations with genetic data are high, indicat-ing some heritability of these traits when considered asa group. The amount of probable heritability lends sup-port for using cranial metrics or nonmetrics as proxiesfor genetic material. Specifically, this work shows thatcranial metrics can likely be used as a proxy for mtDNAhaplogroup frequencies and cranial nonmetrics canlikely be used as a proxy for Y-chromosome DNA fre-quencies. Moreover, craniometrics and cranial nonmet-rics agree, here, showing that one is not necessarilysuperior to the other.
The evidence that some heritability exists (althoughnot quantified) amongst the cranial metric and nonmet-ric traits is important for researchers wishing to investi-gate greater bioarchaeological hypotheses, in particular,peopling of the New World. Peopling of the New World ismentioned here because of the lack of agreementbetween data types resulting in conflicting hypotheses.Ancient DNA is difficult to obtain from important skele-tal specimens for peopling of the New World, datingback 15000–20000 BP. Therefore, furthering the under-standing of the complicated relationship between cranialdata and genetics is important for improving upon cur-rent methodologies. Further, while there are seemingly
COMPARABILITY OF MULTIPLE DATA TYPES 11
American Journal of Physical Anthropology

contradictory studies on peopling of the New Worldinvolving either cranial morphology or genetics (Green-berg et al., 1986; Bonatto and Salzano, 1997; Powell andNeves, 1999; Schurr and Sherry, 2004; Tamm et al.,2007; Mulligan et al., 2008; Perez et al., 2009; Hubbeet al., 2010; Pitblado, 2011), it is likely that each of thesedata types are showing only a portion of the whole story,as evidenced in the figures.
Our work is not without bias. Although, the mtDNA/craniometric and Y-chromosome/cranial nonmetric pat-terns emerged more than once, indicating we are prop-erly modeling the structure of this data set, we cannotdiscount that these findings are population specific. Fur-ther, our samples were all from the same time period(all contemporary), but the exact census population sizesare not known. The same people within each populationalso could not be used to obtain both DNA and cranialmetric/nonmetric traits, which could have introducederror and implies that the correlations are only the mini-mum estimate (Roseman, 2004). Without further studiesinvolving extraction of all data types from the same indi-viduals, the extent to which this affected the resultsshown are unknown. To best remedy this potential bias,we used similar demes to compare to each other. Eachgroup used to approximate another has a known sharedhistory or interaction with the other. This increased theodds that there was gene flow between these peoples,and thus the demes should reflect similar geneticvariation.
In sum, the results here demonstrate that cranial phe-notypic data (metric and nonmetric) are linked and areexcellent proxies for mtDNA and Y-chromosome DNA.The correlations of phenotypic and genetic data arehighly specific (mtDNA to metrics and Y-chromosome tononmetric). Although exact heritabilities were not calcu-lated here, the high concordance of the molecular andphenotypic data indicates that some genetic heritabilityis present among these data types. The biological affin-ities uncovered were consistent with population histor-ies, indicating our methodology is solid. Our study doesnot utilize temporal and spatial components, so thisstudy alone is not sufficient for interpretations of thehuman migration into the New World. In spite of this,our study has implications for research relating tomigration. Knowing how well each data type compli-ments each other is important for interpreting the vastamount of information different lines of research pro-vide. More inclusive research involving various datatypes and disciplines needs to be completed so a betterunderstanding of human events, e.g., migration, canoccur.
ACKNOWLEDGMENT
The authors thank Dr. Mark Hubbe, an Associate Edi-tor for AJPA, and the anonymous reviewers for theircomments and suggestions.
LITERATURE CITED
Battaglia V, Grugni V, Perego UA, Angerhofer N, Gomez-Palmieri JE, Woodward SR, Achilli A, Myres N, Torroni A,Semino O. 2013. The first peopling of South America: newevidence from Y-chromosome haplogroup Q. Plos One 8:1–13.
Becker R, Wilks A, Brownrigg R, Minka T. 2013. Maps: drawgeographical maps. R package version 2.3-6. Available at:http://CRAN.R-project.org/package=maps.
Berglund J. 1986. The decline of the Norse settlements inGreenland. Arctic Anthropol 23:109–135.
Bivand R, Lewin-Koh N, Pebesma E, Archer E, Baddeley A,Bibiko H-J, Brey S, Callahan J, Carrillo G, Dray S, ForrestD, Friendly M, Giraudoux P, Golicher D, Rubio VG,Hausmann P, Hufthammer KO, Jagger T, Luque S,MacQueen D, Niccolai A, Lamigueiro OP, Short T, Snow G,Stabler B, Stokely M, Turner R. 2013. Maptools: tools forreading and handling spatial objects. R package version 0.8-2.7. Available at: http://CRAN.R-project.org/package=maptools.
Bockstoce JR. 1973. A prehistoric population change in theBering Strait Region. Polar Rec 16:793–803.
Bonatto SL, Salzano FM. 1997. A single and early migration forthe peopling of the Americas supported by mitochondrialDNA sequence data. Proc Natl Acad Sci USA 94:1866–1871.
Bosch E, Calafell F, Rosser ZH, Norby S, Lynnerup N, HurlesME, Jobling MA. 2003. High level of male-biased Scandina-vian admixture in Greenlandic Inuit shown by Y-chromosomal analysis. Hum Genet 112:353–363.
Britton K, Knecht R, Nehlich O, Hillerdal C, Davis RS,Richards MP. 2013. Maritime adaptations and dietary varia-tion in prehistoric western Alaska: stable isotope analysis ofpermafrost-preserved human hair. Am J Phys Anthropol 151:448–461.
Candela PB. 1939. Blood-group determinations upon the bonesof thirty Aleutian mummies. Am J Phys Anthropol 24:361–383.
Carson E. 2006a. Maximum likelihood estimation of human cra-niometric heritabilities. Am J Phys Anthropol 131:169–180.
Carson E. 2006b. Maximum-likelihood variance componentsanalysis of heritabilities of cranial nonmetric traits. Hum Biol78:383–402.
Cheverud J. 1981. Variation in highly and lowly heritable mor-phological traits among social groups of rhesus macaques(Macaca mulatta) on Cayo Santiago. Evolution 35:75–83.
Cheverud J. 1988. A comparison of genetic and phenotypic cor-relations. Evolution 42:958–968.
Cheverud J, Buikstra J. 1981a. Quantitative genetics of skeletalnonmetric traits in the rhesus macaques on Cayo Santiago.II. Phenotypic, genetic, and environmental correlationsbetween traits. Am J Phys Anthropol 54:51–58.
Cheverud J, Buikstra J. 1981b. Quantitative genetics of skeletalnonmetric traits in the rhesus macaques on Cayo Santiago. I.Single trait heritabilities. Am J Phys Anthropol 54:43–49.
Cheverud J, Buikstra J. 1982. Quantitative genetics of skeletalnonmetric traits in the rhesus macaques of Cayo Santiago.III. Relative heritability of skeletal nonmetric and metrictraits. Am J Phys Anthropol 59:151–155.
Corbett DG, Lefevre C, Siegel-Causey D. 1997. The westernAleutians: cultural isolation and environmental change. HumEcol 25:459–479.
Crawford MH, Rubicz RC, Zlojutro M. 2010. Origins of Aleutsand the genetic structure of populations of the Archipelago:molecular and archaeological perspectives. Hum Biol 82:695–717.
D’Anatro A, Lessa E. 2011. Phenotypic and genetic variation inthe white croaker Micropogonias furnieri Desmarest 1823(Perciformes: Sciaenidae): testing the relative roles of geneticdrift and natural selection on population divergence. J Zool185:139–149.
Davis C, Ge J, Chidambaram A, King J, Turnbough K, CollinsM, Dym O, Chakraborty R, Eisenberg AJ, Budowle B. 2011.Y-str loci diversity in native Alaskan populations. Int J LegalMed 125:559–563.
Derbeneva OA, Sukernik RI, Volodko NV, Hosseini SH, Lott M,Wallace DC. 2002. Analysis of mitochondrial DNA diversityin the Aleuts of the Commander islands and its implicationsfor the genetic history of Beringia. Am J Hum Genet 71:415–421.
Devor E. 1987. Transmission of human craniofacial dimensions.J Cran Genet Dev Bio 7:95–106.
Dulik MC, Owings AC, Gaieski JB, Vilar MG, Andre A, LennieC, Mackenzie MA, Kritsch I, Snowshoe S, Wright R, Martin
12 B. HERRERA ET AL.
American Journal of Physical Anthropology
J, Gibson N, Andrews TD, Schurr TG, The Genographic Con-sortium. 2012. Y-chromosome analysis reveals genetic diver-gence and new founding native lineages in Athapaskan- andEskimoan-speaking populations. Proc Natl Acad Sci USA 109:8471–8476.
Gad F. 1971. The history of Greenland: earliest times to 1700.Translation of the Danish edition Gronlands Historie I Indtill1700 published by Nyt Nordisk Forlag/Arnold Busck, 1969.Hurst: McGill-Queens University Press.
Gilbert MTP, Kivisild T, Gr!nnow B, Andersen PK, Metspalu E,Reidla M, Tamm E, Axelsson E, G"otherstr"om A, Campos PF,Rasmussen M, Metspalu M, Higham TFG, Schwenninger J-L,Nathan R, Hoog C-J de, Koch A, M!ller LN, Andreasen C,Meldgaard M, Villems R, Bendixen C, Willerslev E. 2008.Paleo-eskimo mtDNA genome reveals matrilineal discontinu-ity in Greenland. Science 320:1787–1789.
Gonz!alez-Jos!e R, Bortolini MC, Santos FR, Bonatto SL. 2008.The peopling of America: craniofacial shape variation on acontinental scale and its interpretation from an interdiscipli-nary view. Am J Phys Anthropol 137:175–187.
Gonz!alez-Jos!e R, Van der Molen S, Gonz!alez-P!erez E, Hern!adezM. 2004. Patterns of phenotypic covariation and correlationin modern humans as viewed from morphological integration.Am J Phys Anthropol 123:69–77.
Graf OM, Zlojutro M, Rubicz R, Crawford MH. 2010. Surnamedistributions and their association with Y-chromosomemarkers in the Aleutian Islands. Hum Biol 82:745–757.
Greenberg JH, II CGT, Zegura SL, Campbell L, Fox JA,Laughlin WS, Szathmary EJE, Weiss KM, Woolford E. 1986.The settlement of the Americas: a comparison of the linguis-tic, dental, and genetic evidence [and Comments and Reply].Curr Anthropol 27:477–497.
Gr"uneberg H. 1952. Genetical studies on the skeleton of themouse. IV. Quasi-continuous variations. J Genet 41:95–114.
Haak W, Brandt G, Jong HN, Meyer C, Ganslmeier R, Heyd V,Hawkesworth C, Pike AWG, Meller H, Alt KW. 2008. AncientDNA, strontium isotopes, and osteological analyses shed lighton social and kinship organization of the Later Stone Age.Proc Natl Acad Sci USA 105:18226–18231.
Hall ES Jr. 1980.Technological change in Northern Alaska. In:Robert CD, Edwin SH, editors. Archaeological essays in honorof Irving B. Rouse. Mouton: The Hague. p 209–229.
Hallenberg C, Tomas C, Simonson B, Morling N. 2009. Y-chro-mosome STR haplotypes in males from Greenland. ForensicSci Int 3:e145–e146.
Hanihara T. 1993. Population prehistory of East Asia and thePacific as viewed from craniofacial morphology: the basic pop-ulations in East Asia, VII. Am J Phys Anthropol 91:173–187.
Hanihara T. 1996. Comparison of craniofacial features of majorhuman groups. Am J Phys Anthropol 99:389–412.
Hanihara T. 1997. Craniofacial affinities of Mariana islandersand Circum-Pacific peoples. Am J Phys Anthropol 104:411–425.
Hanihara T. 2000. Frontal and facial flatness of major humanpopulations. Am J Phys Anthropol 111:105–134.
Harpending H, Jenkins T. 1973. Genetic distances amongsouthern African populations. In: Crawford MH, WorkmanPL, editors. Methods in anthropological genetics. Albuquer-que: University of New Mexico Press. p 177–199.
Harvati K, Weaver TD. 2006. Human cranial anatomy and dif-ferential preservation of population history and climate signa-tures. Anat Rec A 228A:1225–1233.
Helgason A, P!alsson G, Pedersen HS, Angulalik E,Gunnarsd!ottir B, Stef!ansson K. 2005. mtDNA variation ininuit populations of Greenland and Canada: migration historyand population structure. Am J Phys Anthropol 130:123–134.
Holzlehner T. 2011. Engineering socialism: a history of villagerelocations in Chukotka, Russia. In: Brunn S, editor. Engi-neering earth: the impacts of mega engineering projects. Dor-drecht, The Netherlands: Springer Science 1 Business Media.p 1957–1973.
Howells WW. 1973. Cranial variation in man. A study by multi-variate analysis of patterns of differences among recent
human populations. Papers of the Peabody Museum of Arche-ology and Ethnology, Vol. 67. Cambridge: Peabody Museum.
Hrdlicka A. 1945. The Aleutian and Commander Islands andtheir inhabitants. Philadelphia: Wistar Institute of Anatomyand Biology.
Hubbe M, Hanihara T, Harvati K. 2009. Climate signatures inthe morphological differentiation of worldwide modern humanpopulations. Anat Rec (Hoboken) 292:1720–1733.
Hubbe M, Neves WA, Harvati K. 2010. Testing evolutionaryand dispersion scenarios for the settlement of the New World.Plos One 5:e11105.
Jantz R. No date. Program: Kship. Written and distributed byauthor.
Karafet TM, Zegura SL, Posukh O, Osipova L, Bergen A, LongJ, Goldman D, Klitz W, Harihara H, Knijff P de, Wiebe V,Griffiths RC, Templeton AR, Hammer MF. 1999. AncestralAsian source(s) of New World Y-chromosome founder haplo-types. Am J Hum Genet 64:817–831.
Kleivan I, Sonne B. 1985. Iconography of religions: arctic peo-ples. Canada: Brill Academic Publications.
Konigsberg L. 2006. A post-Neumann history of biological andgenetic distance studies in bioarchaeology.In: Buikstra J,Beck L, editors. Bioarchaeology: the contextual analysis ofhuman remains. Amsterdam: Elsevier. p 263–275.
Konigsberg L, Herrmann NP. 2001. Modern statistical comput-ing in “R” and “Winbugs” for physical anthropology. Posterpresented at the Annual Meeting of the American Associationof Physical Anthropologists.
Lele S. 1993. Euclidean distance matrix analysis (EDMA): esti-mation of mean form and mean form difference. Math Geomet25:573–602.
Ligges U, M"achler M. 2003. Scatterplot3d—an R package forvisualizing multivariate data. J Stat Softw 8:1–20.
Malyarchuk B, Derenko M, Denisova G, Maksimov A, WozniakM, Grzybowski T, Dambueva I, Zakharov I. 2011. Ancientlinks between Siberians and Native Americans revealed bysubtyping the Y chromosome haplogroup Q1a. J Hum Genet56:583–588.
Mantel N. 1967. The detection of disease clustering and a gen-eralized regression approach. Cancer Res 27:209–220.
Martin R, Saller K. 1957. Lehrbuch der anthropologie. Stutt-gart: Gustav Fischer Verlag.
Mart!ınez-Abad!ıas N, Esparza M, Sj!vold T, Gonz!alez-Jos!e R,Santos M, Hern!andez M. 2009. Hertitability of human cranialdimensions: comparing the evolvability of different cranialregions. J Anat 214:19–35.
Mason OK, Gerlach SC. 1995. Chukchi hot spots, paleo-polynyas, and caribou crashes: climatic and ecological dimen-sions in North Alaska prehistory. Arctic Anthropol 32:101–130.
Mason OK, Jordon JW. 1993. Heightened North Pacific stormi-ness and synchronous late Holocene erosion of north-westAlaska Beach Ridge complexes. Quat Res 40:55–69.
MATLAB version 7.10.0. Natick, Massachusetts: The Math-Works Inc., 2010. http://www.mathworks.com/products/matlab/.
McGrath J, Cheverud J, Buikstra J. 1984. Genetic correlationsbetween sides and heritability of asymmetry for nonmetrictraits in rhesus macaques on Cayo Santiago. Am J PhysAnthropol 64:401–411.
McIlroy D, Brownrigg R, Minka T, Bivand R. 2013. mapproj:map projections. R package version 1.2-1. http://cran.r-project.org/web/packages/mapproj/index.html.
Melgaard J. 1976. The prehistoric cultures in Greenland: dis-continuities in a marginal area.In: Hans PK, editor. Continu-ity and discontinuity in the Inuit culture of Greenland. TheNetherlands: University of Groningen, Arctic Center. p 19–52.
Merriwether DA, Rothhammer F, Ferrell RE. 1995. Distributionof the four founding lineage haplotypes in Native Americanssuggests a single wave migration for the New World. Am JPhys Anthropol 98:411–430.
Microsoft. 2012. Microsoft Excel [computer software]. Redmond,Washington: Microsoft.
COMPARABILITY OF MULTIPLE DATA TYPES 13
American Journal of Physical Anthropology
M!bjerg T. 1986. A contribution to paleoeskimo archaeology inGreenland. Arctic Anthropol 23:19–56.
Mulligan CJ, Kitchen A, Miyamoto MM. 2008. Updated three-stage model for the peopling of the Americas. Plos One 3:e3199.
Oksanen J. 2013. Multivariate analysis of ecological commun-ities in R: vegan tutorial. URL: Available at: http://CRAN.R-project.org
Oksanen J, Blanchet FG, Kindt R, Legendre P, Minchin PR,O’Hara RB, Simpson GL, Solymos P, Stevens MHH, WagnerH. 2013. vegan: community ecology package. R package ver-sion 2.0-5.URL: Available at: http://CRAN.R-project.org/package=vegan.
Peres-Neto PR, Jackson DA. 2000. How well do multivariatedata sets match? The advantages of a Procrustean superimpo-sition approach over the Mantel test. Oceologia 129:169–178.
Perez SI, Bernal V, Gonzalez PN. 2007. Evolutionary relation-ships among prehistoric human populations: an evaluation ofrelatedness patterns based on facial morphometric data usingmolecular data. Hum Biol 79:25–50.
Perez SI, Bernal V, Gonzalez PN, Sardi M, Politis GG. 2009.Discrepancy between cranial and DNA data of early Ameri-cans: implications for American peopling. PLoS One 4:e5746.
Pitblado BL. 2011. A tale of two migrations: reconciling recentbiological and archaeological evidence for the Pleistocene peo-pling of the Americas. J Archaeol Res 19:327–375.
Powell JF, Neves WA. 1999. Craniofacial morphology of the firstAmericans: pattern and process in the peopling of the NewWorld. Am J Phys Anthropol Suppl 29:153–188.
R Development Core Team. 2005. R: a language and environ-ment for statistical computing.
R Development Core Team. 2013. R: A language and environ-ment for statistical computing. R Foundation for StatisticalComputing. Vienna, Austria. Available at: http://www.R-pro-ject.org.
Raff J, Tackney J, O’Rourke DH. 2010. South from Alaska: apilot aDNA study of genetic history on the Alaska Peninsulaand the Eastern Aleutians. Hum Biol 82:677–693.
Rasmussen M, Li Y, Lindgreen S, Pedersen JS, Albrechtsen A,Moltke I, Metspalu M, Metspalu E, Kivisild T, Gupta R,Bertalan M, Nielsen K, Gilbert MT, Wang Y, Raghavan M,Campos PF, Kamp HM, Wilson AS, Gledhill A, Tridico S,Bunce M, Lorenzen ED, Binladen J, Guo X, Zhao J, Zhang X,Zhang H, Li Z, Chen M, Orlando L, Kristiansen K, Bak M,Tommerup N, Bendixen C, Pierre TL, Gr!nnow B, MeldgaardM, Andreasen C, Fedorova SA, Osipova LP, Higham TF,Ramsey CB, Hansen TV, Nielsen FC, Crawford MH, BrunakS, Sicheritz-Pont!en T, Villems R, Nielsen R, Krogh A, WangJ, Willerslev E. 2010. Ancient human genome sequence of anextinct Palaeo-Eskimo. Nature 463:757–762.
Reedy-Maschner KL. 2010. Aleut identities: tradition and mod-ernity in an indigenous fishery. Montreal, Canada: McGill-Queen’s University Press.
Relethford JH. 1994. Craniometric variation among modernhuman populations. Am J Phys Anthropol 95:53–62.
Relethford JH. 2001. Genetics and the search for modernhuman origins. New York: Wiley-Liss.
Relethford JH. 2003. RMET: computer program. Distributed bythe author. http://employees.oneonta.edu/relethjh/programs/.
Relethford JH. 2009. Population-specific deviations of globalhuman craniometric variation from a neutral model. Am JPhys Anthropol 142:105–111.
Relethford JH, Blangero J. 1990. Detection of differential geneflow from patterns of quantitative variation. Hum Biol 62:5–25.
Relethford JH, Crawford MH, Blangero J. 1997. Genetic driftand gene flow in post-famine Ireland. Hum Biol 69:443–465.
Rey D, Areces C, Parga-Lozano C, G!omez-Prieto P, CrawfordMH, Arnaiz-Villena A. 2010. HLA genes in populations of theAleutian Islands. Hum Biol 82:737–744.
Ricaut F-X, Auriol V, Cramon-Taubadel N, Keyser C, Murail P,Ludes B, Crub!ezy E. 2010. Comparison between morphologi-cal and genetic data to estimate biological relationship: the
case of the Egyin Gol necropolis (Mongolia). Am J PhysAnthropol 143:355–364.
Richtsmeier J, McGrath J. 1986. Quantitative genetics of cra-nial nonmetric traits in randombred mice: heritability andetiology. Am J Phys Anthropol 69:51–58.
Rohlf FJ. 2008. NTSYSpc: numerical taxonomy system, ver.2.20. Setauket, NY: Exeter Publishing Ltd.
Roseman CC, Weaver TD. 2007. Molecules versus morphology?Not for the human cranium. Bioessays 12:1185–1188.
Rubicz R, Melton PE, Spitsyn V, Sun G, Deka R, Crawford MH.2010a. Genetic structure of native circumpolar populationsbased on autosomal, mitochondrial, and Y chromosome DNAmarkers. Am J Phys Anthropol 143:62–74.
Rubicz R, Schurr TG, Babb PL, Crawford MH. 2003. Mitochon-drial DNA variation and the origin of the Aleuts. Hum Biol75:809–835.
Rubicz R, Zlojutru M, Sun G, Spitsyn V, Deka R, Young KL,Crawford MH. 2010b. Genetic architecture of a small,recently aggregated Aleut population: Bering Island, Russia.Hum Biol 82:719–736.
Ruiz-Linares A, Ort!ız-Barrientos D, Figueroa M, Mesa N,M!unera JG, Bedoya G, V!elez ID, Garc!ıa LF, P!erez-Lezaun A,Bertranpetit J, Feldman MW, Goldstein DB. 1999. Microsatel-lites provide evidence for Y chromosome diversity among thefounders of the New World. Proc Natl Acad Sci USA 96:6312–6317.
Saillard J, Forster P, Lynnerup N, Bandelt H-J, N!rby S. 2000.mtDNA variation among Greenland Eskimos: the edge ofBeringian expansion. Am J Hum Genet 67:718–726.
Savelle JM, Dyke AS. 2002. Variability in Palaeoeskimo occupa-tion on south-western Victoria Island, Arctic Canada: causesand consequences. World Archaeol 33:508–522.
Schurr TG. 2002. A molecular anthropological view of the peo-pling of the Americas. Athena Rev 3:59–77.
Schurr TG. 2004. The peopling of the New World: perspectivesfrom molecular anthropology. Ann Rev Anthropol 33:551–583.
Schurr TG, Sherry ST. 2004. Mitochondrial DNA and Y chromo-some diversity and the peopling of the Americas: evolutionaryand demographic evidence. Am J Hum Biol 16:420–439.
Sepez J, Package C, Malcolm PE, Poole A. 2007. Unalaska,Alaska: memory and denial in the globalization of the Aleu-tian landscape. Polar Geograph 30:193–209.
Shields GF, Schmiechen AM, Frazier BL, Redd A, Voevoda MI,Reed JK, Ward RH. 1993. mtDNA sequences suggest a recentevolutionary divergence for Beringian and northern NorthAmerican populations. Am J Hum Genet 53:549–562.
Sj!vold T. 1984. A report on the heritability of some cranialmeasurements and non-metric traits.In: Van Vark GN,Howells WW, editors. Multivariate statistical methods inphysical anthropology. Dordrecht: Reidel Publishing. p 223–246.
Smith SE, Hayes MG, Cabana GS, Huff C, Coltrain JB,O’Rourke DH. 2009. Inferring population continuity versusreplacement with aDNA: a cautionary tale from the AleutianIslands. Hum Biol 81:407–426.
Sparks CS, Jantz RL. 2002. A reassessment of human cranialplasticity: boas revisited. Proc Natl Acad Sci USA 99:14636–14639.
Spradley MK. 2006. Biological anthropological aspects of theAfrican diaspora: geographic origins, secular trends, and plas-tic versus genetic influences utilizing craniometric data. PhDdissertation. University of Tennessee, Knoxville.
Starikovskaya E, Sukernik R, Derbeneva O, Voldko N, Ruiz-Pesini E, Torroni A, Brown M, Lott M, Hosseini S, HuoponenK, Wallace D. 2005. Mitochondrial DNA diversity in indige-nous populations of the southern extent of Siberia, and theorigins of Native American haplogroups. Ann Hum Genet 69:67–89.
Starikovskaya YB, Sukernik RI, Schurr TG, Kogelnik AM,Wallace DC. 1998. mtDNA diversity in Chukchi and SiberianEskimos: implications for the genetic history of ancient Berin-gia and the peopling of the New World. Am J Hum Genet 63:1473–1491.
14 B. HERRERA ET AL.
American Journal of Physical Anthropology
Stern PR. 2010. Daily life of the Inuit. Denver: The GreenwoodPress.
Stojanowski CM. 2004. Population history of native groups inpre- and postcontact Spanish Florida: aggregation, gene flow,and genetic drift on the Southeastern US Atlantic coast. AmJ Phys Anthropol 123:316–332.
Tamm E, Kivisild T, Reidla M, Metspalu M, Smith DG,Mulligan CJ, Bravi CM, Rickards O, Martinez-Labarga C,Khusnutdinova EK, Fedorova SA, Golubenko MV, StepanovVA, Gubina MA, Zhadanov SI, Ossipova LP, Damba L,Voevoda MI, Dipierri JE, Villems R, Malhi R. 2007. Beringianstandstill and spread of Native American founders. Plos One2:e829.
Veltre DW, Smith MA. 2010. Historical overview of archaeologi-cal research in the Aleut region of Alaska. Hum Biol 82:487–506.
Volodko NV, Starikovskaya EB, Mazunin IO, Eltsov NP,Naidenko PV, Wallace DC, Sukernik RI. 2008. Mitochondrialgenome diversity in Arctic Siberians with particular referenceto the evolutionary history of Beringia and Pleistocenic peo-pling of the Americas. Am J Hum Genet 82:1084–1100.
West D, O’Rourke D, Crawford MH. 2010. Introduction: originsand settlement of the indigenous populations of the AleutianArchipelago. Hum Biol 82:481–486.
Williams-Blangero S, Blangero J. 1991. Skin colorvariation ineastern Nepal. Am J Phys Anthropol 85:281–291.
Wozniak M, Grzybowski T, Starzy!nski J, Marciniak T. 2007.Continuity of Y chromosome haplotypes in the population ofSouthern Poland before and after the Second World War. For-ensic Sci Int 1:134–140.
Zimmerman MR, Aufderheide AC. 1984. The frozen family ofUtqiagvik: the autopsy findings. Arctic Anthropol 21:53–64.
Zlojutro M. 2006. Mitochondrial DNA and Y-chromosome varia-tion of eastern Aleut populations: implications for the geneticstructure and peopling of the Aleutian Archipelago. PhD Dis-sertation, University of Kansas.
Zlojutro M, Rubicz R, Crawford MH. 2009a. Mitochondrial DNAand Y-chromosome variation in five eastern Aleut commun-ities: evidence for genetic substructure in the Aleut popula-tion. Ann Hum Genet 36:511–526.
Zlojutro M, Rubicz R, Devor EJ, Spitsyn VA, Makarov SV, WilsonK, Crawford MH. 2006. Genetic structure of the Aleuts andcircumpolar populations based on mitochondrial DNA sequen-ces: a synthesis. Am J Phys Anthropol 129:446–464.
Zlojutro M, Tarskaia LA, Sorensen M, Snodgrass JJ, LeonardWR, Crawford MH. 2009b. Coalescent simulations of YakutmtDNA variation suggest small founding population. Am JPhys Anthropol 139:474–482.
COMPARABILITY OF MULTIPLE DATA TYPES 15
American Journal of Physical Anthropology


![Srovnatelnost Schwartzovy hodnotové škály v mezinárodních datech [The Comparability of Schwartz’s Human Value Scale in International Data]](https://static.fdokumen.com/doc/165x107/632518f4545c645c7f098595/srovnatelnost-schwartzovy-hodnotove-skaly-v-mezinarodnich-datech-the-comparability.jpg)