Ancient Local Evolution of African mtDNA Haplogroups in Tunisian Berber Populations

Biological Relationship Between Central and SouthAmerican Chibchan Speaking Populations:Evidence From mtDNA
Phillip E. Melton,1* I. Briceno,2 A. Gomez,2 E.J. Devor,1,3 J.E. Bernal,2 and M.H. Crawford1
1Department of Anthropology, University of Kansas, Lawrence, KS2Institute of Human Genetics, Pontificia Universidad Javeriana, Bogota, Colombia3Molecular Genetics and Bioinformatics, Integrated DNA Technologies (IDT), Coralville, IA
KEY WORDS Colombia; Ijka; Kogi; Arsario; Wayuu; Chibcha
ABSTRACT We examined mitochondrial DNA (mtDNA)haplogroup and haplotype diversity in 188 individualsfrom three Chibchan (Kogi, Arsario, and Ijka) populationsand one Arawak (Wayuu) group from northeast Colombiato determine the biological relationship between lower Cen-tral American and northern South American Chibchanspeakers. mtDNA haplogroups were obtained for all indi-viduals and mtDNA HVS-I sequence data were obtainedfor 110 samples. Resulting sequence data were comparedto 16 other Caribbean, South, and Central American popu-lations using diversity measures, neutrality test statistics,
sudden and spatial mismatch models, intermatch distribu-tions, phylogenetic networks, and a multidimensional scal-ing plot. Our results demonstrate the existence of a sharedmaternal genetic structure between Central AmericanChibchan, Mayan populations and northern South Ameri-can Chibchan-speakers. Additionally, these results suggestan expansion of Chibchan-speakers into South Americaassociated with a shift in subsistence strategies because ofchanging ecological conditions that occurred in the regionbetween 10,000–14,000 years before present. Am J PhysAnthropol 133:753–770, 2007. VVC 2007 Wiley-Liss, Inc.
Over the last two decades, mitochondrial DNA(mtDNA) has been used extensively to characterizeNative American population structure and history (Wal-lace et al., 1985; Schurr et al., 1990; Horai et al., 1993;Torroni et al., 1993; Schurr and Sherry, 2004). Theseinvestigations have demonstrated that the majority ofmodern Amerindian populations are characterized byfour major haplogroups (A, B, C, and D) (Schurr et al.,1990; Torroni et al., 1993; Schurr and Sherry, 2004). Afifth haplogroup, X, is restricted to North America(Smith et al., 1999) and absent in South America (Dor-nelles et al., 2005). All mtDNA haplogroups are associ-ated with several specific point mutations located withinthe control region (CR) of the mitochondrial genome.Frequencies of mtDNA haplogroups differ among popula-tions and are often correlated with cultural affiliation,linguistic family, or geographic location (O’Rourke et al.,2000; Bolnick and Smith, 2003). Populations that typi-cally share founding haplotypes tend to be geographi-cally restricted, indicating more recent mutations. Thisgeographic restriction suggests that closely related popu-lations share several derived haplotypes that are eitheridentical or differ by few mutations (Torroni et al., 1993;Bolnick and Smith, 2003).
Initially, evidence from the four mtDNA haplogroupswas used to suggest distinct founding Native Americanpopulations (Horai et al., 1993; Torroni et al., 1993) butothers advocated a single founding group that underwenta genetic bottleneck (Merriwether et al., 1995; Bonattoand Salzano, 1997; Stone and Stoneking, 1998) or twomigrations (Rubicz et al., 2003; Schurr, 2004). Evidencefrom archaeology (Dixon, 1999; Dillehay, 2000; Lavallee,2000) and molecular genetics (Bonatto and Salzano, 1997;Tarazona-Santos et al., 2001) indicate the peopling of
South America occurred during the Pleistocene but thenumber of migrations into the continent is unresolved.Some researchers argue for a single founder SouthAmerican population (Moraga et al., 2000) while othersfavor a two-wave migration model (Fox, 1996; Laluezaet al., 1997; Keyeux et al., 2002). Fox (1996) and Laluezaet al. (1997) originally proposed two migrations based ona clinal distribution of mtDNA haplogroups in SouthAmerica, where A occurs at high frequencies (>50%) innorthern populations and is absent in the southern coneand D demonstrates the opposite distribution. Moragaet al. (2000) used evidence from sequence data in themtDNA CR region to dispute this hypothesis and demon-strated that modern Fuegian populations from Chile andArgentina did not exhibit divergent sequences and sug-gested that southern South American populations weredescended from a single Paleoindian population. Recently,Keyeux et al. (2002) noticed a similar A/D haplogroupdistribution in 25 indigenous populations from Colombiaseparated by the Andean Cordillera. These latter re-searchers proposed two migrations into the continent,
Grant sponsor: National Science Foundation.
*Correspondence to: Phillip E. Melton, Department of Anthropol-ogy, University of Kansas, Fraser Hall Room 622, 1415 JayhawkBlvd., Lawrence, KS 66045, USA. E-mail: [email protected]
Received 14 June 2006; accepted 22 December 2006
DOI 10.1002/ajpa.20581Published online 5 March 2007 in Wiley InterScience
(www.interscience.wiley.com).
VVC 2007 WILEY-LISS, INC.
AMERICAN JOURNAL OF PHYSICAL ANTHROPOLOGY 133:753–770 (2007)

with one occurring along the Amazonian lowlands relat-ing to the majority of eastern South American popula-tions and then occurring along the Pacific and Caribbeancoast associated with a diaspora of Chibchan-speakers.
Populations of the Chibchan language family are dis-tributed from eastern Honduras to the eastern shores ofLake Maracaibo (Fig. 1) (Hoopes and Fonseca, 2003).This language phylum contains 14 extant and six extinctlanguages, divided into four regional subfamilies: (1)Pech (Paya), spoken in eastern Honduras; (2) Votic,spoken in Nicaragua and northern South America; (3)Isthmic, spoken in Costa Rica and Panama; and (4) Mag-delenic, spoken in northern South America (Constenla-Umana, 1991). Other linguists also include other SouthAmerican populations within a larger Chibchan-Paezanfamily, including the Yanomamo, Cayapa, and Atace-meno (Greenberg, 1987; Ruhlen, 1998). Based on glotto-chronological evidence, Chibchan is thought to havediverged from related languages approximately 7,000years before present (YBP) either in Costa Rica orPanama as these regions have linguistic diversity(Constenla-Umana, 1991). The differentiation of the re-gional subfamilies is thought to have begun around5,000 YBP because of a shift to agriculture and adapta-tion to a sedentary lifestyle (Constenla-Umana, 1991;Cooke and Ranere, 1992). Archaeological research con-ducted in lower Central and northern South Americahas focused on the formation of Chibchan populationsand has demonstrated a close cultural relationship basedon shared settlement patterns, iconography, and mate-rial goods (Lange and Stone, 1984; Quilter and Hoopes,2003). This evidence has led some researchers to suggestthe presence of a large homogeneous culture dominatedby Chibchan-speakers (Bray, 2003; Hoopes and Fonseca,2003; Hoopes, 2005). Previous genetic research onChibchan populations has focused on lower CentralAmerica because of their geographic location, bridgingthe two American continents. Originally, it was thoughtthat these populations would exhibit high genetic diver-
sity because of their intermediate position between com-plex cultures in the Andes and Mesoamerica. However,studies using both classical markers (Barrantes et al.,1990; Bieber et al., 1996) and molecular genetics (Santoset al., 1994; Torroni et al., 1994b; Batista et al., 1995;Kolman et al., 1995; Kolman and Bermingham, 1997;Ruiz-Narvaez et al., 2005) demonstrate that these popu-lations are characterized by low amounts of geneticdiversity and a high number of private polymorphismsnot shared with neighboring populations. Several studieshave investigated mtDNA diversity in Central AmericanChibchan-speakers (Santos et al., 1994; Torroni et al.,1994b; Batista et al., 1995; Kolman et al., 1995; Kolmanand Bermingham, 1997). These populations are charac-terized by high frequencies of haplogroup A (>65%),moderate frequencies of B (20–30%), absence of C, andthe infrequent presence of D. Based on mtDNA CRsequence data these Chibchan groups demonstrate lowhaplogroup and nucleotide diversity. (Santos et al., 1994;Batista et al., 1995; Kolman et al., 1995; Kolman andBermingham, 1997). While archaeological and linguisticevidence indicate a relationship between lower Centraland northern South American Chibchan groups the bio-logical relationship between the two regions has yet tobe investigated.
One Chibchan region in northern South America con-taining a wealth of comparative archaeological, linguis-tic, ethnographic, and ethnohistoric information is theSierra Nevada de Santa Marta in northeast Colombia(Reichel-Dolmatoff, 1950; Bray, 1984, 2003; Oyuela-Caycedo, 1996; Uribe, 2000; Hoopes and Fonseca, 2003;Langebaek, 2003). This mountain range rises to 5,780 min a little over 35 km and occurs within the Caribbeanlittoral ecological environment of South America. Theextant indigenous populations (Kogi, Arsario, and Ijka)of the region may represent the remnants of the ancientTairona, one of the largest Chibchan populations presentat European contact (Wilson, 1999; Bray, 2003).
In this study, we test the hypothesis that Chibchanspeaking populations demonstrate a biological relation-ship and how this association relates to the peopling ofSouth America. To accomplish this, we analyze mtDNAhaplogroup and haplotype diversity in the three extantSierra Nevada de Santa Marta (Arsario, Kogi, Ijka) pop-ulations and a neighboring Arawak (Wayuu) group togain greater insight into the genetic history of Chibchanpopulations. Our initial analysis of these indigenouspopulations confirmed the pattern of mtDNA RFLP vari-ation seen in previous research (Briceno et al., 2003;Keyeux et al., 2002), revealing haplogroups A, and C forthe Kogi and Arsario, and A, B, and C for the Ijka andWayuu (Melton et al., 2004; Melton et al., 2005; Melton,2005).These results also indicated that all haplogroup Aindividuals belonged to the A2 subhaplotype (Forsteret al., 1996) However, a higher than expected transis-tion-transversion ratio (17-8) indicated the possibility of\phantom mutations" in the original data (Forster, 2003;Brandstatter et al., 2005). In addition, only a small num-ber of Kogi individuals were characterized in our earlierresearch as well as some unrepresented haplogroups forthe Ijka (Melton et al., 2004, 2005; Melton, 2005). Thepresent study summarizes our expanded analyses(mtDNA heavy and light chains sequenced, higher reso-lution, and larger sample size) and discusses the implica-tion of new mtDNA data for understanding the biologicaland geographic relationship of Chibchan-speaking popu-lations.
Fig. 1. Geographic distribution of the four populations usedin this study as well as other extant and extinct lower Centraland northern South American populations. Tairona and Muiscarefer to extinct Chibchan-speaking populations.
754 P.E. MELTON ET AL.
American Journal of Physical Anthropology—DOI 10.1002/ajpa

MATERIALS AND METHODS
Population samples
Blood samples belonging to 188 individuals from threeChibchan (Kogi n ¼ 48, Ijka, n ¼ 40, and Arsario, n ¼50) populations and one Arawak (Wayuu, n ¼ 50) groupinhabiting northeastern Colombia were collected fromrandomly selected, unrelated, healthy individuals(Briceno et al., 1996b). The Kogi (Kagaba, Cogui) areseasonal horticulturists who inhabit the northern slopesof the Sierra Nevada de Santa Marta. The most accuratecurrent estimate of their population size is 6,138 dis-tributed (Uribe, 2000). The Ijka (Ica, Bıntuka, Busınka,Busintana, Arhucao) are an agricultural population of9,394 individuals inhabiting the southern side of the
Sierra Nevada de Santa Marta (Uribe, 2000). The Arsario(Sanka, Sanha, Guamaca, Marocaseros, Wiwa) inhabitthe southeastern slopes of the Sierra Nevada de SantaMarta range and number *1,500 (Uribe, 2000). All threeSierra Nevada de Santa Marta groups speak languageswithin the Magdalenic subgroup of Chibcha (Constenla-Umana, 1991). The Wayuu (Guajira) are a semi-nomadicpastoralist Arawakan-speaking population inhabitingthe arid La Guajira peninsula of Colombia and Venezuela(Saler, 1992). They represent on of the largest currentextant populations in South America and number80,000–120,000 (Yunis et al., 1994). Geographic locationsof all study populations are shown in Figure 1.
Comparative RFLP data for 37 Central and SouthAmerican populations (Table 1) were collected from the
TABLE 1. South American indigenous population mtDNA haplogroup frequencies and diversity estimates
Populationa
mtDNA haplogroup (%)
Other Hn A B C D
Chibchan-Paezanb
(1) Teribe1,c 20 80.0 20.0 0.0 0.0 0.0 0.34(2) Guataso1 20 85.0 15.0 0.0 0.0 0.0 0.27(3) Kuna1,4 pooled 79 77.0 23.0 0.0 0.0 0.0 0.36(4) Bribri-Cabecar1 24 54.0 46.0 0.0 0.0 0.0 0.52(5) Huetar3 27 70.0 4.0 0.0 26.0 0.0 0.46(6) Ngobe4 46 67.0 33.0 0.0 0.0 0.0 0.45(7) Cayapa2 120 29.0 40.0 9.0 22.0 0.71(8) Atcemeno6 50 12.0 72.0 10.0 6.0 0.0 0.46(9)Yanomamo5 129 0.6 9.0 26.0 31.0 0.0 0.51(19) Embera7 21 73.0 22.0 0.0 0.0 5.0 0.44(21) Zenu7 37 19.0 41.0 30.0 5.0 5.0 0.72KogiTS 48 65.0 0.0 35.0 0.0 0.0 0.46IjkaTS 40 90.0 2.5 7.5 0.0 0.0 0.19ArsarioTS 50 68.0 0.0 32.0 0.0 0.0 0.44
Andeanb
(28) Quechua6,8 pooled 51 20.0 61.0 8.0 12.0 0.0 0.31(10) Aymara6,8 205 5.0 72.0 11.0 12.0 0.0 0.45(11) Mapuche9–11 pool 208 5.0 20.0 33.0 39.0 3.0 0.70(12) Huilliche6,11 pool 118 4.0 29.0 19.0 48.0 0.0 0.65(13)Pehuenche6,11 pool 205 2.0 8.0 40.0 50.0 0.0 0.59(18) Yahgan11 21 0.0 0.0 48.0 52.0 0.0 0.52(25) Fuegian12 45 0.0 0.0 42.0 56.0 0.0 0.52(22) Ingano7 27 15.0 44.0 37.0 0.0 4.0 0.67(36) Jujenos13 65 12.0 65.0 8.0 15.0 0.0 0.54
Equatorial-Tucanoanb
(23) Ticuna1,7 pool 82 15.0 10.0 36.0 39.0 0.0 0.69(14) Zoro14 30 20.0 7.0 13.0 60.0 0.0 0.60(15) Gaviao14 27 15.0 15.0 0.0 70.0 0.0 0.48(20) Wayuu7 40 25.0 35.0 38.0 0.0 2.0 0.69WayuuTS 46d 37.0 26.0 35.0 0.0 2.0 0.69(32) Ignaciano8 22 18.0 36.0 41.0 0.0 5.0 0.70(33) Trinitarion8 35 14.0 40.0 37.0 3.0 6.0 0.70(34) Movima8 22 9.0 9.0 64.0 18.0 0.0 0.57(35) Yuracare8 28 39.0 32.0 21.0 4.0 4.0 0.72
Ge-Pano-Caribb
(16) Mataco1,15,16 pool 129 8.0 54.0 9.0 27.0 2.0 0.63(27) Toba15 pool 56 20.0 41.0 5.0 30.0 4.0 0.71(24) Chorote11,16 pool 34 15.0 44.0 23.0 18.0 0.0 0.72(17) Xavante14 25 16.0 84.0 0.0 0.0 0.0 0.28(29) Pilaga15 26 27.0 35.0 4.0 35.0 0.0 0.71(30) Chimane8 41 39.0 54.0 5.0 0.0 2.0 0.57(31) Moseten8 20 40.0 55.0 0.0 0.0 5.0 0.57
a References: (1) Torroni et al. 1993; (2) Rickards et al., 1999; (3) Santos et al., 1994; (4) Kolman et al., 1995; (5 ) Merriwether et al.2000; (6) Merriwether et al., 1995; (7) Mesa et al., 2000; (8) Bert et al., 2001; (9) Ginther et al., 1993; (10) Bailliet et al., 1994; (11)Moraga et al., 2000; (12) Lalueza et al., 1997; (13) Dipierri et al., 1998; (14) Ward et al., 1996; (15) Demarchi et al., 2001; (16)Bianchi et al., 1995. TS, this study.b Linguistic affiliation as defined by Ruhlen, 1998.c refers to geographic location of population in Figure 2.d Adjusted n to account for fewer samples.
755mtDNA GENETIC RELATIONSHIP OF CHIBCHAN SPEAKERS
American Journal of Physical Anthropology—DOI 10.1002/ajpa

literature. Geographic locations of these populations areshown in Figure 2. Additional RFLP data were alsocollected on 31 Caribbean, and Central and SouthAmerican populations (Table 2). Hypervariable sequenceI (HVS-I) sequences were collected for 16 Caribbean,Central, and South American groups (Table 4) and werechosen because of their geographic proximity to thestudy populations and included greater than 20 sequen-ces, with the exception of the Tainos (n ¼ 19) and Cibo-ney (n ¼ 15).
DNA extraction and mtDNA analysis
DNA was extracted using phenol/chlorform techniquesby researcher at the University upon Tyne, UK (Bricenoet al., 1996a). All 188 samples were characterized for the
four major Native American mtDNA haplogroups (A-D)using polymerase chain reaction (PCR) and associatedrestriction site enzymes (HaeIII, HincII, and AluI) andthe presence/absence of the COII-tRNAlys 9-bp deletion.Primer pairs and amplification conditions used in thisstudy have been previously described by Torroni et al.(1993). A subset of 20 individuals from each of the threeChibchan populations was characterized for a previouslydescribed loss of a MspI restriction site found in CentralAmerican Chibchan-speakers (Torroni et al., 1994b) atmtDNA nucleotide position (np) 104 using PCR primersL1 and H240. Restriction fragments were visualizedwith UV light on 3% NuSieve agarose gels (FMC Bioprod-ucts) and recorded as present or absent. The mtDNA CRHVS-I (np 16050–16383) was sequenced for a randomlyselected subset of 110 individuals (Kogi, n ¼ 21, Ijka,
Fig. 2. Geographic location of comparative South American study populations. Numbers correspond to populations from Table 1.
756 P.E. MELTON ET AL.
American Journal of Physical Anthropology—DOI 10.1002/ajpa
n ¼ 31, Arsario, n ¼ 28, and Wayuu, n ¼ 30) using PCRprimers L15976 and H16422 and the Big Dye protocolfrom Applied BiosystemsTM. For sequences containing ahomopolymeric cytosine stretch from mtDNA np 16184
to 16193, nested sequencing was conducted using inter-nal primer L16190. Sequences were aligned and com-pared with the human mtDNA Cambridge ReferenceSequence (CRS) (Anderson et al., 1981; Andrews et al.,
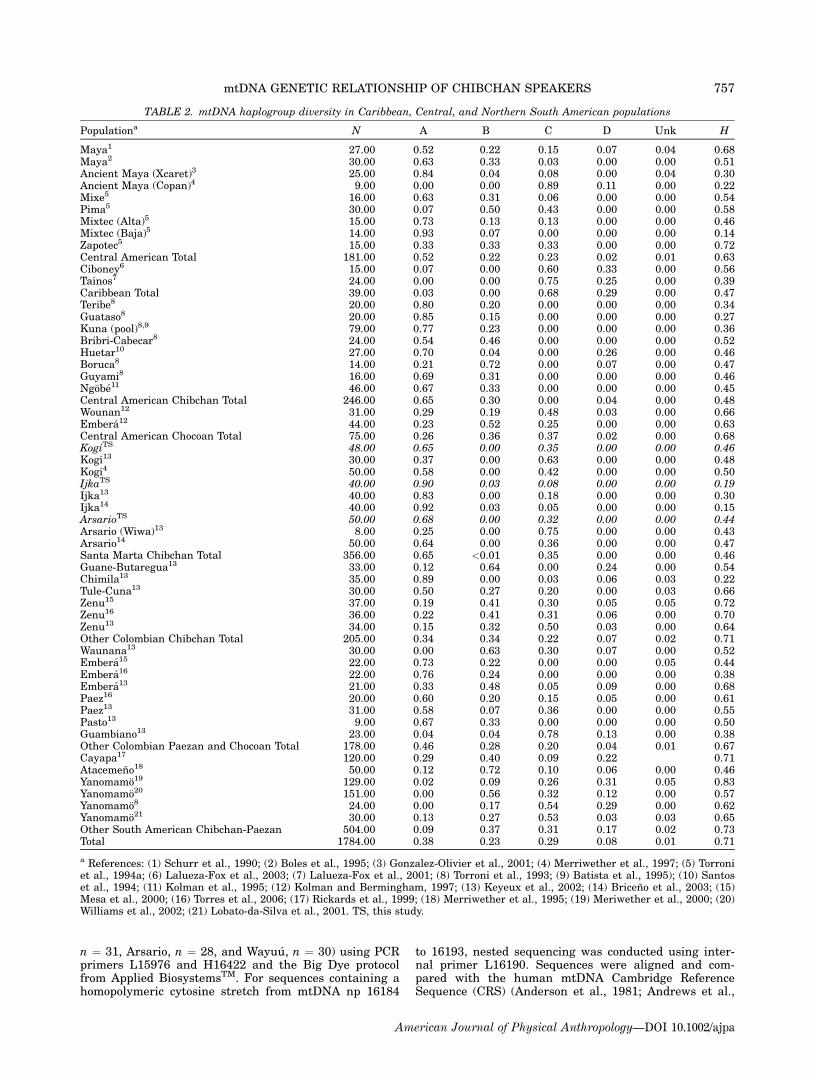
TABLE 2. mtDNA haplogroup diversity in Caribbean, Central, and Northern South American populations
Populationa N A B C D Unk H
Maya1 27.00 0.52 0.22 0.15 0.07 0.04 0.68Maya2 30.00 0.63 0.33 0.03 0.00 0.00 0.51Ancient Maya (Xcaret)3 25.00 0.84 0.04 0.08 0.00 0.04 0.30Ancient Maya (Copan)4 9.00 0.00 0.00 0.89 0.11 0.00 0.22Mixe5 16.00 0.63 0.31 0.06 0.00 0.00 0.54Pima5 30.00 0.07 0.50 0.43 0.00 0.00 0.58Mixtec (Alta)5 15.00 0.73 0.13 0.13 0.00 0.00 0.46Mixtec (Baja)5 14.00 0.93 0.07 0.00 0.00 0.00 0.14Zapotec5 15.00 0.33 0.33 0.33 0.00 0.00 0.72Central American Total 181.00 0.52 0.22 0.23 0.02 0.01 0.63Ciboney6 15.00 0.07 0.00 0.60 0.33 0.00 0.56Tainos7 24.00 0.00 0.00 0.75 0.25 0.00 0.39Caribbean Total 39.00 0.03 0.00 0.68 0.29 0.00 0.47Teribe8 20.00 0.80 0.20 0.00 0.00 0.00 0.34Guataso8 20.00 0.85 0.15 0.00 0.00 0.00 0.27Kuna (pool)8,9 79.00 0.77 0.23 0.00 0.00 0.00 0.36Bribri-Cabecar8 24.00 0.54 0.46 0.00 0.00 0.00 0.52Huetar10 27.00 0.70 0.04 0.00 0.26 0.00 0.46Boruca8 14.00 0.21 0.72 0.00 0.07 0.00 0.47Guyami8 16.00 0.69 0.31 0.00 0.00 0.00 0.46Ngobe11 46.00 0.67 0.33 0.00 0.00 0.00 0.45Central American Chibchan Total 246.00 0.65 0.30 0.00 0.04 0.00 0.48Wounan12 31.00 0.29 0.19 0.48 0.03 0.00 0.66Embera12 44.00 0.23 0.52 0.25 0.00 0.00 0.63Central American Chocoan Total 75.00 0.26 0.36 0.37 0.02 0.00 0.68KogiTS 48.00 0.65 0.00 0.35 0.00 0.00 0.46Kogi13 30.00 0.37 0.00 0.63 0.00 0.00 0.48Kogi4 50.00 0.58 0.00 0.42 0.00 0.00 0.50IjkaTS 40.00 0.90 0.03 0.08 0.00 0.00 0.19Ijka13 40.00 0.83 0.00 0.18 0.00 0.00 0.30Ijka14 40.00 0.92 0.03 0.05 0.00 0.00 0.15ArsarioTS 50.00 0.68 0.00 0.32 0.00 0.00 0.44Arsario (Wiwa)13 8.00 0.25 0.00 0.75 0.00 0.00 0.43Arsario14 50.00 0.64 0.00 0.36 0.00 0.00 0.47Santa Marta Chibchan Total 356.00 0.65 <0.01 0.35 0.00 0.00 0.46Guane-Butaregua13 33.00 0.12 0.64 0.00 0.24 0.00 0.54Chimila13 35.00 0.89 0.00 0.03 0.06 0.03 0.22Tule-Cuna13 30.00 0.50 0.27 0.20 0.00 0.03 0.66Zenu15 37.00 0.19 0.41 0.30 0.05 0.05 0.72Zenu16 36.00 0.22 0.41 0.31 0.06 0.00 0.70Zenu13 34.00 0.15 0.32 0.50 0.03 0.00 0.64Other Colombian Chibchan Total 205.00 0.34 0.34 0.22 0.07 0.02 0.71Waunana13 30.00 0.00 0.63 0.30 0.07 0.00 0.52Embera15 22.00 0.73 0.22 0.00 0.00 0.05 0.44Embera16 22.00 0.76 0.24 0.00 0.00 0.00 0.38Embera13 21.00 0.33 0.48 0.05 0.09 0.00 0.68Paez16 20.00 0.60 0.20 0.15 0.05 0.00 0.61Paez13 31.00 0.58 0.07 0.36 0.00 0.00 0.55Pasto13 9.00 0.67 0.33 0.00 0.00 0.00 0.50Guambiano13 23.00 0.04 0.04 0.78 0.13 0.00 0.38Other Colombian Paezan and Chocoan Total 178.00 0.46 0.28 0.20 0.04 0.01 0.67Cayapa17 120.00 0.29 0.40 0.09 0.22 0.71Atacemeno18 50.00 0.12 0.72 0.10 0.06 0.00 0.46Yanomamo19 129.00 0.02 0.09 0.26 0.31 0.05 0.83Yanomamo20 151.00 0.00 0.56 0.32 0.12 0.00 0.57Yanomamo8 24.00 0.00 0.17 0.54 0.29 0.00 0.62Yanomamo21 30.00 0.13 0.27 0.53 0.03 0.03 0.65Other South American Chibchan-Paezan 504.00 0.09 0.37 0.31 0.17 0.02 0.73Total 1784.00 0.38 0.23 0.29 0.08 0.01 0.71
a References: (1) Schurr et al., 1990; (2) Boles et al., 1995; (3) Gonzalez-Olivier et al., 2001; (4) Merriwether et al., 1997; (5) Torroniet al., 1994a; (6) Lalueza-Fox et al., 2003; (7) Lalueza-Fox et al., 2001; (8) Torroni et al., 1993; (9) Batista et al., 1995); (10) Santoset al., 1994; (11) Kolman et al., 1995; (12) Kolman and Bermingham, 1997; (13) Keyeux et al., 2002; (14) Briceno et al., 2003; (15)Mesa et al., 2000; (16) Torres et al., 2006; (17) Rickards et al., 1999; (18) Merriwether et al., 1995; (19) Meriwether et al., 2000; (20)Williams et al., 2002; (21) Lobato-da-Silva et al., 2001. TS, this study.
757mtDNA GENETIC RELATIONSHIP OF CHIBCHAN SPEAKERS
American Journal of Physical Anthropology—DOI 10.1002/ajpa

1999) using BioEdit sequence alignment editor (Hall,1999). Point mutations at HVS-I np 16182 and 16183were excluded from analysis because they are dependenton the presence of a T-C transition at np 16189 (Pfeifferet al., 1999).
Analytical techniques
Intrapopulational analysis. Mitochondrial DNA hap-logroups for all study and comparative populations werecharacterized for haplogroup diversity (H) using Nei’s(1987) equation. HVS-I sequence variation for all studyand 16 comparative populations were measured for nu-cleotide diversity (p) and haplotype diversity (h) usingNei’s method (1987). Three neutrality test statistics,Tajima’s D (Tajima, 1989), Fu’s Fs (Fu, 1997), andHarpending’s raggedness statistic, r, (Harpending, 1994)were utilized to distinguish population growth from con-stant population size. Fu’s Fs is considered less conserv-ative than both Tajima’s D and Harpending’s r (Ramos-Onsins and Rozas, 2002) and is more sensitive to largepopulation expansions expressed as large negative num-bers whereas positive numbers indicate that the popula-tion may have been impacted by genetic drift (Fu, 1997;Schneider et al., 2000). Statistically significant valueswere generated through random samples under theassumption of selective neutrality and population equi-librium using a coalescent simulation model (Hudson,1990). All measures were calculated using Arlequin 3.0computer package (Excoffier et al., 2005).
Distributions of pairwise differences were used toexamine population history and structure. Mismatch dis-tributions (Rogers and Harpending, 1992; Harpendinget al., 1993) were constructed by enumerating differen-ces between each pair of subjects and using histogramsor scatter plots to display the frequencies of nucleotidevariant sites (Rogers et al., 1996). This measure of diver-sity summarizes the discernible amount of genetic varia-tion within a population. Traditionally, unimodal distri-butions have been viewed as indicative of populationexpansions, whereas multimodal distributions indicatepopulation stasis (Rogers and Harpending, 1992). How-ever, it has recently been demonstrated that populationswith a low migration rate (<50/generation) also exhibitmultiple peaks (Ray et al., 2003; Excoffier, 2004). Excoff-ier (2004) developed a spatial expansion mismatch modelusing an infinite island model with the following fourassumptions: (1) expansion started T generations agofrom a single haploid deme; (2) expansion was instanta-neous and permitted the colonization of an unlimitednumber of islands; (3) after expansion, demes are allconstant size (N1), trade migrants at rate m, and resultin each deme receiving and sending N1m migrants/gen-eration; and (4) random mutations occur at an infiniteamount site of nonrecombining DNA sequences withrate l. This model calculates an additional parameter M(¼ 2 N1m) and corresponds to the expected homozygosityand becomes significant for ‘low’ M values (<50). We cal-culated both sudden (Rogers and Harpending, 1992) andspatial (Excoffier, 2004) expansion mismatch distribu-tions using Arlequin 3.0 (Excoffier et al., 2005). Esti-mates of past population growth may be measured usingthe equation s ¼ 2lt where l equals the mutation rateand t is the time in generations. Time estimates arebased on the mtDNA coalescent (Hudson, 1990) usingboth method of moments (MOM) (Rogers, 1995) and non-linear least squares (NLLS) (Rogers and Harpending,
1992). These estimates were calculated using a mutationrate of 16.5% per HVS-I nucleotide per million years(Ward et al., 1991) with IWAVE (Sherry et al., 1994) andArlequin 3.0 (Excoffier et al., 2005), respectively.
Interpopulation analysis. Phylogenetic networks uti-lizing the median-joining (MJ) method (Bandelt et al.,1995; Bandelt et al., 1999) were constructed to deter-mine the genetic relationship between haplotypes foundwithin the study and comparative populations. Thesetypes of phylogenetic networks offer an advantage overother tree building techniques because they distinguishbetween irresolvable and resolvable character conflictsthat occur due to homoplasy and may be interpreted asrecombination, sequence errors, or phantom mutations(Bandelt et al., 1995). MJ networks were visualized withNetwork 4.0 (www.fluxus-engineering.com) and inte-grated into a schematic based on previously publishedNative American (Forster et al., 1996) and East Asian(Kivisild et al., 2002) mtDNA sequences.
A MDS plot (Kruskal, 1964) was constructed to visual-ize the biological relationship between the study andcomparative populations. The distance method utilizedin this analysis was a dXY matrix with a Tamura-Nei(Tamura and Nei, 1993) model of substitution and ag-value of 0.26 (Meyer et al., 1999). The resulting MDSplot was generated using NTSYS (Applied Biostatistics)and the matrix was computed using Arelquin 3.0(Excoffier et al., 2005). Estimates of population diver-gence (dA), average nucleotide diversity within (dX), andbetween populations (dXY) were calculated using Arle-quin 3.0 (Excoffier et al., 2005). Intermatch distributionswere calculated with the computer program IWAVE(Sherry et al., 1994) to determine potential populationdivergence.
RESULTS
Haplogroup frequency data
Of the 188 samples from which DNA was extracted,183 were assigned by RFLP analysis to one of the fourfounding Native American haplogroups (Schurr et al.,1990; Torroni et al., 1993). Five Wayuu samples could notbe assigned to any Native American specific haplogroup.Subsequent HVS-I sequencing of one of these samplesrevealed that it belonged to African subhaplogroup L2a(Salas et al., 2002), and indicated the presence of Africanadmixture, which had been previously demonstratedusing microsatellite and classical genetic data (Yuniset al., 1994; Guarino et al., 1999). Subsequent sequenc-ing of the remaining four Wayuu samples failed andinsufficient DNA remained for further RFLP analysis. Itis possible that these samples may have been C-rever-tants, common in northern South American Equatorial-Tucano populations (Torres et al., 2006). We investigatedthe presence/absence of a MspI RFLP cut site in 60 hap-logroup A samples from the three Santa Marta Chibchanpopulations. All samples examined exhibited this restric-tion site, suggesting that the loss of this mutation inCentral American Chibchan groups may have occurredafter the Magdalenic subfamily diverged from the othermajor Chibchan subfamilies. Haplogroup diversity (H)and frequencies for the four study populations, 37 com-parative South American, and 31 regional populationsare given in Tables 1 and 2.
758 P.E. MELTON ET AL.
American Journal of Physical Anthropology—DOI 10.1002/ajpa

Haplogroup A (65%, 68%) and C (35%, 32%) were theonly two haplogroups present in the Kogi and Arsario,respectively. Haplogroup A (90%) was highest in the Ijka(90%) although small frequencies of B (2.5%) and C(7.5%) were also present. The Wayuu, contained rela-tively equal amounts of haplogroup A (34%), B (24%),and C (32%). Haplogroup D was absent from all fourstudy populations. The Ijka exhibited the lowest hap-logroup diversity (H) 0.19 and 0.15 (Briceno et al., 2003)of any of the populations in Tables 1 or 2. The Wayuu(0.69) demonstrated the highest H value of any of thestudy populations while the Arsario (0.44), and Kogi(0.46) showed intermediate values. Santa Marta Chib-chan populations demonstrated the lowest average groupH value from Table 2.
The three Santa Marta Chibchan populations shared ahigh frequency of haplogroup A with other Chibchanpopulations from Central America. The presence of hap-logroup C distinguished these groups from other Chib-chan-speakers. This haplogroup is absent from lowerCentral American populations (Kolman and Berming-ham, 1997) but occurs in high frequencies in other SouthAmerican populations (Keyeux et al., 2002). The SantaMarta populations also differed in the absence ofhaplogroup B, which was detected in a single Ijka indi-vidual.
HVS-I sequencing
mtDNA HVS-I sequences of 110 participants (28Arsario, 21 Kogi, 31 Ijka, and 30 Wayuu) are shown inTable 3. Based on diagnostic CR point mutations,sequences belong to haplogroups A (n ¼ 73), B (n ¼ 9), C(n ¼ 27), and L2a (n ¼ 1). Eleven haplotypes character-ized by 21 nucleotide variant sites were observed whencompared with the CRS (Anderson et al., 1981; Andrewset al., 1999). Haplogroup C demonstrated the most varia-tion and contained five haplotypes. Four lineagesbelonged to the Native American A2 subhaplogroup anda single haplotype represented B and L2a. Four haplo-types (SMA3, SMA7, SMB1, and SMC3) were sharedbetween at least two groups within the four study popu-lations. Haplotypes SMA3 and SMC3 are shared by theKogi and Arsario, SMA7 between the Ijka and Arsario,and SMB1 between the Wayuu and Ijka. Of the 10Native American haplotypes detected, six (60%) of themhad not been previously reported. The most commonhaplotype, SMA7 (n ¼ 37), occurs in North Americanpopulations: Bella-Coola, Nuu-Cha-Nuluth, Haida, andCheyenne (Ward et al., 1991; Ward et al., 1993; Malhiet al., 2002), but are found in lower frequencies in SouthAmerican (Pehuenche n ¼ 3, Moraga et al., 2000, Colom-bian Embera n ¼ 1, Torres et al., 2006) and Caribbean(Ciboney, n ¼ 1, Lazleua-Fox et al., 2003) groups. Haplo-types SMA3, SMB1, and SMC1 are also shared withother Native North and South American populations.
Table 4 summarizes diversity measures and neutralitytest statistics for the four study groups, two Caribbean,five Central, and six South American populations. TheIjka demonstrated the lowest haplotype diversity (0.185)of any of the groups, even lower than the Ache, who hadbeen previously reported to have the lowest diversity forany South American population (Schmitt et al., 2004).Estimates of high haplotype diversity (>0.90) were foundin the Tainos, Ciboney, Maya, Panamanian Embera,Mapuche, and Wounan. Nucleotide diversity levelsranged from a low of 0.003 (Ache) to a high of 0.02
TABLE
3.mtD
NA
HVS-I
sequen
cesforfourstudypop
ulation
samples
Hap
logro
up
Hap
loty
pe
11
11
11
11
11
11
11
11
11
11
11
Ars
ari
oIj
ka
Kog
iW
ayu
uT
otal
66
66
66
66
66
66
66
66
66
66
66
01
11
11
22
22
22
22
22
33
33
33
61
28
89
12
46
79
99
99
01
12
26
61
94
92
73
55
80
46
78
91
95
72
CR
Sa
AC
GC
TC
TC
CA
CC
CC
TT
AT
GT
CT
A2
SM
A1
–T
––
––
––
––
–T
––
––
––
A–
–C
––
–8
8S
MA
3–
T–
–C
––
T–
––
T–
––
––
–A
––
C11
–14
–25
SM
A7
–T
A–
––
–T
––
–T
––
––
––
A–
–C
928
––
37
SM
A11
–T
A–
––
–T
––
–T
––
C–
––
A–
–C
––
3–
3B
SM
B1
––
––
C–
C–
––
––
––
––
––
––
––
–1
–8
9C
1S
MC
1–
––
––
––
T–
––
––
––
C–
––
CT
––
––
77
SM
C2
G–
––
–T
–T
––
––
––
–C
–C
–C
T–
––
–6
6S
MC
3–
––
––
––
T–
G–
––
––
C–
–A
CT
–5
–4
–9
SM
C4
––
–T
––
–T
–G
––
––
–C
––
AC
T–
3–
––
3C
SM
C5
––
––
––
TT
––
––
––
C–
––
–T
––
2–
–2
L2a
SM
L1
––
–C
T–
T–
–T
–T
T–
–G
––
––
––
––
11
Tot
al
28
31
21
30
110
On
lyvari
able
site
sare
show
n.
aR
evis
edC
am
bri
dge
Ref
eren
ceS
equ
ence
(An
dre
ws
etal.
1999,
An
der
son
etal.
,1981).
759mtDNA GENETIC RELATIONSHIP OF CHIBCHAN SPEAKERS
American Journal of Physical Anthropology—DOI 10.1002/ajpa

TABLE
4.Diversity
mea
suresandneu
trality
test
statistics(C
hibch
anpop
ulation
sin
italics)
Pop
ula
tion
an
No.
hap
loty
pes
No.
nu
cleo
tid
evari
an
tsi
tes
Hap
loty
pe
div
ersi
ty(h
)N
ucl
eoti
de
div
ersi
ty(p
)M
sbsc
Taji
ma’s
DF
u’s
Fs
Harp
end
ing’sr
ArsarioT
S28
410
0.7
25
0.0
12
1.3
49.8
58.0
11.9
85.7
40.3
6*
Ijka
TS
31
312
0.1
85
0.0
04
0.2
53.0
19.0
6�
1.5
8*
2.9
60.6
8Kog
iTS
21
310
0.5
23
0.0
09
1.1
56.0
08.8
40.5
85.3
00.4
2Ngob
e246
712
0.7
63
0.0
12
1.0
89.9
38.1
01.6
83.3
90.1
1Kuna
363
710
0.5
92
0.0
09
1.0
78.1
67.3
71.5
22.7
70.2
4Huetar4
29
712
0.7
09
0.0
10
2.1
16.8
35.2
60.4
11.1
80.1
5E
mber
a1
44
20
23
0.9
42
0.0
18
3.6
19.1
16.2
60.4
6�
4.3
80.0
3W
oun
an
131
14
29
0.9
12
0.0
20
10.5
29.5
29.4
7�
0.2
7�
1.0
10.0
5W
ayu
uT
S30
617
0.8
25
0.0
16
4.5
48.1
87.3
30.9
74.6
00.1
6**
Map
uch
e539
13
20
0.9
16
0.0
17
11.6
56.8
26.5
00.7
8�
0.1
20.0
3X
avan
te6
25
410
0.6
77
0.0
09
0.4
99.5
97.6
50.4
43.7
20.3
2Z
oro6
29
816
0.7
59
0.0
111.9
57.0
24.9
0�
0.2
00.8
50.0
8G
avia
o6
28
716
0.8
62
0.0
12
0.9
98.2
55.4
20.0
81.9
70.0
6Yanom
amo7
129
31
31
0.9
06
0.0
14
9.2
76.7
25.9
6�
0.4
7�
8.6
0**
0.0
4*
Ach
e863
37
0.2
04
0.0
03
0.2
63.0
57.7
2�
0.3
93.0
80.6
5T
ain
os9
19
1113
0.9
18
0.0
08
22.6
53.4
53.2
6�
0.7
4�
4.2
1**
0.0
2C
ibon
ey10
15
10
12
0.9
43
0.0
09
48.2
83.2
23.0
1�
0.3
8�
3.6
8*
0.0
7Shamatari
11
151
614
0.6
39
0.0
111.7
07.6
46.6
81.2
06.8
90.2
4Caya
pa
12
30
818
0.8
36
0.0
18
6.2
98.5
28.3
21.1
52.8
70.1
4*
Maya
13,1
434
18
27
0.9
30
0.0
17
24.7
68.7
82.2
8�
0.5
78
�4.9
0*
0.0
6
aD
ata
from
:T
S,
this
stu
dy,
(1)
Kol
man
an
dB
erm
ingh
am
,1997,
(2)
Kol
man
etal.
,1995,
(3)
Bati
sta
etal.
,1995,
(4)
San
tos
etal.
,1994,
(5)
Gin
ther
etal.
,1993,
(6)
Ward
etal.
,1996,
(7)
Mer
riw
eth
eret
al.
,2000,
(8)
Sch
mit
tet
al.
,2004,
(9)
Lalu
eza-F
oxet
al.
,2001,
(10)
Lalu
eza-F
oxet
al.
,2003,
(11)
Wil
liam
set
al.
2002,
(12)
Ric
kard
set
al.
1999,
(13)
Bol
as
etal.
1995,
(14)
Tor
ron
iet
al.
1993.
ns,
not
sign
ifica
nt.
bS
ud
den
exp
an
sion
mis
matc
hm
odel
(Rog
ers
an
dH
arp
end
ing,
1992).
cS
pati
al
exp
an
sion
mis
matc
hm
odel
(Exco
ffier
,2004).
*P
<0.0
5,
**P
<0.0
1.
760 P.E. MELTON ET AL.
American Journal of Physical Anthropology—DOI 10.1002/ajpa

(Wounan). The Ijka were the only population with statis-tically significant Tajima’s D value, indicating the effectsof either expansion or selection. Four populations(Yanaomamo, Tainos, Ciboney, Maya) exhibited signifi-cantly negative Fu’s Fs values, indicative of populationgrowth. The Yanomamo were the only population to dis-play a significant Harpending’s r value less than 0.05,suggesting expansion.
Mismatch distributions for all four study populationsare displayed in Figure 3 while the M and s-values forsudden and spatial expansion models are shown inTable 4. All distributions are either multimodal orbimodal with peaks between 7 and 10 and a secondarypeak between 0 and 1. Multimodal peaks are common inNative American populations and the peak between 0and 1 may be the product of sampling related individu-als or genetic drift (Lewis et al., 2005).This type of distri-bution is generally interpreted as a signature of popula-tion stasis (Rogers and Harpending, 1992) but othershave indicated that multimodality may be indicative ofpopulation substructure or due to a low number ofmigrants between populations (Ray et al., 2003; Excoff-ier, 2004). All populations in this study demonstrated Mvalues less than 50 (Table 4), indicating that the spatialexpansion mismatch model (Excoffier, 2004) provided abetter fit to these data than that the sudden expansionmodel (Rogers and Harpending, 1992). Based on s-valuesfor both models the spatial expansion model generated abetter non-linear least squares fit to s, except whereM and haplotype diversity were small (Ijka, Kogi, Ache),due to increased variance of the mismatch distribution,that led to increased s values (Ray et al., 2003).
MJ networks for haplogroups A and C are displayed inFigures 4 and 5. Haplogroup A (Fig. 4), contained foursatellite clusters (16129, 16187, 16189, and 16360) anddated to 24,486 6 7,811 YBP, using the q-statistic (q ¼
1.21 6 0.39) (Forster et al., 1996; Saillard et al., 2000).The four satellite nodes are composed mostly of Chib-chan-speakers but are regionally differentiated betweenSanta Marta and Central American groups. The satellitenode (16189) demonstrated that most of the variationcoalesced at 7,063 6 3,346 (q ¼ 0.35 6 0.16). The otherthree satellite nodes coalesced at dates ranging from13,894 6 12,914 (16360, q ¼ 0.68 6 0.63) to q ¼ 0.68 60.63 (16129, q ¼ 0.09 6 0.07) but exhibited low variabili-ty and high variances, suggestive of limited statisticalvalidity. Haplogroup C (Fig. 5) included a large centralnode (C1), included several South American populations,and dated to 20,473 6 5,788 (q ¼ 1.01 6 0.29). This net-work is star-like and presented a number of reticulationsas well as population-specific nodes. The Santa MartaChibchan populations were found embedded on the edgeof the network in two clusters (16265:16319:16184, and�16325:16245) and did not share nodes with otherCaribbean, Central, or South American haplogroup Cpopulations. Temporal estimates provided for haplogroupA and C were consistent with other published temporalestimates for their origins in the Americas (Schurr, 2004;Schurr and Sherry, 2004).
Estimates of population divergence are presented inFigure 7 and a MDS plot is shown in Figure 6. The MDSbidimensional plot had a high goodness of fit correlation(r ¼ 0.97) between the original data matrix and theresulting plot. Santa Marta populations demonstrated amore recent divergence from Central American Chib-chan-speakers and the Maya and aggregate closest toeach other in Figure 7. The Ijka were the furthest Chib-cha group from other Central and South Americaninhabitants. The Kuna were the most distant from SantaMarta populations, but they are recent migrants fromthe Pacific coast of Colombia (Batista et al., 1995). Of allthe proposed South American Chibchan-Paezan speak-
Fig. 3. Mismatch distributions of the four study populations (Arsario, Ijka, Kogi, and Wayuu). Number of nucleotide differencesare indicated along the x-axis, and the frequency of the pairs is indicated along the y-axis.
761mtDNA GENETIC RELATIONSHIP OF CHIBCHAN SPEAKERS
American Journal of Physical Anthropology—DOI 10.1002/ajpa

ers, the Cayapa appeared nearest to Central Americangroups, while the Yanomamo and the Shamatari werethe most distant. The Shamatari were closer to theMapuche and the Ache than to the Yanomamo who wereclosest to the Colombian Wayuu. Of the four study popu-lations, the Wayuu were furthest from the Santa MartaChibchan populations. The presence of Santa Marta pop-ulations near Center American Chibchan-speakers indi-cates that these populations may share genetic history,
however recent gene flow between groups should havecontained identical HVS-I sequences.
Intermatch distributions were calculated betweenSanta Marta Chibchan-speakers (Kogi, Arsario, Ijka),three groups (Caribbean, Central American Chibchanand Chocoan), and regional populations (Maya, Wayuu,Yanomamo, etc). Figure 8a exhibited the relationshipbetween Santa Marta, Central Chibcha, and the Maya.All populations in this figure displayed two intermatch
Fig. 4. MJ Network for Haplogroup A in 20 Caribbean, South, and Central American Indigenous populations. Centered on A2node (includes diagnostic nucleotide sites 16111, 16223, 16290, 16319, 16362).
762 P.E. MELTON ET AL.
American Journal of Physical Anthropology—DOI 10.1002/ajpa

peaks, with one between 7 and 10 mutation differencesand another between 2 and 3. The second peak over-lapped between these groups and indicated that thesepopulations may have undergone a second populationexpansion. This differs from the intermatch distributionshown in Figure 8b, which showed: (1) no overlappingsecond peak between Santa Marta Chibchan populationsand Caribbean groups; (2) a minor peak for CentralAmerican Chocoan populations; and (3) was centeredaround four mutations. Intermatch distributions betweenthe Santa Marta groups and other populations (data notshown) all demonstrated results similar to Figure 8b.Average-sequence variation within populations (Fig. 6)indicated that Chocoan speakers harbored the mostgenetic diversity, followed by the Mapuche, while theIjka and the Ache exhibited the least.
All study and comparative populations were coalescentdated using two different methodologies (Table 5). The
method of moments (MOM) model (Rogers, 1995) pre-sented age estimates of 9,467 (Arsario), 1,270 (Kogi), and25,681 (Wayuu) within the study groups. Two popula-tions (Ache, Ijka) were not dated with this techniquebecause u was larger than m, and resulted in negatives-values. These dates differed significantly from thosegiven by the sudden (Rogers and Harpending, 1992) andspatial (Excoffier, 2004) non-linear least square models(NLLS) mismatch models, which presented deeper tem-poral estimates for all populations from Table 5. BothMOM and NLSS are based on the mismatch distribution;however, from these data, it appeared that the NLLSmethod was more sensitive to multimodality and subse-quently inflated the estimated coalescent date. Dates esti-mated from MOM are more consistent with dates pre-sented in the MJ networks (Figs. 4 and 5) and with thosefrom the archaeological record (Cooke, 2005), while NLSStimes are more consistent with older coalescent events.
Fig. 5. MJ Network for Haplogroup C in 20 Caribbean, South, and Central American Indigenous populations. Centered on CInode (includes diagnostic nucleotide sites 16223, 16298, 16325, 16327).
763mtDNA GENETIC RELATIONSHIP OF CHIBCHAN SPEAKERS
American Journal of Physical Anthropology—DOI 10.1002/ajpa

DISCUSSION
This study provides additional mtDNA RFLP and newHVS-I sequence data for four indigenous Colombian pop-ulations who live in close geographic proximity but rep-resent two distinct linguistic families. These groups alldemonstrate a northern Colombia mtDNA RFLP patternas suggested by Keyeux et al. (2002). The three SantaMarta Chibchan share a number of HVS-I geneticcharacteristics with linguistically related families fromCentral America, including, low haplotype diversity, pos-itive Fu’s FS values, low M-values, overlapping inter-match distributions, and low between population diver-sity estimates. However, these populations do not sharemtDNA haplotypes indicating that linguistic separationfor Chibchan populations more than likely occurred dur-ing the Pleistocene/Holocene transition 10,000 YBP.These data also support the hypothesis of an early geo-graphic expansion of Chibchan-speakers from CentralAmerica into South America that do not genetically over-lap with contemporary immigrants in the same region.This population expansion may have been caused byshifting climatic conditions occurring in the region7,000–10,000 YBP that resulted in altered human sub-sistence strategies (Cooke, 2005). These paleo-climatic
changes resulted in several microenvironments thatfavored endogenous cultural development and genetichomogeneity in human populations. Furthermore, as cul-tural complexity increased in the region, trade was facili-tated, but gene flow between populations remained low.
The majority of individuals in these three SierraNevada de Santa Marta Chibchan populations belong tohaplogroup A and this is shared with other Chibchanpopulation from lower Central America. Where theseSanta Marta Chibchan speakers differ is in the presenceof haplogroup C, which is absent in Central Americangroups. Kolman and Bermingham (1997) suggested thathaplogroup C was not present throughout Chibchangenetic history. These data shown here appear to refutethat. A potential explanation for this is that all four ofthe major Native American mtDNA haplogroups werepresent at the beginning of Chibchan genetic divergenceand then subsequently lost through genetic drift. All ofthese Chibchan populations have gone through a signifi-cant depopulation within the last 400 years because ofEuropean contact and these different distributions maybe representative of that. However, this explanation isunlikely as all Native American populations wentthrough these severe contact depopulation events andseveral of these groups contain at least four of the fivefounding haplogroups and higher mtDNA diversity thanseen in Chibchan populations (Schurr and Sherry 2004,Kolman et al., 1995). An alternate explanation is thatthese individuals belonging to haplogroup C were part ofan earlier migration to South America (Keyeux et al.,2002; Fox 1996). This is demonstrated through threeChibchan nodes on the haplogroup C MJ network(Fig. 5). All of these Santa Marta Chibchan populationsare deeply rooted within the MJ network and appear onthe periphery, indicative of a significant time depth for adistinct genetic structure to appear.
The MDS plot (Fig. 6) exhibits a relationship betweenSanta Marta Chibchan populations and other CentralAmerican groups. Contrary to previous published studieson Chibchans (Barrantes et al., 1990; Torroni et al.,1994b; Batista et al., 1995; Kolman et al., 1995; Bieberet al., 1996; Kolman and Bermingham, 1997; Ruiz-Narvaez et al., 2005), we find a close affinity betweenFig. 6. Multidimensional scaling plot of DA distances for 20
populations found in Table 4.
Fig. 7. HVS-I nucleotide diversity within and between populations. Average-nucleotide differences are shown within (dX alongdiagonal) and between populations (dA below diagonal, distances between Chibchan populations in bold italics) using the assump-tion of Tamura and Nei (1993) model of substitution with a g value of 0.26.
764 P.E. MELTON ET AL.
American Journal of Physical Anthropology—DOI 10.1002/ajpa

these groups and the Maya, an observation supported byrecent unpublished evidence from archaeology andlinguistics (J. Hoopes personal communication). However,this association is based upon a single Mayan groupfrom Guatemala (Boles et al., 1995), while the Maya area large, heterogeneous group. Further mtDNA sequencedata from other groups is needed for the testing of thishypothesis. This Mayan-Chibchan relationship is alsoexhibited in the intermatch distributions between thesethree groups (Fig. 8a). These populations all exhibit asecond overlapping peak that it not shared when com-
pared to other South American populations, which is sug-gestive of an early population expansion in the region.
Computer simulation utilizing mtDNA haplogroupdata from North America supports the hypothesis thatthe continent was first colonized along coastal and river-ine routes (Fix, 2005). While exact migration routes forSouth American are unknown it can be assumed the firstgroups of Paleoindians moved south and over time grad-ually evolved into several heterogeneous eastern SouthAmerican populations (Dillehay, 2000; Lavallee, 2000;Pearson, 2002; Cooke, 2005). Chibchan populations would
Fig. 8. Intermatch distributions of CR sequences among several populations. Panel A plots the intermatch distributions betweenSierra Nevada de Santa Marta Chibchan and 2 goups of Central American regional populations (Central American Chibchan(Kuna, Ngobe, Huetar) and the Quiche Maya). Panel B plots Santa Marta Chibchan groups vs. Central American Chocoan (Embera,Wounan), and Caribbean populations. The numbers of nucleotide differences, between all pairs of sequences among populations, areindicated along the x-axis, and the frequency of pairs is indicated along the y-axis.
765mtDNA GENETIC RELATIONSHIP OF CHIBCHAN SPEAKERS
American Journal of Physical Anthropology—DOI 10.1002/ajpa

have moved along the Pacific and Caribbean coasts,while they maintained closer contact with Central Amer-ican groups (Fox, 1996; Keyeux et al., 2002). These popu-lations also share certain genetic characteristics withpopulations from the northwest coast of North America,including a high frequency of haplogroup A and a smallnumber of haplotypes, such as 16189 (Ward et al., 1991;Mahli et al., 2002). However, this relationship requiresfurther evidence in order to support or refute it. If thisearly population expansion represented a Chibchan dias-pora, it is probable that the Andean cordillera slowedmovement of people further south. As population sizeincreased, groups were backed up into the Panamanianisthmus, which caused the region to become moredensely populated and blocked more migrants from thenorth (O’Rourke et al., 1992). Ethnohistoric data supportthis argument. The two largest Chibchan-speaking popu-lations present at contact were from Colombia andincluded the Tairona, whose maximum population sizeat contact has been estimated at 468,000 (Langebaek,2003) and the Muisca whose estimated size at Spanishcontact was 500,000 (Hoopes and Fonseca, 2003). Lin-guistic evidence also supports this argument. Colombiacontains the second largest number of indigenous popu-lations in South America representing 80 differentlinguistic families (Yunis et al., 1994). The geographicdistribution of these languages is more numerous andfragmented on the southeastern side of the Andes,whereas on the northwestern side there are fewer lan-guages and most populations have cultural and biologi-cal affinities to either Central American (Chibchan andChocoan) or Caribbean (Arawak and Carib) populations.
MOM (Rogers, 1995) coalescent dates (Table 4) indi-cated that Chibchan populations shared similar genetic
histories, with origins within the last 15,000–8,000 YBP,which are consistent with other temporal estimatesbased on classical markers (Barrantes et al., 1990),mtDNA (Batista et al., 1995; Kolman et al., 1995; Kol-man and Bermingham, 1997), and Y-chromosome (Ruiz-Narvaez et al., 2005) data. Coalescent dates using theNLLS method (Rogers and Harpending, 1992) givedeeper time depths and may be associated with earliercoalescent events but may also be an artifact of the con-servative phylogenetic mutation rate (Ward et al., 1991)used in this study. The actual mtDNA mutation rate iscontroversial, and estimates differ considerably betweenpedigree and phylogenetic studies (Sigurgardottir et al.,2000; Ho et al., 2005; Ho and Larson, 2006). Preliminaryanalysis of these data (not shown) using an intermediaterate of 0.66 3 10�5/site and assuming 27 years/genera-tion (Sigurgardottir et al., 2000) provide estimates moreconsistent with regional archaeological evidence(Pearson, 2002; Cooke, 2005). However, archaeologicaland paleoecological studies indicate that humans haveoccupied the region within this time period domesticatedcrops between 9,000–7,000 YBP (Cooke, 2005).
Paleoenvironmental reconstructions in the Centraland northern South America have demonstrated thatthe region was cooler and drier during the Pleistocenethan at present (Cooke, 2005). This environment wascharacterized by open grassy savannas and xeric habi-tats, inhabited by megafauna and beneficial to humanhunter-gatherers (Lynch, 1983). Climatic oscillationsduring the Younger Dryas (10,000–8,500) created warmerand moister environments, which led to a shift towardmesic forests, while human disturbance intensified(Cooke, 2005). Archaeological evidence from three cen-tral Panamanian sites (Carabalı, Vampiros, and Agua-
TABLE 5. Coalescent time estimates for the four study populations and its mtDNA haplotypes
Population n s-method of momentsa Ageb s-least squaresc Ageb s-least squaresd Ageb
Arsario 28 1.04 9,467 9.83 89,185 8.01 72,672Ijka 31 – – 3.00 27,218 9.06 82,199Kogı 21 0.13 1,207 6.00 54,436 8.84 80,203Ngobe 46 0.89 8,044 9.92 92,256 8.10 73,489Kuna 63 1.69 15,344 8.14 75,702 7.37 66,686Huetar 27 1.41 12,752 6.83 63,519 5.26 47,722Embera 44 3.45 31,268 9.11 84,723 6.26 56,975Wounan 31 3.82 34,679 9.95 92,535 9.47 85,919Wayuue 29 2.83 25,681 8.17 74,124 7.33 66,503Mapuche 39 4.40 39,953 7.93 73,749 6.50 58,972Xavante 24 0.34 3,051 9.52 88,536 7.65 69,406Zoro 29 1.39 12,655 7.02 65,286 4.90 44,456Gaviao 28 1.70 15,440 8.24 76,632 5.42 49,174Yanamamo 129 3.30 29,906 6.22 57,846 5.96 54,073Ache 63 – – 3.00 27,218 7.72 70,041Tainos 19 2.39 21,673 3.45 31,301 3.26 29,577Ciboney 15 2.19 19,874 3.01 27,390 3.01 27,309Shamatari 151 1.21 10,938 7.65 69,406 6.68 60,606Cayapa 30 3.97 36,000 8.52 77,390 8.32 75,485Maya 34 3.32 30,158 8.78 79,658 2.28 20,685
Chibchan populations are in italics.a s-parameter was estimated by method of moments in which s ¼ m� u, where u ¼
ffiffiffiffiffiffiffiffiffiffiffiffiffiffiffiffiffiðv�mÞ
p, where v is the variance and m is the
mean of the mismatch distribution (Rogers, 1995).b Coalescent times were estimated using the equation s ¼ s/2l where l is the mutation rate for mtDNA HVS-I. Ward et al. (1991)16.5% per HVS-I nucleotide per million years mutation rate was used.c s-parameter was estimated by fitting the sudden expansion estimated mismatch model to the observed mismatch distributionthrough a generalized non-linear least squares approach (Rogers and Harpending, 1992).d s-parameter was estimated by fitting the spatial expansion estimated mismatch model to the observed mismatch distributionthrough a generalized non-linear least squares approach (Excoffier, 2004).e One Wayuu haplotype found to be of African ancestry was excluded.
766 P.E. MELTON ET AL.
American Journal of Physical Anthropology—DOI 10.1002/ajpa

dulce) demonstrated the presence of four domesticatedplants: bottle gourd (Lagenaria siceraria); arrowroot(Maranta arundinacea) leren (Calathe allouia), andsquash dated to between 9,000–7,000 YBP. Arrowroothas also been found at site in highland Colombia thatdate between 10,000–9,000 YBP (Bray, 2000). ThesePleistocene/Holocene climate changes also led to a num-ber of microenvironments and as people began to altertheir environment led to reduced diversity and move-ment among populations in the region.
The resulting subsistence shift to horticulture isclearly demonstrated in the genetic structure of Chib-chan populations, based on mtDNA. The majority ofChibchan populations are characterized by low haplotypediversity values relative to most other South Americangroups. In addition, they all have extremely low Mvalues, suggesting that there is low maternal gene flowbetween groups in the region. The lowered maternalmigration reduces the level of variation within the popu-lation since the only remaining source of new geneticmaterial is mutation. Ethnographic information supportsthis assumption as most Chibchan-speakers practiceuxorilocal marriage customs (husband moves to wife’shome) (Reichel-Dolmatoff, 1950; Kolman et al., 1995).This matrilocality leads to the characteristic nodes foundin the phylogenetic networks (Figs. 4 and 5), in whichChibchan groups are primarily composed of one or twomajor haplotypes along with a few singletons. Other evi-dence for this comes from the neutrality test statistics(Table 4). Populations that have expanded have largesignificant negative values. In the case of Chibchan-speaking groups and the majority of eastern SouthAmerican groups all values are either positive or non-significant negative values, indicating long term popula-tion continuity. This pattern differs from Andean (Fuselliet al., 2003; Lewis et al., 2005), Siberian, and NorthAmerican (Zlojutro et al., 2006) populations that demon-strated recent demographic expansion. As cultural com-plexity increased in the region beginning around 6,000YBP (Cooke, 2005), trade was facilitated, but maternalgene flow remained low. While early horticultural sitesare not known from the Santa Marta region, the ecologyof the region contains five major ecological zones (tropi-cal, subtropical, temperate, paramo, and snowline) foundin South America, four of which were intensively usedby populations in the region at Spanish contact (Wilson,1999)
The mtDNA evidence presented here supports anin situ development for the Santa Marta populations(Bray, 1984; Langebaek, 2003) and suggests that peoplewere in the area prior to the development of social com-plexity (Hoopes, 2005; Hoopes and Fonseca, 2003). Thepresence of long term biological continuity in the regionindicates that these populations were not mobile andthis may have facilitated the adoption of the Chibchanlanguage. Glottochronological evidence for the origin ofChibcha, indicate that the language arose because ofincreased sedentism as a result of the introduction ofagriculture into the region between 6,000–4,000 YBP(Constenla-Umana, 1991). New evidence from archaeol-ogy and other disciplines suggests that this is the timeframe for regional cultural complexity and increaseddiversification (Cooke, 2005) and that social stratificationbegan between 2,500–1,300 YBP (Hoopes, 2005). Thislatter date correlates with coalescent chronologies forthe Kogi and suggests that their origins may haveoccurred during this time frame. However the Kogi show
close genetic affinity to the Arsario, who presented amuch earlier coalescent date, consistent with other Chib-chan-speaking groups from lower Central America.
CONCLUSION
Over the last decade increased scientific inquiry hasfocused on Chibcha-speaking populations from lowerCentral and northern South America due to their geo-graphic location bridging the two American continents.This research has rejected the traditional notion of theregion as a heavily trodden pathway for migrating popu-lations and instead suggested long term occupancy andbiological continuity. While archaeological and linguisticresearch has found a cultural association betweenCentral and South American Chibchan speaking popula-tions, the biological relationship remains largely unre-solved. This study demonstrated that northern Southand lower Central American Chibchan speakers share aunique genetic structure but if they share commonancestry it occurred in the distant past. We also find anaffinity between Chibchan groups and a Mayan popula-tion. In addition, we propose an early expansion ofChibchan-speakers from Central America into northernSouth America. We propose that this expansion wasprecipitated by climatic changes during the Pleistocene-Holocene transition and was accompanied by a subsist-ence shift from hunter-gathering to horticulture.However, in order to strengthen this hypothesis furthermolecular evidence is required from the boundaries ofthe Chibchan linguistic frontier, the Caribbean, Meso-america, and from skeletal populations.
ACKNOWLEDGMENTS
We express our appreciation to the Kogi, Arsario, Ijka,and Wayuu people, who voluntarily agreed to participatein the study of their molecular identity. We thankR. John Mitchell, R. van Oorschot, and J Hoopes forhelpful discussions, CM Bravi, AJ Redd, M Zlojutro fortheir comments on earlier versions of this manuscript,TG Schurr for providing PCR primer information on thent 104 MspI cut site and C. Langebaek and A. Oyuela-Cayceo for sharing their archaeological research. We alsothank the late S.S. Papiha for facilitating this investiga-tion of Chibchan genetic history. Carroll D. Clark awardwas given.
LITERATURE CITED
Anderson S, Bankier AT, Barrell BG, de Bruijn MH, CoulsonAR, Drouin J, Eperon IC, Nierlich DP, Roe BA, Sanger F,Schreier PH, Smith AJ, Staden R, Young IG. 1981. Sequenceand organization of the human mitochondrial genome. Nature290:457–465.
Andrews RM, Kubacka I, Chinnery PF, Lightowlers RN,Turnbull DM, Howell N. 1999. Reanalysis and revision of theCambridge reference sequence for human mitochondrial DNA.Nat Genet 23:147.
Bailliet G, Rothhammer F, Carnese FR, Bravi CM, Bianchi NO.1994. Founder mitochondrial haplotypes in Amerindian popu-lations. Am J Hum Genet 55:27–33.
Bandelt HJ, Forster P, Rohl A. 1999. Median-joining networksfor inferring intraspecific phylogenies. Mol Biol Evol 16:37–48.
Bandelt HJ, Forster P, Sykes BC, Richards MB. 1995. Mitochon-drial portraits of human populations using median networks.Genetics 141:743–753.
767mtDNA GENETIC RELATIONSHIP OF CHIBCHAN SPEAKERS
American Journal of Physical Anthropology—DOI 10.1002/ajpa

Barrantes R, Smouse PE, Mohrenweiser HW, Gershowitz H, Azo-feifa J, Arias TD, Neel JV. 1990. Microevolution in lower CentralAmerica: genetic characterization of the Chibcha-speaking groupsof Costa Rica and Panama, and a consensus taxonomy based ongenetic and linguistic affinity. Am J Hum Genet 46:63–84.
Batista O, Kolman CJ, Bermingham E. 1995. MitochondrialDNA diversity in the Kuna Amerinds of Panama. Hum MolGenet 4:921–929.
Bert F, Corella A, Gene M, Perez-Perez A, Turbon D. 2001.Major mitochondrial DNA haplotype heterogeneity in high-land and lowland Amerindian populations from Bolivia. HumBiol 73:1–16.
Bianchi N, Bailliet G, Bravi C. 1995. Peopling of the Americasas inferred through the analysis of mitochondrial DNA. BrazJ Genet 18:661–668.
Bieber H, Bieber SW, Rodewald A, Barrantes R. 1996. Microevo-lution and genetic affinities among six Amerindian tribes oflower Central America: comparative genetic study of serumproteins. Hum Biol 68:929–953.
Boles TC, Snow CC, Stover E. 1995. Forensic DNA Testing onskeletal remains from Mass Graves: a pilot project in Guate-mala. J Forensic Sci 40:349–355.
Bolnick DA, Smith DG. 2003. Unexpected patterns of mitochon-drial DNA variation among Native Americans from the south-eastern United States. Am J Phys Anthropol 122:336–354.
Bonatto SL, Salzano FM. 1997. A single and early migration forthe peopling of the Americas supported by mitochondrialDNA sequence data. Proc Natl Acad Sci USA 94:1866–18671.
Brandstatter A, Sanger T, Lutz-Bonengel S, Parson W, Beraud-Colomb E, Wen B, Kong QP, Bravi CM, Bandelt HJ. 2005.Phantom mutation hotspots in human mitochondrial DNA.Electrophoresis 26:3414–3429.
Bray W. 1984. Across the darien gap: a colombian view ofisthmian archaeology. In: Lange F, Stone D, editors. Archaeol-ogy of lower Central America. Alburquerque: University ofNew Mexico. p 304–340.
Bray W. 2000. Archaeology. Ancient food for thought. Nature408:145–146.
Bray W. 2003. Gold, stone, and ideology, symbols of power inthe tairona tradition of northern Colombia. In: Quilter J,Hoopes J, editors. Gold and power in ancient Costa Rica,Panama, and Colombia. Washington D.C.: Dumbarton OaksResearch Library and Collections.
Briceno I, Bernal J, Duran S, Ortega J, Umana A, Gomez A,Papiha S. 1996a. HLA antigens in Amerindian groups of twodifferent linguistic families from Colombia. Eur J Immunoge-net 23:21–28.
Briceno I, Gomez A, Bernal J. 1996b. HLA-DPB1 polymorphismin seven south American Indian tribes in Colombia. Eur JImmunogenet 23:235–240.
Briceno I, Gomez A, Lozano PAU, Mitchell RJ, Papiha S. 2003.Mitochondrial variation in Colombia: study of matrilineallineages among amerindian tribes. XIX International Con-gress of Genetics Proceedings, Melbourne.
Constenla-Umana A. 1991. Las lenguas del Area intermedia:introduccion a su estudio areal. San Jose, Costa Rica: Edito-rial de la Universidad de Costa Rica.
Cooke R. 2005. Prehistory of Native Americans on the CentralAmerican Land Bridge: colonization, dispersal, and diver-gence. J Archaeological Res 13:129–187.
Cooke R, and Ranere AJ. 1992. The origin of wealth and hierar-chy in the central region of Panama (12,000–2,000 YBP), withobservations on its relevance to the history and phlyogney ofChibchan-speaking polities in Panama and elsewhere. In:Lange F, editor. Wealth and hierarchy in the intermediatearea. Washington D.C.: Dumbarton Oaks. p 243–315.
Demarchi DA, Panzetta-Dutari GM, Motran CC, de BasualdoMDL, Marcellino AJ. 2001. Mitochondrial DNA haplogroupsin Amerindian populations from the Gran Chaco. Am J PhysAnthropol 115:199–203.
Dillehay TD. 2000. The settlement of the Americas: a new pre-history. New York: Basic Books.
Dipierri JE, Alfaro E, Martinez-Marignac VL, Bailliet G, BraviCM, Cejas S, Bianchi NO. 1998. Paternal directional mating
in two Amerindian subpopulations located at differentaltitudes in northwestern Argentina. Hum Biol 70:1001–1010.
Dixon EJ. 1999. Bones, boats and bison: archeology and the firstcolonization of western North America. Albuquerque: Univer-sity of New Mexico Press.
Dornelles CL, Bonatto SL, De Freitas LB, Salzano FM. 2005. Ishaplogroup X present in extant South American Indians? AmJ Phys Anthropol 127:439–448.
Excoffier L. 2004. Patterns of DNA sequence diversity andgenetic structure after a range expansion: lessons from theinfinite-island model. Mol Ecol 13:853–864.
Excoffier L, Laval G, Schneider S. 2005. Arlequin ver. 3.0: Anintegrated software package for population genetics dataanalysis. Evolutionary Bioinformatics Online 1.
Fix AG. 2005. Rapid deployment of the five founding AmerindmtDNA haplogroups via coastal and riverine colonization. AmJ Phys Anthropol 128:430–436.
Forster P. 2003. To err is human. Ann Hum Genet 67:2–4.Forster P, Harding R, Torroni A, Bandelt HJ. 1996. Origin and
evolution of Native American mtDNA variation: a reappraisal.Am J Hum Genet 59:935–945.
Fox C. 1996. Mitochondrial DNA Haplogroups in four Tribesfrom Tierra del Fuego-Patagonia: inferences about the peo-pling of the Americas. Hum Biol 68:855–871.
Fu YX. 1997. Statistical tests of neutrality of mutations againstpopulation growth, hitchhiking and background selection.Genetics 147:915–925.
Fuselli S, Tarazona-Santos E, Dupanloup I, Soto A, Luiselli D,Pettener D. 2003. Mitochondrial DNA diversity in SouthAmerica and the genetic history of Andean highlanders. MolBiol Evol 20:1682–1691.
Ginther C, Corach D, Penacino G, Rey J, Carnese F, Hutz M,Anderson A, Just J, Salzano FM, King M. 1993. Genetic varia-tion among the Mapuche Indians from the Patogonian regionof Argentina: Mitochondrial DNA sequence variation and allelefrequencies of several nuclear genes. In: Pena S, ChakrabortyR, Epplen J, Jeffreys A, editors. DNA fingerprinting: state ofthe science. Basel: Birkhauser-Verlag. p 211–219.
Gonzalez-Oliver A, Marquez-Morfin L, Jimenez JC, Torre-Blanco A. 2001. Founding Amerindian mitochondrial DNAlineages in ancient Maya from Xcaret, Quintana Roo. Am JPhys Anthropol 116:230–235.
Greenberg JH. 1987. Language in the Americas. Stanford,California: Stanford University Press.
Guarino F, Federle L, van Oorschot R, Briceno I, Bernal J,Papiha S, Schanfield M, Mitchell R. 1999. Genetic diversityamong five native American tribes of Colombia. In: Papiha S,Deka R, Chakraborty R, editors. Genomic diversity: ap-plication in human population genetics. New York: KluwerAcademic. p 33–51.
Hall T. 1999. BioEdit: a user-friendly biological sequence align-ment editor and analysis program for Windows 95/98/NT.Nucl Acids Symp Ser 41:95–98.
Harpending H, Sherry ST, Rogers A, Stoneking M. 1993. TheGenetic structure of ancient human populations. Curr Anthro-pol 34:483–496.
Harpending HC. 1994. Signature of ancient population growthin a low-resolution mitochondrial DNA mismatch distribution.Hum Biol 66:591–600.
Ho SY, Larson G. 2006. Molecular clocks: when times area-changin’. Trends Genet 22:79–83.
Ho SY, Phillips MJ, Cooper A, Drummond AJ. 2005. Timedependency of molecular rate estimates and systematic over-estimation of recent divergence times. Mol Biol Evol 22:1561–1568.
Hoopes J. 2005. The emergence of social complexity in thechibchan world of southern Central America and northernColombia, AD 300-600. J World Prehistory 13:1–32.
Hoopes J, Fonseca O. 2003. Goldwork and chibchan identity:endogenous change and diffuse unity in the Isthmo-Colom-bian Area. In: Quilter J, Hoopes J, editors. Gold and power inancient Costa Rica, Panama, and Colombia. Washington DC:Dumbarton Oaks. p 49–89.
768 P.E. MELTON ET AL.
American Journal of Physical Anthropology—DOI 10.1002/ajpa

Horai S, Kondo R, Nakagawa-Hattori Y, Hayashi S, Sonoda S,Tajima K. 1993. Peopling of the Americas, founded by fourmajor lineages of mitochondrial DNA. Mol Biol Evol 10:23–47.
Hudson R. 1990. Gene genealogies and the coalescent process.Oxf Surv Evol Biol 9:1–44.
Keyeux G, Rodas C, Gelvez N, Carter D. 2002. Possible migra-tion routes into South America deduced from mitochondrialDNA studies in Colombian Amerindian populations. HumBiol 74:211–233.
Kivisild T, Tolk HV, Parik J, Wang Y, Papiha SS, Bandelt HJ,Villems R. 2002. The emerging limbs and twigs of the EastAsian mtDNA tree. Mol Biol Evol 19:1737–1751.
Kolman CJ, Bermingham E. 1997. Mitochondrial and nuclearDNA diversity in the Choco and Chibcha Amerinds ofPanama. Genetics 147:1289–1302.
Kolman CJ, Bermingham E, Cooke R, Ward RH, Arias TDGuionneau-Sinclair F. 1995. Reduced mtDNA diversity in theNgobe Amerinds of Panama. Genetics 140:275–283.
Kruskal J. 1964. Multidimensional scaling by optimizinggoodness of fit to a nonmetric hypothesis. Psychometrika 29:1–27.
Lalueza-Fox C, Calderon FL, Calafell F, Morera B, BertranpetitJ. 2001. MtDNA from extinct Tainos and the peopling of theCaribbean. Ann Hum Genet 65:137–151.
Lalueza-Fox C, Gilbert MT, Martinez-Fuentes AJ, Calafell F,Bertranpetit J. 2003. Mitochondrial DNA from pre-ColumbianCiboneys from Cuba and the prehistoric colonization of theCaribbean. Am J Phys Anthropol 121:97–108.
Lalueza C, Perez-Perez A, Prats E, Cornudella L, Turbon D.1997. Lack of founding Amerindian mitochondrial DNA line-ages in extinct aborigines from Tierra del Fuego-Patagonia.Hum Mol Genet 6:41–46.
Lange F, Stone D. 1984. The Archeaology of Lower CentralAmerica. Albuqueque: University of New Mexico Press.
Langebaek C. 2003. Poblamiento Prehispanico de las Bahıas deSanta Marta: Contribucion al estudio de los CaciciazgosTairona del Norte de Colombia. Bogota, Colombia: Universi-dad de los Andes.
Lavallee D. 2000. The first South Americans: the peopling of acontinent from the earliest evidence to high culture. SaltLake City: University of Utah Press.
Lewis CM Jr, Tito RY, Lizarraga B Stone AC. 2005. Land,language, and loci: mtDNA in Native Americans and thegenetic history of Peru. Am J Phys Anthropol 127:351–360.
Lobato-da-Silva DF, Riberio-dos-Santos AKC, Santos SEB. 2001.Diversidade genetica de populacoes humanas na Amazonia.In: Guimaraes Vieira IC, Cardoso da Silva JM, Oren DC,D’Ineao MA, editors. Diversidade humana e cultural na Ama-zonia. Belem: Museu Paraense Emilio Goeldi, p 167–193.
Lynch TF. 1983. The Paleo-Indians. In: Jennings JD, editor. An-cient South Americans. South America: Freeman. p 87–137.
Malhi RS, Eshleman JA, Greenberg JA, Weiss DA, SchultzShook BA, Kaestle FA, Lorenz JG, Kemp BM, Johnson JR,Smith DG. 2002. The structure of diversity within New Worldmitochondrial DNA haplogroups: implications for the prehis-tory of North America. Am J Hum Genet 70:905–919.
Melton PE. 2005. Molecular perspectives on the origins ofChibchan populations from the Sierra Nevada de SantaMarta, Colombia. M.A. thesis, University of Kansas, Anthro-pology, 2005.
Melton PE, Papihia SS, Briceno I, Bernal J, Crawford MH.2004. mtDNA variation in Chibchan speaking groups from Si-erra Nevada de Marta, northwest Colombia. Am J Hum Biol16:214.
Melton PE, Papihia SS, Briceno I, Bernal J, Devor R, CrawfordMH. 2005. Molecular perspectives on the origins of Chibchanspeaking populations from the Sierra Nevada de Santa Marta,Colombia. Am J Phys Anthropol 40:151.
Merriwether DA, Kemp BM, Crews DE, Neel JV. 2000. Geneflow and genetic variation in the Yanomama as revealed bymitochondrial DNA. In: Renfrew C, editor. America Past,America present: genes and languages in the Americas andbeyond. Cambridge, UK: McDonald Institute for Archaeologi-cal Research. p 89–124.
Merriwether DA, Reed DM, Ferrell RE. 1997. Ancient and con-temporary mitochondrial DNA variation in the Maya. In:Whitington SL, Reed DM, editors. Bones of the Maya: studiesof ancient skeletons. Washington D.C.: Smithsonian Institute.p 208–217.
Merriwether DA, Rothhammer F, Ferrell RE. 1995. Distributionof the four founding lineage haplotypes in Native Americanssuggests a single wave of migration for the New World. Am JPhys Anthropol 98:411–430.
Mesa NR, Mondragon MC, Soto ID, Parra MV, Duque C,Ortiz-Barrientos D, Garcia LF, Velez ID, Bravo ML, MuneraJG, Bedoya G, Bortolini MC, Ruiz-Linares A. 2000. Autoso-mal, mtDNA, and Y-chromosome diversity in Amerinds: pre-and post-Columbian patterns of gene flow in South America.Am J Hum Genet 67:1277–1286.
Meyer S, Weiss G, von Haeseler A. 1999. Pattern of nucleotidesubstitution and rate heterogeneity in the hypervariableregions I and II of human mtDNA. Genetics 152:1103–1110.
Moraga ML, Rocco P, Miquel JF, Nervi F, Llop E, ChakrabortyR, Rothhammer F, Carvallo P. 2000. Mitochondrial DNA poly-morphisms in Chilean aboriginal populations: implications forthe peopling of the southern cone of the continent. Am J PhysAnthropol 113:19–29.
Nei M. 1987. Molecular evolutionary genetics. New York:Columbia University Press.
O’Rourke DH, Hayes MG, Carlyle SW. 2000. Spatial and tempo-ral stability of mtDNA haplogroup frequencies in nativeNorth America. Hum Biol 72:15–34.
O’Rourke DH, Mobarry A, Suarez BK. 1992. Patterns of geneticvariation in Native America. Hum Biol 64:417–434.
Oyuela-Caycedo A. 1996. The study of collector variability inthe transistion fo sedentary food producers in northernColombia. J World Prehistory 10:49–93.
Pearson GA. 2002. Pan-continental Paleoindian expansions andinteractions as viewed from the earliest lithic industries oflower Central America. Ph.D. thesis, University of Kansas,Anthropology, 2002.
Pfeiffer H, Brinkmann B, Huhne J, Rolf B, Morris AA,Steighner R, Holland MM, Forster P. 1999. Expanding the for-ensic German mitochondrial DNA control region database:genetic diversity as a function of sample size and microgeog-raphy. Int J Legal Med 112:291–298.
Quilter J, Hoopes J. 2003. Gold and power in ancient CostaRica, Panama, and Colombia. Washington D.C.: DumbartonOaks.
Ramos-Onsins SE, Rozas J. 2002. Statistical properties of newneutrality tests against population growth. Mol Biol Evol19:2092–2100.
Ray N, Currat M, Excoffier L. 2003. Intra-deme moleculardiversity in spatially expanding populations. Mol Biol Evol20:76–86.
Reichel-Dolmatoff G. 1950. The Kogi: a tribe of the SierraNevada de Santa Marta Colombia. Bogota: El Instituto.
Rickards O, Martinez-Labarga C, Lum JK, De Stefano GF,Cann RL. 1999. mtDNA history of the Cayapa Amerinds ofEcuador: detection of additional founding lineages for theNative American populations. Am J Hum Genet 65:519–530.
Rogers AR. 1995. Genetic evidence for a Pleistocene populationexplosion. Evolution 49:608–615.
Rogers AR, Fraley AE, Bamshad MJ, Watkins WS, Jorde LB.1996. Mitochondrial mismatch analysis is insensitive to themutational process. Mol Biol Evol 13:895–902.
Rogers AR, Harpending H. 1992. Population growth makeswaves in the distribution of pairwise genetic differences. MolBiol Evol 9:552–569.
Rubicz R, Schurr TG, Babb PL, Crawford MH. 2003. Mitochon-drial DNA variation and the origins of the Aleuts. Hum Biol75:809–835.
Ruhlen M. 1998. A guide to the world’s languages. StanfordCalifornia: Stanford University.
Ruiz-Narvaez EA, Santos FR, Carvalho-Silva DR, Azofeifa J,Barrantes R, Pena SD. 2005. Genetic variation of the Y chro-mosome in Chibcha-speaking Amerindians of Costa Rica andPanama. Hum Biol 77:71–91.
769mtDNA GENETIC RELATIONSHIP OF CHIBCHAN SPEAKERS
American Journal of Physical Anthropology—DOI 10.1002/ajpa

Saillard J, Forster P, Lynnerup N, Bandelt HJ, Norby S. 2000.mtDNA variation among Greenland Eskimos: the edge of theBeringian expansion. Am J Hum Genet 67:718–726.
Salas A, Richards M, De la Fe T, Lareu MV, Sobrino B,Sanchez-Diz P, Macaulay V, Carracedo A. 2002. The makingof the African mtDNA landscape. Am J Hum Genet 71:1082–1111.
Saler B. 1992. The Guajiro working papers on South AmericanIndians. In: Borders and peripheries in lowland South Amer-ica. Bennington College, Bennington, VT. p. 37–40.
Santos M, Ward RH, Barrantes R. 1994. mtDNA variation inthe Chibcha Amerindian Huetar from Costa Rica. Hum Biol66:963–977.
Schmitt R, Bonatto SL, Freitas LB, Muschner VC, Hill K,Hurtado AM, Salzano FM. 2004. Extremely limited mitochon-drial DNA variability among the Ache Natives of Paraguay.Ann Hum Biol 31:87–94.
Schneider S, Roessli D, Excoffier L. 2000. Arelquin ver 2.000: asoftware for population genetic data analysis. Geneva, Swit-zerland: Genetics and Biometry Laboratory, University ofGeneva.
Schurr TG. 2004. The Peopling of the New World: perspectivefrom Molecular Anthropology. Annu Rev Anthropol 33:551–583.
Schurr TG, Ballinger SW, Gan YY, Hodge JA, Merriwether DA,Lawrence DN, Knowler WC, Weiss KM, Wallace DC. 1990.Amerindian mitochondrial DNAs have rare Asian mutationsat high frequencies, suggesting they derived from four pri-mary maternal lineages. Am J Hum Genet 46:613–623.
Schurr TG, Sherry ST. 2004. Mitochondrial DNA and Y chromo-some diversity and the peopling of the Americas: evolutionaryand demographic evidence. Am J Hum Biol 16:420–439.
Sherry ST, Rogers AR, Harpending H, Soodyall H, Jenkins T,Stoneking M. 1994. Mismatch distributions of mtDNA revealrecent human population expansions. Hum Biol 66:761–775.
Sigurgardottir S, Helgason A, Gulcher JR, Stefansson K,Donnelly P. 2000. The mutation rate in the human mtDNAcontrol region. Am J Hum Genet 66:1599–1609.
Smith DG, Malhi RS, Eshleman J, Lorenz JG, Kaestle FA.1999. Distribution of mtDNA haplogroup X among NativeNorth Americans. Am J Phys Anthropol 110:271–284.
Stone AC, Stoneking M. 1998. mtDNA analysis of a prehistoricOneota population: implications for the peopling of the NewWorld. Am J Hum Genet 62:1153–1170.
Tajima F. 1989. Statistical method for testing the neutral muta-tion hypothesis by DNA polymorphism. Genetics 123:585–595.
Tamura K, Nei M. 1993. Estimation of the number of nucleotidesubstitutions in the control region of mitochondrial DNA inhumans and chimpanzees. Mol Biol Evol 10:512–526.
Tarazona-Santos E, Carvalho-Silva DR, Pettener D, Luiselli D,De Stefano GF, Labarga CM, Rickards O, Tyler-Smith C,Pena SD, Santos FR. 2001. Genetic differentiation in SouthAmerindians is related to environmental and cultural diver-
sity: evidence from the Y chromosome. Am J Hum Genet68:1485–1496.
Torres MM, Bravi CM, Bortolini MC, Duque C, Callegari-Jac-ques S, Ortiz D, Bedoya G, Groot de Restrepo H, Ruiz-LinaresA. 2006. A revertant of the major founder Native Americanhaplogroup C common in populations from northern SouthAmerica. Am J Hum Biol 18:59–65.
Torroni A, Chen YS, Semino O, Santachiara-Beneceretti AS,Scott CR, Lott MT, Winter M, Wallace DC. 1994a. mtDNAand Y-chromosome polymorphisms in four Native Americanpopulations from southern Mexico. Am J Hum Genet 54:303–318.
Torroni A, Neel JV, Barrantes R, Schurr TG, Wallace DC.1994b. Mitochondrial DNA \clock" for the Amerinds and itsimplications for timing their entry into North America. ProcNatl Acad Sci USA 91:1158–1162.
Torroni A, Schurr TG, Cabell MF, Brown MD, Neel JV, LarsenM, Smith DG, Vullo CM, Wallace DC. 1993. Asian affinitiesand continental radiation of the four founding Native Ameri-can mtDNAs. Am J Hum Genet 53:563–590.
Uribe C. 2000. La Ethnografia de las Sierra Nevada de SantaMarta y las Tierras Bajas, Adyacentes: Geografia humana deColombia nordeste indıgena (Tomo II). Bogota: Bank of theRepublic.
Wallace DC, Garrison K, Knowler WC. 1985. Dramatic foundereffects in Amerindian mitochondrial DNAs. Am J PhysAnthropol 68:149–155.
Ward RH, Frazier BL, Dew-Jager K, Paabo S. 1991. Extensivemitochondrial diversity within a single Amerindian tribe.Proc Natl Acad Sci USA 88:8720–8724.
Ward RH, Redd A, Valencia D, Frazier B, Paabo S. 1993.Genetic and linguistic differentiation in the Americas. ProcNatl Acad Sci USA 90:10663–10667.
Ward RH, Salzano FM, Bonatto SL, Hutz MH, Coimbra CEA,Santos RV. 1996. Mitochondrial DNA polymorphism in threeBrazilian Indian tribes. Am J Hum Biol 8:317–323.
Williams SR, Chagnon NA, Spielman RS. 2002. Nuclear andmitochondrial genetic variation in the Yanomamo: a test casefor ancient DNA studies of prehistoric populations. Am JPhys Anthropol 117:246–259.
Wilson DJ. 1999. Indigenous South Americans of the past andpresent: an ecological perspective. Boulder, Colo: Westview.
Yunis JJ, Ossa H, Salazar M, Delgado MB, Deulofeut R, de laHoz A, Bing DH, Ramos O, Yunis EJ, Yunis EJ. 1994. Majorhistocompatibility complex class II alleles and haplotypes andblood groups of four Amerindian tribes of northern Colombia.Hum Immunol 41:248–258.
Zlojutro M, Rubicz R, Devor EJ, Spitsyn VA, Makarov SV,Wilson K Crawford MH. 2006. Genetic structure of the Aleutsand Circumpolar populations based on mitochondrial DNAsequences: A synthesis. Am J Phys Anthropol 129:446–464.
770 P.E. MELTON ET AL.
American Journal of Physical Anthropology—DOI 10.1002/ajpa
Copyright © 2022 FDOKUMEN