Niger-Congo speaking populations and the formation of the Brazilian gene pool: mtDNA and...
14
Niger-Congo Speaking Populations and the Formation of the Brazilian Gene Pool: mtDNA and Y-Chromosome Data Ta ´ bita Hu ¨ nemeier, 1 Cla ´ udia Carvalho, 2 Andrea Rita Marrero, 1 Francisco Mauro Salzano, 1 Se ´ rgio Danilo Junho Pena, 2 and Maria Ca ´ tira Bortolini 1 * 1 Departamento de Gene ´tica, Instituto de Biocie ˆncias, Universidade Federal do Rio Grande do Sul, 91501-970 Porto Alegre, RS, Brazil 2 Departamento de Bioquı´mica e Imunologia, Universidade Federal de Minas Gerais, 31270-901 Belo Horizonte, MG, Brazil KEY WORDS uniparental genetic markers; migrant origins; gender-specific dispersal African diaspora ABSTRACT We analyzed sequence variation in the mitochondrial DNA (mtDNA) hypervariable segment I (HVS-I) from 201 Black individuals from two Brazilian cities (Rio de Janeiro and Porto Alegre), and compared these data with published information from 21 African populations. A subset of 187 males of the sample was also characterized for 30 Y-chromosome biallelic poly- morphisms, and the data were compared with those from 48 African populations. The mtDNA data indicated that respectively 69% and 82% of the matrilineages found in Rio de Janeiro and Porto Alegre originated from West-Central/Southeast Africa. These estimates are in close agreement with historical records which indi- cated that most of the Brazilian slaves who arrived in Rio de Janeiro were from West-Central Africa. In con- trast to mtDNA, Y-chromosome haplogroup analysis did not allow discrimination between places of origin in West or West-Central Africa. Thus, when comparing these two major African regions, there seems to be higher genetic structure with mtDNA than with Y-chro- mosome data. Am J Phys Anthropol 133:000–000, 2007. V V C 2007 Wiley-Liss, Inc. The massive forced African migration to the Americas that occurred from the 15th to the 19th centuries (involving not less than about 10 million persons) included Brazil in a fraction estimated as 40% (Klein, 2002). Most of these individuals were men, since it was supposed that they would be more able to support the hard work in the farms and mineral mines (Bergmann, 1977; Conrad, 1985). Additionally, the slave trade to the Middle East preferentially involved sub-Saharan women, and this resulted in a relatively reduced number of available slave women plus an increased price for them (Klein, 2002). According to historical data (Klein, 2002), the Africans who were brought to Brazil as slaves originated mainly from two major geographical regions: (a) West-Central/ Southeast Africa, that included basically areas repre- sented by two former Portuguese colonies (Angola and Mozambique) and the Congo; and (b) West Africa, that covers all region at the northern of the Gulf of Guinea. Historical references are vague and normally cite that ‘‘gentile’’ from Guinea and Coast of Mina were brought to Brazil. Both terms were frequently used to refer to all region of slave traffic in West Africa (Bergmann, 1977; Klein, 2002). These two major areas have large dimensions and are populated by very distinct peoples and cultures. Most of them, however, are inhabited by speakers of lan- guages belonging to the Niger-Congo linguistic subphylum (Greenberg, 1963; Ruhlen, 1987; Fig. 1). The Niger-Congo subphylum comprises the large Bantu branch, which includes about *500 languages spoken in virtually all Central-South Africa, except for the area occupied by the Khoisan-speaking groups (Cavalli-Sforza et al., 1994). The place of origin of the Bantu languages has been identified as most likely being between Cameroon and Nigeria (Newman, 1995). From there the Bantu expanded at the end of the Neolithic throughout sub- Saharan Africa (Murdock, 1959; Curtin et al., 1991; Phil- lipson, 1993; Cavalli-Sforza et al., 1994; Diamond and Bellwood, 2003; Plaza et al., 2004; Zhivotovsky et al., 2004; Rexova ´ et al., 2006). In contrast, in the West Afri- can branch of the Niger-Congo subphylum, the native inhabitants speak several non-Bantu languages (Green- berg, 1963; Ruhlen, 1987; Cavali-Sforza et al., 1994). Genetic studies have demonstrated that Niger-Congo speaking populations are more related to each other than to other Africans. These same investigations have also shown that Bantu speaking groups show a higher level of genetic homogeneity than do the non-Bantu pop- ulations (Cavalli-Sforza et al., 1994; Poloni et al., 1997; Grant sponsors: Instituto do Mile ˆnio; Programa de Apoio a Nu ´ cleos de Excele ˆncia; Conselho Nacional de Desenvolvimento Cien- tı ´fico e Tecnolo ´gico; Fundac ¸a ˜o de Amparo a ` Pesquisa do Estado do Rio Grande do Sul. *Correspondence to: Maria Ca ´tira Bortolini, Departamento de Gene ´tica, Instituto de Biocie ˆncias, Universidade Federal do Rio Grande do Sul, Caixa Postal 15053, 91501-970 Porto Alegre, RS, Brazil. E-mail: [email protected] Received 6 June 2006; accepted 29 January 2007 DOI 10.1002/ajpa.20604 Published online in Wiley InterScience (www.interscience.wiley.com). V V C 2007 WILEY-LISS, INC. AMERICAN JOURNAL OF PHYSICAL ANTHROPOLOGY 133:000–000 (2007)
-
Upload
independent -
Category
Documents
-
view
0 -
download
0
Transcript of Niger-Congo speaking populations and the formation of the Brazilian gene pool: mtDNA and...

Niger-Congo Speaking Populations and theFormation of the Brazilian Gene Pool:mtDNA and Y-Chromosome Data
Tabita Hunemeier,1 Claudia Carvalho,2 Andrea Rita Marrero,1 Francisco Mauro Salzano,1
Sergio Danilo Junho Pena,2 and Maria Catira Bortolini1*
1Departamento de Genetica, Instituto de Biociencias, Universidade Federal do Rio Grande do Sul,91501-970 Porto Alegre, RS, Brazil2Departamento de Bioquımica e Imunologia, Universidade Federal de Minas Gerais,31270-901 Belo Horizonte, MG, Brazil
KEY WORDS uniparental genetic markers; migrant origins; gender-specific dispersalAfrican diaspora
ABSTRACT We analyzed sequence variation in themitochondrial DNA (mtDNA) hypervariable segment I(HVS-I) from 201 Black individuals from two Braziliancities (Rio de Janeiro and Porto Alegre), and comparedthese data with published information from 21 Africanpopulations. A subset of 187 males of the sample wasalso characterized for 30 Y-chromosome biallelic poly-morphisms, and the data were compared with thosefrom 48 African populations. The mtDNA data indicatedthat respectively 69% and 82% of the matrilineagesfound in Rio de Janeiro and Porto Alegre originated
from West-Central/Southeast Africa. These estimates arein close agreement with historical records which indi-cated that most of the Brazilian slaves who arrived inRio de Janeiro were from West-Central Africa. In con-trast to mtDNA, Y-chromosome haplogroup analysis didnot allow discrimination between places of origin inWest or West-Central Africa. Thus, when comparingthese two major African regions, there seems to behigher genetic structure with mtDNA than with Y-chro-mosome data. Am J Phys Anthropol 133:000–000,2007. VVC 2007 Wiley-Liss, Inc.
The massive forced African migration to the Americasthat occurred from the 15th to the 19th centuries(involving not less than about 10 million persons)included Brazil in a fraction estimated as 40% (Klein,2002). Most of these individuals were men, since it wassupposed that they would be more able to support thehard work in the farms and mineral mines (Bergmann,1977; Conrad, 1985). Additionally, the slave trade to theMiddle East preferentially involved sub-Saharan women,and this resulted in a relatively reduced number ofavailable slave women plus an increased price for them(Klein, 2002).According to historical data (Klein, 2002), the Africans
who were brought to Brazil as slaves originated mainlyfrom two major geographical regions: (a) West-Central/Southeast Africa, that included basically areas repre-sented by two former Portuguese colonies (Angola andMozambique) and the Congo; and (b) West Africa, thatcovers all region at the northern of the Gulf of Guinea.Historical references are vague and normally cite that‘‘gentile’’ from Guinea and Coast of Mina were brought toBrazil. Both terms were frequently used to refer to allregion of slave traffic in West Africa (Bergmann, 1977;Klein, 2002). These two major areas have large dimensionsand are populated by very distinct peoples and cultures.Most of them, however, are inhabited by speakers of lan-guages belonging to the Niger-Congo linguistic subphylum(Greenberg, 1963; Ruhlen, 1987; Fig. 1). The Niger-Congosubphylum comprises the large Bantu branch, whichincludes about *500 languages spoken in virtually allCentral-South Africa, except for the area occupied by theKhoisan-speaking groups (Cavalli-Sforza et al., 1994).
The place of origin of the Bantu languages has beenidentified as most likely being between Cameroon andNigeria (Newman, 1995). From there the Bantuexpanded at the end of the Neolithic throughout sub-Saharan Africa (Murdock, 1959; Curtin et al., 1991; Phil-lipson, 1993; Cavalli-Sforza et al., 1994; Diamond andBellwood, 2003; Plaza et al., 2004; Zhivotovsky et al.,2004; Rexova et al., 2006). In contrast, in the West Afri-can branch of the Niger-Congo subphylum, the nativeinhabitants speak several non-Bantu languages (Green-berg, 1963; Ruhlen, 1987; Cavali-Sforza et al., 1994).Genetic studies have demonstrated that Niger-Congospeaking populations are more related to each otherthan to other Africans. These same investigations havealso shown that Bantu speaking groups show a higherlevel of genetic homogeneity than do the non-Bantu pop-ulations (Cavalli-Sforza et al., 1994; Poloni et al., 1997;
Grant sponsors: Instituto do Milenio; Programa de Apoio aNucleos de Excelencia; Conselho Nacional de Desenvolvimento Cien-tıfico e Tecnologico; Fundacao de Amparo a Pesquisa do Estado doRio Grande do Sul.
*Correspondence to: Maria Catira Bortolini, Departamento deGenetica, Instituto de Biociencias, Universidade Federal do RioGrande do Sul, Caixa Postal 15053, 91501-970 Porto Alegre, RS,Brazil. E-mail: [email protected]
Received 6 June 2006; accepted 29 January 2007
DOI 10.1002/ajpa.20604Published online in Wiley InterScience (www.interscience.wiley.com).
VVC 2007 WILEY-LISS, INC.
AMERICAN JOURNAL OF PHYSICAL ANTHROPOLOGY 133:000–000 (2007)

Cruciani et al., 2002; Salas et al., 2002, 2005; Wood et al.,2005).Because historical records on slavery contain many
gaps, genetic studies with South Americans of Africandescent have been used to trace the ancestry of Niger-Congo speakers back into Africa. Salzano and Bortolini(2002) showed that 61%, 34%, and 3% of the HbbS haplo-types found in Brazil as a whole are of the types namedBantu (or Central African Republic-CAR), Benin, andSenegal, respectively. These results are in good agree-ment with the historical sources which indicate that*68% and *32% of the African slaves were broughtfrom West-Central/Southeast and West Africa, respec-tively (Klein, 2002).
Recently, lineage markers [mitochondrial DNA (mtDNA)and the nonrecombining portion of the Y-chromosome]have been used to try to unravel the history of humanpopulations, since they are uniparentally transmitted,and escape recombination. These markers allow thereconstruction of unequivocal haplotype phylogenies,which can be related to geographic distributions, in anapproach known as phylogeography (Avise, 2000).Alves-Silva et al. (2000) reported an initial landscape
about the phylogeography of the African mtDNA hap-logroups in Brazil as a whole. Haplogroups L3e and L1ctogether constituted approximately 49% of the Africanfraction of mtDNAs analyzed by these authors. Theseresults suggested that the majority of the mtDNA line-
Fig. 1. Map of Africa. The dotted line approximately delimits the northern border of the area occupied by Niger-Congo speakersaccording to Greenberg (1963) and Ruhlen (1987). Within this large region, of course, languages from other families are also spoken.The regions/countries considered in the present analysis are identified by different shading.
2 T. HUNEMEIER ET AL.
American Journal of Physical Anthropology—DOI 10.1002/ajpa

ages of African ancestry in their Brazilian sample wouldhave an origin in West-Central Africa, with a minor con-tribution from the Southeast, although a substantialnumber could also have come from West Africa throughnon-Bantu speaking carriers.Salas et al. (2004) estimated for the first time the
quantitative contribution of the different African regionsto the formation of the New World mtDNA gene pool.According to their estimate, 65% of the types found inSouth America would have a West-Central African ori-gin, its complementary value indicating a West Africancontribution. These numbers are particularly differentfrom those obtained for Central America (41% West-Cen-tral, 59% West), and North America (28% West-Central,72% West), in agreement with the historical data ofthese regions (Curtin, 1969;Thomas, 1998). Using thesame kind of approach but substantially more data,Salas et al. (2005) estimated that >55% of the U.S.mtDNA lineages have a West African ancestry, with<41% coming from West-Central or Southwestern Africa,results which are close to the historical record (McMillin,2004).However, the most recent investigation of mtDNA-
HVS-I variation in Brazilian populations has yieldeddiscrepancies between the patterns obtained with themtDNA haplogroup distributions and the historical sour-ces (Silva et al., 2006). These findings raised the sugges-tion of a possible geographical gender-specific difference,with a proportionally larger number of West-Africanmen than that of women compulsorily migrating to Bra-zil (Silva et al., 2006). The authors mentioned that onlyresearch with Y-chromosome markers could provide amore complete picture about this and other questionsrelated to the Atlantic slave trade to Brazil.Several studies of Y-chomosome phylogeographical
landscape in Africa are now available (Cruciani et al.,2004, Luis et al., 2004, Beleza et al., 2005, Wood et al.,2005), but up to now no investigation has evaluated thesame set of markers in males from the three Americas.Here we provided information about the distribution of
the mtDNA and Y-chromosome haplogroups in two Bra-zilian Black populations, and compared these resultswith those published for populations of several Africanregions. Two major questions were asked: (a) Do the pro-portion of African ancestry differs when maternal andpaternal inheritance is considered? and (b) Can thesetwo sets of data furnish information about possibleregions of origin of the African slaves who arrived inBrazil?
SUBJECTS AND METHODS
Populations
After appropriate informed consent, samples of 201individuals classified as Black according to their physicalappearance and originating from two Brazilian cities,Rio de Janeiro (N ¼ 94), the capital of Rio de Janeirostate, and Porto Alegre (N ¼ 107) the capital of RioGrande do Sul, the southernmost state of Brazil werestudied. Rio de Janeiro, plus the northeastern cities ofSalvador (state of Bahia) and Recife (state of Pernam-buco) were the most important ports of arrival of slavesin Brazil. From these centers these persons would be dis-tributed to the other provinces. For example, accordingto historical data, 88% of the Rio Grande do Sul slavepopulation was brought from Rio de Janeiro, with thecomplementary number of slaves being brought from
other Brazilian provinces and Uruguay, not directly fromAfrica (Maestri-Filho, 1993; Berute, 2006).
mtDNA
The nucleotide sequence of the first hypervariable seg-ment (HVS-I) of 201 individuals was amplified andsequenced according to conditions described in Marreroet al. (2005). Both strands of DNA were sequenced.The information provided by HVS-I was used to clas-
sify the lineages into haplogroups according to Salaset al. (2002, 2004), with two exceptions: (a) HaplogroupL3g shares motifs, within HVS-I and HVS-II and at posi-tions 769 and 1018 with L4a. This information led Kivi-sild et al. (2004) to suggest that L3g is actually a sistercluster of L4a; therefore, they proposed to rename itL4g. (b) Haplogroup L1e has been recently redefined asL5a because it occupies an intermediate phylogeneticposition between L1 and L20L3 major haplogroups (Shenet al., 2004).Although the hierarchical relation between the human
mtDNA lineages is well known, the terminology to definethem remains confusing. Haplogroup, clade, subhaplo-group, and subclade are words frequently used as synon-ymous. In this paper, to facilitate reading and compre-hension, the term haplogroup will be used to define themajor lineages (L0, L1, L2, L3, L4, L5, etc.), as well astheir derivations (L2a, L3e, L2a1, L3e1, etc.).
Y-chromosome markers
The male fraction of our sample (N ¼ 187) was studiedfor thirty biallelic Y-chromosome polymorphisms (92R7,M9, M3, M19, M242, RPSY711, M17, M173, SRY2627,PN2, M2, M174, M145, M33, M35, M75, M58, M191,M149, M116.2, M10, M78, M154, M155, M281, M123,M81, M213, M60, V6) using hierarchical strategies plusRFLP and mini-sequencing methods as described in Bor-tolini et al. (2003) and developed by Carvalho and Pena(2005), respectively. These markers define the majorEuropean, Amerindian, and African haplogroups, butidentify especially well subtypes of the haplogroup E, themost common and widespread Y chromosome in Africa.The haplogroup nomenclature adopted is that pro-
posed by the last Y-chromosome Consortium release(Jobling and Tyler-Smith, 2003). Here also the term hap-logroup will be used to define the major lineages (E,etc.), as well as their derivations (E1, E2, E3, E3a, E3a7,etc.).
Data analyses
The mtDNA sequences were checked manually, vali-dated with the help of the CHROMAS LITE 2.0 program(www.technelsyum.com.au) and aligned with the revisedReference Sequence (rCRS; Andrews et al., 1999) usingthe BIOEDIT software (Hall, 1999). Since artifacts(‘‘phantom mutations’’) can be introduced during thesequencing and editing process, we applied the filteringprocedure described by Bandelt et al. (2002) and usedcriteria like those of Yao et al. (2004) to check for thequality of the sequences. After filtering a network ofsequences was constructed with the NETWORK 4.1.1.2program (www.fluxus-engineering.com) using the me-dian-joining algorithm. Weight networks showing perfectstar tree patterns are expected when the data are poten-tially free of phantom mutations. However, other criteriaas phylogenetic analysis in comparisons with closely
3Y-SNP AND mtDNA VARIATION IN BLACK BRAZILIANS
American Journal of Physical Anthropology—DOI 10.1002/ajpa
TA
BL
E1.
Ma
jor
sub-S
ah
ara
nA
fric
an
mtD
NA
ha
plo
gro
up
sa
nd
thei
rd
istr
ibu
tion
sin
two
Bra
zili
an
an
d21
Afr
ica
np
opu
lati
ons
Brazila
Africab
Niger-C
ongosp
eakers
Afro-Asiatic
spea
kers
Haplogroups
West-Cen
tral
Sou
thea
stWest
West
POA
RJ
12
34
56
78
910
1112
13
14
15
16
17
18
19
20
21
L0
0.022
L0a
0.006
0.125
0.033
0.018
L0a1
0.059
0.071
0.045
0.111
0.068
0.023
0.022
0.097
0.018
0.033
0.015
0.051
L0a2
0.048
0.068
0.111
0.029
0.111
0.177
L0d
0.038
L0d1
0.012
0.013
L0d2
0.003
L1b
0.047
0.095
0.045
0.020
0.006
0.026
0.067
0.048
0.027
0.027
0.075
0.100
0.046
0.017
L1b1
0.111
0.010
0.066
0.067
0.129
0.006
0.100
0.102
0.125
0.135
0.024
0.210
0.163
0.178
0.205
0.133
0.015
0.103
0.067
L1c
0.048
0.111
0.029
0.064
0.003
0.067
0.026
L1c1
0.070
0.048
0.045
0.028
0.111
0.098
0.067
0.111
0.019
0.125
0.033
0.048
0.018
0.068
0.046
0.043
L1c2
0.059
0.071
0.093
0.111
0.126
0.088
0.133
0.032
0.019
L1c3
0.047
0.023
0.028
0.010
0.013
L2
0.023
0.022
0.165
L2a-a1
0.024
0.045
0.020
0.006
0.200
0.051
0.033
0.027
0.054
0.018
0.033
L2a-a2
0.023
0.022
0.032
0.024
0.054
0.100
0.031
0.043
L2a-a3
0.010
0.052
0.027
0.037
0.068
0.077
0.043
L2a1a
0.047
0.059
0.068
0.091
0.100
0.026
0.125
0.033
0.024
0.067
L2a1b
0.129
0.018
L2a1-b1
0.120
0.117
0.023
0.222
0.010
0.066
0.044
0.031
0.051
0.100
0.024
0.158
0.108
0.036
0.111
0.033
0.077
0.008
L2a1-b2
0.012
0.012
0.045
0.023
0.111
0.064
0.010
0.067
0.048
0.052
0.081
0.018
0.033
0.046
0.051
0.067
L2a1-b3
0.023
0.068
0.010
0.013
0.102
0.125
0.033
0.071
0.027
0.009
0.018
0.034
0.196
L2b
0.070
0.024
0.045
0.028
0.010
0.023
0.022
0.032
0.013
0.071
0.081
0.018
0.033
0.015
L2b1
0.048
0.059
0.044
0.032
0.033
0.048
0.215
0.108
0.027
0.031
0.008
L2c
0.024
0.051
0.071
0.052
0.027
0.293
0.037
0.124
0.120
0.067
L2c1
0.027
0.062
0.017
L2c2
0.020
0.006
0.024
0.027
0.018
0.033
0.062
0.017
L2d1
0.194
0.010
0.048
0.026
0.067
L2d2
0.100
0.081
0.056
0.033
0.015
0.034
L3
0.012
0.012
0.132
0.180
0.193
0.013
0.037
L3b
0.023
0.036
0.023
0.039
0.023
0.022
0.064
0.025
0.100
0.051
0.250
0.165
0.054
0.027
0.094
0.100
0.124
0.094
0.067
L3b1
0.023
0.032
0.102
0.033
0.071
0.105
0.027
0.018
0.046
0.008
0.067
L3b2
0.023
0.032
0.009
0.067
L3d
0.012
0.024
0.023
0.010
0.025
0.200
0.102
0.133
0.024
0.054
0.045
0.056
0.033
0.046
0.068
0.067
L3d1
0.023
0.012
0.023
0.010
0.038
0.051
L3d2
0.048
0.010
0.024
0.052
0.036
0.018
0.100
0.015
0.043
L3d3
0.023
0.030
0.003
0.026
L3e1
0.059
0.024
0.068
0.083
0.049
0.088
0.089
0.028
0.033
0.031
L3e1
a0.059
0.012
0.045
0.039
0.038
L3e1
b0.012
0.028
0.039
0.028
L3e2
0.023
0.023
0.250
0.111
0.078
0.044
0.129
0.010
0.100
0.157
0.100
0.024
0.054
0.009
0.015
0.008
0.067
L3e2
b0.023
0.056
0.078
L3e3
0.047
0.071
0.068
0.028
0.020
0.066
0.022
0.038
0.067
0.052
0.009
0.067
L3e4
0.010
0.088
0.024
0.052
0.027
0.036
0.077
L3f
0.036
0.024
0.023
0.334
0.137
0.023
0.067
0.025
0.100
0.128
0.125
0.067
0.095
0.067
(con
tin
ued
)
4 T. HUNEMEIER ET AL.
American Journal of Physical Anthropology—DOI 10.1002/ajpa

related sequences from other databases must be observedto guarantee the quality of the data (Yao et al., 2004).Estimates of geographic parental contributions consid-
ering our mtDNA and Y-SNP data were calculated usingthe weighted least square method (Long, 1991) per-formed with the ADMIX program, kindly made availableby Dr. J.C. Long. The relationships among the popula-tions were examined using the DA distance and theneighbor-joining method (Nei et al., 1983; Saitou andNei, 1987; Nei and Roychoudhoury, 1993). The trees werevisualized using the TreeView program (Page, 1996), ver-sion1.6.6 (http://taxonomy.zoology.gla.ac.uk/rod/rod.html).Analyses of molecular variance (AMOVA), implemented inthe Arlequin program (Excoffier et al., 2005), version 3.01(http://cmpg.unibe.ch/software/arleqin3/), were performedto test the hypothesis of differentiation between popula-tional groups of particular interest observed in the phylo-genetic trees.
RESULTS
mtDNA
The networks obtained for the HVS-I weighty varia-tion showed perfect star trees. Associated with other cri-teria (see Subjects and methods), they indicate that ourHVS-I data sets are potentially free of artifacts (data notshown).About 90% and 79% of the mtDNA sequences found in
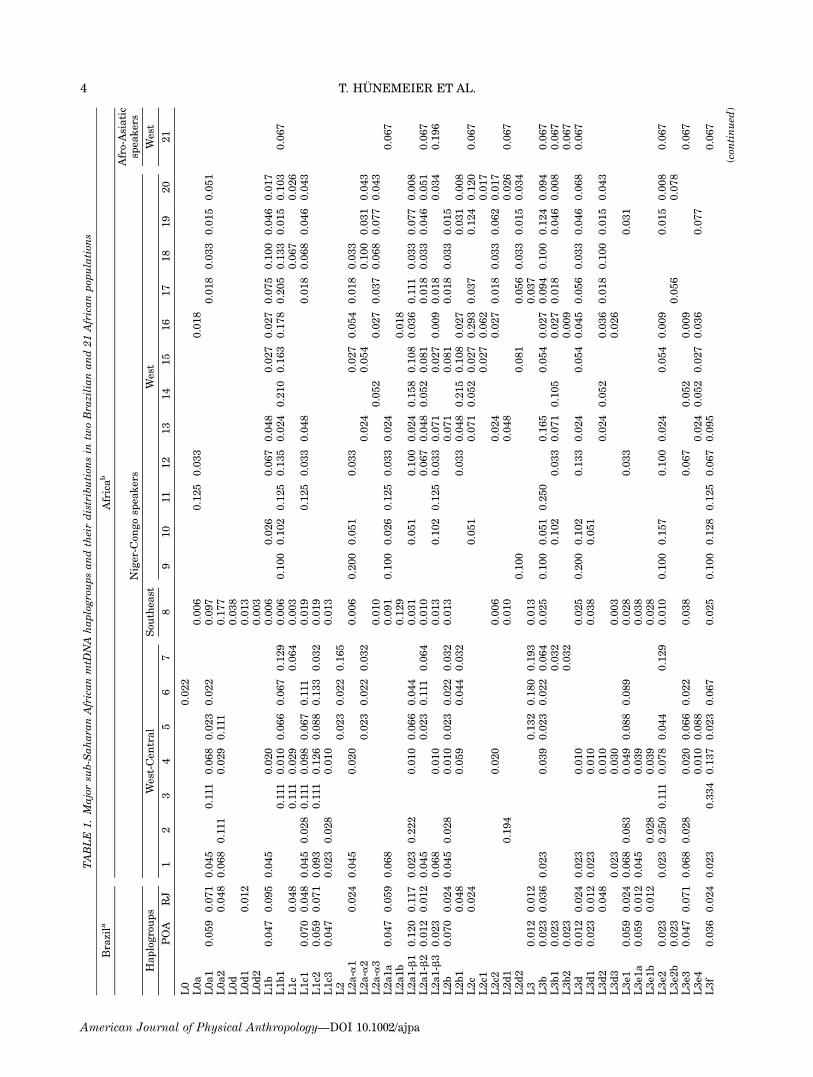
Blacks from Rio de Janeiro and Porto Alegre, respec-tively, are estimated as having an African origin, andthey are listed in Table A1 (Appendix). The remainingsequences were identified with haplogroups of European(2% and 6%, respectively) or Amerindian (8% and 15%)origin (data not shown). T1Table 1 presents the mtDNAhaplogroup distributions for the two Brazilian Blacksamples and for 21 African populations. About 70% ofthe haplogroups present in these African groups can alsobe seen in Brazil, while all haplogroups observed inthese two Brazilian Black samples can be found inAfrica. Table 1 also shows that there are similarities ofhaplogroup frequencies between the West and West-Cen-tral regions of Africa in comparison with other majorregions of the continent (Salas et al., 2005), probablyreflecting genetic similarity within the Niger-Congo lin-guistic subphylum. However, some haplogroups are pres-ent only in West-Central and/or Southeast Africa (L3e1a,L5a1, L0d, L0d1, L0d2), whereas others seem to beexclusive of West Africa (L2c1, L2d2, L3b1). Many hap-logroups show striking differences in their distributions.For example, the cumulative frequency of L1b1 in theWest (12.3%) is about 7 times higher than that found inWest-Central/Southeast Africa (1.7%). Ancient or morerecent (but not less complex) demographic events havebeen related to these particular mtDNA haplogroup dis-tributions across Africa (Salas et al., 2002).Of special interest is the presence of haplogroup L0d1
in Rio de Janeiro. This and other related haplogroups(L0d, L0d2) are characteristic of southern African Khoi-san-speaking groups, but are also present in Mozambi-que, probably due to admixture between Khoisan womenand Bantu Southeast men (Salas et al., 2002). Thesequence observed in Rio de Janeiro is the same as thatdescribed by Salas et al. (2002) in Mozambique, suggest-ing that the occurrence of L0d1 in Brazil is probably dueto the direct slave trade from this former African Portu-guese colony to Brazil.
TA
BL
E1.
(Con
tin
ued
)
Brazila
Africab
Niger-C
ongosp
eakers
Afro-Asiatic
spea
kers
Haplogroups
West-Cen
tral
Sou
thea
stWest
West
POA
RJ
12
34
56
78
910
1112
13
14
15
16
17
18
19
20
21
L3f1
0.047
0.024
0.010
0.056
0.046
0.060
L3g(L4g)
0.036
0.045
0.010
0.023
0.018
L5a1(L1e)
0.023
POA:Porto
Alegre,
N¼
85;RJ:Rio
deJaneiro,
N¼
84.
Thenumberscorrespon
dto
thefollow
ingAfrican
pop
ulation
s:1–
Angola,
N¼44,Plaza
etal.
(2004);
2–
Bubi,
N¼36(E
quatorialGuinea
)Mateu
etal.
(1997);
3–
Fang,
N¼9
(EquatorialGuinea
),Pinto
etal.(1996);
4–Cabinda,
N¼
101(C
abinda,form
erPortugueseprotectorate),Belezaet
al.(2005);5–Bakaka,
N¼44(C
ameroo
n),Coiaet
al.(2005);
6–Bassa,
N¼
45(C
ameroo
n),Coiaet
al.(2005);7–Fulbe,
N¼
31(C
ameroo
n),Coiaet
al.(2005);8–Mozambique,
N¼
307,Salaset
al.(2002);9–Kanuri,
N¼10(N
iger,Nigeria),
Watson
etal.(1997);
10–Fulbe,
N¼
39(N
igeria,Niger,Ben
in,Cameroo
n,Burk
inaFaso),
Watson
etal.(1997);
11–Son
ghai,
N¼8(N
igeria,Niger,Mali),
Watson
etal.(1997);
12–Yoruba,
N¼
30(N
igeria),Watson
etal.(1997),Vigilantet
al.(1991);13–Sen
egalese,
N¼
42(Sen
egal),Randoet
al.(1998);14–Serer,
N¼
19(Sen
egal),Randoet
al.(1998);
15–
Wolof,
N¼
37(Sen
egal),Randoet
al.(1998);
16–Manden
ka,
N¼
112(Sen
egal),Graven
etal.(1995);
17–Men
de,
N¼54(SierraLeone),Jack
son
etal.(2005);
18–Lok
o,N¼30(SierraLeo
ne),Jack
sonet
al.(2005);19–Lim
ba,
N¼65(SierraLeo
ne),Jack
sonet
al.(2005);20–Tem
ne,
N¼11
7(SierraLeo
ne),Jack
sonet
al.(2005);21–Hausa
,N¼15
(Niger,Nigeria),Watson
etal.(1997).
TA1
5Y-SNP AND mtDNA VARIATION IN BLACK BRAZILIANS
American Journal of Physical Anthropology—DOI 10.1002/ajpa

Using the haplogroup distributions presented in Table1, we constructed a tree which shows three well-definedclusters (Fig. 2). One of them (A) groups all West Afri-cans; another (B) clusters the West-Central/SoutheastAfricans with the two Brazilian Black populations. Notethe proximity of the latter with the two former Portugalcolonies, Angola and Mozambique. A third, intermediateand more restricted cluster (C), is represented by threepopulations from Cameroon (Bassa, Bakaka, and Fulbe).
Cameroon is geographically located in the probablecenter of spread of the Bantu languages and is posi-tioned exactly between Western and Western-CentralAfrican regions. As a consequence it contains both Bantu(Bakaka and Bassa) and non-Bantu (Fulbe) speakingpopulations. Figure 2 also suggests a genetic differentia-tion within the Niger-Congo subphylum, separating theWest-Central/Southeast Bantu speakers (Fang, Cabinda,Bubi, Angola, Mozambique) from the Western non-Bantu
Fig. 2. Unrooted tree based on the mtDNA haplogroup distributions presented in Table 1. A: Western non-Bantu cluster; B:West-Central/Southeastern Bantu cluster; C: Cameroon populations.
6 T. HUNEMEIER ET AL.
American Journal of Physical Anthropology—DOI 10.1002/ajpa

TA
BL
E2.
Dis
trib
uti
ons
(in
%)
ofth
eB
*,D
*a
nd
E*
Y-c
hro
mos
ome
ha
plo
gro
up
sin
two
Bra
zili
an
an
dtw
enty
-on
eA
fric
an
pop
ula
tion
sa
Pop
ulation
(cou
ntry)
N
Haplogroupb
E3*
(PN2)E3a*
(M2)E3a1
(M58)
E3a2
(M11
6.2)E3a3
(M149)E3a4
(M154)E3a5
(M155)E3a6
(M10)E3a7
(M191)
E1*
(M33)
E2*
(M75)E3b*
(M35)E3b1*
(M78)E3b2*
(M81)
E3b3
(M123)E3b4
(M281)E-V
6c
YAP
(xDE)
(M145)
D*
(xE)
(M174)
B*
(M60)Others
Porto
Alegre
(Brazil)
57
16
93
32
364
Rio
deJaneiro
(Brazil)
130
33
112
22
41
144
Niger-C
ongosp
eakers
Wes
tMossi
(Burk
inaFaso)
49
268
22
42
ND
ND
2Rim
aibe(B
urk
inaFaso)
37
352
58
527
ND
ND
Fulbe(B
urk
inaFaso)
20
90
10
ND
ND
Fon
(Ben
in)
100
38
ND
ND
ND
ND
57
5ND
Wes
t-C
entr
al
Fulbe(C
ameroon)
17
653
ND
ND
41
Ewon
do(C
ameroon)
29
66
21
ND
ND
10
3Fali(C
ameroo
n)
39
26
33
ND
ND
18
23
Tali(C
ameroo
n)
15
46
720
20
ND
ND
7Mixed
Adamawa(C
ameroo
n)
18
17
11ND
ND
12
60
Bakaka(C
ameroo
n)
12
67
825
ND
ND
Bamilek
e(C
ameroo
n)
48
25
15
56
ND
ND
4Bamilek
e(C
ameroo
n)
85
59
ND
ND
ND
ND
41
ND
Bantu
(Cameroo
n)
14
57
ND
ND
ND
ND
21
ND
22
Cen
tra
l-E
ast
Bantu
(Ken
ya)
29
21
ND
ND
ND
ND
31
17
14
ND
314
Wairak(Tanza
nya)
43
21
ND
ND
ND
ND
219
237
ND
19
Hutu
(Ruanda)
69
22
10
ND
ND
ND
ND
51
83
ND
6Tutsi(R
uanda)
94
32
ND
ND
ND
ND
48
41
ND
15
Nilo-Sahariansp
eakers
Wes
t-C
entr
al
Mixed
-Nilo-Saharian
(Cameroo
n)
911
22
11ND
ND
22
34
Afro-Asiatic-Spea
kers
Wes
t-C
entr
al
Mixed
-Chadic
(Cameroo
n)
15
77
7ND
ND
772
Daba(C
ameroo
n)
18
28
22
6ND
ND
44
Ouldem
e(C
ameroo
n)
21
ND
ND
595
aTheAfricandata
werecompiled
from
Cru
cianiet
al.(2002)andLuis
etal.(2004).ND
¼not
determined
(mark
erwasnot
investigated).
bNom
enclature
accordingtheTheIn
tern
ation
alY–Chromosom
eCon
sortium
revised
byJob
lingandTyler-Smith(2003).
cThis
haplogroupsh
owed
freq
uen
cies
rangingfrom
4%
to17%
inpop
ulation
sfrom
Ken
yaandEthiopia
(Cru
cianiet
al.,2004).
7Y-SNP AND mtDNA VARIATION IN BLACK BRAZILIANS
American Journal of Physical Anthropology—DOI 10.1002/ajpa

TA
BL
E3.
Dis
trib
uti
ons
(in
%)
ofth
eB
*a
nd
E*
Y-c
hro
mos
ome
ha
plo
gro
up
sin
two
Bra
zili
an
an
din
48
Afr
ica
np
opu
lati
onsa
Pop
ulation
(cou
ntry)
N
Haplogroupb
E3*
(xE3a)
E3a*
(xE3a7)
E3a7
(M191)
E1*
(M33)
E2*
(M75)
E3b*
(xE3b1,xE3b2)
E3b1*
(M78)
E3b2*
(M81)
B*
(M60)
Others
Porto
Alegre
(Brazil)
57
16
93
32
364
Rio
deJaneiro
(Brazil)
130
34
12
22
41
144
Niger-C
ongosp
eakers
Wes
tWolof
(Gambia/Sen
egal)
34
368
12
36
62
Mandinka(G
ambia/Sen
egal)
39
79
35
33
7Ewe(G
hana)
30
373
23
1Ga(G
hana)
29
62
34
31
Fante
(Ghana)
32
344
41
33
6Fon
(Ben
in)
100
38
57
5Mossi
(Burk
inaFaso)
49
268
22
42
2Rim
aibe(B
urk
inaFaso)
37
357
85
27
Fulbe-I(B
urk
inaFaso)
20
90
10
Wes
t-C
entr
al
Mixed
-Adamawa(C
ameroo
n)
18
28
12
60
Fali(C
ameroo
n)
39
26
33
18
23
Tali(C
ameroo
n)
15
53
20
20
7Fulbe-II
(Cameroo
n)
17
653
41
Tupuri
(Cameroo
n)
21
1189
Ewon
do(C
ameroo
n)
29
66
21
10
3Bakaka-I
(Cameroo
n)
12
75
25
Bakaka-II(C
ameroo
n)
17
47
53
Bamilek
e-I(C
ameroo
n)
48
40
56
4Bamilek
e-II
(Cameroo
n)
85
59
41
Bantu
(Cameroo
n)
14
57
21
22
Bassa(C
ameroo
n)
1155
36
9Ngou
mba(C
ameroo
n)
31
39
32
623
Nande(D
emocraticRep
ublicof
Con
go)
18
33
37
30
Hem
a(D
emocraticRep
ublicof
Con
go)
18
17
1139
28
5Cabinda(D
emocraticRep
ublicof
Con
go)
74
46
32
ND
ND
ND
ND
ND
913
Cen
tra
l-E
ast
Bantu
(Ken
ya)
29
21
31
17
14
314
Wairak(Tanza
nya)
43
22
19
237
20
Hutu
(Ruanda)
69
32
51
83
6Tutsi(R
uanda)
94
32
48
41
15
Ganda(U
ganda)
26
31
46
16
7S
outh
wes
tHerero(N
amibia)
24
38
33
29
Ambo(N
amibia)
22
550
32
55
3S
outh
east
Shon
a(Zim
babwe)
49
51
37
210
Sou
thSotho-Tsw
ana(Sou
thAfrica)
28
436
21
47
18
10
Zulu
(Sou
thAfrica)
29
334
21
21
17
4Xhosa(Sou
thAfrica)
80
434
20
28
55
4Nilo-Sahariansp
eakers
Wes
t-C
entr
al
Mixed
(Cameroo
n)
911
22
1122
34
(con
tin
ued
)
8 T. HUNEMEIER ET AL.
American Journal of Physical Anthropology—DOI 10.1002/ajpa

speakers (Yoruba, Kanuri, Fulbe, Shongai, Senegalese,Limba, Temne, Mende, Loko, Wolof, Mandenka, Serer).Using an AMOVA we tested the hypothesis of differen-
tiation between these two major geographical groups(excluding the Brazilian samples). The value obtained,although low, is significant: FCT ¼ 0.025, P < 10�4.
Y-chromosome biallelic markers
Table 2 shows that 56% and 36% of the Y-chromo-somes from Rio de Janeiro and Porto Alegre respectivelyhave an African origin. All the other Y-chromosomes(44%) found in Rio de Janeiro have a probable Europeanorigin, while for Porto Alegre 5% and 59% have a proba-ble Amerindian and European origins, respectively (datanot shown).E3a* is the most frequent African chromosome found
in our Brazilian sample, followed by E3a7. With theexception of E3b2, all African haplogroup E chromo-somes found in Brazil are also present in sub-SaharanAfricans. E3b2 has been described in high frequencies inNorth African populations, particularly among the Ber-ber (Cruciani et al., 2002; Luis et al., 2004; Semino etal., 2004). However, the presence of the E3b2 chromo-some in Brazil is most likely related to Iberian men,since typical Berber Y-chromosomes have been reportedin Portuguese/Spanish populations. The existence of acommon genetic background between Berbers and Iber-ians probably reflects the genetic impact of the Islamicoccupation of the Iberian Peninsula for 7 centuries (Car-valho-Silva et al., 2001; Lucotte et al., 2001; Bortolini etal., 2004b; Cruciani et al., 2004; Semino et al., 2004;Goncalves et al., 2005).Since few African populations have been studied with
the same set of Y-SNPs used here, we assembled thehaplogroups according to a hierarchical strategy. Thisprocedure allowed the comparison of our results withthose from 48 African populations, including 36 Niger-Congo T3speaking groups (Table 3). Afterwards, this infor-mation was used to obtain a distance matrix and aneighbor-joining tree (Fig. 3), which shows a clear splitseparating the Niger-Congo speakers (cluster B) fromthe other Africans (Afro-Asiatic and Nilo-Saharan speak-ers; cluster A). But there are some exceptions (the Mas-sai and Luo from Kenya clustered together with Niger-Congo speakers, whereas Mixed-Adamawa, Fulbe-Came-roon, and Tupuri grouped with the Afro-Asiatic speak-ers). The two Black Brazilian populations are closelyrelated to each other and with the Niger-Congo speak-ing-populations. The Niger-Congo cluster, however, doesnot show internal structure in accordance with geogra-phy or language, a pattern which differs from thatobserved with mtDNA. The same tendency was observedwhen just Niger-Congo populations were considered inthe analysis (data not shown).Using the populations from West and West-Central/
Southeast Africa given in Table 3 (excluding those fromCameroon, see comment above) we obtained a value ofFCT ¼ 0.006; P > 5%, i.e., no Y-chromosome differentia-tion between West-Central/Southeast (Bantu) and West(non-Bantu) men.
Admixture analysis
The two major population groups observed in ourmtDNA phylogenetic tree (West-Central/SoutheastBantu speakers and Western non-Bantu speakers),
TA
BL
E3.
(Con
tin
ued
)
Pop
ulation
(cou
ntry)
N
Haplogroupb
E3*
(xE3a)
E3a*
(xE3a7)
E3a7
(M191)
E1*
(M33)
E2*
(M75)
E3b*
(xE3b1,xE3b2)
E3b1*
(M78)
E3b2*
(M81)
B*
(M60)
Others
Cen
tra
l-E
ast
Massai(K
enya)
26
12
435
15
826
Luo(K
enya)
922
44
22
12
Afro-Asiaticsp
eakers
Wes
t-C
entr
al
Mixed
-Chadic
(Cameroo
n)
15
77
779
Pod
okwo(C
ameroo
n)
19
595
Mandara
(Cameroo
n)
28
114
74
74
Uldem
e(C
ameroo
n)
13
31
69
Ouldem
e(C
ameroon)
21
595
Daba(C
ameroo
n)
18
28
22
644
Cen
tra
l-E
ast
Amhara
(Ethiopia)
18
611
33
50
Mixed
Sem
itic
(Ethiopia)
20
10
20
35
35
Oromo(E
thiopia)
911
1122
56
ND
¼not
determined
(mark
erwasnot
investigated).
aTheAfricanpop
ulation
data
werecompiled
from
Cru
cianiet
al.(2002),Luis
etal.(2004),Woo
det
al.(2005),andBelezaet
al.(2005).
Nom
enclature
accordingto
theIn
tern
ation
alY-C
hromosom
eCon
sortium
revised
byJob
lingandTyler-Smith(2003).
9Y-SNP AND mtDNA VARIATION IN BLACK BRAZILIANS
American Journal of Physical Anthropology—DOI 10.1002/ajpa

which showed significant differences in their mtDNAhaplogroup distributions, were used as parental stocksin the admixture analysis, using the data presented inTable 1 and a least squares approximation. The West-Central and Southeast African maternal contributionwas majority (69% for Rio de Janeiro; 82% for Porto Ale-gre), whereas the complementary numbers can be attrib-utable to the West African contribution (Table 4). These
admixture values are very similar to those suggested bythe historical records. These findings could reflect theabsence of major geographic gender-specific differencesin the Atlantic slave trade (as mentioned in the introduc-tion) in disagreement with another data set (Silva et al.,2006). Although sampling error cannot be discarded, thediscrepancy between the two studies may be due to thedifferent African sources that supplied slaves to the sev-eral Brazilian regions, and/or to different patterns of theslave trade for each of them.
DISCUSSION
As expected, estimates of the African contribution tothe Black Brazilian mtDNA gene pool (79–90%) arelarger than those obtained for populations identified asWhite in the different Brazilian regions, where the pro-portion of African mtDNA lineages ranged from 0% to44% (Alves-Silva et al., 2000; Marrero et al., 2005). Fromthese results a picture emerges, that the contemporaryBrazilian population presents the most important reser-voir of African mtDNA lineages out of Africa. It has beenestimated that at least 90 million persons in Brazil, in-dependently of their physical appearance, show mtDNAsof sub-Saharan African origin (Pena and Bortolini,2004). This particularity allowed inferences not onlyabout the probable mtDNA lineage composition of popu-lations from African regions hitherto not studied (Alves-Silva et al., 2000), but also about possible evolutionaryand demographic events mediated by women, whichshould have occurred in Africa (Bortolini et al., 2004a).On the other hand, some demographic and historical
circumstances related to Brazil’s colonization determinedthat the first Brazilians arose mostly by the unionbetween Portuguese males and Amerindian or Africanfemales (Bortolini et al., 1997; Carvalho-Silva et al.,2001; Salzano and Bortolini, 2002). These asymmetricalmatings determined that most of the Y-chromosomes ofcontemporary Brazilian populations have an Europeanorigin. The present results indicated that, although theproportion of the typical African chromosomes in theBlack samples (36–56%) are much higher than those
Fig. 3. Unrooted tree based on Y-SNP haplogroup distribu-tions presented in Table 3. Since all ‘‘other’’ haplogroups in Riode Janeiro and Porto Alegre had an European or Amerindianorigin, this category was excluded of the analyses for these twopopulations. A: Afro-Asiatic speaker cluster; B: Niger-Congospeaker cluster.
TABLE 4. Origin of Africans (in %) who arrived in RioGrande do Sul and Rio de Janeiro at the time of the slave trade
considering genetic and historical sources
West-Central andSoutheast Africaa West Africab
Porto Alegre (POA)mtDNAc 82 6 14 18 6 14Historicald *80 *20
Rio de JaneiromtDNAc 69 6 13 31 6 13Historicale *70 *30
a Major geographical regions characterized by the presence ofpeople who speak languages identified with the Bantu branch,Niger-Congo subphylum. Two important previous Portuguesecolonies were located in this region: Angola and Mozambique.b Major geographical region characterized by the presence ofpeople who speak languages identified with several non-Bantulinguistic groups of the Niger-Congo subphylum (except Hausa).c Some sub-clades with low frequencies in the derived popula-tions (RJ and POA) were grouped in their respective hap-logroups.d According to estimates presented by Klein (2002).e According to Maestri-Filho (1993).
10 T. HUNEMEIER ET AL.
American Journal of Physical Anthropology—DOI 10.1002/ajpa

obtained for Brazilian populations identified as White (0to *5%; Carvalho-Silva et al., 2001; Abe-Sandes et al.,2004; Marrero et al., 2005), the amount of Y-chromo-somes of European origin is striking.Our mtDNA results basically confirmed the historical
evidence that the main source of African migration toBrazil originated from West-Central and SoutheastAfrica. These results could be obtained because there areclear mtDNA geographic or language structures withinAfrica, particularly considering the Niger-Congo cluster.The same was not true; however, for the Y-SNP data,due to lack of clear African Y-chromosome patterns ofdistribution. Cruciani et al. (2002) suggested that theabsence of Y-chromosome differentiation in Africa couldbe due to relatively recent range expansion(s). E3a*chromosomes could have been already present along theWestern region and then spread to South Africa throughthe Bantu expansion. This haplogroup was also observedin high frequencies among hunter–gatherer populations,like the Biaka/Mbuti and Khoisan-speaking people, prob-ably due to admixture between Bantu-speaking men andBiaka/Mbuti/Khoisan women. The M191 mutation,which defines haplogroup E3a7, probably arose in West-Central Africa. A later demic expansion should havebrought E3a7 chromosomes from West-Central to West-ern Africa (Cruciani et al., 2002). Studies with Y-SNPsassociated with the fast-evolving Y microsatellite loci(STRs) revealed that the STR variation is structuredwithin SNP-haplogroups. However, this variation is alsonot well correlated with geography (Scozzari et al., 1999;Cruciani et al., 2002). These results reinforce the ideathat the present differences between HVS-I mtDNA andY-SNP data is not an artifact related to different muta-tion rates.A first important implication of these findings is that
E3a* should be interpreted as a Niger-Congo marker.Although the presence of E3a* in Central to SouthAfrica can be associated with the Bantu expansion, thischromosome may have existed for at least *11,000 yearsbefore the spread of the carriers of the Bantu languages(Scozzari et al., 1999). Probably E3a* was the most
common chromosome in West Africa at the time of theNiger-Congo language emergence. A second implicationis that these demic expansions in Africa, including theBantu dispersion, probably did not involve a highermigration rate of Niger-Congo speaking women thanmen, but maybe the opposite, or at least the samefemale/male migration rate.
CONCLUSIONS
New World African-derived populations furnish impor-tant information about past events. When historicalsources are lacking or deficient (for instance, on Decem-ber 14, 1890, Brazilian’s then Minister of Finances, RuiBarbosa, issued a decree ordering the burning of alldocuments related to slavery) genetic data can be usedto clarify some of the uncertainties.The present work was designed to answer specific
questions, one related to the pattern of interethnicunions that occurred in the past, and the second aboutpossible sources of origin of the Africans who were forci-bly transported to Brazil. The results indicated a clearpresence of European Y-chromosomes in Black persons,as well as confirmation, through the mtDNA findings, ofhistorical data which placed West-Central and SoutheastAfrica as the main places from which such people cameto Brazil. The lack of clear Y-chromosome prevalencepatterns within Africa, however, prevents the ascertain-ment of the role played by possible gender differenceswhich could have occurred in the slave traffic.
ACKNOWLEDGMENTS
The authors thank Mara H. Hutz and Eliane Bandi-nelli for the Porto Alegre and Rio de Janeiro samples,and Rafael Bisso Machado for technical assistance. Wewould also like to thank Sidia Maria Callegari-Jacquesfor constructive comments. This investigation wasapproved by the Brazilian National Ethics Commission(CONEP number 1333/2002).
APPENDIX
TABLE A1. List of the mtDNA haplogroups and haplotypes observed in Rio de Janeiro (RJ) and/or Porto Alegre (POA)
Haplotype Haplogroup HVS1 Mutationsa RJ POA
1 L0a1 129 148 168 172 187 188G 189 223 230 278 311 320 1 12 L0a1 129 148 168 172 187 188G 189 223 230 278 293 311 320 3 33 L0a1 093 129 148 168 172 187 188G 189 223 230 278 293 311 320 24 L0a2 148 172 187 188A 189 223 230 311 320 15 L0a2 148 172 187 188G 189 223 230 311 320 36 L0d1 129 187 189 223 230 239 243 294 311 17 L0a1a 093 129 148 168 172 187 188A 189 223 230 278 293 311 320 18 L1b 111 126 187 189 223 264 270 278 293 311 19 L1b 126 187 189 223 264 270 278 293 311 2 210 L1b 126 148 187 189 223 264 270 278 311 111 L1b 126 187 189 223 264 270 278 311 4 212 L1c 129 187 189 223 278 294 311 360 113 L1c 129 187 189 223 261 278 311 360 114 L1c 129 187 189 223 274 278 287 294 311 320 360 115 L1c 129 187 189 223 278 294 311 355 360 362 116 L1c1 129 187 189 223 278 293 294 311 360 2 217 L1c1 129 187 189 223 274 278 293 294 311 360 118 L1c1 093 129 187 189 223 263 278 293 294 311 360 1 119 L1c1 129 163 187 189 209 223 278 293 294 311 360 220 L1c1 093 129 187 189 223 278 293 294 311 360 1
(continued)
11Y-SNP AND mtDNA VARIATION IN BLACK BRAZILIANS
American Journal of Physical Anthropology—DOI 10.1002/ajpa

TABLE A1. (Continued)
Haplotype Haplogroup HVS1 Mutationsa RJ POA
21 L1c2 129 187 189 223 265C 278 286G 294 311 320 360 322 L1c2 129 187 189 223 265C 278 286G 294 311 355 360 123 L1c2 129 187 189 223 265C 278 286G 294 311 360 1 324 L1c2 129 145 187 189 223 234 265C 278 286G 294 311 360 125 L1c2 129 187 189 223 265C 278 286A 294 311 320 360 126 L1c2 129 187 189 213 223 234 265C 278 286G 294 311 360 127 L1c3 129 189 215 223 278 294 311 360 328 L1c3 129 189 215 223 278 294 311 354 360 129 L2a a1 223 234 249 278 294 230 L2a1 b1 223 278 294 309 2 231 L2a1 b1 193 213 223 239 278 294 309 132 L2a1 b1 093 223 256 278 292 294 309 133 L2a1 b1 223 256 278 294 309 2 134 L2a1 b1 093 223 256 278 294 309 4 235 L2a1 b1 223 278 291 294 309 136 L2a1 b1 129 223 278 294 309 237 L2a1 b1 092 223 278 294 309 238 L2a1 b2 189 193 223 245 278 294 309 139 L2a1 b2 189 223 278 294 309 140 L2a1 b3 189 192 223 278 294 309 241 L2a1a 092 223 278 286 294 309 242 L2a1a 223 278 286 294 309 3 443 L2b 114A 129 213 223 278 354 2 144 L2b 114A 129 213 223 274 278 345 L2b 114A 223 264 274 278 146 L2b 223 264 274 278 147 L2b1 114A 129 213 223 278 355 362 348 L2b1 114A 129 213 223 278 311 362 149 L2c 223 264 278 250 L3 223 1 151 L3b 124 223 278 362 1 252 L3b 124 145 223 278 362 253 L3b1 223 278 294 362 254 L3b2 124 223 278 311 362 255 L3d 124 223 319 256 L3d 124 223 278 290 292 312 362 157 L3d1 124 223 158 L3d1 124 145 223 278 290 319 362 159 L3d1 124 223 278 290 319 362 160 L3d2 124 223 256 461 L3e1 223 327 1 462 L3e1 176 223 327 1 163 L3e1a 185 223 327 1 164 L3e1a 185 223 311 327 265 L3e1a 185 209 223 327 266 L3e1b 223 325D 327 167 L3e2 093 192 223 320 168 L3e2 192 223 320 169 L3e2b 172 189 223 320 270 L3e3 223 265T 3 271 L3e3 223 265T 355 172 L3e3 223 265T 316 173 L3e3 223 265T 288 174 L3e3 189 223 265T 275 L3f 209 223 311 2 276 L3f 192 209 223 311 177 L3f1 129 209 223 292 295 311 1 278 L3f1 093 129 209 223 292 295 311 179 L3f1 209 223 292 311 280 L3g 093 223 287 293T 301 311 355 362 281 L3g 093 223 293T 301 311 355 362 1Total 84 85
a The nucleotide positions (less 16,000) considered for the analyses were from 16051 to 16384. Sequences were aligned with the re-vised reference sequence (Andrews et al., 1999).
12 T. HUNEMEIER ET AL.
American Journal of Physical Anthropology—DOI 10.1002/ajpa

LITERATURE CITED
Abe-Sandes K, Silva WA Jr, Zago MA. 2004. Heterogeneity ofthe Y chromosome in Afro-Brazilian populations. Hum Biol76:77–86.
Alves-Silva J, da Silva Santos M, Guimaraes PE, Ferreira AC,Bandelt H-J, Pena SD, Prado VF. 2000. The ancestry of Bra-zilian mtDNA lineages. Am J Hum Genet 67:444–461.
Andrews RM, Kubacka I, Chinnery PF, Lightowlers RN, Turn-bull DM, Howell N. 1999. Reanalysis and revision of the Cam-bridge reference sequence for human mitochondrial DNA. NatGenet 23:147.
Avise JC. 2000. Phylogeography: the history and formation ofspecies. Cambridge: Harvard University Press.
Bandelt H-S, Quintana-Murci L, Salas A, Macaulay V. 2002.The fingerprint of phantom mutations in mitochondrial DNAdata. Am J Hum Genet 71:1150–1160.
Beleza S, Gusmao L, Amorim A, Carracedo A, Salas A. 2005.The genetic legacy of western Bantu migrations. Hum Genet117:366–375.
Bergmann M. 1977. Nasce um povo. Petropolis: Editora Vozes.Berute GS. 2006. Caracterısticas dos escravos traficados para o
Rio Grande de Sao Pedro (1788–1802). Humanas 26:349–369.Bortolini MC, Salzano FM, Thomas MG, Stuart S, Nasanen SP,
Bau CH, Hutz MH, Layrisse Z, Petzl-Erler ML, Tsuneto LT,Hill K, Hurtado AM, Castro-de-Guerra D, Torres MM, GrootH, Michalski R, Nymadawa P, Bedoya G, Bradman N, LabudaD, Ruiz-Linares A. 2003. Y-chromosome evidence for differingancient demographic histories in the Americas. Am J HumGenet 73:524–539.
Bortolini MC, Silva-Junior WA, Zago MA, Elion J, Krishnamoor-thy R, Goncalves VF, Pena SD. 2004a. The phylogeography ofmitochondrial DNA haplogroup L3g in Africa and the Atlanticslave trade. Am J Hum Genet 75:522–524.
Bortolini MC, Thomas MG, Chikhi L, Aguilar JA, Castro-de-Guerra D, Salzano FM, Ruiz-Linares A. 2004b. Ribeiro’s typol-ogy, genomes, and Spanish colonialism, as viewed from GranCanaria and Colombia. Genet Mol Biol 27:1–8.
Bortolini MC, Zago MA, Salzano FM, Silva-Junior WA, BonattoSL, Silva MC da, Weimer TA. 1997. Evolutionary and anthro-pological implications of mitochondrial DNA variation in Afri-can Brazilian populations. Hum Biol 69:141–159.
Carvalho CM, Pena SD. 2005. Optimization of a multiplex mini-sequencing protocol for population studies and medical genet-ics. Genet Mol Res 4:115–125.
Carvalho-Silva DR, Santos FR, Rocha J, Pena SD. 2001. Thephylogeography of Brazilian Y-chromosome lineages. Am JHum Genet 68:281–286.
Cavali-Sforza LL, Menozzi P, Piazza A. 1994. The history andgeography of human genes. Princeton: Princeton UniversityPress.
Coia V, Destro-Bisol G, Verginelli F, Battagglia C, Boschi I, Cru-ciani F, Spedini G, Comas D, Callafel F. 2005. mtDNA varia-tion in North Cameroon: lack of Asian lineages and implica-tions for back migration from Asia to sub-Saharan Africa. AmJ Phys Anthropol 128:678–681.
Conrad RE. 1985. Tumbeiros, o trafico de escravos para o Brasil.Sao Paulo: Ed. Brasiliense.
Cruciani F, La Fratta R, Santolamazza P, Sellitto D, Pascone R,Moral P, Watson E, Guida V, Colomb EB, Zaharova B, La-vinha J, Vona G, Aman R, Cali F, Akar N, Richards M, Tor-roni A, Novelletto A, Scozzari R. 2004. Phylogeographic analy-sis of haplogroup E3b (E-M215) Y chromosomes reveals multi-ple migratory events within and out of Africa. Am J HumGenet 74:1014–1022.
Cruciani F, Santolamazza P, Shen P, Macaulay V, Moral P, Olck-ers A, Modiano D, Holmes S, Destro-Bisol G, Coia V, WallaceDC, Oefner PJ, Torroni A, Cavalli-Sforza LL, Scozzari R,Underhill PA. 2002. A back migration from Asia to sub-Saharan Africa is supported by high-resolution analysis ofhuman Y-chromosome haplotypes. Am J Hum Genet 70:1197–1214.
Curtin P. 1969. The Atlantic slave trade: a census. Madison:University of Wisconsin Press.
Curtin P, Feierman S, Thompson L, Vansina J. 1991. Africanhistory. London: Longman.
Diamond J, Bellwood P. 2003. Farmers and their languages: thefirst expansion. Science 300:597–603.
Excoffier L, Laval G, Schnieder S. 2005. Arlequin 3.0 an inte-grated software package for population genetics data analysis.Evol Bioinformatics online 1:47–50.
Goncalves R, Freitas A, Branco M, Rosa A, Fernandes AT, Zhi-votovsky LA, Underhill PA, Kivisild T, Brehm A. 2005. Y-chro-mosome lineages from Portugal, Madeira and Acores recordelements of Sephardim and Berber ancestry. Ann Hum Genet69:443–454.
Graven L, Passarino G, Semino O, Boursot P, Santachiara-Ben-erecetti S, Langaney A, Excoffier L. 1995. Evolutionary corre-lation between control region and restriction polymorphismsin the mitochondrial genome of a large Senegalese Mandenkasample. Mol Biol Evol 12:334–345.
Greenberg JH. 1963. The languages of Africa. Bloomington: In-diana University Press.
Hall TA. 1999. BioEdit: a user-friendly biological sequencealignment editor and analysis program for Windows 95/98/NT.Nucleic Acids Symp Ser 41:95–98.
Jackson BA, Wilson JL, Kirbah S, Sidney SS, Rosenberg J, Bas-sie N, Alie JA, McLean DC, Garvey WT, Ely B. 2005. Mito-chondrial DNA genetic diversity among four ethnic groups inSierra Leone. Am J Phys Anthropol 128:156–163.
Jobling M, Tyler-Smith C. 2003. The human Y chromosome:an evolutionary marker comes of age. Nat Rev Genet 4:598–612.
Kivisild T, Reidla M, Metspalu E, Rosa A, Brehm A, PennarunE, Parik J, Geberhiwot T, Usanga E, Villems R. 2004. Ethio-pian mitochondrial DNA heritage: tracking gene flow acrossand around the gate of tears. Am J Hum Genet 75:752–770.
Klein HS. 2002. As origens africanas dos escravos brasileiros.In: Pena SDJ, editor. Homo brasilis. Aspectos geneticos, lin-guisticos, historicos e socioantropologicos da formacao do povobrasileiro. Ribeirao Preto: FUNPEC Editora. p 93–112.
Long JC. 1991. The genetic structure of admixed populations.Genetics 127:417–428.
Lucotte G, Gerard N, Mercier G. 2001. North African genes inIberia studied by Y-chromosome DNA haplotype V. HumImmunol 62:885–888.
Luis JR, Rowold DJ, Regueiro M, Caeiro B, Cinnioglu C, Rose-man C, Underhill PA, Cavalli-Sforza LL, Herrera RJ. 2004.The Levant versus the Horn of Africa: evidence for bidirec-tional corridors of human migrations. Am J Hum Genet74:532–544.
Maestri-Filho M. 1993. O escravo gaucho: persistencia e tra-balho. Porto Alegre: Editora da UFRGS.
Marrero AR, Das Neves Leite FP, De Almeida Carvalho B,Peres LM, Kommers TC, Da Cruz IM, Salzano FM, Ruiz-Linares A, Silva-Junior WA, Bortolini MC. 2005. Heterogene-ity of the genome ancestry of individuals classified as Whitein the state of Rio Grande do Sul, Brazil. Am J Hum Biol17:496–506.
Mateu E, Comas D, Calafell F, Perez-Lezaun A, Abade A, Ber-tranpetit J. 1997. A tale of two islands: population historyand mitochondrial DNA sequence variation of Bioko and SaoTome, Gulf of Guinea. Ann Hum Genet 61:507–518.
McMillin JA. 2004. The final victims: foreign slave trade toNorth America 1783–1810. Columbia: University of SouthCarolina Press.
Murdock GP. 1959. Africa. Its peoples and their culture history.New York: McGraw-Hill.
Nei M, Roychoudhury AK. 1993. Evolutionary relationships ofhuman populations on a global scale. Mol Biol Evol 10:927–943.
Nei M, Tajima F, Tateno Y. 1983. Accuracy of estimated phyloge-netic trees from molecular data. J Mol Evol 19:153–170.
Newman J. 1995. The peopling of Africa: a geographic interpre-tation. New Haven: Yale University Press.
Page RDM. 1996. TREEVIEW: an application to display phylo-genetic trees on personal computers. Comp Appl Bios 12:357–358.
13Y-SNP AND mtDNA VARIATION IN BLACK BRAZILIANS
American Journal of Physical Anthropology—DOI 10.1002/ajpa

Pena SD, Bortolini MC. 2004. Pode a genetica definir quemdeve se beneficiar das cotas universitarias e demais acoes afir-mativas? Est Avanc (Sao Paulo) 18:1–20.
Phillipson DW. 1993. African archaeology. Cambridge: Cam-bridge University Press.
Pinto F, Gonzalez AM, Hernandez M, Larruga JM, Cabrera VN.1996. Genetic relationship between the Canary islanders andtheir African and Spanish ancestors inferred from mitochon-drial DNA sequences. Ann Hum Genet 60:321–330.
Plaza S, Salas A, Calafell F, Corte-Real F, Bertranpetit J, Carra-cedo A, Comas D. 2004. Insights into the western Bantu dis-persal: mtDNA lineage analysis in Angola. Hum Genet115:439–447.
Poloni ES, Semino O, Passarino G, Santachiara-Benerecetti AS,Dupanloup I, Langaney A, Excoffier L. 1997. Human geneticaffinities for Y-chromosome P49a,f/TaqI haplotypes showstrong correspondence with linguistics. Am J Hum Genet61:1015–1035.
Rando JC, Pinto F, Gonzalez AM, Hernandez M, Larruga JM,Cabrera VM, Bandelt H-J. 1998. Mitochondrial DNA analysisof northwest African populations reveals genetic exchangeswith European, Near-Eastern,and sub-Saharan populations.Ann Hum Genet 65:531–550.
Rexova K, Bastin Y, Frynta D. 2006. Cladistic analysis of Bantulanguages: a new tree based on combined lexical and gram-matical data. Naturwissenschaften 93:189–194.
Ruhlen M. 1987. A guide to the world’s languages. Stanford:Stanford University Press.
Saitou N, Nei M. 1987. The neighbor-joining method: a newmethod for reconstruction of phylogenetic trees. Mol Biol Evol4:406–425.
Salas A, Carracedo A, Richards M, Macaulay V. 2005. Chartingthe ancestry of African Americans. Am J Hum Genet 77:676–680.
Salas A, Richards M, De la Fe T, Lareu MV, Sobrino B, San-chez-Diaz P, Macaulay V, Carracedo A. 2002. The making ofthe African mtDNA landscape. Am J Hum Genet 71:1082–1111.
Salas A, Richards M, Lareu MV, Scozzari R, Coppa A, TorroniA, Macaulay V, Carracedo A. 2004. The African diaspora: mi-tochondrial DNA and the Atlantic slave trade. Am J HumGenet 74:454–465.
Salzano FM, Bortolini MC. 2002. Evolution and genetics ofLatin American populations. Cambridge: Cambridge Univer-sity Press.
Scozzari R, Cruciani F, Santolamazza P, Malaspina P, Torroni A,Sellitto D, Arredi B, Destro-Bisol G, De Stefano G, RichardsO, Martinez-Labarga C, Modiano D, Biondi G, Moral P, Olck-ers A, Wallace DC, Novelletto A. 1999. Combined use of bial-lelic and microsatellite Y-chromosome polymorphisms to inferaffinities among African populations. Am J Hum Genet65:829–846.
Semino O, Magri C, Benuzzi G, Lin AA, Al-Zahery N, BattagliaV, Maccioni L, Triantaphyllidis C, Shen P, Oefner PJ, Zhivotov-sky LA, King R, Torroni A, Cavalli-Sforza LL, Underhill PA,Santachiara-Benerecetti AS. 2004. Origin, diffusion, and dif-ferentiation of Y-chromosome haplogroups E and J: inferenceson the neolithization of Europe and later migratory events inthe Mediterranean area. Am J Hum Genet 74:1023–1034.
Shen P, Lavi T, Kivisild T, Chou V, Sengun D, Gefel D, ShpirerI, Woolf E, Hillel J, Feldman M, Oefner P. 2004. Reconstruc-tion of patri- and matri-lineages of Samaritans and otherIsraeli populations from Y-chromosome and mitochondrialDNA sequence variation. Hum Mut 24:248–260.
Silva WA, Bortolini MC, Schneider MPC, Marrero AR, Elion J,Krishnamoorthy R, Zago MA. 2006. mtDNA haplogroup anal-ysis of Black Brazilian and sub-Saharan populations: implica-tions for the Atlantic slave trade. Hum Biol 78:29–41.
Thomas H. 1998. The slave trade—the history of the Atlanticslave trade: 1440–1870. London: Macmillan.
Vigilant L, Stoneking M, Harpending H, Hawkes K, Wilson AC.1991. African populations and the evolution of mitochondrialDNA. Science 253:1503–1507.
Watson E, Forster P, Richards M, Bandelt H-J. 1997. Mitochon-drial footprints of human expansions in Africa. Am J HumGenet 61:691–704.
Wood ET, Stover DA, Ehret C, Destro-Bisol G, Spedini G,McLeod H, Louie L, Bamshad M, Strassmann BI, Soodyall H,Hammer MF. 2005. Contrasting patterns of Y chromosomeand mtDNA variation in Africa: evidence for sex-biased demo-graphic processes. Eur J Hum Genet 13:867–876.
Yao YG, Bravi CM, Bandelt H-J. 2004. A call for mtDNA dataquality control in forensic science. Forensic Sci Int 141:1–6.
Zhivotovsky LA, Underhill PA, Cinnioglu C, Kayser M, MorarB, Kivisild T, Scozzari R, Cruciani F, Destro-Bisol G, SpediniG, Chambers GK, Herrera RJ, Young KK, Gresham D, Tour-nev I, Feldman MW, Kalaydjieva L. 2004. The effective muta-tion rate at Y chromosome short tandem repeats, with appli-cation to human population divergence time. Am J HumGenet 74:50–61.
14 T. HUNEMEIER ET AL.
American Journal of Physical Anthropology—DOI 10.1002/ajpa