La nueva frontera: Spanish-Speaking Populations in Central Washington (with Daniel Villa & Eva...
24
Studies in Hispanic and Lusophone Linguistics Volume 7, Issue 1 Spring 2014 La nueva frontera: Spanish-Speaking Populations in Central Washington Daniel J. Villa, Naomi Lapidus Shin & Eva Robles Nagata New Mexico State University, University of New Mexico & University of Montana Abstract Washington State, demographically speaking, represents the northernmost boundary, la nueva frontera, of what might now be called the Spanish speaking West. Previously, Spanish speakers in the West were concentrated mostly in the Southwest. However, in recent years the Hispanic population of the U.S. has steadily grown, with the result that it forms the largest minority group in the nation, extending into areas that traditionally have not had significant Hispanic communities, including the Pacific Northwest. Little research to date has been carried out on the Spanish-speaking Hispanic populations in that region, particularly in interior Washington. This article seeks to begin to fill that research lacuna. Analyses of U.S. Census data, as well as sociolinguistic interviews with Washington Hispanics, indicate that what used to be the Spanish-speaking Southwest can now be subsumed under the broader ‘Spanish-speaking West,’ with Washington at its northernmost border. 1. Introduction There exists a well-established literature on the Spanish spoken by Hispanic populations throughout the U.S., dating back to Espinosa’s (1909) pioneering work on Traditional New Mexican Spanish. These studies have tended to focus on the Southwest, the Northeast, and Florida (e.g. Flores-Ferrán 2009, Jenkins 2009a, Lipski 2008, Otheguy & Zentella 2012, Moyna 2010, Silva-Corvalán 1994 and Zentella 1997, to name but a few). Conversely, only a handful of linguistic studies have been carried out on Hispanic populations in the Pacific Northwest (e.g. Rivera- Mills 2010, 2011, Rivera-Mills & Merecías-Cuevas 2010 and Woods & Rivera Mills 2010, 2012) and have tended to focus on coastal areas. To the best of the authors’ knowledge, there have been no previous linguistic studies focusing on Spanish speakers in Washington. This article seeks to begin to fill that research lacuna. We propose that Washington State, demographically speaking, now represents the northernmost boundary, la nueva frontera, of what might now be called the Spanish speaking West. We base this assertion on Bills’ 1989 study of Southwest Spanish, in which he includes Colorado in the geographic region he defines as the
Transcript of La nueva frontera: Spanish-Speaking Populations in Central Washington (with Daniel Villa & Eva...
Studies in Hispanic and Lusophone Linguistics Volume 7, Issue 1 Spring 2014
La nueva frontera: Spanish-Speaking Populations in Central Washington
Daniel J. Villa, Naomi Lapidus Shin & Eva Robles Nagata New Mexico State University, University of New Mexico & University of Montana Abstract Washington State, demographically speaking, represents the northernmost boundary, la nueva frontera, of what might now be called the Spanish speaking West. Previously, Spanish speakers in the West were concentrated mostly in the Southwest. However, in recent years the Hispanic population of the U.S. has steadily grown, with the result that it forms the largest minority group in the nation, extending into areas that traditionally have not had significant Hispanic communities, including the Pacific Northwest. Little research to date has been carried out on the Spanish-speaking Hispanic populations in that region, particularly in interior Washington. This article seeks to begin to fill that research lacuna. Analyses of U.S. Census data, as well as sociolinguistic interviews with Washington Hispanics, indicate that what used to be the Spanish-speaking Southwest can now be subsumed under the broader ‘Spanish-speaking West,’ with Washington at its northernmost border. 1. Introduction There exists a well-established literature on the Spanish spoken by Hispanic populations throughout the U.S., dating back to Espinosa’s (1909) pioneering work on Traditional New Mexican Spanish. These studies have tended to focus on the Southwest, the Northeast, and Florida (e.g. Flores-Ferrán 2009, Jenkins 2009a, Lipski 2008, Otheguy & Zentella 2012, Moyna 2010, Silva-Corvalán 1994 and Zentella 1997, to name but a few). Conversely, only a handful of linguistic studies have been carried out on Hispanic populations in the Pacific Northwest (e.g. Rivera-Mills 2010, 2011, Rivera-Mills & Merecías-Cuevas 2010 and Woods & Rivera Mills 2010, 2012) and have tended to focus on coastal areas. To the best of the authors’ knowledge, there have been no previous linguistic studies focusing on Spanish speakers in Washington. This article seeks to begin to fill that research lacuna.
We propose that Washington State, demographically speaking, now represents the northernmost boundary, la nueva frontera, of what might now be called the Spanish speaking West. We base this assertion on Bills’ 1989 study of Southwest Spanish, in which he includes Colorado in the geographic region he defines as the
2 Daniel J. Villa, Naomi Lapidus Shin & Eva Robles Nagata
Southwest,’ along with California, Arizona, New Mexico and Texas. He reports that the 1980 U.S. Census identified 11.8 percent of Colorado’s population as “Spanish origin,” and justifies the inclusion of the state in the Southwest based on that demographic datum (Bills 1989, p.13). Thus, Bills (1989) established a criterion for defining a Hispanic region in the Southwest: at least 10 percent of a state’s residents must be Hispanic in order for that state to be considered a Hispanic region. This 10 percent “tipping point” represents that moment in which a minority group becomes ‘visible.’ That is, the linguistic, economic and political presence, the educational needs, and the physical ‘one in ten faces’ presence of that minority group bring it to the attention of the rest of the population.
At the time of Bills’ (1989) study, Colorado formed the northern border of the Spanish-speaking Southwest; there were relatively few Spanish speakers in the states to its north. But, as Jenkins (2013) asserts, “given the growth of the Spanish-speaking, and especially Mexican, populations in the United States, studies on what has traditionally been called Southwest Spanish should move outside of that limited area.” Indeed, in the last thirty years the Hispanic population of the U.S. has grown steadily, with the result that it forms the largest minority group in the nation, at 16.7 percent of the total population at the time of writing of this article (www.census.gov; hereafter, all demographic references are drawn from data found in the U.S. Census, unless otherwise noted). This increase also occurred in Washington, the northernmost region of the Pacific Northwest, where Hispanics made up 11.2 percent of the total population in 2010. Thus, Washington’s Hispanic population exceeds the 10 percent tipping point and the state can therefore be considered a Hispanic region. As there have not yet been any linguistic studies based on this newly emerging Hispanic population, there are numerous research questions that need to be addressed. We focus on three here: 1. What are the specific demographic motivations for designating Washington as
a Hispanic Region, and where in the state is the Hispanic population located? 2. What variety of Spanish is spoken in Washington? 3. Are Spanish speakers in Washington maintaining the language, or are they
abandoning it in favor of English? In order to better understand the central Washington Hispanic communities and
to explore the three research questions outlined above we draw on two sources, one quantitative and the other qualitative, as the basis for our study: data from the U.S. Census, and sociolinguistic interviews of agricultural workers from central Washington. We begin with Census data in order to establish that central Washington can now be designated a Hispanic region.
La nueva frontera: Spanish-Speaking Populations in Central Washington 3
2. The growing Hispanic population in central Washington: Demographic data
As noted above, the Hispanic population in Washington exceeds 10 percent of the state’s population and, therefore, meets the minimum requirement for being considered a Hispanic region. Nevertheless, the Hispanic population is distributed unevenly throughout the state. There are counties in which Hispanics form significantly larger percentages of the total population, most notably in the river-fed farmlands of the Central Basin. In broad terms, this area is classified as semiarid, as the Cascade Mountains prevent moisture-laden clouds from reaching these portions of the state. Annual precipitation in this region ranges from seven to fifteen inches (http://www.wrcc.dri.edu/narratives/washington.htm). Given the small amount of rainfall the greater area receives, it would be unsuitable for growing crops. However, the construction of irrigation systems was initiated in the late 19th century, and culminated with projects such as the Columbia Basin Irrigation Project, which began delivering water to farmers in the mid-20th century. Hydroelectric power generated by dams along the Columbia River allows the economical delivery of water to the arid semi-desert regions by a system of some 300 miles of main canals (http://www.usbr.gov/pn/). Thus, an ideal condition for agriculture was created: long summer days, mostly cloudless, coupled with fertile soils and plentiful supplies of water. The demand for agricultural labor has triggered various stages of what Maldonado (1995) calls the viaje al norte (‘the move up north’), the Hispanic migration to the Pacific Northwest. The Bracero program, for example, brought Mexican laborers to the region, most notably between 1942 and 1947. The post World War II period saw an even more dramatic increase of Hispanic migration to the area (García 2005, pp.3-4), followed by a boom in the population in the 1980s and 1990s. This boom resulted in greater visibility and extensive communication networks including Spanish language radio stations and newspapers (Maldonado 1995, pp.23-24). Since the introduction of irrigation in the arid regions of the state, the food and agriculture industry has become increasingly important to Washington’s economic success. In 2010 this industry generated 40 billion dollars, which represents a contribution of 12 percent to the state’s economy (http://agr.wa.gov/AgInWa/). Demographic changes, especially the aging of the workforce, have created a demand for labor at all levels in agricultural production. The result has been a sharp increase in Hispanic workers, reflected in demographic changes in the areas studied. The ten counties that have the highest proportion of Hispanics in the region are listed in Table 1. The columns labeled ‘N’ provide the total number of Hispanics in each county. The columns labeled ‘% of total population’ present the percent of Hispanics out of the general population in each county. For example, in 2010 Adams County had a total population of 18,728 people, 11,099 of whom (59.3
4 Daniel J. Villa, Naomi Lapidus Shin & Eva Robles Nagata
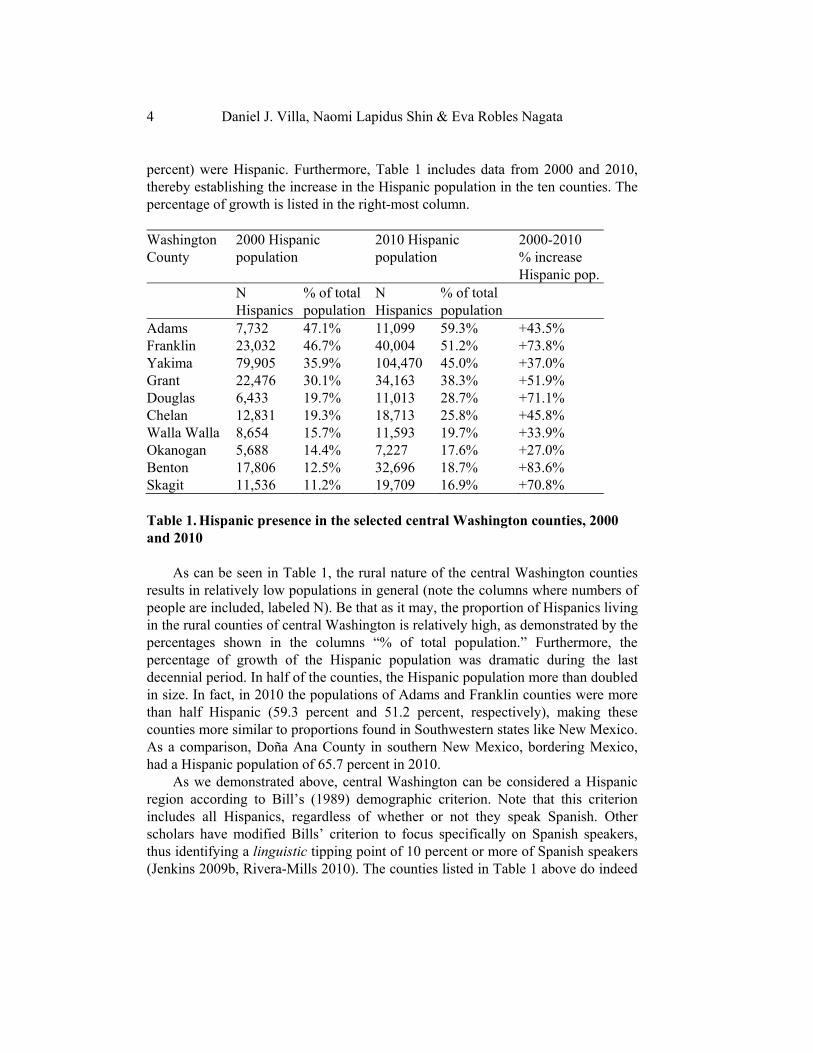
percent) were Hispanic. Furthermore, Table 1 includes data from 2000 and 2010, thereby establishing the increase in the Hispanic population in the ten counties. The percentage of growth is listed in the right-most column. Washington County
2000 Hispanic population
2010 Hispanic population
2000-2010 % increase Hispanic pop.
N Hispanics
% of total population
N Hispanics
% of total population
Adams 7,732 47.1% 11,099 59.3% +43.5% Franklin 23,032 46.7% 40,004 51.2% +73.8% Yakima 79,905 35.9% 104,470 45.0% +37.0% Grant 22,476 30.1% 34,163 38.3% +51.9% Douglas 6,433 19.7% 11,013 28.7% +71.1% Chelan 12,831 19.3% 18,713 25.8% +45.8% Walla Walla 8,654 15.7% 11,593 19.7% +33.9% Okanogan 5,688 14.4% 7,227 17.6% +27.0% Benton 17,806 12.5% 32,696 18.7% +83.6% Skagit 11,536 11.2% 19,709 16.9% +70.8% Table 1. Hispanic presence in the selected central Washington counties, 2000 and 2010
As can be seen in Table 1, the rural nature of the central Washington counties results in relatively low populations in general (note the columns where numbers of people are included, labeled N). Be that as it may, the proportion of Hispanics living in the rural counties of central Washington is relatively high, as demonstrated by the percentages shown in the columns “% of total population.” Furthermore, the percentage of growth of the Hispanic population was dramatic during the last decennial period. In half of the counties, the Hispanic population more than doubled in size. In fact, in 2010 the populations of Adams and Franklin counties were more than half Hispanic (59.3 percent and 51.2 percent, respectively), making these counties more similar to proportions found in Southwestern states like New Mexico. As a comparison, Doña Ana County in southern New Mexico, bordering Mexico, had a Hispanic population of 65.7 percent in 2010.
As we demonstrated above, central Washington can be considered a Hispanic region according to Bill’s (1989) demographic criterion. Note that this criterion includes all Hispanics, regardless of whether or not they speak Spanish. Other scholars have modified Bills’ criterion to focus specifically on Spanish speakers, thus identifying a linguistic tipping point of 10 percent or more of Spanish speakers (Jenkins 2009b, Rivera-Mills 2010). The counties listed in Table 1 above do indeed
La nueva frontera: Spanish-Speaking Populations in Central Washington 5
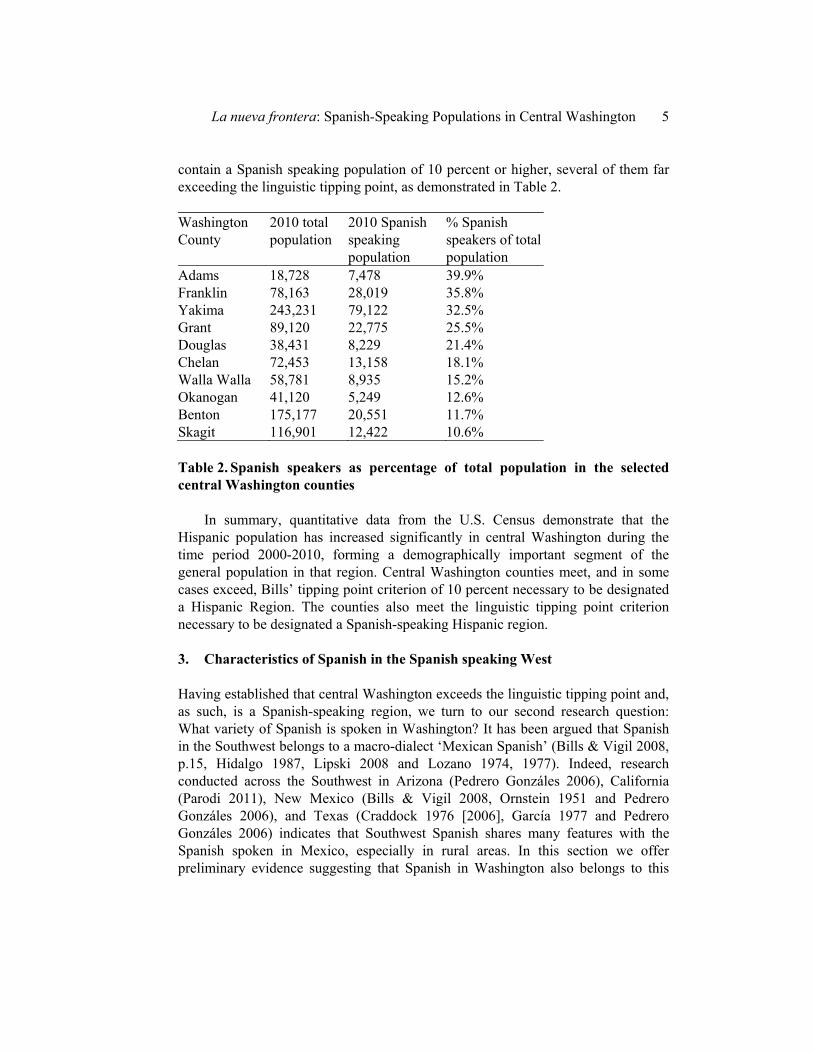
contain a Spanish speaking population of 10 percent or higher, several of them far exceeding the linguistic tipping point, as demonstrated in Table 2. Washington County
2010 total population
2010 Spanish speaking population
% Spanish speakers of total population
Adams 18,728 7,478 39.9% Franklin 78,163 28,019 35.8% Yakima 243,231 79,122 32.5% Grant 89,120 22,775 25.5% Douglas 38,431 8,229 21.4% Chelan 72,453 13,158 18.1% Walla Walla 58,781 8,935 15.2% Okanogan 41,120 5,249 12.6% Benton 175,177 20,551 11.7% Skagit 116,901 12,422 10.6% Table 2. Spanish speakers as percentage of total population in the selected central Washington counties In summary, quantitative data from the U.S. Census demonstrate that the Hispanic population has increased significantly in central Washington during the time period 2000-2010, forming a demographically important segment of the general population in that region. Central Washington counties meet, and in some cases exceed, Bills’ tipping point criterion of 10 percent necessary to be designated a Hispanic Region. The counties also meet the linguistic tipping point criterion necessary to be designated a Spanish-speaking Hispanic region. 3. Characteristics of Spanish in the Spanish speaking West Having established that central Washington exceeds the linguistic tipping point and, as such, is a Spanish-speaking region, we turn to our second research question: What variety of Spanish is spoken in Washington? It has been argued that Spanish in the Southwest belongs to a macro-dialect ‘Mexican Spanish’ (Bills & Vigil 2008, p.15, Hidalgo 1987, Lipski 2008 and Lozano 1974, 1977). Indeed, research conducted across the Southwest in Arizona (Pedrero Gonzáles 2006), California (Parodi 2011), New Mexico (Bills & Vigil 2008, Ornstein 1951 and Pedrero Gonzáles 2006), and Texas (Craddock 1976 [2006], García 1977 and Pedrero Gonzáles 2006) indicates that Southwest Spanish shares many features with the Spanish spoken in Mexico, especially in rural areas. In this section we offer preliminary evidence suggesting that Spanish in Washington also belongs to this
6 Daniel J. Villa, Naomi Lapidus Shin & Eva Robles Nagata
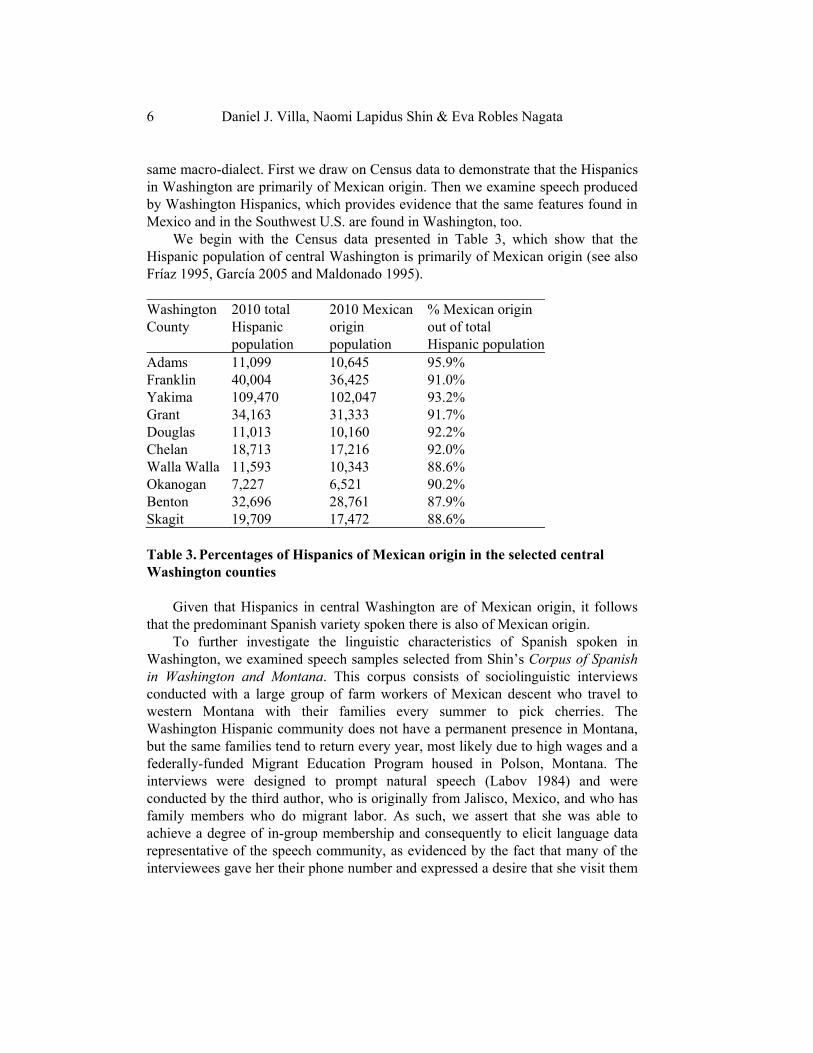
same macro-dialect. First we draw on Census data to demonstrate that the Hispanics in Washington are primarily of Mexican origin. Then we examine speech produced by Washington Hispanics, which provides evidence that the same features found in Mexico and in the Southwest U.S. are found in Washington, too. We begin with the Census data presented in Table 3, which show that the Hispanic population of central Washington is primarily of Mexican origin (see also Fríaz 1995, García 2005 and Maldonado 1995). Washington County
2010 total Hispanic population
2010 Mexican origin population
% Mexican origin out of total Hispanic population
Adams 11,099 10,645 95.9% Franklin 40,004 36,425 91.0% Yakima 109,470 102,047 93.2% Grant 34,163 31,333 91.7% Douglas 11,013 10,160 92.2% Chelan 18,713 17,216 92.0% Walla Walla 11,593 10,343 88.6% Okanogan 7,227 6,521 90.2% Benton 32,696 28,761 87.9% Skagit 19,709 17,472 88.6% Table 3. Percentages of Hispanics of Mexican origin in the selected central Washington counties
Given that Hispanics in central Washington are of Mexican origin, it follows that the predominant Spanish variety spoken there is also of Mexican origin. To further investigate the linguistic characteristics of Spanish spoken in Washington, we examined speech samples selected from Shin’s Corpus of Spanish
in Washington and Montana. This corpus consists of sociolinguistic interviews conducted with a large group of farm workers of Mexican descent who travel to western Montana with their families every summer to pick cherries. The Washington Hispanic community does not have a permanent presence in Montana, but the same families tend to return every year, most likely due to high wages and a federally-funded Migrant Education Program housed in Polson, Montana. The interviews were designed to prompt natural speech (Labov 1984) and were conducted by the third author, who is originally from Jalisco, Mexico, and who has family members who do migrant labor. As such, we assert that she was able to achieve a degree of in-group membership and consequently to elicit language data representative of the speech community, as evidenced by the fact that many of the interviewees gave her their phone number and expressed a desire that she visit them
La nueva frontera: Spanish-Speaking Populations in Central Washington 7
in their homes. In addition to the open-ended questions prompting natural speech (conversation and narrative), questions were posed to elicit sociodemographic data such as place of birth, place of residence, years in the U.S., etc. We selected from the corpus only ‘Washington Hispanics’ (N = 51), that is, people who reported having a permanent residence in one of the Washington counties identified above. While these individuals may work outside of their home area during the summer, they have an established presence in their home community. Out of the 51 total participants, 23 were adults (13 women, 10 men) and 28 were children (15 girls, 13 boys). We include children because a) their speech reflects the speech of the community, as demonstrated by examples 18, 23, 35, and 405 below, and b) one of our goals is to explore intergenerational Spanish language loss. All 23 adults, whose ages ranged from 19 to 71 years old, did agricultural labor; a few were also students. Only three of the 23 adults were born in the U.S. Said differently, almost all were born in Mexico, primarily hailing from Michoacán (N = 8) or Guerrero (N = 9). Of the 23 adults, 17 reside in Yakima County (mostly in towns such as Sunnyside or Grandview), and six reside in Benton County (either in Kennewick or Prosser). The ages of the 28 children included in the current study ranged from three to 17 years old. Like the adults, most of the children currently reside in Yakima County (N = 10) or Benton County (N = 9). Three live in Adams County and four in Grant County. Only two of the 28 children were born in Mexico (Michoacán) and migrated to the United States. In other words, we have the mirror opposite situation with the children as we do with the adults: almost all the adults were born in Mexico and migrated to the U.S., whereas almost all the children were born in the U.S. The speech of the participants in our study demonstrates that their Spanish is indeed rooted in a Mexican variety. For purposes of comparison, we draw on the characteristics of Spanish spoken in the West, as described by scholars such as Lipski (2008) and Parodi (2011). In terms of their phonology, speakers pronounced syllable-final /s/ as a strong sibilant, which is congruent with Mexican and Mexican-American varieties (Lipski 2008, p.85, Parodi 2011, p.226). In addition, Lipski (1994, p.279) notes that there are high rates of deletion of unstressed vowels in Spanish spoken in central Mexico, especially in cases of [e] in contact with /s/. Parodi (2011, p.225) notes this tendency as well in the Spanish spoken in Los Angeles. We find examples of this in our data, as in the pronunciation of necesitan
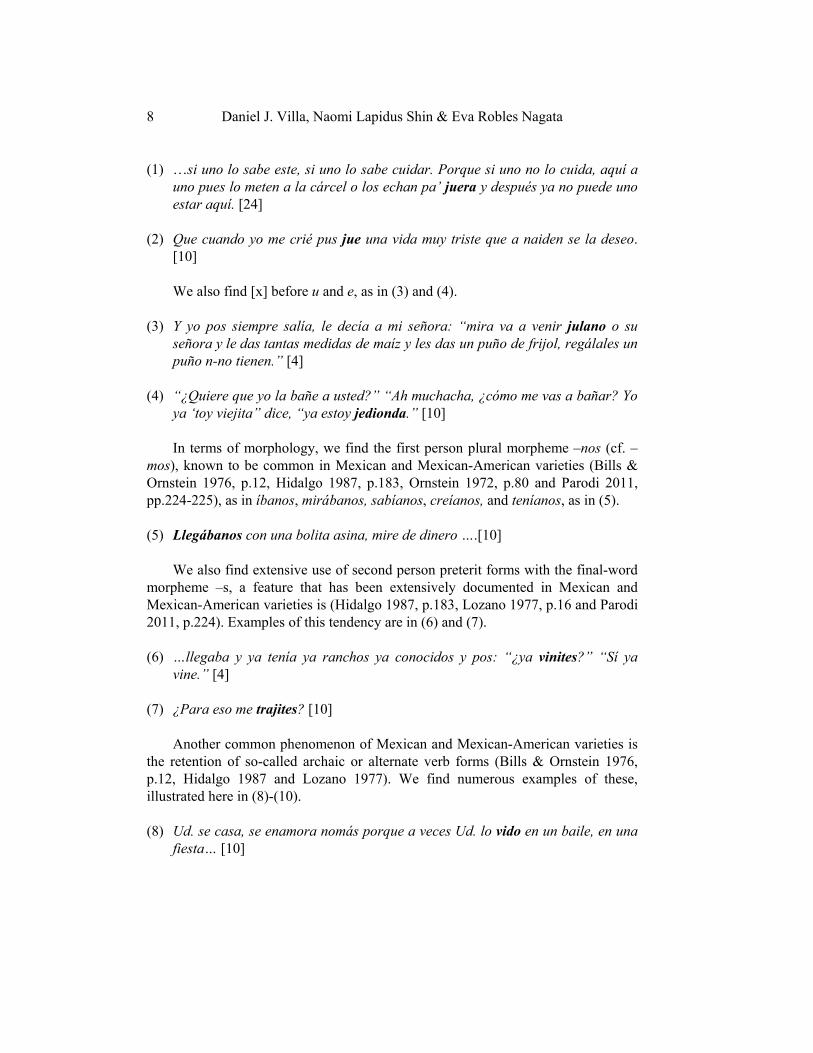
as [ne-si-tan] instead of [ne-se-si-tan], está as [sta], and estaba as [sta-ȕa], etcetera. In some cases the omission of unstressed [e] appears to be nearly categorical. Omission of unstressed vowels also affects [a], as in malamente, pronounced as [mal-men-te]. Another feature found in Mexican and Mexican American Spanish the pronunciation of /f/ as [x], primarily before the diphthong ue, as in juerte (cf. fuerte) (Hidalgo 1987, p.181, Lipski 2008, p.96 and Parodi 2011, p.224). We find numerous [x] before ue, as in (1) and (2).
8 Daniel J. Villa, Naomi Lapidus Shin & Eva Robles Nagata
(1) …si uno lo sabe este, si uno lo sabe cuidar. Porque si uno no lo cuida, aquí a
uno pues lo meten a la cárcel o los echan pa’ juera y después ya no puede uno
estar aquí. [24] (2) Que cuando yo me crié pus jue una vida muy triste que a naiden se la deseo.
[10]
We also find [x] before u and e, as in (3) and (4).
(3) Y yo pos siempre salía, le decía a mi señora: “mira va a venir julano o su
señora y le das tantas medidas de maíz y les das un puño de frijol, regálales un
puño n-no tienen.” [4] (4) “¿Quiere que yo la bañe a usted?” “Ah muchacha, ¿cómo me vas a bañar? Yo
ya ‘toy viejita” dice, “ya estoy jedionda.” [10] In terms of morphology, we find the first person plural morpheme –nos (cf. –mos), known to be common in Mexican and Mexican-American varieties (Bills & Ornstein 1976, p.12, Hidalgo 1987, p.183, Ornstein 1972, p.80 and Parodi 2011, pp.224-225), as in íbanos, mirábanos, sabíanos, creíanos, and teníanos, as in (5). (5) Llegábanos con una bolita asina, mire de dinero ….[10]
We also find extensive use of second person preterit forms with the final-word morpheme –s, a feature that has been extensively documented in Mexican and Mexican-American varieties is (Hidalgo 1987, p.183, Lozano 1977, p.16 and Parodi 2011, p.224). Examples of this tendency are in (6) and (7).
(6) …llegaba y ya tenía ya ranchos ya conocidos y pos: “¿ya vinites?” “Sí ya
vine.” [4]
(7) ¿Para eso me trajites? [10]
Another common phenomenon of Mexican and Mexican-American varieties is the retention of so-called archaic or alternate verb forms (Bills & Ornstein 1976, p.12, Hidalgo 1987 and Lozano 1977). We find numerous examples of these, illustrated here in (8)-(10). (8) Ud. se casa, se enamora nomás porque a veces Ud. lo vido en un baile, en una
fiesta… [10]
La nueva frontera: Spanish-Speaking Populations in Central Washington 9
(9) Me levanté, gané y me fui entonces vide a una señora que venía ahí pa’ el otro
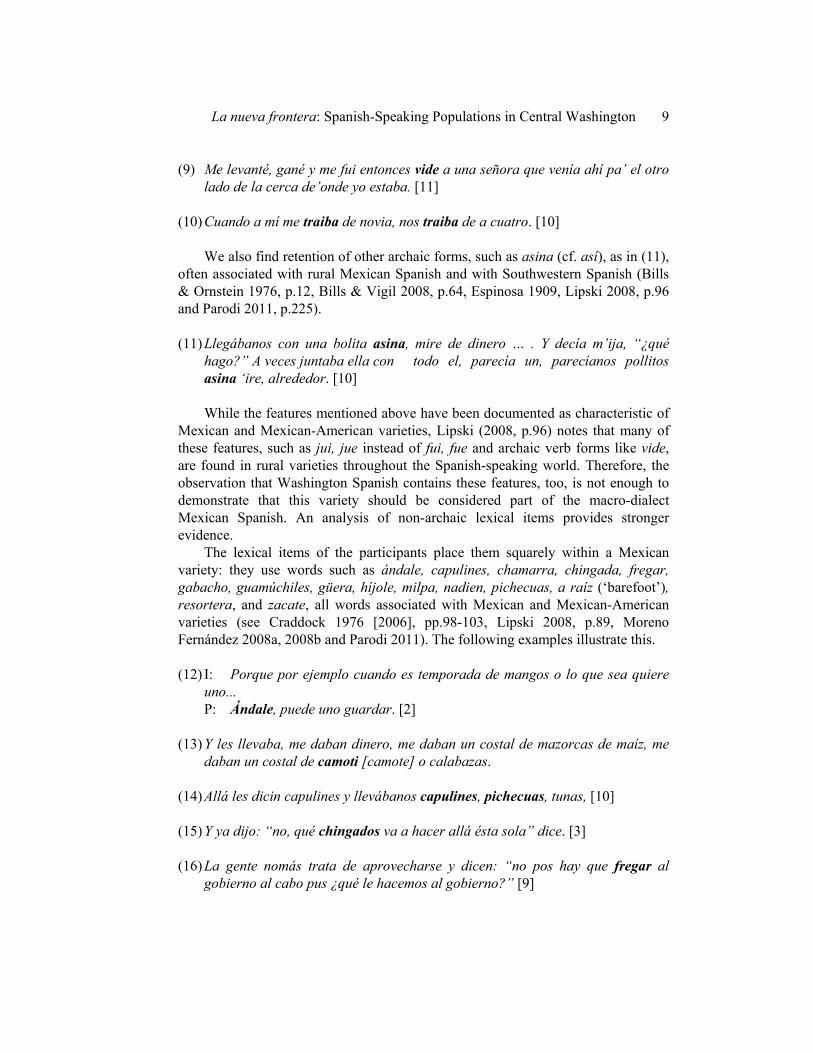
lado de la cerca de’onde yo estaba. [11] (10) Cuando a mí me traiba de novia, nos traiba de a cuatro. [10] We also find retention of other archaic forms, such as asina (cf. así), as in (11), often associated with rural Mexican Spanish and with Southwestern Spanish (Bills & Ornstein 1976, p.12, Bills & Vigil 2008, p.64, Espinosa 1909, Lipski 2008, p.96 and Parodi 2011, p.225). (11) Llegábanos con una bolita asina, mire de dinero … . Y decía m’ija, “¿qué
hago?” A veces juntaba ella con todo el, parecía un, parecíanos pollitos
asina ‘ire, alrededor. [10]
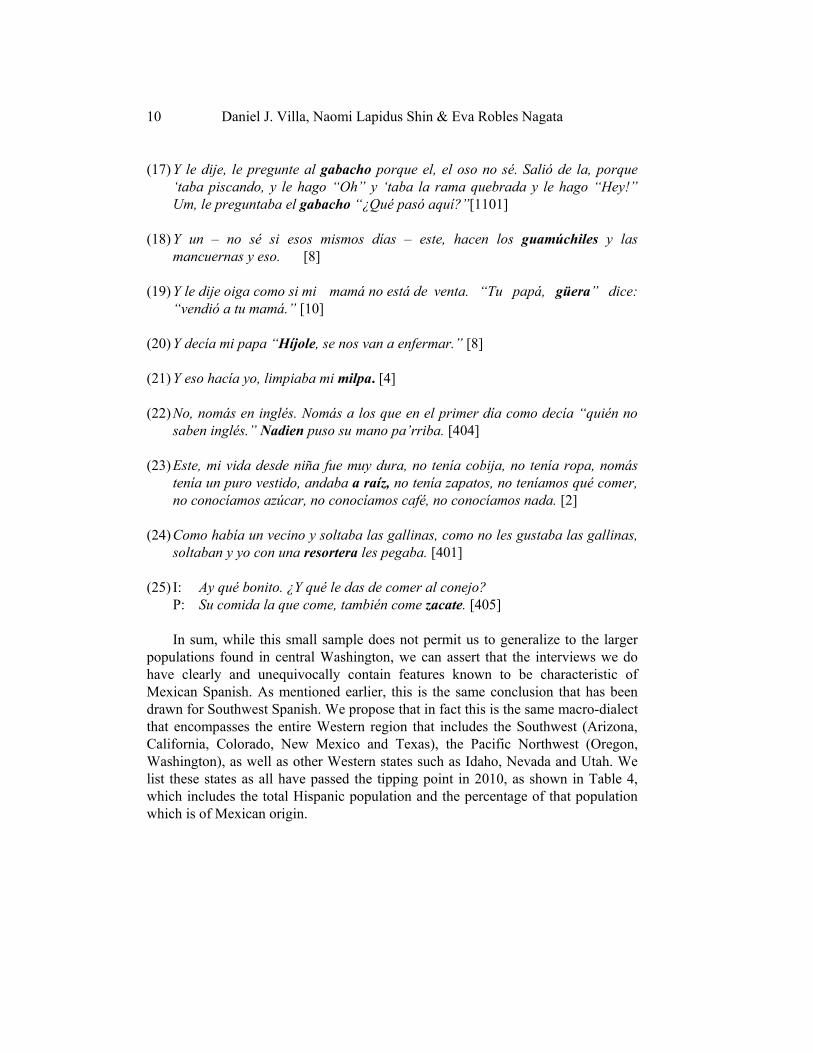
While the features mentioned above have been documented as characteristic of Mexican and Mexican-American varieties, Lipski (2008, p.96) notes that many of these features, such as jui, jue instead of fui, fue and archaic verb forms like vide, are found in rural varieties throughout the Spanish-speaking world. Therefore, the observation that Washington Spanish contains these features, too, is not enough to demonstrate that this variety should be considered part of the macro-dialect Mexican Spanish. An analysis of non-archaic lexical items provides stronger evidence. The lexical items of the participants place them squarely within a Mexican variety: they use words such as ándale, capulines, chamarra, chingada, fregar,
gabacho, guamúchiles, güera, híjole, milpa, nadien, pichecuas, a raíz (‘barefoot’), resortera, and zacate, all words associated with Mexican and Mexican-American varieties (see Craddock 1976 [2006], pp.98-103, Lipski 2008, p.89, Moreno Fernández 2008a, 2008b and Parodi 2011). The following examples illustrate this. (12) I: Porque por ejemplo cuando es temporada de mangos o lo que sea quiere
uno...
P: Ándale, puede uno guardar. [2]
(13) Y les llevaba, me daban dinero, me daban un costal de mazorcas de maíz, me
daban un costal de camoti [camote] o calabazas.
(14) Allá les dicin capulines y llevábanos capulines, pichecuas, tunas, [10]
(15) Y ya dijo: “no, qué chingados va a hacer allá ésta sola” dice. [3] (16) La gente nomás trata de aprovecharse y dicen: “no pos hay que fregar al
gobierno al cabo pus ¿qué le hacemos al gobierno?” [9]
10 Daniel J. Villa, Naomi Lapidus Shin & Eva Robles Nagata
(17) Y le dije, le pregunte al gabacho porque el, el oso no sé. Salió de la, porque
‘taba piscando, y le hago “Oh” y ‘taba la rama quebrada y le hago “Hey!”
Um, le preguntaba el gabacho “¿Qué pasó aquí?”[1101] (18) Y un – no sé si esos mismos días – este, hacen los guamúchiles y las
mancuernas y eso. [8] (19) Y le dije oiga como si mi mamá no está de venta. “Tu papá, güera” dice:
“vendió a tu mamá.” [10] (20) Y decía mi papa “Híjole, se nos van a enfermar.” [8] (21) Y eso hacía yo, limpiaba mi milpa. [4] (22) No, nomás en inglés. Nomás a los que en el primer día como decía “quién no
saben inglés.” Nadien puso su mano pa’rriba. [404] (23) Este, mi vida desde niña fue muy dura, no tenía cobija, no tenía ropa, nomás
tenía un puro vestido, andaba a raíz, no tenía zapatos, no teníamos qué comer,
no conocíamos azúcar, no conocíamos café, no conocíamos nada. [2] (24) Como había un vecino y soltaba las gallinas, como no les gustaba las gallinas,
soltaban y yo con una resortera les pegaba. [401] (25) I: Ay qué bonito. ¿Y qué le das de comer al conejo?
P: Su comida la que come, también come zacate. [405]
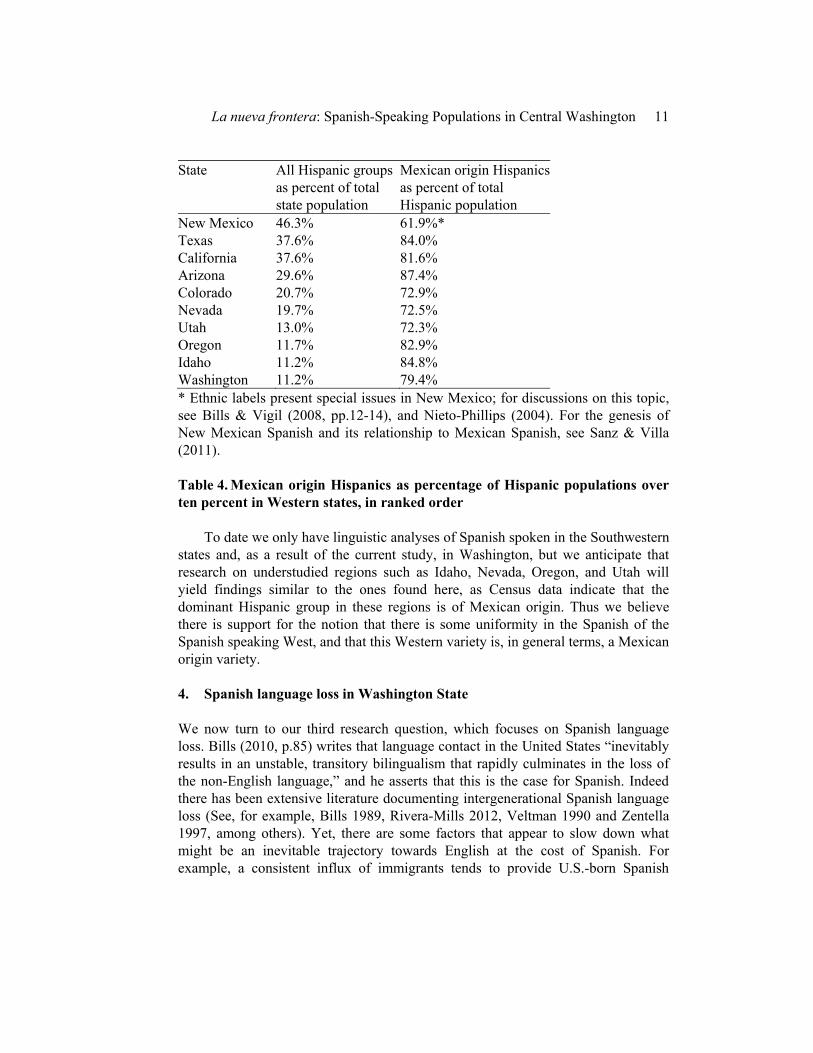
In sum, while this small sample does not permit us to generalize to the larger populations found in central Washington, we can assert that the interviews we do have clearly and unequivocally contain features known to be characteristic of Mexican Spanish. As mentioned earlier, this is the same conclusion that has been drawn for Southwest Spanish. We propose that in fact this is the same macro-dialect that encompasses the entire Western region that includes the Southwest (Arizona, California, Colorado, New Mexico and Texas), the Pacific Northwest (Oregon, Washington), as well as other Western states such as Idaho, Nevada and Utah. We list these states as all have passed the tipping point in 2010, as shown in Table 4, which includes the total Hispanic population and the percentage of that population which is of Mexican origin.
La nueva frontera: Spanish-Speaking Populations in Central Washington 11
State All Hispanic groups as percent of total state population
Mexican origin Hispanics as percent of total Hispanic population
New Mexico 46.3% 61.9%* Texas 37.6% 84.0% California 37.6% 81.6% Arizona 29.6% 87.4% Colorado 20.7% 72.9% Nevada 19.7% 72.5% Utah 13.0% 72.3% Oregon 11.7% 82.9% Idaho 11.2% 84.8% Washington 11.2% 79.4% * Ethnic labels present special issues in New Mexico; for discussions on this topic, see Bills & Vigil (2008, pp.12-14), and Nieto-Phillips (2004). For the genesis of New Mexican Spanish and its relationship to Mexican Spanish, see Sanz & Villa (2011). Table 4. Mexican origin Hispanics as percentage of Hispanic populations over ten percent in Western states, in ranked order
To date we only have linguistic analyses of Spanish spoken in the Southwestern states and, as a result of the current study, in Washington, but we anticipate that research on understudied regions such as Idaho, Nevada, Oregon, and Utah will yield findings similar to the ones found here, as Census data indicate that the dominant Hispanic group in these regions is of Mexican origin. Thus we believe there is support for the notion that there is some uniformity in the Spanish of the Spanish speaking West, and that this Western variety is, in general terms, a Mexican origin variety. 4. Spanish language loss in Washington State We now turn to our third research question, which focuses on Spanish language loss. Bills (2010, p.85) writes that language contact in the United States “inevitably results in an unstable, transitory bilingualism that rapidly culminates in the loss of the non-English language,” and he asserts that this is the case for Spanish. Indeed there has been extensive literature documenting intergenerational Spanish language loss (See, for example, Bills 1989, Rivera-Mills 2012, Veltman 1990 and Zentella 1997, among others). Yet, there are some factors that appear to slow down what might be an inevitable trajectory towards English at the cost of Spanish. For example, a consistent influx of immigrants tends to provide U.S.-born Spanish
12 Daniel J. Villa, Naomi Lapidus Shin & Eva Robles Nagata
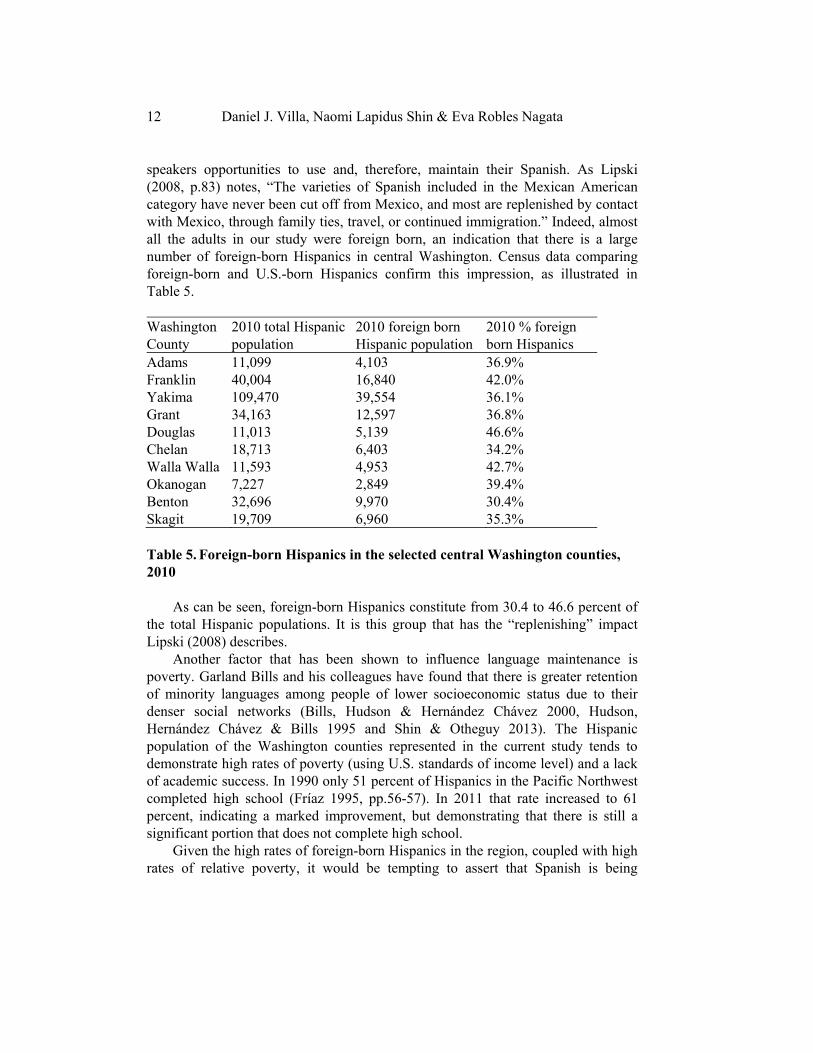
speakers opportunities to use and, therefore, maintain their Spanish. As Lipski (2008, p.83) notes, “The varieties of Spanish included in the Mexican American category have never been cut off from Mexico, and most are replenished by contact with Mexico, through family ties, travel, or continued immigration.” Indeed, almost all the adults in our study were foreign born, an indication that there is a large number of foreign-born Hispanics in central Washington. Census data comparing foreign-born and U.S.-born Hispanics confirm this impression, as illustrated in Table 5. Washington County
2010 total Hispanic population
2010 foreign born Hispanic population
2010 % foreign born Hispanics
Adams 11,099 4,103 36.9% Franklin 40,004 16,840 42.0% Yakima 109,470 39,554 36.1% Grant 34,163 12,597 36.8% Douglas 11,013 5,139 46.6% Chelan 18,713 6,403 34.2% Walla Walla 11,593 4,953 42.7% Okanogan 7,227 2,849 39.4% Benton 32,696 9,970 30.4% Skagit 19,709 6,960 35.3% Table 5. Foreign-born Hispanics in the selected central Washington counties, 2010
As can be seen, foreign-born Hispanics constitute from 30.4 to 46.6 percent of the total Hispanic populations. It is this group that has the “replenishing” impact Lipski (2008) describes. Another factor that has been shown to influence language maintenance is poverty. Garland Bills and his colleagues have found that there is greater retention of minority languages among people of lower socioeconomic status due to their denser social networks (Bills, Hudson & Hernández Chávez 2000, Hudson, Hernández Chávez & Bills 1995 and Shin & Otheguy 2013). The Hispanic population of the Washington counties represented in the current study tends to demonstrate high rates of poverty (using U.S. standards of income level) and a lack of academic success. In 1990 only 51 percent of Hispanics in the Pacific Northwest completed high school (Fríaz 1995, pp.56-57). In 2011 that rate increased to 61 percent, indicating a marked improvement, but demonstrating that there is still a significant portion that does not complete high school. Given the high rates of foreign-born Hispanics in the region, coupled with high rates of relative poverty, it would be tempting to assert that Spanish is being

La nueva frontera: Spanish-Speaking Populations in Central Washington 13
maintained in central Washington. However, a comparison of self-reported language use numbers in 2000 and 2010 paints a different picture. Table 6 presents the percentage of Spanish speakers of the total Hispanic populations in 2000 and 2010. Washington County
2000 total Hispanic population
No. of Spanish speakers
% Spanish speakers of total Hispanic population
2010 total Hispanic population
No. of Spanish speakers
% Spanish speakers of total Hispanic population
Adams 7,732 6,162 79.6% 11,099 7,478 67.3% Franklin 23,032 18,376 79.7% 40,004 28,019 70.0% Yakima 79,905 60,533 75.7% 109,470 79,122 72.2% Grant 22,476 17,188 76.4% 34,163 22,775 66.3% Douglas 6,433 5,268 81.8% 11,013 8,229 74.7% Chelan 12,831 11,153 86.9% 18,713 13,158 70.3% Walla Walla 8,654 6,947 80.2% 11,593 8,935 77.0% Okanogan 5,688 4,695 82.5% 7,227 5,249 72.6% Benton 17,806 13,425 75.3% 32,696 20,551 62.8% Skagit 11,536 8,255 71.5% 19,709 12,422 63.0% Table 6. Percentage of Spanish speakers of the total Hispanic population, 2000 and 2010
As can be observed, in 2000 the percentages of Spanish speaking Hispanics were relatively high in all counties. At the same time, we do observe incipient language loss. There is no county in which 100 percent of the Hispanics spoke Spanish at home. In other words, in all counties at least some portion of the Hispanic population spoke English at home. In 2010 the percentage of Spanish-speaking Hispanics remains relatively high, with a low of 62.8 percent in Benton County, and a high of 77 percent in Walla Walla. A comparison of the 2010 figures with those of 2000 shows that the number of Spanish speakers increased in all counties. But given that the Hispanic population grew as well, the increase in number of Spanish speakers is an artifact of the growing population, and not necessarily an indication of Spanish language maintenance among the more established Hispanic communities. In fact, a comparison of the percentage of Spanish speakers out of the total number of Hispanics, presented in Table 7, shows a decrease in the rate of Spanish-speaking Hispanics.
14 Daniel J. Villa, Naomi Lapidus Shin & Eva Robles Nagata
Washington County
2000 % Spanish speakers of total Hispanic population
2010 % Spanish speakers of total Hispanic population
Percentage-point decrease in Spanish-speaking Hispanics, 2000-2010
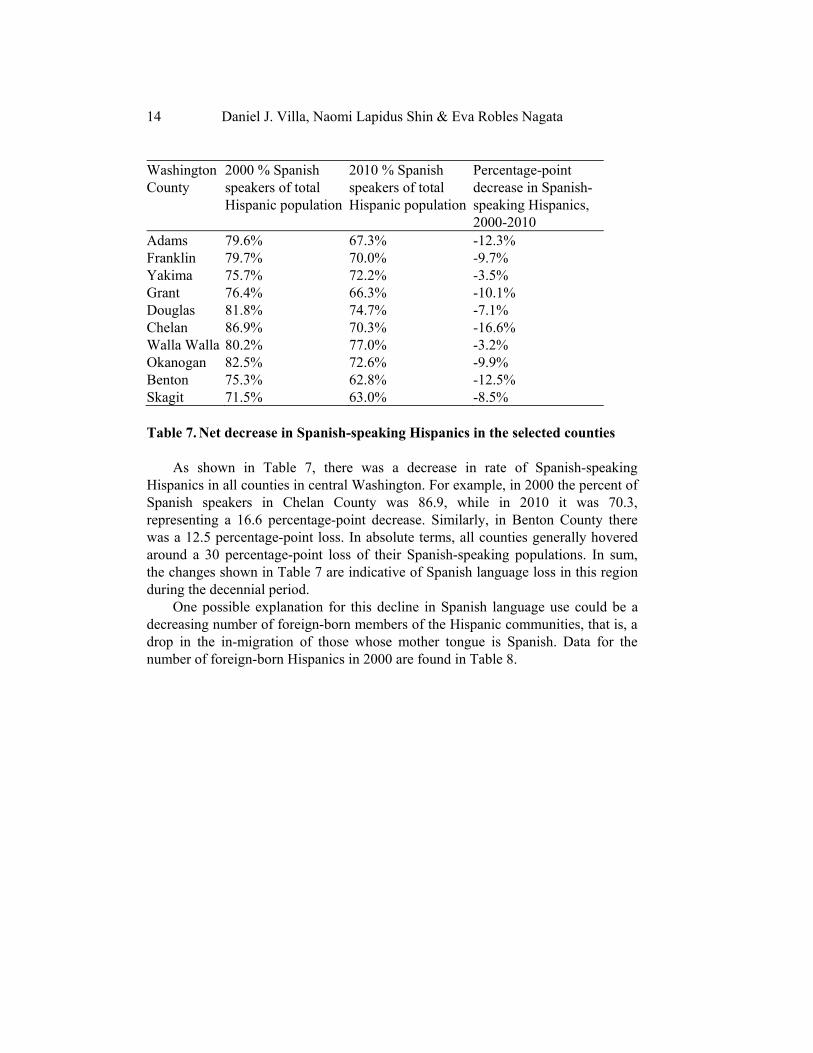
Adams 79.6% 67.3% -12.3% Franklin 79.7% 70.0% -9.7% Yakima 75.7% 72.2% -3.5% Grant 76.4% 66.3% -10.1% Douglas 81.8% 74.7% -7.1% Chelan 86.9% 70.3% -16.6% Walla Walla 80.2% 77.0% -3.2% Okanogan 82.5% 72.6% -9.9% Benton 75.3% 62.8% -12.5% Skagit 71.5% 63.0% -8.5% Table 7. Net decrease in Spanish-speaking Hispanics in the selected counties
As shown in Table 7, there was a decrease in rate of Spanish-speaking Hispanics in all counties in central Washington. For example, in 2000 the percent of Spanish speakers in Chelan County was 86.9, while in 2010 it was 70.3, representing a 16.6 percentage-point decrease. Similarly, in Benton County there was a 12.5 percentage-point loss. In absolute terms, all counties generally hovered around a 30 percentage-point loss of their Spanish-speaking populations. In sum, the changes shown in Table 7 are indicative of Spanish language loss in this region during the decennial period. One possible explanation for this decline in Spanish language use could be a decreasing number of foreign-born members of the Hispanic communities, that is, a drop in the in-migration of those whose mother tongue is Spanish. Data for the number of foreign-born Hispanics in 2000 are found in Table 8.
La nueva frontera: Spanish-Speaking Populations in Central Washington 15
Washington County
2000 total Hispanic population
2000 foreign born Hispanic population
2000 % foreign born
2010 % foreign born*
2000-2010decrease
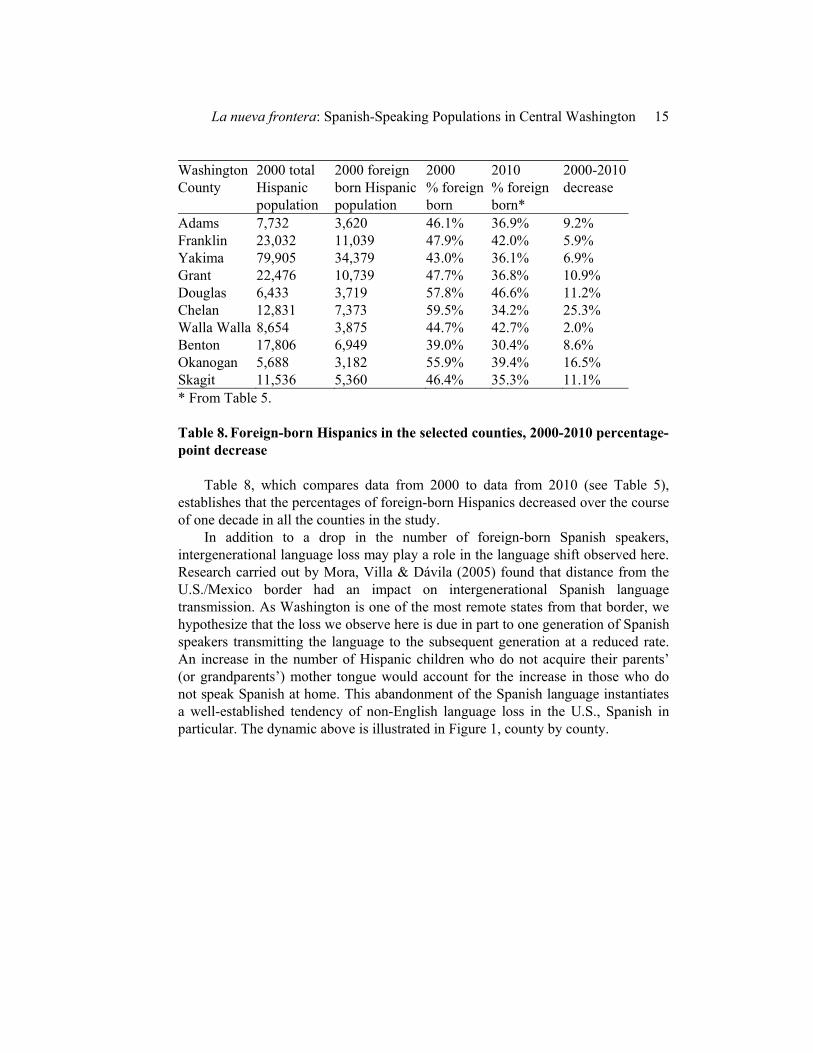
Adams 7,732 3,620 46.1% 36.9% 9.2% Franklin 23,032 11,039 47.9% 42.0% 5.9% Yakima 79,905 34,379 43.0% 36.1% 6.9% Grant 22,476 10,739 47.7% 36.8% 10.9% Douglas 6,433 3,719 57.8% 46.6% 11.2% Chelan 12,831 7,373 59.5% 34.2% 25.3% Walla Walla 8,654 3,875 44.7% 42.7% 2.0% Benton 17,806 6,949 39.0% 30.4% 8.6% Okanogan 5,688 3,182 55.9% 39.4% 16.5% Skagit 11,536 5,360 46.4% 35.3% 11.1% * From Table 5. Table 8. Foreign-born Hispanics in the selected counties, 2000-2010 percentage-point decrease
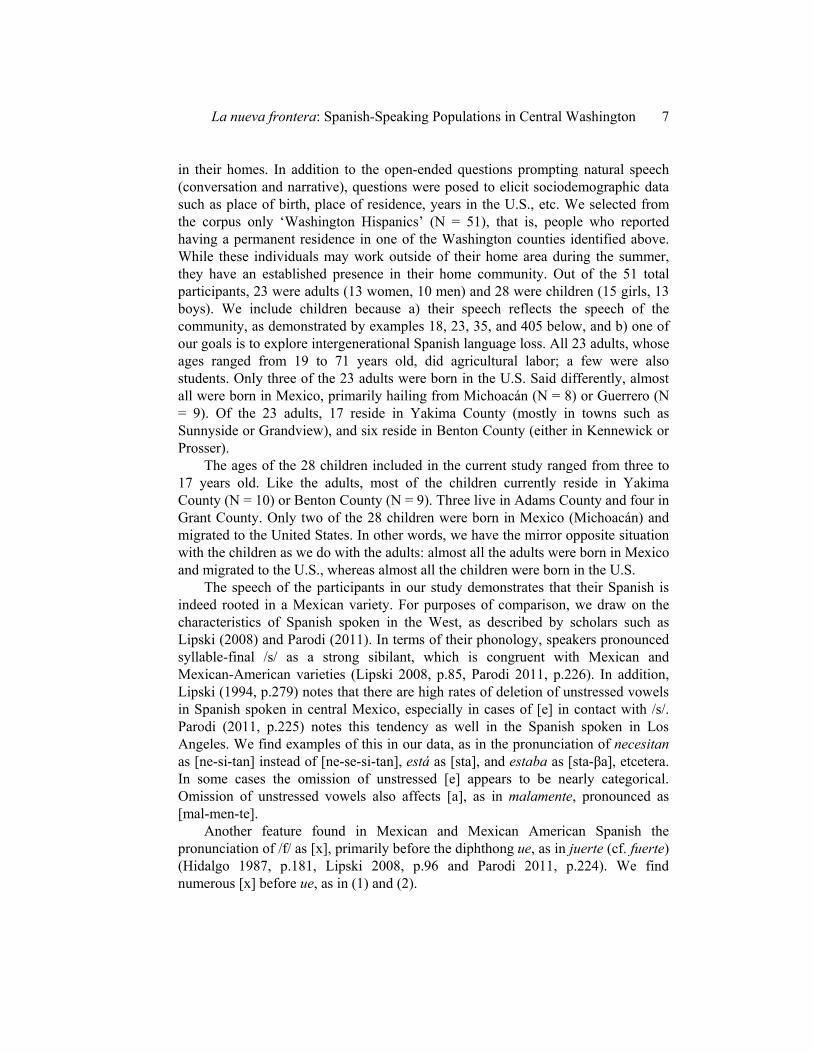
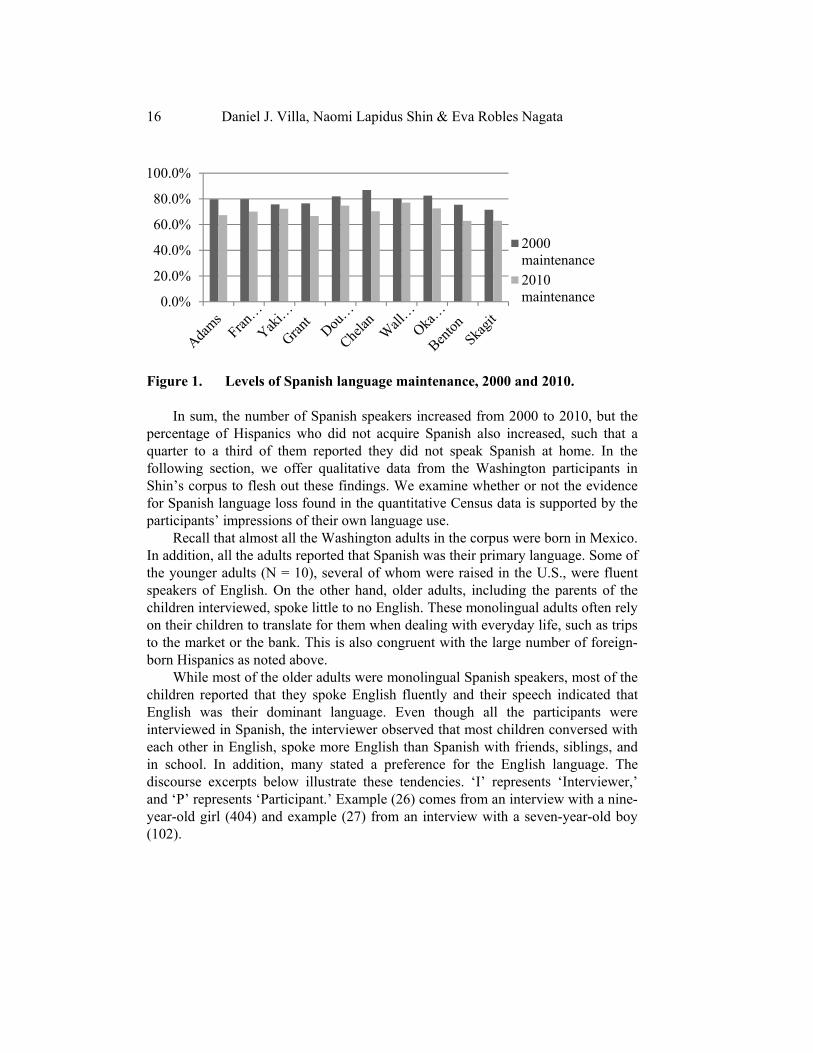
Table 8, which compares data from 2000 to data from 2010 (see Table 5), establishes that the percentages of foreign-born Hispanics decreased over the course of one decade in all the counties in the study. In addition to a drop in the number of foreign-born Spanish speakers, intergenerational language loss may play a role in the language shift observed here. Research carried out by Mora, Villa & Dávila (2005) found that distance from the U.S./Mexico border had an impact on intergenerational Spanish language transmission. As Washington is one of the most remote states from that border, we hypothesize that the loss we observe here is due in part to one generation of Spanish speakers transmitting the language to the subsequent generation at a reduced rate. An increase in the number of Hispanic children who do not acquire their parents’ (or grandparents’) mother tongue would account for the increase in those who do not speak Spanish at home. This abandonment of the Spanish language instantiates a well-established tendency of non-English language loss in the U.S., Spanish in particular. The dynamic above is illustrated in Figure 1, county by county.
16 Daniel J. Villa, Naomi Lapidus Shin & Eva Robles Nagata
0.0%
20.0%
40.0%
60.0%
80.0%
100.0%
2000maintenance2010maintenance
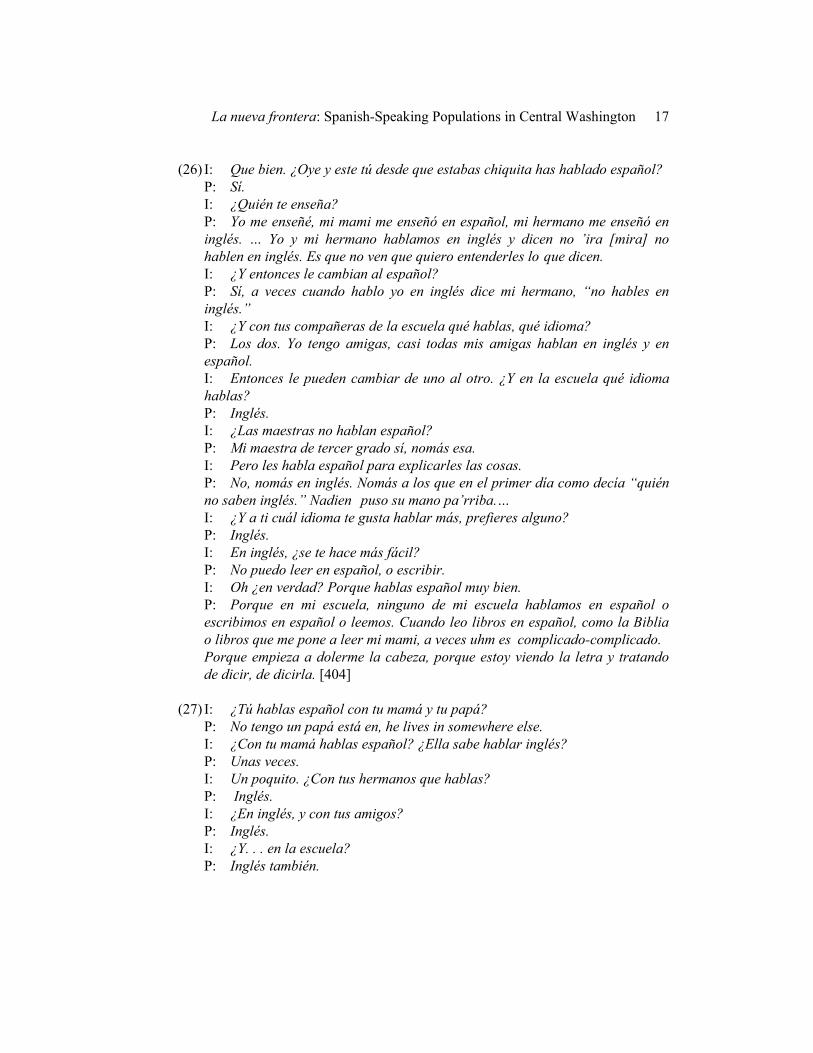
Figure 1. Levels of Spanish language maintenance, 2000 and 2010. In sum, the number of Spanish speakers increased from 2000 to 2010, but the percentage of Hispanics who did not acquire Spanish also increased, such that a quarter to a third of them reported they did not speak Spanish at home. In the following section, we offer qualitative data from the Washington participants in Shin’s corpus to flesh out these findings. We examine whether or not the evidence for Spanish language loss found in the quantitative Census data is supported by the participants’ impressions of their own language use. Recall that almost all the Washington adults in the corpus were born in Mexico. In addition, all the adults reported that Spanish was their primary language. Some of the younger adults (N = 10), several of whom were raised in the U.S., were fluent speakers of English. On the other hand, older adults, including the parents of the children interviewed, spoke little to no English. These monolingual adults often rely on their children to translate for them when dealing with everyday life, such as trips to the market or the bank. This is also congruent with the large number of foreign-born Hispanics as noted above. While most of the older adults were monolingual Spanish speakers, most of the children reported that they spoke English fluently and their speech indicated that English was their dominant language. Even though all the participants were interviewed in Spanish, the interviewer observed that most children conversed with each other in English, spoke more English than Spanish with friends, siblings, and in school. In addition, many stated a preference for the English language. The discourse excerpts below illustrate these tendencies. ‘I’ represents ‘Interviewer,’ and ‘P’ represents ‘Participant.’ Example (26) comes from an interview with a nine-year-old girl (404) and example (27) from an interview with a seven-year-old boy (102).
La nueva frontera: Spanish-Speaking Populations in Central Washington 17
(26) I: Que bien. ¿Oye y este tú desde que estabas chiquita has hablado español?
P: Sí.
I: ¿Quién te enseña?
P: Yo me enseñé, mi mami me enseñó en español, mi hermano me enseñó en
inglés. … Yo y mi hermano hablamos en inglés y dicen no ’ira [mira] no
hablen en inglés. Es que no ven que quiero entenderles lo que dicen.
I: ¿Y entonces le cambian al español?
P: Sí, a veces cuando hablo yo en inglés dice mi hermano, “no hables en
inglés.”
I: ¿Y con tus compañeras de la escuela qué hablas, qué idioma?
P: Los dos. Yo tengo amigas, casi todas mis amigas hablan en inglés y en
español.
I: Entonces le pueden cambiar de uno al otro. ¿Y en la escuela qué idioma
hablas?
P: Inglés.
I: ¿Las maestras no hablan español?
P: Mi maestra de tercer grado sí, nomás esa.
I: Pero les habla español para explicarles las cosas.
P: No, nomás en inglés. Nomás a los que en el primer día como decía “quién
no saben inglés.” Nadien puso su mano pa’rriba.…
I: ¿Y a ti cuál idioma te gusta hablar más, prefieres alguno?
P: Inglés.
I: En inglés, ¿se te hace más fácil?
P: No puedo leer en español, o escribir.
I: Oh ¿en verdad? Porque hablas español muy bien.
P: Porque en mi escuela, ninguno de mi escuela hablamos en español o
escribimos en español o leemos. Cuando leo libros en español, como la Biblia
o libros que me pone a leer mi mami, a veces uhm es complicado-complicado.
Porque empieza a dolerme la cabeza, porque estoy viendo la letra y tratando
de dicir, de dicirla. [404]
(27) I: ¿Tú hablas español con tu mamá y tu papá?
P: No tengo un papá está en, he lives in somewhere else.
I: ¿Con tu mamá hablas español? ¿Ella sabe hablar inglés?
P: Unas veces.
I: Un poquito. ¿Con tus hermanos que hablas?
P: Inglés.
I: ¿En inglés, y con tus amigos?
P: Inglés.
I: ¿Y. . . en la escuela?
P: Inglés también.
18 Daniel J. Villa, Naomi Lapidus Shin & Eva Robles Nagata
I: ¿Este y algunas veces entonces nada más con tu mamá te toca hablar
español a veces? ¿Qué te gusta más hablar, español o inglés?
P: Mmm inglés. [102]
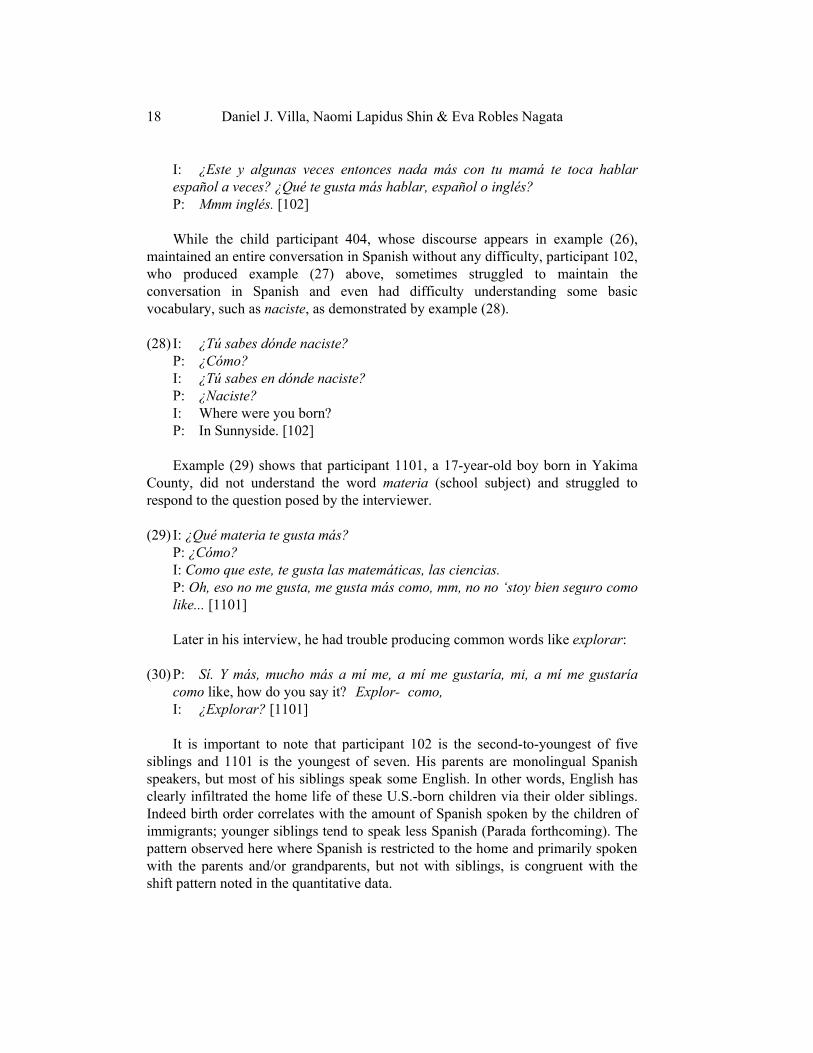
While the child participant 404, whose discourse appears in example (26), maintained an entire conversation in Spanish without any difficulty, participant 102, who produced example (27) above, sometimes struggled to maintain the conversation in Spanish and even had difficulty understanding some basic vocabulary, such as naciste, as demonstrated by example (28).
(28) I: ¿Tú sabes dónde naciste?
P: ¿Cómo?
I: ¿Tú sabes en dónde naciste?
P: ¿Naciste?
I: Where were you born? P: In Sunnyside. [102]
Example (29) shows that participant 1101, a 17-year-old boy born in Yakima County, did not understand the word materia (school subject) and struggled to respond to the question posed by the interviewer. (29) I: ¿Qué materia te gusta más? P: ¿Cómo? I: Como que este, te gusta las matemáticas, las ciencias.
P: Oh, eso no me gusta, me gusta más como, mm, no no ‘stoy bien seguro como
like... [1101]
Later in his interview, he had trouble producing common words like explorar:
(30) P: Sí. Y más, mucho más a mí me, a mí me gustaría, mi, a mí me gustaría
como like, how do you say it? Explor- como,
I: ¿Explorar? [1101]
It is important to note that participant 102 is the second-to-youngest of five siblings and 1101 is the youngest of seven. His parents are monolingual Spanish speakers, but most of his siblings speak some English. In other words, English has clearly infiltrated the home life of these U.S.-born children via their older siblings. Indeed birth order correlates with the amount of Spanish spoken by the children of immigrants; younger siblings tend to speak less Spanish (Parada forthcoming). The pattern observed here where Spanish is restricted to the home and primarily spoken with the parents and/or grandparents, but not with siblings, is congruent with the shift pattern noted in the quantitative data.
La nueva frontera: Spanish-Speaking Populations in Central Washington 19
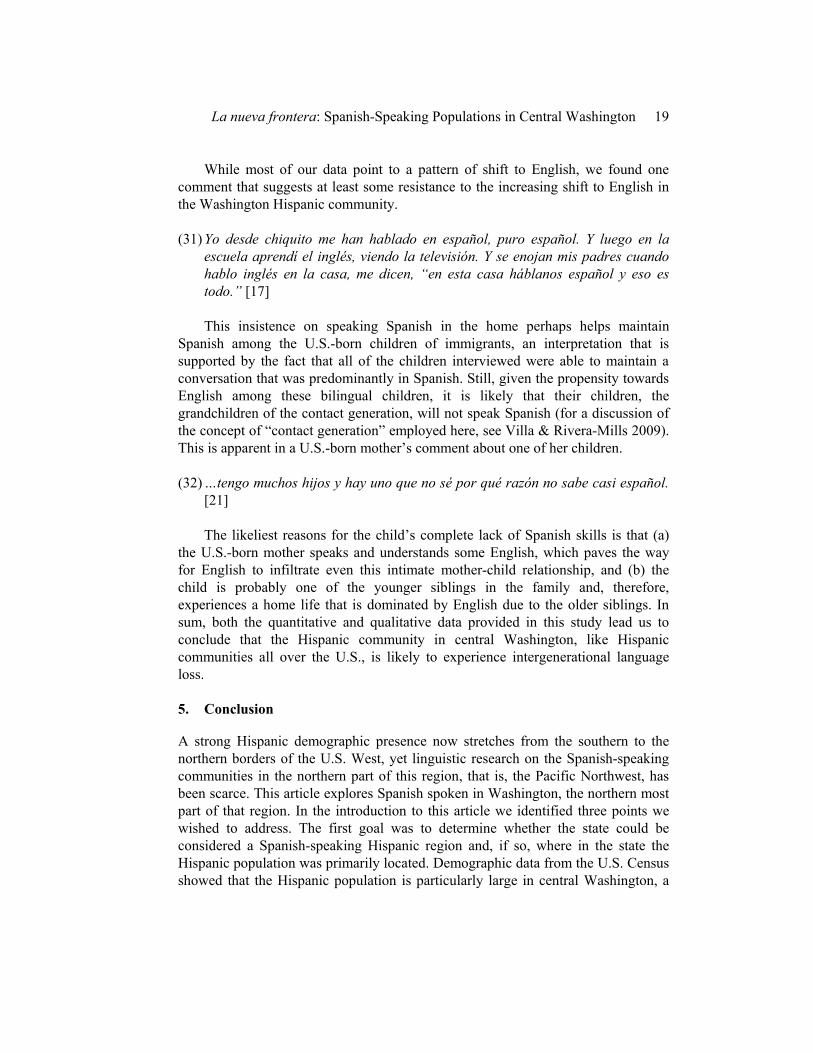
While most of our data point to a pattern of shift to English, we found one comment that suggests at least some resistance to the increasing shift to English in the Washington Hispanic community. (31) Yo desde chiquito me han hablado en español, puro español. Y luego en la
escuela aprendí el inglés, viendo la televisión. Y se enojan mis padres cuando
hablo inglés en la casa, me dicen, “en esta casa háblanos español y eso es
todo.” [17]
This insistence on speaking Spanish in the home perhaps helps maintain Spanish among the U.S.-born children of immigrants, an interpretation that is supported by the fact that all of the children interviewed were able to maintain a conversation that was predominantly in Spanish. Still, given the propensity towards English among these bilingual children, it is likely that their children, the grandchildren of the contact generation, will not speak Spanish (for a discussion of the concept of “contact generation” employed here, see Villa & Rivera-Mills 2009). This is apparent in a U.S.-born mother’s comment about one of her children.
(32) …tengo muchos hijos y hay uno que no sé por qué razón no sabe casi español.
[21]
The likeliest reasons for the child’s complete lack of Spanish skills is that (a) the U.S.-born mother speaks and understands some English, which paves the way for English to infiltrate even this intimate mother-child relationship, and (b) the child is probably one of the younger siblings in the family and, therefore, experiences a home life that is dominated by English due to the older siblings. In sum, both the quantitative and qualitative data provided in this study lead us to conclude that the Hispanic community in central Washington, like Hispanic communities all over the U.S., is likely to experience intergenerational language loss. 5. Conclusion
A strong Hispanic demographic presence now stretches from the southern to the northern borders of the U.S. West, yet linguistic research on the Spanish-speaking communities in the northern part of this region, that is, the Pacific Northwest, has been scarce. This article explores Spanish spoken in Washington, the northern most part of that region. In the introduction to this article we identified three points we wished to address. The first goal was to determine whether the state could be considered a Spanish-speaking Hispanic region and, if so, where in the state the Hispanic population was primarily located. Demographic data from the U.S. Census showed that the Hispanic population is particularly large in central Washington, a
20 Daniel J. Villa, Naomi Lapidus Shin & Eva Robles Nagata
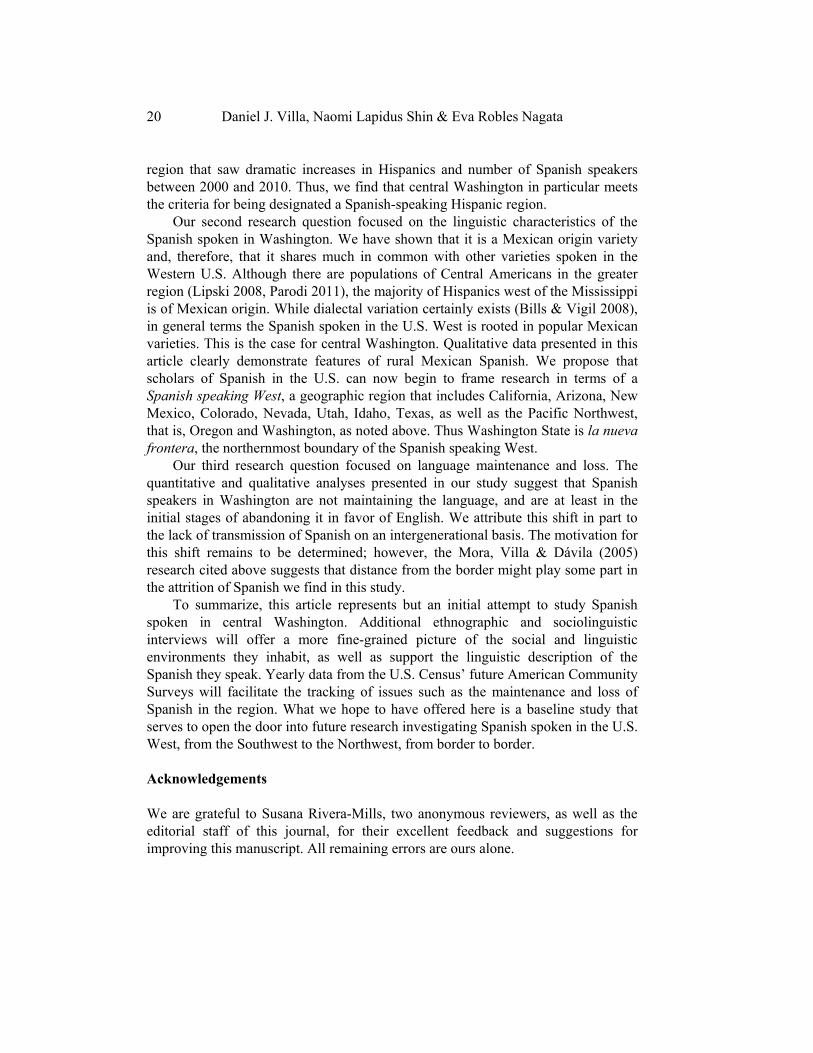
region that saw dramatic increases in Hispanics and number of Spanish speakers between 2000 and 2010. Thus, we find that central Washington in particular meets the criteria for being designated a Spanish-speaking Hispanic region.
Our second research question focused on the linguistic characteristics of the Spanish spoken in Washington. We have shown that it is a Mexican origin variety and, therefore, that it shares much in common with other varieties spoken in the Western U.S. Although there are populations of Central Americans in the greater region (Lipski 2008, Parodi 2011), the majority of Hispanics west of the Mississippi is of Mexican origin. While dialectal variation certainly exists (Bills & Vigil 2008), in general terms the Spanish spoken in the U.S. West is rooted in popular Mexican varieties. This is the case for central Washington. Qualitative data presented in this article clearly demonstrate features of rural Mexican Spanish. We propose that scholars of Spanish in the U.S. can now begin to frame research in terms of a Spanish speaking West, a geographic region that includes California, Arizona, New Mexico, Colorado, Nevada, Utah, Idaho, Texas, as well as the Pacific Northwest, that is, Oregon and Washington, as noted above. Thus Washington State is la nueva
frontera, the northernmost boundary of the Spanish speaking West. Our third research question focused on language maintenance and loss. The
quantitative and qualitative analyses presented in our study suggest that Spanish speakers in Washington are not maintaining the language, and are at least in the initial stages of abandoning it in favor of English. We attribute this shift in part to the lack of transmission of Spanish on an intergenerational basis. The motivation for this shift remains to be determined; however, the Mora, Villa & Dávila (2005) research cited above suggests that distance from the border might play some part in the attrition of Spanish we find in this study.
To summarize, this article represents but an initial attempt to study Spanish spoken in central Washington. Additional ethnographic and sociolinguistic interviews will offer a more fine-grained picture of the social and linguistic environments they inhabit, as well as support the linguistic description of the Spanish they speak. Yearly data from the U.S. Census’ future American Community Surveys will facilitate the tracking of issues such as the maintenance and loss of Spanish in the region. What we hope to have offered here is a baseline study that serves to open the door into future research investigating Spanish spoken in the U.S. West, from the Southwest to the Northwest, from border to border. Acknowledgements We are grateful to Susana Rivera-Mills, two anonymous reviewers, as well as the editorial staff of this journal, for their excellent feedback and suggestions for improving this manuscript. All remaining errors are ours alone.
La nueva frontera: Spanish-Speaking Populations in Central Washington 21
Note 1 We thank Humanities Montana and the University of Montana for funding the
development of Naomi Shin’s corpus. Interviews were conducted and transcribed by Eva Nagata with help from several students at the University of Montana: Jackelyn Torres Van Buren, Cassandra García, Alysa Kelly, Kate Little, Charo Loa, and Kristin Thomas.
References Bills, Garland D. 1989. The U.S. Census of 1980 and Spanish in the Southwest.
International Journal of the Sociology of Language 79, 11-28. Bills, Garland D. 2010. Whither Southwest Spanish? Issues in the assessment of
maintenance or loss. In Susana V. Rivera-Mills & Daniel J. Villa (eds.), Spanish of the U.S. Southwest: A language in transition, 85-93. Madrid/Frankfurt: Iberoamericana/Vervuert.
Bills, Garland D., Alan Hudson & Eduardo Hernández Chávez. 2000. Spanish home language use and English proficiency as differential measures of language maintenance and shift. Southwest Journal of Linguistics 19(1), 11-27.
Bills, Garland D. & Jacob Ornstein. 1976. Linguistic diversity in Southwest Spanish. In J. Donald Bowen & Jacob Ornstein (eds.), Studies in Southwest Spanish, 4-16. Rowley: Newbury House.
Bills, Garland D. & Neddy Vigil. 2008. The Spanish language of New Mexico and Southern Colorado: A linguistic atlas. Albuquerque: University of New Mexico Press.
Craddock, Jerry. 1976 [2006]. Lexical analysis of Southwest Spanish. In Donald Bowen & Jacob Ornstein (eds.), Studies in Southwest Spanish, 45-70. Rowley, MA: Newbury House. [Reprinted in 2006. Romance Philology 60, 93-125.]
Espinosa, Aurelio M. 1909. Studies in New Mexican Spanish. Part 1: Phonology. University of New Mexico Bulletin/Language series 1(2), 47-162.
Flores-Ferrán, Nydia. 2009. Are you referring to me? The variable use of UNO and YO in oral discourse. Journal of Pragmatics 41, 1810-1824.
Fríaz, Guadalupe M. 1995. Latinos and Latinas in the Northwest: A demographic profile. In Carlos Maldonado & Gilberto García (eds.), The Chicano experience in the Northwest, 41-70. Iowa: Kendall/Hunt.
García, Jerry. 2005. Introduction. Beyond the Spanish moment: Mexicans in the Pacific Northwest. In Jerry García & Gilberto García (eds.), Memory, community, and activisim: Mexican migration and labor in the Pacific Northwest, 1-21. Michigan: Julian Samora Research Institute.
García, Mary Ellen. 1977. Chicano Spanish/Latin American Spanish: Some differences in lingusitic norms. Bilingual Review 4, 200-209.
22 Daniel J. Villa, Naomi Lapidus Shin & Eva Robles Nagata
Hidalgo, Margarita. 1987. Español mexicano y español chicano: problemas y propuestas fundamentales. Language Problems and Language Planning 11, 166-193.
Hudson, Alan, Eduardo Hernández Chávez & Garland D. Bills. 1995. The many faces of language maintenance: Spanish language claiming in five Southwestern states. In Carmen Silva-Corvalán (ed.), Spanish in four continents: Studies in language contact and bilingualism, 165-183. Washington, DC: Georgetown University Press.
Jenkins, Devin. 2009a. The cost of linguistic loyalty: Socioeconomic factors in the face of shifting demographic trends among Spanish speakers in the Southwest. Spanish in Context 6, 7-25.
Jenkins, Devin. 2009b. Spanish in the non-border Southwest. Paper presented at the annual meeting of the Linguistic Association of the Southwest 38, Brigham Young University, Utah.
Jenkins, Devin. 2013. Spanish on the map: Population growth and Spanish language maintenance in the United States. Paper presented at the 24th Conference on Spanish in the United States, McAllen, Texas.
Labov, William. 1984. Field methods of the project of linguistic change and variation. In John Baugh & Joel Scherzer (eds.), Language in use: Readings in sociolinguistics, 51-72. Englewood Cliffs: Prentice Hall.
Lipski, John M. 1994. Latin American Spanish. New York: Longman. Lipski, John M. 2008. Varieties of Spanish in the United States. Washington, DC:
Georgetown University Press. Lozano, Anthony. 1974. Grammatical notes on Chicano Spanish. Bilingual Review
1, 147-151. Lozano, Anthony. 1977. El español chicano y la dialectología. Aztlán 7, 13-18. Maldonado, Carlos S. 1995. An overview of the Mexicano/Chicano presence in the
Pacific Northwest. In Carlos Maldonado & Gilberto García (eds.), The Chicano experience in the Northwest, 1-40. Iowa: Kendall/Hunt.
Mora, Marie T., Daniel J. Villa & Alberto Dávila. 2005. Language maintenance among the children of immigrants: A comparison of border States with other regions of the U.S. Southwest Journal of Linguistics 24(1,2), 127-144.
Moreno Fernández, Francisco. 2008a. Caracterización del español patrimonial. In Humberto López Morales (coord.), Enciclopedia del español en los Estados Unidos, 179-199. Madrid: Instituto Cervantes-Santillana.
Moreno Fernández, Francisco. 2008b. Dialectología del español de los Estados Unidos. In Humberto López Morales (coord.), Enciclopedia del español en los Estados Unidos, 200-221. Madrid: Instituto Cervantes-Santillana.
Moyna, María Irene. 2010. Varieties of Spanish in post-annexation California (1848-1900). In Susana Rivera-Mills & Daniel J. Villa (eds.), Spanish of the U.S. Southwest: A language in transition, 27-44. Madrid/Frankfurt: Iberoamericana/Vervuert.
La nueva frontera: Spanish-Speaking Populations in Central Washington 23
Nieto-Phillips, John M. 2004. The language of blood: The making of Spanish-American identity in New Mexico, 1880s-1930s. Albuquerque: University of New Mexico Press.
Ornstein, Jacob. 1951. The archaic and the modern in the Spanish of New Mexico. Hispania 34, 137-142.
Ornstein, Jacob. 1972. Towards a classification of Southwest Spanish nonstandard variants. Linguistics 10(93), 70-87.
Otheguy, Ricardo & Ana Celia Zentella. 2012. Spanish in New York: Language contact, dialectal leveling, and structural continuity. Oxford: Oxford University Press.
Parada, MaryAnn. Forthcoming. Sibling variation and family language policy: The role of birth order in the Spanish proficiency and first names of second-generation Hispanics. To appear in the Journal of Language, Identity, and Education.
Parodi, Claudia. 2011. El otro México: Español chicano, koineización y diglosia en Los Ángeles, California. In Pedro Martín Butragueño (ed.), Realismo en el análisis de corpus orales: Primer coloquio de cambio y variación lingüística, 217-243. México, D.F.: El Colegio de México, Centro de Estudios Lingüísticos y Literarios.
Pedrero-González, Amalia. 2006. Diferencias léxicas entre el campo y la ciudad en el sudoeste de Estados Unidos (según las encuestas del Átlas lingüístico de Hispanoamérica). Revista Internacional de Lingüística Iberoamericana 4, 181-202.
Rivera-Mills, Susana V. 2010. Latinos or Hispanics? Changing demographics, implications, and continued diversity. Southwest Journal of Linguistics 28(2), 1-20.
Rivera-Mills, Susana V. 2011. Use of the voseo and Latino identity: An intergenerational study of Hondurans and Salvadorans in the western region of the U.S. In Luis A. Ortíz (ed.), Gibrán Delgado y Nadja Fúster (ed. assts.), Selected proceedings of the 13th Hispanic Linguistics Symposium, 94-106. Somerville: Cascadilla Press.
Rivera-Mills, Susana V. 2012. Spanish heritage language maintenance: Its legacy and its future. In Sara Beaudrie & Marta Fairclough (eds.), Spanish as a heritage language in the U.S.: The state of the science, 26-64. Washington, DC: Georgetown University Press.
Rivera-Mills, Susana V. & Octaviano Merecías-Cuevas. 2010. Language maintenance and shift among speakers of Mixteco in Oregon. In Susana V. Rivera-Mills & Juan Antonio Trujillo (eds.), Building communities and making connections, 98-118. Newcastle upon Tyne: Cambridge Scholars.
Sanz, Israel & Daniel J. Villa. 2011. The genesis of Traditional New Mexican Spanish: The emergence of a unique dialect in the Americas. Studies in Hispanic and Lusophone Linguistics 4, 417-442.
24 Daniel J. Villa, Naomi Lapidus Shin & Eva Robles Nagata
Shin, Naomi Lapidus & Ricardo Otheguy. Forthcoming. Social class and gender impacting change in bilingual settings: Spanish subject pronoun use in New York. Language in Society 42.
Silva-Corvalán, Carmen. 1994. Language contact and change: Spanish in Los Angeles. Oxford: Oxford University Press.
Veltman, Calvin. 1990. The status of the Spanish language in the United States at the beginning of the 21st century. International Migration Review 24, 108-123.
Villa, Daniel J. & Susana V. Rivera-Mills. 2009. An integrated multi-generational model for language maintenance and shift: The case of Spanish in the Southwest. Spanish in Context 6, 26-42.
Woods, Michael R. & Susana V. Rivera-Mills. 2010. Transnacionalismo del voseante: Salvadoreños y hondureños en los Estados Unidos. Lengua y migración 2, 97-112.
Woods, Michael R. & Susana V. Rivera-Mills. 2012. El tú como “mask:” Voseo and Salvadoran and Honduran identity in the United States. Studies in Hispanic and Lusophone Linguistics 5, 191-216.
Zentella, Ana Celia. 1997. Growing up bilingual. Cambridge, MA: Blackwell.