Community Innovation Survey 2008 Synthesis Quality Report
34
Community Innovation Survey 2008 Synthesis Quality Report
-
Upload
khangminh22 -
Category
Documents
-
view
1 -
download
0
Transcript of Community Innovation Survey 2008 Synthesis Quality Report
Community Innovation Survey 2008
Synthesis Quality Report
Table of contents Page
1 Introduction .............................................................................................................................................................1
2 Methodological overview ....................................................................................................................................1
3 Quality assessment ................................................................................................................................................8
3.1 Relevance........................................................................................................................................................................................8
3.1.1 User groups, user needs, user satisfaction ........................................................................................................8
3.1.2 Completeness..................................................................................................................................................................9
3.2 Accuracy....................................................................................................................................................................................... 10
3.2.1 Sampling errors .......................................................................................................................................................... 10
3.2.2 Coverage errors .......................................................................................................................................................... 11
3.2.3 Measurement errors................................................................................................................................................. 13
3.2.4 Processing errors ....................................................................................................................................................... 13
3.2.5 Non-response errors ................................................................................................................................................ 13
3.3 Timeliness and Punctuality ................................................................................................................................................. 16
3.4 Accessibility and Clarity........................................................................................................................................................ 17
3.5 Comparability ............................................................................................................................................................................ 18
3.5.1 Methodological deviations..................................................................................................................................... 18
3.5.2 Comparability over time......................................................................................................................................... 24
3.6 Coherence.................................................................................................................................................................................... 25
3.6.1 Coherence with Structural Business Statistics.............................................................................................. 25
4 Comparison with CIS 2006............................................................................................................................... 27
5 Conclusions............................................................................................................................................................ 32

1
1 Introduction
The present report is the synthesis of the national quality reports on CIS 2008 (version of 18th June
2012). It covers all aspects of quality as presented in the quality report template and makes an overall
assessment of the quality of the 2008 data collection on innovation statistics.
CIS 2008 was carried out in 31 countries, i.e. the 27 EU Member States, 3 EU Candidate countries (Croatia,
Iceland and Turkey) and Norway. Eurostat received 26 national quality reports, which are summarised in
the present synthesis.
The report is organised as follows: chapter 2 gives a short methodological overview of the production of
national CIS 2008 statistics. Chapter 3 makes an assessment of the quality of innovation statistics
according to the quality dimensions defined by Eurostat. Chapter 4 presents a comparison of the CIS 2008
with the previous data collection, CIS 2006, highlighting the improvements made in the quality of CIS
statistics. Finally, Chapter 5 summarises the findings of this synthesis report.
2 Methodological overview
The collection of the CIS statistics at national level is made following the Commission Regulation No.
1450/2004 implementing Decision No. 1608/2003 concerning the production and development of
Community statistics on innovation. The regulation sets the variables to be collected, the activities and
sectors to be covered and the breakdowns of the results. In addition, the methodological guidelines
proposed by Eurostat provide specific information on the implementation of the CIS 2008, the data
treatment and transmission to Eurostat.
As indicated thereon, the target population for the CIS 2008 was all enterprises in NACE Rev.2 sections A
to M. The core population of NACE categories to be included in the survey on a mandatory basis was set
according to annex IV of the Commission Regulation No. 973/2007.
Almost all countries covered the core population of NACE sections. In Poland the target population was
according to NACE Rev.1.1 but the results were recalculated according to NACE 2 and thus, some
industries in section E (NACE 36-39) may have been under covered.
Most of the countries covered in addition a number of NACE sections from the non-core activities. In
particular, Spain, Latvia1 and Malta covered all these sections and Czech Republic also covered them all
with the exception of the non-core NACE 01-03, 59-60 and 75. More than half of the countries covered
enterprises in “Scientific Research and Development” (NACE 72) and also one half of the countries
covered enterprises in “Construction” (NACE 41-43). Finally, CIS in Spain, Latvia and Portugal also
included some NACE divisions outside the recommended target population.
1 Latvia covered enterprises in all NACE Rev.2 sections except for NACE U (Activities of extraterritorial organisations and bodies).

2
Table 1 shows the coverage of the additional NACE sections from the non-core population in the CIS 2008.
Table 1. Additional NACE sections covered in CIS 2008.
NACE sections in the non-core population Number of
countries Countries covering this section
Scientific research and development (NACE 72) 17
Belgium, Bulgaria, Czech Republic, Germany,
Spain, France, Latvia, Lithuania,
Luxembourg, Hungary, Malta, Portugal,
Romania, Slovakia, Sweden, Croatia, Norway
Construction (NACE 41-43) 13
Czech Republic, Spain, France, Italy, Latvia,
Lithuania, Hungary, Malta, Netherlands,
Portugal (not 41), Slovakia, Croatia, Norway
Wholesale and retail trade and repair of motor
vehicles and motorcycles (NACE 45) 7
Czech Republic, Spain, France, Italy, Latvia,
Lithuania, Malta
Retail trade, except of motor vehicles and
motorcycles (NACE 47) 8
Czech Republic, Spain, France, Italy, Latvia,
Lithuania, Malta, Portugal (47.1)
Legal and accounting activities (NACE 69) 8 Czech Republic, Germany, Spain, France,
Latvia, Lithuania, Malta, Portugal
Activities of head offices; management
consultancy activities (NACE 70) 8
Czech Republic, Germany, Spain, France,
Latvia, Lithuania, Malta, Norway
Advertising and marketing research (NACE 73) 9 Czech Republic, Germany, Spain, France,
Latvia, Lithuania, Malta, Portugal, Croatia
Other professional, scientific and technical
activities (NACE 74) 9
Czech Republic, Germany, Spain, France,
Latvia, Lithuania, Malta, Portugal, Norway
(74.9)
Employment activities (NACE 78) 7 Czech Republic, Germany, Spain, France,
Latvia, Malta, Netherlands
Security and investigation activities (NACE 80) 7 Czech Republic, Germany, Spain, France,
Latvia, Malta, Netherlands
Services to buildings and landscape activities
(NACE 81) 7
Czech Republic, Germany, Spain, France,
Latvia, Malta, Netherlands
Real estate activities (NACE 68) 7 Czech Republic, Spain, France, Latvia, Malta,
Netherlands, Croatia
Accommodation and food service activities
(NACE 55-56) 8
Czech Republic, Spain, France, Italy, Latvia,
Malta, Netherlands, Croatia
Rental and leasing activities (NACE 77) 6 Czech Republic, Spain, France, Latvia, Malta,
Netherlands
Motion picture, video and television
programme production, sound recording and
music publishing / programming and
broadcasting activities (NACE 59-60)
7 Germany, Spain, France, Latvia, Malta,
Portugal, Norway
Agriculture, forestry and fishing (NACE 01-03) 5 Spain, Latvia, Malta, Netherlands, Norway
(03)
Travel agency, tour operator and other
reservation services and related activities
(NACE 79)
7 Czech Republic, Germany, Spain, France,
Latvia, Malta, Netherlands
Office administrative, office support and other
business support activities (NACE 82) 7
Czech Republic, Germany, Spain, Latvia,
Malta, Netherlands, Norway (82.9)
Veterinary activities (NACE 75) 4 Spain, Latvia, Malta, Portugal
NACE sections outside the recommended target population (NACE Rev. 2 A to M)
Human health and social work activities (NACE
86-88) 3 Spain, Latvia, Portugal (86)
Arts, entertainment and recreation (NACE 90-
93) 2 Spain, Latvia
Other service activities (NACE 94-96) 2 Spain (95, 96), Latvia

3
As regards the breakdown of enterprises into size classes, the Regulation defines the following three
classes depending on the number of employees in the enterprise: (a) 10-49 employees, (b) 50-249
employees and (c) 250+ employees. The majority of countries were in compliance with this division. Some
of them covered enterprises with more than 10 employees but used more detailed breakdowns than
recommended. For example, Germany, Estonia and Netherlands broke down the class of 10-49 employees
into two sub-groups, 10-19 and 20-49, and the class of 50-249 into 50-99 and 100-249 employees.
Germany and Norway also covered enterprises with 5 to 9 employees. Portugal reported that for NACE 86
only enterprises with 50 or more employees were included in the survey and for NACE sections 42, 43,
47.1, 59 and 60 only the enterprises with 250 or more employees. Sweden included all research institutes
in the CIS sample regardless of their size.
In almost all countries the statistical unit in the CIS survey was the enterprise, as defined in the Council
Regulation 696/1993 or in the national business register. Finland used the legal unit instead of the
enterprise, as this was also the basic unit in the Finnish Business Register, or groups of legal units where
most appropriate.
Finally, the observation and reference periods were in total compliance with the recommendations.
Therefore, in all countries, CIS 2008 covered the observation period from 2006 to 2008 inclusive with
reference period the year 2008.
Survey methodology
The majority of the countries used a combination of sample survey and complete enumeration (i.e.
census) of the enterprises included in the frame population. Only two countries (Bulgaria and Malta) used
exclusively census. In most of the cases where a combination of sampling with census is used, the
employment size class is used to define a threshold. Usually larger enterprises are enumerated, while
smaller enterprises are sampled. The threshold to separate large from smaller enterprises can be as large
as 500 employees (for Germany only), for the majority of the countries it is 250 employees, for Hungary,
the Netherlands and Romania it is 100 employees, while for several other countries (e.g. Estonia, Croatia,
Norway, Poland, etc.) it is usually set to 50 employees, with the exception of Cyprus with 20 employees.
Moreover, some countries implement census to previously known intensive R&D performers or to specific
NACE groups/classes, irrespective of the size class.
Table 2 below gives an overview of the survey type, sample size, number of responses and population size.
Moreover, the Table presents sample and response rates provided by the countries or computed based on
the information available in the reports. During the analysis of these figures, as provided by the countries,
it was realized that the sample size has caused some confusion. Clarifications on this issue will be given in
future versions of the quality report templates. The information provided by all countries have been tried
to put together in a comparable way. Therefore there is separate reporting of the gross from the net
sample size, net sample representing the initial (gross) sample excluding the ineligible units. The net
sample coincides with the term ‘realized’/final sample used in the course of this quality report template.

4
Table 2. Overview of survey type and other sampling and response characteristics, CIS 2008.
Survey type
Gross
(initial)
sample
Net
(realised/
final)
sample
Number of
units with a
response in the
realised sample
Population
size
Sample
rate
Un-
weighted
Response
rate
BE Combination
census/sampling - 8599 3427 15111 56.91% 39.85%
BG Census - - 13674 15832 - 86.37%
CZ Combination
census/sampling 8638 7295 49080 17.60% 84.45%
DE Combination
census/sampling 35197 29811 7661 225841 13.20% 25.70%
EE Combination
census/sampling 2479 2020 4923 50.36% 81.48%
IE Combination
census/sampling 4650 - - 27.00% -
ES Combination
census/sampling 48866 44652 205859 23.74% 91.38%
FR Combination
census/sampling 24986 15066 12260 89679 16.80% 81.38%
IT Combination
census/sampling 44803 38090 19904 208637 18.26% 52.26%
CY Combination
census/sampling 1365 1365 1365 - - 100.00%
LV Combination
census/sampling 1707 - 13992 12.20% -
LT Combination
census/sampling 2279 2143 2111 11279 19.00% 98.51%
LU Combination
census/sampling 692 615 1793 38.59% 88.87%
HU Combination
census/sampling 6363 6362 5390 20006 31.80% 84.72%
MT Census - - 894 1288 - 69.41%
NL Combination
census/sampling 14624 14624 10981 58864 24.84% 75.09%
AT Combination
census/sampling 5402 5402 3534 15711 34.38% 65.42%
PL Combination
census/sampling 22152 21394 16013 54856 39.00% 74.85%
PT Combination
census/sampling 9116 7862 6512 25517 30.81% 82.83%
RO Combination
census/sampling 11689 10715 9506 31353 34.18% 88.72%
SI Combination
census/sampling 3009 3009 2595 4597 65.46% 86.24%
SK Combination
census/sampling 3239 2919 2296 10974 26.60% 78.66%
FI Combination
census/sampling 3576 3525 2622 8494 41.50% 74.38%
SE Combination
census/sampling 5418 5418 4624 17398 31.14% 85.35%
NO Combination
census/sampling 5114 5084 4892 14122 36.00% 96.22%
HR Combination
census/sampling 4504 4327 3404 10302 42.00% 78.67%
5
For the sampled enterprises most countries applied a stratified random sampling. The variables used for
the stratification of the sample were the economic activity of the enterprise (according to NACE Rev.2
classification), the enterprise size and in few countries also the geographical region (NUTS2 level). The
number of strata used for each variable varies among the countries. Regarding the size class, there were in
most cases three strata based on the number of employees in the enterprise.
The majority of countries used the national business register as sampling frame, as it was also indicated in
the methodological guidelines. The business register was up-to-date and provided information on
identification characteristics of the enterprise, its economic activity and the number of employees.
Belgium, Germany, Spain and France used other registers for the selection of the enterprises. These
registers were also used in other enterprise surveys, had a very good coverage of the enterprises and
provided all the necessary information. Therefore, they may be considered statistically equivalent to the
official business register.
Weights calculation method
Weights were calculated as the inverse of the sampling fraction, i.e. the ratio Nh/nh, where Nh is the
number of enterprises in stratum h of the population and nh the number of enterprises in the sample in
stratum h of the population, assuming that each enterprise had the same probability to be included in the
sample. This ratio was used in order to adjust for different probabilities of selection of the enterprises in
the sampling process.
Moreover in some countries, the initial weights were re-adjusted following the results of the non-response
analysis and the information from auxiliary variables, like the number of employees, the number of
enterprises and the turnover of the enterprise. The adjustment of weights was done in eleven countries
with the use of a calibration method.
The data source used for the calculation of total figures in the population was the national business
register. Most countries collected from the register information on the number of enterprises, broken
down by economic activity and size class. Other variables derived were the number of employees, the
turnover of the enterprises and the geographical regions.
Countries used various programmes for the weighting of CIS data. The most commonly used were the
software package CLAN, SAS programmes (usually self-developed), SPSS, STATA, MS Access and MS Excel.
Data collection and transmission
CIS 2008 data were collected either through a postal or an electronic survey. In fact, the majority of
countries offered both possibilities to the enterprises. The CIS questionnaire was first sent by post.
Enterprises that wanted to reply electronically could either fill in the electronic questionnaire available on
the website of the NSI, and send it back by mail, or reply to a web-based platform, specially developed for
the CIS. The electronic mode was rather preferable by the enterprises in Estonia, Norway and Italy.
Only in two countries, Cyprus and Luxembourg, the CIS data collection was made exclusively via face-to-
face interviews at the enterprises’ premises. Romania also made visits to the enterprises apart from the
postal survey.
Finally, some countries also contacted the enterprises by telephone. This mode served at first as a
reminder for replying to the survey and secondly as a follow-up to clarify non-responses and missing data.
Table 3 summarises the data collection methods used in CIS 2008.

6
Table 3. CIS 2008 Data Collection Methods
CIS 2008 Data Collection Method Number of countries Countries
Postal and Electronic Survey 16
Belgium, Bulgaria, Germany, Estonia,
Ireland, Spain, France, Hungary, Latvia,
Lithuania, Austria, Portugal, Finland,
Sweden, Croatia, Norway
Only Postal Survey 6 Czech Republic, Malta, Netherlands,
Romania, Slovenia, Slovakia
Only Electronic Survey 2 Italy, Poland
Face-to-Face Interviews 3 Cyprus, Luxembourg, Romania
As regards the transmission of CIS data to Eurostat, all countries used the EDAMIS (electronic Data files
Administration and Management Information System) application as recommended in the methodological
guidelines.
Overall assessment of the national methodology
In this section countries were asked to give an overall assessment of the quality of the CIS methodology.
Most countries considered it to be good with respect to the standard criteria of quality mainly thanks to
the common tools adopted (harmonised methodology and questionnaire). Most critical weaknesses can be
traced back to non-evident concepts of innovation and innovation activities and their interpretation to
and by the respondents in the survey.
The main strengths and weaknesses of CIS 2008, as reported by the countries in the national quality
reports are summarised as follows:
Strengths
o Survey methodology according to Eurostat methodological recommendations resulting in reasonable
good comparability over countries
o Common questionnaire and methodological recommendations with CIS 2006 resulting in high
comparability over time
o Mandatory nature of the survey, where applicable, resulting in reasonable good quality
o Complete enumeration of large enterprises in each round resulting in good familiarity with the CIS
questionnaire and the survey concepts
o High unit response rate in census and sample surveys – no need for non-response survey in most
countries
o Low item non-response rates, especially for the main questions of the survey, thanks to re-contact with
enterprises for corrections/completions on the data initially received
o Electronic mode of data collection – convenient for respondents, economical form of collecting data,
data control during fulfilling questionnaires
o Electronic and manual data checking
o On-line manual and phone lines available to help respondents filling in the questionnaire
o All compulsory cells in the CIS tabulation delivered

7
o All national tabulated data and micro-data delivered on time
o No significant differences with SBS data for 2008 resulting in high coherence
Weaknesses
o In several cases enterprises cannot necessarily assess with precision whether their own activities are
innovative or not, and this is more evident with the expansion of the concept to marketing and
organisational innovations in CIS 2008
o Difficult for enterprises in the services sector to fill in the questionnaire as the wording of questions
appear more applicable to enterprises in manufacturing – more apparent in NACE46, wholesale trade,
where many respondents thought that the survey was not relevant for them
o High burden on respondents due to the length of the CIS questionnaire and the complexity of the
requested information
o Lack of knowledge about innovation and research and lack of resources to spend in filling in such a
long questionnaire
o High non-response rate for questions on innovation expenditure either due to data confidentiality or
due to the difficult and time-consuming data collection, especially for large enterprises
o High non-response for questions on turnover of innovative products due to the difficulty in
understanding the concept
o With regard to R&D data:
- Broadly fit with the latest results from R&D surveys but show differences on a micro-level
- Difficulties in the grossing up of R&D expenditures
- Number of R&D performing enterprises overestimated in a sample survey as the CIS
o Editing phase still a burdensome
o Timing of the survey relatively late
o No user satisfaction survey carried out
Plans for further improvements (reported only by few countries):
o Refinement of the estimates for non-respondents
o Carrying out of user satisfaction survey
o Gathering of reliable information on the burden of respondents
o Development of the editing process to be more efficient in future rounds
o Regional stratification (NUTS 1, 2 or 3) – depending on the expected increase of the sample size
8
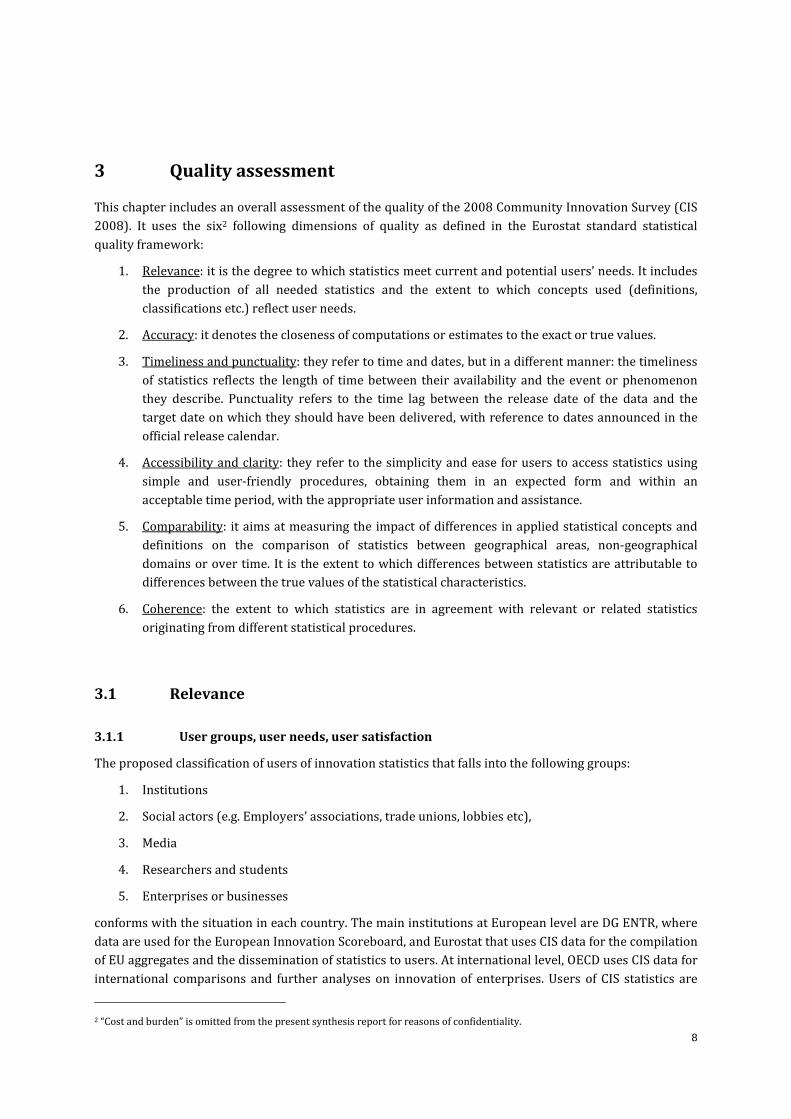
3 Quality assessment
This chapter includes an overall assessment of the quality of the 2008 Community Innovation Survey (CIS
2008). It uses the six2 following dimensions of quality as defined in the Eurostat standard statistical
quality framework:
1. Relevance: it is the degree to which statistics meet current and potential users’ needs. It includes
the production of all needed statistics and the extent to which concepts used (definitions,
classifications etc.) reflect user needs.
2. Accuracy: it denotes the closeness of computations or estimates to the exact or true values.
3. Timeliness and punctuality: they refer to time and dates, but in a different manner: the timeliness
of statistics reflects the length of time between their availability and the event or phenomenon
they describe. Punctuality refers to the time lag between the release date of the data and the
target date on which they should have been delivered, with reference to dates announced in the
official release calendar.
4. Accessibility and clarity: they refer to the simplicity and ease for users to access statistics using
simple and user-friendly procedures, obtaining them in an expected form and within an
acceptable time period, with the appropriate user information and assistance.
5. Comparability: it aims at measuring the impact of differences in applied statistical concepts and
definitions on the comparison of statistics between geographical areas, non-geographical
domains or over time. It is the extent to which differences between statistics are attributable to
differences between the true values of the statistical characteristics.
6. Coherence: the extent to which statistics are in agreement with relevant or related statistics
originating from different statistical procedures.
3.1 Relevance
3.1.1 User groups, user needs, user satisfaction
The proposed classification of users of innovation statistics that falls into the following groups:
1. Institutions
2. Social actors (e.g. Employers’ associations, trade unions, lobbies etc),
3. Media
4. Researchers and students
5. Enterprises or businesses
conforms with the situation in each country. The main institutions at European level are DG ENTR, where
data are used for the European Innovation Scoreboard, and Eurostat that uses CIS data for the compilation
of EU aggregates and the dissemination of statistics to users. At international level, OECD uses CIS data for
international comparisons and further analyses on innovation of enterprises. Users of CIS statistics are
2 “Cost and burden” is omitted from the present synthesis report for reasons of confidentiality.

9
also various national Ministries and other government institutions that need CIS statistics for the
monitoring of innovation strategies, the production of national indicators and reports and the further
development in the field of innovation.
Other users of CIS statistics are research institutes, researchers and students. Such users are interested in
CIS data for analytical purposes, for research in science and innovation and its performance in enterprises
and for studies in economics and other relevant topics.
Enterprises and other businesses are using CIS data for comparisons of innovation strategies and for
market analyses. Finally, media are also an important user of CIS statistics for the presentation of
innovation activities to the general public.
A user satisfaction survey is not generally carried out. Three countries report that they consider that users
are satisfied with the available information on innovation. Austria conducts a user satisfaction survey in
common for R&D and Innovation. Luxembourg reports that they involve users in the preparation of the
national questionnaire, which leads to the inclusion of some of their needs in the survey. Norway also
reports that they hold regular meetings with key stakeholders where participants express their
suggestions for changes in future collection rounds.
3.1.2 Completeness
The Commission Regulation N° 1450/2004, implementing Decision No 1608/2003/EC of the European
Parliament and of the Council concerning the production and development of Community statistics on
innovation (= Commission Regulation on innovation statistics), puts innovation statistics on a statutory
basis and makes compulsory the delivery of certain variables.
According to article 5 of the Com. Reg. 1450/2004, two types of data are to be transmitted to Eurostat. The
first set of data refers to aggregated statistics that will be transmitted on a compulsory basis while the
second one refers to individual data records that could be transmitted on a voluntary basis. Eurostat has
furthermore prepared detailed guidelines for the tabulation of the transmitted data (by detailing the
derivations step-by-step based on the survey microdata).
For the assessment of the completeness of national statistics the comparison has been done on the total
number of compulsory cells which should be transmitted to Eurostat with the number of cells actually
transmitted for the total number of cells in all Excel tables3 that were transmitted with reference year
2008. Reference has not been made to the completeness of voluntary cells.
Based on the information that countries have provided in their national quality report, all countries
transmitted the compulsory cells excepting two countries (Belgium and France). Belgium clarifies that the
reason why some compulsory cells are missing is because no observations were available for these cells
(either because there is no firm in the population, or because none of the surveyed firms answered the
questionnaire).
3 INN_BASIC1, INN_BASIC2, INN_GEN, INN_GEN2, INN_ENTER, INN_ENTER2, INN_TYPES, INN_DEVELOP,
INN_DEVELOP_RD, INN_NEWPROD, INN_EXPEND, INN_FUNDING, INN_SOURCES, INN_COOP, INN_OBJECT,
INN_ORGMKT, INN_ORG-type, INN_OBJORG, INN_MKT-type, INN_OBJMKT, INN_ECO, INN_ECOMOT, INN_ECOPRO
10
3.2 Accuracy
Accuracy of statistics is the outcome of many factors which makes very difficult its quantification with
precision. In this quality report an indirect assessment is done and information on sampling and non-
sampling errors which affect CIS statistics are presented.
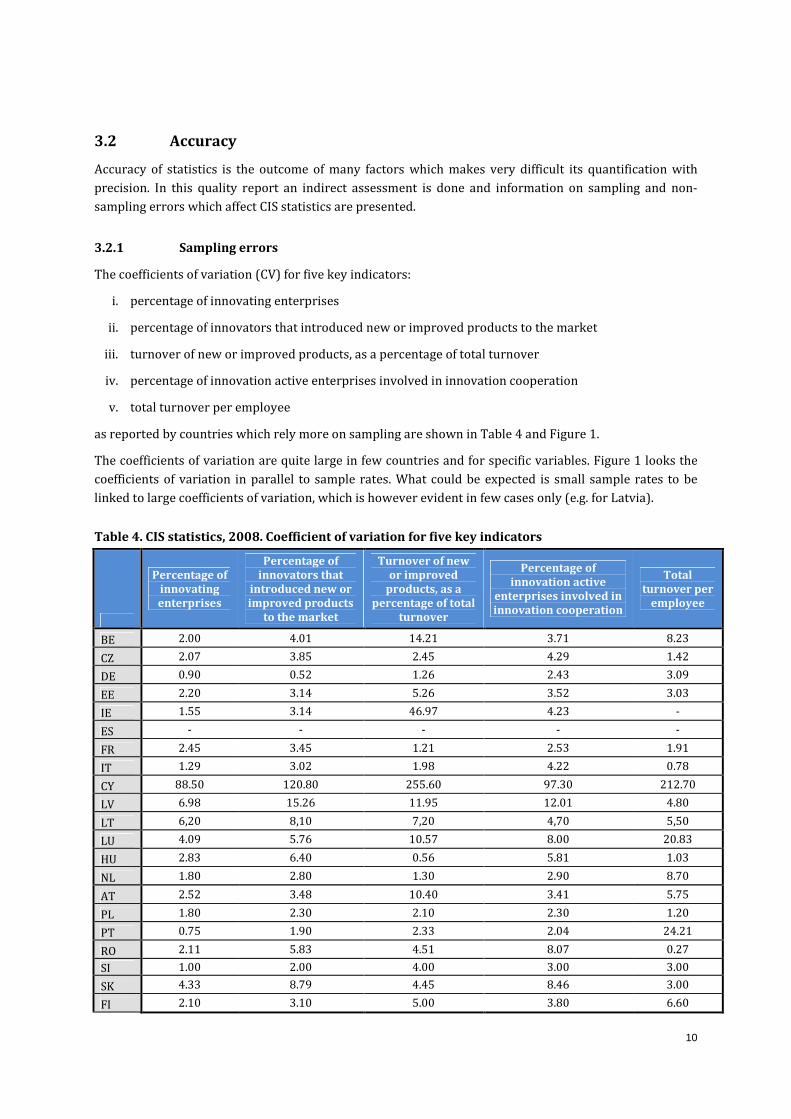
3.2.1 Sampling errors
The coefficients of variation (CV) for five key indicators:
i. percentage of innovating enterprises
ii. percentage of innovators that introduced new or improved products to the market
iii. turnover of new or improved products, as a percentage of total turnover
iv. percentage of innovation active enterprises involved in innovation cooperation
v. total turnover per employee
as reported by countries which rely more on sampling are shown in Table 4 and Figure 1.
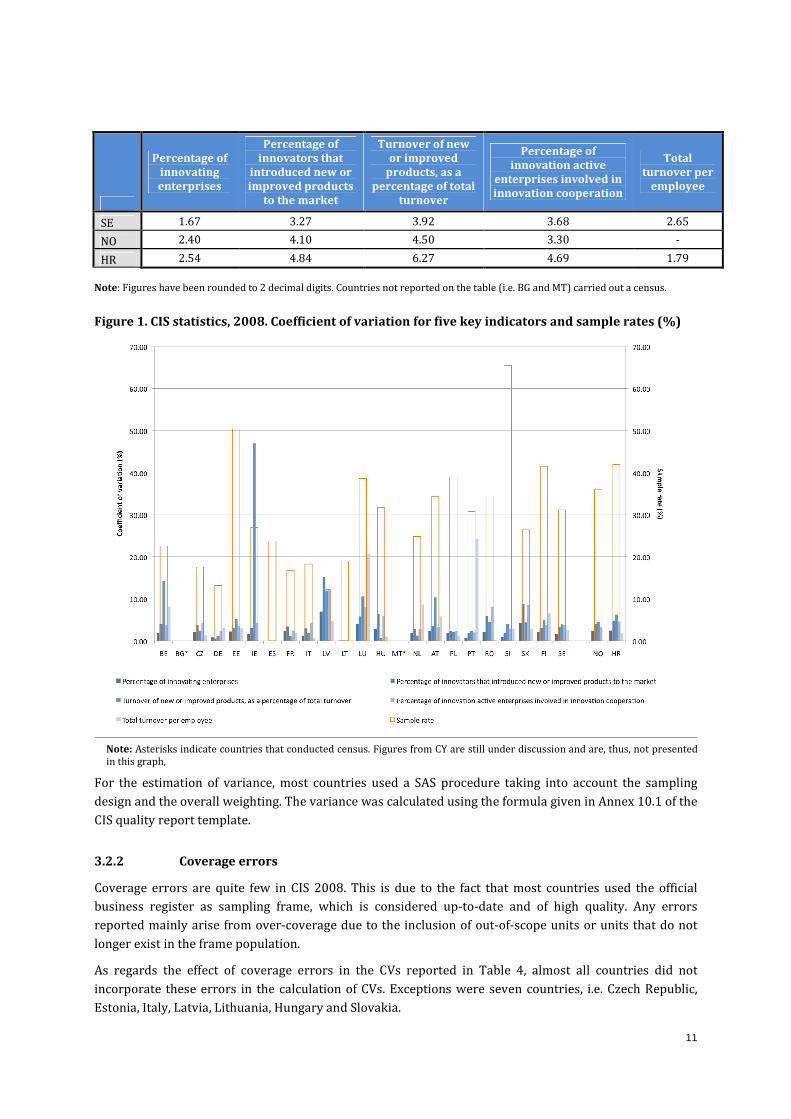
The coefficients of variation are quite large in few countries and for specific variables. Figure 1 looks the
coefficients of variation in parallel to sample rates. What could be expected is small sample rates to be
linked to large coefficients of variation, which is however evident in few cases only (e.g. for Latvia).
Table 4. CIS statistics, 2008. Coefficient of variation for five key indicators
Percentage of
innovating
enterprises
Percentage of
innovators that
introduced new or
improved products
to the market
Turnover of new
or improved
products, as a
percentage of total
turnover
Percentage of
innovation active
enterprises involved in
innovation cooperation
Total
turnover per
employee
BE 2.00 4.01 14.21 3.71 8.23
CZ 2.07 3.85 2.45 4.29 1.42
DE 0.90 0.52 1.26 2.43 3.09
EE 2.20 3.14 5.26 3.52 3.03
IE 1.55 3.14 46.97 4.23 -
ES - - - - -
FR 2.45 3.45 1.21 2.53 1.91
IT 1.29 3.02 1.98 4.22 0.78
CY 88.50 120.80 255.60 97.30 212.70
LV 6.98 15.26 11.95 12.01 4.80
LT 6,20 8,10 7,20 4,70 5,50
LU 4.09 5.76 10.57 8.00 20.83
HU 2.83 6.40 0.56 5.81 1.03
NL 1.80 2.80 1.30 2.90 8.70
AT 2.52 3.48 10.40 3.41 5.75
PL 1.80 2.30 2.10 2.30 1.20
PT 0.75 1.90 2.33 2.04 24.21
RO 2.11 5.83 4.51 8.07 0.27
SI 1.00 2.00 4.00 3.00 3.00
SK 4.33 8.79 4.45 8.46 3.00
FI 2.10 3.10 5.00 3.80 6.60
11
Percentage of
innovating
enterprises
Percentage of
innovators that
introduced new or
improved products
to the market
Turnover of new
or improved
products, as a
percentage of total
turnover
Percentage of
innovation active
enterprises involved in
innovation cooperation
Total
turnover per
employee
SE 1.67 3.27 3.92 3.68 2.65
NO 2.40 4.10 4.50 3.30 -
HR 2.54 4.84 6.27 4.69 1.79
Note: Figures have been rounded to 2 decimal digits. Countries not reported on the table (i.e. BG and MT) carried out a census.
Figure 1. CIS statistics, 2008. Coefficient of variation for five key indicators and sample rates (%)
Note: Asterisks indicate countries that conducted census. Figures from CY are still under discussion and are, thus, not presented
in this graph,
For the estimation of variance, most countries used a SAS procedure taking into account the sampling
design and the overall weighting. The variance was calculated using the formula given in Annex 10.1 of the
CIS quality report template.
3.2.2 Coverage errors
Coverage errors are quite few in CIS 2008. This is due to the fact that most countries used the official
business register as sampling frame, which is considered up-to-date and of high quality. Any errors
reported mainly arise from over-coverage due to the inclusion of out-of-scope units or units that do not
longer exist in the frame population.
As regards the effect of coverage errors in the CVs reported in Table 4, almost all countries did not
incorporate these errors in the calculation of CVs. Exceptions were seven countries, i.e. Czech Republic,
Estonia, Italy, Latvia, Lithuania, Hungary and Slovakia.

12
Misclassification rates
Countries were asked to provide the misclassification rates of their frames, i.e. the percentage of
enterprises that were found to belong in a different stratum than indicated by the frame. These are given
in Table 5.
Please note that for the calculation of the misclassification rates countries followed different procedures.
However, since rates are expressed as percentages, figures may still be used for comparison reasons. Italy,
Malta and Hungary reported the largest misclassification rates (28.1%, 16% and 14.56% respectively)
while Austria, Bulgaria, Cyprus and Sweden reported no deviations in the allocation of enterprises in the
strata between the time of the last frame update and the time when the survey was carried out.
Misclassification rates were calculated either based on the size of the initial (gross) sample, or the number
of units with a response in the realised sample. In exceptional cases, figures are based on the realised
(final/net) sample (or complete enumeration where relevant), while for many countries no inference is
made about the approach. In Table 5 an indication is given according to which approach the calculation of
the misclassification rate has been made.
Table 5. ‘Frame’ misclassification rate (%) by size class in CIS 2008.
Small [10-49] Medium [50-249] Large [>249] TOTAL
BE** 10.20 6.90 5.00 8.80
BG* 0.00 0.00 0.00 0.00
CZ 12.50 6.40 4.50 11.10
DE* 11.40 8.80 6.80 10.20
EE*** 0.01 0.04 0.08 0.02
IE - - - -
ES 7.64 23.62 12.99 9.78
FR 1.32 1.14 0.87 1.19
IT* 29.90 25.10 16.80 28.10
CY* 0.00 0.00 0.00 0.00
LV*** 10.63 8.85 1.56 9.20
LT* 0.21 6.88 8.35 4.43
LU - - - -
HU** 18.39 10.24 9.80 14.56
MT 15.00 20.00 14.00 16.00
NL - - - -
AT* 0.00 0.00 0.00 0.00
PL 0.06 0.03 0.02 0.04
PT** 6.80 9.80 9.00 7.80
RO 1.58 1.08 0.21 1.18
SI - - - -
SK** 5.10 9.50 3.60 6.20
FI - - - -
SE* 0.00 0.00 0.00 0.00
NO - - - -
HR** 3.08 7.16 7.95 5.26
*Rates based on the initial (gross) sample
**Rates based on the units with a response in the realised sample
***Rates based on the realized (final/net) sample

13
3.2.3 Measurement errors
Measurement errors occur during data collection and cause recorded values of variables to be different
from the true ones. Such errors are usually caused by the survey questionnaire or/and the respondents.
Countries were asked to provide a short description of measurement errors, if existing, and the measures
taken at national level to reduce them.
The majority of countries did not report any measurement errors. There were only some problems
mentioned by few countries concerning data for turnover and innovation expenditures. In particular,
Czech Republic reported that many enterprises found it difficult to estimate the percentages of total
turnover from new products or services (question 2.3 of the CIS 2008 questionnaire).
All countries made significant efforts to minimise measurement errors. At first, they organised seminars
for the training of the persons involved in the data collection and most of them tested the survey
questionnaire before sending it to the enterprises. They also prepared explanatory notes for both the
postal and the electronic survey in order to help respondents in the completion of the questionnaire.
The use of the electronic questionnaire by many countries had a positive impact on the quality of the data
collected. This mode allowed the use of built-in controls that checked the values inserted by respondents
at the time of completion and informed them in case of error or missing item. The electronic version also
eliminated the bias from interviewers.
3.2.4 Processing errors
Processing errors are considered to be negligible in the CIS 2008 data collection. In case of a postal survey,
data were entered through a data keying method and any error was corrected manually during the editing
process. A number of quality checks were then applied in order to identify inconsistent or missing
information. These checks also included comparisons with data from previous surveys or data from
structural statistics to assess the consistency of the data collected. Finally, countries contacted the
enterprises, mainly by phone, in order to request clarifications on the answers received and complete
items that were left empty.
3.2.5 Non-response errors
Non response occurs when a survey fails to collect data on all survey variables from all the population
units designated for data collection in a sample or complete enumeration.
Non-response errors may be reduced with the use of reminders/recalls to the enterprises. As
recommended in the survey guidelines, most countries sent at least two or three paper reminders to non-
responding enterprises. Additionally, these enterprises were either contacted by phone or e-mail in order
to remind them to fill in and deliver the survey questionnaire.
Figure 2 presents un-weighted and weighted unit response rates, defined as follows:
− Un-weighted Unit Response Rate= 100*(Number of units with a response) / (Total number of
eligible and unknown eligibility units in the sample)
− Weighted Unit Response Rate = 100*(Weighted number of responding units) / (Weighted number
of eligible and unknown eligibility units in the sample)

14
The weighting is with the same weights used for estimation of population statistics with sample data.
Therefore the weighted response rate is an estimate of the proportion of population units which would
respond, had a census been used. When a country uses a census (BG and MT) un-weighted and weighted
response rates coincide.
Figure 2 shows both rates for each country, unless a census is used in which case only the un-weighted
rate is shown. Overall non-response is evident in the CIS surveys of several countries. In particular it can
be seen that all the three Belgium regions and Germany have response rates below 50%, while sixteen
countries have response rates above 80%. Belgium reported that the non-mandatory participation in the
CIS survey may be an explanation for the low response rate.
Figure 2 CIS statistics, 2008. Unit response rate (%).
The un-weighted response rates are also shown on a map of Europe, in Figure 3 below.

15
Figure 3. CIS statistics, 2008. Un-weighted unit response rate (%).
Following Eurostat’s recommendations for the CIS 2008, a non-response survey should be performed
when the (un-weighted) unit response rate is below 70%. As shown in Figure 2, Belgium, Germany,
Austria, Ireland and Italy reported response rates below this threshold. The first three4 carried out a non-
response analysis to overcome the effect of the low response rate on the data collected. Italy planned to
perform such a survey but due to delays caused by administrative issues, this did not start in time for the
provision of CIS 2008 estimates.
The non-response survey was performed for a stratified random sample of enterprises selected from the
non-responding units of the full survey. In Belgium, this sample included only small and medium
enterprises from the core NACE sectors since the response rate for large enterprises was more than 70%.
Austria selected two “mirror” units from the same stratum for each sampled enterprise in case the original
enterprise would refuse to participate. The final sample included 42% of the original selected enterprises
and 58% of the first or second mirror units.
Enterprises were contacted by phone. Germany used the CATI method while Belgium and Austria
provided also the possibility to the enterprises to reply either by fax or e-mail. The questions included in
the non-response survey were similar to those specified in Annex 5 of the CIS 2008 methodological
recommendations. All three countries achieved high response rates that allowed data from the non-
response survey to be used in the adjustment of weighting factors for the share of innovative enterprises
in the CIS 2008. The overall response rates in the non-response survey were 88% in Belgium, 82% in
Germany and 99.5% in Austria.
4 In Belgium, a non-response survey was performed only for Flanders.

16
Use of imputation
National authorities try to correct errors in the data by re-contacting the enterprises concerned. Only if
this is not possible do they resort to imputation for (automatic) correction. The imputation rates, i.e.
proportion of enterprises for which imputation was used, for five metric CIS indicators (i.e. Turn = Total
turnover in 2008, Turnin = Turnover due to new or improved product (Share), TurnMar = Share of new or
improved products to market, RrdInX = Expenditure in intramural RD, Rtot = Total innovation
expenditure) are shown in Figure 4.
Belgium has reported considerably high imputation rates. Especially for total innovation expenditure
imputation rate exceeds 75%. High imputation rates for Belgium are reasonable as a result of low
response rate (approximately 37% on average for the three regions) to some extent but mainly due to the
fact that Rtot was fully imputed in Flanders (as the sum of its components). France and Luxembourg have
also reported high imputation rates, close to 20%, for total innovation expenditure and Expenditure in
intramural R&D respectively. Both countries report response rates above 80%.
Figure 4. CIS statistics, 2008. Imputation rates (%) for five key indicators.
3.3 Timeliness and Punctuality
According to Com. Reg. 1450/2004 national CIS statistics must be delivered to Eurostat within 18 months
from the end of the reference year, i.e. the deadline for transmission of 2008 CIS data to Eurostat being
30th June 2010.
17
Most countries conformed to this regulation and sent their results within the required time period.
Deviations have been reported only by Luxembourg (2 months delay) and Malta (half month delay) only.
Greece has not sent the data. Croatia, Ireland, Lithuania and Sweden manage to compile and send their
data half, one or two months in advance of the deadline.
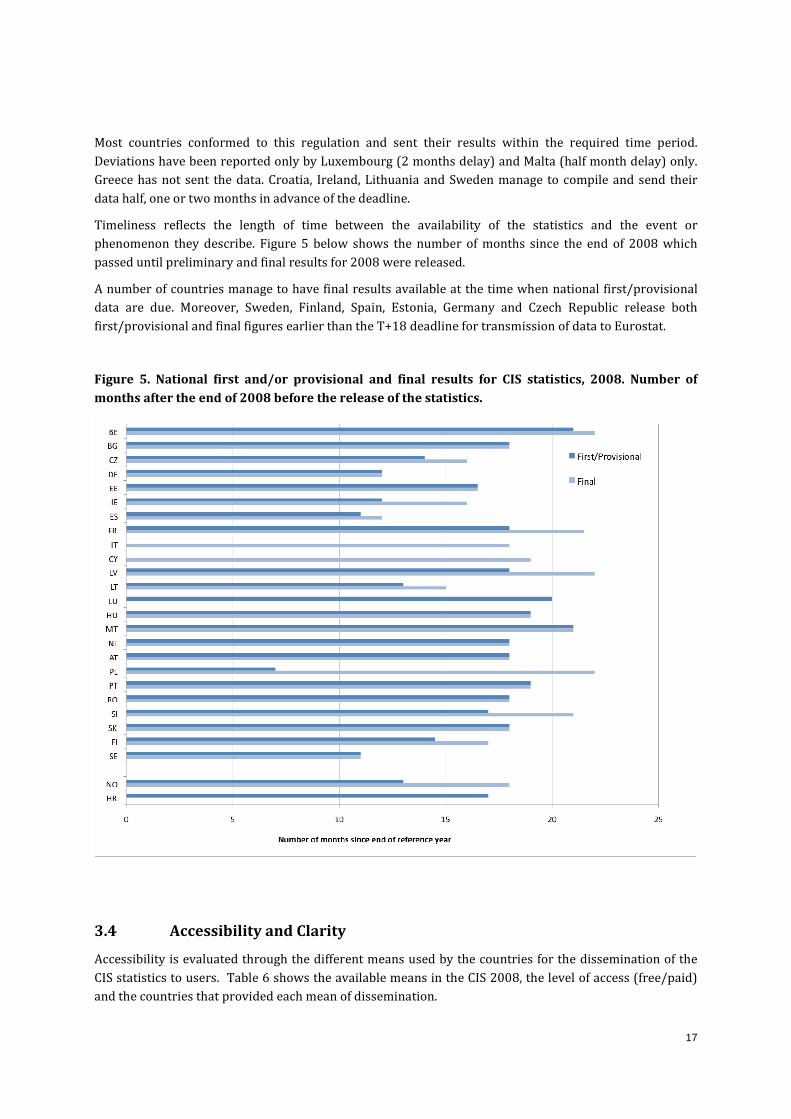
Timeliness reflects the length of time between the availability of the statistics and the event or
phenomenon they describe. Figure 5 below shows the number of months since the end of 2008 which
passed until preliminary and final results for 2008 were released.
A number of countries manage to have final results available at the time when national first/provisional
data are due. Moreover, Sweden, Finland, Spain, Estonia, Germany and Czech Republic release both
first/provisional and final figures earlier than the T+18 deadline for transmission of data to Eurostat.
Figure 5. National first and/or provisional and final results for CIS statistics, 2008. Number of
months after the end of 2008 before the release of the statistics.
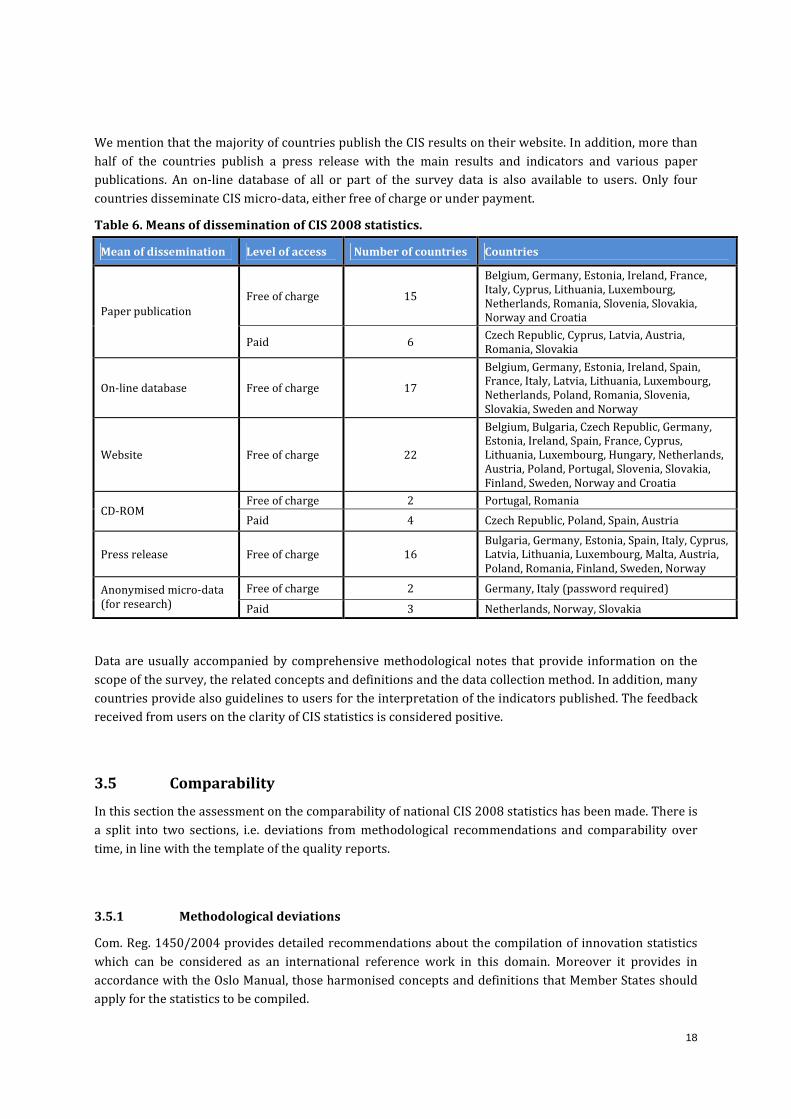
3.4 Accessibility and Clarity
Accessibility is evaluated through the different means used by the countries for the dissemination of the
CIS statistics to users. Table 6 shows the available means in the CIS 2008, the level of access (free/paid)
and the countries that provided each mean of dissemination.
18
We mention that the majority of countries publish the CIS results on their website. In addition, more than
half of the countries publish a press release with the main results and indicators and various paper
publications. An on-line database of all or part of the survey data is also available to users. Only four
countries disseminate CIS micro-data, either free of charge or under payment.
Table 6. Means of dissemination of CIS 2008 statistics.
Mean of dissemination Level of access Number of countries Countries
Free of charge 15
Belgium, Germany, Estonia, Ireland, France,
Italy, Cyprus, Lithuania, Luxembourg,
Netherlands, Romania, Slovenia, Slovakia,
Norway and Croatia Paper publication
Paid 6 Czech Republic, Cyprus, Latvia, Austria,
Romania, Slovakia
On-line database Free of charge 17
Belgium, Germany, Estonia, Ireland, Spain,
France, Italy, Latvia, Lithuania, Luxembourg,
Netherlands, Poland, Romania, Slovenia,
Slovakia, Sweden and Norway
Website Free of charge 22
Belgium, Bulgaria, Czech Republic, Germany,
Estonia, Ireland, Spain, France, Cyprus,
Lithuania, Luxembourg, Hungary, Netherlands,
Austria, Poland, Portugal, Slovenia, Slovakia,
Finland, Sweden, Norway and Croatia
Free of charge 2 Portugal, Romania CD-ROM
Paid 4 Czech Republic, Poland, Spain, Austria
Press release Free of charge 16
Bulgaria, Germany, Estonia, Spain, Italy, Cyprus,
Latvia, Lithuania, Luxembourg, Malta, Austria,
Poland, Romania, Finland, Sweden, Norway
Free of charge 2 Germany, Italy (password required) Anonymised micro-data
(for research) Paid 3 Netherlands, Norway, Slovakia
Data are usually accompanied by comprehensive methodological notes that provide information on the
scope of the survey, the related concepts and definitions and the data collection method. In addition, many
countries provide also guidelines to users for the interpretation of the indicators published. The feedback
received from users on the clarity of CIS statistics is considered positive.
3.5 Comparability
In this section the assessment on the comparability of national CIS 2008 statistics has been made. There is
a split into two sections, i.e. deviations from methodological recommendations and comparability over
time, in line with the template of the quality reports.
3.5.1 Methodological deviations
Com. Reg. 1450/2004 provides detailed recommendations about the compilation of innovation statistics
which can be considered as an international reference work in this domain. Moreover it provides in
accordance with the Oslo Manual, those harmonised concepts and definitions that Member States should
apply for the statistics to be compiled.
19
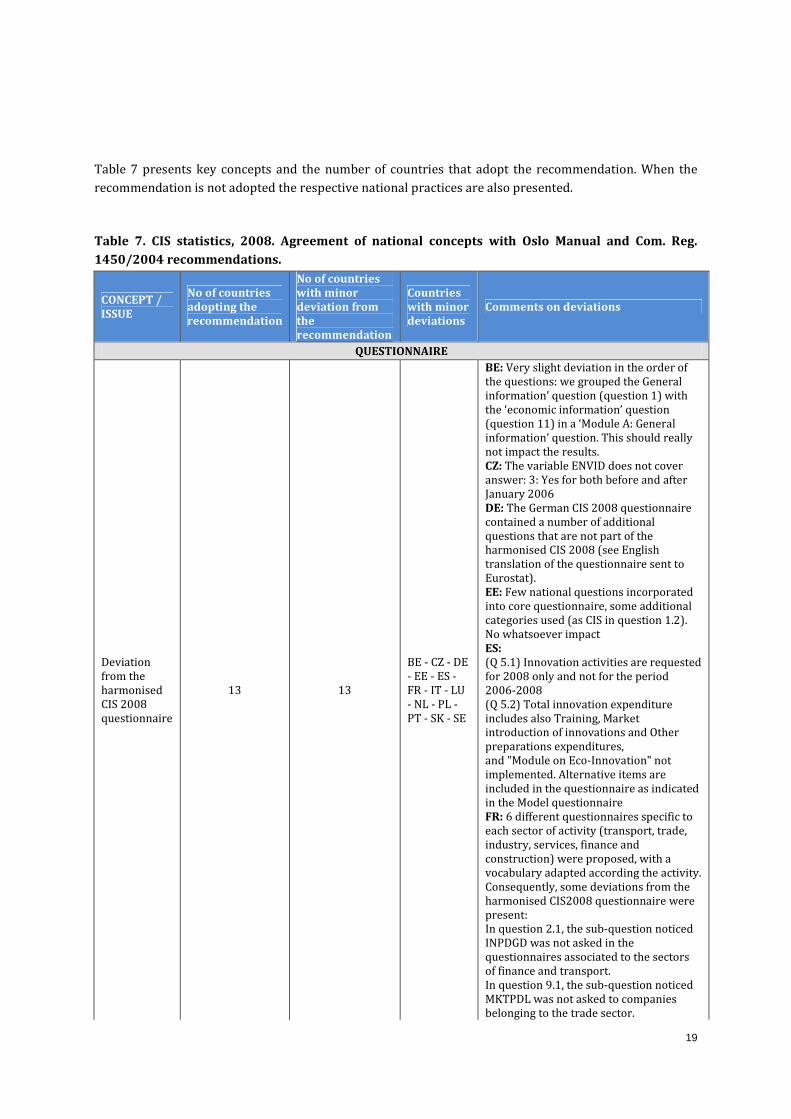
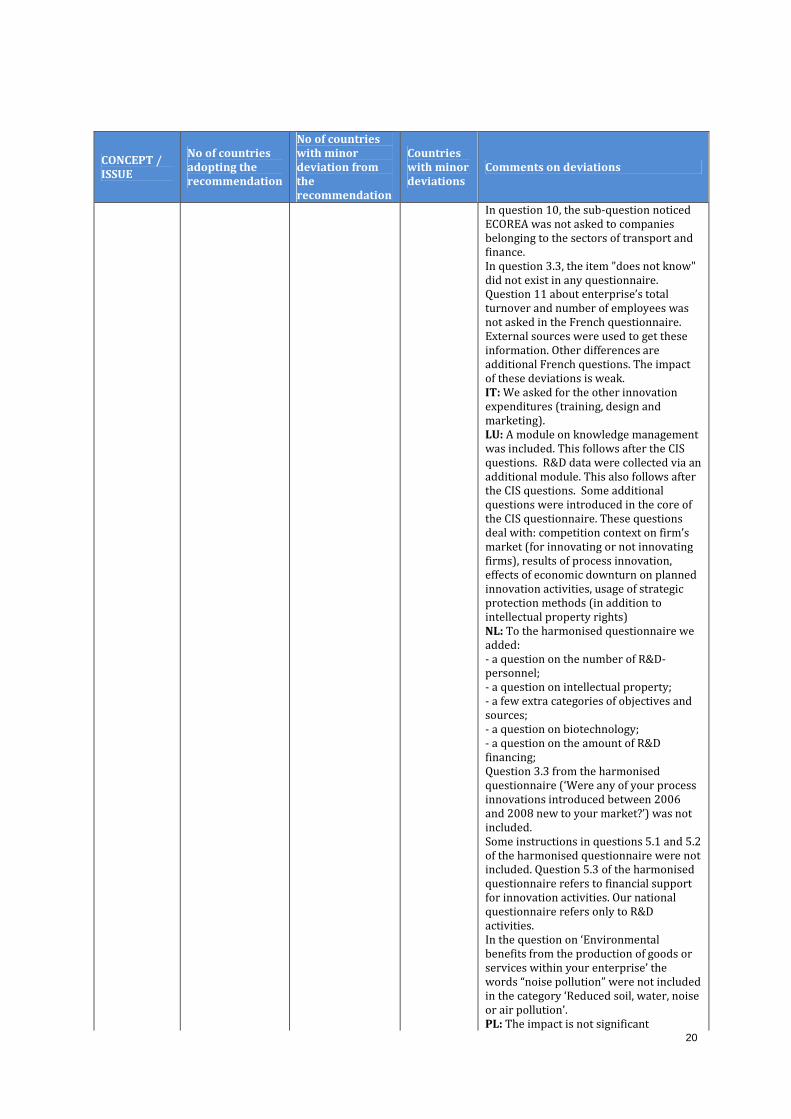
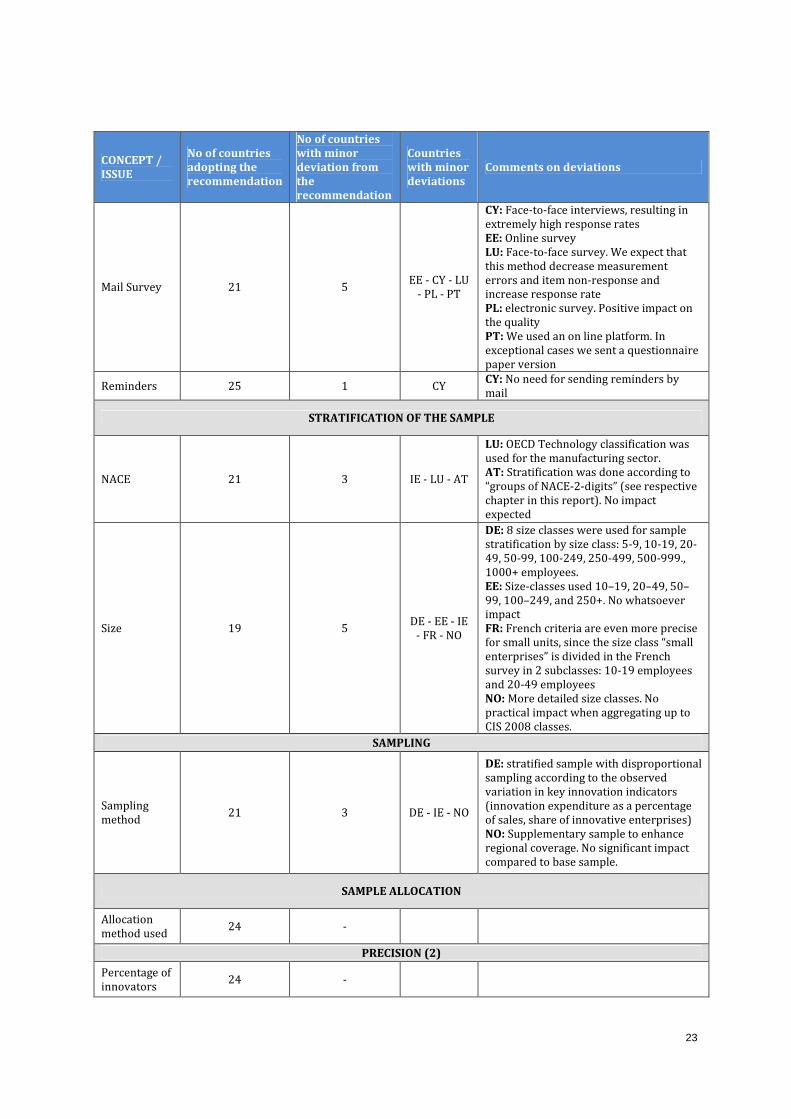
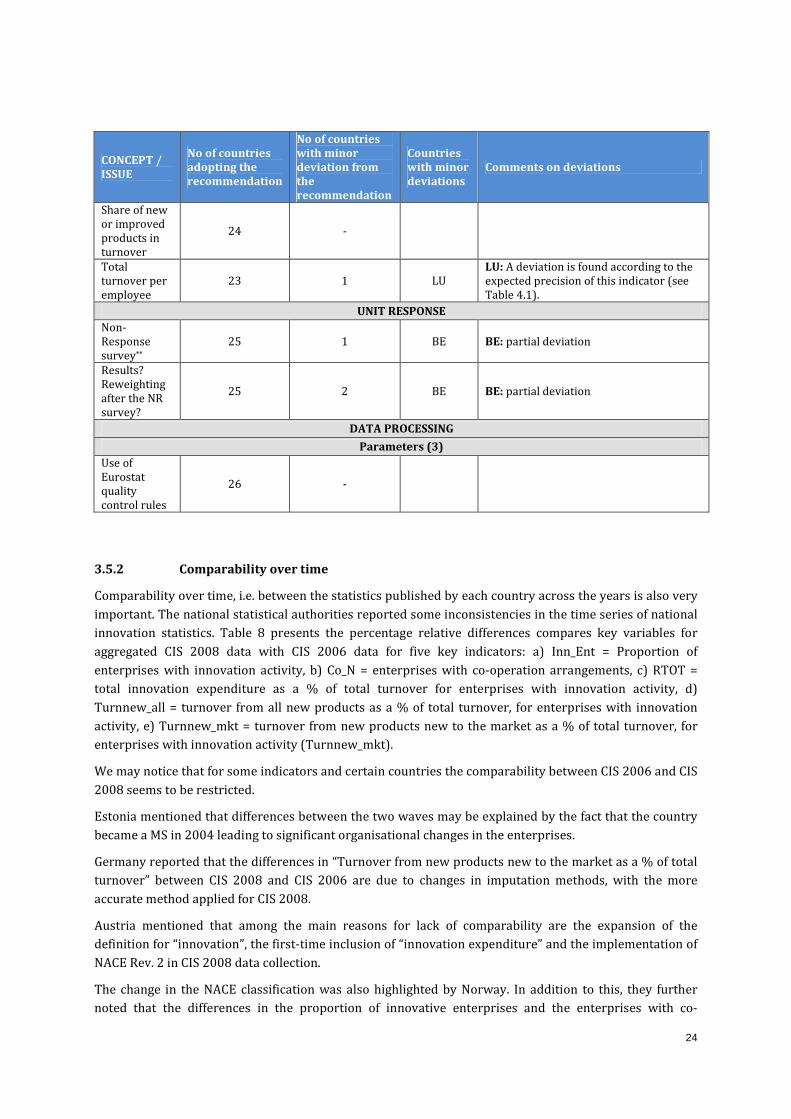
Table 7 presents key concepts and the number of countries that adopt the recommendation. When the
recommendation is not adopted the respective national practices are also presented.
Table 7. CIS statistics, 2008. Agreement of national concepts with Oslo Manual and Com. Reg.
1450/2004 recommendations.
CONCEPT /
ISSUE
No of countries
adopting the
recommendation
No of countries
with minor
deviation from
the
recommendation
Countries
with minor
deviations
Comments on deviations
QUESTIONNAIRE
Deviation
from the
harmonised
CIS 2008
questionnaire
13 13
BE - CZ - DE
- EE - ES -
FR - IT - LU
- NL - PL -
PT - SK - SE
BE: Very slight deviation in the order of
the questions: we grouped the General
information’ question (question 1) with
the ‘economic information’ question
(question 11) in a ‘Module A: General
information’ question. This should really
not impact the results.
CZ: The variable ENVID does not cover
answer: 3: Yes for both before and after
January 2006
DE: The German CIS 2008 questionnaire
contained a number of additional
questions that are not part of the
harmonised CIS 2008 (see English
translation of the questionnaire sent to
Eurostat).
EE: Few national questions incorporated
into core questionnaire, some additional
categories used (as CIS in question 1.2).
No whatsoever impact
ES:
(Q 5.1) Innovation activities are requested
for 2008 only and not for the period
2006-2008
(Q 5.2) Total innovation expenditure
includes also Training, Market
introduction of innovations and Other
preparations expenditures,
and "Module on Eco-Innovation" not
implemented. Alternative items are
included in the questionnaire as indicated
in the Model questionnaire
FR: 6 different questionnaires specific to
each sector of activity (transport, trade,
industry, services, finance and
construction) were proposed, with a
vocabulary adapted according the activity.
Consequently, some deviations from the
harmonised CIS2008 questionnaire were
present:
In question 2.1, the sub-question noticed
INPDGD was not asked in the
questionnaires associated to the sectors
of finance and transport.
In question 9.1, the sub-question noticed
MKTPDL was not asked to companies
belonging to the trade sector.
20
CONCEPT /
ISSUE
No of countries
adopting the
recommendation
No of countries
with minor
deviation from
the
recommendation
Countries
with minor
deviations
Comments on deviations
In question 10, the sub-question noticed
ECOREA was not asked to companies
belonging to the sectors of transport and
finance.
In question 3.3, the item "does not know"
did not exist in any questionnaire.
Question 11 about enterprise’s total
turnover and number of employees was
not asked in the French questionnaire.
External sources were used to get these
information. Other differences are
additional French questions. The impact
of these deviations is weak.
IT: We asked for the other innovation
expenditures (training, design and
marketing).
LU: A module on knowledge management
was included. This follows after the CIS
questions. R&D data were collected via an
additional module. This also follows after
the CIS questions. Some additional
questions were introduced in the core of
the CIS questionnaire. These questions
deal with: competition context on firm’s
market (for innovating or not innovating
firms), results of process innovation,
effects of economic downturn on planned
innovation activities, usage of strategic
protection methods (in addition to
intellectual property rights)
NL: To the harmonised questionnaire we
added:
- a question on the number of R&D-
personnel;
- a question on intellectual property;
- a few extra categories of objectives and
sources;
- a question on biotechnology;
- a question on the amount of R&D
financing;
Question 3.3 from the harmonised
questionnaire (‘Were any of your process
innovations introduced between 2006
and 2008 new to your market?’) was not
included.
Some instructions in questions 5.1 and 5.2
of the harmonised questionnaire were not
included. Question 5.3 of the harmonised
questionnaire refers to financial support
for innovation activities. Our national
questionnaire refers only to R&D
activities.
In the question on ‘Environmental
benefits from the production of goods or
services within your enterprise’ the
words “noise pollution” were not included
in the category ‘Reduced soil, water, noise
or air pollution’.
PL: The impact is not significant

21
CONCEPT /
ISSUE
No of countries
adopting the
recommendation
No of countries
with minor
deviation from
the
recommendation
Countries
with minor
deviations
Comments on deviations
PT: We introduced some national
questions. No impact expected, due to the
optional status of those questions
SK:
Q1.1 (voluntary) without reference year
(2008), we guess that enterprises
answered this question for the year 2008,
because the reference year was written in
the title of the questionnaire
Q10.2 (voluntary) in first two options is
not written reason “taxes” due to not
existing such taxes in our country
SE: All mandatory questions according to
the regulation were included in the
Swedish questionnaire. We also included
almost all the voluntary questions. The
only questions that we did not include
from the “core” questionnaire was
question nr 3.3, 5.3 and 6.1
National data
collection
period
26 -
Deviation
from the
sampling
frame
24 2 SE - NO
SE: All research institutes (regardless of
size) are also included in the sample
NO: Enterprises with 10-19 employees
not covered in NACE 49-53
TARGET POPULATION (1)
NACE sectors
covered5 21 5
ES – LV – PL
– PT – FI
ES - LV: Coverage of sectors outside the
recommended target population - Human
health and social work activities (NACE
86-88), Arts, entertainment and
recreation (NACE 90-93), Repair of
computers and personal and household
goods, and Other personal service
activities (NACE 95, 96)
PL: Target population for CIS 2008 in
Poland was according to NACE Rev1.
The results were recalculated according
to NACE 2. Some industries in section E
(NACE 36-39) could be under covered
PT: Coverage of sectors outside the
recommended target population – NACE
86
5 The deviations indicated in the coverage of NACE sectors refer to differences in the NACE classification, the non-coverage of sectors
in the core population and the coverage of sectors outside the recommended target population. For the coverage of the additional
NACE sectors, apart from the core population, please see Table 1 of the present synthesis report.

22
CONCEPT /
ISSUE
No of countries
adopting the
recommendation
No of countries
with minor
deviation from
the
recommendation
Countries
with minor
deviations
Comments on deviations
Size classes 23 3 DE - ES - NO
DE: extended for size class 5 to 9
employees
ES: The breakdown of the size classes
used for extracting the random sample
from the Target Population is the
following:
o 10-49
o 50-199
o 200-more (all covered)
NO: Enterprises with 10-19 employees
not covered in NACE 49-53
SURVEY METHODOLOGY
SAMPLING FRAME
Sampling
frame 22 4
BE – DE –
ES - FR
BE: Due to confidentiality constraints the
official Belgian business register could not
be used. Instead, we used as frame
population the register available from the
Belgian National Social Security Office
that contains all active employers in
Belgium. This official register is at the
enterprise level. We used its December
2008 version. This register was agreed
upon by Statistics Belgium as being
statistically equivalent to the official
business register.
DE: In the absence of a publically
accessible national business register in
Germany for purposes of sampling, we
used the enterprise register of
Creditreform, the largest credit rating
agency in Germany, which was processed
by ZEW in order to serve as an
appropriate sampling comparable to
official business registers.
ES: The Central Businesses Directory
(DIRCE) and the Directory of Enterprises
that performed R&D or are potential R&D
performers (DIRID) are used. Both frames
are annually updated.
FR: The frame was built mainly from the
frame of the annual sectoral survey (ESA)
and the annual production survey (EAP
2008). For sectors not surveyed by the
ESA, the French business register SIRENE
was used.
Date of
business
register
extraction
23 3 FR - IT - SE
FR: Sampling was realised in June 2009,
and concerned enterprises active at the
date of the extraction
IT: Information dated 31 Dec 2006
SE: Nov 2008
DATA COLLECTION
Survey
method 26 -
23
CONCEPT /
ISSUE
No of countries
adopting the
recommendation
No of countries
with minor
deviation from
the
recommendation
Countries
with minor
deviations
Comments on deviations
Mail Survey 21 5 EE - CY - LU
- PL - PT
CY: Face-to-face interviews, resulting in
extremely high response rates
EE: Online survey
LU: Face-to-face survey. We expect that
this method decrease measurement
errors and item non-response and
increase response rate
PL: electronic survey. Positive impact on
the quality
PT: We used an on line platform. In
exceptional cases we sent a questionnaire
paper version
Reminders 25 1 CY CY: No need for sending reminders by
STRATIFICATION OF THE SAMPLE
NACE 21 3 IE - LU - AT
LU: OECD Technology classification was
used for the manufacturing sector.
AT: Stratification was done according to
“groups of NACE-2-digits” (see respective
chapter in this report). No impact
expected
Size 19 5 DE - EE - IE
- FR - NO
DE: 8 size classes were used for sample
stratification by size class: 5-9, 10-19, 20-
49, 50-99, 100-249, 250-499, 500-999.,
1000+ employees.
EE: Size-classes used 10–19, 20–49, 50–
99, 100–249, and 250+. No whatsoever
impact
FR: French criteria are even more precise
for small units, since the size class “small
enterprises” is divided in the French
survey in 2 subclasses: 10-19 employees
and 20-49 employees
NO: More detailed size classes. No
practical impact when aggregating up to
CIS 2008 classes.
SAMPLING
Sampling
method 21 3 DE - IE - NO
DE: stratified sample with disproportional
sampling according to the observed
variation in key innovation indicators
(innovation expenditure as a percentage
of sales, share of innovative enterprises)
NO: Supplementary sample to enhance
regional coverage. No significant impact
compared to base sample.
SAMPLE ALLOCATION
Allocation
method used 24 -
PRECISION (2)
Percentage of
innovators 24 -
24
CONCEPT /
ISSUE
No of countries
adopting the
recommendation
No of countries
with minor
deviation from
the
recommendation
Countries
with minor
deviations
Comments on deviations
Share of new
or improved
products in
turnover
24 -
Total
turnover per
employee
23 1 LU
LU: A deviation is found according to the
expected precision of this indicator (see
Table 4.1).
UNIT RESPONSE
Non-
Response
survey**
25 1 BE BE: partial deviation
Results?
Reweighting
after the NR
survey?
25 2 BE BE: partial deviation
DATA PROCESSING
Parameters (3)
Use of
Eurostat
quality
control rules
26 -
3.5.2 Comparability over time
Comparability over time, i.e. between the statistics published by each country across the years is also very
important. The national statistical authorities reported some inconsistencies in the time series of national
innovation statistics. Table 8 presents the percentage relative differences compares key variables for
aggregated CIS 2008 data with CIS 2006 data for five key indicators: a) Inn_Ent = Proportion of
enterprises with innovation activity, b) Co_N = enterprises with co-operation arrangements, c) RTOT =
total innovation expenditure as a % of total turnover for enterprises with innovation activity, d)
Turnnew_all = turnover from all new products as a % of total turnover, for enterprises with innovation
activity, e) Turnnew_mkt = turnover from new products new to the market as a % of total turnover, for
enterprises with innovation activity (Turnnew_mkt).
We may notice that for some indicators and certain countries the comparability between CIS 2006 and CIS
2008 seems to be restricted.
Estonia mentioned that differences between the two waves may be explained by the fact that the country
became a MS in 2004 leading to significant organisational changes in the enterprises.
Germany reported that the differences in “Turnover from new products new to the market as a % of total
turnover” between CIS 2008 and CIS 2006 are due to changes in imputation methods, with the more
accurate method applied for CIS 2008.
Austria mentioned that among the main reasons for lack of comparability are the expansion of the
definition for “innovation”, the first-time inclusion of “innovation expenditure” and the implementation of
NACE Rev. 2 in CIS 2008 data collection.
The change in the NACE classification was also highlighted by Norway. In addition to this, they further
noted that the differences in the proportion of innovative enterprises and the enterprises with co-

25
operation arrangements are impacted by the omission of the size group ‘10-19’ in NACE groups F and H
while the differences in turnover indicators are impacted by a change in the method for obtaining
turnover data. Numbers for CIS 2006 were generally somewhat underreported. In addition, the CIS 2006
sample did not include certain large enterprises with a dominant turnover. Ignoring actual turnover and
adjusting for comparability, the weighted reported numbers for these variables are only slightly lower
than in CIS 2006 overall.
Table 8. Comparison between CIS 2006 and CIS 2008 data (relative difference).
Inn_Ent Co_N RTOT TURNNEWALL TURNNEW
MKT
BE 109.05 72.36 101.86 119.97 103.57
BG 84.43 127.79 96.89 84.03 99.84
CZ 84.10 119.40 97.90 95.60 107.40
DE 98.00 136.00 104.00 106.00 267.00
EE 99.00 123.00 59.00 74.00 92.00
IE 105.12 117.46 102.04 129.48 118.07
ES 117.00 75.00 92.00 100.00 103.00
FR 103.60 93.20 111.20 87.40 88.20
IT 84.30 78.30 136.40 78.00 80.00
CY 92.10 133.70 125.20 76.00 285.20
LV 73.17 236.02 51.39 57.99 53.55
LT 63.90 93.40 42.60 90.30 57.10
LU 105.00 110.00 484.00 150.00 181.00
HU 98.88 91.76 88.12 64.27 74.89
MT 84.00 116.00 91.00 127.00 143.00
NL 100.20 94.80 105.90 105.90 90.10
AT 118.00 100.40 - 112.00 111.00
PL 116.00 124.00 87.00 98.00 94.00
PT 69.94 73.08 151.87 109.69 102.00
RO 110.00 1.20 103.80 157.30 140.30
SI - - - - -
SK 46.18 87.59 242.34 133.86 117.02
FI 111.00 175.00 - 100.00 116.00
SE - - - - -
NO 81.20 78.60 176.60 133.90
HR 94.47 93.81 119.97 104.05 68.36
3.6 Coherence
3.6.1 Coherence with Structural Business Statistics
Table 9 below shows the relative differences in absolute terms between aggregated CIS 2008 data and SBS
data from 2008 for the following five key variables: a) Turn = Proportion of total turnover in 2008, b) Emp
= Proportion of total number of employees in 2008, c) NbEnt = Proportion of number of enterprises by

26
NACE, d) RrdInx = Proportion of expenditure in intramural RD, e) TurnEmp = Proportion of total turnover
in 2008 per employee. Information is displayed only for the countries that have provided this information.
The comparison between SBS and CIS statistics may be used to indicate whether the results from the two
surveys are comparable or not and could be used for further analysis.
There seems to be a different degree of deviations between the indicators displayed in the table. This
means that the difference in coverage between the two surveys may have greater impact on some
indicators and lower on others.
In addition, the definition of employment in CIS (number of employees) differs from the definition in SBS
(persons employed). This difference may also affect the coherence between the two data collections.
Table 9. Comparison between SBS and CIS 2008 data (relative differences)
Turn% Emp% NbEnt% RrdInx% TurnEmp%
EE 96.00 96.00 100.00 87.00 99.00
IT 104.90 97.10 100.10 - 110.80
CY 114.10 115.90 120.50 - 98.50
LV 93.40 95.30 99.70 - -
LU 115.40 97.00 100.40 - 119.00
HU 102.20 103.00 104.70 105.80 99.20
MT 98.67 106.43 111.26 - 95.12
AT 104.10 102.10 107.90 - 102.00
PL 128.00 130.00 139.00 - 433.00
RO 100.00 94.40 100.60 - 104.60
SK 97.29 91.67 103.30 86.80 106.14
FI 99.00 99.00 102.00 - 100.00

27
4 Comparison with CIS 2006
In this section a comparison of the CIS 2008 is made with the previous data collection, CIS 2006, in terms
of accuracy, timeliness, comparability and coherence. This comparison serves in highlighting the
improvements made in the quality of CIS statistics.
The following assessment covers the countries that have participated in both CIS 2006 and CIS 2008 data
collection and have also delivered their quality reports.
Accuracy
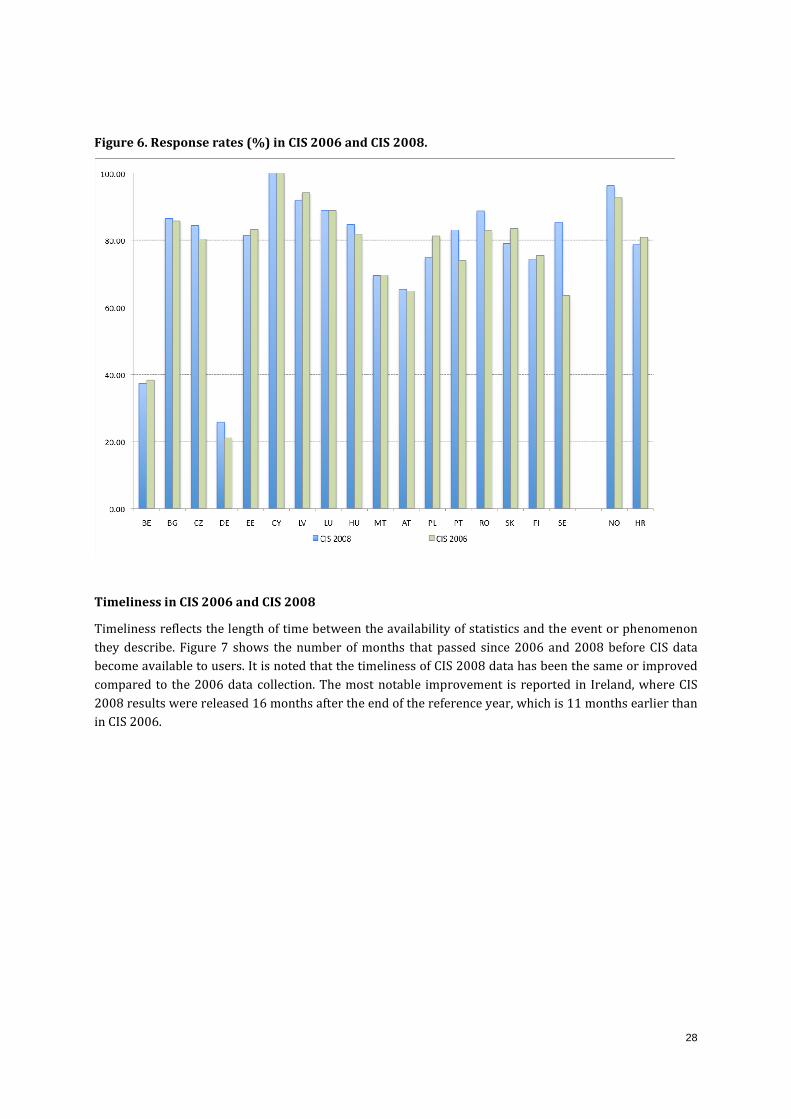
A quantitative indicator of accuracy is the response rate. Figure 6 presents the un-weighted response
rates in the CIS 2006 and 2008. It is apparent that in both rounds the rates are high indicating that the
data collected are accurate. Latvia and Norway report response rates above 90% while Cyprus achieved
100% response rate. Notable exceptions are Belgium and Germany whose rates are below 40% in both
collections.
In most of the countries there are slight differences between the response rate in CIS 2006 and in CIS
2008 that do not exceed 5%. Bulgaria, Czech Republic, Germany, Luxembourg, Hungary, Austria and
Norway report higher response rates in CIS 2008. Improvements are more notable in Romania and
Portugal. In 2008 the CIS became a part of the Swedish official statistics making the survey mandatory for
surveyed enterprises. This explains the considerable increase in Swedish response rate from CIS 2006.
On the contrary, Slovakia and Poland report significant reductions in the response rates of 2008 compared
to the 2006 data collection that do not however exceed 7%,
28
Figure 6. Response rates (%) in CIS 2006 and CIS 2008.
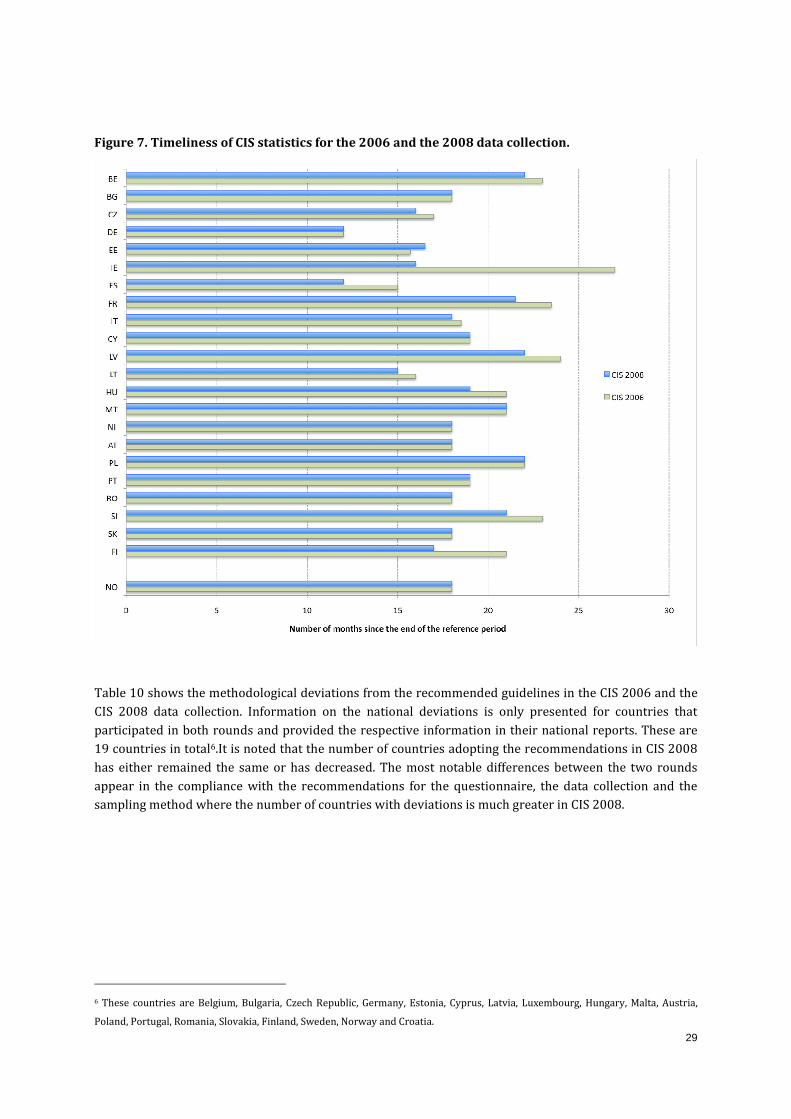
Timeliness in CIS 2006 and CIS 2008
Timeliness reflects the length of time between the availability of statistics and the event or phenomenon
they describe. Figure 7 shows the number of months that passed since 2006 and 2008 before CIS data
become available to users. It is noted that the timeliness of CIS 2008 data has been the same or improved
compared to the 2006 data collection. The most notable improvement is reported in Ireland, where CIS
2008 results were released 16 months after the end of the reference year, which is 11 months earlier than
in CIS 2006.
29
Figure 7. Timeliness of CIS statistics for the 2006 and the 2008 data collection.
Table 10 shows the methodological deviations from the recommended guidelines in the CIS 2006 and the
CIS 2008 data collection. Information on the national deviations is only presented for countries that
participated in both rounds and provided the respective information in their national reports. These are
19 countries in total6.It is noted that the number of countries adopting the recommendations in CIS 2008
has either remained the same or has decreased. The most notable differences between the two rounds
appear in the compliance with the recommendations for the questionnaire, the data collection and the
sampling method where the number of countries with deviations is much greater in CIS 2008.
6 These countries are Belgium, Bulgaria, Czech Republic, Germany, Estonia, Cyprus, Latvia, Luxembourg, Hungary, Malta, Austria,
Poland, Portugal, Romania, Slovakia, Finland, Sweden, Norway and Croatia.

30
Table 10. Methodological deviations in CIS 2006 and CIS 2008
CIS 2008 CIS 2006
CONCEPT /
ISSUE No of countries
adopting the
recommendation
No of countries
with minor
deviation from
the
recommendation
No of countries
adopting the
recommendation
No of countries
with minor
deviation from
the
recommendation
QUESTIONNAIRE
Deviation
from the
harmonised
CIS 2008
questionnaire
10 9 16 3
National data
collection
period
19 - 19 -
Deviation
from the
sampling
frame
17 2 19 -
TARGET POPULATION (1)
NACE sectors
covered 15 4 16 3
Size classes 17 2 16 3
Statistical
unit 18 1 19 -
SURVEY METHODOLOGY
SAMPLING FRAME
Sampling
frame 18 1 19 -
Date of
business
register
extraction
18 1 19 -
DATA COLLECTION
Survey
method 19 - 19 -
Mail Survey 14 5 17 2
Reminders 18 1 17 2
STRATIFICATION OF THE SAMPLE
NACE 15 2 16 2
Size 14 3 17 1
SAMPLING
Sampling
method 15 2 18 -
SAMPLE ALLOCATION
Allocation
method used 17 - 18 -
PRECISION (2)
Percentage of
innovators 17 - 18 -
Share of new
or improved
products in
turnover
17 - 18 -

31
CIS 2008 CIS 2006
CONCEPT /
ISSUE No of countries
adopting the
recommendation
No of countries
with minor
deviation from
the
recommendation
No of countries
adopting the
recommendation
No of countries
with minor
deviation from
the
recommendation
Total
turnover per
employee
16 1 18 -
UNIT RESPONSE
Non-
Response
survey**
18 1 3 -
Results?
Reweighting
after the NR
survey?
18 1
DATA PROCESSING
Parameters (3)
Use of
Eurostat
quality
control rules
19 - 19 -
Coherence with SBS statistics in CIS 2006 and CIS 2008
Countries are asked to assess the coherence of CIS statistics with SBS statistics for the same reference
year. Table 11 presents the relative differences between SBS and CIS for 2006 and 2008. The number of
countries presented is limited mainly due to the lack of available SBS data in either the 2006 or the 2008
data collection. The differences between the two rounds are small and it is difficult to assess the
improvements, if any, in the coherence of CIS statistics. In Finland it seems to be clearer that CIS 2008
statistics are more coherent than CIS 2006.
Table 11. Coherence with SBS statistics in CIS 2006 and CIS 2008.
Turn% Emp% NbEnt% RrdInx% TurnEmp%
CIS 2008 96.00 96.00 100.00 87.00 99.00 EE
CIS 2006 97.00 100.00 100.00 94.00 100.00
CIS 2008 114.10 115.90 120.50 98.50 CY
CIS 2006 101.70 116.50 128.20 87.30
CIS 2008 98.67 106.43 111.26 95.12 MT
CIS 2006 102.00 106.00 105.00 107.00
CIS 2008 104.10 102.10 107.90 102.00 AT
CIS 2006 103.10 94.30 103.80 109.30
CIS 2008 100.00 94.40 100.60 104.60 RO
CIS 2006 99.70 100.20 103.30 99.00
CIS 2008 99.00 99.00 102.00 100.00 FI
CIS 2006 86.00 84.00 93.00 102.00
32
5 Conclusions
The overall quality of the CIS 2008 data collection is regarded as good following the assessment of the
standard quality dimensions. Starting from relevance, the majority of countries may not carry out a user
satisfaction survey but are aware of their users and their needs in the field of innovation statistics. The
completeness of CIS data is also high as almost all countries transmit all compulsory data.
The accuracy of CIS statistics is also considered to be good. In terms of methodology, most countries use a
combination of a sample survey and a census in order to ensure high coverage of the target population
and good quality in the data collection. In addition, the wide use of the business register as a sampling
frame reduces coverage errors.
The most critical quality problems are reported to be linked to the phenomenon under study itself,
innovation. In several cases enterprises cannot necessarily assess with precision whether their own
activities are innovative or not. The widespread distribution of these activities in the enterprise and
somewhat subjective assessment as regards the innovation activities can also set some reservations to the
data. These issues have been and continue to be tackled with less ambiguous wording of the survey
questionnaires and more clear instructions.
As regards response rates, it is worth mentioning that in CIS 2008 almost all countries reported rates over
70%, which is a very positive sign for an enterprise survey. This reduced the need for a non-response
survey and for imputation, which is indeed limited in CIS.
The CIS 2008 data collection was carried out following the Commission Regulation No. 1450/2004, the CIS
2008 harmonised questionnaire and the methodological recommendations developed in close
cooperation with the Members States. The compliance of almost all countries with these documents
resulted in high quality of the data collected. National deviations are mainly reported in the survey
questionnaire and the coverage of NACE sectors. Especially for the latter, it should be mentioned that a
great number of countries cover enterprises in sectors outside the core population with focus on
enterprises in research and development (NACE 72) and in construction (NACE 41-43).
Moreover, the punctuality of CIS statistics is very good as almost all countries transmit their data on time
by using the eDAMIS application recommended by Eurostat. Data are also released in a short period after
the reference year resulting in high timeliness of CIS. Several countries publish their data nationally
earlier than the deadline for transmission to Eurostat.
Finally, the coherence between CIS and SBS statistics is satisfactory in most key variables. Nevertheless,
methodological and conceptual differences between the two surveys may have a significant impact on the
differences of the statistics produced.