COMMISSION FOR AGRICULTURAL COSTS AND PRICES
100
COMMISSION FOR AGRICULTURAL COSTS AND PRICES REPORT ON PRICE POLICY FOR KHARIF CROPS OF 2005-2006 SEASON SUMMARY OF RECOMMENDATIONS In this report, the Commission for Agricultural Costs and Prices presents its views on the Price Policy for Kharif Crops of 2005-2006 Season. The Commission recommends that the minimum support prices for the kharif crops of 2005-2006 season be fixed at the following levels: Commodity Variety Quality Minimum Support Price (Rs per quintal) Paddy Common FAQ 560 Grade-A " 600 Jowar - " 525 Bajra - " 525 Maize - " 540 Ragi - " 525 Tur (Arhar) - " 1400 Moong - " 1520 Urad - " 1520 Groundnut-in-shell - " 1520 Soyabean Yellow " 1010 Black " 900 Sunflowerseed - " 1500 Sesamum - " 1550 Nigerseed - " 1200 Cotton (Kapas)F-414/H-777/J-34 " 1760 H-4 " 1980 VFC Tobacco Black soil F 2 grade " 3400 Light soil L 2 grade " 3600 (Para 4.6) ---------------------------------------------------------------------------------------------------------------- The Commission further recommends that: i) the prices for different varietal groups of rice be derived from the minimum support prices of paddy on the basis of hulling/milling ratios as well as the processing and incidental charges obtaining in different states; (ii) the MSP recommended for F-414/H-777/J-34 variety of kapas be made applicable only for Rajasthan; (iii) the prices of F-414/H-777/J-34 grown in Haryana and Punjab be fixed keeping in view the respective quality differentials vis-a-vis Rajasthan obtaining in these states; iv) the prices of varieties other than those in the group of long and superior long cotton be fixed keeping in view the normal market price differentials between F-414/H-777/J-34 and other varieties;
-
Upload
khangminh22 -
Category
Documents
-
view
0 -
download
0
Transcript of COMMISSION FOR AGRICULTURAL COSTS AND PRICES

COMMISSION FOR AGRICULTURAL COSTS AND PRICES
REPORT ON PRICE POLICY FOR KHARIF CROPS
OF 2005-2006 SEASON
SUMMARY OF RECOMMENDATIONS
In this report, the Commission for Agricultural Costs and Prices presents its views on the Price Policy for Kharif Crops of 2005-2006 Season. The Commission recommends that the minimum support prices for the kharif crops of 2005-2006 season be fixed at the following
levels: Commodity Variety Quality Minimum Support Price
(Rs per quintal) Paddy Common FAQ 560
Grade-A " 600
Jowar - " 525
Bajra - " 525
Maize - " 540
Ragi - " 525
Tur (Arhar) - " 1400
Moong - " 1520
Urad - " 1520
Groundnut-in-shell - " 1520
Soyabean Yellow " 1010
Black " 900
Sunflowerseed - " 1500
Sesamum - " 1550
Nigerseed - " 1200
Cotton (Kapas)F-414/H-777/J-34 " 1760
H-4 " 1980
VFC Tobacco
Black soil F2 grade " 3400
Light soil L2 grade " 3600
(Para 4.6) ---------------------------------------------------------------------------------------------------------------- The Commission further recommends that: i) the prices for different varietal groups of rice be derived from the minimum support
prices of paddy on the basis of hulling/milling ratios as well as the processing and incidental charges obtaining in different states;
(ii) the MSP recommended for F-414/H-777/J-34 variety of kapas be made applicable only
for Rajasthan; (iii) the prices of F-414/H-777/J-34 grown in Haryana and Punjab be fixed keeping in view
the respective quality differentials vis-a-vis Rajasthan obtaining in these states; iv) the prices of varieties other than those in the group of long and superior long cotton be
fixed keeping in view the normal market price differentials between F-414/H-777/J-34 and other varieties;

v) the prices of varieties other than H-4 in the group of long and superior long cotton be fixed keeping in view the normal market price differentials between H-4 and other varieties;
vi) the prices of grades other than F2 VFC tobacco grown on black soils be fixed keeping
in view the normal market price differentials between F2 and other grades; vii) the prices of grades other than L2 VFC tobacco grown on light soils be fixed keeping in
view the normal market price differentials between L2 and other grades; viii) Government should formulate an appropriate, albeit integrated policy for surplus
management and trade of agricultural produce and putting in place flexible options for insulating domestic prices from international volatility, besides appropriate instrument for promoting trade of domestic surpluses; (Para 1.6)
ix) decentralized procurement in newly emerging surplus states, particularly in
Eastern India, needs to be made more effective, efficient and streamlined not only to reduce the transaction and distribution costs but also to bring the element of equity in safeguarding the interest of farmers; (Para 1.7)
x) there should be a comprehensive review of seed management in the country covering research, seed multiplication, distribution, quality assurance and knowledge dissemination and putting in place proper seed supply system in the mode of public-private participation; (Para 1.8)
xi) the issues of credit, input delivery and associated risk in farming should be addressed in a holistic manner and multiplicity of institutions involved in delivering these services at the grass root level be minimized. The delivery of these services should be streamlined so that procedural hassles do not act as de-motivator for farmers; (Para 1.9)
xii) high priority be attached to address the issues of food safety and food quality. There is urgent need to bring all the dimensions of market access both of tariff and non tariff nature under unified umbrella. Further, the information on various SPS conditions on different products be consolidated and disseminated for the knowledge of all stakeholders;
(Para 1.10)
xiii) India should not deviate from its negotiating stand in WTO that the reform
process can not be carried forward on the firm commitments of market access alone without bringing meaningful and effective disciplines on all kinds of trade distorting domestic support by developed countries. Since, for developing countries, tariff is the only means of protection from unabated domestic support given by developed countries, India’s negotiating posture on market access issues should match the unrelenting posture of developed countries on domestic support. The provisions of Special and Differential treatments for developing countries should be effective and not mere expressions of best endeavour;
(Para 1.11)
xiv) Government should take utmost care and examine all pros and cons while considering the agricultural commodities in the FTAs and in bilateral and regional trade liberalization agreements; (Para 1.12)

xv) the Central Government should take necessary steps to remove all apprehensions on the part of state governments about various marketing reforms, as contained in the Model Agriculture Produce Marketing Act and also provide institutional support to ensure that farmers are not unduly exploited in the process of implementation of any such reforms; (Para 2.7)
xvi) reiterates its recommendation made in its report for rabi crops of 2000-2001 that
state governments should reduce statutory charges on purchase of cereals to a combined maximum of 4 per cent, including all taxes and cesses, mandi charges and payments to commission agents; (Para 2.8)
xvii) state governments should refrain from taxing primary products brought in or taken
out of the states by agencies designated to undertake minimum support operations;
(Para2.8)
xviii) the Department of Food and Public Distribution should make a state-wise evaluation of the working of decentralized procurement for removal of operational hitches and smooth operations of procurement;
(Para 2.13)
xix) the Government may consider announcing separate MSP for durum wheat and basmati paddy in addition to MSPs for common wheat and common variety and Grade ‘A’ Paddy and accordingly put in place a system to defend the same in the market; (Para 2.14)
xix) the existing mechanism of price support and public distribution system should
continue and be made more efficient to meet food requirements of Indian population from domestic production. Also the PDS should be strengthened in Eastern and Central regions where there is high concentration of poor people and yet the off-take is relatively low; (Para 2.17)
xxi) Government should periodically review FAQ norms for all the commodities, and
standardize the relaxation procedures so as to avoid ad-hocism and also give wide publicity of these norms and relaxations thereof, so that farmers take due care of the crop at various stages and reduce the incidences of rejection by the procurement agencies on quality consideration. (Para 2.61)
xxii) the Government should review the existing procurement/price support operations
of oilseeds and make proper marketing arrangements to ensure that the oilseeds crop of the farmers is fully protected against price uncertainty; (Para 2.67)
xxiii) the Government may formulate an appropriate strategy to exploit the available
potential of secondary sources of oil to enhance availability of edible oils in the country; (Para 2.79)

xxiv) the Technology Mission on Oilseeds & Pulses may examine the suggestion of
the oil industry to declare cultivation of oil palm as plantation and allow the public and private enterprisers to enter in this field and make suitable recommendations to the Government in this regard; (Para 2.81)
xxv) the Government should examine the feasibility of creating a buffer stock in cotton
to streamline the supply management and protect the interests of the farmers from fluctuating market
prices; (Para 2.100)
xxvi) both CCI and NAFED should be equipped with adequate resources and
infrastructure not only for procurement of cotton but also for trading in domestic and international market; (Para 2.100)
xxvii) some of the fundamental problems of cotton economy such as low productivity,
high costs of production, non-availability of pest and disease resistant quality seeds and marketing bottlenecks need to be addressed on priority basis to make Indian cotton competitive in the world and to gain substantially in post MFA textiles regime; (Para 2.104)
xxviii) the Government should set up a Core Group on Cotton with representation from
farmers, State Government, Industry, Trade and Commercial Organization, procurement agency, etc. to meet periodically and comprehensively address the problems faced by the respective
stakeholders;and (Para 2.104)
xxix) the Government may examine the relevance of MSP in tobacco production vis-à-vis MGP and Auction Price and whether the tobacco production and pricing could be left to either market forces or to Tobacco Board. (Para 2.114)

I. AN OVERVIEW During the year 2004-05, Indian agriculture has been facing its inherent vulnerability to climatic
aberrations and resultant imbalance between supply and demand. Though the year has not been free
from erratic weather impinging the farm sector, it has simultaneously encountered the problem of supply
management. After a normal monsoon during 2003 translating in good crop production, the year 2004
witnessed the overall monsoon rainfall deficiency of 13 per cent from the long period average (LPA). As a
result, 13 out of 35 met sub-divisions were rain deficient. Out of 524 meteorological districts, 132 districts
(25%) experienced moderate drought and 36 districts (7%) experienced severe drought at the end of the
season. It has been further reported that the total storage level in the 73 major reservoirs across the
country was only 96 per cent of the previous year’s level (as on February 19, 2005), and was only 80 per
cent of the average storage level during the last 10 years. Besides, unseasonal rain in Tamil Nadu in the
month of February have hit the samba (winter) rice crop in many districts, while hailstorm has hit wheat
and other crops in parts of Punjab, Haryana, Rajasthan, Uttaranchal and Uttar Pradesh. The emerging
production scenario is turning out to be the mixed bag of high and low levels of production of different
agricultural commodities.
1.2 According to the Second Advance Estimate of agricultural production (Directorate of Economics
and Statistics, Department of Agriculture and Cooperation, 19th January, 2005), total foodgrain production
during 2004-05 is expected to be 206.39 million tonnes, a decline of 3.3 per cent from the record
production of 213.46 million tonnes achieved last year. As expected, the major impact of incremental
weather is borne by Kharif crops. The Kharif foodgrains production is poised to slide by about 14 million
tonnes to 102.94 million tonnes during this year. Though the estimated total rice production of 87.80
million tonnes may be close to last year’s production of 88.28 million tonnes and wheat production may
marginally improve to 73.03 million tonnes from 72.11 million tonnes produced last year, the production of
coarse cereals and total pulses is likely to fall from record 38.12 million tonnes and 14.94 million tonnes
respectively in 2003-04 to 31.88 million tonnes and 13.67 million tonnes respectively during 2004-
05. This decline is mainly attributed to bajra and Kharif pulses other than tur. The production of these
crops declined during 2004-05 by about 47 per cent and 27 per cent from the respective record
production of 11.79 million tonnes and 3.90 million tonnes achieved during 2003-04. The overall oilseeds
production is expected to be relatively less impacted and the likely production during 2004-05 is pegged
at 24.82 million tonnes, marginally lower than the record production of 25.29 million tonnes in 2003-
04. But the impact of weather on Kharif oilseeds production was evident as it declined to 14.76 million
tonnes in 2004-05 from 16.77 million tonnes in 2003-04 mainly on account of Kharif groundnut. Like
foodgrains, the performance of oilseeds in rabi season is poised to sustain the domestic supply with the
production expected to breach 10 million tonnes mark for the first time. In this mixed production
performance, the crop that is likely to post new landmark is cotton. Responding to the market signals of
favorable price regime of previous year, the cotton farming has demonstrated its zeal to embrace BT in a
big way with much larger area coverage. The official estimate of 17.07 million bales of cotton production,
during 2004-05 is 23 per cent more than last year’s production of 13.87 million bales and 14 per cent
more than the target of 15.00 million bales set for the year. The impressive performance of cotton
production, however, has brought in its wake the problem of management of surplus supply and in turn
safeguarding the interest of the farmers due to sharp decline in market prices.
1.3 During 2003-04, the procurement of rice by FCI and State Agencies stood at 22.83 million
tonnes. However, the procurement of wheat in the corresponding period was at the moderate level of
15.8 million tonnes. The rice procurement during 2004-05 (as on 25.02.05) remained upbeat with 17.94
million tonnes already procured as compared to 16.38 million tonnes procured in the corresponding

period in 2003-04. Nearly one-third of the total procurement of rice has come through the levy
route. This channel of procurement is generally prevalent in the States opting for decentralized
procurement. Since the transactions under levy procurement of rice are secondary in nature, there is a
need to ensure that during their primary transactions, farmers get the MSP for paddy. The wheat
procurement during the current marketing season has also improved to 16.80 million tonnes. The stock
of foodgrains at the commencement of 2005 stood at 21.7 million tonnes comprising 12.8 million tonnes
of rice and 8.9 million tonnes of wheat. Though, the present stock position is lowest in the past seven
years but it remains more than the buffer norms of 16.8 million tonnes comprising 8.4 million tonnes each
for rice and wheat. The moderate stocks is due to improvement in the off-take of foodgrains from the
Central Pool in recent years. During 2003-04, the off-take of rice was 25.04 million tonnes, as against
24.85 million tonnes during 2002-03 and 15.31 million tonnes during 2001-02. The off-take of wheat
during 2003-04 was 24.3 million tonnes, close to that of 25.0 million tonnes in 2002-03, but significantly
higher than 16.0 million tonnes offtake during 2001-02. During the current year, about 16 million tonnes
of rice and 12.8 million tonnes of wheat already have been lifted.
1.4 Owing to general ease on supply front, the market for agricultural commodities during 2003-04
and in 2004-05 remained non inflationary. The average wholesale price index (WPI – Base 1993-94) for
agricultural commodities for the period April to January, 2004-05 rose by 2.6 per cent as compared to 6.7
per cent for all commodities for the corresponding period last year. Inspite of bumper domestic supply of
oilseeds during 2003-04 followed by normal production in 2004-05, its prices were relatively more volatile
with rise of 3.2 per cent in average WPI. The prices of cereals in general remained stable with average
WPI registering a modest rise of 0.6 per cent. The prices of pulses however, succumbed to supply
pressure in second consecutive year and during 2004-05, average WPI dropped by 0.89 per cent for the
period ending January, 2005. This trend, contrary to the inflationary trend existing prior to 2003-04,
pushed the prices below MSP and in turn necessitated procurement at minimum support prices. In the
case of cotton however, the declining trend in prices had assumed alarming proportion. The WPI at the
end of marketing season in October, as already dived by more than 20 per cent from the previous years
and setting aside the buoyancy of previous year, it is apprehended to touch its lowest level in recent
years. The depressive cotton market, resulting mainly from increased supply and inadequate
procurement operations by CCI, has given a wrong signal to the farmers. It is also a cause for concern to
agricultural policy makers. The Commission feels that a sound policy framework and its effective
operationalisation assumes as much importance for managing the surpluses, as for increasing the
production. In the recent years, the pressure of supply on the market has been more intense, due to
augmentation of domestic production of certain commodities and also due to liberal trade regime. Even
in the case of rice and wheat, for which market support mechanism over the years had developed albeit
in iniquitous manner, managing the surplus to safeguard the farmer’s interest on price front was far from
satisfactory. Vulnerability of producer at the receiving end of the non remunerative price is an
increasingly recurring phenomenon. The farmer’s plight is compounded due to his inaccessibility to
correct signals on emerging supply-demand dynamics.
1.5 The softness of domestic prices are generally consistent with the trend of international
prices. The year 2005 opened with recessionary note for several agricultural commodities in the
international market. The moderate buoyancy in early half of 2004 that witnessed the index of
international commodity prices (source IMF) for food items climbing to 105.6 from 86.6 in 2003 and 81.8
in 2002 appears to be short lived as the index has fallen to 93.3 in the last quarter of 2004. While the
price index for rice in January 2005 at 89.9 tried to regain some ground from extreme low levels of 59.8
and 62.2 in 2002 and 2003 respectively, the index for wheat, maize, cotton, oilseeds and edible oils
dropped sharply during 2004. Due to sharp slide by 26 per cent and 33 per cent from January 04 to
January 05, the respective price indices of palm oil and cotton at 64.5 and 52.1 were at their lowest level
in recent years.
1.6 An equally disquieting trend was observed in the case of agricultural trade performance. The
share of agricultural exports in total national exports has been gradually declining, while that of imports
has shown a rising trend. During 2003-04 agricultural exports was only 12.65 percent of total national
exports, substantially lower than 20.33 percent in 1996-97. But the share of agricultural imports in total
imports remained robust at 6.19 percent. The agricultural imports in rupee terms registered an annual
increase of 24.3 percent during 2003-04 over 2002-03 where as the corresponding increase in
agricultural exports was only 6.8 per cent. The rice export, after touching the record 5.06 million tonnes in
2002-03, declined to 3.41 million tonnes in 2003-04. This decelerating trend persisted in the first half of
2004-05. During the current year, the basmati exports has been increased compared to last year. The
wheat export trend this year marginal declined the level of 2003-04, when total export peaked at 4.61
million tonnes. The positive feature of agricultural exports is the emerging export performance of
maize. During first four months of the current year, 0.7 million tonnes of maize has already been
exported which is higher than total annual exports of maize in the past. On the other hand, imports of
edible oil and pulses, the two commodity groups accounting for nearly two third of total agri-imports,
remained large. The imports of edible oil registered a new peak of 5.3 million tonnes during 2003-04 and
that of pulses also remained high at 1.7 million tonnes. The trend is sustained in the year 2004-05 (April
– July) also. Given the general depression in the international prices, vulnerability of domestic market
from such import surges remains high. In fact, the market scenario is far more complex now than it used
to be a few years back. Although, the domestic market is integrating horizontally, but its backward
linkage to production system remains antiquated. Also the forward integration of market with rest of the
world is placing domestic production system at the receiving end of competition from advanced
production systems empowered by huge subsidies in developed countries. The impact of strengthened
rupee on the competitiveness of India agriculture is also not ruled out. What appears to be seriously
lacking in the domestic agricultural system is a framework of policy with flexible options, to take care of
domestic production surpluses and its trade interest. Therefore, the Commission recommends
that Government should formulate an appropriate, albeit integrated policy for surplus
management and trade of agricultural produce and putting in place flexible options for insulating
domestic prices from international volatility, besides appropriate instrument for promoting trade
of domestic surpluses.
1.7 The issue of subsidies to different sectors including the farm sector has occupied central stage of
current debate, as indicated in the Report on Central Government Subsidies in India (December 2004,
Ministry of Finance, Government of India). Expressing the concern on Food Subsidy, which has touched
the level of 0.98 per cent of GDP in 2002-03, the aforesaid report stated, “The rapid increase in food
subsidy in recent years is attributable to what is called the „economic cost‟ of foodgrains, which include
the minimum support prices paid to farmers in the procurement process.” (Para III.1). The said report
further gives an impression, albeit wrongly that the MSP is the major cause for rising food subsidies. In
this context, it should be noted that the economic cost of procurement operation has three main
components viz., MSP (i.e. the payment received by the farmers), procurement incidentals and
distribution cost. The later two are the cash flows to individuals and institutions engaged in food
management, out side the farm sector. These add on factors of economic cost are increasing over the
years far more rapidly. While the MSP of wheat and paddy increased by 1.61 per cent and 1.87 per cent
per annum during 2002-03 to 2004-05, the per quintal add on factors in economic costs increased by 17.4
per cent and 9.0 per cent per annum respectively for these crops in the corresponding period. Besides,
the annual escalation in some of the factors of carrying cost per quintal, such as handling, storage and
administrative over heads had been rising at the rate of 26.3 per cent, 39.3 per cent, 10.7 per cent and
52.0 per cent per annum respectively. Various taxes and levies charged in market institutions in certain
States on the primary transactions of agricultural commodities also were as high as 11.5 per cent,
contributing to procurement incidentals in economic cost. The paradigm of efficiency in marketing and
produce handling rests on reduction in transaction cost. The scope of pruning the procurement cost is
evident for reducing the burden of food subsidies besides, improving efficiency and competitiveness of
procured produce. Further, the decentralized procurement system also needs to be streamlined and
aligned to local needs of TPDS by assigning greater flexibility and resources to the State designated
agencies so that transaction costs for multiple handling of the procured produce for distribution can be
saved. The Commission reiterates its recommendation that decentralized procurement in newly
emerging surplus states, particularly in Eastern India, needs to be made more effective, efficient
and streamlined not only to reduce the transaction and distribution costs but also to bring the
element of equity in safeguarding the interest of farmers.
1.8 The unabated farm subsidies in developed countries and mounted pressure on developing
countries for tariff reduction have clouded the on going agricultural trade negotiations in WTO. Further,
the reality of developing South and East Asian regional economic cooperation will be evolving the era of
competitive coexistence. The inescapable route for agrarian development is the enhancement of
competitiveness and consolidation of comparative advantage. This brings to focus the essence of market
oriented research and technological development and its delivery to farmers. In this context, one
important area of concern is the problem in seed sector, where gap between Lab and Land continues to
persist, particularly in the case of oilseeds and pulses. Due to the gap in production of foundation seeds
and subsequent seed multiplication, the problem of non availability of quality seeds remains
unaddressed. Many of the newly formed States do not even have seed corporations of their own. Also in
the States where seed management was established over the years. the tendency of disposing of Seed
Farms on the ground of their poor performance has further eroded the capability of seed programmes in
the country. Even the available seed farms are reported to be functioning inefficiently. Down the line, the
system of seed delivery and back up knowledge for seed application and replacement to the farmers is
reported to be functioning in a manner far from satisfactory. Considering the paramount importance of
quality seeds in enhancing cost competitiveness, the Commission recommends that there should be a
comprehensive review of seed management in the country covering research, seed multiplication,
distribution, quality assurance and knowledge dissemination and putting in place proper seed
supply system in the mode of public-private participation.
1.9 In recent years, the socio economic stress on the farming community in different parts of the
country have culminated into bizarre consequences. The recurring drought and other incidences like pest
attacks and spurious inputs have inflicted serious crop losses and financial burden on farming
community. The unbearing circumstance, have forced several farmers to take extreme steps of
committing suicide. Belying the general belief that such incidences have mainly occurred in non-cereal
based arid farm economies in parts of peninsular India, these disturbing phenomenon have also surfaced
in the relatively developed state like Punjab. The Commission undertook a rapid appraisal of ground
realities and observed that the victims were generally small and marginal farmers, having high debt
burden. The main reason for indebtedness was the compulsion to improve irrigation sources by digging
deep bore wells. Even after accessing the water sources, the crops had not fared well due to poor quality
of inputs and lack of power to irrigate the crops in time. The high share of non institutional credit had
further choked their social and economic conditions. Unsupportive market dented their debt serving
capabilities. These dark aspects of Indian agriculture aptly sum up the failure of farm support delivery
and markets which are crucial for accelerated and diversified agricultural growth. Though it is heartening

to note that Government has targeted to improve the flow of institutional credit to farm economy
substantially in the next two years, it is important to recognize that availability of credit alone may not be a
remedy. If the availability of quality inputs namely seeds, pesticides, fertilizers and irrigation is not
improved, farmers may not derive lasting gains from the easy credit. Already, the current production
season is witnessing dislocation in the availability of fertilizer due to uncertainty in the input market on
policy guidelines. Linked to the credit and associated issues of assured availability of quality inputs, the
institutional role for risk management in agriculture also remains a grey area. Though the Government
has taken several initiatives to revamp the national agricultural insurance scheme in the country and the
macro indicators of insurance performance suggest that claim premium ratio is as high as 4:1 but the
problem of farming risk in production and in the market still remains largely un-addressed. Considering
the inter-linkages between credit, input delivery and associated risk in farming, the Commission
recommends that the issues of credit, input delivery and associated risk in farming should be
addressed in a holistic manner and multiplicity of institutions involved in delivering these
services at the grass root level be minimized. The delivery of these services should be
streamlined so that procedural hassles do not act as de-motivator for farmers.
1.10 Forward looking Indian agricultural needs to be geared up for newer market realities and
consumer concerns. The issue that has lately assumed great significance is that of food safety. Two
main dimensions that need to be addressed seriously and expeditiously are (a) the porous and poor
quality regime in the domestic market which makes it vulnerable to easy flow of inferior products from rest
of the world, and (b) domestic production not meeting the Sanitary and Phyto-sanitary (SPS) conditions of
consumption destination which will fail to gain market access. Both these dimensions have potential to
cause aberrations in country’s agricultural development strategy, domestic market and farm economy. In
the similar context, the issue of pesticide residue in the various domestic agricultural produce has
emerged as an area of concern. Interestingly, this problem has surfaced when the pesticide use in the
country is much lower than several other countries. The reasons for this paradoxical state of affairs are
mainly the lack of knowledge amongst the farmers for pesticide use, wide prevalence of spurious
pesticides, weakness in surveillance and quality control system, absence of proper labeling on pesticide
products and non sustainability of integrated pesticide management (IPM) programme amongst the
farmers. Though at apex level the concern on these food safety issues has been expressed quite
appropriately, the involvement of various departments and ministries and lack of proper coordination
between them have been hampering the speedy redressal of issues and in providing specific policy and
implementation strategy. At the same time, farmer’s awareness on food safety and food quality issue is
also negligible. The Commission recommends that high priority be attached to address the issues of
food safety and food quality. There is urgent need to bring all the dimensions of market access
both of tariff and non tariff nature under unified umbrella. Further, the information on various SPS
conditions on different products be consolidated and disseminated for the knowledge of all
stakeholders.
1.11 It needs to be understood that in the era of globalization, the agricultural policies would require
modulation for structural adjustment of domestic agrarian systems and emerging requirements of market
integration. In this context, the year 2005 may also turn out to be a watershed for agriculture world-over,
if the WTO members conclude their hectic efforts of on going negotiations on Agreement on Agriculture
(AoA) by the next summit scheduled to be held in December, 2005 at Hongkong. Culmination of these
negotiations, on implementation over next ten years or so will have far reaching consequences on
agricultural policies and development strategies of all member countries. Several asymmetries and
lacunae had already got exposed since the maiden initiation of AoA in 1995. Since the on going
negotiations are endeavored for furthering the process of reforms in agricultural trade enshrined in the

preamble of AoA in accordance with the Article 20 of AoA envisaging that this process should take note
of the experiences of implementation of agreement, the opportunity of correcting the course should not be
lost in the outcome of the negotiations. It should be appreciated that due to ambiguous provisions of AoA
in 1995, there has been no meaningful reduction in subsidies given to the respective agriculture by the
developed countries. Rather the subsidies in such countries have increased. Taking the advantage of so
called nomenclatures of minimal and less trade distorting domestic support, the reduction commitments of
the agreement were very conveniently circumvented. Resultantly, the developed countries have been
able to increase the unfair competitiveness for their farm produce. At the same time, the tariffs reduction
commitments exposed the domestic production of developing agrarian economies like that of India to
unfair competitions, breaching the vulnerability of large farm dependent population. Therefore, if the
outcome of negotiation drill is unable to address the definitional laxity in the domestic support for
meaningful reduction in subsidies and bringing checks on the scope of shuffling the subsidies away from
reduction commitments then the prevailing distortions will earn credibility for further accentuation. It is felt
that the framework of negotiation arrived at in July 2004 is not addressing this core area adequately. The
framework, is more emphatic on market access issues seeking tariff reduction for furthering the reform
process. In the long term perspective, the complacency that the framework is taking care of India’s
defensive interest may evaporate when the agreement will come up for further negotiation and the tariffs
will be under further pressure for reduction, whereas the distorting domestic support would get firmly
cemented. Since there are strong inter-linkages between the three pillars of the agreement viz.
market access, domestic support and export competition, the Commission expresses its concern
on the ongoing process of negotiations and recommends that India should not deviate from its
negotiating stand in WTO that the reform process can not be carried forward on the firm
commitments of market access alone without bringing meaningful and effective disciplines on all
kinds of trade distorting domestic support by developed countries. Since, for developing
countries, tariff is the only means of protection from unabated domestic support given by
developed countries, India’s negotiating posture on market access issues should match the
unrelenting posture of developed countries on domestic support. The provisions of Special and
Differential treatments for developing countries should be effective and not mere expressions of
best endeavour.
1.12 Besides, the international trade environment is witnessing significant changes due to
liberalization through bilateral and regional agreements. In this process, a few Free Trade Agreements
(FTAs) have already come into existence and more are likely to be signed in the future. There is a need
to adopt utmost caution in consideration of agricultural commodities in the FTAs. Already, the ripples
from FTA with Sri Lanka have been felt. It is learnt that investments being made for additional edible oil
refining capabilities in Sri Lanka may increase the duty free edible oil imports in India, circumventing the
provisions of rules of origin. The Commission recommends that Government should take utmost care
and examine all pros and cons while considering the agricultural commodities in the FTAs and in
bilateral and regional trade liberalization agreements.

II. PRICE SUPPORT OPERATIONS, CROP SITUATION,
MARKET BEHAVIOUR, PROCUREMENT,
DISTRIBUTION AND STOCKS
Minimum Support Price
The Commission submitted its Report on Price Policy for Kharif Crops of 2004-05 on April 23, 2004 recommending, inter alia, that the Minimum Support Prices (MSP) for fair average quality (FAQ) of various crops be fixed at the following levels. (Rs.per quintal)
Crop Variety MSP fixed by MSP recommended MSP fixed by
Government for by CACP for Government for
2003-04 Season 2004-05 Season 2004-05 Season
1 2 3 4 5
Paddy Common 550 560 560
Paddy Grade `A’ 580 590 590
Jowar 505 515 515
Bajra 505 515 515
Maize 505 525 525
Ragi 505 515 515
Tur(Arhar) 1360 1390 1390
Moong 1370 1410 1410
Urad 1370 1410 1410
Groundnut-in-shell 1400 1500 1500

Soyabean Yellow 930 1000 1000
Soyabean Black 840 900 900
Sunflower-seed 1250 1340 1340
Sesamum 1485 1500 1500
Nigerseed 1155 1180 1180
Raw Cotton
(Kapas) F-414/ 1725 1760 1760
H-777/J-34
Raw Cotton
(Kapas) H-4 1925 1960 1960
VFC Tobacco Black soil
F2 Grade 3100 3400 3200
VFC Tobacco Light soil
L2 Grade 3300 3600 3400
2.2 The Government announced the kharif price policy for cereals, pulses,
oilseeds and raw cotton on August 10, 2004 fixing the MSPs at levels
recommended by the Commission. Subsequently, the Textile Commissioner
fixed the MSPs for different varieties of raw cotton on August 27, 2004
keeping in view the normal market price differentials and other relevant
factors, namely staple length and micronaire value. The government
announced its price policy for tobacco on 7 October, 2004 and fixed the MSP
at Rs.3200 per quintal for F2 grade and at Rs.3400 per quintal for L2 grade.
These prices were, however, lower than the prices recommended by the
Commission.

Price Support Arrangements
2.3 The Government notified the uniform specifications of paddy, rice and
coarse grains for the kharif marketing season 2004-05 on August 31,
2004. There was no major change in paddy specifications from what were
notified in 2003-04. However, with a view to improve the quality of rice
supplied under Public Distribution System (PDS) the limit of 10 per cent
admixture of lower class in grade ‘A’ paddy and rice was reduced to 8 per cent
in 2004-05. The maximum moisture limit was fixed at 17 per cent for paddy,
14 per cent for jowar, bajra and maize and 12 per cent for ragi. The Central
Government also announced the levy prices of rice, common as well as grade
A varieties in both raw and par-boiled form. However, following the requests
from State governments, the Central Government allowed relaxation in
respect of quality of paddy/rice procurement with certain value cut in the case
of Madhya Pradesh, Orissa and Tamil Nadu. In case of Madhya Pradesh and
Orissa, the relaxation allowed in respect of dried, sprouted and weevilled grain
were upto a maximum of 4 percent and 5 percent respectively of the total
procured grain. The moisture content for Tamil Nadu was raised to 20 per
cent with full value cut. The Haryana government while seeking relaxation in
specifications sought an allowance from 2 to 3 per cent for damaged grain
because of un-seasonal rains but did not pursue the matter due to fear of
imposition of a value cut.
2.4 The Central Government relaxed the standard quality norms in case of
maize for Andhra Pradesh by allowing upto 2.5 percent damaged and 7 per
cent shrivelled and immature grain with corresponding value cut.
2.5 The grains purchased under relaxed conditions generally deteriorate
faster than FAQ grain. Since the quality of paddy/rice of the Kharif marketing
season mostly meet the prescribed standards, its disposal may not pose any
problem. However, the state may continue to face serious problems in

disposing of the coarse cereals. These grains are generally disposed off
through tenders, but have to be auctioned if their quality deteriorates beyond
normal standards. The procedure involved in clearing stocks of coarse cereals
is quite time consuming. The state governments may be asked to procure
these grains also for distribution through PDS in their respective states. In
case the procuring states find some difficulty in their disposal, these grains
may be sent to the neighboring states. A beginning was reportedly made in
this respect in 2004-05. Maize procured by Karnataka government was
dispatched to Gujarat for public distribution in tribal pockets of the state.
2.6 As a result of promulgation of the Central Government’s order ‘Removal
of Licensing requirements, Stock limits and Movement Restrictions on Special
Foodstuff Order, 2002’,dated 15thFebruary, 2002 dealers are free to buy, use
or consume, stock, sell, transport, distribute, dispose any quantity of
paddy/rice, wheat, coarse grains, sugar, edible oilseeds and edible oils
without requiring any permit or license. Though laxity in restrictions has
facilitated the free movement of agricultural commodities, but has not helped
farmers because marketing bye-laws in many states still require grains, fruits
and vegetables to be channelised through designated mandies.
Consequently, the restriction on entry of buyers in the market fails to produce
the desired buoyancy.
2.7 The Central Government has prepared a Model Agriculture Produce
Marketing Act to free the growers from many of these obligations and the
state governments are being encouraged to adopt the Act in their respective
states. However, some state governments apprehend that the Model Act
contains radical reforms which could belittle the importance of mandies and
lead to large retail stores/chains and companies exploiting farmers after
making them a party to the loaded contracts. Some states also feel that they
would lose important sources of revenue due to reduction of purchase tax,
market fees etc. as indicated. The Commission recommends that the Central
Government should take necessary steps to remove all apprehensions
on the part of state governments about various marketing reforms, as

contained in the Model Agriculture Produce Marketing Act and also
provide institutional support to ensure that farmers are not unduly
exploited in the process of implementation of any such reforms.
2.8 Some state governments like Punjab and Haryana impose various
charges and taxes, which are added to the procurement cost. These taxes
and levies account for 11.5 per cent of procurement price in Punjab and 10.5
per cent in Haryana. Besides, some state governments impose entry tax
when paddy is brought to their states from other states for milling. The State
like Rajasthan also imposes tax when edible oil extracted from oilseeds
bought under MSP operations is taken out of the state. These taxes and
levies are entirely passed on to Central government agencies when they take
over the grain and oilseeds bought under MSP operations. The
Commission reiterates its recommendation made in its report for rabi
crops of 2000-2001 that state governments should reduce statutory
charges on purchase of cereals to a combined maximum of 4 per cent,
including all taxes and cesses, mandi charges and payments to
commission agents. The Commission also recommends that state
governments should refrain from taxing primary products brought in or
taken out of the states by agencies designated to undertake minimum
support operations.
Rice*
2.9 According to the Second Advance Estimate (19.01.2005) released by
the Directorate of Economics and Statistics, the production of rice estimated
at 87.80 million tonnes during 2004-05 is likely to show a marginal decline of
about half a
-------------------------------------------------------------------------------------------------------
---
* This section is focused on rice. However, for a comprehensive view of the

foodgrains situation, wheat situation is also discussed later in the section.
million tonnes over previous year’s production of 88.28 million tonnes and a
substantial decline of 5.44 million tonnes over the record production of 93.3
million tonnes achieved in 2001-02. The estimates received from states,
indicate that the production increased in Andhra Pradesh by 1.6 per cent to
9.10 million tonnes, Chattisgarh by 4.6 per cent to 6.2 million tonnes, Punjab
by 7.7 per cent to 10.4 million tonnes and Haryana by 6.9 per cent to 2.9
million tonnes and Tamil Nadu by 68.9 per cent to 5.4 million tonnes. As
against this the production declined in Madhya Pradesh by 72 per cent to 5
lakh tonnes, Orissa by 1.3 per cent to 6.6 million tonnes, Uttar Pradesh by
19.4 per cent to 10.5 million tonnes and in West Bengal by 1.6 per cent to
14.4 million tonnes. Despite regional variations, production at the aggregate
level maintained its long term tempo of growth. The compound annual growth
rate of rice production at All India level was 1.15 per cent due to acreage
expansion of 0.12 per cent and a yield enhancement of 1.03 per cent per
annum during the period between 1990-91 and 2003-
04. (Table
2.1)
2.10 The productivity of rice in the states of Punjab and Haryana has
reached almost a plateau with near stagnant growth rates. The growth in yield
recorded between 1990-91 and 2003-04 was 0.93 per cent for Punjab and
0.19 per cent for Haryana. However, area under rice increased both in Punjab
and Haryana by 2.26 per cent and 3.52 per cent per annum respectively, due
to assured price and market intervention. The increase in the area under
paddy in these two states has become a cause of concern because paddy-
wheat crop rotation which tends to deteriorate the soil health and also deplete
ground-water, may pose a serious risk to sustainability of agriculture in the
long run. The Commission being concerned about the emerging
environmental, land degradation and water scarcity problems in Punjab and
Haryana feels that the time has come to diversify agriculture in Punjab and
Haryana from the existing paddy cultivation, which is a high water consuming
crop to other crops. The states of eastern India including Assam, Bihar,
Chattisgarh and Orissa are emerging surplus states despite having yields

much below the all India average. Compared to national average yield of
2077 kgs per hectare in 2003-04, the respective yields recorded in these
states were 1534, 1516, 1455 and 1511 kgs per hectare. In view of the
favorable agro-climatic conditions prevailing in these states, the main thrust
should be on raising the productivity and making suitable arrangements for
purchase, storage and milling for making support price operations more
effective.
Market Behaviour, Procurement, Distribution, Stocks, Demand & Supply
Balance, Trade.
2.11 The market prices of rice remained subdued in 2004-05. The average
index number of wholesale prices of rice for ten months (April-January 2005)
at 167.8 showed a fall of 1.10 per cent over the corresponding period of last
year, but stood firm at 168.4 in January 2005. During the post harvest months,
the wholesale prices of paddy ruled below MSP in many states. For example
against MSP of Rs.560 per quintal for common variety of paddy, it was sold in
January 2005 at Rs.535 per quintal at Mainpuri, Rs.545 per quintal at Attara in
December 2004 in Uttar Pradesh, Rs.515 per quintal at Sainthia, and Rs.540
per quintal at Bankura (West Bengal) in January 2005. As far as defending
MSP is concerned, the states that have opted for decentralized procurement
have not shown the required alertness that was expected from them once
they had formally undertaken the task of handling minimum support price
operations.
(Table 2.14 &
Annexure – I)
Procurement
2.12 Procurement of rice recorded at 17.9 million tonnes during 2004-05 ( as
on February 25, 2005) was higher than 16.4 million tonnes procured in the

corresponding period of 2003-04. Maximum procurement of 8.7 million
tonnes was made in Punjab followed by 2.2 million tonnes in Chattisgarh, 2.1
million tonnes in Uttar Pradesh, 1.7 million tonnes in Andhra Pradesh and 1.6
million tonnes in Haryana. In addition, purchases of paddy/rice were also
made in Tamil Nadu, West Bengal, Maharashra and
Uttaranchal. (Table 2.8)
2.13 The Government of India took a decision in 1999 to introduce
decentralized procurement of foodgrains. Under this scheme, the designated
states are required to procure, store and also issue foodgrains as per
allotment indicated by the central government under PDS. The scheme of
decentralized procurement of foodgrains is presently in vogue in the states of
Chattisgarh, Tamil Nadu, West Bengal, Madhya Pradesh, Uttar Pradesh and
Uttaranchal. The perceived advantages of decentralized procurement were
that it would avoid crisscross movement of grain and minimize the cost of
transportation. Besides, the state governments would be vigilant in
safeguarding MSP; and also the quality of procured grains would be suitable
for the local tastes. However, the working of decentralized procurement in
some states has not been satisfactory. The line of credit sanctioned from
Reserve Bank of India operated through the consortium of banks is released
in time to state governments, but the primary cooperative societies that
undertake procurement at field level often face problems of liquidity. The
expenses incurred on account of milling and interest payments after the
procurement are reportedly not reimbursed promptly by the central
government. The state governments also do not have the adequate storage
facilities. The Commission recommends that the Department of Food and
Public Distribution should make a state-wise evaluation of the working
of decentralized procurement for removal of operational hitches and
smooth operations of procurement.
2.14 It has been brought to the notice of the Commission that the existing
framework of safeguarding the interest of farmers for wheat and paddy
through MSP operation is inadequate and is not tuned with emerging trade
realities. The MSP for paddy are currently recommended for two varieties viz.
paddy common and paddy Grade A and that of wheat without varietal
specification. The High Level Committee on Long Term Grain Policy had,
however, recommended for MSP fixation for only one variety of paddy. But it
is also a fact that there are certain broad varietal classifications in respect of
both wheat and rice, commanding differential price in the market on account
of their specific demand both in domestic as well as international
markets. The varieties like durum wheat and basmati rice generally are grown
in distinct cropping conditions and have niche market. However sometimes,
market prices of these superior variety of rice and wheat tend to get
depressed which may require intervention by the government. Further, with
the importance of international trade, the varieties need to be harmonized with
the varietal specification of traded wheat and paddy (rice) for their exports.
The Commission reviewed the aspect of varietal specifications for MSP of
wheat and paddy and accordingly recommends that the Government may
consider announcing separate MSP for durum wheat and basmati paddy
in addition to MSPs for common wheat and common variety and Grade
‘A’ Paddy and accordingly put in place a system to defend the same in
the market.
Offtake
2.15 Total offtake of foodgrains in 2004-05 (upto December, 2004) rose to a
level of 28.73 million tonnes. Of this, the respective offtake of rice and wheat
was 15.97 million tonnes and 12.76 million tonnes. Compared to last year,
the offtake of rice was lower by 3 million tonnes and that of wheat by 5.5
million tonnes. The offtake of rice was 11.5 million tonnes under TPDS and
4.4 million tonnes under other schemes. The various measures taken by the
government to monitor offtake of food grains include:-
(a) Increase monthly scale of issue under the PDS to 35 kg per
family w.e.f. April 2002;
(b) Freeze the Central Issue Prices (CIP) of foodgrains for BPL and
APL families at the levels of July 2000 and July 2002 respectively;

(c) Implementation of the foodgrains based Sampoorna Gramin
Rojgar Yojana (SGRY);
(d) Allocation of foodgrains under the Food for Work and the special
component of the SGRY programme;
(e) Expand the scope of Antyodaya Anna Yojana to cover an additional
100 lakh BPL families; and
(f) Discontinue the practice of permitting export of foodgains from
governments stocks.
(g) Continue the open market sale of stock of wheat and rice.
(Table 2.11)
2.16 The current scenario of moderate procurement and relatively high
offtake indicates a change in situation from the one that prevailed three years
ago. The view held at that time was that the existing mechanism of
announcing minimum support prices backed by government agencies
undertaking procurement for government should be dismantled as it was
causing excess production and procurement resulting in excess burden on
Government for holding unnecessary stocks. The alternative policy
prescription that followed called for disbanding the existing institutional
mechanism and replacing it by a farm income insurance scheme. However,
the Commission is not sure whether the alternative policy would be
economically more viable and sustainable. Similarly, the prevailing public
distribution system is being criticized and some wings of the Government are
examining certain alternatives such as providing food stamps in place of

physical transfer of grain. The Commission is in favour of a detailed
evaluation of these alternatives before implementing them.
2.17 As large number of persons depend on agriculture for their livelihood
and can’t bear the market shocks, the Commission feels that the existing
mechanism of price support and public distribution system should
continue and be made more efficient to meet food requirements of
Indian population from domestic production. Also the PDS should be
strengthened in Eastern and Central regions where there is high
concentration of poor people and yet the off-take is relatively low.
Stocks
2.18 The stocks of rice and wheat, which reached a record high level of 64.7
million tonnes (23.4 million tonnes of rice and 41.3 million tonnes of wheat) on
June 1, 2002, came down to 20.3 million tonnes on 1st October,
2004. Following procurement of paddy/rice during kharif 2004, the level of
stocks went up to 21.7 million tonnes (12.8 million tonnes of rice and 8.9
million tonnes of wheat) on 1st January, 2005 as compared to11.7 million
tonnes of rice and 12.7 million tonnes of wheat as on 1st January, 2004. The
likely stock of rice estimated at 16.6 million tonnes as on April 1, 2005 has
been marginally higher than the stipulated buffer norm of 11.8 million
tonnes. Similar is the case of wheat where the official stock estimated at 4.63
million tonnes is higher than the buffer norm of 4.0 million tonnes as on April
1, 2005, as can be seen from the table below:

Projected Stocks in the Central Pool
(Million Tonnes)
________________________________________________________________
Rice Wheat
Official Stock as on 1st January 2005 (Rounded off) 12.76 8.93
Likely Procurement during January-March 2005 9.10 0.00
Likely Offtake during January-March 2005 5.29 4.30
________________________________________________________________
Likely Stock as on 01.04.05 16.57 4.63
Likely Procurement 2005-06 20.00 18.00
Likely Offtake 2005-06 21.29 17.00
Likely Stock as on 01.04.06 15.28 5.63

Buffer Norm requirement for 1st April, 2005 11.80 4.00
________________________________________________________________
Demand and Supply
2.19 Based on data of average consumption of rice and wheat as revealed
in the 55th
Round of NSS (1999-2000) and using Population Census (2001)
data for extrapolating growth of population with annual growth rate of 1.9 per
cent, consumption demand for rice and wheat has been broadly worked out
as given in the table below.
Annual consumption

*
:
We
igh
ted
ave
rag
e
of
rur
al
an
d
urb
an
con
su
mp
tion with respective population size as weights.
Source : NSS- 55th Round (1999-2000)
2.20 The above calculations seem to inflate the consumption data as the
growth in demand for cereals is likely to be lower than the growth in
population. At the same time, it needs to be mentioned that NSS consumption
data does not account for non-household consumption. Accordingly, the
demand for rice is estimated at 86.64 million tonnes and wheat at 62.60
million tonnes in 2005-06.
(Million Tonnes)
Per Person
Per Month 2001-02 2002-03 2003-04 2004-05
2005-06
Consumption (Kg.)*
Rural Urban
Population - 1047 1066 1086 1106 1127
(Million)
Rice 6.75 5.21 80.49 81.95 83.49 85.03 86.64
Wheat 4.49 4.76 58.16 59.21 60.33 61.44 62.60

2.21 Based on the projections made earlier and data on gross production,
the situation that emerges in respect of overall supply of rice and wheat during
the fiscal year 2005-06 is presented below alongwith corresponding data for
the preceding three years:
Domestic Rice Situation
(Million Tonnes)
Crop Year (July-June) 2001-02 2002-03 2003-04 2004-05
Fiscal Year (April-March)
2002-03
2003-04
2004-05
2005-06
Projected
1. Gross Production 93.34 72.66 88.28 87.80
2. Net Production 81.67 63.58 77.25 76.83
(87.5% of Gross Production)
3. Procurement 22.13 16.42 22.83 20.00#
24.85 25.04 21.42 21.29

4. Offtake FY of which
(a) Export Sale 5.06 3.41 1.50# 1.00#
(b) Open Sale 0.40 0.39 0.40 0.10
5. Addition to Stock (3-4) -2.72 -8.62 1.41 -1.29
6. Supply (Gross)
[2-3+4-4(a)]or[2-5-4(a)] 79.33 68.79 74.34 77.12
7. Basmati Export 0.71 0.77 0.60 0.60
8. Supply (Net) [6-7] 78.62 68.02 73.74 76.52
9. Average Stock in excess of 11.32 2.10 1.12 1.50
Buffer Norm*
10. Supply Potential (8+9) 89.94 70.12 74.86 78.02
11. WPI (1993-94=100) 166.00 168.80 167.80
# : Anticipated figures.
* : This is defined as an average of actual stock minus as average of buffer
norms at four points of time, namely, 1st April, 1
st July, 1
st October and
1st January. This is perceived by the market not as a dead stock but as
A source of potential supply, which tends to weigh down speculative
expectations about rising prices.
Source : Food Bulletin, January, 2005, DGCIS and FCI
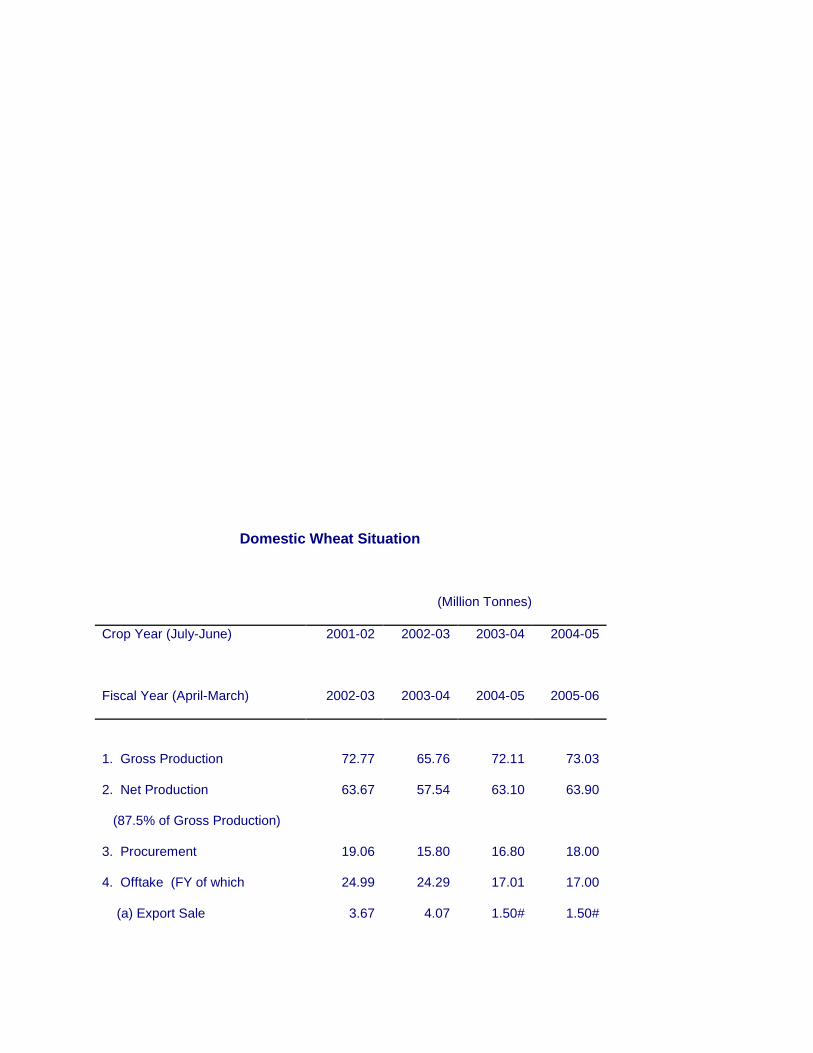
Domestic Wheat Situation
(Million Tonnes)
Crop Year (July-June) 2001-02 2002-03 2003-04 2004-05
Fiscal Year (April-March) 2002-03 2003-04 2004-05 2005-06
1. Gross Production 72.77 65.76 72.11 73.03
2. Net Production 63.67 57.54 63.10 63.90
(87.5% of Gross Production)
3. Procurement 19.06 15.80 16.80 18.00
4. Offtake (FY of which 24.99 24.29 17.01 17.00
(a) Export Sale 3.67 4.07 1.50# 1.50#

(b) Open Sale 5.27 0.93 0.16 1.00
5. Addition to Stock (3-4) -5.93 -8.49 -0.21 1.00
6. Supply (Gross)
[2-3+4-4(a)]or[2-5-4(a)] 65.93 61.96 61.81 61.40
7. Average Stock in excess of 23.32 8.16 12.00 2.73
Buffer Norm*
8. Supply Potential (6+7) 89.25 70.12 73.81 64.13
9. WPI (1993-94=100) 175.70 181.40 183.30
# : Anticipated figures.
* : This is defined as an average of actual stock minus as average of buffer
norms at four points of time, namely, 1st April, 1
st July, 1
st October and
1st January. This is perceived by the market not as a dead stock but as
a source of potential supply, which tends to weigh down speculative
expectations about rising prices.
Source : Food Bulletin-January 2005, DGCIS and FCI
2.22 The supply of rice and wheat has been estimated on the assumption
that the entire net production of a crop year is available in the following fiscal
year. This may be true in the case of wheat but partially true in the case of
rice. Nevertheless, this procedure is useful since the purpose is not to
calculate the exact quantum of supply but only to compare supplies as
obtained on the same assumptions over time. On this basis, the supply of rice
is likely to increase marginally in 2005-06 but still fall short of demand. This
may cause some rise in prices of rice. The scenario is entirely different for
wheat. The net availability of wheat even during the drought year of 2002-03
was in excess of household consumption demand and is likely to remain so in
2004-05 and 2005-06.
Trade Prospects
2.23 Based on FAO data base (Food Outlook December 2004), the world
rice production estimated at 408 million tonnes in 2004-05 is higher than
previous year’s production by about 18.8 million tonnes. Global trade at 26.1
million tonnes in 2004 is forecast to contract in 2005 to a level of 25.2 million
tonnes. The contraction is due to supply constraints in some of the major
exporting countries especially Thailand, India and Uruguay. The expected
export of 1.9 million tonnes of rice from India in 2005 would consist mainly of
basmati and par boiled rice. The overall increase in exports is anticipated
from China, Pakistan, United States, Vietnam and Egypt.
2.24 On the demand side, export of rice is predicted to increase EU and
Africa. The EU is expected to import about 1.0 million tonnes. The other
importers will include Brazil, China, Iran, Philippines and USA.
2.25 FAO’s forecast for global rice stocks at the close of 2004 is 99 million
tonnes. However, the year end stocks being less than the opening level by 4
million tonnes would represent a decline in stocks for the fifth consecutive
year.
World (Milled Situation)
(Million tonnes)
--------------------------------------------------------------------------------------------------------

2002-03 2003-04 2004-05 forecast
-------------------------------------------------------------------------------------------------------
1. Production @ 382.0 389.4 408.2
2. Exports* 27.7 26.1 25.2
3. Utilisation 406.1 406.9 412.2
4. Carryover Stocks** 118.5 102.9 98.8
Main Exporters $
1. Opening Stock 93.0 83.3 68.3
2. Production 172.5 163.6 180.5
3. Imports 0.9 1.4 0.9
4. Supply(1+2+3) 266.0 248.3 249.7
5. Domestic Use 162.8 159.8 162.7
6. Exports 19.9 20.1 19.7
7. Closing Stocks 83.3 68.3 67.3
-----------------------------------------------------------------------------------------------------------------------
@ : Data refer to the calendar year of the first year shown.
* : Trade in rice refers to the calendar year of the second
year shown 2002, 2003 (estimated) & 2004 (forecast)
**: Crop year ending in the year 2002,2003(estimated) & 2004 (forecast)
$ : Includes US, Thailand, China, Pakistan and Vietnam.
Source : FAO, Food Outlook, December, 2004.
2.26 Despite lower global supplies of rice, particularly that of the major
exporting countries, prices remained depressed. There were, however, signs
of a turn around at the end of the year. Based on FAO’s data base, world
reference price of rice (Thai 35 per cent broken) stood at $210 per tonne in
quarter October-December 2004 compared to $159 per tonne in the

corresponding quarter of 2003. It may be recalled that the world reference
price of rice showed a continuous declining trend during later half of nineties
and calendar 2001. Thereafter, it had shown some recovery and the
reference price in December 2004 stood at $257.3 per tonne. The prices are
likely to firm up in 2005 due to lower carry over stocks.
Coarse Cereals
2.27 According to the Second Advance Estimates (as on 19/1/05) the
production of Kharif coarse cereals during 2004-05 is estimated at 24.6 million
tonnes and the total production of coarse cereals of 31.88 million tonnes for
the year. Production in 2004-05 was 6.25 million tonnes lower than that in
2003-04. The maximum production of 13.58 million tonnes of maize was
followed by jowar 7.53 million tonnes, bajra 6.46 million tonnes and ragi 2.45
million tonnes. With less than 8 percent of area under irrigation, coarse
cereals like jowar, bajra and ragi are completely dependent on the vagaries of
the weather. The lower production of coarse cereals in 2004-05 kharif was
due to a prolonged break in the monsoon in July. The production of jowar and
ragi in 2004-05 showed a respective increase of 5.17 per cent and 21.29 per
cent over the previous year. During the same period the production of bajra
and maize declined by 46.70 per cent and 9.04 per cent
respectively. (Table 2.1)
2.28 Among coarse cereals only maize exhibited a positive trend in growth
with the acreage under irrigation also showing an increase. On the demand
side, coarse cereals as a group suffer from chronic deficiency in demand vis-
à-vis supplies. For most coarse cereals, the demand is also localized with
jowar confined to Karnataka and Maharashtra and bajra being restricted to
Gujarat, Maharashtra and Rajasthan. Successive NSS surveys have shown
that people are eating lesser and lesser quantities of coarse cereals. Even
poor people have changed their food habits in favour of rice and
wheat. Increased accessibility to wheat and rice through PDS and rural
development schemes is also considered to be a reason for the change in
dietary habits of people, particularly of those in the target groups. There is no
evidence of rising demand for coarse cereals as animal feed. Further, there is

also no export demand, except that of maize, due to their lack of price
competitiveness. The future sustainability of coarse grains production lies in
expanding both direct and indirect consumption in the form of fodder,
processed foods and beverages as well as increased industrial
consumption. The position with regard to individual coarse cereals is
illustrated below:
Jowar
2.29 Production of jowar in kharif 2004-05 estimated at 3.94 million tonnes
(19/1/2005) is significantly lower than the production of 4.9 million tonnes
achieved in 2003-04. The total production of 7.16 million tonnes in 2003-04
was 2.22 million tonnes lower than the peak production of 9.38 million tonnes
achieved in 1992-93. During the period between 1990-91 and 2003-04,
production of jowar decelerated sharply by 3.55 percent per annum as
compared to a slower decline of 0.87 per cent per annum observed during the
eighties. The decline in production was attributed to acreage shifts which
were significant in the states of Andhra Pradesh, Gujarat, Rajasthan, Tamil
Nadu, Madhya Pradesh and Orissa, while in the two largest producing states
of Maharashtra and Karnataka, the magnitude of decline was smaller. This
could be because jowar forms a part of the staple diet of households in
Maharashtra and
Karnataka.
(Table 2.1)
2.30 The yield of jowar remained stagnant at around one tonne per hectare
during last twenty years. The annual yield of jowar during nineties registered a
growth of 4.04 per cent in Andhra Pradesh and 1.02 per cent in Madhya
Pradesh. The yield recorded at 1038 and 1066 kgs per hectare respectively in
these two states in TE 2003-04 was higher than 766 kg in Maharashtra and
645 kg per hectare in Karnataka.
2.31 Following the decline in production the average WPI of jowar (base
1993-94=100) stood at 232.8 in April, 2004 to January, 2005. This was higher
than the index of corresponding month of the previous year by 6.7 per cent.

Among cereals, the steepest increase was observed in the price of jowar in
recent
years.
(Table 2.14)
2.32 Inspite of the overall favourable price scenario, there were instances of
prices ruling less than MSP in the post harvest months particularly in
Maharashtra. During the marketing season of 2004-05,the price of jowar
ruled between Rs.528 and Rs.532 per quintal at Nagpur (Maharashtra) in
October-December 2004 and Rs.700 to Rs.740 per quintal at Bangalore
(Karnataka) from October 2004 to January 2005. Maharashtra procured
around 9 lakh tonnes of jowar under MSP.
Bajra
2.33 Bajra is grown under rainfed conditions and consequently, its
production fluctuates widely from year to year. At the all-India level, the
production of bajra reported at 6.46 million tonnes in 2004-05 is only half the
production of 12.12 million tonnes in 2003-04. The lower production is
attributed to prolonged break in monsoon in 2004-05. The production in
Rajasthan plummeted to 1.2 million tonnes in 2004-05 as compared to 6.7
million tonnes in 2003-04. The other important states for bajra are Uttar
Pradesh, Gujarat, Haryana and Maharashtra.
(Table
2.1)
2.34 At the all India level, acreage under bajra declined by 1.39 per cent per
annum during the period 1990-91 to 2003-04. Most of the states recorded a
decline in acreage. The annual decline in area was 2.26 per cent in Gujarat,
1.20 per cent in Haryana, 2.33 per cent in Maharashtra, 0.67 per cent in
Rajasthan, 5.79 per cent in Tamil Nadu. However, the yield of bajra showed
an annual increase of 2.70 per cent.
2.35 Bajra has localised demand and also has a short shelf life which,
makes its storage difficult especially under the present methods followed in
harvesting and storage. It has been reported that farmers using traditional
methods of storage were previously keeping the grain for 2 to 3 years at a
time to meet household demand during lean period. The Commission feels
that the traditional methods of storage should be studied for correcting the
post harvest procedures and improving the shelf life of the coarse grain.
2.36 The index number of wholesale prices of bajra (base 1993-94=100)
after reaching a peak of 205.2 in April 2003 declined to 163.9 in June
2004. Thereafter, prices firmed up and the index of wholesale prices stood at
195.7 in January 2005 showing an increase of 17.9 per cent over WPI of
corresponding month of the previous
year. (Table 2.14)
2.37 Month end wholesale prices of bajra quoted during October 2004-
January 2005 were between Rs.525 per quintal and Rs.565 per quintal in
Jodhpur (Rajasthan). The market prices of Rs.475-550 per quintal at Hissar
(Haryana), Rs.400-460 per quintal at Morena (Madhya Pradesh) and Rs.490-
590 per quintal at Pathnordi (Maharashtra) during November-December 2004
remained below MSP of Rs.515 per quintal. MSP operations for bajra were
carried out in three states. Procurement of 1.3 lakh tonnes of bajra in
Haryana, 4302 tonnes in Maharashtra and 320 tonnes in Madhya Pradesh
were made.
Maize
2.38 There has been a significant increase in the area, production and yield
of maize in the country. Area under maize increased from 5.9 million hectares
in 1990-91 (TE) to 6.0 million hectares in 1995-96 and further to 6.8 million
tonnes in 2003-04 (TE). The production during kharif 2004-05 is estimated to
be 11.35 million tonnes as compared with 12.74 million tonnes in 2003-
04. Reports received in the Commission suggest that actual production is
likely to increase in coming years with acreage and productivity increases in
Andhra Pradesh, Karnataka, Punjab and Orissa.
2.39 The production of maize recorded an annual growth of 3.63 per cent
during the period between 1994-95 and 2003-04 which was higher than the
growth rate of rice in the same period. The annual growth of production was
as high as 9.02 per cent in Andhra Pradesh, 7.84 per cent in Gujarat, 3.70
per cent in Karnataka, 8.03 per cent in Maharashtra, and 11.83 per cent in
Tamil Nadu. At an all India level, the yield of maize recorded an annual
growth of 2.18 per cent, while the area under this crop grew by 1.42 per cent
per annum. Technology Mission on Oilseeds, Pulses and Maize has been
implementing Accelerated Maize Development Programme (AMDP) since
1995 in 26 states by covering all the potential districts. Subsequently based
on suggestion from Planning Commission, several programmes were merged
and an Integrated Scheme of Oilseeds, Pulses, Oil Palm and Maize
(ISOPOM) has been implemented from 1st April, 2004. The scheme has also
been restricted to 14 states. The components of AMDP are to be continued in
the Tenth Five Year Plan as well. The earlier thrust on maize research has
paid dividends in the evolution of several hybrids and high yielding
varieties. Thirteen single cross hybrids of early maturity and full season
groups have been released for various agro-climatic zones of the country.
2.40 Although, maize is reported to have diverse uses, besides food and
feed such as industrial raw material in the manufacturing of starch, glucose
etc., The demand for maize could not keep pace with the increase in its
supply and consequently its prices remained subdued. During 2003-04 when
production touched a record level, the annual average WPI of maize declined
by about 4.3 per cent from the level in 2002-03. Subsequently prices
continued to decline till June 2004 when the index of wholesale prices stood
at 182.3. The price picked up and the index reached at 194.9 in August 2004.
With the arrival of the new crop from October onwards, prices began to
decline again and the index stood at 188.8 in January
2005. (Table 2.14)
2.41 During the post harvest months of 2004-05, the MSP of Rs.525 per
quintal for maize breached in several states across the country. The month
end wholesale prices per quintal of maize in October 2004 were quoted below
MSP at Rs.470 at Muzaffarpur (Bihar), Rs.500 at Mandi (Himachal Pradesh),
Rs.400 Mandla (Madhya Pradesh), Rs.435 at Bahraich (Uttar Pradesh),
Rs.480 at Hoshiarpur (Punjab) and Rs.470 per quintal at Gokak
(Karnataka) in October
2004. (Annexure
-1)
2.42 During kharif 2004-05, about 5 lakh tonnes of maize was purchased
under MSP operations. Maximum purchase of 3.1 lakh tonnes was made in
Karnataka followed by 1.9 million tonnes in Andhra Pradesh. Small quantities
were also purchased in Madhya Pradesh, Punjab and Maharashtra. The
possibility of utilizing maize in rural employment programmes of the Ministry of
Rural Development also needs to be explored as the production trends
indicate the likely emergence of larger surpluses of maize.
Ragi
2.43 Ragi production has been hovering around 2.5 million tonnes for the
last twenty years. During kharif 2004-05, the production is estimated to have
remained stable at 2.45 million tonnes. The major ragi producing states are
Karnataka, Tamil Nadu, Uttaranchal and Maharashtra. (Table 2.1)
2.44 Ragi is grown in most of the states by small and marginal farmers
under dry land conditions. There has been a significant decline in the area
under ragi in recent years. The compound growth rate of area under ragi
declined during the period 1990-91 and 2003-04 by 2.81 per cent per annum.
The annual decline of 1.67 per cent in Karnataka was relatively
less. (Table 2.2)
2.45 One of the advantages of ragi crop is that it can adapt to seasonal
changes and may be grown in varying soil types and temperature
conditions. The average yield of ragi is less than 1.5 tonne per hectare in
most of the states except in Tamil Nadu where the yields are relatively higher
at about 2.04 tonnes per hectare. As a cereal food, ragi has desirable
properties in terms of digestibility, slow energy release and high calcium

content. It is a recommended cereal diet for diabetic patients. Ragi is
consumed by poor people within the producing states of India unlike in parts
of Africa where it is considered as a rich man’s food. There exists scope for
manufacturing processed foods from ragi, but entrepreneurs are perhaps not
investing in this sector because of uncertainties in supplies, entrepreneurs are
not investing in this sector. Ragi processed products need to be promoted as
a health food by the state government of Karnataka, Tamil Nadu and
Maharashtra where a certain segment of the population is health conscious.
This could translate into better returns for farmers also.
2.46 The annual average index number of wholesale prices of ragi rose by
10.4 percent in 2002-03 and by another 13 percent in 2003-2004. However
the monthly index on point to point basis declined by 6.8 per cent from
January 2004 to January 2005 when it stood at 182.2. With the arrival of the
new crop during 2004-05, the prices fell below MSP in Karnataka. For
example the price quoted at Rs.440 per quintal in Bangalore in December was
lower than MSP of Rs 515 per quintal. As a consequence, Karnataka
purchased about 2.7 lakh tonnes of ragi under MSP operations. However, the
price ruled much above the MSP in other states. The price per quintal of ragi
was quoted at Rs.681 at Salem (Tamil Nadu), Rs.590 at Nellore (Andhra
Pradesh) and Rs.610 at Gomti (Maharashtra) in the month end of December
2004. Under MSP operations 2.7 lakh tonnes of ragi has been purchased in
Karnataka. (Annexure - I)
2.47 Apart from expansion of domestic demand there is a need to explore
the possibility of exporting the coarse cereals particularly maize. Global
production as well as external trade of coarse cereals is quite high. According
to Food Outlook December 2004, of the total global production of 1013 million
tonnes of coarse cereals nearly half is accounted for by a few exporting
countries namely United States, Canada, Argentina, Australia and
Europe. World Trade is forecast at 102.5 million tonnes. Global prices are,
however, very low as compared to Indian prices. For example, according to
World Bank data base world average reference price of maize (US, No2,
yellow, fob, US Gulf ports) in December 2004 was 95.4 dollars per metric

tonne which is equivalent to Rs.4198 per tonne. Similarly, world reference
price of Sorghum (jowar) (US No2 milo yellow, fob, Gulf ports) in December
2004 ruled at 90.7 dollar equivalent to Rs.3990 per tonne. At these prices,
Indian export of coarse cereals is not globally competitive.
Pulses
2.48 Pulses occupy a prominent space both in the food production basket
as well as consumption profile of the people in India, being a major protein
supplement in their diet. Even in the global perspective, India is the largest
producer of pulses with nearly a quarter share in the world’s production of
about 60 million tonnes. It is also a prime sustainer of livelihood of millions of
farmers engaged in its production in arid and semi-arid zones, mostly with
small and marginal holdings in Central, Western and Southern India. These
leguminous crops are essential adjunct to the crop diversification
strategy. Hence, the pulses has been accorded due importance in the crop
development programmes of the Government. Since 1990, the National
Pulses Development Programme (NPDP) has been brought under the
umbrella of Technology Mission on Oilseeds and Pulses (TMOP). However,
in-spite of significance assigned to the development of pulses in the policy
framework, the production of pulses in the country has remained stagnant,
inconsistent and susceptible to climatic aberrations, often causing imbalance
in its supply vis-a-vis demand. Such susceptibility is particularly high for the
Kharif pulses that normally account for 37 per cent of total pulses production
from nearly half of total pulses acreage in the country and are mostly grown in
rainfed conditions.
2.49 The year 2003-04 was a landmark in the production of pulses in the
country. The all time record production of 14.94 million tonnes achieved
during 2003-04 was largely attributed to favorable weather and climatic
conditions. The production in 2003-04 was a smart recovery of 34 percent
over the drought impacted production of 11.13 million tonnes in 2002-03. The
performance of pulses production in 2003-04 was impressive in both the
seasons, but was more remarkable in Kharif season. The Kharif pulses
responded to congenial climatic conditions with larger area coverage and
better productivity, resulting in 6.16 million tonnes of production, 48 per cent

higher than the corresponding seasonal production of 4.15 million tonnes in
the previous year. The production of tur (Pigeon Pea), the dominant Kharif
pulse however remained normal at 2.37 million tonnes, but other Kharif pulses
including Urad (Black Gram) and Moong (Green Gram) posted 3.79 million
tonnes production, as against 1.86 million tonnes produced in the preceding
year. (Table 2.1)
2.50 After the repositioned production milestone in 2003-04, the vulnerability
of pulses economy to weather aberration is exposed again in the year 2004-
05. Monsoon 2004 with aggregate deficiency of 13 per cent from the Long
Period Average (LPA) and subdued post monsoonal rains have rendered
parts of major pulses producing states of Maharashtra, Uttar Pradesh,
Rajasthan and Madhya Pradesh rain deficient. According to the Second
Advance Estimate of Crop Production (19.01.2005), the Kharif pulses
production in 2004-05 is likely to decline by 18 per cent from the previous year
to the subdued level of 5.04 million tonnes. This sharp decline is triggered
again by other Kharif pulses, the production of which is likely to fall by 27 per
cent from previous year to 2.78 million tonnes. The Tur production at 2.26
million tonnes is likely to fall by a much smaller margin of only 5 per
cent. Such volatility in pulses production brings to focus the instability in
domestic supply of pulses and also that of economic conditions of farmers
engaged in its production. The current advance production estimates of 13.67
million tonnes appear to be making the pulses productions target of 15.3
million tonnes during 2004-05 a difficult one to attain.
(Table 2.1)
2.51 The emerging scenario of discomfort in the pulses
production, particularly that of Kharif pulses in 2004-05 is indicating that its
performance during 2003-04 was more an exception rather than an element of
growth trend. The decade of nineties, though coincided with initiation of
National Pulses Development Programme in the mission mode, paradoxically
witnessed sharp deceleration in all the growth parameters viz area and
productivity of Pulses, in both kharif and rabi seasons. Total pulses
production crossed the 14 million tonnes mark way back in 1990-91 but has
not yet exceeded 15 million tonnes production so far. This indicates that
agricultural development strategies are by passing pluses sector. Table below
sums up the annual percentage growth of area, production and productivity of
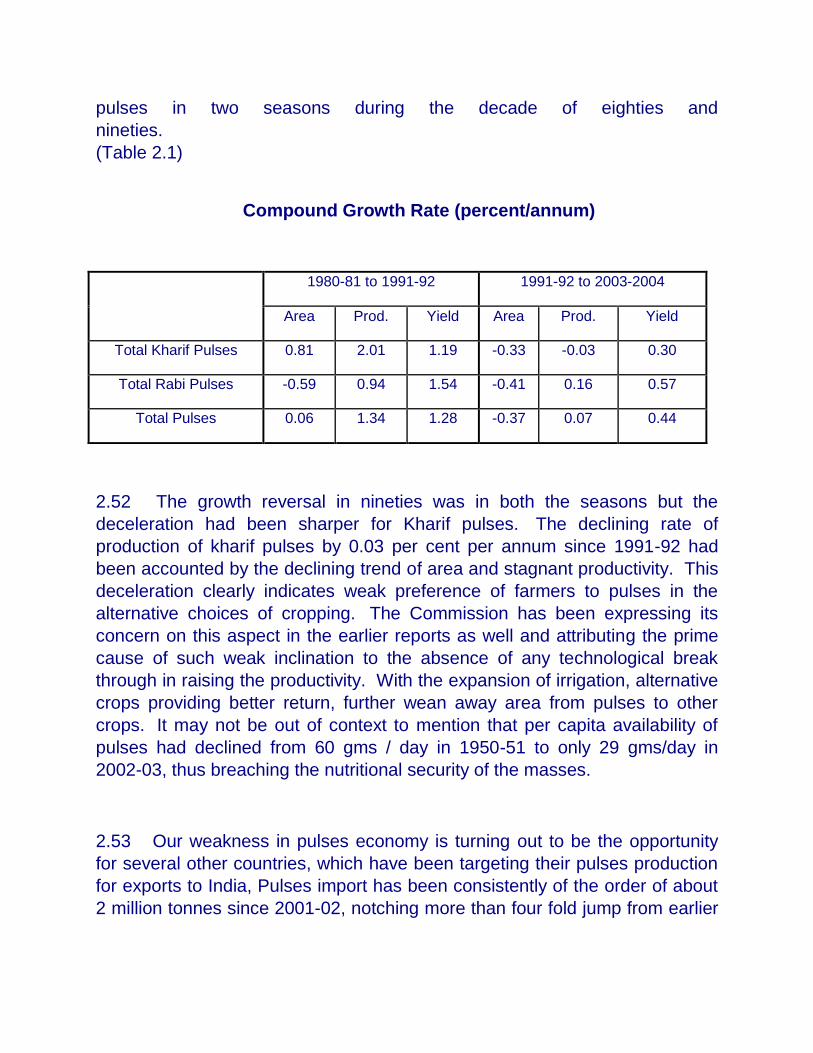
pulses in two seasons during the decade of eighties and
nineties.
(Table 2.1)
Compound Growth Rate (percent/annum)
1980-81 to 1991-92 1991-92 to 2003-2004
Area Prod. Yield Area Prod. Yield
Total Kharif Pulses 0.81 2.01 1.19 -0.33 -0.03 0.30
Total Rabi Pulses -0.59 0.94 1.54 -0.41 0.16 0.57
Total Pulses 0.06 1.34 1.28 -0.37 0.07 0.44
2.52 The growth reversal in nineties was in both the seasons but the
deceleration had been sharper for Kharif pulses. The declining rate of
production of kharif pulses by 0.03 per cent per annum since 1991-92 had
been accounted by the declining trend of area and stagnant productivity. This
deceleration clearly indicates weak preference of farmers to pulses in the
alternative choices of cropping. The Commission has been expressing its
concern on this aspect in the earlier reports as well and attributing the prime
cause of such weak inclination to the absence of any technological break
through in raising the productivity. With the expansion of irrigation, alternative
crops providing better return, further wean away area from pulses to other
crops. It may not be out of context to mention that per capita availability of
pulses had declined from 60 gms / day in 1950-51 to only 29 gms/day in
2002-03, thus breaching the nutritional security of the masses.
2.53 Our weakness in pulses economy is turning out to be the opportunity
for several other countries, which have been targeting their pulses production
for exports to India, Pulses import has been consistently of the order of about
2 million tonnes since 2001-02, notching more than four fold jump from earlier

levels. India’s import has lion’s share in nearly 8 million tonnes in annual
global trade of pulses.
Import of Pulses (000 tonnes)
Fiscal Year
(April-March) All
Pulses* Tur Moong Urad Imports as % of
net Production
2000-01 350.57 43.46 18.52 11.56 2.99
2001-02 2232.29 354.18 159.08 19.30 23.04
2002-03 1995.33 320.55 262.57 35.36 17.05
2003-04 1725.51 314.92 0.00 0.00 17.64
2004-05 429.55# 145.67 0.00 0.00 13.20*
# upto July 04 * Assuring import level in 2004-05 at the level of 2003-04
* Excluding other beans
2.54 The total import of pulses galloped to 2.23 million tonnes in 2001-02,
registering a phenomenal increase of 538 per cent over 0.35 million tonnes
import during 2000-01. Since then, the pulses import have maintained high
level Import as the percentage of net production of pulses in the country
remained at 17 percent to 23 percent since fiscal year 2001-02 as compared
to less than 4 per cent in earlier years. Inspite of record production of pulses
in the country in 2003-04, the import substitution is likely to remain more than
13 percent in FY 2004-05 as the pulses import is unabated and in first four
months of the financial year, about 0.43 million tonnes of pulses have already
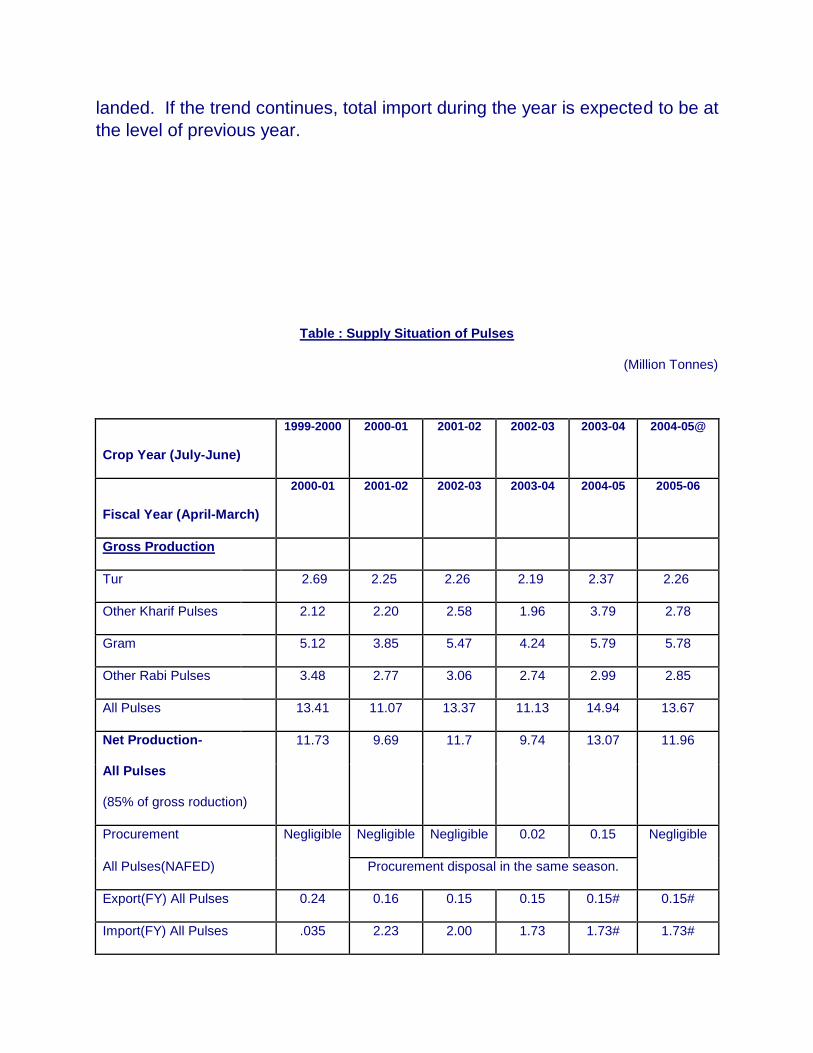
landed. If the trend continues, total import during the year is expected to be at
the level of previous year.
Table : Supply Situation of Pulses
(Million Tonnes)
Crop Year (July-June)
1999-2000
2000-01
2001-02
2002-03
2003-04
2004-05@
Fiscal Year (April-March)
2000-01
2001-02
2002-03
2003-04
2004-05
2005-06
Gross Production
Tur 2.69 2.25 2.26 2.19 2.37 2.26
Other Kharif Pulses 2.12 2.20 2.58 1.96 3.79 2.78
Gram 5.12 3.85 5.47 4.24 5.79 5.78
Other Rabi Pulses 3.48 2.77 3.06 2.74 2.99 2.85
All Pulses 13.41 11.07 13.37 11.13 14.94 13.67
Net Production-
All Pulses
(85% of gross roduction)
11.73 9.69 11.7 9.74 13.07 11.96
Procurement Negligible Negligible Negligible 0.02 0.15 Negligible
All Pulses(NAFED) Procurement disposal in the same season.
Export(FY) All Pulses 0.24 0.16 0.15 0.15 0.15# 0.15#
Import(FY) All Pulses .035 2.23 2.00 1.73 1.73# 1.73#

Supply(FY) 11.84 11.76 13.54 11.31 14.90 13.53
Average Supply
(Triennium Ending) 12.38 12.20 13.25
@: Based on advance estimate as on 19.1.2005
#: Import/Export assured to be at the level of FY 2003-04
2.55 Nevertheless, the import of pulses had definite impact on the supply
position. For calculation of supply it is assumed that the production in the
crop year (July-June) is available for consumption in the following financial
year. On this basis, the average annual supply of pulses for the triennium
ending (TE) 2003-04 (marketing season) was 12.20 million tonnes. During
2004-05 the overall supply of pulses is likely to be 14.90 million tonnes. The
substantial augmentation of supply of pulses has been reflected in the
softness of prices of pulses in the current fiscal. Although, the crop available
for consumption during the forthcoming FY 2005-06 may not be as good as
corresponding previous year, still supply expected to be 13.53 million tonnes
is likely to be better than TE 2004-05 average supplies of 13.25 million
tonnes.
2.56 The normative requirement of pulses is 40 grams per consumption unit
per day which equates to about 37 grams per capita per day. Thus, the
current level of per capita availability is lower than normative
requirement. This translates into the normative demand of about 14.5 million
tonnes of pulses during 2005-06 which is exceeding the expected supply by
about one million tonnes. On the other hand, the direct household
consumption of pulses and pulses product according to the NSS 55th
(1999-
2000) round had been estimated at 11 million tonnes. Assuming the low
consumption elasticity of pulses and the population growth of less than 2 per
cent, the growth of behaviorist demand of consumption is taken at 2.2 per
cent. The demand for pulses for the year 2005-06 is ascertained at 12.5
million tonnes. It may be noted that NSS Estimates do not take into account
the non-household consumption. Even accounting for such non-household
consumption, the behaviorist demand of pulses and pulses product during
2005-06 is expected to be well within the estimated supply.
2.57 The Commission in the past has observed that the Ministry of
Agriculture should prepare the pulses budget every year taking into account
the likely production, consumption and resultant supply. The Commission
reiterates its earlier observation that there should be proper assessment of
demand-supply scenario of pulses, followed by appropriate policy measures
to safeguard the interest of both producers and consumers of pulses so that
the domestic market is guarded against instability.
2.58 As stated above, the pressure of supply side owing to good production
performance of pulses during crop year 2003-04 and liberal import of pulses
has reflected on the softening of its prices in the market. The average
wholesale price (WPI base 1993-94) of pulses for the FY 2003-04 stood at
176.6, which was 2.2 per cent lower than the corresponding WPI for FY 2002-
03. This was in contrast to annual 5.5 per cent increase in average WPI for all
commodities and 1.3 per cent increase in that of food articles in FY 2003-
04. The bearish trend of prices was more pronounced for two important Kharif
pulses, urad and moong. Their average WPI for FY 2003-04 at 217.4 and
195.9 was 9.3 per cent and 5.8 per cent lower than previous year
respectively. However, the prices of arhar (tur) remained buoyant during
2003-04. (Table 2.15)
2.59 The pulses prices during 2004-05 remained more or less stable. The
WPI of all pulses and that of tur for January 2005 was 174.5 and 172.3
respectively, deviating in the range of –0.68 and –5.02 per cent from the
corresponding WPI for January, 2004. However, the WPI of moong and urad
stood at 192.9 and 220.4 in January, 2005, firming by 4.38 and 3.86 percent
respectively. Compared to 5.5 per cent increase in WPI for all commodities on
month to month basis and 2.0 per cent for food articles, the corresponding
WPI for pulses witnessed a marginal
decrease. (Table
2.15)
2.60 According to the information furnished by National Agricultural
Cooperative Marketing Federation of India Ltd. (NAFED), the nodal agency for
intervention in the market for defending MSP, the price of tur in 2003-04 ruled

in the range of Rs.1600/Qtl to Rs.2100/Qtl, well above the MSP, in the peak
marketing season (October to December) in major markets. However,
deflationary trend due to supply pressure brought down the market price of
moong and urad below MSP during 2003-04. The price of moong in the peak
marketing season ruled in the range of Rs.1150/Qtl to Rs.1700/Qtl as
compared to recommended MSP of Rs.1410/Qtl. The price depression in
case of urad was much more severe as it moved in the range of Rs.720/Qtl to
Rs.1675/Qtl in various markets. In such unstable market situation, the
procurement of 1.5 lakh tonnes of urad and moderate quantity of moong by
NAFED during 2003-04 was necessitated in several States. The Commission
has noted with satisfaction that NAFED had identified 298 purchase centres in
138 districts, in consultation with state level supporters viz. State Cooperative
Marketing Federations and Tribal Cooperative Marketing Development
Federation (TRIFED). (Table 2.3)
2.61 However, it was brought to the notice of the Commission that the FAQ
norms for procurement of pulses are very lax. The aggregated tolerance on
accorent of foreign matter, admixture, damaged pulses, slightly damaged
pulses, immature and shriveled pulses and weevilled pulses add up to 19
percent. High limits of tolerance gives the scope of dilution of quality
sometime not by fair intentions. Moreover, quality is the derivative of farming
practices evolved, which itself is a dynamic phenomenon. Further, the
awareness of the farmers on FAQ norms is also weak. As a result they do not
take proper care of the crop during its growth and after harvest to make it fit
for procurement. The Commission therefore recommends that Government
should periodically review FAQ norms for all the commodities, and
standardize the relaxation procedures so as to avoid ad-hocism and also
give wide publicity of these norms and relaxations thereof, so that
farmers take due care of the crop at various stages and reduce the
incidences of rejection by the procurement agencies on quality
consideration.
2.62 At the commencement of 2004-05 marketing season of kharif pulses,
the prices of tur, moong and urad are ruling at Rs.2000/Qtl, Rs.1725/Qtl and
Rs.1500/Qtl respectively. Anticipating that crop size during the year will not
be as good as last year, the market price is expected to hold above MSP

(Rs.1390 and 1410/Qtl) and there may not be undue compulsions of market
intervention by NAFED in ensuing months, though NAFED has entered in
some markets of Uttar Pradesh to defend the MSP during the current season
with the procurement of 280 MT of
urad. (Table 2.3)
2.63 Owing to its low productivity, the MSP of kharif pulses, particularly that
of moong and urad are just on the margins of their cost of production. The fall
in prices below MSP therefore seriously breaches the economies of farmers
engaged in its cultivation who are generally resource poor in less endowed
region. Their livelihood concerns come in sharp focus in the regime of
globalization when the global prices too fall sharply and the tariff protection is
too inadequate. This phenomenon was evident during 2003-04 and its
shadows are still lingering. International prices of tur during 2003-04 as well
as 2004-05 (Dec, 2004) are stable in the range of 275 to 325 $/Tns (C &
F). This translates into 1237 to 1462 Rs./Qtl. After accounting for the tariff @
10 (ten) per cent, the lower limit of landed price of imported tur is less than the
MSP. Thus, on the price front, the imported tur is enjoying a competitive
advantage over the domestic tur. Liberal tariff regime on pulses coupled with
perpetual gap in domestic demand and supply has earned Indian pulse
market a favorite destination for other producing countries, looking for the
market access.
2.64 The aforesaid discussion does not augur well for sustained buoyancy
either in production or in the prices of pulses. The proponents of large scale
crop diversification may not derive optimism from such scenario. The main
bottleneck in the endeavour to improve the economy of pulses production is
the absence of any meaningful breakthrough in the seed technology and
cultivation practices. In the recent studies evaluating the NPDP programme, it
was revealed that not only the farmers but institutional seed development is
confining itself to the old varieties even in the purchase of breeder seeds. The
seed replacement rate in case of pulses is abysmally low. No doubt, the wide
gap between the yield of pulses in the front line demonstration by agricultural
research institutions and the actual yield derived by the farmers highlight the
missing zeal of extension machinery. The limitation of crop insurance, also,
does not enable farmers to minimize the risk in cultivation of pulses,
particularly when these crops are sown in vulnerable economic and climatic

conditions. In nut-shell, the sorry state of pulses economy urgently needs an
all round and proactive institutional involvement covering technology, support,
market and trade safeguards for its sustenance and growth.
Oilseeds
2.65 The production of oilseeds, after declining from 206.62 lakh tonnes in
2001-02 to 148.40 lakh tonnes in 2002-03 due to failure of monsoon, made a
remarkable recovery in 2003-04 due to good, timely and evenly distributed
monsoon. In 2003-04, the production of oilseeds was provisionally estimated
at a record level of 252.90 lakh tonnes breaking the previous record
production of 247.5 lakh tonnes achieved in 1998-99. The increase in
production in percentage terms was 70 per cent. The impact of good
monsoon was more on the kharif oilseeds crop, the production of which
increased by 87 per cent from 89.77 lakh tonnes in 2002-03 to 167.74 lakh
tonnes against an increase of 45 per cent observed in production of rabi
oilseeds from 58.63 lakh tonnes to 85.16 lakh tonnes. The second advance
estimate of crop production (Directorate of Economics and Statistics (DES),
Department of Agriculture and Cooperation, 19th
January, 2005) put the kharif
oilseeds production in 2004-05 at 147.61 lakh tonnes, which was lower than
last year’s production by 20.13 lakh tonnes. The estimated production of rabi
oilseeds for 2004-05 season was 100.81 lakh tonnes. The overall oilseeds
crop size in 2004-05 is expected to be lower by 4.5 lakh tonnes than last
year’s production. (Table 2.1)
2.66 The decline in production of edible oilseeds in 2004-05 might be
largely attributed to the erratic monsoon in the season. The states of Madhya
Pradesh, Gujarat, Rajasthan, Maharashtra and Andhra Pradesh are the major
producers of oilseeds. These five states accounting for about 75 percent of
total production of oilseeds lacked the assured irrigation facilities. The
respective areas under irrigation (as in 2000-01) in Madhya Pradesh,
Rajasthan, Gujarat, Maharashtra and Andhra Pradesh was just 3.8, 49.5,
24.8, 9.0 and 15.0 percent against the irrigated area of 23.0 per cent for the
country as a whole.
2.67 The wheat-paddy cropping system in Punjab, Haryana and Western
U.P. over the years caused ecological imbalances and a considerable fall in
water tables in these states/region. The efforts were therefore, made in the
past to induce the farmers to diversify their cultivation in favour of oilseeds.
With a view to help farmers to go for diversification, the Commission in its
rabi/kharif reports on price policy for 2003-04, 2004-05 and 2005-06
recommended a substantial increase in the MSP for oilseeds. The
Government accepted Commission’s recommendations and fixed the MSP at
the recommended level. The MSP of rapeseed/mustard was raised by Rs.270
per quintal in 2004-05 and further Rs.100 per quintal in 2005-06. The MSP of
groundnut was increased by Rs.45 per quintal in 2003-04 and further Rs.100
per quintal in 2004-05. Similarly, the MSP of soyabeans (yellow) was
increased by Rs.45 per quintal in 2003-04 and further Rs.70 per quintal in
2004-05. The Commission’s expectation that the increased MSP would
induce farmers to opt for cultivation of oilseeds did not materialize as no large
scale shift in area took place in favour of oilseeds. The Commission
discussed this matter at length in its meetings with the officers of the State
Governments, the representatives of oil industry and farmers to ascertain the
main reasons for which farmers continue their preference for wheat-paddy
rotation. It was borne out of discussion that farmers were apprehensive about
marketing their produce in the absence of elaborate arrangements for
procurement of oilseeds which refrained them from opting for diversification in
favour of oilseeds. In case of oilseeds, there were very few procurement
centres and the farmers were required to travel long distances to sell their
produce. For example, compared to 1400 centres for procurement of
wheat/paddy in Punjab there were only 14 centres for procurement of
oilseeds. Further, the central and state level agencies became very active at
the procurement time of wheat/paddy but remained indifferent at the time of
oilseeds procurement. To modulate the wheat-paddy cropping system and
encourage the farmers to diversify to oilseeds, Government will have to
ensure proper marketing arrangements for procurement of oilseeds. The

Commission therefore, recommends that the Government should review
the existing procurement/price support operations of oilseeds and make
proper marketing arrangements to ensure that the oilseeds crop of the
farmers is fully protected against price uncertainty.
2.68 During the course of discussions, the NAFED informed the
Commission that the prices of kharif oilseeds remained above the MSP for the
third consecutive year. The prices for groundnut ruled below MSP in
Karnataka, Andhra Pradesh and Uttar Pradesh, because the quality of
produce was below Fair Average Quality (FAQ) particularly with respect to
parameters like kernel recovery, excess moisture level and refractions. Since
prices remained above MSP for FAQ oilseeds throughout the kharif season
2004, NAFED did not carry out its price support operations in 2004-05.
However, it made commercial purchases (up to 25th December, 2004) of
soyabean, groundnut and sesamum seeds of 80848 tonnes, 2006 tonnes and
1486 tonnes valued at Rs.98.55 crores, Rs. 3.63 crores and Rs 5.94 crores
respectively. NAFED further pointed out that although the procurement/price
support operations were carried out to protect the interest of farmers by
enabling them to sell their produce at the MSP, the State Governments
imposed taxes on such purchases, which increased the losses of the
NAFED. Further, the stocks when moved from the procuring state to other
states were subjected to inter-state taxes. NAFED pleaded that the State
Governments should be persuaded to stop levying taxes/cess on stocks
procured or moved under price support operations. The Commission finds
merit in NAFED’s demand that the State Governments may be asked to stop
levying various types of taxes, cess, marketing fees etc. on stocks procured
under price support operations and inter-state taxes imposed on movement of
these stocks from one state to another
state. (Table 2.6)
2.69 Despite record production of oilseeds in 2003-04 and liberal imports of
edible oils market prices of oilseeds remained quite firm. The wholesale price
index (WPI) for the groundnut and soyabeans, the two major kharif oilseeds
during November and December 2004, the peak marketing season for kharif
oilseeds, remained higher than the corresponding months of 2003. The WPI

for all the Kharif oilseeds was higher than last year by about 8 percent. The
buoyancy in the oilseeds prices in the domestic market could be attributed to
the higher international prices and higher domestic demand. (Table
2.16)
2.70 In view of the limited scope for the horizontal expansion of bringing
more area under oilseed cultivation except in Madhya Pradesh, the
Commission in its earlier reports had impressed upon the need for increasing
the productivity of oilseeds. Since oilseeds are grown in the rainfed areas, the
scientists of ICAR, SAU and other research institutions need to develop
drought resistant and disease resistant seed varieties. In view of the huge
potential of genetically modified (GM) seeds for bringing a spectacular
increase in productivity of oilseeds, it is often argued that GM seeds should
be used extensively for bringing a breakthrough in production of oilseeds. The
proponents of GM seeds substantiated their views by giving examples
of USA and Argentina, where the use of GM seeds has not only helped these
countries in rising the productivity of oilseeds but also raising the export of
edible oils to a substantial level. However, there is a need for caution in the
use of GM oilseeds for cultivation. Indian scientists should study the effects
of GM seeds on human health and their suitability to local conditions and
come out with clear recommendations in this regard.
2.71 The bumper production of oilseeds in 2003-04 was expected to scale
down the import of edible oils. However, the imports of edible oils remained
unabated and in 2003-04 showed an increase of about 9 lakh tonnes over the
previous year. It may also be observed from the figures given in the following
table that the imports of edible oils, which were merely 12.66 lakh tonnes in
1997-98, doubled to 26.22 lakh tonnes in 1998-99 and again doubled to 52.90
lakh tonnes in 2003-04.
Table : Import of Edible Oils Sl. No. Year (April
-March)
Quantity (In
lakh tonnes)
Value (In
crores)
Unit Value
(In Rs/kg.)
1 2 3 4 5

1. 1997-98 12.66 2764 21.84
2, 1998-99 26.22 7588.99 28.94
3. 1999-2000 41.96 7983 19.93
4. 2000-01 41.77 5976 14.30
5. 2001-02 43.22 6464.97 14.96
6. 2002-03 43.65 8779.64 20.11
7. 2003-04 52.90 11683.24 22.09
8. 2004-05(Upto
July 2004)
12.83
3321.52 25.89
2.72 Further, imports as percentage of the domestic production, increased
from 23 percent in 1997-98 to more than 100 percent in 2002-03. It remained
substantially high at 83 percent even in the record production year of 2003-
04. The rising share of imports gave an indication of increased dependence of
the country on imported edible oils over the years as indicated below: -
Table : Import substitution of Edible Oils
Sl.No. Year Domestic Production
(Crop year) (Primary
Source) (In Lakh
tonnes)
Imports
(Fiscal year) (In Lakh
tonnes)
Imports as
percentage
of domestic
production.
1 2 3 4 5
1. 1997-98 54.38 12.66 23.28
2. 1998-99 63.67 26.22 41.18
3. 1999-2000 53.62 41.96 78.25
4. 2000-01 47.44 41.77 88.05
5. 2001-02 54.44 43.22 79.39

6. 2002-03 41.29 43.65 105.72
7. 2003-04 64.10 52.90 82.53
2.73 The other intriguing feature of imports of edible oils was the rising cost
reflected in the unit value of imports. The unit value of import after declining
from Rs.28.94 per kg. in 1998-99 to Rs.14.30 per kg. in 2000-2001, increased
sharply to Rs.20.11 per kg. in 2002-03, further to Rs.22.09 per kg. in 2003-04
and Rs 25.89 per kg. during April-July, 2004, for which the DGCI&S data were
available. The rising cost of imports implied higher spending of foreign
exchange on imported edible oils. This gives a clear signal that unless the
dependence on imported edible oils is reduced in the coming years, a major
chunk of foreign exchange earnings will be spent on imported edible oils. In
this context, the Commission emphasized the need for bringing a
technological breakthrough in productivity and regulating the import of edible
oils. The increase in the MSP of oilseeds would become meaningless if it
makes the imports attractive. The recent announcement by the Government
of import duty hike on palm oil by 15 percent is a step in the right direction but
it had been simultaneously neuteralised by reducing the tariff value. The
Commission therefore, reiterates that the import duty on edible oils should be
kept at such a level that imports remain regulated and do not affect the
domestic prices and oilseeds production adversely and also a standing
committee comprising representatives of concerned Departments and
Planning Commission should be constituted to monitor import of edible oils on
a continuous basis keeping in view, inter alia, the requirement of the country
and international prices and suggest changes in the import duty rates as and
when required. (Table 2.32)
2.74 The import duty on soyabean oil (45%) and rapeseed/mustard
(75%) is inflexible due to their binding rates. Tariff flexibility exists in respect
of other edible oils viz., palmolein, palm oil, groundnut oil, sunflower, safflower
oil and coconut oil, since binding rate of duty is 300%. The Commission feels
the need for higher binding rate on soyabean and rapeseed/mustard, which
according to it is too low.

2.75 According to the Solvent Extractors’ Association of India (SEA) the
increase in import of refined RBD Palmolein oil from 3.19 lakh tonnes in 2002-
03 to 7.97 lakh tonnes in 2003-04 was not desirable. It was of the view that
the palm oil should be imported in crude form so that the processing and
value addition takes place in the country and the capacities already created in
the country are fully utilized. The import duty rates on crude palm/RBD
palmolein oil and refined palm/RBD palmolein, which were 65 percent and 75
percent respectively till recently, have now been raised to 80% and 90%
respectively. Although the import duty rates have been raised, the difference
between the import duty rates on crude and refined palm/RBD palmolein oil
remains the same i.e. 10%.
2.76 The other issue brought to the notice of the Commission by the edible
oil industry associations related to import of edible oils under the Preferential
Trade Agreements (PTAs)/Free Trade Agreements (FTAs) including import of
vanaspati oil from Nepal. The associations apprehended that the PTAs/FTAs
might become a route for flooding the Indian market with imports of cheap
edible oils threatening the survival of the indigenous oil processing
industry. They cited the example of Indo-Nepal Treaty of Trade, which
allowed import of edible oils including vanaspati duty free, quantity free and
licence free. The 1993 treaty was revised in 1996. The terms of the new
treaty deleted the condition incorporated in 1993 treaty that the Nepalese
material and labour content and Indian material content should be at least
50%. Consequently, there was surge in import of vanaspati from Nepal. The
treaty was further revised in March, 2002 wherein, the import of a fixed
quantity of one lakh tonne was allowed duty free from Nepal. Also the Indo-
Sri Lanka Free Trade Agreement allowed import of vanaspati duty free and
quantity free. After signing of the FTA with Sri Lanka in 2002, many Indian
companies reported to be setting up the vanaspati processing units in Sri
Lanka to take advantage of concessions allowed under the FTA. Had the
treaty not been signed, such Indian companies would have set up the
processing units in the country itself. The Commission is of the view that since
the welfare of farmers growing oilseeds is linked with the edible oil industry,
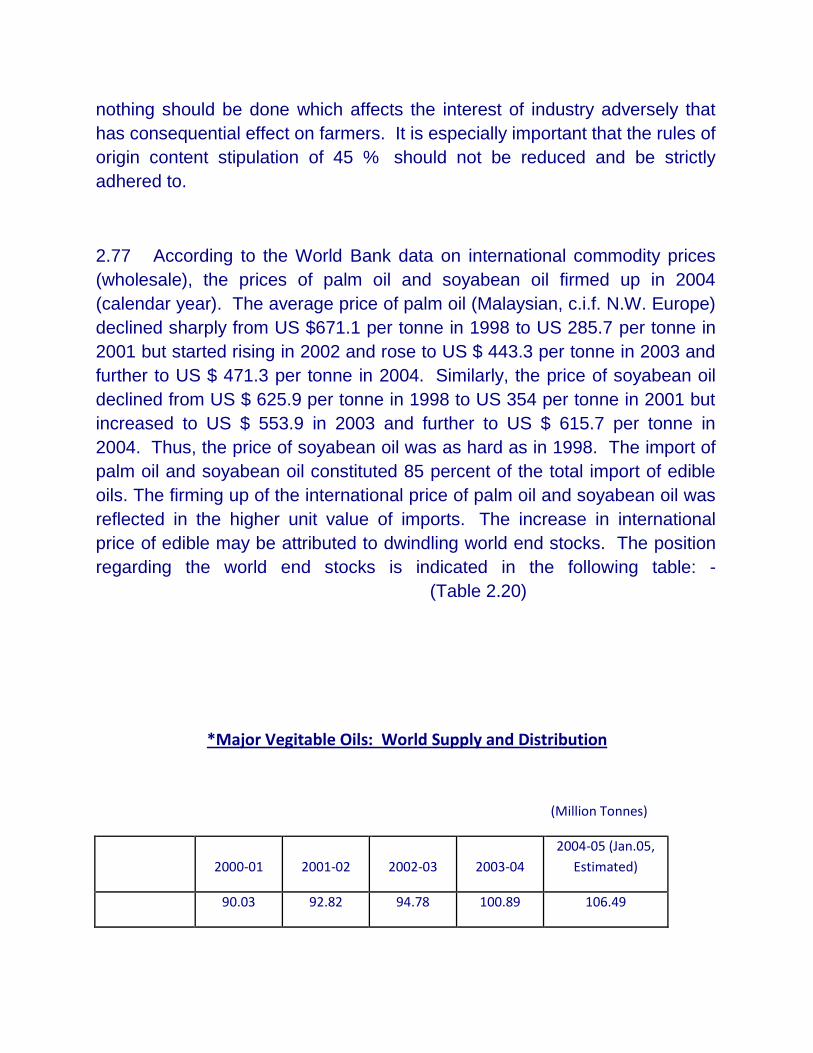
nothing should be done which affects the interest of industry adversely that
has consequential effect on farmers. It is especially important that the rules of
origin content stipulation of 45 % should not be reduced and be strictly
adhered to.
2.77 According to the World Bank data on international commodity prices
(wholesale), the prices of palm oil and soyabean oil firmed up in 2004
(calendar year). The average price of palm oil (Malaysian, c.i.f. N.W. Europe)
declined sharply from US $671.1 per tonne in 1998 to US 285.7 per tonne in
2001 but started rising in 2002 and rose to US $ 443.3 per tonne in 2003 and
further to US $ 471.3 per tonne in 2004. Similarly, the price of soyabean oil
declined from US $ 625.9 per tonne in 1998 to US 354 per tonne in 2001 but
increased to US $ 553.9 in 2003 and further to US $ 615.7 per tonne in
2004. Thus, the price of soyabean oil was as hard as in 1998. The import of
palm oil and soyabean oil constituted 85 percent of the total import of edible
oils. The firming up of the international price of palm oil and soyabean oil was
reflected in the higher unit value of imports. The increase in international
price of edible may be attributed to dwindling world end stocks. The position
regarding the world end stocks is indicated in the following table: -
(Table 2.20)
*Major Vegitable Oils: World Supply and Distribution
(Million Tonnes)
2000-01 2001-02 2002-03 2003-04
2004-05 (Jan.05,
Estimated)
90.03 92.82 94.78 100.89 106.49

Production
Export 30.90 33.33 36.08 37.52 39.16
Import 30.13 31.74 34.97 36.13 37.82
Consumption 88.91 91.74 95.25 99.49 104.83
Ending stocks 8.77 8.25 6.67 6.68 6.99
Source: USDA,FAS, Jan.2005
* Includes Soyabean, Palm, Sunflower seed, Rapeseed, Cotton seed
It may be observed from the above table that the world production of edible oil
increased from 90.03 million tonnes in 2000-01 to 100.89 million tonnes in
2003-04 and is estimated to increase to 106.49 million tonnes in 2004-05. On
the other hand, the world consumption increased from 88.91 million tonnes in
2000-01 to 99.49 million tonnes in 2003-04 and is estimated to increase
further to 104.83 million tonnes in 2004-05. The increase in consumption
outpacing the increase in production resulted in the dwindling world end
stocks and reflected in the higher international prices and unit value of
imports. However, the world end stocks are estimated to have slightly
improved to 6.99 million tonnes in 2004-05 from 6.68 million tonnes in 2003-
04.
2.78 The availability of edible oils from domestic resources is not expected
to be less than the previous year although there would be a fall in production
of kharif oilseeds in 2004-05. As usual, the Commission carried out an
exercise to estimate the domestic production of edible oils based on certain
assumptions. As per the Commission’s estimates, the production of edible

oils from domestic resources would be around 64.65 lakh tonnes in 2004-05
as indicated in the following table:
Estimated Domestic Production of Edible Oils (Lakh tonnes)
Assump-
tion Crop-Year (July-June)
(a) (b)
1997-
98 1998-
99 1999-
00 2000-
01 2001-
02 2002-
03 2003-
04 2004-
05
1.Groundnut 17.8 28 16 20.45 11.49 14.23 15.78 9.30 18.34 14.41
2. Rapeseed/
Mustard 7.3 33 14.38 17.32 17.7 12.81 15.53 11.83 18.93 23.18
3.Sesamum 22.2 40 1.31 1.29 1.11 0.88 1.22 0.90 1.74 1.26
4.Safflower 15 40 0.4 0.81 0.86 0.68 0.74 0.58 0.40 0.49
5.Nigerseed 25 28 0.26 0.24 0.27 0.15 0.21 0.08 0.18 0.09
6.Soyabean 12 18 10.22 11.31 11.21 8.22 9.44 7.37 12.02 11.84
7.Sunflower 10 40 3.17 3.39 2.49 2.32 2.44 3.13 3.57 4.46
8.Cottonseed* - - 4.15 4.35 4.11 3.66 4.13 3.53 4.37 4.37
9.Copra** - - 4.5 4.5 4.38 4.49 4.55 4.55 4.55 4.55
Total 54.38 63.67 53.62 47.44 54.04 41.27 64.10 64.65
Note: Col. (a): Human Consumption, Seed, Feed, and Wastage as percentage of total production
Col. (b): Percentage of oil recovery
* : Actual Production reported by all India Cottonseed Crushers’ Association ** : Production estimates sourced from Coconut Development Board up to 2002-03. For
2003-04 and 2004-05 production assumed at the level of 2002-03
2.79 The above estimates were based on the assumption that edible oils
derived from oilseeds produced in crop year (July – June) would be available
for consumption in the following fiscal year (April – March). According to the
Solvent Extractors Association of India, the oil production of about 11.8 lakh

tonnes would be available from secondary sources (Rice Bran 6.8 lakh
tonnes; Rapeseed, Sunflower seed and Groundnut cake 3.1 lakh tonnes;
Cottonseed & others 0.7 lakh tonnes; Tree Borne Oilseeds 0.8 lakh tonnes;
and domestic palm oil 0.5 lakh tonnes). Taking into account the oil production
from secondary sources, the total availability of edible oils estimated at 76.45
lakh tonnes for 2004-05 would be marginally higher than last year’s estimated
availability of 75.6 lakh tonnes. Against present potential of 11.8 lakh
tonnes, the SEA pointed out the possibility of exploiting huge potential of 27
lakh tonnes of edible oils from secondary sources by exploiting the available
potential of rice bran, cottonseed and tree borne seeds. The Commission
recommends that the Government may formulate an appropriate strategy
to exploit the available potential of secondary sources of oil to enhance
availability of edible oils in the country.
2.80 To achieve self-sufficiency in edible oils, the Government set up the
Technology Mission on Oilseeds & Pulses (TMOP) in 1986. The Mission
included the oil palm cultivation in its programme in 1991-92 and launched the
Oil Palm Development Programme (OPDP) for development of oil palm trees
over 80,000 ha. area each in the eighth and ninth five year plan. As against
the target of covering 1,60,000 ha. with palm oil trees in eighth and ninth plan,
the actual achievement was 62,732 ha. (39.2 percent). It was decided to
continue with the efforts of promoting palm oil cultivation during the tenth plan
but with suitable modifications in the light of the experience gained and the
impediments observed in the past. The OPDP was merged with the
‘Integrated Scheme for Oilseeds, Pulses, Oil Palm & Maize (ISOPOM)’ during
tenth plan with the target of covering 50,000 ha. Area. In the first three years
of the tenth plan, 12073 ha. area (as on 1stDecember, 2004) was covered
against the target of 27,000 ha. (44.7 percent).
2.81 The programme, however, could not achieve the desired
success. There were shortfalls in targets in the eighth, ninth and in the first
three years of the tenth plan. According to the TMOP, the adverse weather
conditions that prevailed in successive four years since 1998-99 and the fall in
domestic prices of palm oil due to cheap edible oil imports dampened the
enthusiasm of the farmers, which affected adversely the implementation of
OPDP in the country compelling farmers to uproot palm trees in an area of

17,943 ha. In addition, lack of processing facility in some areas also caused
uprooting of the palm oil trees. The Commission considers this matter to be
serious which requires the urgent attention of the Government. The
Government may either set up the processing facilities on its own or
encourage the private sector in this field. The potential yield of oil from palm
fruits is around 10-15 times more than the yield of edible oils obtained from
traditional oil seeds. Hence, there is a need to bring more area under palm oil
cultivation. The representatives of oil industry associations suggested that the
area under palm oil cultivation would increase rapidly if the palm oil cultivation
was declared as plantation and public and private enterprises were allowed to
enter in this field. The Commission recommends that the Technology
Mission on Oilseeds & Pulses may examine the suggestion of the oil
industry to declare cultivation of oil palm as plantation and allow the
public and private enterprisers to enter in this field and make suitable
recommendations to the Government in this regard.
Groundnut
2.82 The area and production under groundnut showed a decline of 2.59
percent and 2.04 percent per annum respectively during the period between
1990-91 and 2003-04. The area, production and yield recorded at 86.68 lakh
hectares, 70.95 lakh tonnes and 818 kg. per hectare respectively in 1991-92
declined to 59.36 lakh hectares, 41.21 lakh tonnes and 694 kg. per hectare
respectively in 2002-03. However, the area, production and yield improved to
59.98 lakh hectares, 81.82 lakh tonnes and 1364 kg. per hectare respectively
in 2003-04 due to good, timely and evenly spread monsoon in the season.
The second advance estimate of the Directorate of Economics & Statistics
place the groundnut production at 64.76 lakh tonnes in 2004-05, which is
lower by about 17 lakhs tonnes over the last year’s production mainly due to
the erratic
monsoon.
(Table 2.1)
2.83 Like soyabean, this crop is also grown in the rainfed areas exposing
its production to the vagaries of nature. The state of Gujarat accounts for
about one-third of the total cultivated area under this crop. The yield in India is

very low as compared to other groundnut growing countries and world
averages mainly because India has not achieved any technological
breakthrough in seed technology. Apart from the low yield, the crop often
gets infected with aflatoxin that adversely affects the export prospects. The
scientists have not been able to find a satisfactory solution to this problem.
Despite the problem of aflatoxin, which sometimes acts as a trade barrier, a
good quantity of groundnut was exported in 2003-04 as indicated below: -
Table: Export of Groundnut
Sl.No. Year Quantity
(In tonnes)
Value
(In Rs. Crores)
Unit value
(In Rs./kg.
1. 2000-01 137066 316.40 23.08
2. 2001-02 112813 250.94 22.24
3. 2002-03 67890 178.30 26.26
4. 2003-04 176110 544.30 30.91
5. 2004-05
(April-July 2004) 50890 149.49 29.38
Source: DGCI&S Kolkata
However, it may be difficult to sustain the export at present level if no
satisfactory solution is found to the aflatoxin problem. Hence, there is an
urgent need to address the problem of aflatoxin.
Soyabean
2.84 The setting up of the Technology Mission on Oilseeds in 1986
contributed substantially in raising the area, production and yield of
soyabean. The area under this crop increased from 15.27 lakh hectares in
1986-87 to 31.85 lakh hectares in 1991-92 and 64.93 lakh hectares in 1998-
99. The production increased by about eight times from 8.91 lakh tonnes in
1986-87 to 71.43 lakh tonnes in 1998-99. The yield also doubled to 1100 kg.
per hectare in 1998-99 from 584 kg. per hectare in 1986-87. This trend lost
its momentum after 1998-99 and the area, production and yield declined to

61.06 lakh hectares, 46.55 lakh tonnes and 762 kg. respectively in 2002-03.
However, in 2003-04, the area coverage improved to 64.97 lakh hectares and
production and yield reached a record level of 78.63 lakh tonnes and 1210 kg.
per hectare respectively due to good, timely and evenly distributed monsoon
in the season. The second advance estimates of the Directorate of
Economics & Statistics put the soyabean production at 77.52 lakh tonnes in
2004-05, which is marginally lower by about 1 lakh tonnes over last year’s
production partly due to erratic monsoon. (Table 2.1)
2.85 The crop of soyabean, which is mainly grown in the rainfed areas of
Madhya Pradesh and Maharashtra, is facing multiplicity of problems. The
seed replacement is the major problem. The farmers have been using the
same old varieties of seeds due to no significant breakthrough in seed
technology. The Commission was informed that although the farmers well
received the newly released seed variety 9305 provided to them, it failed to
make any dent in production as the yield of the new variety was almost the
same as that of previous varieties. The crop that used to be free from pests
and diseases in the eighties and early nineties, has now become susceptible
to a number of pests and diseases. The scope of bringing improvement in
production and yield of this crop would remain limited until drought and pest
resistant seed varieties are developed by the scientists and made available to
the farmers. Till a breakthrough is achieved in seed technology, the efforts
should be made to increase the production and yield of soyabean by
educating and persuading the farmers to adopt improved agricultural
practices. The farmers can be persuaded by giving the example of Soyabean
Processors Association of India (SOPA), which could achieve 30 to 40
percent higher yield on demonstration plots with adoption of such
improved agricultural practices.
Nigerseed
2.86 Nigerseed is mainly grown in the tribal areas of Madhya Pradesh,
Chattisgarh, Orissa, Maharashtra and in small areas in Andhra Pradesh,
Karnataka and Jharkhand. The area, production and yield recorded at 6.01
lakh hectares, 1.9 lakh tonnes and 317 kg. per hectare respectively in 1995-
96 declined to 5.04 lakh hectares, 1.48 lakh tonnes and 293 kg. per hectare

respectively in 1999-00 and further to 4.14 lakh hectares, 0.86 lakh tonnes
and 208 kg. per hectare respectively in 2002-03. However, the area,
production and yield again increased to 4.37 lakh hectares, 1.11 lakh tonnes
and 253 kg. per hectare respectively in 2003-04 due to good monsoon but
remained lower than the highest recorded levels of 1995-96. Although the
area covered in Madhya Pradesh (including Chattisgarh) was the highest
(1.83 lakh hectares), the yield was very low. The yield level of 209 kg. per
hectare in Madhya Pradesh in 2003-04 was lower than that of 315 kg. per
hectare in Maharashtra and 412 kg. in Andhra Pradesh. The second advance
estimate of crop production put the crop size at 0.69 lakh tonnes in 2004-05,
which is lower than last year’s level by 0.42 lakh tonnes. In view of
significance of this crop for tribal farmers, serious efforts should be made to
increase its area, production and yield. (Table 2.1)
2.87 Nigerseed is having a good potential for exports. NAFED, apart from
being procurement agency for ensuring MSP, is also exporting sizable
quantities of nigerseed. Previously, the exports were being canalized through
TRIFED and associate shippers. Now, the practice of fixing the minimum
export price has been done away with due to the sluggish demand of
nigerseed in the international market. TRIFED is now issuing only ‘No
Objection Certificate (NOC)’ to the registered exporters of nigerseed. The
volume of nigerseed exported during 2000-01 to 2003-04 and 2004-05 (Upto
July, 2004) is given below: -
Table: Export of Nigerseed
Sl.No. Year Quantity
(In tonnes)
Value
(In Rs. Crores)
Unit value
(In Rs./kg.
1. 2000-01 29490 80.35 27.25
2. 2001-02 22220 47.85 21.53
3. 2002-03 36130 77.99 21.59
4. 2003-04 17890 45.41 25.38
5. 2004-05
(April-July 2004) 5560 14.64 26.33
Source: DGCI&S.Kolkata
It may be observed from the above table that the exports, which were 36130
MTs in 2002-03, declined to 17890 MTs in 2003-04 though the unit value of
exports improved to Rs.25.38 in 2003-04 from Rs.21.59 in 2002-03

Sesamum
2.88 The area, production and yield of sesamum increased from 21.64 lakh
hectares, 4.48 lakh tonnes and 207 kg. per hectare respectively in 1986-87 to
26.27 lakh hectares, 7.06 lakh tonnes and 269 kg. per hectare respectively in
1991-92. Though the area decreased sharply to 21.29 lakh hectares in 1992-
93 but the production and yield increased to 7.58 lakh tonnes and 356 kg. per
hectare. Thereafter, a continuous fall was observed in the area, production
and yield. The area, production and yield after falling to 14.44 lakh hectares,
4.41 lakh tonnes and 306 kg. per hectares respectively in 2002-03 improved
to 17.74 lakh hectares, 8.03 lakh tonnes and 453 kg. per hectares
respectively in 2003-04 mainly due to favourable monsoon. During the period
ranging between 1990-91 and 2003-04, the area and production declined at
the compound growth rate of 3.09 percent and 1.17 percent per annum
respectively, while the yield grew at a rate of 1.98 percent only. The second
advance estimates of the Directorate of Economics & Statistics place its
production at 6.48 lakh tones in 2004-05, which is lower by 1.55 lakh tonnes
than the last year’s production. The fall in production in 2004-05 may be
attributed to the erratic monsoon. The crop is mainly grown in Gujarat, West
Bengal and Rajasthan. It is also grown in small areas in Andhra Pradesh,
Madhya Pradesh, Maharashtra and Tamil Nadu. The crop yield varied widely
in different states. In 2003-04, the state of West Bengal recorded the highest
yield (876 kg. per hectare) followed by Gujarat (598 per hectare), Tamil Nadu
(521 kg. per hectare) and lowest (267 kg. per hectare) in Andhra
Pradesh. (Table
2.1)
2.89 Like nigerseed, the international demand for sesamum seeds was
quite good and the unit value of its export was much higher than MSP. The
export of sesamum seed both in terms of volume and value from 2000-01 to
2004-05 (upto July 2004) is given in the following table:
Table: Export of Sesamum Sl.No. Year Quantity
(In MTs)
Value
(In Rs. Crore)
Unit Value
(In Rs. Per kg.)

1. 2000-01 183310 517.57 28.24
2. 2001-02 218970 562.23 25.68
3. 2002-03 118380 373.00 31.51
4. 2003-04 189110 708.89 37.48
5. 2004-05 (April-July
2004)
32680 139.47 42.68
Source: DGCI&S, Kolkata
The figures given in the above table shows that this crop has a good potential
for its exports; therefore serious efforts should be made to increase its area,
production and yield.
Sunflower
2.90 Like other oilseeds crops, the area, production and yield of sunflower
also increased with the setting up of the Technology Mission on Oilseeds in
1986. During the period 1990-91 to 1995-96, the area, production and yield
of this crop grew at the compound growth rate of 11.55 percent, 15.33 percent
and 3.39 percent per annum respectively. The area, production and yield
increased from 16.33 lakh hectare, 8.73 lakh tonnes and 535 Kg. per hectare
in 1990-91 to 21.21 lakh hectare, 12.58 lakh tonnes and 593 Kg. per hectare
in 1995-96. The growth momentum was lost after 1995-96 and the area,
production and yield declined at a compound growth rate of 4.19 percent,
4.97 percent and 0.81 percent per annum respectively during the period
1995-96 and 2003-04. The area under this crop increased from 11.77 lakh
hectares in 2001-02 to 16.42 lakh hectares in 2002-03 and further to 20.01
lakh hectares in 2003-04. With increase in area, the production increased
from 6.8 lakh tonnes in 2001-02 to 8.73 lakh tonnes in 2002-03 and further to
9.92 lakh tonnes in 2003-04. The yield, however, declined from 577 kg. per
hectare in 2001-02 to 531 kg. per hectare in 2002-03 and further to 496
kg. per hectare in 2003-04. The second advance estimates of the
Directorate of Economics & Statistics put the production of this crop at 12.41
lakh tonnes in 2004-05, which is higher by 2.5 lakh tonnes than last year’s
production. The sunflower is the only kharif oil seed crop whose production is
estimated to have increased in 2004-05. (Table 2.1)

2.91 Sunflower is mainly grown in Karnataka, Andhra Pradesh and
Maharashtra and in small areas in UP, Punjab, Haryana and Tamil Nadu. The
recorded per hectare yield of the crop in 2003-04 was highest in U.P. (1708
kg.) followed by Punjab (1600 kg.), Haryana (1483 kg.), Tamil Nadu (1288
kg.), Andhra Pradesh (678 kg.), Maharashtra (396 kg.) and lowest in
Karnataka (375 kg.). In view of the high productivity of sunflower in Punjab,
Haryana and UP, this crop can be an alternative to the paddy in these states
provided the proper marketing and processing arrangements are made on the
same scale as being made for the procurement/price support operations of
paddy.
Cotton
2.92 Cotton occupied centre stage of production, supply management and
market dynamics of the agrarian economy during the year 2004-05
necessitating proactive institutional and policy intervention. Cotton production
remained sluggish in recent years due to either widespread pest incidence or
weather anomalies and dived down to 87 lakh bales (Official Estimates,
Directorate of Economics and Statistics, 1 bale: 170 kgs) in 2002-03
compared to earlier peak level of 142.3 lakh bales achieved in 1996-
97. During 2003-04, the production recovered to 138.66 lakh bales. During
2004-05, the cotton production performed exceptionally well. According to
2nd
Advance Estimates (Official), the cotton production in 2004-05 is pegged
at 170.7 lakh bales, accelerating by 23 per cent over previous year and
surpassing the production target of 150 lakh bales by 13.8 per cent.
2.93 The impressive cotton crop during the two consecutive recent years, after
a prolonged subdued spell was an outcome of multiple factors such as farmers
response to the good price received in the previous year, steady inroads made
by improved cropping practices with the wider use of BT Cotton seeds in
conjunction with favorable weather in cropping season and generally pest free
cropping conditions. The total area under cotton cultivation that had come down
to 76.70 lakh hectares in 2002-03, sliding further to 76.30 lakh hectares in 2003-
04 from its peak level of 93.4 lakh hectares of 1998-99, scaled new heights in
2004-05 with 99.7 lakh hectares coverage.

2.94 India is the leading country in cotton acreage with more than one-fourth of
about 350 lakh hectares cotton area in the world. China and USA distantly follow
with about 57 lakh hectares and 53 lakh hectares cotton acreage
respectively. However, in terms of total production, China tops the world by
producing about 295 lakh bales, followed by USA with production of 215 lakh
bales leaving India behind at third position. The main reason for such a
dichotomy of India’s performance in acreage and production is its abysmally
low level of productivity. The annual average yield of cotton in India (TE
2003-04) is 328 kg per hectare. The cotton yield in China and USA is
reported to be about 1127 kg per hectare and about 877 kg per hectare
respectively. India's cotton productivity even lags much behind Pakistan (612
kg/ha), Uzbekistan (739 kg/ha), Iran (646 kg/ha), Afghanistan (370 kg/ha), and
of some of the African countries like Sudan (435 kg/ha), Mali (454 kg/ha) and
Burkina (501 kg/ha). The main factors stimulating the productivity of cotton
are irrigation and seed. The persisting low productivity in India over the years
is mainly attributed to the fact that nearly 65 per cent of the cotton area is rain-
fed. The average productivity of cotton in states of Punjab and Haryana
having near complete irrigation is 428 kg/hectare and 365 kg/hectare
respectively whereas Maharashtra having largest share in country’s cotton
acreage (28 per cent) with only 4 per cent of the cotton area under irrigation
has the lowest yield of around 140 kg/hectare. The productivity of cotton in
Andhra Pradesh, Karnataka and Tamil Nadu having moderate irrigation (10-
30 per cent) ranges between 219 kg and 281 kg/hectare.
2.95 The cotton productivity lately has started picking up. The average yield
for TE 1994-95 was 298 kg/hectare is poised to cross the milestone of 400
kg/hectare during 2004-05. In some of the states like Gujarat, productivity
may match the world average of 627 kg/hectare. The sharp rise in yield may
be attributed to BT cotton as well as favourable weather. Although the wider
adoption of BT cotton is not confirmed officially, it is believed that the farmers
have adopted these seeds through private sources and derived productivity
gains. Given the fact that expansion of area under irrigation is a long-term
phenomenon, the yield could possibly be increased in the short run through
adoption of GM seeds which have resistance to pests and diseases. The
higher productivity besides reducing the cost of production due to lower

expenses on pesticides would raise the competitiveness of cotton in the world
market. The Commission feels that India, with its major share in world cotton
area could considerably influence the world supply of cotton, provided its yield
is enhanced to match the world average level.
2.96 With the lapse of Multi Fibre Agreement (MFA) since 1st January, 2005,
and reforms in textile trade, ample opportunities for India to expand the textile
trade are envisaged. This emerging transformation should create larger
demand for cotton and cotton farming should benefit from it. This would
require improvement in productivity, quality and specifications of cotton for
meeting rising needs of industry. However, availability of quality cotton seed,
BT or otherwise at affordable price should not pose a constraint. Apart from
high cost, there is undue delay on the part of ICAR to release BT cotton seed
in different regions such as Punjab and Haryana, the regions having potential
of increasing productivity with extensive irrigation facility. Sometimes spurious
GM seeds are also passed by scrupulous input suppliers to the farmers, which
results into productivity loss. Such incidences call for strict implementation of
Seed Act by the Government agencies.
2.97 The Commission is aware of the on going issues on divergence
between the official and trade estimates of cotton production, due to inherent
methodological features adopted for each estimate. However, there exists a
fair degree of consistency in the trends of the time series of the two
estimates. The Commission, therefore, considers both the sets of estimates
appropriately while formulating the price policy. The Commission observed in
its previous report about the buoyancy in the supply and resultant depression
in the prices during the cotton year 2004-05. According to the domestic
balance sheet of cotton for 2004-05, prepared by the Textile Commissioner,
Ministry of Textile, the total import of cotton during 2004-05 is likely to be
about 5 lakh bales as compared to 6.50 lakh bales imported in the previous
year. This is the minimum level of import, particularly the import of long staple
or extra long staple cotton, demanded by the industry on specific quality
consideration. Adding to it, the opening stock of 21 lakh bales and production
of 213.00 lakh bales as estimated by the Cotton Advisory Board (CAB) (trade
estimates), the total supply of cotton in the country is expected to be about
239.00 lakh bales. As against this, the total demand for cotton, including both
mill and non-mill consumption and export is likely to be about 205 lakh
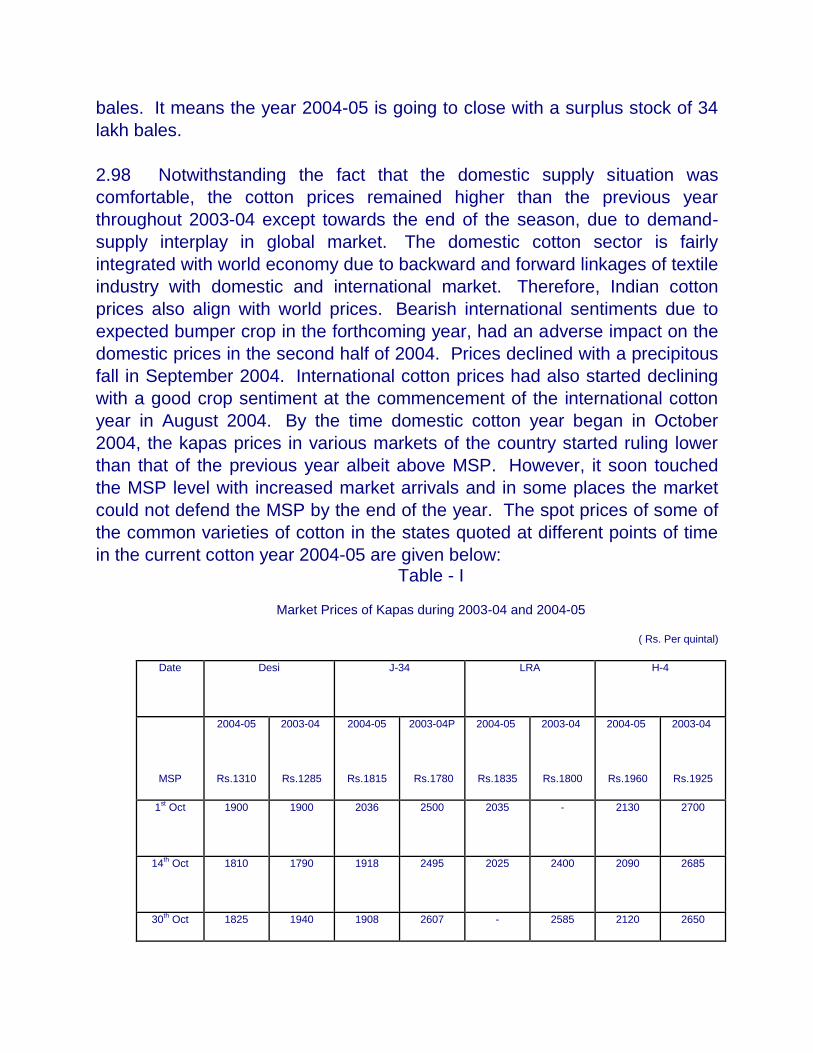
bales. It means the year 2004-05 is going to close with a surplus stock of 34
lakh bales.
2.98 Notwithstanding the fact that the domestic supply situation was
comfortable, the cotton prices remained higher than the previous year
throughout 2003-04 except towards the end of the season, due to demand-
supply interplay in global market. The domestic cotton sector is fairly
integrated with world economy due to backward and forward linkages of textile
industry with domestic and international market. Therefore, Indian cotton
prices also align with world prices. Bearish international sentiments due to
expected bumper crop in the forthcoming year, had an adverse impact on the
domestic prices in the second half of 2004. Prices declined with a precipitous
fall in September 2004. International cotton prices had also started declining
with a good crop sentiment at the commencement of the international cotton
year in August 2004. By the time domestic cotton year began in October
2004, the kapas prices in various markets of the country started ruling lower
than that of the previous year albeit above MSP. However, it soon touched
the MSP level with increased market arrivals and in some places the market
could not defend the MSP by the end of the year. The spot prices of some of
the common varieties of cotton in the states quoted at different points of time
in the current cotton year 2004-05 are given below: Table - I
Market Prices of Kapas during 2003-04 and 2004-05
( Rs. Per quintal)
Date Desi J-34 LRA H-4
MSP
2004-05
Rs.1310
2003-04
Rs.1285
2004-05
Rs.1815
2003-04P
Rs.1780
2004-05
Rs.1835
2003-04
Rs.1800
2004-05
Rs.1960
2003-04
Rs.1925
1st Oct 1900 1900 2036 2500
2035 - 2130 2700
14th Oct 1810 1790 1918 2495
2025 2400 2090 2685
30th Oct 1825 1940 1908 2607 - 2585 2120 2650

16th Nov 1790 1910 1865 2556
- - 2080 2535
30th Nov 1760 - 1815 -
- 2485 1960 -
18th Dec 1695 2860 1815 2546
- - 1960 2452
(Source: Cotton Corporation of India)
The average price quotations of lint during the current season 2004-05
vis-a vis the previous season 2003-04 are as under: Table –II
Market Prices of Lint during 2003-04 and 2004-05
(Rs/per qtl.)
Date Desi
2004-05 2003-04
J-34
2004-05 2003-04
LRA H-4
2004-05 2003-04 2004-05 2003-04
1st Oct 4077 3712 4752 5680 5118 6186 5343 6411
14th Oct 3993 3684 4330 5540 4780 5821 4977 6186
30th Oct 4077 4162 4359 5990 4809 6243 4893 6383
16th Nov 3796 3937 4077 5961 4612 6186 4837 6411
30th Nov 3712 3712 3852 5596 4274 5708 4387 5821
13th Dec 3543 4049 3937 5793 4218 5877 4359 6046
(Source: Cotton Corporation of India)

2.99 The Cotton Corporation of India (CCI) commenced its MSP operation
initially in Andhra Pradesh and Karnataka. As kapas prices went below MSP
level, CCI intervention was necessitated in Punjab, Haryana, Rajastan,
Madhya Pradesh, Gujurat. In Maharastra, CCI resorted to commercial
purchase due to the prevalence of monopoly procurement in the
State. However, the total procurement of about 9.71 lakh bales by CCI till 31
December 2004 amounting to only 4.56 percent of the total production was
found to be quite inadequate to hold the price. The Maharashtra State
Cooperative Cotton Growers Marketing Federation, on the other
hand, purchased cotton at a higher rate of Rs.2500 per quintal as against the
support price of Rs.1960 per quintal for H-4/H-6 hybrid cotton with the
payment offered in three instalments – the payment of first instalment of price
equivalent to MSP was made at the time of procurement and the balance to
be paid as bonus in two instalments in the month of June 2005 and October
2005. The State Government plans to procure about 150 lakh quintals from
the farmers with an outlay of Rs1600 crores. The Maharashtra State
Cooperation Cotton Growers Marketing Federation is reported to have
procured about 20 lakh bales as on 31st December 2004.
2.100 While, the falling cotton prices in Maharashtra have been checked by
State’s monopoly procurement, CCI’s intervention in other states remained
inadequate to hold cotton prices at the MSP level. The farmers had
expressed their disappointment as their expectations to get better income this
year have been belied inspite of their good production performance. The
Commission feels that the existing procurement system was not properly
equipped to tackle the surplus supply and this calls for urgent attention of
policy makers. One of the alternative solution is to create a mechanism of
building a buffer stock. The buffer stock agencies at the end of a specified
period may sell it in the market at profit or loss at Government risk. The
Commission would recommend that the Government should examine the
feasibility of creating a buffer stock in cotton to streamline the supply
management and protect the interests of the farmers from fluctuating
market prices. The Commission also acknowledges the recent initiative to
allow NAFED to procure cotton at MSP. This will help in building a
competitive spirit in procurement and the farmers will have more options in the
market. The Commission would also recommend that both CCI and NAFED
should be equipped with adequate resources and infrastructure not only

for procurement of cotton but also for trading in domestic and
international market.
2.101 The International Cotton Advisory Committee (ICAC) while releasing its
projected demand and supply figures on January 1, 2005 stated that the
estimated world cotton production of 24.87 million tonnes in 2004-05 would be
higher by 20.4 per cent than the production of 20.65 million tonnes in 2003-
04. The higher production was attributed to 10 per cent expansion of area
over previous year and a rise in average yield of cotton pegged at 682 kg per
hectare. The estimated world consumption of 22.53 million tonnes in 2004-05
was also higher than previous year’s consumption figure of 21.18 million
tonnes. The cotton trade however, is likely to fall from 7.27 million tonnes in
2003-04 to 6.74 million tonnes in 2004-05 due to increased production in most
of the cotton producing countries. While taking into account, the opening
stock, trade and consumption, the closing stock of cotton for 2004-05 is
estimated at 10.14 million tonnes as against 7.79 million tonnes in the
previous year. ICAC predicts that the average Cotlook ‘A’ index for 2004-05
may remain around 48 cents per pound as compared to 69.24 cents in 2003-
04.
The Cotlook A index (staple lenth = 28 mm) for international cotton season
(August-July) for 2001-02, 2002-03, 2003-04 and 2004-05 is given below:
International Reference Prices of Cotton
Cotlook A index in US cents/lbs
Month 2001-02 2002-03 2003-04 2004-05
(Provisional)
------------------------------------------------------------------------------------------------
---
August 43.48 49.62 60.49 53.56
September 41.26 49.02 64.08 56.37
October 37.12 49.58 72.56 52.60

November 37.67 52.30 76.77 49.23
December 40.49 55.24 73.62 51.03
January 43.42 56.71 76.15
February 42.77 58.61 73.94
March 42.02 61.04 72.23
April 41,43 60.78 69.45
May 39.91 57.80 70.04
June 43.16 58.50 64.55
July 46.57 60.21 57.02
Average 41.61 55.78 69.24 52.56 (so far)
(Cotlook A index is the average of the five lowest quotes of the cotton=28mm)
2.102 The subdued international cotton prices mainly on account of healthy
cotton crop in 2004-05 in most of the cotton producing countries is likely to
affect the trade sentiments throughout the world. Besides, the production
performance, policies of support and subsidies in some major cotton growing
countries also affect the international prices to a great extent. China’s
production of 29.5 million bales in 2004-05 is expected to rise by 13.7 percent
over previous season on account of both expansion in area under cotton
cultivation and rise in yield. Despite harvesting a bumper crop this year,
China is also expected to enter the world market for import of cotton to build
its stocks and meeting its expanding textile trade commitments. USA’s
production of 20.9 million bales of cotton during 2004-05 is expected to rise by
24 percent over previous season. The rise in production is expected both
from upland cotton and extra long staple cotton. A host of factors are
responsible for the rise in production which include a record rise in national
yield in 2003-04, rate of change of farm prices being above the loan rate,
increased profitability and a normal planting season in 2004. Generally one
third of cotton produced in USA is consumed domestically and the remaining
two third is exported. USA accounts for about 20 percent of the total world
export of cotton and its major importer is China which accounts for about 35
percent of USA’s total export. Although production of cotton in USA has
increased manifold, its export is likely to decline because of the lower demand
by major importing countries due to bumper cotton crop all over the
world. World aggregate supply and demand estimates suggest that the
Cotlook A index during 2004-05 may average at 48 to 50 cents per pound i.e.
about 30 percent less than the last marketing season.
2.103 Continued import of large quantity of cotton by the cotton mills in recent
years was facilitated by low tariff of 10 per cent applied on modest level of
international prices. India’s major suppliers include USA, Australia, West
Africa, Egypt and CIS countries. Apart from price consideration, quality was
also the prime factor particularly the need for long and extra long staple
cotton, inducing import of cotton during the past three years. On an average,
the annual import of cotton during the period 1999-2003 was 16 lakh bales.
India’s export of staple cotton in the recent years has lost some of its ground
because of the tight position of domestic supply, the depleting price
competitiveness and lower quality. The annual average export of cotton
during the last four years remained low at about 7 lakh bales. The
Government introduced recently a cotton export scheme for 2004-05, being
operated by CCI, to stimulate the export and ease the supply pressure in
domestic market. While export of raw cotton remained negligible, there exist
possibilities for the Indian textile industry with its value added chain – i.e. fibre
to finished products, to absorb the domestic surplus of production due to
higher world demand resulting from removal of quota restrictions from January
2005. The textile industry appears to be upbeat in view of a substantial
investment made (about $ 14 billion) during the last five years in textile
industry for its capacity expansion and modernization. The National Textile
Policy 2000 that envisaged textile export at US $ 50 billion with garment’s
share of US $ 25 billion by 2010, states that India’s share in the world textile
trade would increase from the current rate of 3.13 per cent to 7 per cent. This
in turn, should increase the demand for domestic cotton and ultimately benefit
the farmers.
2.104 Still there are many problems persisting with the cotton economy: low
productivity; frequent attack by pest and diseases impinging on cost of
cultivation and productivity; the non availability of quality seeds that is

resistant to pests and diseases at affordable rate and marketing bottlenecks
for farmers. Besides, the problems of quality due to varietal dispersion, poor
post harvest management and obsolete ginning and pressing factories are the
perennial constraints. To make Indian cotton competitive, all these problems
need to be tackled in an integrated manner. The Commission recommends
that some of the fundamental problems of cotton economy such as low
productivity, high costs of production, non-availability of pest and
disease resistant quality seeds and marketing bottlenecks need to be
addressed on priority basis to make Indian cotton competitive in the
world and to gain substantially in post MFA textiles regime. Several of
these issues are encompassed in the Technology Mission on Cotton, which is
now in its sixth year of operation. The elements of the mission, though have
been delivering some results, have to be geared up. The progress of
modernization of ginning and pressing units which is undertaken by the
Mission, needs to be closely monitored and speeded up and resource
constraints, if any for modernization should be overcome because the
technology constraint for quality improvement of cotton is clearly acting as a
development deterrent in the textile sector. Secondly, there is a continued
shortage of long staple and extra long staple cotton in the country. Recently
some areas like Koraput – Bolangir and Kalahandi districts of Orissa have
been nurtured to produce long staple fine cotton but it lacked market
support. These areas need to be supported and sustained with direct
participation of cotton mills or other institutional arrangements. The
Government should encourage contract farming in the new areas of potential
cotton farming. The Commission recommends that the Government should
set up a Core Group on Cotton with representation from farmers, State
Government, Industry, Trade and Commercial Organization,
procurement agency, etc. to meet periodically and comprehensively
address the problems faced by the respective stakeholders.
2.105 Under Mini Mission III and IV, the Govt. of India envisages to improve
market yards and modernize ginning and pressing factories. Of the 400
market yards existing in the country, 171 are targeted for development on
mission mode and 111 projects are being implemented to develop market
yard. So far about 71 projects have been completed and the remaining 40
projects are likely to be completed by March 2005. The development
programmes include inter-alia, cemented roads, pucca platforms, sheds,
parking places, grading laboratories, farmers information centers, rest houses,
canteen and sanitary facilities etc. It is expected that improved market yards
will reduce contamination of cotton, which is the major problem for the Indian
cotton currently. Out of over 4000 ginning and pressing factories in India,
only 700 units are composite units with both ginning and pressing
facilities. The present level of cotton production requires about 800 ginning
complexes. Of about 500 ginning cum pressing factories targeted for
modernization, 430 projects have already been approved and 260 projects
have been completed by October 2004. The remaining would be completed
by 2006-07.
2.106 The Commission perceives an optimistic outlook for cotton economy
during 2005-06 for two reasons: (a) although price is a dominant factor
influencing the decision of the farmers for acreage, the relative price
realization of cotton with certain degree of marketing arrangement vis-à-vis
other crops favours cotton farming as a better option than other crops; (b) BT
cotton is finding farming preference over traditional cotton. The structural
changes witnessed in cotton sector in India in the past two years indicate that
the acreage under cotton is sustainable. On the price front, the Commission
expects that the present subdued demand will start defusing after March/April,
when the mills consumption will start rising due to demand for textile. On the
whole, the gross farming returns may not be substantially affected. The
overall supply of domestic cotton next year, therefore may only be subjected
to climatic uncertainties, that frequent the arid and semi-arid cotton production
regions.
Tobacco
2.107 Virginia Flue Cured (VFC) tobacco is an important cash crop in a
number of Indian states, namely Andhra Pradesh, Maharashtra, Orissa and
Karnataka. In India, the tobacco sector, from farm to processing,
manufacturing and marketing of product, generates total employment
opportunity for over 3 million people. The annual foreign exchange earning
from tobacco export is estimated to be about Rs.800 crores. Since tobacco
economy provides employment to large number of persons in rural areas and
fetches substantial amount of foreign exchange and a sizeable amount of
revenue, emerging dynamics of tobacco consumption is poised to have the
socio-economic implications on the tobacco cultivation. Cultivation of tobacco
is regulated by Tobacco Board under the power vested with it vide Tobacco

Board Act 1975. The Board after assessing both domestic and international
demand assigns crop size to each tobacco region. The crop is grown both in
light soils and black soils. There are seven soil regions in the country where
tobacco is produced. Northern Black Soils (NBS) are located in the districts of
East and West Godawari districts of Andhra Pradesh. The tobacco produced
in NBS is mostly preferred by East European markets. The Central Black
soils (CBS) are located in Krishna, Guntur, Karim Nagar and Warrangal
districts of Andhra Pradesh and part of Maharashtra. The tobacco produced
from CBS is exported to East European markets. Southern Black soils (SBS)
are located in Prakasham and Nellore districts of Andhra Pradesh. The
tobacco produced from SBS is generally exported to African countries, Nepal
and CIS countries. Southern Light Soil (SLS) are located in Prakasham and
Nellore districts of Andhra Pradesh. The crop produced from SLS is generally
exported to UK and EEC countries. Northern Light Soils (NLS) are situated in
East and West Godavari and parts of Khammam districts. The soils are
sandy to sandy loams and irrigation is necessary to produce tobacco. The
tobacco produced from here is exported to UK (British American Tobacco)
and Germany. Eastern Light Soils (ELS) are located in Vijayanagram districts
of Andhra Pradesh and Rayagoda district of Orissa. Tobacco cultivation is
encouraged in this region as an alternative to NLS area. Karnataka Light
Soils (KLS) are located in Mysore, Hassan, Shimoga, Coorg and Chitradurga
districts of Karnataka. The heavy rainfall in these areas is favorable for
tobacco cultivation.
2.108 The tobacco year 2003-04 opened with carry over stock of 59.19
million kg. Adding to it the production of 221.66 million kg, the total availability
of tobacco was estimated at 280.85 million kg. As against this, the demand
for tobacco was estimated at 175.49 million kg, on the assumption of 44.33
million kg as wastage and farm retention, 70.00 million kg for domestic
consumption and 98.52 million kg for export. Thus the current tobacco year
2004-05 opened up with carry over opening stock of 68.00 million kg. The
estimated production for the current year was placed at 216.56 million
kg. Similarly, the consumption, export and wastage of tobacco were
estimated at 70 million kg, 100 million kg and 46 million kg respectively. The
year 2004-05 is expected to close with a surplus stock of 68.56 million kg to
be carried forward to the next year.

2.109 The total area under tobacco cultivation in Andhra Pradesh,
Maharashtra and Orissa has been rising for the last five years since 2000-01
in spite of Governmental measure to reduce demand and supply of
tobacco. To manage over production of tobacco, the Tobacco Board declared
2000-01 as a crop holiday. However, subsequently, the area under tobacco
increased from about 88 thousand hectares in 2001-02 to 93 thousand
hectares in 2002-03, further to 109 thousand hectares in 2003-04 and finally
to 113 thousand hectares in 2004-05. Similarly, in Karnataka, the area has
been continuously rising from 48 thousand hectares in 2001-02 to 69
thousand hectares in 2003-04 and finally to 70 thousand hectares in 2004-
05. Although, the area has increased in Andhra Pradesh, Maharashtra and
Orissa in the current year, the estimated production of 137.81 is likely to be
less than last year by about 10 thousand tonnes.
2.110 In its recent study, FAO has predicted a decelerated growth in
consumption of tobacco in the world until the year 2010, and the expected per
capita consumption of tobacco may decline to 1.4 kg per year in 2010 from
1.6 kg per year in 2000. A major part of the projected demand for tobacco is
expected from Far East, particularly China, whose share in the world’s total
demand would be around 37 percent. India, by accounting for 21 per cent of
the world’s consumption becomes the second largest consumer of tobacco.
2.111 The Commission recommends MSP for F2 grade black soil and
L2 grade of light soil VFC tobacco. For 2002-03, the Commission had
recommended Rs.28 per kg for F2 grade and Rs.30 per kg for L2 grade VFC
tobacco. The Tobacco Board fixed the prices for other varieties of tobacco
based upon grade differential and recommended MSP for basic grade of
F2 and L2VFC tobacco. The MSP recommended by Commission at Rs.31.00
per kg for F2 grade and Rs.33 per kg for L2 grade VFC tobacco for 2003-04
were accepted and announced by the central Government. The MSP
recommended by Commission at Rs.34 per kg for F2 grade and Rs.36 per kg
for L2 grade VFC tobacco for 2004-05 were, however, reduced by the
Government to Rs 32 for F2 grade and Rs.34 kg for L2 grade.
2.112 The Minimum Guaranteed Price (MGP) an informal negotiated price
between farmers and the traders offered by Tobacco Board, and the actual
average price realized by the growers in the past remained much higher than

the MSP announced by the Government. The average price realized in
Andhra Pradesh for L2 grade in 2003 was Rs.46.35 per kg and Rs.43.12 per
Kg. for F2 grade. The average price realized for F2 grade in Karnataka was
Rs.55.92 per kg. In 2004-05, the reported price realization in Andhra Pradesh
is Rs. 48.79 kg. for L2 grade and Rs. 41.92 kg. for F2 grade.
2.113 The Tobacco Board stated that since the cost of production, the quality
and yield of tobacco widely varied in KLS, SLS and NLS, a single MSP for all
regions would not be appropriate. Moreover, there was always a huge price
differential between MSP and the Auction Price of different grades. With a
low level of MSP compared to the MGP or Auction Price, the traders exploited
the farmers, since auction price was mostly determined by MSP as the
benchmark.
2.114 It is admitted that a crop like tobacco where the auction price is driven
by vast export demand in comparison with MSP, which is predominantly
determined by the average cost of production, may often depress the auction
price and thereby price realization by the farmers. Generally MSP also acts
as an instrument to modulate crop planning but in case of tobacco, the
exogenous policy factors and market behaviour have a role stronger than
MSP. The Commission would recommend that the Government may
examine the relevance of MSP in tobacco production vis-à-vis MGP and
Auction Price and whether the tobacco production and pricing could be
left to either market forces or to Tobacco Board.

III. BEHAVIOUR OF INPUT PRICES, COST OF PRODUCTION, TERMS OF TRADE AND INTER-CROP PRICE PARITY
The cost of production is perhaps the most important among the
multiple factors that go into the formulation of price support policy. For this
reason the Commission reviews comprehensively the level of cost of
production of each of the crops grown in different parts of the country. Apart
from paid out operational costs, the items of input costs that are actually
incurred by the farmers for each of the crops grown by them, the imputed
value of family labour, owned value of inputs, rental value of owned land,
interest on fixed capital etc. are also considered. The usual source of cost
data continues to be the Directorate of Economics & Statistics, Ministry of
Agriculture who generate statewise estimates of cost of cultivation of various
crops under the Comprehensive Scheme (CS). In addition, the Commission
also obtains extensive feed back from state governments and other
organisations, which provide valuable information on state specific input
prices as also estimates of cost of cultivation generated by state
governments. Besides, price indices in respect of some agricultural inputs are
obtained from the office of the Economic Adviser, Ministry of Industry whereas
the month-wise average wage rates for agricultural labour are obtained from
Labour Bureau.
3.2 After the submission of the Commission’s last report on Price Policy for
Kharif Crops for 2004-05 season, the statutory minimum wages for agricultural
labourers have been revised upward in the states of Haryana, Madhya
Pradesh, Punjab, Uttaranchal and West Bengal. According to the data
obtained from Labour Bureau, the actual average agricultural wage rates,
between the Kharif seasons (April- September) of 2003 and 2004, are
observed to have increased by 1 to 4 per cent in Bihar, Gujarat, Karnataka,
Madhya Pradesh, Maharashtra, Punjab, Tamil Nadu and West Bengal. In the
states of Andhra Pradesh, Assam, Haryana, ,Orissa, Rajasthan and Uttar
Pradesh the increase in the wages is 5 per cent during the same period.
3.3 The prices of High Speed Diesel (HSD), one of the most significant farm
input, as measured by the WPI reached the level of 388.2 in January, 2005
from 321.6 prevailing in February, 2004registering a sharp increase of about

21 per cent. A similar increase of about 25 per cent is observed for Light
Diesel Oil (LDO) also. The prices of other farm inputs as measured by
WPI are observed to have increased by 2.69 per cent for pesticides, 4.62 per
cent for tractors, 9.29 per cent for lubricants and 9.75 per cent for non-
electrical machinery between February, 2004 and January, 2005. However,
the prices of fertilizers have registered an increase of less than one per cent
which is almost negligible. It may be pertinent to note in this regard that most
of the state governments in their interaction with Commission, informed about
the non-availability of the fertilizers and the associated rise in the prices of
fertilizers. (Tables 3.1 & 3.2)
Estimates of Cost of Cultivation and Projected Costs for 2005-06 Season
3.4 After the submission of the Commission’s last Report on Price Policy
of Kharif crops for 2004-05 season, the Directorate of Economics & Statistics
(DE&S) has provided the estimates of cost of cultivation/production for the
year 2002-03 for different crops. This year was a severe drought year for the
Kharif crops. As a result, 17 out of a total of 82 estimates of cost of
cultivation/ production received in the Commission registered all-time low
yields in the last five years. It may be mentioned in this regard that these
unusually low yields and costs have been kept out of the projection regime
and have not been used for framing the price policy recommendations for the
Kharif season 2005-06. Interestingly, a few estimates of cost of
cultivation/production for the year2002-03 show all-time high yields in the last
five years
Paddy
3.5 The Directorate of Economics & Statistics has provided the estimates
of cost of cultivation/production of paddy for the year 2002-03 in respect of
Andhra Pradesh, Assam, Bihar, Haryana, Karnataka, Kerala, Madhya
Pradesh, Orissa, Punjab, Tamil Nadu, Uttar Pradesh and West Bengal. The
cost estimates of paddy with respect to Chattisgarh, Jharkhand and
Uttaranchal have become available for the first time for the year 2002-03.The
details of the latest available cost estimates of paddy and also those
pertaining to the preceding year are presented in Table 3(A). It is observed

that between 2001-02 and 2002-03 the estimated C2 cost of cultivation per
hectare has increased in all the states except Assam, Madhya Pradesh and
Orissa. The lower cost of cultivation is associated with fall in the yield levels
by 20 per cent and 32 per cent repectively in the states of Orissa and Madhya
Pradesh during the year. In the case of Haryana and Punjab, the increase in
the C2 cost of cultivation is high ranging between 24 to 26 per cent. The
C2 cost of production per quintal has increased in all the states for which
estimates are available. The increase in C2 cost of production is observed to
be more than 24 per cent in the case of Punjab and Orissa. Further details of
cost of cultivation/production of paddy pertaining to the latest period and for
the preceding year are given in Tables 3.3 and 3.4.
3.6 In order to derive the likely cost of production of paddy for the ensuing
crop season (2005-06), the Commission has, as usual, used the base level
CS data pertaining to different states for the latest three years ending 2002-
03. In other words, each of the estimated costs for 2000-01, 2001-02 and
2002-03 have been projected to 2005-06 and their average taken. For
projections, a state-specific Variable Input Price Index has been constructed
to capture the actual movements of input prices between the base year and
the year of projection (2005-06). No projections have been made in
respect of Chattisgarh, Jharkhand and Uttaranchal in the absence of time
series data for the states. (Table 3.5)
3.7 As per the above methodology, the projected per quintal paid-out cost
of production of paddy plus imputed cost of family labour (i.e. cost A2+FL) for
2005-06 works out to an average of Rs. 399 for Andhra Pradesh, Rs. 436 for
Assam, Rs.365 for Bihar, Rs.478 for Haryana, Rs.456 for Karnataka, Rs. 633
for Kerala, Rs.495 for Madhya Pradesh, Rs.426 for Orissa, Rs.324 for Punjab,
Rs. 426 for Tamil Nadu, Rs.371 for Uttar Pradesh and Rs. 445 for West
Bengal. As against this, the projected C2 cost of production of paddy for these
states average at Rs. 578, Rs.564, Rs.512, Rs. 685, Rs.602, Rs.765, Rs.682,
Rs.558, Rs.481, Rs.620, Rs. 511 and Rs. 573 per quintal respectively for
2005-06. The weighted average cost of production of paddy for all these
states works out to Rs. 407 on cost A2+FL basis and Rs. 558 on cost
C2 basis. [Table 3(G)]

3.8 It is observed from the above that the average C2 cost of production of
paddy is the lowest in Punjab followed by Uttar Pradesh. Based on the MSP
fixed for paddy (Common) for 2004-05 at Rs.560 per quintal, both these states
command a margin of about 17 per cent and 10 per cent over C2 costs of
production currently being projected. On the other hand, the costs of
production of paddy are much on the higher side in Haryana, Kerala and
Madhya Pradesh. While Madhya Pradesh suffers from extremely low
productivity, Kerala’s high cost is explained mainly by the higher human
labour cost. In the case of Haryana, the total cost of cultivation of paddy per
hectare at Rs. 27808 is very close to that of its neighbour, Punjab. However,
Haryana produces finer quality of paddy of basmati variety in a large area
which results in much lower yield levels averaging around 40 quintals per
hectare as against 59 quintals obtained in Punjab for common variety.
3.9 The Commission regularly examines the cost data received from some
of the state governments and compares them with those made available by
the DES for the latest year and also with the projected costs of production of
various crops for the ensuing kharif season Although these estimates are not
strictly comparable with the CS estimates because of certain conceptual and
methodological differences, the comparison exercise is useful for the purpose
of cross-checking of the cost data. In some cases these state estimates
pertain to more recent years and information therein is used for the purpose of
projections.
3.10 From Table 3(H) it is observed that the cost of production of paddy
estimated by Madhya Pradesh, Uttaranchal and West Bengal at Rs 610, Rs.
378 and Rs. 455 per quintal for 2002-03 are lower than those given under CS
at Rs.690, Rs. 529 and Rs.549 per quintal respectively .In the case of Uttar
Pradesh, however, the unit cost estimated by the state at Rs.589 per quintal is
higher than the CS estimate mainly because of higher human labour
cost considered by the state. As regards Bihar the per quintal cost estimated
by the state for 2002-03 at Rs. 727 per quintal is much higher than the CS
estimate for the year. This state estimate is inclusive of 25 per cent profit to
the farmers, farmer’s risk, management charges etc.The estimated cost of
production of paddy provided by Andhra Pradesh and Gujarat for the year
2004-05 is Rs. 770 and Rs. 546 per quintal. The estimate of Andhra Pradesh

includes 10 per cent on account of managerial cost. However, no comparison
is possible due to non- availability of CS data for 2004-05.
3.11 Punjab has given the projected cost of paddy for 2005-06 at Rs. 742
per quintal .This is inclusive of the weather risk, management charges
etc. After making necessary adjustments for these, the projection works out
to Rs.589 for 2005-06 which is higher than the Commission’s projection at
Rs.481 per quintal. This difference is mainly attributed to the much higher
rental value of land considered by the state. This has been mentioned in the
Commission’s earlier reports and the issue has been repeatedly discussed
during the meetings of the Commission with the state government officials.
Bihar and Maharashtra have provided the projected cost at Rs.953 and Rs.
928 per quintal. In the case of Bihar the estimate is inclusive of 25 percent
profit to the farmers whereas for Maharashtra it is inclusive of the 15 per cent
profit to the farmers and also transport and marketing charges. After making
similar adjustments to the projected costs to make them comparable with the
Commission’s concepts and methodologies, it is observed that the projected
costs work out at Rs. 692 and Rs.682 per quintal respectively. It is observed
that this adjusted projected cost for Bihar is still higher than the Commission’s
projection at Rs.512 per quintal for 2005-06 mainly on account of higher
human labour cost and also higher fixed cost components considered in the
state estimate. The state of Haryana has provided the projected cost at
Rs.746 per quintal which is inclusive of management charges, weather risk,
transportation charges etc. However, the adjusted projected cost works out to
Rs.631 per quintal which is lower than the Commission’s projection for the
state. In the case of Maharashtra no comparison is possible due to non-
availability of data under CS. [Table 3(I)]
Cotton (Kapas)
3.12 For cotton, the estimates of cost of cultivation/production for 2002-03
have become available in respect of Andhra Pradesh, Gujarat, Haryana,
Karnataka, Madhya Pradesh Maharashtra, Punjab and Tamil Nadu. The data
presented in Table 3(B) show that the C2 cost of cultivation per hectare is
estimated to have increased as compared to the preceding year in the states
of Andhra Pradesh, Haryana, Karnataka, Madhya Pradesh, Maharashtra and

Punjab while in Gujarat and Tamil Nadu it has declined. This increase is
higher in the case of Haryana and Madhya Pradesh as compared to other
states. The unit C2 cost of production of cotton has gone up in the states of
Madhya Pradesh, Maharashtra and Tamil Nadu. It may be noted that yield
levels of cotton have substantially increased in the states of Andhra Pradesh,
Haryana and Madhya Pradesh in 2002-03 over the previous
year. (Tables 3.6 & 3.7)
3.13 Following the same methodology as used in the case of paddy,
the cost A2+FL of cotton is projected for 2005-06 to an average of Rs.1200 for
Andhra Pradesh, Rs.1425 for Gujarat, Rs.1252 for Haryana, Rs. 1677 for
Karnataka, Rs.1500 for Madhya Pradesh, Rs.1813 for Maharashtra, Rs.1834
for Punjab and Rs. 1809 per quintal for Tamil Nadu. The corresponding cost
C2per quintal is projected at Rs.1815, Rs.1761, Rs.1802, Rs.2318, Rs.2550,
Rs.2303, Rs.2415 and Rs.2586 per quintal respectively. The weighted
average cost of production of cotton for 2005-06 is placed at Rs.2077 per
quintal on cost C2 basis.
[Table 3(G)]
3.14 In addition, the estimates of cost of production of cotton for
2002-03 provided by the states of Gujarat, Madhya Pradesh and
Maharashtra at Rs. 1391, Rs. 2009 and Rs. 2148 per quintal respectively are
much lower than the corresponding CS estimates. The states of Haryana,
Maharashtra and Punjab have given the projected costs of cotton for the year
2005-06. The projected costs provided by Haryana and Maharashtra are on
the higher side as compared to the Commission’s projections for these
states. However, after similar adjustments as explained earlier, the projected
costs in the case of these states work out much lower than the Commission’s
projected costs. In the case of Punjab, the two projections are almost the
same after adjustment.
[Tables 3(H) &
3(I)]
Coarse Cereals
3.15 Jowar, bajra, maize and ragi are the major kharif coarse cereals for
which cost estimates are available under CS. For jowar, estimates of cost of
cultivation/production are available for 2002-03 in respect of Andhra Pradesh,

Karnataka, Madhya Pradesh, Maharashtra and Tamil Nadu. It may be
observed from Table 3(C) that between 2001-02 and 2002-03, the C2 cost of
cultivation for jowar per hectare is estimated to have increased with respect to
Madhya Pradesh and Tamil Nadu. The yield level has increased by 13.89 per
cent in the state of Maharashtra while in Madhya Pradesh it has increased by
a lower margin of 3.43 per cent. However it has declined for the remaining
states .The cost estimates for bajra have been received with respect to
Gujarat, Haryana, Maharashtra and Uttar Pradesh. For bajra, the C2 cost of
cultivation is estimated to have increased in all the states for which data have
been made available while the yield has registered a decline except in the
case of Maharashtra. In case of maize, cost estimates have become available
for Andhra Pradesh, Himachal Pradesh, Karnataka, Madhya Pradesh,
Rajasthan and Uttar Pradesh. For the first time, cost estimates of maize have
been made available for the states of Jharkhand and Uttaranchal. The yield
levels have gone up in Andhra Pradesh and Himachal Pradesh while declined
substantially in Uttar Pradesh and Karnataka. The cost estimates with respect
to Karnataka and Tamil Nadu have been made available for Ragi. It is
observed that C2 cost of cultivation has declined by a big margin of 28 and 18
per cent respectively in the states of Karnataka and Tamil Nadu. This decline
is associated with a substantial fall in the yield levels from 16.02 to 9.42
quintal per hectare in Karnataka and from 18.89 to 8.77 quintal per hectare in
Tamil Nadu.
3.16 The projected cost of production (A2+FL) for jowar for 2005-06 in
respect of Andhra Pradesh, Karnataka, Madhya Pradesh, Maharashtra and
Tamil Nadu are Rs.533, Rs.566, Rs.460, Rs.502 and Rs.466 per quintal
respectively while the projected cost of production per quintal on C2 basis for
these states are Rs.866, Rs.732, Rs.635, Rs.642 and Rs.577 respectively.
The weighted average A2+FL and C2 cost of production for jowar work out to
Rs. 510 and Rs.677 per quintal respectively. The projected cost of production
for bajra for the year 2005-06 with respect to the states of Gujarat, Haryana,
Maharashtra and Uttar Pradesh on A2+FL basis work out to Rs.467 Rs.507,
Rs.548 and Rs.412 per quintal while the C2 cost of production per quintal for
these states are Rs. 563, Rs.674, Rs.666 and Rs.545 respectively. The
weighted average A2+FL and C2 costs of production for the year 2005-06 work
out to Rs.479 and Rs. 604 per quintal respectively. The A2+FL projected cost

of production of maize for the states of Andhra Pradesh, Himachal Pradesh,
Karnataka, Madhya Pradesh, Rajasthan and Uttar Pradesh are Rs.374, Rs
438, Rs. 343, Rs. 402, Rs. 548 and Rs.543 per quintal respectively, while the
projected C2 cost of production for these states works out to Rs.528, Rs.607,
Rs.456, Rs.534, Rs.684 and Rs.687 per quintal respectively. The weighted
average A2+FL and C2 costs of production of maize on the basis of these
costs work out to Rs.436 and Rs.575 per quintal respectively. The projected
A2+FL cost of production for ragi for the year 2005-06 for the states of
Karnataka and Tamil Nadu work out to Rs.557 and Rs. 727 respectively
while the C2 cost of production for these states are Rs.679 and Rs. 954
per quintal. The weighted average cost of production of ragi works out to Rs.
584 on cost A2+FL basis and Rs.723 on cost C2 basis respectively. [Table
3(G)]
3.17 The cost estimates for jowar have been made available by the states
of Gujarat and Uttar Pradesh for the year 2004-05 while Maharashtra has provided
the same for the year 2002-03.The state of Madhya Pradesh has provided cost
estimates for three years 2002-03,2003-04 and 2004-05.The estimate provided by
Madhya Pradesh and Maharashtra at Rs. 573 and Rs. 418 for 2002-03 is much lower
than the corresponding CS estimates. The cost estimates of bajra provided by Gujarat,
Maharashtra and Uttar Pradesh for 2002-03 are on the lower side as compared to the
corresponding CS estimates. For maize, cost estimates have been provided by the
states of Andhra Pradesh, Bihar, Gujarat, Madhya Pradesh, Uttaranchal and Uttar
Pradesh. The estimates of cost provided by Madhya Pradesh and Uttar Pradesh at Rs.
553 and Rs. 566 per quintal are much lower than the corresponding CS estimates.
Maharashtra has also given the projected cost figures for jowar and bajra for the year
2005-06 at Rs.851 per quintal and Rs. 962 quintal respectively. However, when these
have been adjusted using the Commission’s concepts and methodologies, they worked
out to Rs. 608 and Rs. 698 per quintal respectively. The Commission’s projections for
jowar and bajra for the state are Rs. 642 and Rs.666 per quintal respectively. Haryana
has provided the projected costs of bajra and maize at Rs.664 per quintal. However, the
adjusted projected cost works out to Rs.560 for both these crops. Bihar has projected
the cost of production of maize for 2005-06 at Rs. 689 per quintal. When this projected
cost is adjusted, it works out to Rs.627 per quintal. However no comparison is possible
in the absence of cost estimates for Bihar under CS for the
crop. [Tables 3(H) & 3(I)]

Pulses
3.18 The latest available estimates of cost of cultivation/production for major
kharif pulses of tur (arhar), moong and urad are presented in Table 3 (D). The
cost estimates of tur and urad with respect to Chattisgarh have been made
available for the first time for 2002-03. It may be observed that the cost of
cultivation per hectare for tur is estimated to be higher in the range of 10 to
20 per cent during 2002-03 with respect to Andhra Pradesh, Gujarat,
Karnataka, Maharashtra and Orissa over the preceding year. The yield has
increased in the states of Andhra Pradesh, Karnataka and Maharashtra while
it has declined substantially in the case of Madhya Pradesh and Uttar
Pradesh. The projected per quintal cost of production (A2+FL) of tur for 2005-
06 averaged at Rs.1242 for Andhra Pradesh, Rs.1001 for Gujarat, Rs.1327 for
Karnataka, Rs.876 for Madhya Pradesh, Rs.817 for Maharasthra, Rs.1039 for
Orissa and Rs.615 for Uttar Pradesh .The corresponding C2 costs work out to
Rs. 1812, Rs.1450, Rs.1773, Rs.1286, Rs.1190, Rs.1529 and Rs.1132 per
quintal respectively. The weighted average cost works out to at Rs.899 and
Rs.1342 per quintal on A2+FL and C2 basis respectively. As regards moong
cost A2+FL is projected at Rs.1359, Rs.1364, Rs.1504 and Rs.1354 per
quintal for the states of Andhra Pradesh, Maharasthra, Orissa and Rajasthan
respectively and cost C2 at Rs.1964, Rs. 1734, Rs.2036 and Rs.1805 per
quintal for these states respectively. The weighted average cost for moong
for the same year works out to Rs. 1368 and Rs.1825 per quintal respectively
for cost A2+FL and C2. The A2+FL cost for urad for the states of Andhra
Pradesh, Madhya Pradesh, Mahrashtra, Orissa, Rajasthan, Tamil Nadu and
Uttar Pradesh have been projected at Rs.790, Rs. 1429, Rs. 1472, Rs.1222,
Rs.1818, Rs. 1447 and Rs.792 per quintal respectively. The corresponding
C2 cost of production for these states works out to Rs.1315, Rs.1980,
Rs.1857, Rs.1736, Rs.2359, Rs. 2188 and Rs.1221 per quintal respectively
with weighted average A2+FL and C2 cost being placed at Rs.1202 and Rs.
1696 per quintal
respectively.
[Table 3(G)]
3.19 For all the kharif pulses, the estimates of costs have been provided by
the states of Andhra Pradesh, Gujarat, Maharashtra and Uttar Pradesh while
Madhya Pradesh has provided cost estimates for tur only. In the case of tur,

the cost estimates provided by all these four states are lower than the
corresponding CS estimates for the year 2002-03. The cost estimate for
moong, as reported by the state of Maharashtra for 2002-03, is also lower
than the CS estimate while no comparison is possible for Gujarat and Uttar
Pradesh in the absence of CS data for the year 2004-05.The cost as projected
by Maharashtra for tur is higher than the projection made by the Commission
mainly due to a very high cost considered on account of human labour as
compared to the CS
estimate.
[Ta
bles 3(H) & (I)]
Oilseeds
3.20 The latest estimates of cost of cultivation/production for groundnut for
the year 2002-03 have become available in respect of Andhra Pradesh,
Gujarat, Karnataka, Maharashtra and Tamil Nadu. (Table-3(E)). The C2 cost
of cultivation per hectare for 2002-03 is estimated to be higher than that for
the previous year in the states of Gujarat, Karnataka and Tamil Nadu.
Although C2 cost of production has registered an increase for all the states for
which estimates have become available, the increase is much higher in the
case of Gujarat due to significant decline in yield from 16.67 to 8.75 quintal
per hectare. In the case of soyabean, cost estimates have become available
for Madhya Pradesh, Maharashtra and Rajasthan. For the first time cost
estimates of soyabean have become available for Chattisgarh for the year 02-
03. The yield levels have declined in all the three states. In Madhya Pradesh
the decline is substantial from 11.27 to 6.50 quintal per hectare. Cost
estimates for sunflower are available with respect to Andhra Pradesh,
Karnataka and Maharashtra. It is observed that the yield has declined in the
states of Andhra Pradesh and Karnataka. Interestingly, the yield of sunflower
in Maharashtra is an all-time high at 10.15 quintal per hectare since 1990-91.
3.21 The estimated costs of kharif oilseeds for the latest three years ending
2002-03 have been projected for the ensuing crop season of 2005-06 and
their averages taken. Accordingly, the projected A2+FL cost of production for
groundnut averages at Rs.1324 per quintal for Andhra Pradesh, Rs.983 for

Gujarat, Rs.1349 for Karnataka, Rs.1494 for Maharashtra and Rs.1333 per
quintal for Tamil Nadu. The C2 cost of production for these states work out to
Rs.1754, Rs.1256, Rs.1746, Rs.1795 and Rs.1697 per quintal respectively.
The weighted average cost for groundnut works out to Rs. 1178 per quintal on
A2+FL basis and Rs. 1509 on cost C2 basis. For soyabean, the projected
A2+FL cost works out to Rs. 690, Rs.719 and Rs.809 per quintal respectively
for the states of Madhya Pradesh, Maharashtra and Rajasthan while the
C2 cost works out to Rs.978, Rs.913 and Rs.1004 per quintal respectively.
The weighted average cost is Rs.709 and Rs.962 per quintal respectively on
cost A2+FL and C2 basis. The projected costs for sunflower for 2005-06 for
states of Andhra Pradesh, Karnataka and Maharashtra are placed at Rs.1918,
Rs.1609 and Rs.1797 per quintal on C2 basis. The weighted average cost on
A2+FL and C2 basis work out to Rs.1343 and Rs.1754 per quintal
respectively. For sesamum, the average projected A2+FL costs are Rs.1413,
Rs.1164, Rs1585, Rs.1399, Rs.1440 and Rs.1525 per quintal and the
corresponding C2 costs work out to Rs.1844, Rs.1705, Rs.2283, Rs.2391,
Rs.2417 and Rs.2314 per quintal for the states for Gujarat, Madhya Pradesh,
Orissa, Rajasthan, Tamil Nadu and Uttar Pradesh respectively with the
weighted average A2+FL and C2 cost at Rs.1402 and Rs.2055 per quintal
respectively. The C2 cost of production of nigerseed in respect of Orissa has
been projected to an average of Rs.1255 per quintal.
[Table
3(G)]
3.22 As against the estimated costs provided under CS, the estimates
provided by the state governments of Gujarat and Maharashtra for the year
2002-03 are observed to be lower for groundnut. In the case of soyabean, the
cost estimates given by the states of Madhya Pradesh and Maharashtra for
2002-03 are much lower than the corresponding CS estimates. In the case of
sesamum, the cost estimates given by Gujarat and Madhya Pradesh are
lower than the corresponding CS estimates for 2002-03. The projected cost
provided by Maharashtra for soyabean, after adjustment is higher as
compared to CACP’s projection mainly due to higher yield considered under
CS. The projected cost provided by Uttaranchal for soyabean is Rs.1471 per
quintal, which after adjustment works out to Rs. 1040 per quintal. Projection
for the year 2005-06 received for sunflower in respect of Maharashtra is Rs.
2352 per quintal which after adjustment works out to Rs. 1798 per quintal.

This is same as that projected by the Commission for the crop in the
state.
[Tables 3(H) &
3(I)]
VFC Tobacco
3.23 The latest estimates of cost of cultivation/production for VFC tobacco
have been made available by the DES which pertains to Andhra Pradesh for
the year 2002-03. Karnataka, the only other important VFC tobacco producing
state, is not covered under the C.S. The data presented in Table 3(F) show
that between 2001-02 and 2002-03 the C2 cost of cultivation has increased.
The cost of production of tobacco in respect of Andhra Pradesh has been
projected to an average of Rs.2998 and Rs. 3797 per quintal on cost A2+FL
and C2 basis,
respectively. [Table
3(G)]
Terms of Trade
3.24 Inter-sectoral terms of trade play an important role in the determination
of minimum support prices. The Commission has expressed its concern from
time to time, about deteriorating agricultural terms of trade over time. The
index of Terms of Trade (ITT) with base TE 1990-91 (TE 1990-91 = 100)
deteriorated from 106.6 in 1994-95 to 102.7 in 1999-2000 and 100.9 in 2000-
01. The ITT marginally recovered to 102.6 in 2001-02 and 103.6 in 2002-03,
but slided again to 102.5 in 2003-04. The index of Intermediate Consumption
alone has risen to 259.1 as against the index of 254.9 for prices received by
the farmers in 2003-04. In fact, deteriorating terms of trade, in conjunction
with declining trend in farm profitability do not augur well for accelerated
agricultural growth. Therefore, Government should pay due attention to
rationalization of input-output price structure and make conscious efforts to
reverse the existing trend of deteriorating terms of trade.
Inter-crop price parity
3.25 Prices provide incentive to farmers to make investments, adopt newer
technology and take farming decisions. This aspect assumes greater
significance in the context of recent policy initiative for diversification of
agriculture, which will necessitate reallocation of resources from one crop to

another with appropriate policy measures, including price policy. Therefore, it
has been the endeavour of the price policy formulated by the Commission to
analyse inter-crop price parity which is basically a measure of relative prices of
competing crops and give appropriate price signal for accelerated and
diversified agricultural growth.
3.26 Amongst the several methods to track the movement of relative prices,
one is to calculate the percentage change in MSP over two points of time and
compare such changes across different crops. An alternative way is to compare
real MSPs (MSP deflated by All Commodities WPI) over time and across crops.
Since MSPs are not what the farmers usually receive, it is also desirable to look
at the movement of real prices of crops as determined in the market (WPI of a
commodity deflated by All Commodities WPI). This comparison is made more
meaningful by examining the MSPs in conjunction with productivity of each
crop. The Commission has tried to look at price parity from different angles as
mentioned above. The broad findings are as
below. (Annexures II, III & IV)
3.27 The MSPs of paddy, wheat, coarse cereals, and cotton have increased
by 173, 193, 186 and 172 percent respectively between 1990-91 and 2004-
05. For pulses, the increase ranged from 190 to 230 percent and that for
oilseeds from 123 percent (sunflower seeds) to 178 percent (rapeseed/mustard)
in the corresponding period. As compared to the position obtained in the period
covering the decade of nineties (1990-91 to 1999-2000), inter-crop price parity
based on MSP is now much more balanced. The imbalance against coarse
cereals and pulses has been reversed although the imbalance favouring wheat
and disfavouring certain oilseeds such as groundnut, soyabean and sunflower
still persists.
3.28 Between 1990-91 and 2004-05, real MSPs of paddy, wheat, coarse
cereals, pulses, oilseeds and cotton have on average increased by about 14,
21, 24, 26, 8 and 18 percent respectively. Thus, barring oilseeds, all other crops
have witnessed significant increases in their real MSPs. It is noteworthy to
compare this increase of real MSP with the increase in the decade of nineties
(1990-91 to 1999-2000), the corresponding escalations were 26, 34, 21, 18, 1
and 27 percent. It is evident that price policy in the recent years has resulted
into more harmonious increase in real prices. Even in case of oilseeds, there
has been significant improvement in the rate of increase in the real prices. The
percentage change in the real MSP of some of the oilseeds such has rapeseed/
mustard and safflower were negative for the period 1990-91 to 1999-2000 which
have become positive for the period 1990-91 to 2004-05. However, it needs to
be noted that due to persistent large yield differentials, absolute levels of gross
revenues continue to be much higher in the case of paddy and wheat as
compared to several oilseeds and pulses. This underlines the fact that, in the
absence of any breakthrough in yield raising technologies, there is a limit
beyond which MSP cannot be of much help in raising the attractiveness of
pulses, oilseeds and coarse cereals vis-à-vis paddy/wheat rotation.


Table 3(A): Cost Estimates for Paddy
Paddy Rupees
States Year A2+FL C2 A2+FL C2 C3 Yield Implicit MSP MP BP GV MP/GV A2FL/QTL A2 FL A2+FL
/Hect /Hect /Qtl. /Qtl. /Qtl. (Qtl.)/Hect.. Price(Qtl.) /Qtl.
Andhra Pradesh 2002-03 18829.37 29311.08 349.86 543.71 602.39 49.70 607.74 530(C) 30204.90 2503.96 32708.86 0.923447 15790.13 3039.24
2001-02 18190.80 27043.45 364.30 538.35 595.42 46.67 544.42 530(C)
Assam 2002-03 9529.55 13106.89 367.47 504.89 555.38 24.57 474.34 530(C) 11654.62 646.47 12301.09 0.947446 5350.08 4179.47
2001-02 10006.90 13444.19 368.69 495.29 544.82 25.65 471.13 530(C)
Bihar 2002-03 9122.33 13231.03 332.61 484.08 534.95 22.91 434.10 530(C) 9945.34 1960.79 11906.13 0.835313 7272.74 1849.59
2001-02 7906.35 12304.27 276.52 430.33 473.37 24.56 399.67 530(C)
Chattisgarh 2002-03 7909.85 11931.78 363.49 547.71 653.77 19.29 538.22 530(C) 10382.31 1330.02 11712.33 0.886443 5770.89 2138.96
Haryana 2002-03 20046.14 29429.62 465.74 682.86 751.15 42.07 720.68 530(C) 30319.06 700.33 31019.39 0.977423 16222.10 3824.04
2001-02 15061.80 23422.17 383.41 596.03 613.87 38.71 714.38 530(C)
Jharkhand 2002-03 9552.09 13364.43 381.54 533.95 587.77 21.71 381.87 530(C) 8290.37 1270.05 9560.42 0.867155 5962.72 3589.37
Karnataka 2002-03 22563.74 31128.03 445.15 603.57 664.66 45.73 711.97 530(C) 32558.19 3529.59 36087.78 0.902194 19141.68 3422.06
2001-02 20406.97 27563.44 451.30 590.41 649.45 40.20 652.69 530(C)
Kerala 2002-03 20585.86 26198.32 499.62 630.19 693.21 34.51 671.11 530(C) 23159.84 4491.87 27651.71 0.837555 18945.57 1640.29
2001-02 19211.50 24338.38 475.05 597.91 657.70 34.17 637.72 530(C)
Madhya Pradesh 2002-03 7908.59 10484.10 522.35 690.26 804.54 12.93 503.85 530(C)
2001-02 9318.85 13188.46 420.51 592.74 676.42 18.92 518.04 530(C)
Orissa 2002-03 12222.31 16447.23 401.19 539.53 608.02 25.52 427.57 530(C)
2001-02 12176.91 16803.45 314.09 433.05 476.36 31.89 423.75 530(C)
Punjab 2002-03 19782.49 29348.70 335.73 498.12 549.28 58.68 572.71 530(C) 33606.71 139.52 33746.23 0.995866 335.73 17452.58 2329.91 19782.49
2001-02 14379.72 23577.39 239.61 392.91 507.82 59.48 563.48 530(C)
Tamil Nadu 2002-03 21974.37 31656.12 426.66 615.10 682.30 45.67 681.44 530(C) 31121.35 3974.61 35095.96 0.886750 19235.91 2738.46
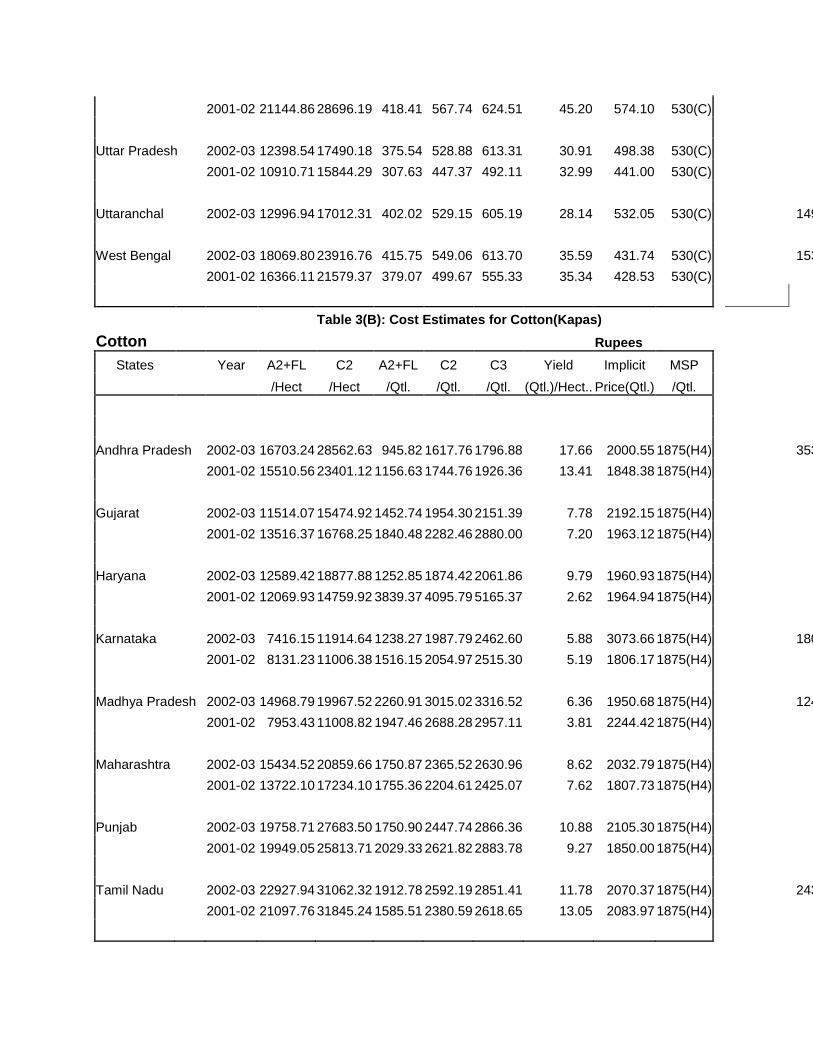
2001-02 21144.86 28696.19 418.41 567.74 624.51 45.20 574.10 530(C)
Uttar Pradesh 2002-03 12398.54 17490.18 375.54 528.88 613.31 30.91 498.38 530(C)
2001-02 10910.71 15844.29 307.63 447.37 492.11 32.99 441.00 530(C)
Uttaranchal 2002-03 12996.94 17012.31 402.02 529.15 605.19 28.14 532.05 530(C) 14971.83 2228.67 17200.50 0.870430 7730.50 5266.44 12996.94
West Bengal 2002-03 18069.80 23916.76 415.75 549.06 613.70 35.59 431.74 530(C) 15365.69 3399.10 18764.79 0.818858 13027.96 5041.84
2001-02 16366.11 21579.37 379.07 499.67 555.33 35.34 428.53 530(C)
Table 3(B): Cost Estimates for Cotton(Kapas)
Cotton Rupees
States Year A2+FL C2 A2+FL C2 C3 Yield Implicit MSP
/Hect /Hect /Qtl. /Qtl. /Qtl. (Qtl.)/Hect.. Price(Qtl.) /Qtl.
Andhra Pradesh 2002-03 16703.24 28562.63 945.82 1617.76 1796.88 17.66 2000.55 1875(H4) 35329.71 0.00 35329.71 1.000000 14511.28 2191.96
2001-02 15510.56 23401.12 1156.63 1744.76 1926.36 13.41 1848.38 1875(H4)
Gujarat 2002-03 11514.07 15474.92 1452.74 1954.30 2151.39 7.78 2192.15 1875(H4)
2001-02 13516.37 16768.25 1840.48 2282.46 2880.00 7.20 1963.12 1875(H4)
Haryana 2002-03 12589.42 18877.88 1252.85 1874.42 2061.86 9.79 1960.93 1875(H4)
2001-02 12069.93 14759.92 3839.37 4095.79 5165.37 2.62 1964.94 1875(H4)
Karnataka 2002-03 7416.15 11914.64 1238.27 1987.79 2462.60 5.88 3073.66 1875(H4) 18073.10 335.35 18408.45 0.981783 6262.36 1153.79
2001-02 8131.23 11006.38 1516.15 2054.97 2515.30 5.19 1806.17 1875(H4)
Madhya Pradesh 2002-03 14968.79 19967.52 2260.91 3015.02 3316.52 6.36 1950.68 1875(H4) 12406.30 508.54 12914.84 0.960624 10904.38 4064.41
2001-02 7953.43 11008.82 1947.46 2688.28 2957.11 3.81 2244.42 1875(H4)
Maharashtra 2002-03 15434.52 20859.66 1750.87 2365.52 2630.96 8.62 2032.79 1875(H4)
2001-02 13722.10 17234.10 1755.36 2204.61 2425.07 7.62 1807.73 1875(H4)
Punjab 2002-03 19758.71 27683.50 1750.90 2447.74 2866.36 10.88 2105.30 1875(H4)
2001-02 19949.05 25813.71 2029.33 2621.82 2883.78 9.27 1850.00 1875(H4)
Tamil Nadu 2002-03 22927.94 31062.32 1912.78 2592.19 2851.41 11.78 2070.37 1875(H4) 24388.96 428.01 24816.97 0.982753 15277.04 7650.90
2001-02 21097.76 31845.24 1585.51 2380.59 2618.65 13.05 2083.97 1875(H4)

- 83 -
Table 3(C): Cost Estimates for Coarse Cereals
Jowar
Rupees
States Year A2+FL C2 A2+FL C2 C3 Yield Implicit MSP
/Hect /Hect /Qtl. /Qtl. /Qtl. (Qtl.)/Hect.. Price(Qtl.) /Qtl.
Andhra Pradesh 2002-03 7026.12 10339.07 575.99 844.70 930.04 10.40 663.03 485.00
2001-02 9184.79 12486.22 708.98 935.77 1031.20 11.43 547.28 485.00
Karnataka 2002-03 4917.68 6512.92 638.14 845.34 987.89 6.46 636.57 485.00 4112.26 793.37 4905.63 0.838274 4127.78 789.90
2001-02 5570.84 7297.99 626.42 819.60 958.89 7.48 603.26 485.00
Madhya Pradesh 2002-03 5634.60 7801.23 519.05 718.68 790.55 8.14 583.73 485.00
2001-02 5488.92 7467.59 548.29 744.28 818.71 7.87 545.42 485.00
Maharashtra 2002-03 8142.56 11700.79 361.58 528.57 582.24 14.43 571.43 485.00 8245.76 4622.64 12868.40 0.640776 7133.11 1009.45
2001-02 10379.70 13225.02 490.89 629.08 691.99 12.67 491.19 485.00
Tamil Nadu 2002-03 9100.89 14054.35 520.40 797.58 877.34 10.29 659.21 485.00 6783.31 4745.26 11528.57 0.588391 7325.37 1775.52
2001-02 7784.02 12752.01 310.01 503.38 553.72 14.52 573.78 485.00
Bajra
Gujarat 2002-03 10542.12 12954.39 484.71 590.06 649.07 15.67 568.54 485.00
2001-02 7984.10 10149.56 303.75 387.96 509.89 17.90 443.29 485.00
Haryana 2002-03 8409.46 11659.89 566.85 777.78 855.56 10.48 599.52 485.00
2001-02 7315.20 10043.75 344.00 472.77 520.05 15.74 295.43 485.00
Maharashtra 2002-03 11599.85 14577.21 490.67 616.57 678.23 18.32 538.48 485.00 9865.01 2865.31 12730.32 0.774922 9942.74 1657.11
2001-02 10087.27 12080.39 531.14 635.70 699.27 14.10 432.13 485.00
Uttar Pradesh 2002-03 7018.02 10708.95 439.73 662.35 728.59 12.09 518.91 485.00 6273.59 2008.09 8281.68 0.757526 4054.12 2963.90
2001-02 6439.60 9218.35 310.52 446.95 491.65 15.98 326.82 485.00

Maize
Andhra Pradesh 2002-03 11456.96 17228.33 394.29 591.97 651.17 26.77 495.88 485.00
2001-02 8086.06 11983.11 320.07 470.32 518.54 22.73 462.21 485.00
Himachal Pradesh 2002-03 7373.77 10912.31 373.95 551.00 609.25 14.03 535.90 485.00 7518.65 3048.54 10567.19 0.71 373.95
2001-02 6554.61 9329.25 373.88 530.81 585.96 12.79 486.33 485.00
Jharkhand 2002-03 7806.20 11225.34 469.98 674.95 742.45 15.40 561.44 485.00 8646.16 679.23 9325.39 0.927163 3589.86 4216.34
Karnataka 2002-03 8004.43 11267.81 405.19 573.70 667.21 17.57 562.61 485.00 9885.07 1229.23 11114.30 0.889401 7004.73 999.70
2001-02 9929.87 13484.35 390.57 530.81 628.17 22.83 488.65 485.00
Madhya Pradesh 2002-03 5425.52 7357.29 598.97 818.63 916.42 7.49 588.38 485.00 4406.95 922.65 5329.60 0.826882 3711.69 1713.83
2001-02 5297.96 6933.62 499.44 658.76 735.75 8.22 484.48 485.00 3982.39 1156.84 5139.23 0.774900 3404.08 1893.88
Rajasthan 2002-03 9766.16 13795.56 468.65 673.04 743.34 11.19 585.89 485.00
2001-02 11055.34 13300.99 558.81 671.27 738.40 13.56 443.79 485.00
Uttar Pradesh 2002-03 8276.05 11108.97 870.06 1170.29 1287.32 8.19 684.30 485.00 5604.40 904.64 6509.04 0.861018 3006.18 5269.87
2001-02 8573.33 11239.72 476.58 622.83 685.11 16.57 424.92 485.00
Uttaranchal 2002-03 10361.44 13714.44 665.42 868.85 955.74 13.39 451.68 485.00 6048.00 985.24 7033.24 0.859917 3295.89 7065.55
Ragi
Karnataka 2002-03 7035.33 9417.69 513.02 703.08 778.15 9.42 530.85 485.00 5000.63 2279.30 7279.93 0.686906 5278.82 1756.51
2001-02 10559.07 13125.17 522.86 640.42 704.46 16.02 390.53 485.00
Tamil Nadu 2002-03 11301.24 16018.15 1203.02 1687.91 1856.70 8.77 893.77 485.00 7838.38 557.74 8396.12 0.933572 8118.79 3182.45
2001-02 11819.66 19471.02 556.74 918.51 1010.36 18.89 626.44 485.00
- 84 -
Table 3(D): Cost Estimates for Pulses
Tur (Arhar)
Rupees
States Year A2+FL C2 A2+FL C2 C3 Yield Implicit MSP
/Hect /Hect /Qtl. /Qtl. /Qtl. (Qtl.)/Hect.. Price(Qtl.) /Qtl.

Andhra Pradesh 2002-03 8007.23 15378.22 737.89 1407.89 1581.88 10.56 1656.12 1320.00 17488.58 482.74 17971.32 0.973138 6624.44 1382.79
2001-02 8472.98 12768.15 1148.94 1748.76 1975.68 6.95 1558.73 1320.00
Chattisgarh 2002-03 4495.08 6608.69 1355.02 1992.93 2478.45 2.80 1470.74 1320.00 4118.07 760.89 4878.96 0.844047 2589.87 1905.21
Gujarat 2002-03 9450.61 13450.42 1112.81 1555.46 1791.74 7.76 1853.36 1320.00 14382.11 1357.66 15739.77 0.91 1112.81 6965.70 2484.91 9450.61
2001-02 7113.98 11319.32 736.99 1152.74 1670.38 8.77 1665.83 1320.00
Karnataka 2002-03 7186.51 9893.31 1257.16 1727.38 1988.93 5.60 1771.94 1320.00 9922.88 206.34 10129.22 0.979629 6281.50 905.01
2001-02 5814.79 8458.44 1350.69 1954.33 2253.36 4.19 1983.95 1320.00
Madhya Pradesh 2002-03 6800.08 9802.93 1306.88 1888.55 2138.72 4.63 1674.69 1320.00 7753.80 960.12 8713.92 0.889818 4468.96 2331.12
2001-02 6062.10 10020.39 626.97 1039.60 1157.95 9.03 1420.69 1320.00
Maharashtra 2002-03 8290.31 12491.63 770.27 1156.94 1276.80 9.94 1454.10 1320.00 14453.80 1196.49 15650.29 0.92 770.27 7097.39 1192.92 8290.31
2001-02 7263.02 11264.97 697.99 1100.05 1210.06 9.29 1470.16 1320.00
Orissa 2002-03 4408.09 6762.97 1133.53 1736.77 2024.22 3.71 1527.78 1320.00 5668.07 273.19 5941.26 0.954018 3054.96 1353.13
2001-02 3806.58 6146.85 701.94 1134.70 1292.90 5.08 1357.89 1320.00
Uttar Pradesh 2002-03 5014.56 11264.64 617.51 1376.88 1562.53 6.98 1653.36 1320.00
2001-02 6181.84 11979.83 540.39 1048.87 1153.76 10.17 1422.63 1320.00
Moong
Andhra Pradesh 2002-03 6189.80 9835.10 1237.34 1969.59 2195.55 4.88 2188.69 1330.00
2001-02 7815.64 11078.35 1349.81 1914.21 2213.12 5.58 1463.36 1320.00
Maharashtra 2002-03 5516.22 7384.69 1426.81 1910.57 2140.13 3.82 1539.68 1330.00
2001-02 7774.07 9724.82 1352.78 1689.93 1858.92 5.57 1672.35 1320.00
Orissa 2002-03 4670.74 6413.00 1765.15 2420.30 2755.26 2.53 1894.81 1330.00 4793.86 219.95 5013.81 0.96 1765.15 3233.37 1437.37 4670.74
2001-02 4268.60 6051.57 1349.83 1913.93 2105.32 3.03 1966.97 1320.00
Rajasthan 2002-03 3933.24 5949.56 2832.30 4191.88 4721.84 0.94 2593.85 1330.00
2001-02 4628.91 5942.78 1339.35 1703.93 1897.05 3.02 1744.56 1320.00
Urad

Andhra Pradesh 2002-03 5118.82 8796.37 575.63 988.90 1093.83 8.84 1386.54 1330.00 12256.97 72.76 12329.73 0.994099 4651.54 467.28
2001-02 5244.91 9398.31 702.12 1257.66 1383.43 7.37 1721.66 1320.00
Chattisgarh 2002-03 3771.25 5158.61 1743.95 2400.90 2920.53 1.96 1451.32 1330.00 2844.58 293.86 3138.44 0.906367 2204.55 1566.70
Madhya Pradesh 2002-03 4913.09 6940.80 1498.72 2110.21 2321.23 3.16 1612.06 1330.00
Maharashtra 2002-03 6943.28 9313.73 1162.61 1560.76 1748.14 5.93 1290.44 1330.00
2001-02 7343.66 9491.92 1472.42 1899.31 2089.24 4.95 2082.58 1320.00
Orissa 2002-03 4965.13 6878.84 1230.78 1703.88 1958.62 3.77 1503.66 1330.00
2001-02 3986.58 6388.39 821.13 1316.10 1447.71 4.51 1593.91 1320.00
Rajasthan 2002-03 5476.53 7076.20 2163.38 2842.40 3301.16 1.91 2231.82 1330.00
2001-02 6122.65 8459.34 1663.57 2257.59 2529.73 3.23 2143.55 1320.00
Tamil Nadu 2002-03 7951.40 14242.82 1335.21 2391.74 2630.91 5.86 1682.23 1330.00 9857.89 160.10 10017.99 0.984019 6201.08 1750.32
2001-02 5602.24 7508.63 1393.49 1865.91 2052.50 3.96 2061.37 1320.00
Uttar Pradesh 2002-03 3880.44 6193.17 1075.52 1715.18 1912.14 3.47 1743.10 1330.00
2001-02 4817.15 8066.90 638.06 1068.97 1175.87 7.30 1774.90 1320.00
- 85 -
Table 3(E): Cost Estimates for Oilseeds
Rupees
States Year A2+FL C2 A2+FL C2 C3 Yield Implicit MSP
/Hect /Hect /Qtl. /Qtl. /Qtl. (Qtl.)/Hect.. Price(Qtl.) /Qtl.
Groundnut
Andhra Pradesh 2002-03 9984.30 13828.16 1302.10 1797.67 1977.44 7.11 1564.96 1355.00
2001-02 11115.92 14841.84 1261.14 1674.88 1842.58 8.09 1245.07 1340.00

Gujarat 2002-03 12176.10 15989.87 1143.13 1501.62 1651.78 8.75 1657.03 1355.00
2001-02 11316.96 15974.20 559.21 789.14 914.28 16.67 1227.58 1340.00
Karnataka 2002-03 8943.83 12272.45 1467.10 2006.34 2396.04 5.82 1970.20 1355.00 11466.58 544.27 12010.85 0.954685 8153.07 790.76
2001-02 6753.28 8765.53 1143.83 1483.79 1846.12 5.56 1107.48 1340.00
Maharashtra 2002-03 15845.59 19649.23 1625.22 2013.15 2214.47 8.95 1541.12 1355.00 13793.00 1232.56 15025.56 0.917969 12980.68 2864.91
2001-02 19252.70 23627.72 1257.22 1544.42 1722.95 14.19 1347.42 1340.00
Tamil Nadu 2002-03 22785.63 32509.90 1239.23 1764.58 1941.04 17.45 1325.52 1355.00 23130.32 1241.90 24372.22 0.949044 18883.89 3901.74
2001-02 15626.02 21463.14 1162.35 1592.37 1751.61 12.81 1089.09 1340.00
Soyabean
Chhattisgarh 2002-03 6707.89 9130.91 857.16 1166.22 1386.45 6.85 1013.02 885(Y) 6939.19 988.42 7927.61 0.875319 5101.82 1606.07
Madhya Pradesh 2002-03 7320.42 10551.17 1066.10 1537.06 1693.14 6.50 1266.04 885(Y)
2001-02 6942.25 10457.60 573.77 861.79 947.97 11.27 929.00 885(Y)
Maharashtra 2002-03 9938.15 13588.82 746.66 1023.51 1137.73 12.99 1078.68 885(Y) 14012.00 345.38 14357.38 0.975944 9124.76 813.39
2001-02 10584.29 13864.22 632.72 832.19 915.41 15.98 945.47 885(Y)
Rajasthan 2002-03 7354.64 9792.52 1142.99 1505.51 1672.81 5.65 1228.54 885(Y) 6941.27 963.87 7905.14 0.88 1142.99 7354.64
2001-02 6768.20 8355.86 748.11 908.01 1033.11 8.11 950.90 885(Y)
Sunflower
Andhra Pradesh 2002-03 12277.66 16693.50 1629.58 2215.94 2437.53 7.46 1699.69 1195.00
2001-02 12550.13 16895.56 1260.57 1696.65 1866.32 9.92 1322.09 1185.00
Karnataka 2002-03 6225.17 8739.10 1236.81 1734.88 2052.67 4.98 1692.18 1195.00 8427.07 90.13 8517.20 0.989418 5472.68 752.49
2001-02 5343.53 7752.27 890.19 1290.50 1496.23 5.97 1408.00 1185.00
Maharashtra 2002-03 11924.53 15037.54 1174.72 1481.23 1629.35 10.15 1413.31 1195.00 14345.05 1.41 14346.46 0.999902 10647.83 1276.70
2001-02 6526.76 7624.72 1990.17 2336.11 2569.72 3.22 1544.17 1185.00
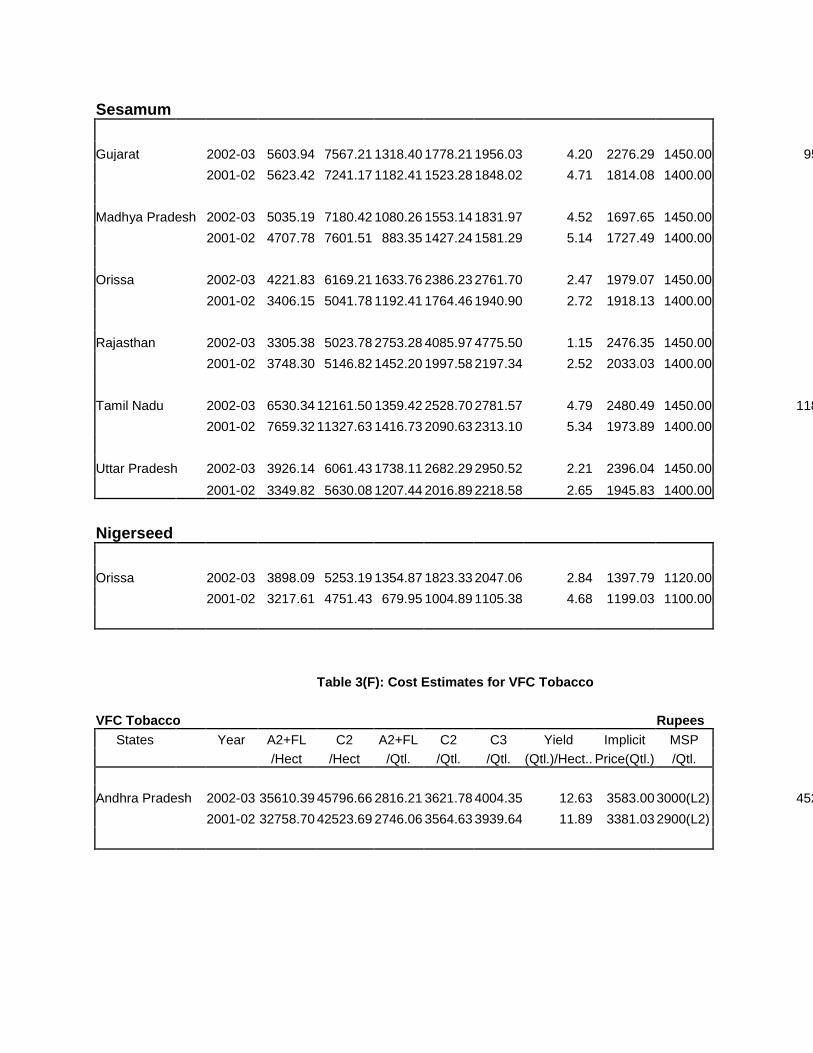
Sesamum
Gujarat 2002-03 5603.94 7567.21 1318.40 1778.21 1956.03 4.20 2276.29 1450.00 9560.42 115.12 9675.54 0.988102 3845.14 1758.80
2001-02 5623.42 7241.17 1182.41 1523.28 1848.02 4.71 1814.08 1400.00
Madhya Pradesh 2002-03 5035.19 7180.42 1080.26 1553.14 1831.97 4.52 1697.65 1450.00
2001-02 4707.78 7601.51 883.35 1427.24 1581.29 5.14 1727.49 1400.00
Orissa 2002-03 4221.83 6169.21 1633.76 2386.23 2761.70 2.47 1979.07 1450.00
2001-02 3406.15 5041.78 1192.41 1764.46 1940.90 2.72 1918.13 1400.00
Rajasthan 2002-03 3305.38 5023.78 2753.28 4085.97 4775.50 1.15 2476.35 1450.00
2001-02 3748.30 5146.82 1452.20 1997.58 2197.34 2.52 2033.03 1400.00
Tamil Nadu 2002-03 6530.34 12161.50 1359.42 2528.70 2781.57 4.79 2480.49 1450.00 11881.53 34.19 11915.72 0.997131 5394.69 1135.65
2001-02 7659.32 11327.63 1416.73 2090.63 2313.10 5.34 1973.89 1400.00
Uttar Pradesh 2002-03 3926.14 6061.43 1738.11 2682.29 2950.52 2.21 2396.04 1450.00
2001-02 3349.82 5630.08 1207.44 2016.89 2218.58 2.65 1945.83 1400.00
Nigerseed
Orissa 2002-03 3898.09 5253.19 1354.87 1823.33 2047.06 2.84 1397.79 1120.00
2001-02 3217.61 4751.43 679.95 1004.89 1105.38 4.68 1199.03 1100.00
Table 3(F): Cost Estimates for VFC Tobacco
VFC Tobacco Rupees
States Year A2+FL C2 A2+FL C2 C3 Yield Implicit MSP
/Hect /Hect /Qtl. /Qtl. /Qtl. (Qtl.)/Hect.. Price(Qtl.) /Qtl.
Andhra Pradesh 2002-03 35610.39 45796.66 2816.21 3621.78 4004.35 12.63 3583.00 3000(L2) 45253.34 52.99 45306.33 0.998830 35265.14 345.25 35610.39
2001-02 32758.70 42523.69 2746.06 3564.63 3939.64 11.89 3381.03 2900(L2)