Multifunctional Plant Virus Nanoparticles for Targeting Breast ...
DBi
Ja
b
a
ARRA
KMSOPELH
1
aonift
1d
Europ. J. Agronomy 32 (2010) 112–119
Contents lists available at ScienceDirect
European Journal of Agronomy
journa l homepage: www.e lsev ier .com/ locate /e ja
esigning a hedgerow network in a multifunctional agricultural landscape:alancing trade-offs among ecological quality, landscape character and
mplementation costs
eroen C.J. Groot a,∗, André Jellema a,b, Walter A.H. Rossing a
Biological Farming Systems Group, Wageningen University, P.O. Box 563, 6700 AN Wageningen, The NetherlandsAlterra Green World Research, Wageningen University and Research Centre, P.O. Box 47, 6700 AA Wageningen, The Netherlands
r t i c l e i n f o
rticle history:eceived 8 July 2008eceived in revised form 27 May 2009ccepted 6 July 2009
eywords:ultifunctional agriculture
patial planningptimizationareto optimalitycological networkandscape characteredgerow
a b s t r a c t
Spatial planning aimed at multifunctional agriculture can be seen as a negotiation process on environ-mental, social and economic aspects of land use. Complexity arises due to the high number of stakeholdersand due to the limited knowledge, which is often organized along disciplinary divides. This paper setsout from the premise that the role of agronomy in such land use planning processes can be strength-ened by approaches that allow multi-objective and multi-scale evaluation of spatially explicit land usealternatives. We present an application of the explorative Landscape IMAGES framework, which employsthe Differential Evolution optimization strategy and the concepts of Pareto optimality that are relativelyeasy to implement and to combine with spatially explicit indicator assessments. This technique yieldsa set of solutions, each representing a spatial configuration of hedgerows in a landscape along with theperformance of the landscape in terms of Pareto rank and efficiency. The methodology was applied ina redesign of the structure of linear landscape elements in an agri-ecological zone in The Netherlandswhere 7 indicators representing ecological quality, landscape character and implementation costs wereconsidered. The case study was developed in interaction with an NGO involved in landscape managementplanning and implementation.
Spatial cohesion in the landscape was found to increase with larger total hedgerow length, but could alsobe improved without increasing the total length (and therefore costs of establishment and maintenance).Trade-offs existed with other objectives, since this change would involve replacing hedgerows currently
positioned in the longitudinal direction (L) of the fields by hedgerows in the transversal direction (T).This change would compromise cultural heritage value as expressed in the L/T ratio, and it would requireremoval of mature hedgerows in some places and adding of new hedgerows elsewhere in the landscape,thereby increasing implementation costs.The approach was evaluated positively in terms of design validity, output validity and end-user validity.The role of the Landscape IMAGES framework in setting a research agenda to enhance the role of agronomy
se pla
in multifunctional land u. Introduction
Diversification of farming systems as an answer to the sustain-bility problems in agriculture and to the increasing urbanizationf Europe has given rise to new economic on-farm activities such as
ature conservation, agro-tourism and maintenance of cultural her-tage values (Vos and Meekes, 1999; O’Conner et al., 2006). Differentrom the traditional agricultural activities of food and fibre produc-ion these activities can not be managed at a farm or field scale
∗ Corresponding author.E-mail address: [email protected] (J.C.J. Groot).
161-0301/$ – see front matter © 2009 Elsevier B.V. All rights reserved.oi:10.1016/j.eja.2009.07.002
nning is discussed.© 2009 Elsevier B.V. All rights reserved.
alone, but also require to be managed at a regional scale (Gottfriedet al., 1996; Cumming et al., 2006). To realize the potential of thesenew economic activities farmers increasingly need to interact withother stakeholders in the region as part of regional planning pro-cesses (Holloway et al., 2006; Franks and Mc Gloin, 2007). Thishas consequences for agronomic research which thus far has hadonly limited attention for the regional scale (e.g. Leenhardt et al.,2009).
Spatial planning of land-use and management activities aimed
at sustainable natural resource management may be seen as a com-plex negotiation process on environmental, economic and socialaspects of land-use. Complexity arises due to the high numberof stakeholders with often contrasting perspectives and divergentexpectations about future development of a region (Kangas et al.,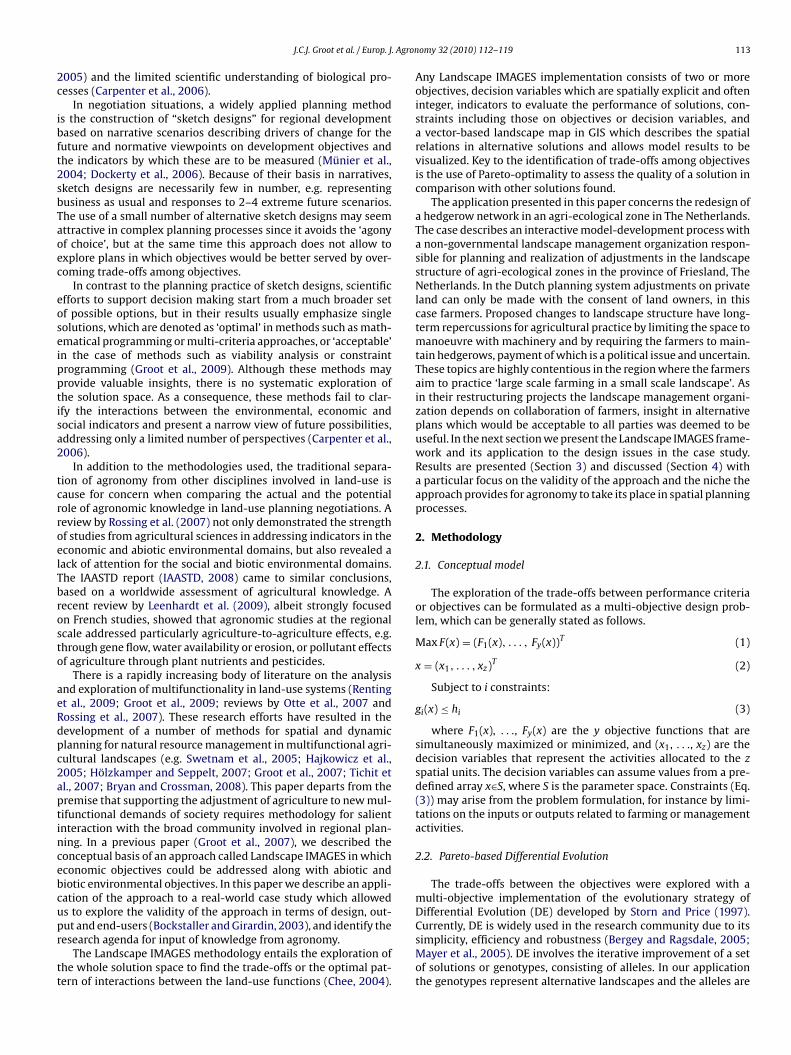
. Agron
2c
ibft2sbTaoec
eoseipptisa2
tcrroelTbrosto
aeRdpc2aptincebcupr
tt
J.C.J. Groot et al. / Europ. J
005) and the limited scientific understanding of biological pro-esses (Carpenter et al., 2006).
In negotiation situations, a widely applied planning methods the construction of “sketch designs” for regional developmentased on narrative scenarios describing drivers of change for theuture and normative viewpoints on development objectives andhe indicators by which these are to be measured (Münier et al.,004; Dockerty et al., 2006). Because of their basis in narratives,ketch designs are necessarily few in number, e.g. representingusiness as usual and responses to 2–4 extreme future scenarios.he use of a small number of alternative sketch designs may seemttractive in complex planning processes since it avoids the ‘agonyf choice’, but at the same time this approach does not allow toxplore plans in which objectives would be better served by over-oming trade-offs among objectives.
In contrast to the planning practice of sketch designs, scientificfforts to support decision making start from a much broader setf possible options, but in their results usually emphasize singleolutions, which are denoted as ‘optimal’ in methods such as math-matical programming or multi-criteria approaches, or ‘acceptable’n the case of methods such as viability analysis or constraintrogramming (Groot et al., 2009). Although these methods mayrovide valuable insights, there is no systematic exploration ofhe solution space. As a consequence, these methods fail to clar-fy the interactions between the environmental, economic andocial indicators and present a narrow view of future possibilities,ddressing only a limited number of perspectives (Carpenter et al.,006).
In addition to the methodologies used, the traditional separa-ion of agronomy from other disciplines involved in land-use isause for concern when comparing the actual and the potentialole of agronomic knowledge in land-use planning negotiations. Aeview by Rossing et al. (2007) not only demonstrated the strengthf studies from agricultural sciences in addressing indicators in theconomic and abiotic environmental domains, but also revealed aack of attention for the social and biotic environmental domains.he IAASTD report (IAASTD, 2008) came to similar conclusions,ased on a worldwide assessment of agricultural knowledge. Aecent review by Leenhardt et al. (2009), albeit strongly focusedn French studies, showed that agronomic studies at the regionalcale addressed particularly agriculture-to-agriculture effects, e.g.hrough gene flow, water availability or erosion, or pollutant effectsf agriculture through plant nutrients and pesticides.
There is a rapidly increasing body of literature on the analysisnd exploration of multifunctionality in land-use systems (Rentingt al., 2009; Groot et al., 2009; reviews by Otte et al., 2007 andossing et al., 2007). These research efforts have resulted in theevelopment of a number of methods for spatial and dynamiclanning for natural resource management in multifunctional agri-ultural landscapes (e.g. Swetnam et al., 2005; Hajkowicz et al.,005; Hölzkamper and Seppelt, 2007; Groot et al., 2007; Tichit etl., 2007; Bryan and Crossman, 2008). This paper departs from theremise that supporting the adjustment of agriculture to new mul-ifunctional demands of society requires methodology for salientnteraction with the broad community involved in regional plan-ing. In a previous paper (Groot et al., 2007), we described theonceptual basis of an approach called Landscape IMAGES in whichconomic objectives could be addressed along with abiotic andiotic environmental objectives. In this paper we describe an appli-ation of the approach to a real-world case study which alloweds to explore the validity of the approach in terms of design, out-
ut and end-users (Bockstaller and Girardin, 2003), and identify theesearch agenda for input of knowledge from agronomy.The Landscape IMAGES methodology entails the exploration ofhe whole solution space to find the trade-offs or the optimal pat-ern of interactions between the land-use functions (Chee, 2004).
omy 32 (2010) 112–119 113
Any Landscape IMAGES implementation consists of two or moreobjectives, decision variables which are spatially explicit and ofteninteger, indicators to evaluate the performance of solutions, con-straints including those on objectives or decision variables, anda vector-based landscape map in GIS which describes the spatialrelations in alternative solutions and allows model results to bevisualized. Key to the identification of trade-offs among objectivesis the use of Pareto-optimality to assess the quality of a solution incomparison with other solutions found.
The application presented in this paper concerns the redesign ofa hedgerow network in an agri-ecological zone in The Netherlands.The case describes an interactive model-development process witha non-governmental landscape management organization respon-sible for planning and realization of adjustments in the landscapestructure of agri-ecological zones in the province of Friesland, TheNetherlands. In the Dutch planning system adjustments on privateland can only be made with the consent of land owners, in thiscase farmers. Proposed changes to landscape structure have long-term repercussions for agricultural practice by limiting the space tomanoeuvre with machinery and by requiring the farmers to main-tain hedgerows, payment of which is a political issue and uncertain.These topics are highly contentious in the region where the farmersaim to practice ‘large scale farming in a small scale landscape’. Asin their restructuring projects the landscape management organi-zation depends on collaboration of farmers, insight in alternativeplans which would be acceptable to all parties was deemed to beuseful. In the next section we present the Landscape IMAGES frame-work and its application to the design issues in the case study.Results are presented (Section 3) and discussed (Section 4) witha particular focus on the validity of the approach and the niche theapproach provides for agronomy to take its place in spatial planningprocesses.
2. Methodology
2.1. Conceptual model
The exploration of the trade-offs between performance criteriaor objectives can be formulated as a multi-objective design prob-lem, which can be generally stated as follows.
Max F(x) = (F1(x), . . . , Fy(x))T (1)
x = (x1, . . . , xz)T (2)
Subject to i constraints:
gi(x) ≤ hi (3)
where F1(x), . . ., Fy(x) are the y objective functions that aresimultaneously maximized or minimized, and (x1, . . ., xz) are thedecision variables that represent the activities allocated to the zspatial units. The decision variables can assume values from a pre-defined array x∈S, where S is the parameter space. Constraints (Eq.(3)) may arise from the problem formulation, for instance by limi-tations on the inputs or outputs related to farming or managementactivities.
2.2. Pareto-based Differential Evolution
The trade-offs between the objectives were explored with amulti-objective implementation of the evolutionary strategy ofDifferential Evolution (DE) developed by Storn and Price (1997).
Currently, DE is widely used in the research community due to itssimplicity, efficiency and robustness (Bergey and Ragsdale, 2005;Mayer et al., 2005). DE involves the iterative improvement of a setof solutions or genotypes, consisting of alleles. In our applicationthe genotypes represent alternative landscapes and the alleles are
1 . Agronomy 32 (2010) 112–119
deta
p
wratoieodaap
p
edevsccab
p
grocnTGFat
famip
raibciTPrn
Fig. 1. Pareto optimality illustrated for a solution space of two objectives F1 and F2
that are maximized: symbol (� ) indicates solutions which are not dominated by
14 J.C.J. Groot et al. / Europ. J
ecision variables in which the occupation of the field borders wasncoded as a real number. A genotype is a multi-dimensional vec-or p = (p1, . . ., pz)T of z alleles. Each allele pi is initialized as pi,0 byssigning a random number within the allowed range:
i,0 = L(pi) + ri (U(pi) − L(pi)) (4)
here ri denotes a uniformly distributed random value within theange [0, 1] and L and U are the lower and upper values of thellowed range. A new generation t + 1 is created by applying muta-ion and selection operators on the individuals in the population Pf the current generation t. The first step of the reproduction process
s generation of a trial population P′ that contains a counterpart forach individual in P, produced by parameterized uniform crossoverf a target vector and a mutation vector. The mutation vector iserived from three mutually different competitors c1, c2 and c3 thatre randomly selected from the population P in the current gener-tion t. The allele values are taken from the mutation vector withrobability CR:
′i,t+1 =
{c3,i + F × (c1,i − c2,i) if ri < CR
pi,t otherwise(5)
where ri is a uniformly distributed random variable. The param-ter F∈[0, 2] is a parameter that controls the amplification ofifferential variations. After a mutation, the value of p′
i,t+1 canxtend outside of the allowed range of the search space. For allelealues that violate the boundary constraints the repair rule pre-ented in Eq. (6) is applied. This rule implements a mechanism thatan be denoted as ‘back folding’: the adjustment for the allele isalculated by interpolation into the allowed range from the bound-ry by a value that is proportional to the difference between theoundary and violation values:
′i,t+1 =
⎧⎪⎪⎨⎪⎪⎩
L(pi) −p′
i,t+1 − L(pi)
Fif p′
i,t+1 < L(pi)
U(pi) −p′
i,t+1 − U(pi)
Fif p′
i,t+1 > U(pi)
p′i,t+1 otherwise
(6)
A trial genotype p′t+1 replaces pt if it outperforms the parent
enotype. Here, better performance is interpreted as a better Paretoanking, a higher Pareto efficiency or located in a less crowded areaf the solution space than the parent genotype. These performanceriteria are explained below. Population size N is determined by theumber of alleles in the genotype z and a multiplication factor M.he last parameter in the DE algorithm is the number of generations, which serves as the stopping criterion. The parameter values for, CR, M and G as employed in this study were derived from factorialnalysis in preliminary optimization runs, where G was chosen suchhat the volume of the solution space no longer expanded.
The concept of Pareto optimality was used to assess the per-ormance of solutions, since it avoids the need of normalizationnd a priori weighing of objectives as is the case with commonulti-criteria methods. As such it fits very well the aim of support-
ng negotiation by providing insight in objectives without undue ariori restriction of the solution space.
The first criterion for the performance of a solution is its Paretoank as proposed by Goldberg (1989). Individuals in the populationre Pareto-optimal when they do not perform worse than any otherndividual for all the objectives, i.e. when they perform equal to oretter than any other individual in at least one objective. In suchase, there is no objective basis to discard the individual. These
ndividuals are called non-dominated and receive rank 1 (Fig. 1).his set of solutions is called the trade-off frontier. The next step inareto-ranking the entire population of solutions is to remove theank 1 individuals from the population and identify a new set ofon-dominated individuals, which is assigned rank 2. This processany other solutions: setting level f1 for objective function F1 as a minimum level,there will be no alternative solution in the dataset with a higher value for objectiveF2. The arrows indicate the selection pressure exerted by Pareto ranking (solid) andthe crowding metric (dashed).
is continued until all individuals in the population are assigned aPareto rank.
The probability of equal Pareto ranks increases when the numberof dimensions of the solution space increases, i.e. when the num-ber of objectives in the decision problem increases. This means thatthe number of solutions in the trade-off frontier increases, whichcauses the DE algorithm to progress more slowly towards bettersolutions. Das (1999) proposed to take Pareto efficiency as an addi-tional performance criterion in the case that two solutions havePareto rank 1. A solution is Pareto efficient of order k if it is notdominated by any other solution in each k-dimensional subset ofthe y-dimensional solution space (Das, 1999), where 1 ≤ k ≤ y and yis the number of objectives. Solutions with a low Pareto efficiencyvalue are considered better compromise solutions since they aredominated in fewer dimensions. The concept of Pareto efficiencycan be seen as an extension of the concept Pareto optimality.
If two solutions have the same rank and efficiency, a third selec-tion criterion, the crowding distance, is taken into account. Themetric � represents the within-rank solution density and is calcu-lated from the normalized distance from solution p to the nearestsolution in the search space, as follows (Deb et al., 2002):
� =k∑
j=1
|di − d||Bj|
(7)
where Bj is the range of objective j, which is calculated as thedifference between the minimum and maximum values of objec-tive j. Variable di denotes the Euclidian distance between genotypep and the nearest neighbouring solution within the Pareto front ofa given rank and the parameter d is the average of these distances.
An individual is replaced by a trial solution of the same rank andefficiency if the latter is located in a less densely populated partof the solution space. Pareto ranking exerts a pressure orthogonalto the surface of the trade-off frontier, whereas the crowding met-ric stimulates spread of solutions over the surface and within the
. Agron
sp
2
ndc(oonqtotttir‘azwmcoiodn
2
wsrattmti
2
sshcsiss
stTtacshe
J.C.J. Groot et al. / Europ. J
olution space (see arrows in Fig. 1). Together these metrics ensurerogress of the entire frontier to better solutions.
.3. Hedgerows in the Friesian Woodlands
The Friesian Woodlands are a unique agricultural area in theorth of The Netherlands consisting of a mosaic of fields bor-ered by hedgerows. The landscape of the Friesian Woodlands isomparable to the Bocage landscapes in Brittany and NormandyBaudry et al., 2001) and contains the densest hedgerow networksf The Netherlands (Dijkstra et al., 2003). The hedgerows wereriginally planted as cattle fence and property boundary, but areowadays highly valued for their ecological and cultural-historicalualities (De Boer, 2003). The prevailing land-use activity betweenhe hedgerows is dairy farming. On some farms a limited proportionf up to 5% of the area is used for forage maize production, whilehe rest of the area is occupied by permanent grassland. In this set-ing the Landscape IMAGES framework has been applied to supporthe development of an agro-ecological zone of 873 ha by evaluat-ng and generating alternatives for a sketch design produced by aegional, non-governmental landscape management organizationLandschapsbeheer Friesland’ (LBF) responsible for developmentnd implementation of landscape improvement projects in theone. A set of alternative landscape configurations was generatedith the Pareto-based Differential Evolution multi-objective opti-ization algorithm, in which each solution represented a different
onfiguration of hedgerows in the case study area. The results of theptimizations were compared with the performance of the ‘orig-
nal’ hedgerow configuration as encountered by LBF at the startf the planning project, and the implemented ‘sketch design’ aseveloped and implemented by the landscape management orga-ization.
.4. Objectives and indicators
Objectives and indicators for the Landscape IMAGES applicationere developed in an iterative process of model design, demon-
tration of consequences and redesign of the model between theesearchers and LBF, in which the representatives of LBF playedn active role in the formulation of objectives and indicators. Inhe course of three meetings a set of objectives and indicators ini-ially proposed by the researchers was adjusted and extended to
atch the interests of LBF. The final set included a total of 7 indica-ors describing ecological quality, landscape character, and costs ofmplementation and maintenance.
.4.1. Ecological qualitySpatial coherence of the hedgerow network was used as a mea-
ure for ecological quality. Depending on their mobility differentpecies will experience a different degree of clustering of hedgerowabitat in the network. The connectivity of landscapes can be cal-ulated from the relation between dispersal capacity (Dcap) of thepecies and the size of the largest interconnected cluster of habitatn the network (Urban and Keitt, 2001; Fall et al., 2007). In the casetudy the integral of this function (Fig. 2a) was used as measure ofpatial coherence and was maximized.
The relation between dispersal capacity and maximum clusterize can be calculated efficiently by determining critical distances inhe network structure using graph theory (Bondy and Murty, 1977).he critical distance is the smallest non-habitat distance betweenwo parts of the network that needs to be crossed in order to be
ble to connect these two parts. For species which are capable ofrossing such a critical distance a larger part of the network is acces-ible than for species which are not able to cross this distance. Theedgerow network can be described as a graph by representingach of the hedgerows as a point or node, and the possible connec-omy 32 (2010) 112–119 115
tions between the hedgerows as lines or edges. Each connectionbetween two hedgerows is weighted by the minimum distancebetween them. The critical distances in the network can now bedetermined by calculating a minimum spanning tree (Nesetril etal., 2001) or the minimum set of edges that connects all parts of thenetworks.
2.4.2. Landscape characterLandscape character is defined as the presence, variety and
arrangement of different landscape features, which gives a land-scape a specific identity and makes it stand out from otherlandscapes (Swanwick and Consultants, 2002). The patterns offields and hedgerows determine the appearance of the FriesianWoodlands and give a sense of place to the people inhabitingthe landscape (Renting and Van Der Ploeg, 2001; Stedman, 2003).Together with LBF the following indicators for variation, continu-ity and historical characteristics of the hedgerow patterns weredeveloped.
The hedgerows surrounding the fields divide the landscape intoelongated visual chambers, the length of which is denoted as sightline (Fig. 2b). Variation in sight lines contributes to the visual qual-ity of the landscape (De la Fuente de Val et al., 2006). Sight linehomogeneity, represented by the evenness of the frequency distri-bution of the length of visual chambers was used as an indicator,and was minimized.
In the hedgerow landscape of the Friesian Woodlands, a sightline from road to road (Fig. 2b) is undesirable and perceived as dis-turbing the pattern of the landscape. To optimize the continuity ofthe landscape the indicator porosity, expressed as number of con-tinuous sightlines from road to road, was defined and minimized.
Historically, the landscape has a high ratio of longitudi-nal hedgerows (L) over transversal hedgerows (T) relative tothe parcelling direction, resulting in elongated visual chambers(Anonymous, 2006). This characteristic was maintained by maxi-mizing the L/T ratio.
2.4.3. Implementation and maintenance costsRemoval, planting and maintenance of hedgerows were con-
sidered as separate objectives as each is associated with its ownecological, socio-cultural and agronomic considerations which arehighly relevant to farmers that invest labour in maintenance andthe financers of landscape development plans who would aim toreduce costs of restructuring.
Removal of existing hedgerows can disrupt the socio-culturalcharacteristics of the landscape expressed in particular patterning.Moreover, older hedgerows, some exceeding 100 years of age, repre-sent unique ecological habitats. And finally, removal of hedgerows iscostly. Here, the details of each of these consideration are not takeninto account, but as a general objective removal of hedgerows wasminimized.
Addition of new hedgerows is also costly and was minimized.From the perspective of some farmers aiming to develop large-
scale farming systems, the presence of hedgerows forms a barrier tomanoeuvre with machines and for the enlargement of fields. More-over, these farmers consider hedgerows as unwanted sinks of labourfor maintenance and related costs. To represent this perspective, thetotal hedgerow length in the landscape was minimized.
2.5. Implementation
The model was implemented in the Microsoft .NET Develop-
ment Environment. The landscape configuration data were directlyaccessed from ESRI shape files (Anonymous, 1998) with theShapeLib.dll (URL: http://www.shapelib.maptools.org/). The addi-tion of new linear landscape elements to the landscape and theremoval of landscape elements were determined by the DE algo-
116 J.C.J. Groot et al. / Europ. J. Agronomy 32 (2010) 112–119
F een tn f land
e Legen
re
3
ldsslhatfecreoMs
thvmthhfiptotwnot
fiiet
ig. 2. (a) Spatial coherence of the hedgerow network, defined as the relation betwetwork. The integral of this function was maximized. (b) Conceptual illustration o
longated visual chambers. Sightlines from road to road (porosity) are undesirable.
ithm. The generated solutions, each representing a landscape werevaluated for the 7 objectives described above.
. Results
The final solution set provided by the algorithm offered aarge range of Pareto-optimal landscape configurations. The 7-imensional objective space was visualized by projecting theolutions onto 2-dimensional surfaces (Fig. 3). Relations betweenome objectives were narrowly defined, e.g. between hedgerowength and spatial cohesion (Fig. 3a) or porosity and sight lineomogeneity (Fig. 3p). Apparently the other objectives did notffect the relation in a major way. Such relations indicate strongrade-offs or conflicts between the objectives, leaving limited roomor negotiation. At the other extreme, point clouds indicated thexistence of alternative Pareto-optimal solutions, e.g. for spatialohesion and L/T ratio (Fig. 3g) or for porosity and hedgerowsemoved (Fig. 3r). For each value of one objective several landscapesxisted that were Pareto-optimal, yet very different in terms of thether objective. Such relations provide more room for negotiation.ost relations in Fig. 3 fell between these extremes, combining
harply defined trade-offs with less clear relations.As an illustration of the interaction among the various indica-
ors, spatial cohesion was found to be positively related to totaledgerow length (Fig. 3a). Alternative solutions at a particularalue of total hedgerow length demonstrated that further improve-ents in spatial cohesion would be possible without increasing
otal hedgerow length (Fig. 3a) and therefore maintenance costs ofedgerows in the landscape. However, this would involve replacingedgerows currently positioned in the longitudinal direction of theelds by hedgerows in the transversal direction. As an additionalositive effect, such an adjustment would reduce the porosity ofhe landscape as desired (Fig. 3c), but clear trade-offs existed withther objectives, since the change would probably compromise cul-ural heritage value as expressed in the L/T ratio (Fig. 3b), and itould require removal of hedgerows in some places and addingew hedgerows elsewhere in the landscape (Fig. 3e and f). Theccurrence of these trade-offs implies that priorities need to be seto make further planning decisions.
We projected the performance of the ‘original’ landscape con-guration (yellow square) and LBFs’ ‘sketch design’ (yellow circle)
n the plots describing the solution space (Fig. 3). The decision rulesmployed by LBF to create the sketch design positively affected spa-ial cohesion (Fig. 3a) at the cost of adding about 5 km hedgerow
he dispersal capacity (Dcap) and the largest interconnected cluster of habitat in thescape pattern of the Friesian Woodlands. The hedgerows divide the landscape into
d: ( ) road ( ) hedgerow, and ( ) sightline.
and removing none (Fig. 3e and f), but reduced the L/T ratio fromca. 9 to 6.5. Both porosity and variability in sightlines were slightlyincreased. LBF did not explicitly evaluate their sketch design forthese undesirable changes.
Solutions with a low Pareto efficiency value can be typified asthe ‘best compromises’ because they contain fewer trade-offs andare therefore likely to be interesting from a planner’s point of view.Lowest Pareto efficiency found in the set of Pareto-optimal solu-tions was k = 5, which was associated with 5 landscape alternatives(the red circles in Fig. 3). In the solution space these compromisesolutions were located close to the original situation, but were char-acterized by desirable lower sight line homogeneity and higher L/Tratio, albeit often at the cost of investments in removal and addingof hedgerows. Spatial cohesion remained at a similar level as in theoriginal situation. Solutions with Pareto efficiency values of 6 and 7were identified in Fig. 3 as blue and green circles, respectively. Thesepoints represent solutions in which most trade-offs occur amongthe 7 objectives, although all are Pareto-optimal.
In Fig. 4 two alternative landscape maps are presented, whichconstitute the spatial representation of two Pareto-optimal solu-tions. Although these landscapes have similar economic andecological performance their visual appearance is very different,which can be related to differences in the values of the indicatorsof L/T ratio (8.79 versus 5.75) and landscape porosity (45 versus 15).The presence of different alternative solutions for similar parame-ter settings demonstrates the various ways in which objectives canbe matched and focuses discussion about details of the implemen-tation of a landscape plan.
4. Discussion
Already in the 1970s Penning de Vries (1977) proposed toevaluate model performance in terms of ‘usefulness’ and ‘truthful-ness’. Recently, Bockstaller and Girardin (2003) distinguished threevalidation dimensions, viz. end-user validation equivalent to use-fulness, output validation equivalent to truthfulness, and designvalidation, thus adding the issue of how a particular model config-uration or indicator was selected. The latter is particularly relevantwhere no data exist to assess output validity based on data. We will
discuss these three domains in turn starting with end-user valida-tion, leaving aside the philosophical issue of whether ‘validation’ ispossible at all.The solution space generated by the Landscape IMAGES frame-work as presented in Fig. 3 revealed the ‘playing field’ for the NGO

J.C.J. Groot et al. / Europ. J. Agronomy 32 (2010) 112–119 117
F ationsi inal li er is r
‘mspduapis
stphntos
ig. 3. The 7-dimensional solution space represented by 2-dimensional plots of relndicate Pareto efficiency of k = 7 (�, blue), k = 6 (�, green) or k = 5 (�, red). The origndicated.(For interpretation of the references to color in this figure legend, the read
Landschapsbeheer Friesland’, as delimited by the minimum andaximum attainable values for the desired objectives; it demon-
trated the interactions between objectives including trade-offs andossible synergies; and it provided insight into options to combineifferent land-use objectives. Such outputs may contribute to thenderstanding of the system by the stakeholders and can providesound basis for balanced decision making that does justice to theerspectives and interests of broad groups of stakeholders, which
s considered instrumental for active management of ecosystemervices (Robertson and Swinton, 2005).
The study demonstrated that the spatial coherence of the casetudy area could be increased to support the dispersal opportuni-ies of species with different dispersal ranges, with limited costs oflanting of hedgerows or labour inputs of farmers to maintain the
edgerows. Key strategy to achieve such result would be to con-ect existing large connected fragments of existing hedgerows byargeted placement of new hedgerows in the transversal directionf the fields. This would also reduce the porosity of the land-cape, improving the visual perception. On the other hand, it wouldbetween the objectives. Each point represents a landscape configuration. Symbolsandscape (� , yellow) and the sketch design developed by the NGO (�, yellow) areeferred to the web version of the article.)
reduce the ratio between longitudinally and transversally directedhedgerows, thereby changing the cultural heritage value of thelandscape. These results originated from a joint effort of researchersand landscape planners. The NGO ‘Landschapsbeheer Friesland’considered the application of the Landscape IMAGES framework tobe supportive in their landscape re-design practice as was appar-ent from statements and from their continued participation in the3-year process. The need in Landscape IMAGES to define explicitobjectives and indicators brought out the largely implicit designrules of the NGO and stimulated reflection. Presentation of prelimi-nary results from various intermediate versions of the model duringproject team meetings helped to elucidate hidden constraints thathad been used by the NGO in formulating the sketch design andneeded to be included in the model as well. The confrontation
between the sketch design and the Pareto optimal set allowedthe LBF representatives to assess their result against the range ofpossible alternatives. The benefit for the NGO end-users was alsoapparent from their invitation to the research team to contribute toa large landscape restructuring project surrounding the construc-
118 J.C.J. Groot et al. / Europ. J. Agron
Fig. 4. Original hedgerow configuration in the 873 ha case study region in the North-elt(
tw
rsdtdsetaipataqddeb
amsarnVohbmt
rn Friesian Woodlands (a) and a generated landscape (b) with similar hedgerowength (85.6 km in (a) and 85.7 km in (b)) and connectivity (6.7 and 6.9, respec-ively), but strongly contrasting ratio between longitudinal and transversal hedges8.79 in (a) and 5.75 in (b)) and porosity (45 and 15, respectively).
ion of a major road in the area. Here, trade-offs with agricultureill be addressed in more detail.
Output validation concerns the value of the information abouteality in the model. No data exist, or are likely to become availableoon, about the landscape system as a whole. This implies that vali-ation of the output value shifts to the individual indicators. None ofhe indicators had a direct link to simulation models, or to a specificataset. The landscape character indicators porosity, L/T ratio andight line homogeneity were strongly based on input by landscapexperts from research and from the region. Indicator validity was inhese cases thus fully based on consensus, denoted by Bockstallernd Girardin (2003) as global expert validation. The ecological qual-ty indicator landscape cohesion was based on general ecologicalrinciples derived from particularly modelling studies (e.g. Urbannd Keitt, 2001; Verboom et al., 2001), and thus based on quali-ative comparison with results from other approaches (Bockstallernd Girardin, 2003). There is an urgent need for validation based onuantitative tests with empirical data. From the agronomy domain,ata and models of gene flow with pollen (Colbach et al., 2009) andispersal of plant pathogens (Skelsey, 2008) and crop pests (Bianchit al., 2007) hold promise to better understand the general relationetween landscape configuration and distribution patterns.
An important design aspect was the decision to not includegricultural land-use alternatives in the Landscape IMAGES imple-entation for the NGO. As a consequence, landscape redesign
uggestions were not evaluated in terms of pasture managementnd its consequences to dairy farms operating in the area. Theeasons for this were two-fold. Including the large amount of agro-omic knowledge on pasture management that is available (e.g.an de Ven, 1996; Groot et al., 2007; Schils et al., 2007) would
bscure model performance on the core interests of the NGO stake-older and would deviate from the purpose of end-user validationy spatial planners. Secondly, knowledge on the effect of pastureanagement on the quality of the neighbouring hedgerows or onhe potentials for dispersal of organisms is largely absent and so
omy 32 (2010) 112–119
that interactions between landscape and agriculture could not becovered.
Pareto-based Differential Evolution is resilient to differentspecifications of the optimization problem, which can be easilyintegrated in a GIS and can be coupled to complex computationalalgorithms such as mechanistic simulation models and spatial met-ric calculations, for instance to determine the minimum spanningtree. Mathematical programming methods tend to fall short whenfaced with large combinatorial problems, as is the case in theapplications in this section. Evolutionary computation is a usefulcompromise for the type of complex decision problems presentedhere where interest is more in trends and variation in the solutionsthan in precise optimality. Thus, the flexibility of multi-objectiveevolutionary computation offers opportunities for connecting dif-ferent spatial scales as well as different scientific disciplines tocreate new perspectives for sustainable land-use. Future applica-tions will rely on increased algorithmic efficiency, particularly inview of sparse solution spaces at high numbers of objectives, andtechniques to select and present relevant solutions in the discussionand negotiation process.
The results of the three types of validation demonstrate the use-fulness of the approach for landscape planning end-users, and theacceptability of the ecological quality and landscape character indi-cators for experts. The simultaneous analysis of different types ofobjectives (economic, socio-cultural and ecological), and the scalingup from the field/hedgerow level to the regional level representednew perspectives to the end-users. Visual presentation of trade-offsand the room for negotiation in the various objective dimensions,as well as visualization of the landscapes associated with a cer-tain performance was particularly insightful for the end-users. Thestudy also suggests that to contribute to this type of spatial planningagronomic research should invest in understanding consequencesof land-use for spatial coherence. This will support the ambitionsof an increasing number of European farmers to contribute to mul-tifunctionality for the benefit of society at large. The LandscapeIMAGES model may play a role as a tool for integration of knowledgewhen used in a process with end-users that allows joint construc-tion of the various components of the model, including objectives,system definition and performance indicators. As witnessed in thecase study, the model then represents the boundary object in whichprogress in mutual understanding materializes, which constitutesa key element for end-user validity (Sterk et al., 2006).
Acknowledgements
We would like to thank Foppe van der Meer and Els van Loon ofLandscape Management Friesland (LBF) for their cooperation in theproject and their contribution to the elaboration of the methodol-ogy.
References
Anonymous, 1998. ESRI Shapefile Technical Description. Environmental SystemsResearch Institute, Redlands, CA, USA, p. 34.
Anonymous, 2006. Nota Ruimte. Ruimte voor ontwikkeling. Ministry of Health, Spa-tial Planning and Environment, Den Haag.
Baudry, J., Bunce, R.G.H., Burel, F., 2001. Hedgerows: an international perspective ontheir origin, function and management. J. Environ. Manage. 60, 7–22.
Bergey, P.K., Ragsdale, C., 2005. Modified differential evolution: a greedy randomstrategy for genetic recombination. Omega-Int. J. Manage. Sci. 33, 255–265.
Bianchi, F.J.J.A., Honek, A., van der Werf, W., 2007. Changes in agricultural land usecan explain population decline in a ladybeetle species in the Czech Republic: evi-dence from a process-based spatially explicit model. Landsc. Ecol. 21, 1541–1554.
Bockstaller, C., Girardin, P., 2003. How to validate environmental indicators. Agric.Syst. 76, 639–653.
Bondy, J.A., Murty, U.S.R., 1977. Graph Theory with Applications. American ElsevierPublishing Co., New York, p. 270.
Bryan, B.A., Crossman, N.D., 2008. Systematic regional planning for multiple objec-tive natural resource management. J. Environ. Manage. 88, 1175–1189.
. Agron
C
C
C
C
D
D
D
D
D
D
F
F
G
G
G
G
H
H
H
I
K
L
M
Verboom, J., Foppen, R., Chardon, P., Opdam, P., Luttikhuizen, P., 2001. Introducing
J.C.J. Groot et al. / Europ. J
arpenter, S.R., DeFries, R., Dietz, T., Mooney, H.A., Polasky, S., Reid, W.V., Scholes, R.J.,2006. Millennium ecosystem assessment: research needs. Science 314, 257–258.
hee, Y.E., 2004. An ecological perspective on the valuation of ecosystem services.Biol. Conserv. 120, 549–565.
olbach, N., Devaux, C., Angevin, F., 2009. Comparative study of the efficiency ofbuffer zones and harvest discarding on gene flow containment in oilseed rape.A modelling approach. Eur. J. Agronomy 30, 187–198.
umming, G.S., Cumming, D.H.M., Redman, C.L., 2006. Scale mismatches in social-ecological systems: causes, consequences, and solutions. Ecol. Soc., 11.
as, I., 1999. A preference ordering among various Pareto optimal alternatives. Struct.Opt. 18, 30–35.
e Boer, J.J., 2003. Veldgids landschapselementen Noardlike Fryske Walden. Sticht-ing Landschapsbeheer Friesland, Beetsterzwaag, 196 pp.
e la Fuente de Val, G., Atauri, J.A., de Lucio, J.V., 2006. Relationship betweenlandscape visual attributes and spatial pattern indices: a test study inMediterranean-climate landscapes. Landscape Urban Plan. 77, 393–407.
eb, K., Pratap, A., Agarwal, S., Meyarivan, T., 2002. A fast and elitist multiobjectivegenetic algorithm: NSGA-II. IEEE T. Evol. Comput. 6, 182–197.
ijkstra, H., Bianchi, F.J.J.A., Griffioen, A.J., Van Langevelde, F., 2003. Typering vanlandscapeseenheden in Nederland naar groen-blauwe dooradering. Alterra-rapport 645, Alterra, Wageningen, pp. 79.
ockerty, T., Lovett, A., Appleton, K., Bone, A., Sünnenberg, G., 2006. Developingscenarios and visualisations to illustrate potential policy and climatic influenceson future agricultural landscapes. Agric. Ecosyst. Environ. 114, 102–120.
all, A., Fortin, M.J., Manseau, M., O’Brien, D., 2007. Spatial graphs: principles andapplications for habitat connectivity. Ecosystems 10, 448–461.
ranks, J.R., Mc Gloin, A., 2007. Environmental co-operatives as instruments for deliv-ering across-farm environmental and rural policy objectives: lessons for the UK.J. Rural Stud. 23, 472–489.
oldberg, D.E., 1989. Genetic algorithms in search. In: Optimization and MachineLearning. Addison-Wesley, Reading, p. 412.
ottfried, R., Wear, D., Lee, R., 1996. Institutional solutions to market failure on thelandscape scale. Ecol. Econ. 18, 133–140.
root, J.C.J., Rossing, W.A.H., Jellema, A., Stobbelaar, D.J., Renting, H., Van Ittersum,M.K., 2007. Exploring multi-scale trade-offs between nature conservation, agri-cultural profits and landscape quality—a methodology to support discussions onland-use perspectives. Agric. Ecosyst. Environ. 120, 58–69.
root, J.C.J., Rossing, W.A.H., Tichit, M., Turpin, N., Baudry, J., Jellema, A., Doyen, L.,Van de Ven, G.W.J., 2009. On the contribution of modelling to multifunctionalagriculture: learning from comparisons. J. Environ. Manage. 90, S147–S160.
ajkowicz, S., Perraud, J.M., Dawes, W., DeRose, R., 2005. The strategic landscapeinvestment model: a tool for mapping optimal environmental expenditure. Env-iron. Model. Softw. 20, 1251–1262.
olloway, L., Cox, R., Venn, L., Kneafsey, M., Dowler, E., Tuomainen, H., 2006. Man-aging sustainable farmed landscape through ‘alternative’ food networks: a casestudy from Italy. Geo. J. 172, 219–229.
ölzkamper, A., Seppelt, R., 2007. A generic tool for optimising land-use patternsand landscape structures. Environ. Model. Softw. 22, 1801–1804.
AASTD, 2008. Agriculture at a crossroads: the synthesis report. Washington,DC, USA: International Knowledge, Science and Technology for Development.www.agassessment.org/.
angas, J., Store, R., Kangas, A., 2005. Socioecological landscape planning approachand multicriteria acceptability analysis in multiple-purpose forest management.
Forest Policy Econ. 7, 603–614.eenhardt, D., Angevin, F., Biarnès, A., Colbach, N., Mignolet, C., 2009. Describing andlocating cropping systems on a regional scale. A review. Agron. Sustain. Dev.,doi:10.1051/agro/2009002.
ayer, D.G., Kinghorn, B.P., Archer, A.A., 2005. Differential Evolution – an easy andefficient evolutionary algorithm for model optimization. Agric. Syst. 83, 315–328.
omy 32 (2010) 112–119 119
Münier, B., Birr-Pedersen, K., Schou, J.S., 2004. Combined ecological and economicmodelling in agricultural land use scenarios. Ecol. Model. 174, 5–18.
Nesetril, J., Milková, E., Nesetrilová, H., 2001. Otakar Boruka on minimum spanningtree problem: translation of both the 1926 papers, comments, history. DiscreteMath. 233, 3–36.
O’ Conner, D., Renting, H., Gorman, M., Kinsella, J., 2006. Driving Rural Development:Policy and Practice in Seven EU Countries. Van Gorcum Publishers.
Otte, A., Simmering, D., Wolters, V., 2007. Biodiversity at the landscape level:recent concepts and perspectives for multifunctional land use. Landsc. Ecol. 22,639–642.
Penning de Vries, F.W.T., 1977. Evaluation of simulation models in agriculture andbiology: conclusions of a workshop. Agric. Syst. 2, 99–107.
Renting, H., Rossing, W.A.H., Groot, J.C.J., Van der Ploeg, J.D., Laurent, C., Perraud, D.,Stobbelaar, D.J., Van Ittersum, M.K., 2009. Exploring multifunctional agriculture.A review of conceptual approaches and prospects for an integrative transitionalframework. J. Environ. Manage. 90, S112–S123.
Renting, H., Van Der Ploeg, J.D., 2001. Reconnecting nature, farming and society:environmental cooperatives in The Netherlands as institutional arrangementsfor creating coherence. J. Environ. Pol. Plan. 3, 85–101.
Robertson, G.P., Swinton, S.M., 2005. Reconciling agricultural productivity and envi-ronmental integrity: a grand challenge for agriculture. Front. Ecol. Environ. 3,38–46.
Rossing, W.A.H., Zander, P., Josien, E., Groot, J.C.J., Meyer, B., Knierim, A., 2007. Integra-tive modelling approaches for analysis of impact of multifunctional agriculture:a review for France, Germany and the Netherlands. Agric. Ecosyst. Environ. 120,41–57.
Schils, R.L.M., de Haan, M.H.A., Hemmer, J.G.A., van den Pol-van Dasselaar, A., de Boer,J.A., Evers, A.G., Holshof, G., van Middelkoop, J.C., Zom, R.L.G., 2007. DairyWise,a whole-farm dairy model. J. Dairy Sci. 90, 5334–5346.
Skelsey, P., 2008. Multi-scale modeling of potato late blight epidemics. PhD ThesisWageningen University, Wageningen, pp. 257.
Stedman, R.C., 2003. Is it really just a social construction? The contribution of thephysical environment to sense of place. Soc. Nat. Resour. 16, 671–685.
Sterk, B., van Ittersum, M.K., Leeuwis, C., Rossing, W.A.H., van Keulen, H., van deVen, G.W.J., 2006. Finding niches for whole-farm design models—contradictioin terminis? Agric. Syst. 87, 211–228.
Storn, R., Price, K., 1997. Differential evolution—a simple and efficient heuristic forglobal optimization over continuous spaces. J. Global Optim. 11, 341–359.
Swanwick, C., Consultants, L.U., 2002. Landscape Character Assessment—Guidancefor England and Scotland. Countryside Agency, Cheltenham and Scottish NaturalHeritage, Edinburgh.
Swetnam, R.D., Wilson, J.D., Whittingham, M.J., Grice, P.V., 2005. Designing lowlandlandscape for farmland birds: scenario testing with GIS. Comput. Environ. UrbanSyst. 29, 275–296.
Tichit, M., Doyen, L., Lemel, J.Y., Renault, O., Durant, D., 2007. A co-viability modelof grazing and bird community management in farmland. Ecol. Model. 206,277–293.
Urban, D., Keitt, T., 2001. Landscape connectivity: a graph-theoretic perspective.Ecology 82, 1205–1218.
Van de Ven, G.W.J., 1996. A mathematical approach to comparing environmental andeconomic goals in dairy farming on sandy soils in The Netherlands. PhD Thesis,Wageningen University, 239pp.
the key patch approach for habitat networks with persistent populations: anexample for marshland birds. Biol. Conserv. 100, 89–101.
Vos, W., Meekes, H., 1999. Trends in European cultural landscape develop-ment: perspectives for a sustainable future. Landsc. Urban Plan. 46 (1–3),3–14.
Copyright © 2022 FDOKUMEN