Comment on “The Molecular Evolutionary Patterns of the Insulin/FOXO Signaling Pathway&rdquo
6
Evolutionary Bioinformatics 2013:9 229–234 doi: 10.4137/EBO.S11915 This article is available from http://www.la-press.com. © the author(s), publisher and licensee Libertas Academica Ltd. This is an open access article published under the Creative Commons CC-BY-NC 3.0 license. OPEN ACCESS Full open access to this and thousands of other papers at http://www.la-press.com. Evolutionary Bioinformatics LETTER TO EDITOR Evolutionary Bioinformatics 2013:9 229 Comment on “The Molecular Evolutionary Patterns of the Insulin/FOXO Signaling Pathway” David Alvarez-Ponce 1 , Montserrat Aguadé 2 and Julio Rozas 2 1 Laboratorio de Biología Integrativa de Sistemas, Instituto de Biología Molecular y Celular de Plantas, Consejo Superior de Investigaciones Científicas-Universidad Politécnica de Valencia, Valencia, Spain. 2 Departament de Genètica, and Institut de Recerca de la Biodiversitat, Universitat de Barcelona, Barcelona, Spain. Corresponding author email: [email protected] Abstract: Letter to the Editor on Wang M, Wang Q, Wang Z, Zhang X, Pan Y. The molecular evolutionary patterns of the insulin/FOXO signaling pathway. Evol Bioinform. 2013;9:1–16. doi: 10.4137/EBO.S10539. Keywords: network evolution, insulin pathway, selective constraint, d N /d S
Transcript of Comment on “The Molecular Evolutionary Patterns of the Insulin/FOXO Signaling Pathway&rdquo
Evolutionary Bioinformatics 2013:9 229–234
doi: 10.4137/EBO.S11915
This article is available from http://www.la-press.com.
© the author(s), publisher and licensee Libertas Academica Ltd.
This is an open access article published under the Creative Commons CC-BY-NC 3.0 license.
Open AccessFull open access to this and thousands of other papers at
http://www.la-press.com.
Evolutionary Bioinformatics
L E T T E r T O E d i T O r
Evolutionary Bioinformatics 2013:9 229
comment on “The Molecular evolutionary patterns of the Insulin/FOXO signaling pathway”
david Alvarez-Ponce1, Montserrat Aguadé2 and Julio rozas2
1Laboratorio de Biología integrativa de Sistemas, instituto de Biología Molecular y Celular de Plantas, Consejo Superior de Investigaciones Científicas-Universidad Politécnica de Valencia, Valencia, Spain. 2departament de Genètica, and Institut de Recerca de la Biodiversitat, Universitat de Barcelona, Barcelona, Spain.Corresponding author email: [email protected]
Abstract: Letter to the Editor on Wang M, Wang Q, Wang Z, Zhang X, Pan Y. The molecular evolutionary patterns of the insulin/FOXO signaling pathway. Evol Bioinform. 2013;9:1–16. doi: 10.4137/EBO.S10539.
Keywords: network evolution, insulin pathway, selective constraint, dN/dS
Alvarez-Ponce et al
230 Evolutionary Bioinformatics 2013:9
Wang et al have recently analyzed the pattern of selective pressures acting on genes along the insulin/FOXO pathway of vertebrates.1 In this study, which is similar to those that we and other authors per-formed in the Insulin/TOR (IT) signal transduction pathway,2–5 the authors questioned some of our previ-ous findings. Here we revise previous analyses of the pattern of selective constraints along the IT and other signal transduction pathways and discuss a number of issues that might account for the apparently different results obtained for the IT pathway by the different groups.
Alvarez-Ponce et al2 analyzed the selective pres-sures acting on genes involved in the Drosophila IT pathway and found that levels of selective constraint exhibit a gradient distribution along the upstream/downstream pathway axis. In particular, levels of selective constraint (measured from the nonsynony-mous to synonymous divergence ratio, ω = dN/dS) correlate with pathway position (computed as the number of steps required to transduce the signal from the insulin receptor to the rest of pathway compo-nents), being the downstream genes the most selec-tively constrained. We also determined that this trend is not the result of a higher incidence of positive selec-tion in the upstream part of the pathway2,4 and that the correlation remains significant after factoring out the effect of gene expression level, codon bias, protein length, and number of protein-protein interactions. The analysis was based on 27 D. melanogaster genes (representative of 21 gene families), all of which act downstream of the insulin receptor (ie, neither insulin-like peptides, IGFBPs, nor the insulin recep-tor were included in this analysis). We identified the orthologs of each gene in another 11 Drosophila species and, when necessary, we corrected manually the gene annotations. Remarkably, the distribution of selective constraint levels observed along the IT path-way sharply contrasts with that generally observed in biosynthetic pathways, in which upstream genes tend to be the most selectively constrained.6–11
In order to evaluate whether the correlation observed in Drosophila is general or, on the contrary, specific to this genus, we performed a similar analysis using six vertebrate genomes.3 In this case, we analyzed a total of 72 genes (representative of 23 gene families) (Table 1). Our network-level analysis revealed a tendency con-sistent with that observed in Drosophila: levels of
selective constraint exhibited a polarity along the pathway, with downstream genes being the most con-strained. This trend, however, was less pronounced than that observed in Drosophila, which might be explained, at least partially, by the lower effective pop-ulation sizes that vertebrates commonly have.12,13 In fact, overall ω values (estimated using the M0 model implemented in the PAML software,14 which assumes a unique ω value for all codons and branches in the phylogeny) do not significantly correlate with pathway position; however, when the analysis is conducted sep-arately for each branch of the phylogeny of the stud-ied vertebrates (using the ω values estimated under the free-ratio model, which assumes a separate ω ratio for each branch), the sign of the correlation was negative (ρ , 0) for most of the branches. This result indicates that, also in vertebrates, levels of selective constraint follow a polarity along the pathway, thus implying that the trend does not represent a feature specific to Drosophila. Jovelin and Phillips also studied the levels and patterns of selective constraint along the IT path-way, in this case in Caenorhabditis.5 In their similar network-level analysis based on 13 genes, they also found that ω values significantly correlated with path-way position, with downstream genes being the most selectively constrained. Nevertheless, they observed that the trend becomes nonsignificant after discounting the effect of gene expression levels.
Noticeably, a similar distribution of selective con-straint levels has been observed in the yeast HOG sig-nal transduction pathway, whose downstream genes are the most selectively constrained.15 Indeed, this appears to be the most common distribution of lev-els of selective constraint across signal transduction cascades: analysis of the global human signal trans-duction network has shown that, on average, genes acting at the downstream part of the network tend to be more selectively constrained than those occupying more highly hierarchical positions.16
In their recent study in vertebrates, Wang et al1 used a gene set that only partially overlaps with that used in our 2011 analysis. Their gene set encom-passes a total of 27 genes (representative of 9 gene families) acting at the upper part of the IT pathway (the insulin/FOXO pathway), of which only 15 (rep-resentative of 5 gene families) were also used in our study (Table 1).3 Consistent with previous observa-tions,2–5 they also detected a negative significant
The insulin/FOXO signal transduction pathway
Evolutionary Bioinformatics 2013:9 231
correlation between ω estimates and pathway posi-tion, even when potentially confounding factors were controlled for. However, they noticed that statistical significance vanished when genes encoding insulin, IGF1, and IGFBP1–6 (genes not included in any of the previous analyses2–5) were removed from their analysis. From this observation, the authors conclude that the distribution of selective constraints that they observe across the pathway “is different from [our] previous similar reports.” They claim that their obser-vation that the detected trend vanishes after removing the above-mentioned genes “demonstrates that the relaxed selective constraint at position 1 explains the purifying selection polarity along the IIF pathway,” adding that “the presented correlation [between path-way position and ω] comes from the relaxed selective
constraint operated on genes of position 1, which give us an erroneous perception of truth.”1 Wang et al’s con-clusions, however, are not supported by their obser-vations, as none of the previous analyses included genes encoding insulin, IGF1, and IGFBP1–6 (genes at position 1 in their study) (Table 1).2–5 Therefore, the polarity that we had detected cannot be caused by the presence of these genes.
Furthermore, we have reanalyzed our published data sets to evaluate whether the correlation between ω and the IT pathway position previously detected vanishes when analyses are restricted to the gene families also analyzed by Wang et al (Table 1). Remarkably, when we reanalyzed our Drosophila dataset, we found a significant correlation that is even stronger than that detected in our previous analysis
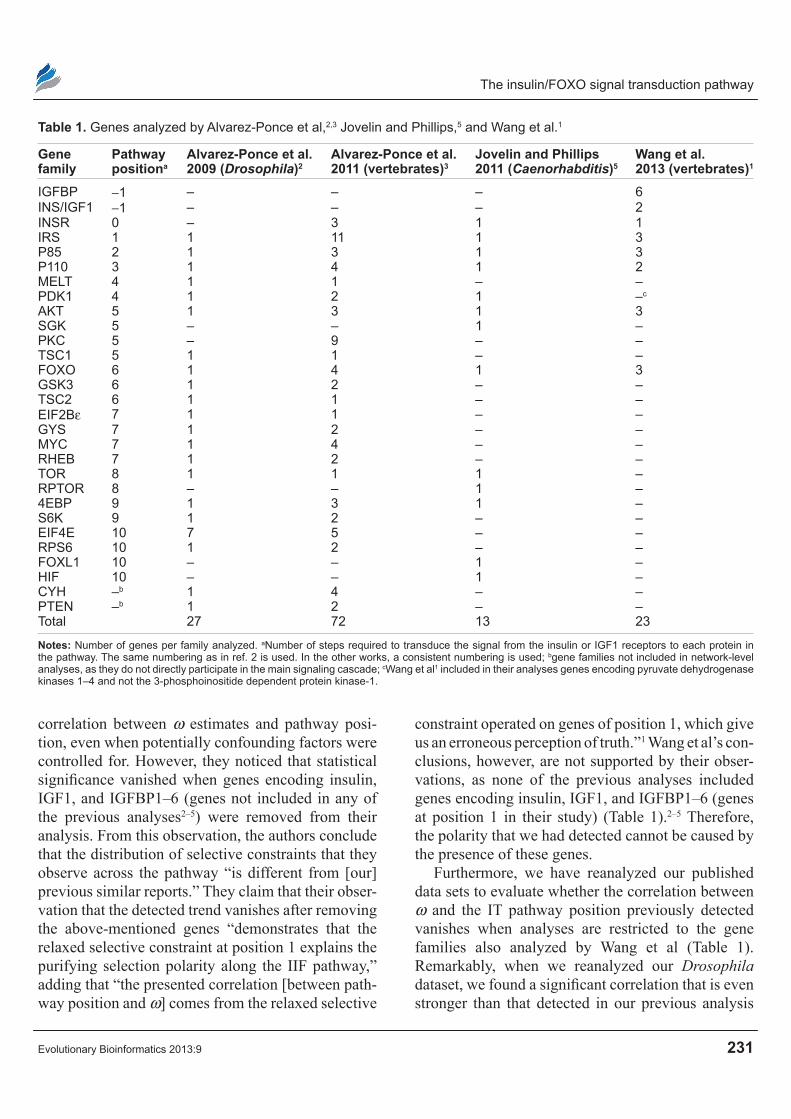
Table 1. Genes analyzed by Alvarez-Ponce et al,2,3 Jovelin and Phillips,5 and Wang et al.1
Gene family
pathway positiona
Alvarez-ponce et al. 2009 (Drosophila)2
Alvarez-ponce et al. 2011 (vertebrates)3
Jovelin and phillips 2011 (Caenorhabditis)5
Wang et al. 2013 (vertebrates)1
iGFBP -1 – – – 6iNS/iGF1 -1 – – – 2iNSr 0 – 3 1 1irS 1 1 11 1 3P85 2 1 3 1 3P110 3 1 4 1 2MELT 4 1 1 – –PdK1 4 1 2 1 –c
AKT 5 1 3 1 3SGK 5 – – 1 –PKC 5 – 9 – –TSC1 5 1 1 – –FOXO 6 1 4 1 3GSK3 6 1 2 – –TSC2 6 1 1 – –EiF2Bε 7 1 1 – –GYS 7 1 2 – –MYC 7 1 4 – –rHEB 7 1 2 – –TOr 8 1 1 1 –rPTOr 8 – – 1 –4EBP 9 1 3 1 –S6K 9 1 2 – –EiF4E 10 7 5 – –rPS6 10 1 2 – –FOXL1 10 – – 1 –HiF 10 – – 1 –CYH –b 1 4 – –PTEN –b 1 2 – –Total 27 72 13 23
notes: Number of genes per family analyzed. aNumber of steps required to transduce the signal from the insulin or iGF1 receptors to each protein in the pathway. The same numbering as in ref. 2 is used. in the other works, a consistent numbering is used; bgene families not included in network-level analyses, as they do not directly participate in the main signaling cascade; cWang et al1 included in their analyses genes encoding pyruvate dehydrogenase kinases 1–4 and not the 3-phosphoinositide dependent protein kinase-1.
Alvarez-Ponce et al
232 Evolutionary Bioinformatics 2013:9
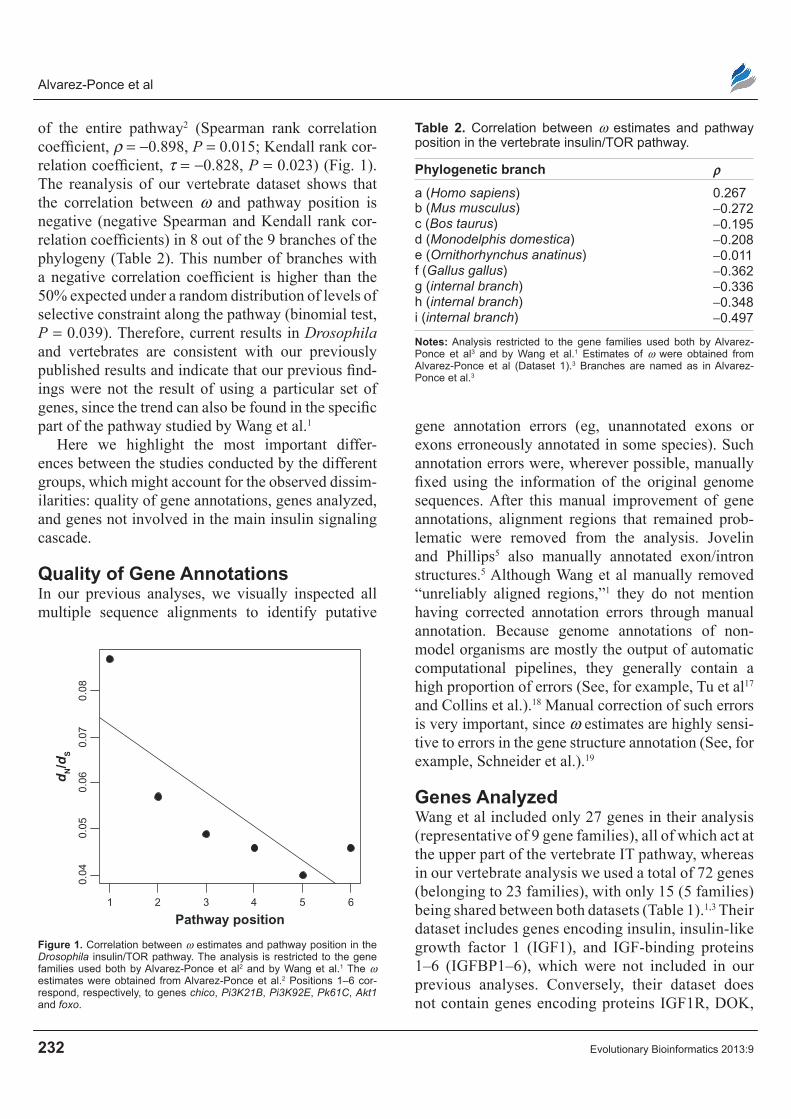
of the entire pathway2 (Spearman rank correlation coefficient, ρ = -0.898, P = 0.015; Kendall rank cor-relation coefficient, τ = -0.828, P = 0.023) (Fig. 1). The reanalysis of our vertebrate dataset shows that the correlation between ω and pathway position is negative (negative Spearman and Kendall rank cor-relation coefficients) in 8 out of the 9 branches of the phylogeny (Table 2). This number of branches with a negative correlation coefficient is higher than the 50% expected under a random distribution of levels of selective constraint along the pathway (binomial test, P = 0.039). Therefore, current results in Drosophila and vertebrates are consistent with our previously published results and indicate that our previous find-ings were not the result of using a particular set of genes, since the trend can also be found in the specific part of the pathway studied by Wang et al.1
Here we highlight the most important differ-ences between the studies conducted by the different groups, which might account for the observed dissim-ilarities: quality of gene annotations, genes analyzed, and genes not involved in the main insulin signaling cascade.
Quality of Gene AnnotationsIn our previous analyses, we visually inspected all multiple sequence alignments to identify putative
gene annotation errors (eg, unannotated exons or exons erroneously annotated in some species). Such annotation errors were, wherever possible, manually fixed using the information of the original genome sequences. After this manual improvement of gene annotations, alignment regions that remained prob-lematic were removed from the analysis. Jovelin and Phillips5 also manually annotated exon/intron structures.5 Although Wang et al manually removed “unreliably aligned regions,”1 they do not mention having corrected annotation errors through manual annotation. Because genome annotations of non-model organisms are mostly the output of automatic computational pipelines, they generally contain a high proportion of errors (See, for example, Tu et al17 and Collins et al.).18 Manual correction of such errors is very important, since ω estimates are highly sensi-tive to errors in the gene structure annotation (See, for example, Schneider et al.).19
Genes AnalyzedWang et al included only 27 genes in their analysis (representative of 9 gene families), all of which act at the upper part of the vertebrate IT pathway, whereas in our vertebrate analysis we used a total of 72 genes (belonging to 23 families), with only 15 (5 families) being shared between both datasets (Table 1).1,3 Their dataset includes genes encoding insulin, insulin-like growth factor 1 (IGF1), and IGF-binding proteins 1–6 (IGFBP1–6), which were not included in our previous analyses. Conversely, their dataset does not contain genes encoding proteins IGF1R, DOK,
dN/d
S
Pathway position1 2 3 4 5 6
0.04
0.05
0.06
0.07
0.08
Figure 1. Correlation between ω estimates and pathway position in the Drosophila insulin/TOr pathway. The analysis is restricted to the gene families used both by Alvarez-Ponce et al2 and by Wang et al.1 The ω estimates were obtained from Alvarez-Ponce et al.2 Positions 1–6 cor-respond, respectively, to genes chico, Pi3K21B, Pi3K92E, Pk61C, Akt1 and foxo.
Table 2. Correlation between ω estimates and pathway position in the vertebrate insulin/TOr pathway.
phylogenetic branch ρ
a (Homo sapiens) 0.267b (Mus musculus) -0.272c (Bos taurus) -0.195d (Monodelphis domestica) -0.208e (Ornithorhynchus anatinus) -0.011f (Gallus gallus) -0.362g (internal branch) -0.336h (internal branch) -0.348i (internal branch) -0.497
notes: Analysis restricted to the gene families used both by Alvarez-Ponce et al3 and by Wang et al.1 Estimates of ω were obtained from Alvarez-Ponce et al (dataset 1).3 Branches are named as in Alvarez-Ponce et al.3

The insulin/FOXO signal transduction pathway
Evolutionary Bioinformatics 2013:9 233
FRS, p110δ, PKC, Melted, GSK3, TSC1/2, Rheb, mTOR, S6K, RpS6, 4E-BP, eIF4E, Myc, eIF2B-ε, Glycogen Synthase, PTEN, and Cyh, which were included in our previous analysis (Table 1). The fact that they used a reduced dataset may have decreased the statistical power of their correlation analyses, particularly when genes encoding insulin, IGF1 and IGFBP1–6 (ie, 30% of their dataset) were removed from their analyses. Notice that trimming a small dataset often involves a dramatic reduction in the power of statistical tests, which can result in certain trends becoming statistically nonsignificant, despite their relevance.
Genes not Involved in the main Insulin signaling cascadeAccording to their report, Wang et al1 included in their analyses 4 genes encoding 3-phosphoinosit-ide dependent protein kinases (“position 5” in their Fig. 1, downstream of the PI3K complex and upstream of AKT1-3 proteins). However, the acces-sion numbers listed in their additional files 1 and 2 correspond to genes encoding pyruvate dehydroge-nase kinases 1–4. Although the activity of the latter enzymes is regulated by insulin, they do not act at “position 5” (in their Fig. 1); indeed, they are not directly involved in the main insulin signal trans-duction cascade. While insulin activates the 3-phos-phoinositide dependent protein kinase-1, it inhibits pyruvate dehydrogenase kinases 1–4.20–23 The fact that the same acronym (PDK) is often used for both enzymes (even though the gene symbols are PDPK1 for the 3-phosphoinositide dependent protein kinase-1 and PDK1–4 for pyruvate dehydrogenase kinases 1–4) likely led Wang et al to confound both gene families.
conclusionsIn conclusion, the issues raised above might explain the observation by Wang et al1 that the negative cor-relation between pathway position and ω vanishes after removing some genes from the analysis. These concerns, indeed, may have added some noise to their dataset, reducing the statistical power of their analy-ses. Therefore, there is no support for claiming that levels of selective constraint do not exhibit a polarity along the upstream/downstream axis of the insulin/TOR pathway.
Author contributionsConceived and designed the experiments: DA-P, MA, JR. Analyzed the data: DA-P. Wrote the first draft of the manuscript: DA-P. Contributed to the writing of the manuscript: DA-P, MA, JR. Agree with manu-script results and conclusions: DA-P, MA, JR. Jointly developed the structure and arguments for the paper: DA-P, MA, JR. Made critical revisions and approved final version: DA-P, MA, JR. All authors reviewed and approved of the final manuscript.
FundingWork supported by grants from the Ministerio de Educación y Ciencia of Spain (BFU2010-15484 to JR and BFU2012-35168 to MA) and from the Comissió Interdepartamental de Recerca i Innovació Tecnològica of Spain (2009SGR-1287). JR was par-tially supported by ICREA Academia (Generalitat de Catalunya), and DA-P by a Juan de la Cierva post-doctoral fellowship from the Spanish Ministerio de Economía y Competitividad (JCI-2011-11089).
competing InterestsAuthor(s) disclose no potential conflicts of interest.
Disclosures and ethicsAs a requirement of publication the authors have pro-vided signed confirmation of their compliance with ethical and legal obligations including but not lim-ited to compliance with ICMJE authorship and com-peting interests guidelines, that the article is neither under consideration for publication nor published elsewhere, of their compliance with legal and ethi-cal guidelines concerning human and animal research participants (if applicable), and that permission has been obtained for reproduction of any copyrighted material. This article was subject to blind, indepen-dent, expert peer review. The reviewers reported no competing interests.
References1. Wang M, Wang Q, Wang Z, Zhang X, Pan Y. The molecular evolutionary
patterns of the insulin/FOXO signaling pathway. Evol Bioinform Online. 2013;9:1–16.
2. Alvarez-Ponce D, Aguadé M, Rozas J. Network-level molecular evolutionary analysis of the insulin/TOR signal transduction pathway across 12 Drosophila genomes. Genome Res. 2009;19(2):234–42.
3. Alvarez-Ponce D, Aguadé M, Rozas J. Comparative genomics of the vertebrate insulin/TOR signal transduction pathway: a network-level analysis of selective pressures. Genome Biol Evol. 2011;3: 87–101.
Alvarez-Ponce et al
234 Evolutionary Bioinformatics 2013:9
4. Alvarez-Ponce D, Guirao-Rico S, Orengo DJ, Segarra C, Rozas J, Aguadé M. Molecular population genetics of the insulin/TOR signal transduction pathway: a network-level analysis in Drosophila melanogaster. Mol Biol Evol. 2012;29(1):123–32.
5. Jovelin R, Phillips PC. Expression level drives the pattern of selective con-straints along the insulin/Tor signal transduction pathway in Caenorhabditis. Genome Biol Evol. 2011;3:715–22.
6. Rausher MD, Miller RE, Tiffin P. Patterns of evolutionary rate variation among genes of the anthocyanin biosynthetic pathway. Mol Biol Evol. 1999;16(2):266–74.
7. Ramsay H, Rieseberg LH, Ritland K. The correlation of evolutionary rate with pathway position in plant terpenoid biosynthesis. Mol Biol Evol. 2009;26(5):1045–53.
8. Sharkey TD, Yeh S, Wiberley AE, Falbel TG, Gong D, Fernandez DE. Evolution of the isoprene biosynthetic pathway in kudzu. Plant Physiol. 2005;137(2):700–12.
9. Livingstone K, Anderson S. Patterns of variation in the evolution of carotenoid biosynthetic pathway enzymes of higher plants. J Hered. 2009;100(6):754–61.
10. Yu HS, Shen YH, Yuan GX, et al. Evidence of selection at melanin syn-thesis pathway loci during silkworm domestication. Mol Biol Evol. 2011;28(6):1785–99.
11. Ma X, Wang Z, Zhang X. Evolution of dopamine-related systems: biosynthesis, degradation and receptors. J Mol Evol. 2010;71(5–6):374–84.
12. Lynch M. The Origins of Genome Architecture. Sunderland, MA: Sinauer Associates; 2007.
13. Ohta T. Slightly deleterious mutant substitutions in evolution. Nature. 1973;246(5428):96–8.
14. Yang Z. PAML 4: phylogenetic analysis by maximum likelihood. Mol Biol Evol. 2007;24(8):1586–91.
15. Wu X, Chi X, Wang P, Zheng D, Ding R, Li Y. The evolutionary rate varia-tion among genes of HOG-signaling pathway in yeast genomes. Biol Direct. 2010;5:46.
16. Alvarez-Ponce D. The relationship between the hierarchical position of pro-teins in the human signal transduction network and their rate of evolution. BMC Evol Biol. 2012;12:192.
17. Tu Q, Cameron RA, Worley KC, Gibbs RA, Davidson EH. Gene struc-ture in the sea urchin Strongylocentrotus purpuratus based on transcriptome analysis. Genome Res. 2012;22(10):2079–87.
18. Collins JE, White S, Searle SM, Stemple DL. Incorporating RNA-seq data into the zebrafish Ensembl genebuild. Genome Res. 2012;22(10):2067–78.
19. Schneider A, Souvorov A, Sabath N, Landan G, Gonnet GH, Graur D. Estimates of positive Darwinian selection are inflated by errors in sequenc-ing, annotation, and alignment. Genome Biol Evol. 2009;1:114–8.
20. Majer M, Popov KM, Harris RA, Bogardus C, Prochazka M. Insulin down-regulates pyruvate dehydrogenase kinase (PDK) mRNA: potential mecha-nism contributing to increased lipid oxidation in insulin-resistant subjects. Mol Genet Metab. 1998;65(2):181–6.
21. Huang SM, Hancock MK, Pitman JL, Orth AP, Gekakis N. Negative regula-tors of insulin signaling revealed in a genome-wide functional screen. PLoS One. 2009;4(9):e6871.
22. Giannakou ME, Partridge L. Role of insulin-like signalling in Drosophila lifespan. Trends Biochem Sci. 2007;32(4):180–8.
23. Oldham S, Hafen E. Insulin/IGF and target of rapamycin signaling: a TOR de force in growth control. Trends Cell Biol. 2003;13(2):79–85.