Reply to Dr. Stoesselfs Comment on
14
Geochimica <'l C",m''''htmica A,'/a Vol. 56. pp. 2559-2572 COpyrishl © 1992 Pctpmon Press LId. Printed in U.S.A. REPLY 0016-7037/92/$5.00 + ,00 Reply to Dr. Stoessell's Comment on "Reaction paths and equilibrium end-points in solid-solution aqueous-solution systems" PIERRE D. GLYNN,I ERIC J. REARDON,2 L. NIEL PLUMMER, I and EURYBIADES DUSENBERG) IUS Geological Survey,432 National Center, Reston, VA 22092, USA 2Departmentof Earth Sciences, University of Waterloo, Waterloo,Ontario N2L 301, Canada (Received October 2, 1990; accepted in revisedform March 3, 1992) Abstract-In reply to the Critical Comment ofR. K. Stoessell (this issue), limiting activity coefficients of bromide in halite ('YNaBr) have been calculated by least-squares fitting of SIMONS etal.'s ( 1952) bromide distribution coefficient data for the Na (CI,Br )-NaOH-H 2 0 system at 35°C. Regular and subregular solid- solution model fits give 'YNaBr = 7.4 and 'YNaBr = 8.8, respectively. The Dr contents of halite at equilibrium with seawater at initial halite saturation, calculated from the regular and subregular fits, are 17 ppm and 14 ppm, respectively. A survey of literature data for trace bromide in halite shows a wide spread in distribution coefficients, with lower values (Da.- "'" 0.01) reported by BLOCH and SCHNERB (1953), PuCHELT et al, ( 1972), and LUTZ( 1975), and higher values (D Br - "'" 0.03) reported by DRAITSCH and HERRMANN( 1963), KOHN (1968), HERRMANN ( 1972), HERRMANN ( 1980), MCCAFFREY et al, (1987), VALIASHKO et al, (1976), VALIASHKO and LAVROVA (1976), and Fontes (pers. cornmun., 1990). The measurement of stoichiometric saturation states for halite (or sylvite) with trace bromide mole-fractions is not practical, given the insensitivity of the measured solubilities on the bromide mole-fractions. Dis- tribution coefficient measurements, with proof of thermodynamic equilibrium, need to be obtained instead, to conclusively determine the thermodynamic-mixing properties of both Na(CI,Dr) and K(CI,Dr) solid- solution series at very low mole-fractions of bromide. The applicability of the stoichiometric saturation concept to the interpretation of precipitation processes is questionable, primarily because the concept requires solid-solutions to behave as one-component solids with fixed composition. Lippmann diagrams are useful in depicting stoichiometric saturation, endmember saturation, and thermodynamic equilibrium states in binary-solid-solution aqueous-solution systems. Lippmann diagrams can contribute a better understanding of these systems, regardless of the concentration of the endmember components. INTRODUCfION WE THANK DR. STOESSELL for giving us the chance to further discuss the concept of stoichiometric saturation and to re- state our objections to the application of this concept in pre- cipitation processes, as implemented in STOESSELL and CARPENTER ( 1986). Dr. Stoessel! makes essentially three points in his Comment on our paper. We first consider his argument that the activity coefficient for trace NaDr in NaO, extrapolated from KIR- GINTSEV and TRUSHNIKOVA (1966) by GLYNN etal. (1990), yields unreasonably low Dr contents in halite at thermody- namic equilibrium with evaporating seawater. In reply, we reexamine the source of Kirgintsev and Trushnikova's data and our previous interpretation of those results. We also ex- tend our discussion to a survey of the existing data on trace bromide in halite and in sylvite. In particular, we reexamine the assumption of STOESSELL and CARPENTER ( 1986) that stoichiometric saturation acted asthe control for the amount of Br incorporated in precipitating halite and sylvite in the laboratory experiments ofBRAITSCH and HERRMANN ( 1963). In a second point, Dr. Stoessell argues that the concept of stoichiometric saturation only requires the aqueous solution composition to come to equilibrium with a multicomponent 2559 phase of a particular given composition. Dr. Stoessell claims that the concept of stoichiometric saturation "does not require the solid-solution to react with a fixed composition as the aqueous-solution composition varies." We disagree. Our reply reviews the definition of stoichiometric saturation states and the relationship between stoichiometric saturation and ther- modynamic equilibrium states. We also discuss the use and limitations of stoichiometric saturation measurements, and outline the problems inherent in applying the concept of stoichiometric saturation to the interpretation of solid-solu- tion precipitation processes. Finally, Dr. Stoessell comments on the limitations of Lippmann phase diagrams in determining whether an aqueous solution is at stoichiometric saturation with respect to a binary solid solution containing a trace component. The problem discussed by Dr. Stoessell is inherent in all solubility studies involving solids with trace components and is not related to the descriptive capabilities of Lippmann diagrams. Our reply expands on our discussion of the definition of stoi- chiometric saturation and on our explanation of the limita- tions inherent in trying to use stoichiometric saturation sol- ubilities to determine the thermodynamic-mixing properties of binary solid solutions with a trace component.
-
Upload
unitedstatesgeologicalsurvey -
Category
Documents
-
view
3 -
download
0
Transcript of Reply to Dr. Stoesselfs Comment on

Geochimica <'l C",m''''htmica A,'/a Vol. 56. pp. 2559-2572COpyrishl © 1992 Pctpmon Press LId. Printed in U.S.A.
REPLY
0016-7037/92/$5.00 + ,00
Reply to Dr. Stoessell's Comment on "Reaction paths and equilibrium end-pointsin solid-solution aqueous-solution systems"
PIERRE D. GLYNN,I ERICJ. REARDON,2 L. NIEL PLUMMER, I and EURYBIADES DUSENBERG)
IUS Geological Survey,432 National Center, Reston, VA 22092, USA2Departmentof Earth Sciences, University of Waterloo, Waterloo,Ontario N2L 301, Canada
(ReceivedOctober 2, 1990; accepted in revisedform March3, 1992)
Abstract-In reply to the Critical Comment ofR. K. Stoessell (this issue), limiting activity coefficientsofbromide in halite ('YNaBr) have been calculated by least-squares fitting ofSIMONS etal.'s ( 1952) bromidedistribution coefficient data for the Na (CI,Br)-NaOH-H20 system at 35°C. Regular and subregular solidsolution model fits give 'YNaBr = 7.4 and 'YNaBr= 8.8, respectively. The Dr contents of halite at equilibriumwith seawater at initial halite saturation, calculated from the regular and subregular fits, are 17 ppm and14 ppm, respectively. A survey of literature data for trace bromide in halite shows a wide spread indistribution coefficients, with lower values (Da.- "'" 0.01) reported by BLOCH and SCHNERB (1953),PuCHELT et al, ( 1972), and LUTZ( 1975), and higher values (D Br- "'" 0.03) reported by DRAITSCH andHERRMANN( 1963), KOHN(1968), HERRMANN ( 1972), HERRMANN ( 1980), MCCAFFREY et al, (1987),VALIASHKO et al, (1976), VALIASHKO and LAVROVA (1976), and Fontes (pers. cornmun., 1990). Themeasurement ofstoichiometric saturation states for halite (or sylvite) with trace bromide mole-fractionsis not practical, given the insensitivity of the measured solubilities on the bromide mole-fractions. Distribution coefficient measurements, with proofofthermodynamic equilibrium, need to be obtained instead,to conclusively determine the thermodynamic-mixing properties of both Na(CI,Dr) and K(CI,Dr) solidsolution series at very low mole-fractions of bromide. The applicability of the stoichiometric saturationconcept to the interpretation of precipitation processes is questionable, primarily because the conceptrequires solid-solutions to behave as one-component solids with fixed composition. Lippmann diagramsare useful in depicting stoichiometric saturation, endmember saturation, and thermodynamic equilibriumstates in binary-solid-solution aqueous-solution systems. Lippmann diagrams can contribute a betterunderstanding of these systems, regardless of the concentration of the endmember components.
INTRODUCfION
WETHANK DR. STOESSELL for giving us the chance to furtherdiscuss the concept of stoichiometric saturation and to restate our objections to the application of this concept in precipitation processes, as implemented in STOESSELL andCARPENTER ( 1986).
Dr. Stoessel! makes essentially three points in his Commenton our paper. We first consider his argument that the activitycoefficient for trace NaDr in NaO, extrapolated from KIRGINTSEV and TRUSHNIKOVA (1966) by GLYNN etal. (1990),yields unreasonably low Dr contents in halite at thermodynamic equilibrium with evaporating seawater. In reply, wereexamine the source of Kirgintsev and Trushnikova's dataand our previous interpretation of those results. We also extend our discussion to a survey of the existing data on tracebromide in halite and in sylvite. In particular, we reexaminethe assumption of STOESSELL and CARPENTER ( 1986) thatstoichiometric saturation acted asthe control for the amountof Br incorporated in precipitating halite and sylvite in thelaboratory experiments ofBRAITSCH and HERRMANN ( 1963).
In a second point, Dr. Stoessell argues that the concept ofstoichiometric saturation only requires the aqueous solutioncomposition to come to equilibrium with a multicomponent
2559
phase ofa particular given composition. Dr. Stoessell claimsthat the concept ofstoichiometric saturation "does not requirethe solid-solution to react with a fixed composition as theaqueous-solution composition varies." We disagree. Our replyreviews the definition ofstoichiometric saturation states andthe relationship between stoichiometric saturation and thermodynamic equilibrium states. We also discuss the use andlimitations of stoichiometric saturation measurements, andoutline the problems inherent in applying the concept ofstoichiometric saturation to the interpretation of solid-solution precipitation processes.
Finally, Dr. Stoessell comments on the limitations ofLippmann phase diagrams in determining whether anaqueous solution is at stoichiometric saturation with respectto a binary solid solution containing a trace component. Theproblem discussed by Dr. Stoessell is inherent in all solubilitystudies involving solids with trace components and is notrelated to the descriptive capabilities ofLippmann diagrams.Our reply expands on our discussion ofthe definition ofstoichiometric saturation and on our explanation of the limitations inherent in trying to use stoichiometric saturation solubilities to determine the thermodynamic-mixing propertiesof binary solid solutions with a trace component.

2560 P. D. Glynnet al.
THE Na(Cl,Br)-H10 AND K(Cl,Br)-H10 SYSTEMS:A DISCUSSION
What is the Activity Coefficient of NaBr in Haliteat Very Low NaBr Mole-Fractions?
We believe that the results of KJRGINSTEV and TRUSH·NIKOVA ( 1966) for the activity coefficients of NaBr in NaClas well as our own calculations of the activity coefficients ofKBrin KCI,are not necessarily applicableat verylowbromidecontents such as found in naturally precipitated halites andsylvites. Our argument against the validity of 'YNaOr and 'YKOr
activitycoefficients calculatedby STOESSELL and CARPENTER( 1986) centered on their findinga higher value for 'YKOr thanfor 'YNaOr. rather than on the specific individual values of'YNaBl and 'YKB.. We argued that it should be easier to fit aBr" ion in a KCllattice than in the smaller NaCllattice, andthat therefore 'YKOr should be smaller than 'YNaOr. even at lowbromide contents. This reasoning agrees with the possiblepresence of a miscibilitygap in the NaCl-NaBrseriesat 25°C(postulated from the results at 35°C of SIMONS et aI., 1952)and the absence ofa gap in the KCI-KBrseriesat 25°C (evidenced by DURHAM et al., 1953,and our own unpublishedexperiments). Dr. Stoessell argues that one of the activitycoefficients calculatedby STOESSELL and CARPENTER ( 1986),presumably that of KBr in KCI, may be incorrect. In theinitial version of his Comment, Dr. Stoessell argued that theactivity coefficient ratio test is not a diagnostic test of theactivity coefficient of NaBr in halite that was predicted bySTOESSELL and CARPENTER (1986). We never consideredthis test specifically diagnostic of the 'YNaOr value of Stoesselland Carpenter. We simplyconsideredit asa test on the generalvalidityof STOESSELL and CARPENTER'S ( 1986)assumptionofstoichiometricsaturation control of precipitationprocesses.The fact that the 'YNaBr coefficient calculated by STOESSELLand CARPENTER (1986) may, possibly, be reasonable, doesnot justify their original assumption of the applicability ofstoichiometric saturation to precipitation processes.GLYNN et al. (1990) never claimed to prove that Stoesselland Carpenter's assumption ofstoichiometric saturation wasinvalid. Instead, we stated:
Our conclusion is that regardless of the degree of non-idealityof the solid-solution, it is not possible to distinguish whether theinitial statesdescribed by STOESSELL and CARPENTER (1986)represent stoichiometric saturation, primarysaturation, orsimplysome metastable supersaturation state.
We believethat the agreement between Stoessell and Carpenter's calculateddistribution coefficient and the distributioncoefficient determined by LUTZ (1975) in his Ph.D. thesiscould very wellbe fortuitous. In any case, wedo not considerthis single point of agreement to be sufficient evidence toclaim that stoichiometricsaturation can control precipitationprocesses,especiallyifone considers the wide range of"equilibrium" distribution coefficients reported in the literature.
The "equilibrium" distribution coefficients determined byLUTZ (1975) do not agree with the results of J. C. Fontes(written and pers.commun., 1990),who conducted a twentyfive year NaCI-NaBr partitioning experiment on a singlecrystal grown from a marine brine. The distribution coeffi-
cient value of 0.0304 (which corresponds to a 'YNaBr activitycoefficient of2.36) determined by Fontes isclose to the 0.033average value independently found by both BRAITSCH andHERRMANN ( 1963) and KOHN ( 1968) and to the 0.032 average of MCCAFFREY et al. ( 1987). Fontes' value is significantly different from the distribution coefficients obtainedby LUTZ ( 1975) in similar single-crystal slow-growth experiments: 0.0148 for the Na(CI,Br)-H20 system, 0.0105 forthe Na(CI,Br)-MgClrH20 system (Mg/Na = 0.7), and0.0119 for the Na(CI,Br)-MgS04-H20 system (Mg/Na= 0.1). The aqueous Mg/Na mole ratio in this last systemis close to that of an evaporated seawater solution at the beginning of halite saturation (for which Mg/Na = 0.11 according to PHRQPITZ, PLUMMER et al., 1989).
The distribution coefficients (Dor- ) found by BRAITSCHand HERRMANN ( 1963) are alsosupported by the results ofVAlIASHKO et al. ( 1976) from slow-isothermal-evaporationexperiments and by the fluid-inclusion determinations ofVALIASHKO and LAVROVA ( 1976). VALIASHKO et al. ( 1976)reinvestigated experimentalsystemsstudied by BRAITSCH andHERRMANN ( 1963) and found the following average Dorvalues: 0.031 for Na(CI,Br)-H20, 0,025 for Na(CI,Br)MgS04-H20, 0.026 for Na(CI,Br)-MgCh-H 20, 0.022 forNa(Cl,Br)-CaCh-H20, 0.022 for Na( Cl,Br)-MgS04-MgCh
H20). VALIASHKO and LAVROVA (1976) measured fluidinclusion compositions in halite sampled from Soviet andEast German evaporite deposits, ranging from Cambrian toQuaternary age. The distribution coefficients they obtainedhave an average Dor- of0.030 ± 0.01.
BLOCH and SCHNERB ( 1953) determined values of Dorin halite close to those of LUTZ ( 1975) during isothermalevaporation experiments on Dead Sea brine at 50°C (Dor= 0.013 to 0.016) and Mediterranean Sea water at 27.5°C(Dor- = 0.015 to 0.025). STOESSELL and CARPENTER (1986),from a personal communication by Lazar,cite an even lowerdistribution coefficient for two fluid inclusions in a MioceneRed Sea halite: DBr- =0.0036 at 51°C in a solution with 3.2molal Mg and an ionic strength of 13. Two experiments ofBRAITSCH and HERRMANN (1963) for apparently similarconditions (55°C, 4 molal Mgsolutions, ionic strengthscloseto 13) yielded a much higher value, Dor- = 0.028. Lazar'sdistribution coefficient is four times lower than the valuefound by LUTZ ( 1975). If as a first approximation, the distribution coefficients are considered dependent only on 'YNaOr
and independent of temperature, Lazar's Dor- value corresponds to a value of 'YNoOr "'" 20!This result only compoundsthe uncertainty as to what may constitute "reasonable" equilibrium Dpr- and 'YNaBr values.
Whereas the laboratory experiments of Fontes andVALIASHKO er al. ( 1976), and the fluid-inclusion measurements OfVAUASHKO and LAVROVA (1976), suggest that theresults of BRAITSCH and HERRMANN ( 1963) may have beenclose to thermodynamic equilibrium, it can also be arguedthat the lowerbromide mole-fractionsin halitefound by LUTZ(1975) and by BLOCH and SCHNERB (1953), and possiblythe very low distribution coefficients found by Lazar (pers.commun. to STOESSELL and CARPENTER, 1986) could beexplained by recrystallization towards thermodynamic equilibrium. HOLSER (1979) reviews the discrepancy in the

Panitioning of Dr between halite and brines 2561
·3.00 0.0010.00 0.20 0.40 0.60 0.80 1.00
XNaBr in Halite
FIG. I. Regular and subregular solid-solution model fits of theSIMONS et al. (1952) log Dar- vs. X_ results from reversibleNa(O.Dr)·NaOH·H20 recrystallization experiments at 35°C.
where m"b- and mI," are the total molalities of CI and Drions in the equilibrium aqueous phase, "YB,- and 'Yo- are theactivity coefficients of Dr- and cr ions in the equilibriumaqueous phase, O'B,- and 0'0- account for ion association byrelating total aqueous concentrations to individual ion concentrations (e.g., mI," = (O'B,- + I )mBr-), XNaO and XNaB,are the mole-fractions of NaCl and NaDr in the equilibriumsolid-phase, and KNaOand KNaB, are the solubility productsof pure halite and pure NaDr.
(2)
If we assume a regular model (GUGGENHEIM, 1937, 1952;PRIGOGINE and DEFAY, 1954) for the solid-solution excessfree-energy function, Eqn. ( I ) becomes
I D - I [KNaCI'YBr-(O'o- + I) exP(Oox~aBr)]n Br- - n KNaBr'Ya-(O'B,- + I) exp(OoX~aCI)
-I [KNaO'YB,-«TO-+ I)] 2 X- n -00+ 00 NaB"KNaBr'Ya-(O'B'- + 1)
Alternatively, if we assume a subregular model, Eqn. (I)becomes
I D - I [KNaO'YD'"( 0'0- + I)]n D," - nKNaB,"YO-( O'Br- + I)
- 00 + a, + (200 - 6a,)XNaBr + 6a,X~aB" (3)
00and a, are the first and second nondimensional parametersin Guggenheim's expansion series for the excess-free-energyofa solution (see Eqns. 7, 8 and 9 in GLYNN et al., 1990).
Using Eqn. (2) and assuming that the "YB,-I'Ya- and( 0'0 - + I)I (O'B,- + I) ratios can be considered invariant asa function ofXNaB" a least-squares regression of the SIMONSet al, ( 1952) distribution coefficient data (excluding the XNaBr= 0.005 point) gives the following results at 35DC (see Fig.I): 00 = 2.00 ± 0.06; DB, - = 0.0101 at XNaB, = 0 (log DB,= -1.997 ± 0.065); "YNaBr = 7.37 ± 0.45 at XNaB' = 0; and'YB,-I'i'a-(O'a-+ 1)/(O'B'-+ 1)= 1.79±0.41 (uncertaintiesgiven are the standard errors on the linear regression). Ourvalue of Do agrees with Kirgintsev and Trushnikova's fittedvalue of 1.96 for the complete Na(CI,Dr) series, and corresponds to a 17 ppm Dr content in halite at thermodynamicequilibrium with evaporating seawater at initial halite saturation (a state referred to as "TEESIHS" hereafter), still significantly lower than the 30 ppm calculated by Dr. Stoessellbased on the Na(CI,Dr)-H20 system experiments of LUTZ(1975). Our Dr content in halite at TEESIHS was calculatedfrom Eqn. (I), using the limiting 'YNaBr = 7.37 value, assuming'YNaC1 = I, KNaO = 101.S76 and KNaBr = 102.958 (WAGMAN etal., 1982) and using an aqueous Dr/O activity ratio of0.00218 for the evaporated seawater (determined fromPHRQPITZ, PLUMMER et al., 1989).
The curvature of the log DDt- vs. XNaBr data in Fig. I isprobably caused by the asymmetry ofthe NaO-NaDr excessfree-energy function, which results in a higher limiting activity-coefficient for 'YNaBr at XNaB, = 0 than for "YNaCl at XNaB'= I, that is a lower DB," value at XNaBr = 0 than that predictedby a regular (symmetric) excess-free-energy model. If we assume an asymmetric excess-free-energy function, or morespecifically if we assume a subregular solid-solution model,a least-squares fit of the SIMONS et al. ( 1952) data using Eqn.(3), (excluding the XNaB, = 0.005 point) gives the results: 00
= 1.83; a, = -0.34; DB, - = 0.00859 at XNaB' = 0 (log Do,"= -2.066); "YNaBr = 8.82 at XNaB, = 0; and 'YB,-/'Yo-(O'CI+ I )/( 0'8'- + I) = 1.83. The limiting "YNa8, value calculatedcorresponds to a 14 ppm Dr content of halite at TEESIHS.If the excess-free-energy function is asymmetric, it should beeasier to substitute NaCI into the larger NaDr lattice thanvice-versa. Our fit predicts a value of 'YNaO = 4.44 at XNaBr= I, which agrees with this theory.
( I)
c:CI)
01 'u. ==
CI)
8co~
0.01 :giiiisSimons el al. (1952)data
__ regular solid-solullon fit........ sub'egular solid-SOlution IiI
c:CI)
'u~ ·1.00
Cog.c'Ciiii5
S
DDt- values found by these various investigations. In ouropinion, good experimental work is still needed to determinethe distribution coefficients and excess-free-energy functionfor both Na(O,Dr) and K(O,Dr) solid-solutions at lowbromide contents.
Dr. Stoessell comments that our extrapolation ofthe 'YNaBrdata of KJRGlNTSEV and TRUSHNIKOVA ( 1966) to a limitingvalue of 13 (determined from Figs. 2 and 3 in their paper)predicts a "much lower than expected trace Dr content (9ppm) in halite at thermodynamic equilibrium with evaporating seawater." Although we believe there is considerableuncertainty as to what that equilibrium Dr content mightactually be, we have reexamined the calculations used byKIRGINTSEV and TRUSHNIKOVA (1966) and the source oftheir data, a paper by SIMONS et aI. ( 1952). Figure I showsa plot of the experimental distribution coefficients which wecalculate from the original data of SIMONS et al, (1952).SIMONS et aI. ( 1952) checked the attainment ofequilibriumin several of their experiments by "the method of duplicatecomplexes," the technique used by DURHAM et aI. (1953)in the KCI-KBr-H20 experiments and previously explainedin GLYNN et al, (1990, p, 278). At thermodynamic equilibrium, experimental distribution-coefficients of NaBr in halitecan be related to endmember solubility products and solidphase and aqueous-phase activity coefficients by the relation(McINTYRE,1963):
DB," = XNaB,1XNaa = KNaO'YB,-( (To- + I )'YNaamI,-lm"b- KNaB,'YO-(O'Br- + I hNaB,

2562 P. D. Glynnet al.
If the XNaB, = 0.005 point is included in our subregularmodel fit. we obtain the following results: 00 = 1.84. Q.
= -0.48; DBt - = 0.00739 at XNaBt =0 (log DB,· = -2.131);'YNoB, = 10.2 at XNaB, = 0; and 'YBt-/'Yo-(O'o- + I )/(O'B,+ I) = 1.81. This regression predicts a 12 ppm Br contentof halite at TEESIHS. The higher absolute value of the Q.
parameter in this last fit predicts the occurrence of a miscibility gap at 35°C, whereas the previous fit did not.
The value of 13 ± 3 for 'YNaB" obtained by GLYNN et aI.( 1990) from the log 'YNaB, calculations of KIRGINTSEV andTRUSHNIKOVA ( 1966) was due to the very low distributioncoefficient obtained by SIMONS et al. ( 1952) at XNoB, = 0.005.The lack ofaccuracy, at low bromide contents, of the X-rayanalysis technique used by SIMONS et al. ( 1952) to determinesolid compositions is probably responsible for their anomalous distribution coefficient at XNaB, = 0.005, which is whywe chose to exclude that point from our regression fits.SIMONS et aI. ( 1952) do not report the uncertainties associatedwith their solid- and aqueous-phase analyses. Until more databecome available, the XNoB, = 0.005 point should probablybe considered suspect, which means that the value of 'YNaB,= 13 calculated in GLYNN et aI. ( 1990) should alsobe considered suspect, or at best should be considered as an upperlimit given the data of SIMONS et aI. (1952).
Extracting 00 and Q. data from Eqns. (2) or (3) relies onthe assumption that the ratio of the ion association factors,(0'0- + 1)/(0'8'- + I), and the ratio of the aqueous activitycoefficients, 'YB,-I'Yo-, can be considered constant throughout the range ofsolid mole fractions investigated by SIMONSet al. (1952). Considering that the ionic strength in the experiments of SIMONS et al. (1952) varied from 13.8 for theNaBr endmember experiment to 9.6 for the Naa endmemberexperiment. this is an assumption which we would have preferred to avoid. However, the Roozeboom diagram drawnin Fig. I ofSIMONS et aI. ( 1952) shows a very flat distributionof the aqueous mole-fractions of bromide against XNoB, inthe region 0.4 < XNaB, < 0.6. This strongly indicates that theNaCI-NaBr solid-solution series is close to a miscibility gapin that region, even though SIMONS et aI. ( 1952) did not findevidence of such a gap at 35°C. In turn, this means that the00 value for the solid-solution series, if a regular solid-solutionmodel is assumed, must be close to the limiting value of tlo= 2, above which a miscibility gap would be predicted. Thevalue of tlo = 2.00 ± 0.06 derived from our regular solidsolution fit, and the Qo and Q. values predicted by our subregular solid-solution fits are consistent with this observation.
A lower value of tlo (00 = l.81 ± 0.06 at 35°C) can becalculated from a linear regression (using Eqn. 2) of the distribution coefficient data of SIMONS et al, (1952) for solidphase mole-fractions between 0.280 and 0.806 (the X-raycomposition analysis of the XNaB, = 0.886 point is slightlysuspect). This regression gives a measure of the uncertaintyin using the SIMONS et aI.( 1952) data to estimate an tlo value.The ionic strength on this restricted data set varies only between 13.4 and 13.8. As a consequence, the assumption ofa constant 'YB,-/'Yo- ratio is more reasonable. Unfortunately,due partly to the fact that the ratio ofthe solid-phase activitycoefficients 'YN.D,I'YN.C1 approaches unity as XNaBt tends to0.5 (a property specific to regular solid solutions) and partly
to the lesser number of data points, restricting the data setof SIMONS et aI. (1952) in such a manner also means thatthe regression is much more sensitive to errors associatedwith individual distribution-coefficient determinations. Furthermore, skewing the regression towards the more Br-richexperiments is not a desirable procedure given our greaterinterest in the behavior of trace Br in halite. Nevertheless,the limiting NaBr activity-coefficient calculated from thisregression h'NoB, = 6.12 ± 0.39 at XNaBt = 0 at 35°C) ishigher than the value of 4 at 25°C reported by STOESSELLand CARPENTER ( 1986) and remains higher than the limitingactivity coefficient for KBr in Ka, calculated from the tlo
and Q. parameters reported in GLYNN et aI. (1990): 'YKBt=4.39 atXKD, = 0 (at 25°C). We consider the value of'YNI8,=6.12 obtained from this fit as a lower limit, given the dataofSIMONS et al. ( 1952). The limiting distribution coefficientcalculated from this regression is DB,- = 0.0134 ± 0.0009 atXN•B, = 0 (at 35°C). which is close to the overall averagedistribution coefficientof0.0 135(standard deviation = 0.004 )obtained at 40°C by LUTZ ( 1975). albeit under very differentexperimental conditions. Indeed, the difference in applicableaqueous Br/CI activities explains why the Br content atTEESIHS calculated from this latest regression is 20 ppm,still below the 30 ppm calculated by Dr. Stoessell from theresults of LUTZ ( 1975).
Trace Bromide In Halite: Survey of Existing Data
We have carefully examined the results of BRAITSCH andHERRMANN ( 1963), VALIASHKO et aI. (1976), VALIASHKOand LAVROVA (1976), HERRMANN (1980), LUTZ ( 1975;alsoreported in PUCHELT et al., 1972) and Fontes (pers. commun., 1990). Figures 2 and 3, plots ofBr" distribution coefficients in halite as a function ofXNaBt , confirm that the valuesof LUTZ ( 1975) are 2 to 3 times lower than the results ofBRAITSCH and HERRMANN (1963), HERRMANN (1972),Fontes (pers. commun., 1990) and VALIASHKO et al, (1976).Figure 3 shows that most of the fluid-inclusion data obtainedby VALIASHKO and LAVROVA ( 1976), despite much scatter,plot above the distribution coefficient data of LUTZ( 1975).Figure 2 illustrates the lowering ofobserved distribution coefficients due to the presence of MgH (or Ca) in the precipitating solution and the lack of dependence of DB, - values onK + and sol- and especially on temperature. The effect ofMg on distribution coefficients is apparent in the results ofboth DRAITSCH and HERRMANN (1963) and LUTZ (1975).The analytical uncertainty on the distribution coefficients reported by LUTZ (1975) is ±O.OO I (5% to 10% relative uncertainty). BRAITSCH and HERRMANN (1963) report an estimated error of ±5% on their results. VALIASHKO and LAv:ROVA (1976) do not report analytical error, but give amaximum of two significant figures for their distributioncoefficients.
STOESSELL and CARPENTER (1986) cited HERRMANN( 1980) for showing that "the Br content ofrapidly precipitatedhalite decreases with recrystallization, indicating a lack ofthermodynamic equilibrium." This was a reference to thefinding of HERRMANN ( 1980) that halite crystals precipitatedon the surface of evaporating seawater pans bad a higher Br

Partitioning of Br between halite andbrines 2563
10-2
**
* **e<>
*
10-5
0.020
0.050'--""'-'rTm""'-"'T'"T"TTTlT1T"""""T"'"T'TT'rmr-r....-nmTll--r-r-rTTmlA B&H+ B&H (SS°C)x B&H (SS°C)
o B&H (KCI)
tl B&H (MgC1v
o B&H (MgCI2. MgS04)
* Lutz (40°C)¢ Lutz (40°C. MgCI2)
o Fontes-0- Herrmann (surface)
¢ Herrmann (bottom)V Veta/.
<¢- V et a/. (MgClvJ:l V eta/. (MgS04))( V el a/. (CaCI2)t3 V et a/. (MgS04• MgC1v
10-'
0.040
0.010
cQ)
'u~ 0.030oUc:o
:0:::::J.c't:u;is
104 10-3
XNaBr in HaliteFIG. 2. Distribution coefficients ofNaBr in halitedeterminedby BRAITSCH and HERRMANN ( 1963), LUTZ ( 1975),
HERRMANN ( 1980).Fontes (pers. commun., 1990).andVALIASHKO etaI.(1976) undervarious experimental conditions.Unless stated otherwise. temperature is 25°C. Additional components occasionally present in the experiments arenoted in the symbol legend.
content than crystals formed and/or recrystallized at the bottom of the pans. Averages of these two sets of data fromHERRMANN ( 1980) are given in Fig. 2. The surface-formedcrystals givea slightly higher distribution coefficient comparedto the data of BRAITSCH and HERRMANN ( 1963) for crystalsforming at the beginning of halite crystallization from seawater. The bottom-formed and recrystallized crystals ofHERRMANN ( 1980) givea similar average to that ofBRAITSCHand HERRMANN (1963). In our view, the difference in dis-
tribution coefficients between surface-formed and bottomformed crystals is simply a hint that crystallization kineticsprobably influence distribution coefficients, a well-known fact(LoRENS, 1981). The general theory that faster rates of precipitation usually result in distribution coefficients closer tounity (HOLSER, 1979, p. 30 I ) seems to agree with the resultsof HERRMANN (1980). Surface-formed crystals probablyformed at a faster rate than the bottom-formed crystals. Thisdoes not, however, conclusively explain the difference between
0.060x
00 o Cambrian (Irkutskregion)
tl A Devonian (Byelorussia)
0.050 + Devonian (Pripiat Basin)
- ~x Devonian (Soligorsk)c: 0
Q) x <> Permian (GOA. Zechstein)'0 o- ~
rI%~==0.040 0 0 tl Jurassic (SETurkmenia)
~Q)
tl * -<>:65 * Cretaceous (Karlikdeposit.SETurkmenia)0J o <><> 0 <> Neogene (Precarpathian Stebnikdeposits)0.030 tl~-<> ec: CJ Quaternary (Kugltan deposit.Turkmenia).2 *CJ Q
'S XX j90- x -0 Quaternary (Lakes Inder& Kuull. Kazakhstan..0 <>'0:::: 0.020 tl e e Korabogaz Bay.Turkmenia)en +-<>is -<> <>
0.010 -<>-<> <> <>
0.00010-S 104 10-3
XNaBr in Halite
FIG.3. Distribution coefficients for NaBr in halite reported by VALIASHKO and LAvROVA (1976) from their studyof halite fluid inclusions in evaporite deposits throughout the Soviet Union and the German Democratic Republic(GDR).
2564 P. D. Glynn et at.
Trace Bromide in Sylvite: Survey of ExistIng Data
1001ll-430 L.........L.LJ.LWlL-.>.......LUW--I..........wul.---L.........woL---'-.............
1~
60
!0
55I8Mt
50 <IiI/j
~t= 45 ./1r--l
40
Figure 5 plots the experimental distribution coefficients ofBRAITSCH and HERRMANN ( 1963), LUTZ ( 1975), and VALIASHKO et al, ( 1976) for bromide in sylvite. The distributioncoefficients observed seem to increase when Mg or Ca arepresent. Sodium also seems to have a similar effect. Thiseffect is at least partly related to the increase in ionic strength,which results in higher aqueous "Yo,-/"Ya- ratios (indicatedby our PHRQPITZ results, PLUMMER et al., 1989; and alsoby NaBr and NaCI mean-activity-coefficient data in ROBINSON and STOKES, 1970, p, 492). Calculating distributioncoefficients D:,- corrected for aqueous-activity-coefficients (determined from PHRQPITZ), that is, D:,= DB,-'YB,-/'Ya-, narrows the spread of the results ofBRAITSCH and HERRMANN ( 1963) to an average D:r - ofabout 0.19 for the pure KCI-KBr-H 20 experiments (ionicstrength 4.7) and 0.22 for solutions containing Na (ionicstrength 7.5). Solutions containing either Mg or Mg and Ca
35
t~ t()-2 10-1
XNaBror Xer,aq
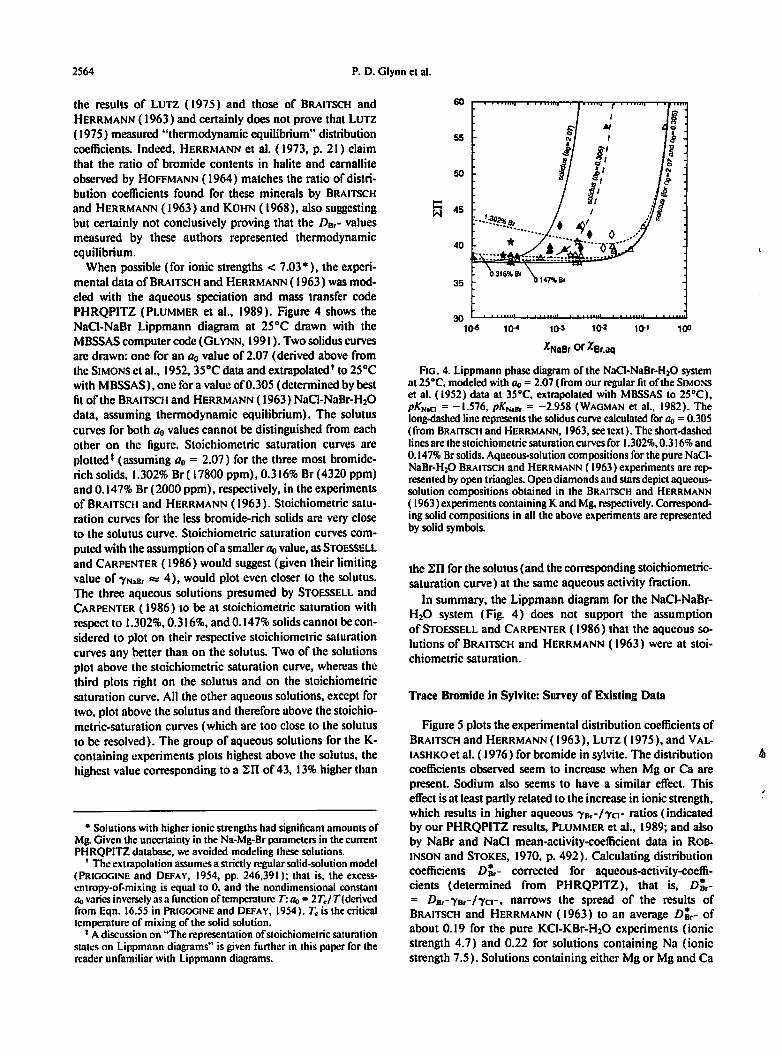
FIG.4. Lippmann phase diagram of the NaCI-NaBr-H20 systemat 25°C, modeledwith tlo = 2.07(from our regularfit of the SIMONSet al. (1952) data at 35°C, extrapolated with MBSSAS to 25°C),pKNaCI = -1.576, pKNaBr = -2.958 (WAGMAN et al., 1982). Thelong-dashed line represents the soliduscurvecalculated for tlo = 0.305(from BRAIl'SCH and HERRMANN, 1963,seetext). The short-dashedlinesare the stoichiometricsaturation curvesfor 1.302%,0.316% and0.147% Brsolids.Aqueous-solution compositionsfor the pure NaClNaBr-H20 BRAITSCH and HERRMANN ( 1963)experiments are representedbyopen triangles. Opendiamonds and starsdepictaqueoussolution compositions obtained in the BRAITSCH and HERRMANN( 1963)experimentscontainingK and Mg,respectively. Corresponding solid compositions in all the above experimentsare representedby solid symbols.
the In for the solutus (and the corresponding stoichiometricsaturation curve) at the same aqueous activity fraction.
In summary, the Lippmann diagram for the NaCI-NaBrH20 system (Fig. 4) does not support the assumptionof STOESSELL and CARPENTER ( 1986) that the aqueous s0
lutions of BRAITSCH and HERRMANN ( 1963) were at stoichiometric saturation.
• Solutionswith higherionic strengths had significant amounts ofMg.Given the uncertaintyin the Na-Mg-Br parameters in thecurrentPHRQPITZ database, weavoided modeling thesesolutions.
, The extrapolationassumesa strictlyregularsolid-solution model(PRtGOGINE and DEFAY, 1954, pp. 246,391); that is, the excessentropy-of-mixing is equal to O. and the nondimensional constantGo variesinversely asa function of temperatureT:Go = 2TelT (derivedfrom Eqn. 16.55 in PRIGOGINE and DEFAY, 1954). T. is the criticaltemperature of mixing of the solid solution.
t Adiscussionon "The representationof stoichiometricsaturationstates on Lippmann diagrams" is given further in this paper for thereader unfamiliar with Lippmann diagrams.
the results of LUTZ (1975) and those of BRAITSCH andHERRMANN ( 1963) and certainly does not prove that LUTZ( 1975) measured "thermodynamic equilibrium" distributioncoefficients. Indeed, HERRMANN et al, (1973, p, 21) claimthat the ratio of bromide contents in halite and carnalliteobserved by HOFFMANN ( 1964) matches the ratio of distribution coefficients found for these minerals by BRAITSCHand HERRMANN (1963) and KOHN (1968), also suggestingbut certainly not conclusively proving that the Do,- valuesmeasured by these authors represented thermodynamicequilibrium.
When possible (for ionic strengths < 7.03·), the experimental data of BRAITSCH and HERRMANN ( 1963) was modeled with the aqueous speciation and mass transfer codePHRQPITZ (PLUMMER et al., 1989). Figure 4 shows theNaO-NaBr Lippmann diagram at 25°C drawn with theMBSSAScomputer code (GLYNN, 1991). Two solidus curvesare drawn: one for an ao value of 2.07 (derived above fromthe SIMONS et al., 1952, 35°C data and extrapolated t to 25°Cwith MBSSAS), one for a value of0.305 (determined by bestfit of the BRAITSCH and HERRMANN ( 1963) NaO-NaBr-H20data, assuming thermodynamic equilibrium). The solutuscurves for both 00 values cannot be distinguished from eachother on the figure. Stoichiometric saturation curves areplotted' (assuming ao = 2.07) for the three most bromiderich solids, 1.302% Dr (17800 ppm), 0.316% Br (4320 ppm)and 0.147% Br(2000 ppm), respectively, in the experimentsof BRAITSCH and HERRMANN (1963). Stoichiometric saturation curves for the less bromide-rich solids are very closeto the solutus curve. Stoichiometric saturation curves computed with the assumption ofa smaller ao value, as STOESSELLand CARPENTER (1986) would suggest (given their limitingvalue of 'YN.B, """ 4), would plot even closer to the solutus.The three aqueous solutions presumed by STOESSELL andCARPENTER ( 1986) to be at stoichiometric saturation withrespect to 1.302%,0.316%, and 0.147% solids cannot be considered to plot on their respective stoichiometric saturationcurves any better than on the solutus. Two of the solutionsplot above the stoichiometric saturation curve, whereas thethird plots right on the solutus and on the stoichiometricsaturation curve. All the other aqueous solutions, except fortwo, plot above the solutus and therefore above the stoichiometric-saturation curves (which are too close to the solutusto be resolved). The group of aqueous solutions for the Kcontaining experiments plots highest above the solutus, thehighest value corresponding to a In of 43, 13%higher than

Partitioning of Brbetween halite and brines 2565
- 0.30c:Q)'(3:=Q) 0.250oc t::.0-.;::J 0.201-.0 +'C~C +
0.15
0.1010'5
t::. B&Ho B&H (Na)
** * B&H (Mg)
~ ° 'I\J ° B&H (Ca, Mg)
0°0 * Lutz (40°C)o Lutz (40°C, Mg/K=l)
0@
-o- Lutz (40°C Mg/K=0.55)x o Lutz (40°C, Mg/K=l.l)
x i: + Lutz (60°C)t::.6§.
<>-¢ 606 Je6 o x Lutz (60°C. Mg/K =1.1)
+¢ 8' t ~ Vet al. (Mg)
* Je Vet al. (Ca)
** • *¢
1()-4 1()-3 10-2 10'1
XKBr in Sylvite
FIG. 5. Distribution coefficients ofKBr in sylvite determined by BRAI1'SCH and HERRMANN (1963), LUTZ (1975),and VAlIASHKO et al, (1976) under various experimental conditions. Unless stated otherwise, temperature is 25°C.Additional components occasionally present in theexperiments are noted in the symbol legend.
9.5
10.
solubilities obtained by BRAITSCH and HERRMANN (1963;average:4.729 mol/kg H20 ) are consistently lower, althoughprobably in the range of uncertainty of the BRAITSCH andHERRMANN (1963) analyses. The primary objective of
1()O1()-1
A (j,
1()-3
(j,AA
1()-4
A
.~!8'1%8.........~ .••••~~4'" 8, •••••••••••..................
9.0
8.5
8.0
7.5
7.0
6.51()-5
XKBr or XBr,aq
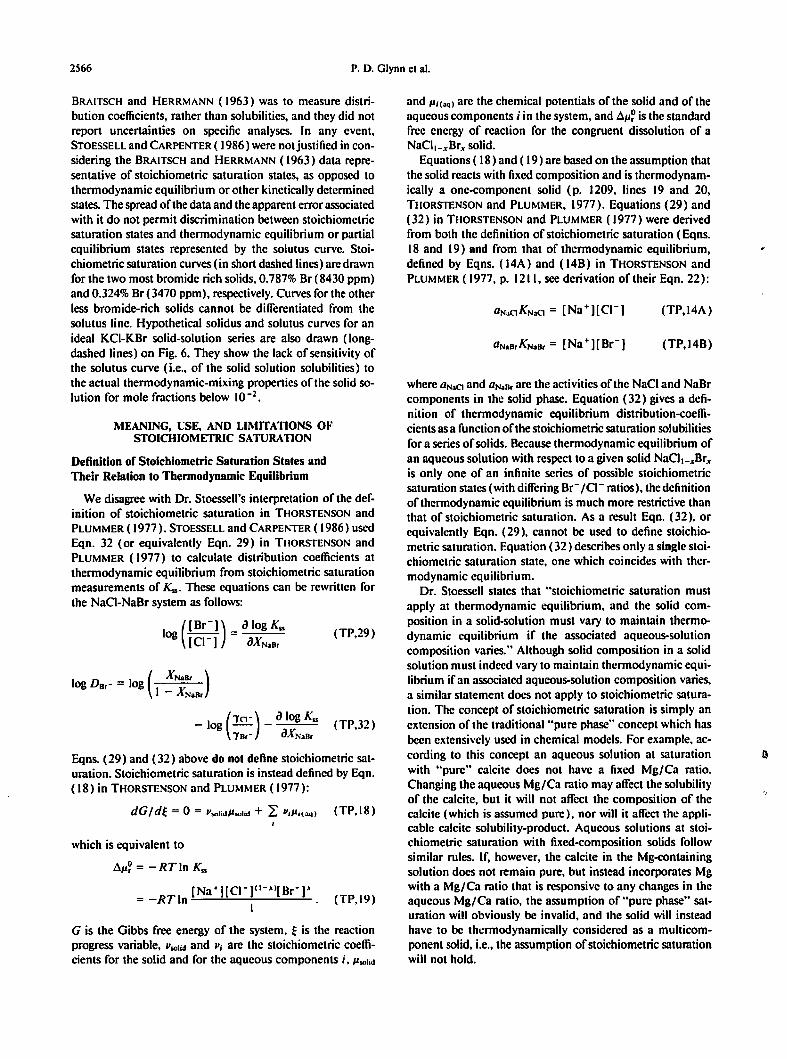
FtG. 6. Lippmann phase diagram of the KCI-KBr-H20 system at25°C, modeled with00 = 1.40, a, =-0.08, pK...o =-0.904, pKtw.= -1.129 (GLYNN et al., 1990; from data in DURHAM et al., 1953).The long-dashed curves represent thesolidus and solutus curves calculated for00= a, =O. The two short-dashed lines arethe stoichiometric saturation curves for0.787% and 0.324% Brsolids. Aqueoussolution compositions for the pure KO·KBr-H20 BRAITSCH andHERRMANN ( 1963) experiments are represented byopen triangles.Opendiamonds depict the aqueous solution compositions obtainedin Braitseh and Herrmann's experiments containing Na. Corresponding solid-compositions in all the above experiments arerepresented bysolid symbols.
had ionic strengths between 10 and 12, and therefore couldnot be reliably modeled with PHRQPITZ. The 40 and 60°Cdata of LUTZ ( 1975) seem to indicate a slight positive dependence of distribution coefficients on temperature. Reversible distribution experiments on the complete KCl-KBrseries (Busenberg, unpubl. data, 1990) give almost no dependence of Do,- on temperature between 5 and 45°C (logDo,- values extrapolated to 0% Br are -0.723, -0.796, and-0.733 at 5°C, 25°C, and 45°C, respectively; the 25°C valueis from DURHAM et al., 1953). The analytical uncertaintyon the distribution coefficients reported by LUTZ ( 1975) variesbetween I and 4% with an averagearound ±2%. BRAITSCHand HERRMANN (1963) report an estimated error of ±6%for their results.
Figure 6 is a Lippmann diagram constructed from ourpreviously modeled results of the DURHAM et al. (1953) KClKBr-H20 recrystallization experiments (GLYNN et al., 1990).The results of BRAITSCH and HERRMANN ( 1963) on sylvitecrystallization from K-CI-Br and from K-Na-Cl-Br solutionsare shown. Figure 6 shows no justification for the assumptionof STOESSELL and CARPENTER (1986) that the results ofBRAITSCH and HERRMANN ( 1963) represented stoichiometricsaturation states. All the aqueous solutions plot below thesolutus and therefore below the saturation curve for theirrespectivesolid compositions. The K-Na-Cl-Br solutions plotonly slightly (average l:n = 7.8) above the pure K-Cl·Braqueous-solutions (average l:n = 7.7). The Lippmann diagram could be adjusted by lowering the endmember solubilityproduct used for KCl from 8.013 (calculated from the 4.816mol/kg H20 solubility data of DURHAM et al., 1953, modeledby PHRQPITZ) to a lower value, so that most ofthe solutionswould plot on the solutus. The value of8.013, however,agreeswith the sylvite solubility given by LINKE ( 1965;4.811 mol/kg H20 , or KKCl = 7.992, asmodeled by PHRQPITZ). The
2S66 P. D. Glynn et al.
MEANING, I;SE, AND LIMITATIONS OFSTOICHIOMETRIC SATURATION
G is the Gibbs free energy of the system, ~ is the reactionprogress variable, llsolid and III are the stoichiometric coefficients for the solid and for the aqueous components i, P",lid
Eqns. (29) and (32) above do not define stoichiometric saturation. Stoichiometric saturation is instead defined by Eqn.(18) in THORSTENSON and PLUMMER (1977):
dG/d~ = 0 = 1'",lidP",lid + L "IPi(aql (TP,18)
'j
(TP,14B)
(TP,14A)
where aN.a and aN.B,are the activities of the NaCI and NaBrcomponents in the solid phase. Equation (32) gives a definition of thermodynamic equilibrium distribution-coefficients as a function ofthe stoichiometric saturation solubilitiesfor a series ofsolids. Because thermodynamic equilibrium ofan aqueous solution with respect to a given solid NaCh-xBrxis only one of an infinite series of possible stoichiometricsaturation states (with differing 8r-/CI- ratios), the definitionof thermodynamic equilibrium is much more restrictive thanthat of stoichiometric saturation. As a result Eqn. (32), orequivalently Eqn. (29), cannot be used to define stoichiometric saturation. Equation (32) describes only a single stoichiometric saturation state, one which coincides with thermodynamic equilibrium.
Dr. Stoesscll states that "stoichiometric saturation mustapply at thermodynamic equilibrium, and the solid composition in a solid-solution must vary to maintain thermodynamic equilibrium if the associated aqueous-solutioncomposition varies." Although solid composition in a solidsolution must indeed vary to maintain thermodynamic equilibrium if an associated aqueous-solution composition varies,a similar statement does not apply to stoichiometric saturation. The concept of stoichiometric saturation is simply anextension of the traditional "pure phase" concept which hasbeen extensively used in chemical models. For example, according to this concept an aqueous solution at saturationwith "pure" calcite does not have a fixed Mg/Ca ratio.Changing the aqueous Mg/Ca ratio may affect the solubilityof the calcite, but it will not affect the composition of thecalcite (which is assumed pure), nor will it affect the applicable calcite solubility-product. Aqueous solutions at stoichiometric saturation with fixed-composition solids followsimilar rules. If, however, the calcite in the Mg-containingsolution does not remain pure, but instead incorporates Mgwith a Mg/Ca ratio that is responsive to any changes in theaqueous Mg/Ca ratio, the assumption of "pure phase" saturation will obviously be invalid, and the solid will insteadhave to be thermodynamically considered as a multicomponent solid, i.e., the assumption ofstoiehiometric saturationwill not hold.
and PI(.q) are the chemical potentials of the solid and of theaqueous components i in the system, and I1p~ is the standardfree energy of reaetion for the congruent dissolution of aNaCII-xBrx solid.
Equations ( 18) and ( 19) are based on the assumption thatthe solid reacts with fixed composition and is thermodynamically a one-component solid (p, 1209, lines 19 and 20,THORSTENSON and PLUMMER, 1977). Equations (29) and(32) in THORSTENSON and PLUMMER (1977) were derivedfrom both the definition of stoichiometric saturation (Eqns.18 and 19) and from that of thermodynamic equilibrium,defined by Eqns, (14A) and (14B) in THORSTENSON andPLUMMER (1977, p, 1211, seederivation of their Eqn. 22):
(TP,19)
(TP,32)
(TP,29)
(')'a- ) _iJ_lo..:.g_K.=..-log - -')'Br- iJXN• B,
(XNaBr )log DB, - = log I _ x:
N.B,
which is equivalent to
11,4 = -RTln K..
[Na +][CI-]( I-X)[ Br-]X=-RTIn ~;';""":~""":'I-~---':'"
BRAITSCH and HERRMANN ( 1963) was to measure distribution coefficients, rather than solubilities, and they did notreport uncertainties on specific analyses. In any event,STOESSELL and CARPENTER ( 1986) were not justified in considering the BRAITSCH and HERRMANN ( 1963) data representative of stoichiometric saturation states, as opposed tothermodynamic equilibrium or other kinetically determinedstates. The spread ofthe data and the apparent error associatedwith it do not permit discrimination between stoichiometricsaturation states and thermodynamic equilibrium or partialequilibrium states represented by the solutus curve. Stoichiometric saturation curves (in short dashed lines) are drawnfor the two most bromide rich solids, 0.787% Br (8430 ppm)and 0.324% Br(3470 ppm), respectively. Curves for the otherless bromide-rich solids cannot be differentiated from thesolutus line. Hypothetical solidus and solutus curves for anideal KCI-KBr solid-solution series are also drawn (longdashed lines) on Fig. 6. They show the lack of sensitivity ofthe solutus curve (i.e., of the solid solution solubilities) tothe actual thermodynamic-mixing properties of the solid solution for mole fractions below 10-2
•
Definition of Stoichiometric Saturation States andTheir Relation to Thermodynamie Equilibrium
We disagree with Dr. Stoessell's interpretation of the definition of stoichiometric saturation in THORSTENSON andPLUMMER ( 1977). STOESSELL and CARPEl'TER ( 1986) usedEqn. 32 (or equivalently Eqn, 29) in THORSTENSON andPLUMMER (1977) to calculate distribution coefficients atthermodynamic equilibrium from stoichiometric saturationmeasurements of K... These equations can be rewritten forthe NaCl-NaBr system as follows:
log ([Br-]) = iJ log K..[CI-] iJXN• Br

Partitioningof Br between halite and brines 2567
"
Effect of the Solid /Solution Ratio in PredictingEquilibrium Distribution Coefficients fromStoichiometric Saturation Measurements
The assumption of an invariant solid composition is inherent in the use of Eqn. (32) to predict equilibrium distribution coefficients. The value of iJK../ iJXNaB, measured for agiven solid composition XNaB, can be used to determine theequilibrium DII<- only for that same solid composition. Inan actual experiment, however. the solid composition at stoichiometric saturation will often be different from the finalsolid composition obtained by letting the solid-solutionaqueous-solution system react to thermodynamic equilibrium. This is due to the effect of a finite solid to aqueoussolution mass ratio and was discussed in GLYNNet aI.(1990).For example, STOESSELL and CARPENTER ( 1986) calculatedequilibrium distribution coefficients by assuming that theinitially precipitated halites of BRAITSCH and HERRMANN( 1963) were at stoichiometric saturation. Most of those initialhalites contained more than 100 ppm Br. Therefore, in strictterms, the distribution coefficients calculated by STOESSELand CARPENTER ( 1986) should only be applied to haliteswith more than 100 ppm Br at thermodynamic equilibrium,although "YNaO, is probably constant at those very low molefractions.
Applicability of the Stoichiometric Saturation Concept toPrecipitation Processes
In our opinion, the concept of stoichiometric saturationcannot be applied to precipitation processes. Our first argument was originally stated by LAFON (1978):
To apply "stoichiometricsaturation" to geochemical reactions,we must have independent. a priori knowledge of the composition of the solid.x, and wemust alsobeassuredthat x remainsstrictly invariable during the evolution of our system. Therehave to be identified.well-understood mechanismsthat ensurethe constancyof x. Thesetwo indispensable conditionsare veryrestrictive. In a natural environment. wedo not generally knowbeforehand what composition of a solid-solution willprecipitatefrom aqueous-solution. ifwediscard the criterionof stableequilibrium.
As we stated in our paper (GLYNN et al., 1990, p, 275),we believe there is no basis for the claim of STOESSELL andCARPENTER ( 1986) that stoichiometric saturation not onlycontrolled the initial aqueous phase compositions of the precipitating solutions, but also controlled the bromide contentin the solid. In order to predict the composition of the solidphase at stoichiometric saturation, both the aqueous-activityfraction Xo,,aq and the ~n value of the aqueous solution (orequivalently, the ion activity products [Na+ ) [Br" ) and [Na +)
[CI-]) would have to be known a priori. Furthermore, theKss stoichiometric saturation constant would also have to beknown as a function of solid composition. This is evidentfrom Eqn, (15) in our paper (GLYNN et al., 1990).
As can be seen on any ofour Lippmann diagrams, aqueoussolutions at stoichiometric saturation arc always supersaturated with respect to one or more solid solutions, unless ofcourse they also happen to be at thermodynamic equilibrium.There are many factors capable ofinlluencing the ~n value,
or the degree of supersaturation, obtained after a length oftime in a precipitation process, such as the presence ofvariousnucleating agents (scratches in glassware, dust, seed crystals.etc.) and surface poisons as well as the formation of polymorphous phases and solid solutions. There is currently noexperimental evidence to suggest that a precipitating solutionwill undergo a significant precipitation rate decrease as itcrosses a stoichiometric saturation state. Indeed, aqueous s0
lutions at stoichiometric saturation are often very highly supersaturated with respect to a series of solid-solution compositions and endmember solids (for examples see Fig. 2bin GLYNN, 1989; or Fig. I in GLYNN et al., 1990).
Stoichiometric saturation curves often cross one another.An aqueous solution at stoichiometric saturation with respectto one solid may also be at stoichiometric saturation withrespect to another solid composition. Which solid composition would be predicted to form? Should it be the solid withthe lowest free energy or the solid with the highest free energyas is often found according to Ostwald's step rule, or shouldit be some other intermediate solid? (see PUTNtS andMCCONNELL, 1980, pp. 97-98, for a discussion ofthe Ostwaldstep rule). We believe that the answer is dictated by kineticphenomena beyond the scope of the stoichiometric saturationconcept.
Use and Limitations of StoichiometricSaturation Measurements
Although we do not believe the concept of stoichiometricsaturation to be applicable to the description ofprecipitationprocesses. the concept has been applied successfully in theinterpretation of solid-solution dissolution experiments inboth stoichiometric (PLUMMER and BUSENBERG, 1987;BUSENBERG and PLUMMER, 1989; Glynn, unpub. data on(Ba,Sr)COJ solids) and nonstoichiometric solutions (PLUM.MER et al., 1992; GAUNIER et al., 1989; WALTER and MORSE,1984; MACKENZIE et al., 1983). There are many practicallimitations, however. to the use of the stoichiometric saturation concept even in dissolution processes.
The Lippmann diagrams in Figs. 4 and 6 illustrate the factthat small amounts (X < 10-2 approximately) of isomorphously substituted impurities cannot by themselves causean experimentally measurable increase in the observed solubility ofa solid, even if the solid dissolves to stoichiometricsaturation. Measurement of stoichiometric saturation statesis a useful tool for determining thermodynamic mixing properties, but only in cases where a series of solids with a significant range ofsolid-solution miscibility can be synthesized.Furthermore, dissolution of a solid solution to a state closeto stoichiometric saturation requires that the original solidmust not undergo significant recrystallization. The recrystallization rate or the rate ofprecipitation ofsecondary solidsmust be low. Similarly, the amount of initial solid present inthe experiment must be high in order for its dissolution tocontrol the saturation state of the aqueous solution; that is,the experiment must be solid-controlled. PLUMMER et al,( 1992) give further detail on the experimental conditionswhich enhance the approach to stoichiometric saturation:"I) high surface area/solution ratios, 2) nonstoichio-

2568 P. D. Glynn et al.
metric solutions biased with an excess of the more soluble endmember component [demonstrated also byGA-L1NIER et al., 1989], 3) a trace inhibitor to minimizenucleation of secondary precipitates, and 4) well-characterized homogeneous solids."
For all the above reasons, measurement of stoichiometricsaturation states does not seem to be an adequate tool fordetermining the thermodynamic mixing properties ofhighlysoluble solid solutions such as the NaO-NaBr series, especiallyin the caseof solids with trace bromide levels. Achievementofthermodynamic equilibrium seems to be the only methodfor determining "equilibrium" distribution coefficients fortrace bromide in halite or in sylvite. Such experiments mustprove attainment of thermodynamic equilibrium. This canbe achieved either by the method ofduplicate complexes or,in the caseof trace amounts ofsubstitution, by using an isotope tracer to document the complete recrystallization of thesolid phase and its equilibration with the aqueous phase.!
UPPMANN PHASE DIAGRAMS AND STOICHIOMETRICSATURATION STATES
Dr. Stoessell comments on the suitability of Lippmanndiagrams to represent stoichiometric saturation states for binary solid-solutions with a trace component. He firstdescribesthe representation of thermodynamic equilibrium and stoichiometric saturation states on Lippmann diagrams. Although different symbols and terminology are used (e.g., theword solutus to describe a stoichiometric saturation curve),Dr. Stoessell essentially follows the description ofLippmanndiagrams found in GLYNN et al. (1990), GLYNN and REARDON (1990), and GLYNN (1989, 1991).
The Representation of Stoichiometric SaturationStates on Lippmann Diagrams
Lippmann diagrams are useful in representing the level ofsaturation or supersaturation ofan aqueous solution relativeto various thermodynamic states, such as the thermodynamicequilibrium and primary saturation states represented by thesolutus curve, stoichiometric saturation states for given solidsolution compositions (with one curve for each), and alsopure endmember saturation states (see GLYNN and REARDON, 1990; GLYNN, 1989, 1992; KONIGSBERGER andGAMSJAGER, 1991, 1992; Konigsberger et al., 1991).
Stoichiometric saturation with respect to a given solid canbe represented by an infinite number of aqueous solutionswith different aqueous activity fractions of the substitutingions (Br- and 0- in our systems). Consequently, the degree
§ PLUMMER ( 1986) gives a consistency test which can be used tocheck for the possible attainment of thermodynamic equilibrium.The test is based on the applicability of the Gibbs-Duhem equationto thermodynamic equilibrium states and the relation between ther:nodynamic equilibrium and stoichiometric saturation states. Unfortunately, due to a calculation error, PLUMMER ( 1986) incorrectlyconcluded that the KO-KBr-H20 data ofDURHAM et al. ( 1953) didnot represent thermodynamic equilibrium (see GLYNN et al., 1990,for the corrected analysis of the KO-KBr-H20 system).
of partitioning of a trace element between the solid andaqueous phases (i.e., the distribution coefficient) does not byitself define whether or not an aqueous-solution may be atstoichiometric saturation. Aqueous-solutions at stoichiometric saturation but not at thermodynamic equilibrium willalways be supersaturated with respect to a series of solidsolution compositions. In other words, aqueous-solutions atstoichiometric saturation but not at thermodynamic equilibrium will always plot above the solutus curve (Le., will havehigher 2:n values) on a Lippmann diagram (LIpPMANN, 1980,1982). This property is a prerequisite of stoichiometric saturation and is its most useful indicator.
Limitations of Lippmann Diagrams In RepresentingStoichiometric Saturation States?
Dr. Stoessell's discussion of the suitability of Lippmanndiagrams to represent stoichiometric saturation states beginswith the equation used to represent the array of possibleaqueous solutions at stoichiometric saturation with respectto a given solid NaCII_.Br. (Eqn. 6 in Dr. Stoessell's Comment, equivalent to Eqn, 15 in GLYNN et al., 1990):
(4)
As explained previously, the concept of stoichiometric saturation, as defined by THORSTENSON and PLUMMER ( 1977),is an extension of the "pure phase" concept and is meant todescribe special limiting thermodynamic states for solid-solution aqueous-solution systems, in which the solid reactswith fixed composition and thus can be thermodynamicallyconsidered a one-component solid. Therefore, Eqn. (4) ismeant to describe the series of(XBr,aq, 2:n) points representingthe series of possible compositions ofan aqueous-solution atstoichiometric saturation with respect to a solid NaCIa-xBrxoifixed composition x, and therefore with a fixed stoichiometric saturation constant K...
First Limiting Case: x = 0 or x = I
If the bromide mole fraction in the solid equals 0 or I,Eqn. (4) reverts to the standard solubility product equationfor pure halite or pure NaBr rewritten in terms of the 2:nand XBr,aq variables. Equation (4) then defines the array ofpossible aqueous NaO-NaBr.H20 solutions at "stoichiometric saturation" with a pure halite of fixed compositionor a pure NaBr solid orjlXed composition (see Eqns. 16and17 in GLYNN et al. 1990).
Second Umlting Case: x '!' 0 and x '!' I,X Br,aq Approaches 0 or I
If the bromide fraction in the NaC"-xBrx solid does notequal 0 or I, and if the solid can be considered a one-cornponent solid (of fixed composition), Eqn. (4) represents thearray ofpossible aqueous compositions for which the aqueous

Partitioning of Brbetween haliteand brines 2569
\
solution will be at stoichiometric saturation with respect tothe given solid. As noted in GLYNN et al. ( 1990), and as canbe easily seen from Eqn. (4), stoichiometric saturation stateswith respect to a solid NaCl._..Br.. (for which x <F 0 and x<F I) will tend towards an infinitel:ll value as XBr,aq, thebromide activity fraction of the aqueous solution, approachesoor I. Conceptually, this makes sense. Consider a SSAS system with an aqueous solution where any bromide introducedinto the aqueous solution wasimmediately removed (throughsome external mechanism) such that the bromide aqueousactivity fraction XBr.aq was always equal to O. The solubilityof solid NaBr would be infinite in such a system! Similarly,if instead we added a solid NaCl._..Br.. offixed compositionx <F 0, which somehow did not recrystallize, the solubility ofthat particular solid would also be infinite. If the system waschanged such that it had the capability to remove chlorideinstead of bromide from the aqueous solution, that is XBr.aq
wasalways equal to I, the solubility ofour solid NaCl._..Br..would still be infinite. This explains why stoichiometric saturation curves drawn for a given composition NaCl._..Brx
(with x <F 0 and x <F I) tend toward an infinitel:ll value ona Lippmann diagram as XBr,aq approaches either 0 or I.
What if the Solid Composition x Variesas X Br.aq Approaches O?
In his Comment, Dr. Stoessell discusses the use of Eqn.(4) when the solid is nor ojfixed composition but insteadchanges as XBr,aq approaches O. However, if the solid is continuously changing its composition by recrystallizing itself,then of course the stoichiometric saturation concept cannotreally be considered applicable.
One possibility, previously discussed in GLYNN et al.( 1990) could be that the recrystallization process reflected aseries of metastable equilibrium states in which the distribution of bromide and chloride between the solid andaqueous phases was representative of that at thermodynamic equilibrium, although their total activities in theaqueous solution (that is their l:ll values) did not reflectthermodynamic equilibrium.
Another possibility, closer to what Dr. Stoessell suggestsin his Comment and in STOESSELL and CARPENTER ( 1986),is that the evolution of the SSAS system towards thermodynamic equilibrium could occur essentially along a continuum ofdiscrete stoichiometric saturation states, each definedby their own characteristic solid and aqueous compositions.The only problem with this scenario is that for any givensolid composition x along the way, an infinity of XBr."'l
aqueous fractions and l:ll values could represent stoichiometric saturation. So another equation is needed if a singlepathway to equilibrium is to be allowed. If we assume that,in addition, the path to equilibrium is controlled by a thermodynamic equilibrium distribution coefficient, then essentially the assumption of stoichiometric saturation becomessuperfluous, because as shown in GLYNN et al, ( 1990) a singlepath can already be defined if an equilibrium distribution isassumed. The only possible variation of that path will dependon whether the solid can be thought ofas capable ofinfinitely
fast (Berthelot-Nemst precipitation) or infinitely slow(Doerner-Hoskins precipitation) recrystallization at eachpoint along the way.
Furthermore, we disagree with Dr. Stoessell's statementthat the aqueous activity fraction XBr,aq of a solution willapproach zero in the precipitation oftmce amounts ofNaBrin halite. Instead as halite precipitates, the NaBr componentwill tend to concentrate in the aqueous solution, thereby increasing rather than decreasing its XBr,aq value (which is whyDr. Stoessell's later statement that x < XBr,aq is correct).
Third Umiting Case: x =0 and X Br.aq =0
We agree with Dr. Stoessell that if both XBr,aq and x areequal to 0, then (XBr.aq)" = 0 0 = I and Eqn. (4) does indeedreduce to the solubility product expression for pure halite,l:ll = KN&o. This result is not at all incompatible with thefact that for a solid offixed composition x <F 0 (regardless ofhow small x is as long as x <F 0), aqueous-solutions at stoichiometric saturation with respect to that solid will tend towards an infinitel:ll value; that is, towards an infinite solutecontent as XBr,aq is made to approach O. This infinite solutecontent is not an artifact of Lippmann diagrams, as Dr.Stoessellclaims in his Comment, but is instead a consequenceof the concept of stoichiometric saturation, In reality, thisparticular behavior may not be observable, because theaqueous solution may not necessarily maintain stoichiometricsaturation with respect to that initial composition, but mayinstead precipitate another composition (and mayor maynot then achieve stoichiometric saturation with respect tothat new solid composition). This is not in any way a problemrelated to the depictive capabilities of Lippmann diagrams.
Figures 4 and 6 also show that if a stoichiometric saturationcurve is drawn for some solid of composition x, where x isclose to 0, but does not equal 0, the curve will not climbsharply towards an infinite Sfl value until the XBr."'l activityfmction of the solution is many orders of magnitude smallerthan x. Instead, the stoichiometric saturation curves drawnin Figs. 4 and 6 are close to the equilibrium solutus curve,and to the pure NaCI and pure KCI curves, over a wide rangeofXBr,aq values (at least 3 orders ofmagnitude). This behavioris not a limitation of Lippmann diagrams. Instead, it simplyreflects the fact that the solubility (or free energy) of a solidis not significantly affected by a trace amount of impurity,which is why attempting to measure stoichiometric saturationsolubilities is uselesson solid solutions with trace components.For this reason, the assumption of STOESSELL and CARPEN.TER (1986) that stoichiometric saturation states had beenobtained in the precipitation experiments of BRAITSCH andHERRMANN ( 1963) cannot be justified.
SUMMARY AND CONCLUSIONS
I) Least-squares fits of the equilibrium log DBr- vs, XNaBr
data of SIMONS et al. ( 1952) on the NaO-NaBr-NaOHH20 system give limiting values at 35°C of "YN&Br = 7.4for a regular solid-solution model and of "YNaBr = 8.8 for

2570 P. D. Glynn et aI.
a subregular solid-solution model, instead of the value of13 previously reported in GLYNN et aI. ( 1990) from anextrapolationof the 'YNnBrvaluescalculatedby KJRGINTSEVand TRUSHNIKOVA ( 1966). The Br contents of halite atequilibrium with seawater at initial halite saturation, calculated from the regular and subregular fits, are 17 ppmand 14 ppm, respectively. These valuesremain belowthe30 ppm content calculatedby Dr. Stoessell from the resultsof LUTZ (1975) and the 27 ppm content predicted bySTOESSELL and CARPENTER (1986). Similarly, the fitted'YNaBr valuesare higher than the value of 'YNaBr =4 determined by STOESSELL and CARPENTER ( 1986). Our 'YNaBr
resultsalso remain higher than the valueof 4.4 calculatedfor the limitingactivity-coefficient of KBr in KCI (GLYNNet al., 1990), in accordance with the theory (KIRGINTSEVand TRUSHNIKOVA, 1966;URUSOV, 1974) that the energyrequired to substitute the Br" ion in the halite latticeshould begreater than the energyrequired for substitutioninto the wider sylvite lattice.
2) A survey of published data for trace bromide in haliteshows a wide spread in reported distribution-coefficientsand an especially significant differencebetweenthe lowervalues obtained by BLOCH and SCHNERB (1953), PUCH·ELT et aI. (1972), LUTZ (1975) and the higher valuesofBRAI1"SCH and HERRMANN (1963), KOHN (1968),HERRMANN (1972), HERRMANN (1980), MCCAFFREYet aI. ( 1987), VALIASHKO et al, ( 1976), VALIASHKO andLAvROVA (1976), and Fontes (pers. cornrnun., 1990).High-quality experimental work needs to be conductedto conclusively determine the thermodynamic mixingpropertiesof both Na(CI,Br)and K(CI,Br)solid-solutionseries at very low mole fractions of bromide. Proof ofthermodynamic equilibrium must be obtained. The measurement of stoichiometric saturation states for such lowbromide mole fractions ( 100ppm or lower) is not practical, given the predicted insensitivity of measured solubilities on the bromide mole fractions. The Lippmanndiagrams of the Na(CI,Br) and K(CI,Br) solubilities obtained by BRAITSCH and HERRMANN ( 1963)giveevidenceof the spread of the data and of the impossibility to associate it with and/or to discriminate between stoichiometric saturation and thermodynamic equilibrium statesat low Br mole-fractions (below 10-2 ) .
3) There is no basis for the assumption of STOESSELL andCARPENTER ( 1986) that the BRAITSCH and HERRMANN( 1963) NaCI.NaBr-H20 and KCI-KBr-H20 results representedstoichiometric-saturation states.This is portrayedin our Lippmann diagrams of these systems. The STOES·SELL and CARPENTER ( 1986) calculation of a 'YNaDt valuefor trace bromide in halite which agrees with the distribution-coefficient data of LUTZ ( 1975) could verywellbefortuitous. In any case, this agreement must be evaluatedin light of the discrepancy between Lutz' results and thehigher distribution coefficients obtained by Fontes (pers.commun., 1990) and many other researchers, and also inlightof our own results (higher 'YNan" lowerDBr- ) obtainedfrom the SIMONS et aI. (1952) equilibriumdata. Similarly,the value of 'YKBr in sylvite calculated by STOESSELL and
CARPENTER ( 1986) does not agree with the equilibriumdata of DURHAM et aI. ( 1953) and does not support theirassumption of stoichiometric saturation in the BRAITSCHand HERRMANN ( 1963) KCI-KBr-H20 experiments.
4) Lippmann diagrams are useful tools in depicting stoichiometric saturation, endmember saturation, and thermodynamic equilibrium states in binary-solid-solutionsystems. Lippmann diagrams can contribute to a betterunderstanding of the thermodynamics of such systems,even in the caseof systemswith a trace component. Smallamounts (X < 10-2 approximately) of isomorphouslysubstituted impurities typically cannot, by themselves,cause an experimentally measurable increase in the observed solubility of a solid, even if the solid dissolves tostoichiometric saturation. As a result, the measurementof stoichiometric saturation states is only a useful tool incases where a series of solids with a significant range ofsolid-solution miscibilitycan be synthesized. Asa furtherconstraint, recrystallization and secondary precipitationmay inhibit approaching the stoichiometric saturationstates desired in an experiment.
5) As previouslystated in Gt,YNN et aI. ( 1990), we disagreewith the claim OfSTOESSELL and CARPENTER ( 1986) thatstoichiometric saturation not only controlled the initialaqueous phasecompositionsof the precipitating solutions,but alsocontrolledthe initialbromidecontent of the solids.THORSTENSON and PLUMMER'S ( 1977) definitionof stoichiometric saturation states and their relation to thermodynamicequilibrium isreexamined here.The conceptof stoichiometric saturation can be very useful in interpreting solid-solutiondissolution experiments and in obtaining solid-solution, excess-free energies, under properexperimental conditions. Nevertheless, its applicabilitytothe interpretation of precipitation processes is questionable. Stoichiometric saturation states with respect to agivensolidare representedby an infinite rangeofaqueousBr- /CI- ratios, thereforealso requiringcontrol of the 2:llvalue (and solid-solution, thermodynamic-mixing properties) in order to fix solid phase compositions. Furthermore, a given aqueous-solution may be at stoichiometricsaturation with as many as two different solid-compositions (in a binary solid-solution system). Solidcompositions in precipitatingsolutions are more likelyto be controlled by other kinetic phenomena than simply bystoichiometric saturation.
Acknowledgments-We are mostgratefulto Gary Cygan,BlairJones,and Don Thorstenson of the US Geological Survey and WilliamHolser (Cornell University) for having significantly improved thispaper through their reviewsand discussionswith us. We also thankWilliam Bischolf(Wichita State University) and Lynn Walter (University of Michigan) for their constructive reviews. We are greatlyindebted to Nora Tamberg (USGS) for her help in obtaining andtranslating the anicles by VALIASHKO et aI.(1976)and VALIASHKOand LAVROVA (1976). Finally, we thank Dr. Lippmann and theUniversityof TUbingen for providing a copy of the Ph.D. thesis ofLUTZ (1975).
Editorial handling: G. Faure

Partitioning of Br between halite and brines 2571
\
REFERENCES
BLOCH M. R. and SCHNERB (1953) On the crIBr- ratio and thedistribution ofBr-ions in liquids and solidsduring the evaporationof bromide-containing chloride solutions. Bu/l. Res. Council ofIsrael3, 151-158.
BRAITSCH O. and HERRMANN A. G. ( 1963) Zur Geochemie desBromsin salinarenSedimenten.Teill: Experimentelle Bestimmungder Br-Verteilung in verschiedenen natUrlischen Salzsystemen.Geochim. Cosmochim. Acta 27, 361-391.
BUSENBERG E. and PLUMMER L. N. (1989) Thermodynamics ofmagnesiancalcitesolid-solutions at 25°C and I atm. total pressure.Geochim. Cosmochim. Acta 49, 713-725.
DURHAM G. S., ROCK E. J., and FRAYN S. F. ( 1953)Solid solutionsof the alkali halides. I. The systems KBr-KCI-H20 , RbBr-RbClH20 , RbBr-KBr-H20 at 25°. J. Amer.Chem.Soc.7S, 5793-5794.
GALINIER C., DANDURAND J.. and SCHorr J. ( 1989)Sur Iecaraeterenon-ideal des solutions solides (Ba,Sr)SO.: Mise en evidence etdetermination des parametres thermodynamiques par des essaisde dissolution a25°C. c. R. Acad. Sci. 308, 1363-1368.
GLYNN P. ( 1989) Modeling solid-solution reactions in low temperature aqueous systems. In Modeling in AqueousSystems II (ed,D. C. MELCHIOR and R. L. BASSEn); Amer. Chem. Soc. Symposium Ser.416, 74-86.
GLYNN P. D. (1991) MBSSAS: A code for the computation of Margulesparametersand equilibrium relations in binary solid-solutionaqueous-solution systems. Compo Geosci. 17,907-966.
GLYNN P. D. and REARDON E. J. (1990) Solid-solution aqueoussolution equilibria: Thermodynamic theory and representation.Amer. J. Sci. 278(2), 164-201.
GLYNN P. D. and REARDON E. J. (1992) Reply to a Comment byK<lnigsberger E. and Gamjager H. on "Solid-solution aqueoussolution equilibria: Thermodynamic theory and representation."Amer. J. Sci. 292, 215-225.
GLYNN P. D., REARDON E. J., PLUMMER i, N., and BUSENBERG E.(1990) Reaction paths and equilibrium end-points in solid-solutionaqueous-solution systems. Geochim. Cosmochim. Acta 54, 267282.
GUGGENHEIM E. A. ( 1937)Theoretical basisof Raoult's law. Trans.Faraday Soc. 33,151-159.
GUGGENHEIM E. A. (1952) Mixtures. Clarendon Press.HERRMANN A.G. ( 1972) Bromine distribution coefficients for halite
precipitated from modem sea water under natural conditions.Contrib. Mineral. Petrol. 37, 249-252.
HERRMANN A. G. ( 1980) Bromide distribution between halite andNaCi-saturated seawater. Chem. Goo/. 28, 171-177.
HERRMANN A.G., KNAKE D., SCHNEIDER J., and PETERS H. ( 1973)Geochemistry of modem seawaterand brines from salt pans: Maincomponents and bromine distribution. Comrib. Mineral. Petrol.40,1-24.
HOFFMANN R. O. ( 1964) Die diadoch eingebarllen Spurenelememein den Kalisalzen des Staj3fllrt Kali/agers Miueldeutschlands. insbesondere das Vorkommen und die Verteilung des Rubidiums.Inaugural-Dissertation, Humboldt-Universitat, Berlin.
HOGFELDT E. (1982) Stabilit}, Constants ofMetal-Ion Complexes.Pan A: Inorganic Ligands; IUPAC Chemical Data Series No. 21.Pergamon Press.
HOLSER W. T. (1979) Trace elements and isotopes in evaporites. InMarine Minerals (ed. R. G. BURNS); Mineral. Soc. Amer.ShonCourse Notes6. pp. 295-346.
KIRGINTSEV A. N. and TRUSHNIKOVA L. N. ( 1966)Thermodynamicsof MCI-MBrsolid solutions. Russ. J. Inorg. Chem. II, 12501255.
KONIGSBERGER E. and GAMJAGER H. ( 1991) Graphical representation of solid-solute phase equilibria inaqueous solution. Ber.Brmsengesellschafl Physikal. Chem. 95,734-737.
KONIGSBERGER E. and GAMSJAGER H. ( 1992)Comment on "Solidsolutionaqueous-solution phaseequilibria:Thermodynamic theoryand representation" by Glynn P. D. and Reardon E. J. Amer. J.Sci. 292, 199-214.
KONIGSBERGER E., HAUSNER R., and GAMJAGER H. (1991) Solidsolute phaseequilibriain aqueous-solution.V: The SYstem CdCOrCaCOJ·H20 . Geochim. Cosmochim. Acta 55,3505-3514.
KOHN R. ( 1968)Geochemistryof the German potash deposits. Geol.Soc. Amer. SpecialPaper88,427-504.
LAFON G. M. ( 1978) Discussion of "Equilibrium criteria for twocomponent solids reacting with fixed composition in an aqueousphase-example: The magnesiancalcites."Amer.J. Sci. 274, 14551468.
LINKE W. F. (1965) Solubilities of Inorganic and Metal-OrganicCompounds. 4th ed., Vol. 2. Amer. Chern. Soc.
LIPPMANS F. ( 1980)Phase diagramsdepicting the aqueous solubilityof binary mineral systems. N. Jahrb. Abh. 139, 1-25.
lJpPMANN F. (1982) Stable and metastable solubility diagrams forthe system CaCOrMgCO)-H20 at ordinary temperature. BIII/.Mineral. 105, 273-279.
LoRENS R. B. ( 1981) Sr, Cd, Mn and Co distribution coefficients incalcite as a function of calcite precipitation rate. Geochim. Cosmochim. Acta 45, 553-561.
LUTZ F. ( 1975) Die Verteilung von Bromide in gezUchten und natUrlichen chloridischen Salzmineralen. Ph.D. dissertation, Univ.of TUbingen.
MACKENZIE F. T., BISCHOFF W. D.• BISHOP F. C., LoIJENS M.,SCHOONMAKER J••and WOLLAST R. (1983) Magnesian calcites:low-temperature occurrence, solubility and solid-solution behavior. In Carbonates: Mineralogy and Chemistry(ed. R. J. REEDER);Reviewsin Mineralogy I I, 97-144.
MceAFFREY M. A., LAZAR B.• and HOLLAND H. D. (1987) Theevaporation path of seawater and the concentration of Br" andK+ with halite. J. Sediment. Petrol. 57,928-937.
McINTYRE W. L, (1963) Trace element partition coefficients-areviewof theoryand applicationsto geology. Geochim. Cosmochim.Acta 27,1209-1264.
PLUMMER L. N. (1986) Approach to equilibrium in solid-solutionaqueous-solution systems:The KCI-KBr-H20 system at 25°C. InGeochemical Processes at MineralSurfaces (ed. J. A. DAVIS andK. H. HAYES); Amer.Chem. Soc. SymposillmSer.323, 561-573.
PLUMMER L, N. and BUSENBERG E. (1987) Thermodynamics ofaragonite-strontianite solid solutions: Results from stoichiometricdissolution at 25 and 76°C. Geochim. Cosmochim. ActaSI,13931411.
PLUMMER i, N., PARKHURST D.L., FLEMING G. W. and DUNKLES. A.( 1989)A Computer Program Incorporating Pitzer's Equationsfor Calculation ofGeochemical Reactions in Brines. USG S WaterResources Im'estigalions Report88-4/5J.
PLUMMERL. N., BUSENBERGE.,GLYNN P.D.,and BLUMA.( 1992)Dissolution of aragonite-strontianite solid-solutions in non-stoichiometric Sr(HCO)2Ca(HCO)h-eOrH20 solutions. Geochim.Cosmochim. Acta 56 (in press).
PRIGOGINE I. and DEFAY R. (1954) Chemical Thermodynamics.Longmans, Green & Co ltd.
PUCHELT H., LUTZ F., and SCHOCK H. H. (1972) Verteilung vonBromidzwischenLosungenund chloridischenSalzmineralen.Naturwiss. 59, 34-34.
PuTNIS A. and MceONNELL J. D. C. (1980) Principles ofMineralBehaviour. Blackwell.
ROBINSON R. A. and STOKES R. H. ( 1970) Electrol}"te Solutions.Butterworth & Co.
SIMONS E. t., ORLICK C. A., and VAUGHAN P. A. (1952) A studyof the solubility limits at 35° in the system NaBr-NaCI. J. Amer.Chem. Soc. 74, 5264-5266.
STOESSELL R. K. ( 1992) Comment on "Reaction paths and equilibrium end-points in solid-solution aqueous-solution systems" byP. D. GLYNN, E. J. REARDON, L. N. PLUMMER, and E. BUSENBERG. Geochim. Cosmochlm. Acta 56, 2555-2557 (this issue).
STOESSELL R. K. and CARPENTER A. B. ( 1986) Stoichiometric saturation testsofNaCl1_...Brx and KCI1_...Br.... Geochim. Cosmochim.Acta50, 1465-1474.
THORSTENSON D. C. and PLUMMER t, N. (1977)Equilibrium criteriafor two-component solids reacting with fixed composition in an

2572 P. D. Glynn et al,
aqueous-phase; example: The magnesian calcites. Amer. J. Sci.277, 1203-1223.
URUSOV V.S. ( 1974) Energetic criteria for solidsolution miscibilitygap calculations.Bull. Mineral. 97,217-222.
VALIASHKO M. G. and LAvROVA L. N. (1976) On some new possibilitiesof the treatment ofbromide/chloride relationsin the investigation of the conditionsof formation of saltdeposits(in Russian).In Bromine inSaltDeposits andSohuions asa GeochemicalIndicator oftheirGenesis. History andProspecting Indications (ed,V. I. BoRJSENKOV et al.); lzd. Moskovskogo Universiteta, 343353.
VALlASHKO M.G., ZHEREBETSOVAI. K.,LAVROVA L. N.,and KHAO
U·BJ (1976) On the distribution of bromide between crystallinesaltsand solutionsof variouscompositionsand concentrations(inRussian). In Bromine in Salt Deposits and Solutions as a Geochemical Indicator of their Genesis, History and ProspectingIndications (ed. V. I. BoRISENKOV et al.); Izd. MoskovskogoUniversiteta.381-407.
WAGMAN D. D., EVANS W. H., PARKER V. B., SCHUMM R. H.,HALOW I., BAILEY S. M., CHURNEY K. L., and NUTTALL R. L.( 1982) The NBS tables of chemical thermodynamic properties.Selected valuesfor inorganicand C. and Czorganicsubstances in51 units. J. Phys. Chem. Ref. Data 11 (Suppl. 2).
WALTER L. M. and MORSE J. (1984) Magnesian calcitestabilities:A reevaluation. Geochim. Cosmochim. Acta48, 1059-1069.
,I.