Comment concilier l'étude des processus régulant la ...
115
H ABILITATION à D IRIGER LES R ECHERCHES Ecole doctorale SIBAGHE Comment concilier l’étude des processus régulant la biodisponibilité des éléments nutritifs et l’innovation agro-écologique et industrielle Soutenance publique le 10 avril 2015 devant le jury composé de : Mme HOUOT Sabine, Directrice de Recherche, INRA, HDR, rapporteur Mme JAFFREZIC Anne, Maître de Conférences, Agrocampus Ouest, rapporteur M. CRIQUET Stéven, Maître de Conférences, Université de Marseille, HDR, rapporteur Mme ELBAZ POULICHET Françoise, Directrice de Recherche, CNRS, HDR, représentant de l’ED SIBAGHE Mme BERTRAND Isabelle, Chargée de Recherche, INRA, HDR, examinatrice M. HINSINGER Philippe, Directeur de Recherche, INRA, HDR, examinateur Présentée par : Edith LE CADRE – BARTHELEMY, Maître de conférences Montpellier SupAgro
-
Upload
khangminh22 -
Category
Documents
-
view
3 -
download
0
Transcript of Comment concilier l'étude des processus régulant la ...

HABILITATION à DIRIGER LES RECHERCHES
Ecole doctorale SIBAGHE
Comment concil ier l ’étude des processus régulant la biodisponibil ité
des éléments nutrit ifs
et
l ’ innovation agro-écologique et industrielle
Soutenance publique le 10 avri l 2015 devant le jury composé de : Mme HOUOT Sabine, Directrice de Recherche, INRA, HDR, rapporteur Mme JAFFREZIC Anne, Maître de Conférences, Agrocampus Ouest, rapporteur M. CRIQUET Stéven, Maître de Conférences, Université de Marseille, HDR, rapporteur Mme ELBAZ POULICHET Françoise, Directrice de Recherche, CNRS, HDR, représentant de l’ED SIBAGHE Mme BERTRAND Isabelle, Chargée de Recherche, INRA, HDR, examinatrice M. HINSINGER Philippe, Directeur de Recherche, INRA, HDR, examinateur
Présentée par :
Edith LE CADRE – BARTHELEMY, Maître de conférences Montpellier SupAgro

2
A mes enfants, mes petites lumières…

3
Avant propos

4
Ce dossier est déposé pour candidater à l’Habilitation à Diriger les Recherches. Dans ce document, je présente mes travaux de recherches, mes activités d’enseignement et d’animation collectives car il est ne m’est pas possible de décorréler arbitrairement les deux. Les travaux d’enseignement et de recherche sont le bilan de 9 années d’activité. C’est une durée suffisamment longue qui permet de dégager des constantes de profil et de mûrir une réflexion stratégique. Le document présent est composé de 5 parties :
- présentation et curriculum vitae (page 7) ; - présentation de cinq publications marquantes (page 13) ; - synthèse des travaux. Après une brève présentation de ma problématique générale et de son
contexte scientifique, je décris ma démarche, les concepts et mes principaux résultats (page 19) ;
- réflexion sur les activités de recherche et d’enseignement en lien avec la partie précédente (page 43) ;
- projet scientifique (page 46) Mon dossier est complété par des annexes décrivant les encadrements doctoraux et post doctoraux.

5
Remerciements Je voudrai remercier les différentes personnes de mon jury ayant accepté de rapporter et d’examiner ce document et d’être présentes à la soutenance. Je voudrai également remercier mon institution d’appartenance, Montpellier SupAgro de m’avoir recrutée puis soutenue par des financements de projets de recherche mais également en créant un environnement de travail agréable. Je tiens à souligner également l’importance de mon UMR d’affectation Eco&Sols et l’ensemble de son personnel dans la construction de mon projet de recherche. Je tiens à souligner la bienveillance de la direction de l’UMR Eco&Sols, Jean Luc Chotte, Philippe Hinsinger, Jean Michel Harmand et antérieurement Benoit Jaillard d’avoir pris en compte les contraintes des enseignants chercheurs afin de les inclure dans la vie scientifique de l’unité. Je suis particulièrement reconnaissante envers Philippe Hinsinger et Claude Plassard de m’avoir permis de développer mon projet de recherche et soutenue de différentes façons. Merci également à Yves Dudal de m’avoir lancée sur les activités enzymatiques du sol, et présentée à Emmanuel Belamie avec qui j’ai beaucoup apprécié de travailler. Je salue les conseils et avis de Isabelle Bertrand pour la rédaction de ce rapport et la remercie de ses conseils et encouragements. Merci également à Simon Boudsocq de m’avoir écoutée et donné son avis d’écologue sur mon projet de recherche. J’aimerai souligner la qualité de l’équipe pédagogique de Montpelluer SupAgro et en particulier Brigitte Brunel et Claire Marsden de l’axe 3, ainsi que Jean Louis Aznar, technicien de recherche et de formation. Je voudrai également remercier mes collègues enseignants et non enseignants du département MPRS et des autres départements. J’adresse un petit clin d’œil spécial à Anne Pellegrino, Aurélie Metay et Elena Kazakou, enseignantes chercheurs à Montpellier SupAgro. Je salue également Patrick Hermann qui m’a transmis le flambeau à Montpellier SupAgro. Je n’oublie mes collègues universitaires et en particulier Bastien Mérigot, Jehan Hervé Lignot et Catherine Moulia pour leurs échanges, et qualités humaines. Un grand merci aux étudiants de doctorat et post doctorat que j’ai co encadré. J’ai beaucoup appris à leur contact, merci pour votre confiance, et qui malgré les journées parfois longues et difficiles, n’ont jamais failli et ont fait avancer nos thématiques de recherches. Merci à Nicolas, Patrice, Christophe et Clémence. Merci également aux étudiants de M1 et M2 et CDD qui ont contribué à ce projet de recherche (Ando, Claire, Alix, Arshad, Pierre, Nicolas, Simon, Jennifer, Justine). Je n’oublie pas les étudiants de M1, M2 de Montpellier SupAgro et du master Ecosystèmes que j’ai pu encadrer ou accompagner au cours de ces dernières années … et merci à tous ceux qui ont contribué à leur manière à ce travail.

6
TABLE DES MATIERES
Avant propos .. . . . . . . . . . . . . . . . . . . . . . . . . . . . . . . . . . . . . . . . . . . . . . . . . . . . . . . . . . . . . . . . . . . . . . . . . . . . . . . . . . . . . . 3
Présentation du candidat .. . . . . . . . . . . . . . . . . . . . . . . . . . . . . . . . . . . . . . . . . . . . . . . . . . . . . . . . . . . . . . . . . . . . 7 Candidat : Edith Le Cadre ............................................................................................................... 8 Diplomes ........................................................................................................................................... 8 Projets de recherche et financements ............................................................................................ 8 Encadrement de la recherche ......................................................................................................... 9 Activités d’enseignements ............................................................................................................. 11 Animation de la recherche ............................................................................................................. 11 Activités collectives ........................................................................................................................ 12 Expertise .......................................................................................................................................... 12
Liste des travaux et 5 Publications marquantes .. . . . . . . . . . . . . . . . . . . . . . . . . . . . . . . . . 13 Liste des travaux avec identification des encadrements ............................................................. 14 Choix de 5 publications marquantes ............................................................................................ 18
Bilan des activités de recherche 2005 - présent .. . . . . . . . . . . . . . . . . . . . . . . . . . . . . . . . . 19 Problématique générale ................................................................................................................ 20 Présentation des travaux ................................................................................................................ 24
Réflexions sur l ’activité d’encadrement et de recherche ... . . . . . . . . . . . . . . . . . . 43
Projet scientif ique ... . . . . . . . . . . . . . . . . . . . . . . . . . . . . . . . . . . . . . . . . . . . . . . . . . . . . . . . . . . . . . . . . . . . . . . . . . . . 46 Quels sont les verrous de la modélisation de l’activité enzymatique dans la rhizosphère ? ... 47 Ouverture de Ma thématique de recherches vers d’autres questions de recherches ............. 49 Des envies, des idées pour le futur ............................................................................................... 50 Conclusions ..................................................................................................................................... 51
Références .. . . . . . . . . . . . . . . . . . . . . . . . . . . . . . . . . . . . . . . . . . . . . . . . . . . . . . . . . . . . . . . . . . . . . . . . . . . . . . . . . . . . . . . . 52
Annexes .. . . . . . . . . . . . . . . . . . . . . . . . . . . . . . . . . . . . . . . . . . . . . . . . . . . . . . . . . . . . . . . . . . . . . . . . . . . . . . . . . . . . . . . . . . . . 60 FICHE SYNTHETIQUE Thèse de doctorat de Christophe Trouillefou ....................................... 62 2010-2014 ........................................................................................................................................ 62 FICHE SYNTHETIQUE POST doctorat de Clémence Salome .................................................... 63 2012-2013 ........................................................................................................................................ 63 FICHE SYNTHETIQUE Thèse de doctorat de Patrice COLL ...................................................... 64 2008-2011 ........................................................................................................................................ 64 FICHE SYNTHETIQUE Thèse de doctorat de Nicolas Devau .................................................... 65 2007-2010 ........................................................................................................................................ 65

7
Présentation du candidat
8
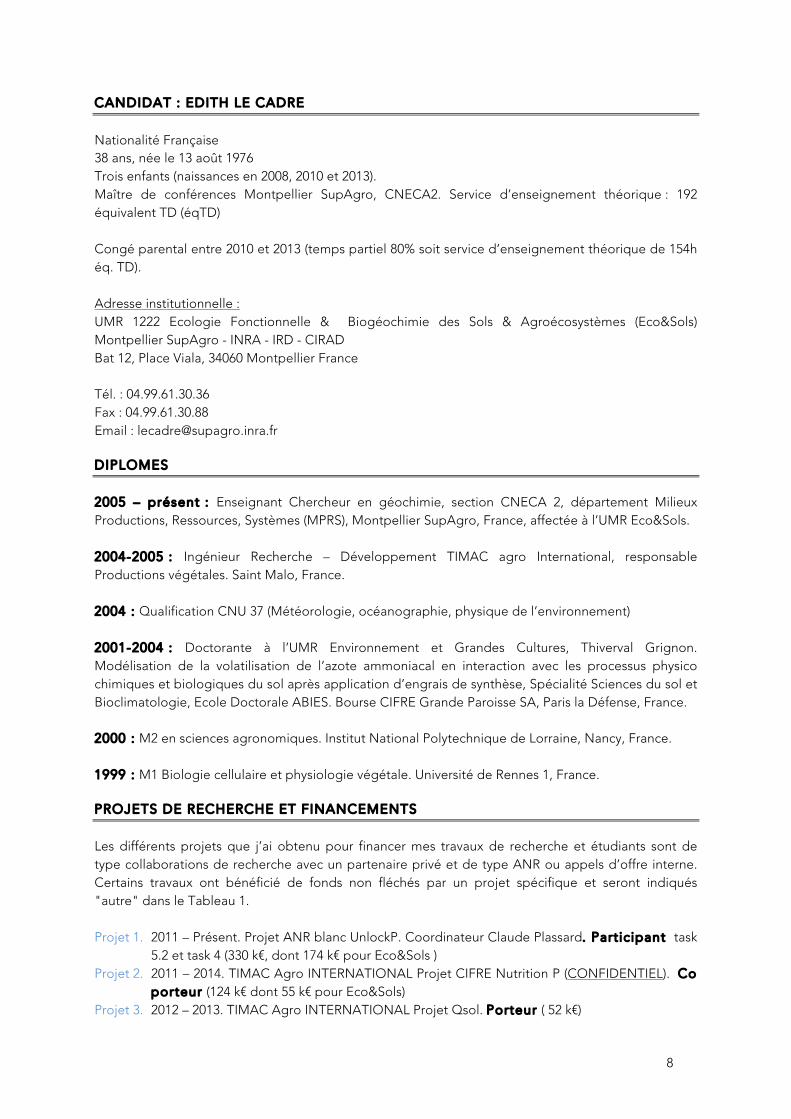
CANDIDAT : EDITH LE CADRE
Nationalité Française 38 ans, née le 13 août 1976 Trois enfants (naissances en 2008, 2010 et 2013). Maître de conférences Montpellier SupAgro, CNECA2. Service d’enseignement théorique : 192 équivalent TD (éqTD) Congé parental entre 2010 et 2013 (temps partiel 80% soit service d’enseignement théorique de 154h éq. TD). Adresse institutionnelle : UMR 1222 Ecologie Fonctionnelle & Biogéochimie des Sols & Agroécosystèmes (Eco&Sols) Montpellier SupAgro - INRA - IRD - CIRAD Bat 12, Place Viala, 34060 Montpellier France Tél. : 04.99.61.30.36 Fax : 04.99.61.30.88 Email : [email protected]
DIPLOMES
2005 – présent : Enseignant Chercheur en géochimie, section CNECA 2, département Milieux Productions, Ressources, Systèmes (MPRS), Montpellier SupAgro, France, affectée à l’UMR Eco&Sols. 2004-2005 : Ingénieur Recherche – Développement TIMAC agro International, responsable Productions végétales. Saint Malo, France. 2004 : Qualification CNU 37 (Météorologie, océanographie, physique de l’environnement) 2001-2004 : Doctorante à l’UMR Environnement et Grandes Cultures, Thiverval Grignon. Modélisation de la volatilisation de l’azote ammoniacal en interaction avec les processus physico chimiques et biologiques du sol après application d’engrais de synthèse, Spécialité Sciences du sol et Bioclimatologie, Ecole Doctorale ABIES. Bourse CIFRE Grande Paroisse SA, Paris la Défense, France. 2000 : M2 en sciences agronomiques. Institut National Polytechnique de Lorraine, Nancy, France. 1999 : M1 Biologie cellulaire et physiologie végétale. Université de Rennes 1, France.
PROJETS DE RECHERCHE ET FINANCEMENTS
Les différents projets que j’ai obtenu pour financer mes travaux de recherche et étudiants sont de type collaborations de recherche avec un partenaire privé et de type ANR ou appels d’offre interne. Certains travaux ont bénéficié de fonds non fléchés par un projet spécifique et seront indiqués "autre" dans le Tableau 1. Projet 1. 2011 – Présent. Projet ANR blanc UnlockP. Coordinateur Claude Plassard. Participant task
5.2 et task 4 (330 k€, dont 174 k€ pour Eco&Sols ) Projet 2. 2011 – 2014. TIMAC Agro INTERNATIONAL Projet CIFRE Nutrition P (CONFIDENTIEL). Co
porteur (124 k€ dont 55 k€ pour Eco&Sols) Projet 3. 2012 – 2013. TIMAC Agro INTERNATIONAL Projet Qsol. Porteur ( 52 k€)

9
Projet 4. 2011 – 2012. IMERYS Ceramics France. Feldspath et nutrition potassique des plantes. Co porteur (59 k€ )
Projet 5. 2010 – 2013. Projet AIDY (Analyse Intégrée des DYnamiques de conversion vers la viticulture biologique). Participant (total 979 k€)
Projet 6. 2011-2012 AO interne UMR Eco&Sols : Variations de la disponibilité du phosphore dans les agro-écosystèmes avec associations de plantes fixatrices et non fixatrices d’azote. Coordinateur Louis Mareschal. Participant (total 3,5 k€).
Projet 7. 2010-2011. AO interne UMR Eco&sols : Qualité des sols viticoles. Co porteur (12 k€). Projet 8. 2010-2010. Projet Encapsulation protéines (CONFIDENTIEL). Co porteur (15 k€). Projet 9. 2008-2012 ANR Systerra Perfcom Peuplements complexes performants en agriculture bas
intrants – Interaction multitrophiques et facilitation intergénotypiques. Coordinateur Philippe Hinsinger. Participant (992 k€).
ENCADREMENT DE LA RECHERCHE
Depuis 2005, j’ai encadré ou co-encadré 13 étudiants dont 3 étudiants en thèse de doctorat et 1 post doctorat. Dans le Tableau 1, je résume les principales données concernant ces encadrements.

10
Tableau 1 : Liste des étudiants encadrés depuis 2005 avec présentation de leur valorisation (articles dans des revues internationales à comité de lecture ou brevets), et insertion professionnelle. Le nombre d’articles en premier auteur des étudiants est signalé entre parenthèses.
Nom Prénom Années et
durée (mois)
Projet Niveau % encadre
ment
Valorisation (dont 1er auteur)
Titre Insertion professionnelle
Post Doctorat 1 personne Salome C. 2013 (12)
Projet 3 Post doctorat
100 1 (1) Identification et analyse des indicateurs de qualité des sols pour une gestion durable des écosystèmes viticoles
CDD contrat privé, Suisse
Doctorat 4 étudiants Coll P. 2011 (36)
Projet 5 Projet 7
Doctorat 50 4 (2) Qualité des sols viticoles en Languedoc Roussillon, effets des pratiques agricoles
CDI Laboratoire Rière
Lardo E. 2011 (12)
Projet 5 Projet 7
Doctorat 50 2 (1) Study of carbon cycle and environmental sustainability in the vineyard systems for quality wine production
CDD Université Basilicata (Italie)
Devau N. 2010 (36)
Projet 9 Doctorat 33 5 (4) Processus rhizosphériques déterminant la disponibilité du phosphore : apport de la modélisation mécaniste géochimique
Chercheur (BRGM)
Trouillefou C. 2014 (36)
Projet 2 Doctorat 33 3 (3) Application de la biocatalyse supportée pour la nutrition phosphatée des plantes à partir de phytate.
En recherche de post doctorat
M2 : 5 étudiants Vidal A. 2013 (5)
Projet 1 M2 100 0 Influence des facteurs d’un sol mycorhizosphérique sur les phytases d’Aspergillus niger et de Debaryomyces castelli
Thèse UPMC (UMR Metis)
Gorbyk M. 2013 (5)
Projet 3 M2 50 - Comment concilier pratiques viticoles et qualité des sols ? Analyse des pratiques à partir d’enquêtes
Inconnu
Trouillefou C. 2010 (6)
Projet 8 M2 33 1 (1) Encapsulation et fonctionnement d’enzymes dans des matériaux mésoporeux
Thèse
Coll P. 2008 (6)
autre M2 50 Sélection d’indicateurs physico chimiques et biologiques de la qualité des sols Cas de l’enherbement de la vigne
Thèse, CDI
Devau N. 2007 (6)
autre M2 50 Modélisation de l’influence du pH de la rhizosphère sur la biodisponibilité du phosphore
Thèse, chercheur BRGM
CDD ingénieur d’étude : 2 personnes Julbe J. Projet 2 CDD 100 - Simon B. 2012 (6)
Projet 4 CDD 50 0 Feldspath et nutrition potassique des plantes
CDD contrat privé (Cameroun)
M1 : 3 étudiants Collet P. 2007 (3)
autre M1 33 0 Synthèse d'un micro-environnement racinaire pour étudier l'hétérogénéité du sol
Thèse
Moret N. 2007 (3)
autre M1 50 0 Amélioration de la prise en compte du temps de latence de la modélisation mécaniste de la nitrification
Inconnu
Radianelson A. 2006 (2)
autre M1 100 0 Etude bibliographique de la modélisation de l’urée
M2, thèse, post doctorat IRRI

11
ACTIVITES D’ENSEIGNEMENTS
Mon activité d’enseignement depuis mon recrutement en 2005 est d’en moyenne 221h équivalents TD (éqTD), et a atteint 240h éqTD en 2012-2013. J’ai été en congé parental (temps partiel 80%) entre 2010 et 2013. Depuis 2012, je suis co-responsable du parcours M2 recherche « Ecosystèmes » du master Biologie Ecologie, co-habilité Montpellier SupAgro et Université de Montpellier 2. Je suis responsable de 3 Unités d’Enseignements et co-responsable de 4 unités d’enseignements : M2 Ecosystèmes UE enjeux et controverses (4 semaines, 40 étudiants en moyenne), 5ECTS UE outils et méthodes du monde de la recherche (4 semaines, 20 étudiants en moyenne), 5ECTS UE cycles biogéochimiques (2 semaines, 5 étudiants en moyenne), 2,5 ECTS M2 Ingénieur Géochimie et transferts des polluants (1 semaine, 10 étudiants en moyenne) Fonctionnement écologique des sols (2 semaines, 15 étudiants en moyenne), 3ECTS M1 Ingénieur Ecologie de la vigne (5 semaines, 32 étudiants en moyenne), 2,5 ECTS Géochimie et écologie des sols (4 semaines, 15 étudiants en moyenne), 6ECTS
Mon enseignement présente la contribution de la géochimie au fonctionnement des écosystèmes. Je développe des enseignements relatifs aux cycles biogéochimiques, à la contribution des sols aux services écosystémiques et aux relations entre activité biologique et composition minérale et organique des sols. La répartition moyenne de mes enseignements1 est la suivante : • Licence (L3 ingénieur Montpellier SupAgro) : 89h éqTD • Master (M1, M2 ingénieur et master recherche) : 127h éqTD • Formation courte non rémunérée : 5h éqTD Liste des étudiants ingénieurs encadrés entre 2010 et 2014 (5 étudiants) • Ingénieur en césure (tuteur école, 2 étudiants) • Ingénieur stage de M1 (tuteur école, 3 étudiants)
Participation à des jurys de soutenance diplômant entre 2010 et 2014 • Jury permanent de fin de stage de M1 et M2 recherche ECOSYSTEMES (environ 16 étudiants par an) • Jury de stage de fin d’étude de licence professionnelle L3 Viticulture raisonnée (2 étudiants) • Jury du M2 spécialité ingénieur (4 étudiants) • Jury de master 3 A (1 étudiant)
ANIMATION DE LA RECHERCHE
o Organisation de workshop, congrès
Membre du comité local d’organisation de « 5th Phosphorus in Soils and Plants - PSP5 », 26 - 29 Août 2014, Montpellier, France Membre du comité local d’organisation de « Sustainable Phosphorus Summit », 01 - 03 Septembre 2014, Montpellier, France Membre du comité local d’organisation de « Rhizosphere 2 », 26 - 31 Août 2007, Montpellier, France
1 Calcul effectué hors années avec congé maternité

12
o Participation à des groupes de travail 2011. Séminaire de réflexion sur l’intensification écologique des agro écosystèmes, 29 Novembre – 01 Décembre, Dourdan la Forêt, France.
ACTIVITES COLLECTIVES
Lors du quadriennal 2011 – 2014, j’étais co-responsable de l’axe enseignement de l’UMR Eco&Sols. Je suis également membre nommée du conseil d’UMR. Je suis membre élue du conseil des enseignants depuis 2012, et depuis 2013, je suis la représentante de Montpellier SupAgro, chargée par la directrice scientifique de Montpellier SupAgro, auprès du master Biologie Ecologie. Je suis également la personne référente auprès de la Direction des Relations Internationales de Montpellier SupAgro pour des étudiants étrangers inscrits à SupAgro souhaitant avoir des renseignements sur l’UMR Eco&Sols. En 2013, je suis intervenue dans le groupe de réflexion « UMRisation » de Montpellier SupAgro sur demande du directeur scientifique, Bruno Blondin.
EXPERTISE
Depuis 2012, je suis membre élue du conseil scientifique de Montpellier SupAgro. Participation en 2012 au lancement du Groupement d’Intérêt Scientifique « Vigne », thématique « gestion du capital sol en vigne ».

13
Liste des travaux et 5 Publications marquantes

14
LISTE DES TRAVAUX AVEC IDENTIFICATION DES ENCADREMENTS
Source IF 5 ans : 2013 JCR Science Edition Thomas Reuters Articles scientif iques dans des journaux internationaux avec comité de lecture (total 16)(sont mis en couleur les noms des doctorants que j 'ai co-encadrés) [P 1] Trouillefou C.M., Le Cadre E., Cacciaguerra T., Cunin F., Plassard C., Belamie E. 2014. Protected activity of a phytase immobilized in mesoporous silica benefits to plant phosphorus nutrition, article en cours de publication, Journal of Soil Gel and Technology (IF 5 ans : 1,763) [P 2] Salome C, Coll P, Lardo E, Villenave C, Blanchart E, Hinsinger P, Marsden C, Le Cadre E. 2014. Relevance of use-invariant soil properties to assess soil quality of vulnerable ecosystems : the case of Mediterranean vineyards. Ecological Indicators. 43, 83-93. (IF 5 ans : 3,384) [P 3] Devau N., Hinsinger P., Le Cadre E., Colomb F. Gerard F. 2013. Reply to the Comment by D. G. Lumsdon on "Fertilization and pH effects on processes and mechanisms controlling dissolved inorganic phosphorus in soils" by N. Devau, P. Hinsinger, E. Le Cadre, B. Colomb and F. Gerard. Geochimica et Cosmochimica Acta. 124, 410-417 (IF 5 ans : 4,798) [P 4] Lardo E, Coll P, Le Cadre E, Palese AM, Villenave C, Xiloyannis C, Celano G. 2012. Electromagnetic induction (EMI) measurements as a proxy of earthworm presence in Southern French vineyards. Applied Soil Ecology. 61, 76-84 (IF 5 ans : 2,952) [P 5] Coll P, Le Cadre E., Villenave C. 2012. How are nematode communities affected during conversion from conventional to organic farming in southern French vineyards. Nematology. 14, 665-676 (IF 5 ans : 1,303) [P 6] Hinsinger P, Brauman A, Devau N, Gérard F, JourdanC, Laclau JP, Le Cadre E, Jaillard B, Plassard C. 2011. Acquisition of phosphorus and poorly mobile nutrients by roots. Where do our plant nutrition models fail ? Plant Soil . 348, 29-61. (IF 5 ans : 3,713) [P 7] Devau N, Hinsinger P, Le Cadre E, Gérard F. 2011. Root induced process controlling phosphate availability with contrasted P-fertilized treatments. Plant Soil . 348, 203-218. (IF 5 ans : 3,713) [P 8] Coll P, Le Cadre E, Blanchart E, Hinsinger P, Villenave C. 2011. Organic viticulture and soil quality : a long term study in Southern France. Applied Soil Ecology. 50, 37-44. (IF 5 ans : 2.952) [P 9] Devau N, Hinsinger P, Le Cadre E., Colomb B, Gérard F. 2011. Fertilization and pH effects on processes and mechanisms controlling dissolved inorganic phosphorus in soils. Geochimica et Cosmochimica Acta. 75, 2980-2996. (IF 5 ans : 4,798) [P 10] Devau N, Le Cadre E, Hinsinger P, Gérard F 2010. A mechanistic model for understanding root-induced chemical changes controlling phosphorus availability. Annals of Botany 105, 1183-1197. (IF 5 ans : 4,001) [P 11] Devau N, Le Cadre E, Hinsinger P, Jaillard B, Gérard F. 2010. Soil pH controls the environmental availability of phosphorus: Experimental and mechanistic modelling approaches (vol 24, pg 2163, 2009). Applied Geochemistry 25, 1094-1095. (IF 5 ans : 2,560)

15
[P 12] Devau N, Le Cadre E, Hinsinger P, Jaillard B and Gérard F. 2009. Soil pH controls the environmental availability of phosphorus: Experimental and mechanistic modelling approaches. Applied Geochemistry 24, 2163-2174. (IF 5 ans : 2,560) [P 13] Le Cadre E, Gérard F, Genermont S, Morvan T, Recous S. 2009. Which formalism to model the pH and temperature dependence of the microbiological processes in soils ? Emphasis on nitrification. Environmental Modeling and Assessment. 14, 539-544. (IF 5 ans : 1,156) [P 14] Li H, Shen J, Zhang F, Clairotte M, Drevon J J, Le Cadre E, Hinsinger P 2008. Dynamics of phosphorus fractions in the rhizosphere of common bean (Phaseolus vulgaris L.) and durum wheat (Triticum turgidum durum L.) grown in monocropping and intercropping systems. Plant and Soil 312, 139-150. (IF 5 ans : 3,713) [P 15] Le Cadre E., Génermont S., Azam F., Recous S. 2004. The SAHGA model to calculate the Spatial Ammoniacal Heterogeneity after Granule Application. Biology and Ferti l i ty of Soils. 40: 178-180 (IF 3.074) [P 16] Le Cadre E., Génermont S., Decuq C., Recous S., Cellier P. 2004. Sources of uncertaintinities in estimating low ammonia volatilization fluxes in laboratory systems. Agronomy and Sustainable Development, 25, 101-107. (IF 3.363) Articles scientif iques dans des journaux nationaux avec comité de lecture (total 4) [P 17] Coll P., Le Velly R., Le Cadre E., Villenave C. 2011. La qualité des sols : associer perceptions
et analyses des scientifiques et des viticulteurs. Etude et Gestion des sols. 19, 79-89. [P 18] Coll P., Le Cadre E., Villenave C. Evaluer la qualité des sols pour adopter des pratiques
viticoles durables. Progrès Agricole et Viticole. 129, 445-448.
[P 19] Coll P., Le Cadre E., Villenave C. Quels effets à long terme de la viticulture biologique sur le fonctionnement du sol ? Progrès Agricole et Viticole. 129, 449-452.
[P 20] Coll P, Arnal D., Blanchart E, Hinsinger P, Le Cadre E., Souche G, Villenave C. 2009. Qualité
des sols viticoles: bénéfices de l’enherbement permanent sur les proprieties chimiques et les indicateurs biologiques des sols. Progrès Agricole et Viticole. 126, 527-531.
Communications et posters dans des congrès internationaux avec comité de lecture et actes (total 6) [C. 1] Vidal A. Plassard C., Clairotte M., Deleporte P., Abbadie J., Aznar JL, Le Cadre E. 2014. Factors controlling phytases produced by the fungi Aspergillus niger and Debaryomyces castellii in rhizosphere soils. 5th International Symposium Phosphorus in Soils and Plants, Aug 25th-29th, Montpellier France [C. 2] Mareschal L., Koutika LS, Le Cadre E., Bouillet JP, Epron E, Laclau JP. 2014. Effects of introducing leguminous species on phosphorus and nitrogen avalaibility in mixed stand forest. 5th International Symposium Phosphorus in Soils and Plants, Aug 25th-29th, Montpellier France [C. 3] Coll P., Lardo E., Le Cadre E., Villenave C., 2011. Studying soil quality is essential to evaluate the sustainability of a vineyard. 17th international Symposium GiESCO – Proceeding of Symposium, Asti- Alba (CN), Italy,29 Aug- 2 Sept, pp: 91-93. ISSN 0369-8173.

16
[C. 4] Devau N., Le Cadre E., Hinsinger P., Gerard F. 2010. Surface complexation modelling of phosphorus availability and bioavailability for plants. Conference on Goldschmidt 2010 – Earth, Energy and the Environment, June 13th-18th, Knoxville, USA. [C. 5] Devau N., Gerard F., Le Cadre E., Roger L., Jaillard B., Hinsinger P.2008. Using a mechanistic adsorption model to understand the influence of soil pHon the environmental availability of phosphorus: applications to a Chromic Cambisol. 18th annual V M Goldschmidt Conference, Vancouver, Canada. [C. 6] Li H., Shen J., Zhang F., Clairotte M., Drevon JJ, Le Cadre E., Hinsinger P. 2008. Dynamics of phosphorus fractions in the rhizosphere of common bean (Phraseolus vulgaris L.) and durum wheat (Triticum turgidum durum L.) grown in monocropping and intercropping systems. 2nd International Conference on Rhizosphere, Aug., Montpellier, France. Brevets et enveloppes Soleau (total 1) [B. 1] Enveloppe soleau N° 491116171013 Communications et posters dans des congrès nationaux avec comité de lecture et actes (total 1) [C. 7] Hinsinger P, Jaillard B, Le Cadre E and Plassard C 2009 Speciation and bioavailability of phosphorus in the rhizosphere. In Oceanis, Vol 33, No 1 and 2 - Phosphore Dans L'environnement: Bilan Des Connaissances Sur Les Impacts, Les Transferts Et La Gestion Environnementale. Eds. J M Dorioz, P Aurousseau and G Bourrie. pp 37-50.
Communications internationales avec comité de lecture sans actes (total 7) [C. 8] Coll P. Le Cadre E., Blanchart E., Arnal D., Hinsinger P., Villenave C. 2010. Nematofauna, a sensitive bioindicator to characterize global soil quality during organic conversion of a vineyard, 30th International ESN Symposium, Sept 19th-23rd, Vienna, Austria. (communication orale) [C. 9] Hinsinger P, Bravin M N, Devau N, Gerard F, Le Cadre E, Jaillard B 2008 Soil-Root-Microbe Interactions in the Rhizosphere - A Key to Understanding and Predicting Nutrient Bioavailability to Plants. Revista De La Ciencia Del Suelo Y Nutricion Vegetal 8. (communication orale) [C. 10] Arshad, M.; Le Cadre E., Hinsinger P., Jaillard B. 2006. Interactions between soil pH buffer capacity and phosphorus bioavailability, 3nd International Symposium on Phosphorus Dynamics in the Soil-Plant Continuum. Uberlândia-Minas Gerais, Brazil , 14-19th May 2006 (poster). .
[C. 11] Le Cadre E., Génermont S., Bedos C., Recous S. 2003. Modelling ammonia volatilisation from synthetic fertilizers. 12th N workshop, 21-24 September, Exeter UK.(poster) [C. 12] Le Cadre E., Génermont S., Recous S. 2003. Dissolution of granular fertilizers in soil and its effect on ammonia volatilisation. 12th N workshop, 21-24 September, Exeter UK. (poster) [C. 13] Le Cadre E., Lasserre-Joulin F.,Vong P.C., Guillemin S., Xardel S., Guckert A. 2002. Distribution of 35S in field-grown oilseed rape vegetative compartments under different sulphur-fertilizer inputs. Congress of the European Society of Agronomie, 15-18 July, Cordoba, Spain. 845 p. (poster)

17
[C. 14] Le Cadre E., Jeuffroy M.H., Génermont S., Flura D., Barbottin A., Chapoulie E. 2001. Reduce ammonia volatilization to increase N use efficiency of a wheat crop. 11th N workshop, 10-13 September, Reims, France. (poster) Communications et posters nationaux avec comité de lecture sans actes (total 1) [C. 15] Le Cadre E., Génermont S., Azam F., Recous S. 2004. Microsites et hétérogénéité spatiale de l'azote ammoniacal et du pH après apport de fertilisants solides au champ. Journées Nationales d'Etude du Sol. 24-26 octobre, Bordeaux, France. (oral) Communications et posters nationaux sans comité de lecture sans actes (total 6)
[C. 16] Lardo E., Coll P., Le Cadre E., Palese A.M., Xiloyannis C., Villenave C., Blanchart E., Ferrazzano G., Celano G., 2012. L’uso della tecnica EMI in pescheto per lo studio della variabilità spaziale degli indicatori biologici di qualità del suolo. VII PESCHMED, Lamezia T. (CS), Italy 26-27 Mag., Acta Italus Hortus, ISSN: 1127-3496.
[C. 17] Lardo E., Palese A.M., Coll P., Le Cadre E., Villenave C., Nuzzo V., Xiloyannis C.,Celano G. Relazioni tra Elettromagnetismo Indotto (EMI) e popolazioni di lombrichi in vigneti della Francia meridionale (accettato al IV COnvegno NAzionale di VIticoltura, Torino, Luglio - 2012). Acta Italus Hortus, ISSN: 1127-3496. [C. 18] Lardo E., Coll P., Celano C., Le Cadre E., Villenave C., Xiloyannis C., 2011. Soil organic matter, aggregate stability and respiration: integrated measures for the evaluation of the soil sustainability in the vineyard. 17th international Symposium GiESCO - Proceeding of Symposium, Asti-Alba (CN), Italy,29 Aug- 2 Sept, pp: 155-158. ISSN 0369-8173. [C. 19] Lardo E., Palese A.M., Coll P., Le Cadre E., Villenave C., Xiloyannis C., Celano G. Soil quality evaluation of fruit crop systems in semi-arid climatic conditions (accettato al 2nd Symposium on horticulture in a changing world, SHE2012, Angers, France). ISHS Acta Horticulturae, ISSN 0567-7572. [C. 20] Le Cadre E. 2004. Modélisation de la volatilisation d’ammoniac en interaction avec les processus biologiques et chimiques du sol. Congrès de l’Association Française d’Etude du sol (AFES). 24.06.2004, Paris, France (oral) [C. 21] Génermont S., Jeuffroy M.H., Le Cadre E., Hénault C., Laville P., Recous S. 2004. Les émissions gazeuses après fertilisation minérale : une perte d’azote pour la culture. Colloque national de la gestion de l’azote, avancées scientifiques. Académie Française d’Agriculture. 5.février, Paris, France. (oral)

18
CHOIX DE 5 PUBLICATIONS MARQUANTES
Le choix des publications marquantes de ma carrière est le suivant. Elles sont marquantes pour différentes raisons, que j’explique ci après : Publication n°1 : Trouillefou C.M., Le Cadre E., Cacciaguerra T., Cunin F., Plassard C., Belamie E. 2014. Protected activity of a phytase immobilized in mesoporous silica benefits to plant phosphorus nutrition, acceptée sous réserve de modifications à Journal of Soil Gel Science and Technology (IF
5ans : 1.763). L’histoire d’un pari risqué, celui d’une collaboration improbable entre la chimie des matériaux, la géochimie et la physiologie végétale. J’adresse ici ma gratitude à Christophe Trouillefou qui n’a pas tremblé devant le risque que nous lui faisions prendre en lui proposant ce sujet de thèse. A l’issu de ses travaux, de nouvelles perspectives s’ouvrent auxquelles j’envisage un potentiel intéressant. Publication n°2 : Salome C, Coll P, Lardo E, Villenave C, Blanchart E, Hinsinger P, Marsden C, Le Cadre E. 2014. Relevance of use-invariant soil properties to assess soil quality of vulnerable ecosystems : the case of Mediterranean vineyards. Ecological indicators. 43, 83-93 (IF 5ans : 3.384). Cette publication est issue des données de terrain collectées lors de la thèse de Patrice Coll. Clémence Salomé a repris en post doctorat la base de données passée au cribles des statistiques. C’est aussi la première publication dans une revue d’écologie qui symbolise le virage de mon projet de recherche. Enfin, la stratégie de collecte de données de terrain lors des thèses de Patrice Coll et Egidio Lardo s’est finalement justifiée par cette publication et associe donc ces deux doctorants. Publication n°3 : Coll P, Le Cadre E, Blanchart E, Hinsinger P, Villenave C. 2011. Organic viticulture and soil quality : a long term study in Southern France. Applied Soil Ecology. 50, 37-44 (IF : 2,952). Cette publication, associée à une deuxième a amorcé ma réflexion sur l’utilisation du concept de qualité des sols pour l’évaluation de la disponibilité des nutriments. Je poursuis cette réflexion dans le cadre de mon projet de recherche. Publication n°4 : Devau N, Le Cadre E, Hinsinger P, Jaillard B and Gérard F. 2009 Soil pH controls the environmental availability of phosphorus: Experimental and mechanistic modelling approaches. Applied Geochemistry 24, 2163-2174 (IF : 2,560 ). Une première publication qui sera suivie de plusieurs autres. Lors de cette thèse, tout n’a pas été facile car ces travaux m’ont demandé un virage thématique vers la géochimie mécaniste. Au final, malgré les difficultés rencontrées, la réflexion entamée lors de cette thèse m’a permis de développer mon projet de recherche et de réfléchir à de nouveaux enseignements. Publication n°5 : Le Cadre E, Gérard F, Genermont S, Morvan T, Recous S. 2009. Which formalism to model the pH and temperature dependence of the microbiological processes in soils ? Emphasis on nitrification. Environmental Modeling and Assessment. 14, 539-544. (IF 5 ans : 1,156) Une publication qui a permis de faire le point sur les formalismes existants pour tenir compte des effets du pH et la température sur les réactions biologiques des sols. Dans cette publication, nous avons utilisé un formalisme de bactériologie médicale prédictive qui s’est avéré puissant pour décrire la nitrification dans les sols et son rétro contrôle par les modifications de pH induits par les engrais de synthèse après application.

19
Bilan des activités de recherche 2005 - présent

20
PROBLEMATIQUE GENERALE
Naturellement, la productivité des écosystèmes terrestres est limitée par les principaux éléments constitutif des plantes soit l’azote (N) , le phosphore (P) et le potassium (K) (Carpenter 2005; Tilman et al. 2002; Vitousek et al. 2010). Ainsi, (Loreau et al. 2001) estiment que la disponibilité des nutriments structure en partie les communautés végétales et (Finzi et al. 2011) attribue la modulation des réponses des plantes à des perturbations comme le changement climatique à leur capacité à acquérir des nutriments. Les réseaux trophiques aériens influencent et dépendent des réseaux trophiques du sol (Wardle et al. 2004). En effet, les plantes par leurs racines, via les exsudats racinaires, ou les parties aériennes revenant au sol, sont une entrée de carbone pour les organismes du sol et constituent alors la base des réseaux trophiques du sol. Les réseaux trophiques du sol avec leurs multiples interactions biotiques et abiotiques contribuent donc à la régulation du cycle des nutriments et à la croissance des plantes (Sylvain and Wall 2011). La compréhension des liens entre le cycle de la matière organique et le fonctionnement des écosystèmes est un enjeu majeur de l’écologie fonctionnelle (Bornette and Lagadeuc 2012). Cet enjeu de l’écologie fonctionnelle est repris désormais par l’agronomie afin de mieux comprendre le fonctionnement des agro-écosystèmes dans le but de les gérer durablement (Doré et al. 2011). En effet, à la fin des années 60, l’intensification des agro-écosystèmes a permis l’augmentation de la production céréalière dans le monde très largement grâce à l’utilisation des engrais. L’objectif de la fertilisation est d’augmenter la disponibilité des nutriments pour lever la limitation naturelle de la productivité des écosystèmes. L’application massive d’engrais a, en retour, contribué à l’augmentation de l’effet de serre (Sutton et al. 2011), la perte de biodiversité (Payne et al. 2013; Sutton et al. 2011)) ou la contamination des eaux (Withers et al. 2014). Au delà des considérations agronomiques et environnementales de l’utilisation des engrais, d’autres problématiques de raréfaction de la matière première des engrais émergent actuellement. En effet, parmi les 3 nutriments majeurs, seuls le phosphore et le potassium sont issus de l’altération chimique de matériaux de nature géologique et donc de nature finie (Cordell et al. 2009; Manning 2010; Roemheld and Kirkby 2010). Le constat actuel d’impasse économique et environnementale des modes actuels de production agricole impose un nouveau paradigme : la nécessité d’une intensification écologique des agro-écosystèmes pour limiter le recours aux intrants, et lorsqu’on parle de nutrition des plantes, de fertilisants. La disponibil ité des nutriments est donc une question de recherche importante aux multiples enjeux écologiques et agro-environnementaux. L’acquisition d’éléments par une plante fait appel aux concepts de disponibilité et biodisponibilité Harmsen et al. 2005 ; Harmsen 2007 ; ISO 2006). La disponibilité représente la concentration en élément présente dans le sol susceptible d’être acquise par une plante. La disponibilité est donc une fraction de la concentration totale du sol. La biodisponibilité est le flux d’élément vers la surface du système racinaire d’une plante cible cultivée sur un sol donné. La biodisponibilité a deux composantes : l’une physico chimique ou disponibilité environnementale et l’autre biologique, qui est l’aptitude d’une plante à acquérir l’élément présent dans le sol. La disponibilité environnementale regroupe un ensemble d’espèces chimiques (spéciation), minérales ou organiques susceptibles d’alimenter la concentration de l’élément dans la solution du sol. Les différentes espèces chimiques se distribuent dans les différentes phases du système (partition). Il est désormais admis que les plantes sont capables d’influencer leur milieu et notamment au travers de processus biogéochimiques contrôlant la disponibilité des éléments (Hinsinger 2001; Hinsinger et al. 2009; Hinsinger et al. 2011b; Hinsinger et al. 2005). Ces processus sont fondamentaux car seules certaines formes sont absorbées par les plantes comme les ions orthosphosphates pour le phosphore (Hinsinger 2001), ou l’ion K+ (Britto and Kronzucker 2008), alors que pour l’azote une plus grande variété d’espèces chimiques sont prélevées (Jones et al. 2005).

21
La compréhension des facteurs de régulation des composantes physico chimiques et biologiques de la biodisponibil ité des éléments est une question de recherche majeure aux multiples enjeux agronomiques, écologiques et environnementaux. Dans le cas des agroécosystèmes, la résidusphère et la rhizosphère sont des lieux privilégiés de transformation de la matière organique et de flux d’éléments (Bundt et al. 2001). Certains auteurs (Hinsinger et al. 2005) ont montré qu’un grand nombre de processus se déroulant dans la rhizosphère, c’est à dire le volume de sol adjacent aux racines et influencé par l’activité de ces dernières, modifie la disponibilité environnementale des éléments (Encadré 1). Comment estimer la disponibil ité des nutriments ? L’estimation de la disponibilité des nutriments repose le plus souvent sur des extractions chimiques, dont la pertinence est critiquable (Koopmans et al. 2004). Par exemple, les extractions chimiques utilisées pour estimer la disponibilité en phosphore des sols sont incapables de prendre en compte les modifications du milieu par les racines des plantes et les micro-organismes associées. La complexité de la géochimie des éléments nécessite de faire appel à de nouvelles méthodes et à la modélisation des réactions chimiques influencées par les êtres vivants. La modélisation permet d’étudier les interactions entre les processus ou les facteurs, contrairement à la démarche expérimentale qui ne permet que l’étude d’un nombre restreint de facteurs ou processus à la fois. Toutefois, il est utopique de penser que l’ensemble de ces réactions (voir Encadré 1) puisse être modélisé. Il est nécessaire d’établir une hiérarchie des facteurs afin de se concentrer sur les principaux facteurs pour examiner les interactions entre processus chimiques et biologiques régulant la disponibilité des nutriments tout en continuant les développements méthodologiques expérimentaux. Afin de contribuer à comprendre comment les interactions entre les composantes abiotiques du sol et l ’activité biologique des sols influencent la disponibil ité des macro-nutriments N, P et K, j ’ai défini 3 axes de recherches. L'ambition est d'identif ier les stratégies de gestion des intrants l imitant l ’empreinte écologique de l ’Homme sur les écosystèmes cult ivés terrestres.
! L’intensification écologique des agro-écosystèmes repose sur l’utilisation des fonctions naturelles des sols (Doré et al. 2011). Parmi ces fonctions, la capacité des plantes à modifier la géochimie des éléments afin d’augmenter la disponibilité environnementale est particulièrement pertinente. Ainsi, la
Encadré 1 : résumé des modifications induites par les racines des p lantes pour modif ier la disponibi li té environnementa le des é léments dans leur rhizosphère

22
diversité des plantes, en utilisant les interactions positives entre espèces (facilitation et complémentarité de niche) peut permettre d'augmenter la disponibilité du phosphore (Hinsinger et al. 2011a). D’autres auteurs (Jackson et al. 2008) ont également mis en avant la complexité des processus dans la rhizosphère pouvant affecter les formes d’azote assimilable par les plantes. La rhizosphère est donc un lieu privilégié d’étude pour identifier les meilleures interactions biotiques et abiotiques augmentant la disponibilité des nutriments. Dans ce contexte, j’ai formulé mon premier axe de recherche comme suit : Axe 1. Peut on identifier et prédire l’effet de facteurs de régulation de la disponibilité environnementale des éléments : application au phosphore ? Liste des projets de l’axe 1 : Projet 1, Projet 6, Projet 9 Publications associées de l’axe 1 :[P 13], [P 15], [P 16], [P 7], [P 9], [P 10], [P 12], [P 14] Encadrement de la recherche de l’axe 1 : Devau N (M2, thèse), Trouillefou C (M2, thèse), Arshad M (M2), Vetelé C (M2), Vidal A (M2), Julbe J (CDD)
! L’agriculture, par ses pratiques de gestion du sol peut influencer la diversité et l’abondance des organismes du sol (Barrios 2007; Wagg et al. 2014), mais également les états physiques et chimiques du sol interférant avec les réactions biologiques. Ainsi, quelques auteurs comme (Doré et al. 2011) insiste sur la pondération de l’importance des processus rhizosphériques lorsqu’il sont intégrés aux pratiques agricoles. Il convient donc d’examiner le poids relatifs des différentes interactions biotiques et abiotiques régulant la disponibilité environnementale à d’autres échelles que celle du segment de racine. Il faut une évaluation à l’échelle de la parcelle en association avec les techniques de gestion du sol pour proposer de nouvelles stratégies de gestion des intrants. C’est le deuxième axe de mes recherches : Axe 2. Etude conjointe de la disponibilité environnementale et du fonctionnement du sol : application du concept de qualité des sols. Liste des projets de l’axe 2 : Projet 3, Projet 5, Projet 7 Publications associées de l’axe 2 : [P 2], [P 4], [P 5], [P 8], + 1 article en préparation Encadrement de la recherche de l’axe 2 : Salomé Clémence (post doctorat), Coll Patrice (doctorant), Lardo Egidio (PhD international 1,5 an en France), Gorbyk M. (M2)
! Le développement de techniques d’agriculture de précision ou les itinéraires techniques basés sur les interactions biologiques et relevant de l'intensification écologique est nécessaire. Le dénominateur commun de ces stratégies techniquement bien différentes est de limiter, voire d’éliminer, les apports de formes minérales solubles et de mieux valoriser les ressources du sol ou les déchets (Makowski et al. 2014). L’industrie des engrais a donc un défi important à relever pour s’adapter aux futurs changements de pratiques des agriculteurs, ou d’anticiper les réglementations de protection de l’environnement comme le protocole de Göteborg. La recherche-développement de formulation d’engrais azotés a permis le développement de produits à libération contrôlée (Slow Release ou Control Release Fertilizers) parfois comprenant des inhibiteurs de la nitrification pour limiter le lessivage des ions nitrate ou les émissions de gaz azotés (Menendez et al. 2012; Menendez et al. 2006; Scheer et al. 2014; Weiske et al. 2001). Face à la pénurie programmée d’engrais solubles à base de P et K, il devient urgent d’explorer les alternatives de fabrication d’engrais qui pourraient accompagner

23
une agriculture productive utilisant les concepts de l’écologie. Les éléments P et K ne bénéficient pas encore d’une recherche-développement de qualité suffisante en ce domaine dans la recherche publique. Certaines alternatives sont testées comme l’utilisation des roches broyées mais les résultats sont parfois peu concluants (Bolland and Gilkes 1990; Manning 2010). Récemment, certains auteurs (Withers et al. 2014) évoquent l’urgence de développer une recherche-développement de nouvelles formulations d’engrais. A chaque avancée des connaissances du fonctionnement des écosystèmes correspond une innovation technologique que l’on peut traduire en recherche finalisée voire appliquée. Ces opportunités doivent être transférables vers les acteurs économiques. Mon dernier axe de recherche, en partenariat avec divers acteurs du secteur économique a pour ambition de développer les résultats des axes 1&2 dans des innovations technologiques ou de vulgarisation. Les valorisations peuvent être des enveloppe Soleau, des brevets, voire non divulgués à l’INPI2 car faisant partie du secret industriel. Axe 3. Recherche d’applicabilité des travaux Liste des projets de l’axe 3: Projet 2, Projet 8, Projet 4 Publications associées de l’axe 3 : [P 1], [P 15] [B. 1], deux brevets en cours de rédaction Encadrement de la recherche de l’axe 3 : Trouillefou C. (doctorant), Coll P. (doctorant), Lardo E. (doctorant), Grondin Jennifer (CDD ingénieur d’étude), Julbe Justine (CDD ingénieur d’études), Benoit Simon (CDD ingénieur d’étude),
!
D’un point de vue disciplinaire, mes travaux se situent dans le champ de l ’écologie fonctionnelle à l ’ interface avec la géochimie. Ma stratégie de recherche consiste à combiner approche expérimentale de terrain et de laboratoire avec de la modélisation (mécaniste et empirique). Pour mener à bien ma stratégie de recherche, j’utilise des modèles et méthodes existantes mais je propose également de nouvelles approches méthodologiques et formalismes de modélisation.
2 Institut National de la Propriété Industrielle

24
PRESENTATION DES TRAVAUX
Axe 1. Peut on identifier et prédire l’effet de facteurs de régulation de la disponibilité
environnementale des éléments : application au phosphore ?

25
Introduction
La disponibilité des espèces chimiques de l’azote, phosphore et potassium est sous le contrôle de différentes réactions chimiques et biologiques (Hinsinger et al. 2011c; Husson 2013; Manning 2010). En prenant l’exemple du pH comme facteur de régulation, l’expérimentation peut contribuer à évaluer les effets du pH sur la disponibilité des éléments dans certains hot spots comme la rhizosphère (Hinsinger et al. 2003) grâce à des techniques adaptées (Blossfeld et al. 2013). Toutefois, la généricité de ces résultats expérimentaux doit être testée à l’aide de modèles de prédiction de la disponibilité en nutriments intégrant les effets directs sur l’activité biologique et les effets en retour de celle ci sur le pH.
Démarche
Une approche unique ne pourrait être employée pour évaluer l’effet des facteurs de régulation de la disponibilité en nutriments. J’ai utilisé à la fois la modélisation mécaniste à base de données (i) issues de la littérature, (ii) acquises expérimentalement ou (iii) adapté des formalismes de disciplines comme la bactériologie prédictive. Ma stratégie générale est de choisir les formalismes les plus adaptés pour l’intégration dans des modèles mécanistes incluant les réactions chimiques voire les transferts. Cette stratégie, qu’on peut qualifier de semi mécaniste permet une évaluation globale des processus impliqués dans la disponibilité des éléments.
Principaux résultats
En thèse, puis suite à mon recrutement à Montpellier Supagro, je me suis intéressée à la prédiction disponibilité des formes minérales de l’azote (ammonium et nitrate) après application d’engrais de synthèse pour évaluer la contribution de ces engrais aux émissions d’ammoniac d’origine agricole. La disponibilité en ammonium et nitrate dépend des processus d’organisation, minéralisation (cycle interne de l’azote) et nitrification. Ces réactions dépendent de l’activité biologique des sols et des propriétés du sol comme la texture, l’humidité et le pH (Jackson et al. 2008). Ces réactions ne sont pas réalisées par les mêmes organismes du sol et par conséquent les facteurs de sensibilité à la température ou au pH sont différents. Dans le cas de la prédiction des émissions d’ammoniac après fertilisation, il faut conceptualiser les interactions biotiques et abiotiques impliquées dans la volatilisation de l’ammoniac. Par exemple, (Praveen-Kumar and Aggarwal 1998) ont démontré que la volatilisation d’ammoniac et la nitrification sont interdépendantes. En effet, la volatilisation se termine quand débute la nitrification. La nitrification est inhibée par de trop fortes concentrations en
ammonium et par conséquent la volatilisation d’ammoniac lève ainsi l’inhibition de la nitrification. Je devais tenir compte également des cinétiques très rapides des processus induisant des variations de pH. Pour cela, j’ai modélisé les réactions tampons du pH à court terme (non publié) et repris les travaux de (Rosso et al. 1995; Rosso et al. 1993) en bactériologie prédictive médicale afin de tenir compte explicitement de la
Figure 1 : s imulation du modèle VOLT’AIR après implémentation des dif férentes réactions inf luençant le cycle de l ’azote après application de solution d ’ammonium nitrate au champ.

26
taille de la population de bactéries nitrifiantes et du pH [P 13]. J’ai également pris en compte explicitement la forme d’application (solide ou liquide) des engrais [P 15] et validé les résultats au moyen d’une mise au point expérimentale [P 16]. Pour l’hydrolyse de l’urée, l’analyse de la littérature sur l’activité de cette exo-enzyme a permis une formalisation. Le principal résultat est présenté dans la Figure 1, où je montre que la prise en compte explicite des interactions entre processus chimiques et biologiques améliore nettement la prédiction des flux d’ammoniac après application d’une solution d’ammonium nitrate au champ. Nous avons également pu démontrer que la modélisation du pH était critique. Les différences observées entre le modèle et les mesures ont été attribuées à une mauvaise prédiction de la teneur en eau des premiers centimètres de sol à l’aide du modèle de bilan d’énergie. En effet, la modélisation des effets de la teneur en eau sur les réactions biologiques comme la nitrification et l’activité uréasique sont encore imparfaites aux échelles de temps courtes.
La modélisation des variations de pH permet une estimation plus précise du pool d’azote ammoniacal mais qu’en est i l pour les autres éléments ? Application au phosphore
A mon recrutement, je me suis intéressée à une autre élément, le phosphore, élément modèle de l’UMR d’accueil. Les ions phosphates, seule forme absorbable par les plantes et l’ammonium ont en commun leur forte réactivité avec la phase solide du sol. En thèse, j’avais tenu compte des réactions à l’interface solide liquide uniquement par une isotherme d’adsorption. Or les isothermes d’adsorption ont une valeur prédictive faible et ne peuvent tenir compte des effets du pH sur la modification de charge de surface des colloïdes impliqués dans les phénomènes de sorption (Limousin et al. 2007). Le pH intervient en effet dans la plupart des réactions chimiques en phase aqueuse et contrôle la charge de surface des colloïdes du sol impliqués dans les réactions chimiques de sorption (Sigg et al. 2006). Parmi les différents facteurs influençant la disponibilité, le pH est commun à la régulation des 3 grands cycles biogéochimiques de l’azote (N), phosphore (P) et potassium (K) par son contrôle des réactions physico chimiques de sorption, précipitation/dissolution et d’hydrolyse. Concernant les réactions biologiques, le pH affecte la biogéographie et l’activité des communautés microbiennes (Baggs et al. ; Dequiedt et al. 2011; Regan et al. 2014) ainsi que l’activité des exo-enzymes libérées par les communautés microbiennes ou fongiques (George et al. 2005; Giaveno et al. 2010; Klose and Tabatabaï 1999; Klose 2000; Makboul and Ottow 1979; Rao et al. 2000; Rao 1983). Afin d’estimer le poids du pH par rapport à d’autres facteurs de régulation de la disponibilité en éléments, j’ai structurée mon premier axe en 3 objectifs :
Objectif 1.1. Estimation expérimentale du poids des variations de pH par rapport à d’autres activités racinaires sur la disponibilité du P. (M2 Arshad M.)
Objectif 1.2. Identification des réactions chimiques contrôlées par le pH définissant la disponibilité environnementale du P mesuré en objectif 1.1 à l’aide d’un modèle de complexation de surface à l’équilibre (Visual Mineteq), puis hiérarchisation du poids du pH. (M2 Devau N.)
Objectif 1.3. Estimation du poids du pH par rapports à d’autres processus rhizosphériques sur différents sols et identification des phases solides du sol contrôlant la disponibilité du phosphore (thèse Devau N.)
Notre modèle biologique est le blé dur (Triticum turgidum durum), plante capable de modifier le pH de sa rhizosphère de 1 à 3 unités pH, et les sols sont un Chromic Cambisol prélevé à Cazevielle dans le département de l’Hérault (objectif 1.1 & 1.2) et un Luvisol (objectif 1.3) prélevé à Toulouse-Auzeville (Haute Garonne). Ces sols sont de minéralogie contrastées et ont des teneurs en matière organique et P total différentes. Sur la base des travaux de (Alamgir et al. 2012; Kuczak et al. 2006; Malik et al. 2012), nous avons d’abord utilisé une approche expérimentale utilisant les extractions séquentielles

27
de P afin de déterminer l’évolution des pools de P susceptibles d’intervenir dans la nutrition des plantes et d'être influencés par l’activité racinaire. Un dispositif de culture original a été utilisé afin de récupérer un maximum de sol rhizosphérique comme dans l’article de (Li et al. 2008) [P 14]. Les résultats obtenus dans les objectifs 1.1 et 1.2 ont permis de mettre en évidence que les formes Pi disponibles extraites par des résines anioniques (Guo et al. 2000) sont modifiées par le pH seul alors que les formes estimées moyennement ou peu disponibles ne le sont pas comme le Pi residue (Figure 2). En présence de plants de blé, Arshad M. et Devau N. ont mesuré une modification du pH de leur rhizosphère sans que cette modification de pH n’induise de modification du pool des formes de P rapidement mobilisable (Pi résine). Par contre, les plantules modifient les pools de P très peu disponibles (P residue) ou organiques (extrait NaOH), données non présentées. L’hypothèse formulée est celle d’une mobilisation du P de ces formes vers les formes extractibles avec des résines. Le pH est donc une variable de régulation de la disponibilité en phosphore du sol de formes rapidement disponibles, mais les plantes peuvent avoir accès à d’autres formes de P.
Afin de caractériser la nature des processus géochimiques contrôlant la disponibilité en phosphore inorganique, nous avons combiné cette approche expérimentale avec une approche de modélisation mécaniste. L’approche de modélisation choisie est originale car elle repose sur la modélisation additive des propriétés et réactions de chacun des constituants du sol (argiles, oxydes de fer et d’aluminium, matière organique) vis à vis des ions orthophosphates. Notre choix s’est porté sur les modèles 1-pK Triple Plane Mode, échange d’ion et le formalisme de NICA-DONNAN. Le modèle choisi est un modèle dit à l’équilibre, Visual Minteq (Gustafsson, KTH Suède). Cette approche a été choisie pour caractériser la nature des processus géochimiques contrôlant la disponibilité en phosphore inorganique et évaluer le rôle du pH dans ces derniers. Nous avons fait le choix de mesurer et simuler la disponibilité en P à partir d’extraction CaCl2 (0,01M) plutôt que de l’eau car elles
Figure 2 : comparaison de deux formes de phosphore extra ites du Chromic Cambisol après modification du pH sans plante (courbe pleine) et après modifications du pH par la rh izosphère par deux variétés de blé (symboles) cult ivées avec de l ’azote ammoniacal comme source d’azote principale . Les formes de phosphore sont obtenues après extraction séquentie lle (adapté du protocole de Hedley décrit dans (L i et a l. 2008) [P 14] ). Données non publiées issus des travaux de Arshad M. et Devau N.

28
modifient peu les conditions chimiques, notamment le pH contrairement aux méthodes à base de résines échangeuses d’anions (Myers et al. 2005) lorsqu’elles sont conditionnés par des ions bicarbonates. Ce type d’extraction rendent bien compte de la quantité de phosphore disponible régulé par le processus d’adsorption - désorption. De cette manière, nous avons pu démontrer que le processus d’adsorption-désorption contrôlait la disponibilité des ions orthophosphates en solution ([P 12], [P 9]) pour une large gamme de pH de sol (pH 4 à pH 10). Nous avons testé notre hypothèse avec le sol de Cazevielle ([P 12]), puis confirmée avec succès sur l’autre sol, le Luvisol ([P 9]). En effet, dans le cas de ce dernier, nous avons utilisé un essai de longue durée de fertilisation phosphatée (Colomb et al. 2007), permettant de tester le rôle de la quantité de phosphore inorganique total disponible. Nous avons également pu identifier la contribution des phases solide du sol (kaolinite et illite) à ce mécanisme d’adsorption en fonction du pH (Figure 3). Nous avons pu mettre en évidence l’effet inattendu des électrolytes (Ca2+ et Cl-) en
fonction du pH. Pour de fortes valeurs en P et calcium, le processus de précipitation de l’hydroxyapatite peut également contribuer à contrôler la disponibilité du P. Cette approche n’aurait pas été complète sans déterminer l’effet de la modification de pH dans la rhizosphère du blé dans chacun de ces deux sols. La culture de blé menée à l’aide des dispositifs de type
« Rhizobox » a alors été utilisée comme dans le M2 de Arshad M. Les résultats relatifs à ces travaux sont décrits dans les publications [P 10] et [P 7]. En conclusion, nous avons démontré comment le pH en contrôlant l’adsorption des ions orthophosphates contribuait à réguler la disponibilité du phosphore disponible.
De la disponibil ité à la biodisponibil ité : un autre regard sur la contribution du pH
Un autre résultat marquant obtenu lors de cette deuxième étape, réalisée dans la thèse de N. Devau, concerne la mise en évidence d’un nouveau processus rhizosphérique, le prélèvement en Ca, susceptibles d’induire une augmentation de la disponibilité en P dans la rhizosphère du blé dur selon le pH et la concentration en Ca du milieu. Les travaux de N. Devau ont permis de mettre en évidence que le prélèvement de Ca augmentait la disponibilité de P en modifiant l’influence du processus d’adsorption-désorption du Ca sur celui du P. Les limites de notre approche reposent sur une calibration des surfaces spécifiques des minéraux correspondant à des structures relativement bien cristallisées. Or, ce n’est certainement pas le cas dans les sols. Malgré ces limites, les travaux de N. Devau ont soulevé plusieurs pistes de réflexion pour améliorer notre compréhension de la biodisponibilité du phosphore. Par exemple, l’effet de l’exsudation d’anions organiques n’a pas été testé alors que (Jones et al. 2003) et (Richardson et al. 2009) mettent en avant les effets de
Figure 3 : concentrations de phosphore adsorbé en fonction du pH sur les dif férentes minéraux du sol (adapté de (Devau et al . 2009) ).

29
compétition entre anions organiques et ions orthophosphates. Cette approche a récemment été testée avec succès par (Duputel et al. 2013a; Duputel et al. 2013b) dans notre unité de recherche. J’ai choisi à l’issue de la thèse de N. Devau, une approche complémentaire à celle de mes collègues en m’intéressant à l’hydrolyse enzymatique de formes de phosphore organique dans la rhizosphère des plantes. En effet, les enzymes sont essentielles pour le cycle des nutriments dans le sol et donc leur disponibilité pour les plantes et les organismes du sol en général. De plus, les activités des enzymes du sol, qu’elles soient intra- ou extra-cellulaires, sont de bons indicateurs des modifications de fonctionnement du sol car ils rendent compte de l’activité des organismes les synthétisant à savoir les bactéries, champignons et plantes (Naseby and James 2002). Les enzymes impliquées dans la dégradation d’une forme de phosphore organique, le phytate ou myo-inositol hexa-phosphate sont particulièrement intéressantes. Dans la rhizosphère des plantes, l’activité enzymatique est souvent plus élevée que dans le sol non influencé par l’activité des racines grâce à l’ajout de carbone exsudé par les plantes stimulant l’activité microbienne (Renella et al. 2007). L’activité des uréases et des phytases comportent des similarités parmi les enzymes intra- ou extra-cellulaires. Lorsqu’elles sont émises dans le milieu, leur activité peut être modifiée par les constituants du sol (Beri 1978; Bremner 1976; Gould et al. 1973; Grant et al. 1996; Klose and Tabatabaï 1999; Klose 2000; Makboul and Ottow 1979; McGarity and Myers 1967; McNaughton et al. 1997; Moyo et al. 1989; Myers and McGarity 1968; Nannipieri et al. 1978; Pal and Chhonkar 1981; Pettit et al. 1976; Reynolds and Wolf 1987; Zantua et al. 1977) et plus récemment pour les phosphatases et phytases (George et al. 2005; George et al. 2007b; Giaveno et al. 2010; Shi et al. 2009). Les plantes ont peu de capacités à hydrolyser le phytate fourni comme seule source de phosphore car elles ne sont pas capables de sécréter la phytase dans le milieu rhizosphérique. Toutefois, lorsqu’elles sont associées à des champignons et des bactéries au sein d’une chaine trophique, les plantes peuvent utiliser cette forme de phosphore (Irshad et al. 2012). Jusqu’à présent, les facteurs de régulation de l’activité de la phytase ont été étudiés en conditions artificielles, où les facteurs influençant l’enzyme ont été analysés séparément et de manière contrôlée. La hiérarchisation des facteurs de contrôle de l’activité phytasique dans la rhizosphère des plantes reste à faire pour étudier les possibilités de valoriser les ressources en phytate du sol. Le projet ANR blanc UnlockP (Projet 1) a pour ambition d’étudier différentes voies d’utilisation du phytate par les plantes. Deux stratégies sont à l’étude. La première est basée sur les interactions trophiques entre un champignon mycorhizien, des bactéries et des invertébrés prédateurs (nématodes). En effet, les nématodes bactérivores en consommant des bactéries libèrent les phytases bactériennes intracellulaires dans la rhizosphère de plantes et accélèreraient la libération de P disponible à partir de phytate (Irshad et al. 2012; Irshad et al. 2011). La deuxième stratégie est de transformer le champignon mycorhizien pour lui faire libérer directement des phytases bactériennes, plus efficientes pour minéraliser le phytate dans la rhizosphère de la plante hôte. Afin d’évaluer ces stratégies, l’activité phytasique doit être intégrée dans un modèle de complexation de surface afin de tenir compte des réactions de nature géochimique contrôlant la disponibilité des ions orthophosphates libérés lors de l’hydrolyse. La grande complexité des réactions entrant en jeu dans la modification de l’activité enzymatique lors de son adsorption sur les surfaces minérales rend délicate une modélisation purement mécaniste. L’originalité des mes travaux repose sur l’analyse de l’activité enzymatique dans des sols entiers en présence d’une résine anionique ayant le rôle de puits afin de proposer un formalisme d’activité enzymatique à double compartiment. La taille de ces compartiments est fonction du pool d’enzymes libérées par chacune des stratégies. Pour cela, nous avons choisi d’évaluer l’activité phytasique de 3 phytases issue de Aspergillus niger, Debaryomyces castelllii et Bacillus subtilis apportée dans les sols précédemment décrits. Ces sols ont été au préalable modifié en apportant des sources de carbone assimilable, anion organique et protons afin de recréer un environnement mycorhizosphérique. Lors de ces expérimentations, nous avons dû optimiser les protocoles d’extraction du phosphore du sol à l’aide de résines échangeuses d’anions afin de ne pas perturber l’environnement chimique. Les bons résultats de cette optimisation devraient prochainement être valorisé sous la forme d’un article. La hiérarchisation des facteurs de contrôle de

30
l’activité enzymatique est actuellement en cours à l’aide de ce protocole [C. 1]. Les premiers résultats nous montrent un effet marqué du pH et de la concentration en oxalate sur la disponibilité en Pi, avant le type d’enzymes (M2 A. Vidal, M2 C. Vetélé). Prochainement, nous mènerons des expérimentations afin d’obtenir des fonctions réponses pour chacune de ces enzymes en tenant compte des pools d’enzymes adsorbées ou libres, en commençant par le pH car c’est un facteur clef de la régulation de l’activité enzymatique via des effets directs ou indirects (Sinsabaugh et al. 2008). Une variante du protocole d’extraction par les résines anioniques a été testée au champ afin de mesurer la disponibilité environnementale de l’azote et du phosphore dans la rhizosphère de plantes seules ou en association ([C. 2], Projet 6).
Conclusions
Dans les travaux décrits dans ce premier axe, nous avons démontré la pertinence de notre démarche pour décrire et évaluer certains facteurs de la disponibilité des nutriments comme le pH. L’originalité de ces travaux réside dans l’évaluation de ce facteur dans des sols de composition minérale entièrement décrite, contrairement à des travaux contemporains n’utilisant qu’une surface absorbante (Geelhoed et al. 1998; Geelhoed et al. 1997, 1999). En condition limitante en phosphore, nous avons pu montrer, en combinaison avec les variations de pH, le rôle clef de l'adsorption sur les argiles et l’importance du prélèvement de calcium sur la disponibilité du phosphore. L’intégration des réactions biologiques bactériennes (nitrification) ou enzymatique (uréasique et phytasique) requiert la même démarche mais l’absence de formalismes mécanistes ralentit leur intégration. Une approche semi mécaniste est nécessaire et justifie une démarche pluri-disciplinaire afin de faire progresser notre compréhension.

31
Axe 2 Etude conjointe de la disponibilité
environnementale et du fonctionnement du sol : application du concept de qualité des sols.

32
Introduction
Les fonctions des écosystèmes sont la résultante de processus naturels se déroulant dans les sous systèmes comme le sol. Parmi les fonctions définissant les services écosystémiques d’approvisionnement, le cycle des nutriments à partir de la matière organique dépend du fonctionnement du sol et plus précisément des interactions entre ses composantes biotiques et abiotiques (de Groot et al. 2002). Concernant les interactions biotiques, les plantes, en modifiant leur rhizosphère, peuvent affecter les réseaux trophiques du sol (Wagg et al. 2014) et contribuer à la régulation du cycle des nutriments (Sylvain and Wall 2011). Ainsi, (Wardle et al. 2004) estiment que les réseaux trophiques du sol, d’une grande complexité, seraient connectés aux réseaux trophiques aériens. Les pratiques agricoles peuvent affecter à la fois les composantes biotiques et abiotiques du sol (Pellerin et al. 2006). Quelques auteurs (Barrios 2007; Wagg et al. 2014) estiment qu'elles affectent la diversité et l’abondance des organismes du sol. Par ses pratiques, l’agriculteur peut ainsi modifier la structure et les états rédox associés ou le pH des sols ou la qualité des litières. Il est nécessaire d’évaluer les facteurs de régulation mis en avant dans l’axe 1 à l’échelle de la parcelle qui intègre l’ensemble des pratiques de l’agriculteur pour sélectionner ceux qui sont pertinents.
Démarche
La stratégie mise en œuvre dans cet axe est d’utiliser le concept de qualité des sols pour tenter de relier les variations de disponibilité environnementale des éléments avec le fonctionnement global des sols. Ce type d’approche permet en outre d’évaluer les pratiques d’intensification écologiques dans un contexte large. L’évaluation de la qualité des sols est une démarche méthodologique et un concept, introduits à la fin des années 70. Je distingue deux qualités des sols, la « qualité inhérente » et la « qualité dynamique » (Karlen 2004; Karlen et al. 2003; Karlen et al. 1997; Wienhold et al. 2004). La qualité inhérente fait référence aux propriétés naturelles et originelles des sols influencées par la roche mère, la topographie, le climat, la végétation et l’âge du sol tandis que la qualité dynamique représente l’évolution du fonctionnement du sol sous l’influence des activités humaines. L’évaluation de la qualité dynamique permet de déterminer la direction et l'intensité des effets sur le fonctionnement du sol lors d’un changement de pratique à des pas de temps relativement courts (< 10 ans), donc pertinents à l’échelle de temps humaine (Robinson et al. 2012). Le concept de qualité des sols reprend les concepts d’écologie du sol en combinant les informations données par une variété d’indicateurs. Les indicateurs peuvent être biologiques (basés sur les organismes du sol) mais également chimiques et physiques. Nous avons fait le choix de ne pas les combiner en un indicateur unique comme l’Indice de Qualité Biologique des Sols (Nuria et al. 2011) afin de ne pas perdre d’information. En effet, dans l’objectif de relier la disponibilité des éléments au fonctionnement du sol, l’utilisation de ces différents types d’indicateurs est nécessaire pour considérer la complexité du sol. L’utilisation de différents indicateurs aux temps de réponse différents après l’apparition d’une perturbation permet également d’évaluer les dynamiques à court et long terme. La démarche mise en œuvre dans ce deuxième axe de recherche s’est structurée autour de deux objectifs :
Objectif 2.1. Quels sont les indicateurs les plus pertinents pour évaluer le fonctionnement du sol et la disponibilité en nutriments ?
Objectif 2.2. Pouvons nous réellement relier le fonctionnement du sol avec les pratiques agricoles?
Afin de répondre à ces objectifs, nous avons choisi de nous intéresser aux systèmes viticoles. En effet, les sols viticoles sont particulièrement vulnérables et menacés par la perte de matière organique et de biodiversité du sol mais également l’érosion et la pollution (Coulouma et al. 2006; Hildebrandt et al. 2008; Lagacherie et al. 2006; Le Bissonnais et al. 2007). Malgré cette vulnérabilité reconnue, la prise en

33
compte de la qualité du sol dans la définition des pratiques viticoles est restée balbutiante car cantonnée à une évaluation de la qualité inhérente. En outre, la vigne est un système pérenne. Dans ce type de système, le recyclage de la matière organique par la communauté microbienne est indispensable. Enfin, la viticulture biologique est en plein essor rendant encore plus importante la question de l’activité biologique des sols. C’est donc un modèle d’étude intéressant pour étudier l’effet des pratiques culturales sur la disponibilité en élément. Notre échelle d’étude est parcellaire, distribuées sur une région viticole à la géologie complexe. Dans ce type d’approche, des compétences associées à la collecte de données (échantillonnage, mesure) des différents indicateurs sont nécessaires mais également des compétences en analyse multivariées et univariées pour extraire l’information.
Principaux résultats
Quels sont les indicateurs les plus pertinents pour évaluer le fonctionnement des sols et la disponibil ité en éléments ?
L’information portée par les indicateurs peut permettre d’identifier les actions pour améliorer ou suivre l’évolution d’un système écologique. Nous avons sélectionné un ensemble d’indicateurs permettant d’évaluer la fonction de recyclage de la matière organique et de transfert des éléments nutritifs. Des compromis dans le choix des indicateurs sont nécessaires (Culman et al. 2010). Nous avons sélectionné des indicateurs physiques, chimiques, et biologiques basés sur les nématodes, bactéries et vers de terre. Nous avons alors suivi l’évolution des valeurs mesurées sur des parcelles d’une même zone pédopaysagère dans le cas d’une conversion de la viticulture conventionnelle à la viticulture biologique. Nous avons pu montré une évolution des teneur en N total, et P, K disponible en fonction de l’âge de conversion. Nous avons formulé alors l’hypothèse que la biomasse bactérienne totale plus importante (+ 34%) ainsi qu'une plus grande abondance de nématodes fongivores (+ 97% après 17 ans de conversion) pour des conversions précoces auraient augmenté la sécrétion de ligands organiques ou de phosphatases par intensification du réseau trophique tel que mesuré par (Irshad et al. 2012; Irshad et al. 2011). L’analyse discriminante (Figure 4) basée sur les mesures des différents indicateurs (physiques, chimiques et biologiques) a montré une nette discrimination en fonction de l’âge de conversion. La viticulture biologique a conduit à une diminution significative de l’abondance et de la biomasse des vers de terre endogés (- 65 % en 17 ans). Ce résultat surprenant aurait mérité d’être complété avec la détermination des vers de terre anéciques mais nous ne pouvions pas faire cette détermination avec le nombre de parcelles étudiées. Nous avons attribué la plus faible abondance et biomasse des vers de terre endogés à la compaction des sols liée à un nombre de passages plus importants en viticulture biologique. Dans cette étude, nous avons démontré que la période de transition 7-11 ans, dépendant des indicateurs considérés, était nécessaire pour séparer clairement les pratiques conventionnelles de celles de l'agriculture biologique pour ce vignoble. [P 8].

34
Figure 4 : Résultats de l ’analyse discriminante réalisée après analyse des indicateurs avec (a) cercle de corrélations et (b) distribution des 96 observations et des centroïdes. Les termes Conv, Bio7, Bio 11 et Bio 17 renvoient à l ’âge de conversion, pas de conversion (Conv), conversion depuis 7, 11 et 17 ans pour Bio7, Bio 11 et Bio 17 respectivement.
En utilisant les informations basées sur les nématodes comme l’indice d’enrichissement, nous suggérons que l’augmentation des ressources disponibles a favorisé la densité des nématodes bactérivores. Le fonctionnement du sol a été modifié avec les voies de décomposition de la matière organique devenant plus fongique que bactérienne. Même si des changements étaient observés dans la structure de la communauté de nématodes après conversion, l’indice de maturité (MI), l’indice des nématodes phytophages (PPI) et l’indice de structure (SI) sont restés constants. Par conséquent, les pratiques agricoles biologiques n’ont amélioré ni la longueur ni la complexité de la chaîne trophique du sol bien que quantitativement l’activité biologique soit plus importante. Nous concluons que le niveau de perturbations dans le sol n’a donc pas changé après conversion [P 5].
Pouvons nous réellement rel ier le fonctionnement du sol avec les pratiques agricoles?
L’évaluation des pratiques agricoles par l’intermédiaire des indicateurs repose sur la composition d’un référentiel qui doit tenir compter des caractéristiques naturelles des sols, les indicateurs de la qualité inhérente. Lors de la thèse de Patrice Coll, et en partie de celle de Egidio Lardo, nous avons échantillonné 164 autres parcelles réparties dans 9 zones pédopaysagères. Une première analyse nous a montré l’importance de tenir compte des propriétés inhérentes des sols comme la teneur en calcaire ou la pierrosité afin de comprendre l’effet des pratiques par type de sol. Lors du post doctorat de Clémence Salomé, nous avons utilisé cette base de données en utilisant des analyses multivariées plus spécifiques afin d’obtenir une classification opérationnelle. La classification opérationnelle est obtenue en évaluant le poids des indicateurs inhérents sur les indicateurs dynamiques. Dès lors, il a été possible de regrouper les parcelles en 6 groupes aux indicateurs inhérents proches plutôt qu’en zones pédopaysagères (Tableau 2). Des statistiques descriptives simples permettent de visualiser la variabilité des indicateurs dynamiques par groupe de sol.

35
Tableau 2 : classif ication opérationnelle uti l isée pour la création du référentiel de variabil ité des indicateurs de qualité dynamique. Repris de (Salome et al. 2014)
La plupart des indicateurs dynamiques sont affectées par les propriétés inhérentes [P 2]. En ce qui concerne les indicateurs de disponibilité en P et K, nous n’avons pas mis en évidence d’effets significatifs du type de sol. C’est un résultat surprenant au vu des conclusions acquises dans le premier axe de recherche. La mesure de la disponibilité de ces éléments reposait sur une extraction simple à l’eau, mais des estimations avec d’autres extractants auraient été préférables. Nous avons pu souligné l’importance des propriétés inhérentes sur la gamme de variation de certains indicateurs comme ceux basés sur l’analyses des populations de nématodes, voire sur l’inadéquation d’autres comme le quotient métabolique. La prochaine étape est l’interprétation des valeurs renvoyées par les indicateurs dynamiques de la qualité des sols en fonction des pratiques. Pour cela nous avons l’objectif de tester les pratiques culturales recensées par un questionnaire (M2 Gorbyk M.). Trois types de pratiques sont testées dans un projet d’article: durée de l’enherbement, type de désherbage et le type de fertilisation (minérale ou organique). Je pense également que le développement de nouvelles techniques d’estimation de la disponibilité environnementale est indispensable. Je pense qu’avec un protocole adapté les résines échangeuses d’anions et de cations au terrain permettraient de mieux suivre les flux d’éléments dans les sols comme démontré par (Andrews and Carroll 2001). Au vu des difficultés rencontrées par la collecte de données sur un grand nombre de parcelles [P 4] et les questions autour de l’adéquation des techniques d’estimation de la disponibilité environnementale, le choix des indicateurs est l’étape critique de notre approche.
Conclusions
Notre objectif était d’estimer la disponibilité en nutriments en réponse à des modifications du fonctionnement du sol. La démarche mise en œuvre ici est originale car à notre connaissance des travaux pionniers car associant des d’indicateurs physico-chimiques et biologiques, indicateurs biologiques incluant la microfaune (nématodes) et la macrofaune (vers de terre) pour l’étude de sols viticoles. Cette approche écologique du fonctionnement du sol permet d’évaluer l’intensité des modifications de disponibilité des éléments. Contrairement à (Gil-Sotres et al. 2005), nous estimons que l’utilisation d’indicateurs physico-chimiques est pertinente car ces indicateurs réagissent aux modifications de pratiques agricoles à condition d’analyser les informations renvoyées par les indicateurs par groupe de sols aux qualités inhérentes proches. Nous essaierons dans un prochain article de relier les pratiques culturales aux modifications du fonctionnement du sol par groupe de sols. Par manque de temps, d’argent et de compétences, nous n'avons pris en compte que la biomasse microbienne (indicateur biochimique général) mais pas les activités enzymatiques (indicateur biochimique spécifique) comme suggéré par (Gil-Sotres et al. 2005; Trasar-Cepeda et al. 2008). Or, il aurait été pertinent de les utiliser pour comprendre les différences de teneurs en éléments disponibles car nous supposons des différences d’activités enzymatiques sous différentes pratiques agricoles. Cette complémentarité d’approche peut guider l’usage des terres et le choix des pratiques culturales promouvant l’ensemble des fonctions du sol impliquées dans différents services écosystémiques (Andrews and Carroll 2001). Nous avons pu identifier quelques indicateurs pertinents

36
pour étudier les modifications du fonctionnement du sol mais nous n’avons pas été au bout de notre démarche car l’étude de la disponibilité en nutriments par les méthodes employées n’était pas satisfaisante. La mise au point méthodologique sur les résines échangeuses d’ions et leur application au champ est prometteuse pour mieux suivre les flux d’éléments dans les sols et les relier aux changements du fonctionnement du sol (voir axe 3). Notre expertise acquise sur cet axe peut être utilisée pour mieux comprendre les cycles des éléments après fertilisation organique ou lors des associations de culture afin de promouvoir la qualité des sols et maintenir les fonctions du sol impliquées dans les services écosystémiques. La richesse de la base de données nous permet à l’avenir de comparer le fonctionnement des sols dans une culture pérenne par rapport à des cultures annuelles.

37
Axe 3 Recherche d’applicabilité des travaux
Avertissement : le contenu de cette partie comporte des informations confidentielles à ne pas
divulguer

43
Réflexions sur l ’activité d’encadrement et de recherche

44
La rédaction de ce document est l’occasion de faire une introspection sur ma trajectoire et de l’analyser. L’Habilitation à Diriger les Recherches, qu’est ce en fin de compte ? C’est un diplôme sanctionnant une formation d’encadrant de jeunes chercheurs grâce à la définition d’une stratégie de recherche suffisamment large et originale (Arrêté du 23 novembre 1988 relatif à l'habilitation à diriger des recherches). Je vais m’arrêter ici sur les différents points de cette définition et faire l’analyse de mes travaux sur la base des fiches synthétiques (décrites en annexe) de mes encadrements et du bilan de publication. Le doctorat est une formation mais je pense qu’il faudrait parler d’accompagnement scientifique et personnel plutôt que d’encadrement. Je pense que notre rôle d’encadrant repose sur l’écoute, sur le respect des intérêts scientifiques et personnels de l’étudiant, et un encouragement de la levée de l’autocensure des étudiants. Je pense qu’il faut favoriser la créativité des étudiants en les rassurant sur leurs capacités tout en les aidant à s’organiser et à argumenter leurs choix. C’est pour toutes ces raisons que je parlerai d’accompagnement plutôt que d’encadrement. Le métier d’enseignant chercheur donne un accès privilégié aux étudiants pour présenter les thématiques de recherche. Parmi les étudiants que j’ai eu en co-encadrement de thèse (n=4), 2 sont des étudiants issus de formations recherche (M2 Ecosystèmes N. Devau) ou ingénieurs (P. Coll) dans lesquelles je suis intervenue. Ces deux étudiants ont obtenu un CDI dans des structures de recherche publiques (BRGM, Nicolas Devau) ou privé (laboratoire Rière, Patrice Coll) conformément à leur projet professionnel. Je résume dans le tableau ci dessous les principales données des fiches synthétiques (voir annexe) autre que les publications renseignées dans le Tableau 1. Tableau 3 : description des valorisations des étudiants. Les étudiants en vert ont obtenu un CDI, en orange un contrat à durée déterminée, en rouge sont en recherche d’emploi.
Doctorant Année début thèse
durée thèse
Type de financement de la bourse
Origine du M2
Nb articles ACL 1er auteur
Nb articles ACL co auteur
Nb communications orales internationales avec actes et comité de lecture
Nb rédaction vulgarisation
Dépôts INPI
Trouillefou C
2010 3,5 CIFRE Master Matériaux Université de Aix Marseille
1 0 0 0 1 2 en cours
Coll P 2008 3 ADEME/MSA Ingénieur agronomie Spécialité Viticulture oenologie
2 2 2 2 0
Lardo E 2008 3 bourse ministérielle (Italie)
International Ph.D. Programme «Crop Systems, Forestry and Environmental Sciences
1 1 0 0 0
Devau N 2007 3 INRA/Région M2 recherche UM2 Fonctionnement des écosystèmes naturels et Cultivés (ECOSYSTEMES)
4 1 2 0 0
J’ai systématiquement proposé à mes étudiants de participer à des enseignements de deuxième année et troisième année d’école et en master recherche. C’est une autre façon de valoriser les résultats de la recherche et de former des jeunes en école d’ingénieur ou à l’université. Mes travaux contribuent à une réintégration de la composante biologique du sol autre que le peuplement cultivé dans les agro-écosystèmes. Le rapprochement entre l’écologie des sols et les

45
sciences de la terre (géochimie) permet de reprendre les questions de recherche sur les flux minéraux de considérer de nouvelles échelles d’action et d’évaluation des pratiques agricoles. L’originalité de mes travaux de recherche porte sur l’approche pluri disciplinaire de la disponibilité des éléments et de la diversité des méthodes employées ainsi que des échelles d’études (rhizosphère à parcelle agricole). La pluridisciplinarité est enrichissante car elle peut renouveler nos concepts et approches. La pluridisciplinarité est en outre intéressante à développer dans les enseignements d’école d’ingénieur agronome. Je développe une stratégie dans la partie projet en réponse aux limites de mes précédents travaux à savoir (i) la prise en compte faible des activités enzymatiques dans la rhizosphère des plantes et (ii) la pauvreté des relations entre pratiques agro écologiques et types de sol. J’ai également la conviction que mes travaux doivent se rapprocher de l’écophysiologie des plantes pour tenir compte des effets d’adaptation des besoins de la plante à la disponibilité en nutriments. Le financement de mes travaux s’est réalisé en partie via des collaborations de recherche avec des partenaires industriels. Les discussions avec les directions « recherche et développement » d’entreprises permettent de sensibiliser ces professionnels aux problématiques actuelles des cycles biogéochimiques et d’envisager avec eux la préservation des services écosystémiques. L’expérience de collaborations de recherche avec les différentes partenaires industriels est satisfaisante car ce sont des entreprises de taille importante avec un secteur recherche-développement constitué en partie de docteurs, donc de personnes habituées à la démarche. Je maintiendrai donc ce lien car outre, les aspects scientifiques, c’est un vivier de recrutement potentiels des doctorants.
.

46
Projet scientif ique

47
Je propose un projet de recherche afin de à (i) lever les verrous de la prise en compte de la biologie des sols pour comprendre la disponibilité des éléments nutritifs et à (ii) de mieux tenir compte de l’écophysiologie de la plante pour tenir compte des effets d’adaptation de la plante aux conditions limitantes en nutriments. Le premier objectif est composés de deux étapes. A court terme, je propose d’identifier et de modéliser l’activité enzymatique de la rhizosphère. A moyen terme, je souhaite intégrer ma réflexion dans des études sur la compréhension du fonctionnement du sol. Enfin dans une perspective à plus long terme, je souhaite développer des liens avec l’écophysiologie de la plante, je propose alors quelques pistes de travail.
QUELS SONT LES VERROUS DE LA MODELISATION DE L’ACTIVITE ENZYMATIQUE DANS LA RHIZOSPHERE ?
Je fais le bilan d’une nécessaire prise en compte des effets de rétro-contrôle entre les composantes biotiques et les facteurs abiotiques du milieu pour mieux comprendre et prédire la disponibilité des éléments. La modélisation mécaniste géochimique peut être utile pour comprendre la disponibilité des éléments minéraux à condition de tenir compte des activités biologiques dans la rhizosphère. Ma contribution à la question générique de recherche de compréhension de la disponibil ité des éléments en condition de bas intrants est l ’évaluation de l ’activité des enzymes extracellulaires dans la rhizosphère des plantes. L’élément modèle sera le phosphore, et plus particulièrement le phytate. Je rappelle que la fraction organique de phosphore dans les sols peut être largement majoritaire mais que les plantes seules n’y ont que faiblement accès en raison de leur capacité limitée à secréter des enzymes alors que les bactéries et champignons peuvent excréter de grandes quantités d’enzymes (phytases) susceptibles d’hydrolyser les liaisons esters permettant de libérer l’ion orthophosphate à partir de molécules de phosphore organique. L’activité des enzymes extracellulaires libérées par les organismes au sein de la rhizosphère est donc impliquée dans la disponibilité des nutriments, mais pas intégrées dans les modèles géochimiques. En outre, les enzymes extracellulaires peuvent être considérées comme un marqueur des activités microbiennes modifiées par les changements physiologiques de la plante en réponse à l’augmentation de la pCO2 atmosphérique (Burns et al. 2013). Outre leur implication dans la nutrition des plantes, la compréhension de leur régulation pourrait contribuer aux connaissances sur les mécanismes de stockage de carbone, et de résilience des agro écosystèmes aux changements climatiques. Quelque soit la nature de l’organisme producteur, les enzymes secrétées, ou libérées dans le milieu par lyse sont susceptibles d’interagir avec les constituants solides du milieu et les autres facteurs abiotiques (température, teneur en eau, pH…). Dans un premier temps, je pense qu’il faut se concentrer sur ces facteurs abiotiques, les mécanismes de libération des enzymes étant étudiés par ailleurs dans l’UMR Eco&Sols suite à l’ajout de litières végétales (I. Bertrand). Nous pourrons établir des liens entre nos travaux. La rhizosphère est une zone de sol modifiée par l’activité des racines, elle est donc dynamique (Carminati 2012). Parmi les facteurs susceptibles de modifier l’activité des enzymes extracellulaires (Figure 10), le pH, la teneur en eau ou la modification des propriétés de surface des colloïdes du sol par les composés exsudés par les racines sont particulièrement importants. Il existe des travaux sur la modélisation de l’activité enzymatique dans les sols mais
Figure 10 : représentation du contrôle environnemental des enzymes l ibérées dans le mil ieu. Les cinétiques enzymatiques sont représentées par les paramètres kcat (v itesse de conversion du substrat), Km (constante
de Michaelis Menten), and Ea (énergie d’activation),
repris de (Burns et al. 2013)

48
déconnectés de la régulation réaliste des facteurs abiotiques sur celle ci (Steinweg et al. 2012), et particulièrement pour le processus d’adsorption délicat à prédire dans un sol (George et al. 2007a; Kedi et al. 2013a; Kedi et al. 2013b; Louche et al. 2010) . Mon hypothèse de recherche est que l’évaluation de l’activité enzymatique des sols rhizosphériques nécessite des fonctions réponses adaptées à ce compartiment de sol à cause des modifications des propriétés du sol induites par les activités racinaires.
Stratégie de recherche
Pour appréhender la complexité du système que j’étudie, je privilégierai une approche expérimentale, simplificatrice et réductionniste en vue de la modélisation. L’approche que j’envisage est principalement empirique dans un premier temps afin d’établir des fonctions réponses de l’activité enzymatique extracellulaire dans la rhizosphère dans l’objectif d’intégration de l’activité enzymatique dans les modèles de géochimie. Je développerai une approche basée en 3 étapes: Etape 1. Identification des gammes de variations de l’activité phytasique pour des sols mycorhizophériques artificiels, et identification des facteurs prépondérants (Projet 1) Les sols mycorhizosphériques sont les sols modèles de l’UMR (Chromic Cambisol de Cazevieille et Luvisol de Auzeville), non stériles, dont l’ambiance géochimique aura été modifiée par l’ajout de molécules secrétées par les plantes ou les champignons et bactéries associées. L’identification et les proportions sont déterminées à partir de la littérature On peut citer en exemple l’oxalate ou carbone assimilable. A ces sols « mycorhizosphériques », je rajouterai des enzymes exogènes (Projet 1) de Aspergillus niger, Bacillus subtilis et Debaryomyces castelli comme enzymes modèles. En fonction de la gamme de réponse obtenue dans les plans expérimentaux, je sélectionnerai les facteurs les plus influents et évaluerai la proportion d’enzymes adsorbées versus libre. En parallèle de ce travail, j’évaluerai la proportion d’enzymes intra cellulaires et extracellulaires par extraction de sol dans une expérimentation menée par mes collègues J. Trap et C. Plassard en microcosmes constitués d’une plante mycorhizée (Pin maritime Pinus pinaster et Hebeloma cylindrosporum), d’un nématode (Rhabditis sp)et d’une bactérie (Bacillus subtilis) en présence de phytate. Ces résultats pourront être également confrontés à ceux d’autres collègues impliqués dans le projet (H. Quiquampoix, H. Le Guernervé) qui utiliseront la RMN 2D DOSY pour étudier l’interaction des enzymes à differents pH. Etape 2. Obtention de formalismes réponses de l’activité enzymatique. L’approche expérimentale de (Steinweg et al. 2012) est particulièrement intéressante pour obtenir des formalismes de réponse comme ceux recherchés dans mon projet. Ces auteurs ont obtenu des formalismes de réponse de type Q10 pour la température ou vis à vis de la teneur en eau. Brièvement, il s’agit de mesurer l’activité enzymatique en microplaque (96 puits) à l’aide d’un spectrofluorimètre. Dans le cas du projet UnlockP, un substrat fluorescent analogue au phytate est en cours d’obtention. La technique en microplaque utilisant peu de substrats (sol et phytate), elle serait donc pertinente pour obtenir ces fonctions réponses. En outre, elle permettrait par la suite de recueillir du sol rhizosphérique et d’analyser si ces fonctions réponses sont valides afin de scénariser l’activité enzymatique sur le terrain si on connaît la variabilité temporelle au champ de certains facteurs comme le pH ou la température. Les étapes 1 et 2 seront faites principalement sur financement du projet ANR de Claude Plassard et en collaboration avec les partenaires impliqués dans le projet. Le cas échéant, si l’ensemble des

49
résultats n’est pas acquis dans le cadre de ce projet, je pense solliciter nos partenaires industriels, TIMAC agro international via le montage d’une ANR de type recherche collaborative. Etape 3 : vers une modélisation plus mécaniste de l’activité enzymatique J’analyserai ensuite les formalismes de la bioacatalyse supportée développés par les chimistes des matériaux. L’école de chimie de Montpellier, et plus particulièrement l’équipe MACS (Matériaux Avancés pour la Catalyse et la Santé) et l’équipe « Matériaux et Biologie » du Laboratoire de la Chimie de la Matière Condensée de Paris (Université Pierre et Marie Curie) seraient des interlocuteurs avec qui je compte collaborer. En effet, ces équipes ont des compétences en modélisation physico-chimique des enzymes supportées. Il est frappant de constater les analogies entre le fonctionnement des enzymes supportées et celles du sol car certains processus influençant l’activité comme l’adsorption ou le piégeage dans le réseau poral sont communs . Il est donc tentant d’examiner les formalismes des enzymes supportées pour voir si ceux ci ne pourraient être adaptés aux sols.
OUVERTURE DE MA THEMATIQUE DE RECHERCHES VERS D’AUTRES QUESTIONS DE RECHERCHES
… pour mieux comprendre le fonctionnement du sol et des services écosystémiques Dans un cadre plus général de compréhension du fonctionnement du sol et des services associés, l’évaluation des systèmes de culture à base d’itinéraires techniques relevant de l’agroécologie comme les associations de culture doit être réalisée (Brooker et al. 2014). (Geisseler and Scow 2014) montrent que les applications répétées d’engrais azotés peuvent altérer la composition des communautés microbiennes en utilisant différents indicateurs microbiens et biochimiques. Ces auteurs insistent sur la cinétique lente des changements et donc l’importance des suivis à des pas de temps supérieurs à 2 ou 3 ans. Dans une de nos études, nous avons déterminé une période de 7-11 ans [P 8]. Les nouvelles pratiques agroécologiques doivent être donc être évaluées à une échelle de temps de plusieurs années pour analyser leurs effets globaux sur le fonctionnement des écosystèmes et pas seulement comme alternative à une réduction des intrants. Récemment, (Tang et al. 2014) ont testé l’hypothèse que l’association entre des plantes peut avoir un effet sur la communauté bactérienne et le cycle du P. Ces auteurs montrent que la teneur en C, N et P de la biomasse microbienne de la rhizosphère est plus importante dans les cultures associées que pures (Figure 11Erreur ! Source du renvoi introuvable.). Lors d’un projet avec un collègue de mon UMR (Louis Mareschal), nous avons testé si l’association entre plantes permettait la facilitation d’un élément comme le P. Nous avons mis en évidence des variations de la disponibilité en N et P en fonction de scenarii contrastés de gestions sylvicoles au Congo et au Brésil dans des associations de
Figure 12 : schéma conceptuel des relations entre communautés bactériennes et fert il isation azotée, repris de (Geisseler and Scow 2014)
Figure 11 : Teneur en Carbone (A), et phosphore (B) dans la rhizosphere et le sol non rh izosphérique de blé, pois chiche et lenti l le cult ivés seuls ou en association, repris de (Tang et al . 2014)

50
culture avec des légumineuses (Projet 6, [C. 2]). Par contre, dans des associations céréales-légumineuses en France, nous n’avons pas mis en évidence de différences de disponibilités en P, seulement un effet du précédent cultural. D’après (Brooker et al. 2014), les études sur les pratiques agro écologiques comme les cultures associées se focalisent sur un processus plutôt que sur les multiples interactions entre processus. Par conséquent, il est délicat d’identifier les limitations des processus majeurs comme la disponibilité en nutriments limitant les rendements ou les services écosystémiques. Dans leur synthèse sur les cultures associés, (Brooker et al. 2014) insistent également sur la nécessité d’étudier la santé du sol (concept proche de la qualité des sols) dans le cas des cultures associées. Selon ces auteurs, les bénéfices des cultures associées peuvent être type de sol dépendantes. Ce résultat étayé par nos travaux ( [P 2][P 5][P 8]) sur l’importance de la qualité inhérente des sols me questionne sur l’adaptation des pratiques agro écologiques en fonction du type de sol. Ma question de recherche est la suivante : existe t’il un potentiel d’adaptation des pratiques agro écologiques en fonction du type de sol ?
Stratégie de recherche
Je pense que l’utilisation des indicateurs de fonctionnement des sols intégrant les activités enzymatiques, associées au suivi de la dynamique des flux au sein de la rhizosphère et résidusphère au moyen de résines échangeuses d’ions placées au champ peut permettre d’évaluer les pratiques agro écologiques. Cette stratégie couplée à un utilisation efficace des outils statistiques peut nous faire avancer dans notre compréhension du fonctionnement du sol (qualité des sols) et des services écosystémiques associés. Notre méthodologie a démontré son efficacité sur l’étude de la qualité des sols et la disponibilité en nutriments. Je souhaiterai établir en fonction d’un gradient latitudinal, un réseau d’expériences de pratiques agro écologiques afin de tester ma question de recherche. Pour ce faire, outre les compétences internes de l’UMR, et ses sites expérimentaux comprenant des cultures associées pérennes ou annuelles, je pourrai me tourner vers des unités comme le Centre d’Ecologie Fonctionnelle et Evolutive de Montpellier, l’UMR d’Agroécologie de Dijon pour compléter nos indicateurs notamment de trait fonctionnels des plantes ou de biologie moléculaire. Typiquement, ce type de projet pourrait être financé par des programmes internationaux (ANR international) ou d’échanges bilatéraux.
DES ENVIES, DES IDEES POUR LE FUTUR
Cette partie n’est pas intégrée dans les perspectives à court et moyen terme de mon projet de recherche mais j’aimerai étudier ces questions par des discussions avec des collègues écophysiologistes. J’ai deux idées qui pourraient être partagées. Idée 1. Les changements climatiques intègrent l’augmentation de la pCO2 et ses effets sur la physiologie de la plante et par conséquent son exsudation (Jossi et al. 2006). En conditions de bas intrants, la plante peut adapter sa physiologie afin de conserver ses nutriments. Par exemple, le phénomène de résorption est connu pour influencer la dynamique des éléments en modifiant la qualité des litières (Vergutz et al. 2012). L’intensité de la résorption serait fonction de la disponibilité en éléments dans le sol (Wang et al. 2014). En conditions de bas intrants, la résorption des éléments peut elle contribuer à limiter la disponibilité des éléments ? Idée 2. Certains auteurs montrent un lien entre la nutrition ammoniacale et potassique (Balkos et al.) On peut donc légitimement se demander comment le potassium en contrôlant les flux d’eau et d’éléments vers la plante (mass flow et diffusion) contrôlera en retour la disponibilité des éléments N et P pour les organismes de la rhizosphère des plantes et les plantes. Par conséquent, je me pose la question du contrôle de la disponibilité en N et P par le K en contexte de changement climatique.

51
J’exprime dans cette partie une envie d’intégrer des aspects d’écophysiologie dans mon projet de recherche, je pense rencontrer en premier lieu vers mes collègues écophysiologistes de l’UMR mais également les collègues montpelliérains du LEPSE (Laboratoire d’Ecophysiologie des Plantes sous Stress Environnementaux).
CONCLUSIONS
C’est avec enthousiasme que j’ai terminé la rédaction de cette partie « Projet scientifique » de mon dossier de candidature d’HDR. Mes travaux de recherche et le projet que je souhaite développer ont pour ambition de mieux comprendre la disponibilité des éléments dans les écosystèmes terrestres. Mes approches tentent de concilier la géochimie avec l’écologie des sols afin de mieux comprendre le rôle des végétaux dans les cycles biogéochimiques. L’intérêt d’un tel rapprochement est crucial pour l’enseignement en école d’agronomie et au cœur des problématiques de l’INRA pour évaluer, et proposer des pistes de pratiques agro écologiques.

52
Références

53
Alamgir M, McNeill A, Tang C, Marschner P (2012) Changes in soil P pools during legume residue
decomposition. Soil Biology and Biochemistry 49 (0):70-77 Andrews SS, Carroll CR (2001) Designing a soil quality assessment tool for sustainable agroecosystem
management. Ecological Applications 11 (6):1573-1585. Baggs E, Smales C, Bateman E (2010) Changing pH shifts the microbial sourceas well as the
magnitude of N2O emission from soil. Biology and Fertility of Soils 46 (8):793-805 Balkos KD, Britto DT, Kronzucker HJ (2010) Optimization of ammonium acquisition and metabolism by
potassium in rice (Oryza sativa L. cv. IR-72). Plant Cell and Environment 33 (1):23-34 Barrios E (2007) Soil biota, ecosystem services and land productivity. Ecological Economics 64 (2):269- Beri V, Goswami, K.P., Brar, S.S. (1978) Urease activity and its Michaelis constant for soil systems. Plant
and Soil 49 (1):105-115 Blossfeld S, Schreiber CM, Liebsch G, Kuhn AJ, Hinsinger P (2013) Quantitative imaging of rhizosphere
pH and CO2 dynamics with planar optodes. Annals of Botany 112 (2):267-276. Bolland MDA, Gilkes RJ (1990) Rock phosphate are not effective fertilizers in western autralians soils -
a review of 100 yeras of reserach. Fertilizer Research 22 (2):79-95. Bornette G, Lagadeuc Y (2012) Prospective « Ecologie fonctionnelle ». Les Cahiers Prospectives.
L'Institut Ecologie et Environnement Bremner MIZeJM (1976) Stability of urease in soils. Soil Biology and Biochemistry 9:135-140 Britto DT, Kronzucker HJ (2008) Cellular mechanisms of potassium transport in plants. Physiologia
Plantarum 133 (4):637-650 Brooker RW, Bennett AE, Cong W-F, Daniell TJ, George TS, Hallett PD, Hawes C, Iannetta PPM, Jones
HG, Karley AJ, Li L, McKenzie BM, Pakeman RJ, Paterson E, Schöb C, Shen J, Squire G, Watson CA, Zhang C, Zhang F, Zhang J, White PJ (2014) Improving intercropping: a synthesis of research in agronomy, plant physiology and ecology. New Phytologist:n/a-n/a. doi:10.1111/nph.13132
Bundt M, Widmer F, Pesaro M, Zeyer J, Blaser P (2001) Preferential flow paths: biological ‘hot spots’ in soils. Soil Biology and Biochemistry 33 (6):729-738.
Burns RG, DeForest JL, Marxsen J, Sinsabaugh RL, Stromberger ME, Wallenstein MD, Weintraub MN, Zoppini A (2013) Soil enzymes in a changing environment: Current knowledge and future directions. Soil Biology and Biochemistry 58:216-234.
Carlsson N, Gustafsson H, Thorn C, Olsson L, Holmberg K, Akerman B (2014) Enzymes immobilized in mesoporous silica: A physical-chemical perspective. Advances in Colloid and Interface Science 205:339-360.
Carminati A (2012) A Model of Root Water Uptake Coupled with Rhizosphere Dynamics. Vadose Zone Journal 11 (3):-.
Carpenter SR (2005) Eutrophication of aquatic ecosystems: Bistability and soil phosphorus. Proceedings National Academy Sciences United States of America 102 (29):10002-10005.
Cellier P, Rochette P, Henault C, Genermont S, Laville P, Loubet B (2013) Gaseous emissions at different space scales in the nitrogen cycle: A review. Cahiers de l' Agriculture 22 (4):258-271.
Coll P, Villenave C, Le Cadre E (2010) La qualité du sol, une notion difficile à appréhender. Réussir Vigne 166:16-23
Colomb B, Debaeke P, Jouany C, Nolot JM (2007) Phosphorus management in low input stockless cropping systems: Crop and soil responses to contrasting P regimes in a 36-year experiment in southern France. European Journal of Agronomy 26 (2):154-165.
Cordell D, Drangert J-O, White S (2009) The story of phosphorus: Global food security and food for thought. Global Environmental Change 19 (2):292-305
Coroneos C, Hinsinger P, Gilkes RJ (1996) Granite powder as a source of potassium for plants: A glasshouse bioassay comparing two pasture species. Fertilizer Research 45 (2):143-152

54
Coulouma G, Boizard H, Trotoux G, Lagacherie P, Richard G (2006) Effect of deep tillage for vineyard establishment on soil structure: A case study in Southern France. Soil & Tillage Research 88 (1-2):132-143.
Culman SW, Young-Mathews A, Hollander AD, Ferris H, Sanchez-Moreno S, O'Geen AT, Jackson LE (2010) Biodiversity is associated with indicators of soil ecosystem functions over a landscape gradient of agricultural intensification. Landscape Ecology 25 (9):1333-1348.
de Groot RS, Wilson MA, Boumans RMJ (2002) A typology for the classification, description and valuation of ecosystem functions, goods and services. Ecological Economics 41 (3):393-408.
Dequiedt S, Saby NPA, Lelievre M, Jolivet C, Thioulouse J, Toutain B, Arrouays D, Bispo A, Lemanceau P, Ranjard L (2011) Biogeographical patterns of soil molecular microbial biomass as influenced by soil characteristics and management. Global Ecology Biogeography 20 (4):641-652.
Devau N, Geard F, Le Cadre E, Roger L, Jaillard B, Hinsinger P (2008) Using a mechanistic adsorption model to understand the influence of soil pH on the environmental availability of Phosphorus: Application to a Chromic Cambisol. Geochimica Et Cosmochimica Acta 72 (12):A214-A214
Devau N, Hinsinger P, Le Cadre E, Colomb B, Gerard F (2011a) Fertilization and pH effects on processes and mechanisms controlling dissolved inorganic phosphorus in soils. Geochimica Et Cosmochimica Acta 75 (10):2980-2996.
Devau N, Hinsinger P, Le Cadre E, Gerard F (2011b) Root-induced processes controlling phosphate availability in soils with contrasted P-fertilized treatments. Plant and Soil 348 (1-2):203-218.
Devau N, Le Cadre E, Hinsinger P, Gerard F (2010a) A mechanistic model for understanding root-induced chemical changes controlling phosphorus availability. Annals of Botany 105 (7):1183-1197.
Devau N, Le Cadre E, Hinsinger P, Gerard F (2010b) Surface complexation modelling of phosphorus availability and bioavailability for plants. Geochimica Et Cosmochimica Acta 74 (12):A228-A228
Devau N, Le Cadre E, Hinsinger P, Jaillard B, Gerard F (2009) Soil pH controls the environmental availability of phosphorus: Experimental and mechanistic modelling approaches. Applied Geochemistry 24 (11):2163-2174
Doré T, Makowski D, Malézieux E, Munier-Jolain N, Tchamitchian M, Tittonell P (2011) Facing up to the paradigm of ecological intensification in agronomy: Revisiting methods, concepts and knowledge. European Journal of Agronomy 34 (4):197-210
Duputel M, Devau N, Brossard M, Jaillard B, Jones DL, Hinsinger P, Gerard F (2013a) Citrate adsorption can decrease soluble phosphate concentration in soils: Results of theoretical modeling. Applied Geochemistry 35:120-131.
Duputel M, Van Hoye F, Toucet J, Gerard F (2013b) Citrate adsorption can decrease soluble phosphate concentration in soil: Experimental and modeling evidence. Applied Geochemistry
Duran J, Delgado-Baquerizo M, Rodriguez A, Covelo F, Gallardo A (2013) Ionic exchange membranes (IEMs): A good indicator of soil inorganic N production. Soil Biology and Biochemistry 57:964-968.
Finzi AC, Cole JJ, Doney SC, Holland EA, Jackson RB (2011) Research frontiers in the analysis of coupled biogeochemical cycles. Frontiers in Ecology and the Environment 9 (1):74-80.
Geelhoed JS, Hiemstra T, Van Riemsdijk WH (1998) Competitive interaction between phosphate and citrate on goethite. Environmental Science and Technology 32 (14):2119-2123.
Geelhoed JS, Van Riemsdijk WH, Findenegg GR (1997) Effects of sulphate and pH on the plant-availability of phosphate adsorbed on goethite. Plant and Soil 197 (2):241-249.
Geelhoed JS, Van Riemsdijk WH, Findenegg GR (1999) Simulation of the effect of citrate exudation from roots on the plant availability of phosphate adsorbed on goethite. European Journal of Soil Science 50 (3):379-390.
Geisseler D, Scow KM (2014) Long-term effects of mineral fertilizers on soil microorganisms – A review. Soil Biology and Biochemistry 75 (0):54-63.

55
George TS, Quiquampoix H, Simpson RJ, Richardson AE (2007a) Interactions between phytases and soil constituents: implications for the hydrolysis of inositol phosphates. Inositol phosphates: linking agriculture and the environment.
George TS, Richardson AE, Simpson RJ (2005) Behaviour of plant-derived extracellular phytase upon addition to soil. Soil Biology and Biochemistry 37 (5):977-988
George TS, Simpson RJ, Gregory PJ, Richardson AE (2007b) Differential interaction of Aspergillus niger and Peniophora lycii phytases with soil particles affects the hydrolysis of inositol phosphates. Soil Biology and Biochemistry 39 (3):793-803.
Giaveno C, Celi L, Richardson AE, Simpson RJ, Barberis E (2010) Interaction of phytases with minerals and availability of substrate affect the hydrolysis of inositol phosphates. Soil Biology and Biochemistry 42 (3):491-498
Gil-Sotres F, Trasar-Cepeda C, Leiros MC, Seoane S (2005) Different approaches to evaluating soil quality using biochemical properties. Soil Biology and Biochemistry 37 (5):877-887.
Gould WD, Cook FD, Webster GR (1973) Factors affecting urea hydrolysis in several alberta soils. Plant and Soil 38:393-401
Grant CA, Jia S, Brown KR, Bailey LD (1996) Volatile losses of ammonia from surface applied urea and urea ammonium nitrate with and without the urease inhibitors NBPT or ammonium thiosulphate. Canadian Journal of Soil Science 76 (3):417-419
Guo F, Yost RS, Hue NV, Evensen CI, Silva JA (2000) Changes in phosphorus fractions in soils under intensive plant growth. Soil Science Society of America Journal 64 (5):1681-1689
Hamaoui-Laguel L, Meleux F, Beekmann M, Bessagnet B, Genermont S, Cellier P, Letinois L (2014) Improving ammonia emissions in air quality modelling for France. Atmospheric Environment 92:584-595.
Hildebrandt A, Guillamon M, Lacorte S, Tauler R, Barcelo D (2008) Impact of pesticides used in agriculture and vineyards to surface and groundwater quality (North Spain). Water Research 42 (13):3315-3326.
Hinsinger P (2001) Bioavailability of soil inorganic P in the rhizosphere as affected by root-induced chemical changes: a review. Plant and Soil 237 (2):173-195
Hinsinger P, Bengough AG, Vetterlein D, Young IM (2009) Rhizosphere: biophysics, biogeochemistry and ecological relevance. Plant and Soil 321 (1-2):117-152
Hinsinger P, Betencourt E, Bernard L, Brauman A, Plassard C, Shen J, Tang X, Zhang F (2011a) P for Two, Sharing a Scarce Resource: Soil Phosphorus Acquisition in the Rhizosphere of Intercropped Species. Plant Physiology 156 (3):1078-1086.
Hinsinger P, Bolland MDA, Gilkes RJ (1996) Silicate rock powder: Effect on selected chemical properties of a range of soils from Western Australia and on plant growth as assessed in a glasshouse experiment. Fertilizer Research 45 (1):69-79
Hinsinger P, Brauman A, Devau N, Gerard F, Jourdan C, Laclau J-P, Le Cadre E, Jaillard B, Plassard C (2011b) Acquisition of phosphorus and other poorly mobile nutrients by roots. Where do plant nutrition models fail? Plant and Soil 348 (1-2):29-61.
Hinsinger P, Brauman A, Devau N, Gerard F, Jourdan C, Laclau JP, Le Cadre E, Jaillard B, Plassard C (2011c) Acquisition of phosphorus and other poorly mobile nutrients by roots. Where do plant nutrition models fail? Plant and Soil 348 (1-2):29-61.
Hinsinger P, Plassard C, Jaillard B (2005) Rhizosphere: a new frontier for soil biogeochemistry. Journal of Geochemical Exploration 88:210-213
Hinsinger P, Plassard C, Tang C, Jaillard Bt (2003) Origins of root-mediated pH changes in the rhizosphere and their responses to environmental constraints: A review. Plant and Soil 248 (1 - 2):43-59
Husson O (2013) Redox potential (Eh) and pH as drivers of soil/plant/microorganism systems: a transdisciplinary overview pointing to integrative opportunities for agronomy. Plant and Soil 362 (1-2):389-417.

56
Irshad U, Brauman A, Villenave C, Plassard C (2012) Phosphorus acquisition from phytate depends on efficient bacterial grazing, irrespective of the mycorrhizal status of Pinus pinaster. Plant and Soil 358 (1-2):148-161.
Irshad U, Villenave C, Brauman A, Plassard C (2011) Grazing by nematodes on rhizosphere bacteria enhances nitrate and phosphorus availability to Pinus pinaster seedlings. Soil Biology and Biochemistry (10):2121-2126.
Jackson LE, Burger M, Cavagnaro TR (2008) Roots nitrogen transformations, and ecosystem services. In: Annual Review of Plant Biology, vol 59. Annual Review of Plant Biology. Annual Reviews, Palo Alto, pp 341-363.
Jones DL, Dennis PG, Owen AG, Hees PAWv (2003) Organic acid behavior in soils misconceptions and knowledge gaps. Plant and Soil 248 (1):31-41
Jones DL, Healey JR, Willett VB, Farrar JF, Hodge A (2005) Dissolved organic nitrogen uptake by plants - an important N uptake pathway? Soil Biology and Biochemistry 37 (3):413-423.
Jossi M, Fromin N, Tarnawski S, Kohler F, Gillet F, Aragno M, Hamelin J (2006) How elevated pCO(2) modifies total and metabolically active bacterial communities in the rhizosphere of two perennial grasses grown under field conditions. Fems Microbiology Ecology 55 (3):339-350.
Karlen DL (2004) Soil quality as an indicator of sustainable tillage practices. Soil and Tillage Research 78 (2):129-130
Karlen DL, Andrews SS, Weinhold BJ, Doran W (2003) Soil quality: Humankind's foundation for survival. Journal of Soil and Water Conservation 58 (4):171-179
Karlen DL, Mausbach MJ, Doran JW, Cline RG, Harris RF, Schuman GE (1997) Soil quality: A concept, definition, and framework for evaluation. Soil Science Society of America Journal 61 (1):4-10
Kedi B, Abadie J, Sei J, Quiquampoix H, Staunton S (2013a) Diversity of adsorption affinity and catalytic activity of fungal phosphatases adsorbed on some tropical soils. Soil Biology and Biochemistry 56:13-20.
Kedi B, Sei J, Quiquampoix H, Staunton S (2013b) Persistence of catalytic activity of fungal phosphatases incubated in tropical soils. Soil Biology and Biochemistry 56:69-74.
Klose S, Tabatabaï MA (1999) Urease activity of microbial biomass in soils. Soil Biology and Biochemistry 31:205-211
Klose ST, M.A. (2000) Urease activity of microbial biomass in soils as affected by cropping systems. Biology Fertility of Soils 31:191-199
Koopmans GF, Chardon WJ, Ehlert PAI, Dolfing J, Suurs RAA, Oenema O, van Riemsdijk WH (2004) Phosphorus availability for plant uptake in a phosphorus-enriched noncalcareous sandy soil. Journal of Environmental Quality 33 (3):965-975
Kuczak CN, Fernandes ECM, Lehmann J, Rondon MA, Luizao FJ (2006) Inorganic and organic phosphorus pools in earthworm casts (Glossoscolecidae) and a Brazilian rainforest Oxisol. SSoil Biology and Biochemistry 38 (3):553-560
Lagacherie P, Coulouma G, Ariagno P, Virat P, Boizard H, Richard G (2006) Spatial variability of soil compaction over a vineyard region in relation with soils and cultivation operations. Geoderma 134 (1-2):207-216.
Le Bissonnais Y, Blavet D, De Noni G, Laurent JY, Asseline J, Chenu C (2007) Erodibility of Mediterranean vineyard soils: Relevant aggregate stability methods and significant soil variables. European Journal of Soil Science 58 (1):188-195
Le Cadre E, Genermont S, Decuq C, Recous S, Cellier P (2005) A laboratory system to estimate ammonia volatilization. Agronomy and Sustainable Development 25 (1):101-107
Li H, Shen J, Zhang F, Clairotte M, Drevon JJ, Le Cadre E, Hinsinger P (2008) Dynamics of phosphorus fractions in the rhizosphere of common bean (Phaseolus vulgaris L.) and durum wheat (Triticum turgidum durum L.) grown in monocropping and intercropping systems. Plant and Soil 312 (1-2):139-150
Limousin G, Gaudet JP, Charlet L, Szenknect S, Barthes V, Krimissa M (2007) Sorption isotherms: A review on physical bases, modeling and measurement. Applied Geochemistry 22 (2):249-275.

57
Loreau M, Naeem S, Inchausti P, Bengtsson J, Grime JP, Hector A, Hooper DU, Huston MA, Raffaelli D, Schmid B, Tilman D, Wardle DA (2001) Ecology - Biodiversity and ecosystem functioning: Current knowledge and future challenges. Science 294 (5543):804-808.
Louche J, Ali MA, Cloutier-Hurteau B, Sauvage F-X, Quiquampoix H, Plassard C (2010) Efficiency of acid phosphatases secreted from the ectomycorrhizal fungus Hebeloma cylindrosporum to hydrolyse organic phosphorus in podzols. Fems Microbiology Ecology 73 (2):323-335.
Makboul HE, Ottow JCG (1979) Clays minerals and the michaelis constant of urease. Soil Biology and Biochemistry 11:683-686
Makowski D, Nesme T, Papy F, Dore T (2014) Global agronomy, a new field of research. A review. Agronomy and Sustainable Development 34 (2):293-307.
Malik MA, Marschner P, Khan KS (2012) Addition of organic and inorganic P sources to soil - Effects on P pools and microorganisms. Soil Biology and Biochemistry 49 (0):106-113
Mallarino AP, Atia AM (2005) Correlation of a resin membrane soil phosphorus test with corn yield and routine soil tests. Soil Science Society of America Journal 69 (1):266-272
Manning DAC (2010) Mineral sources of potassium for plant nutrition. A review. Agronomy and Sustainable Development 30 (2):281-294.
McGarity JW, Myers MG (1967) A survey of urease activity in soils of northern New south Wales. Plant and soil 27 (2):217-238
McNaughton SJ, Zuniga G, McNaughton MM, Banyikwa FF (1997) Ecosystem catalysis: soil urease activity and grazing in the Serengeti system. Oikos 80:467-469
Menendez S, Barrena I, Setien I, Gonzalez-Murua C, Estavillo JM (2012) Efficiency of nitrification inhibitor DMPP to reduce nitrous oxide emissions under different temperature and moisture conditions. Soil Biology and Biochemistry 53:82-89.
Menendez S, Merino P, Pinto M, Gonzalez-Murua C, Estavillo JM (2006) 3,4-dimethylpyrazol phosphate effect on nitrous oxide, nitric oxide, ammonia, and carbon dioxide emissions from grasslands. Journal of Environmental Quality 35 (4):973-981.
Menut L, Bessagnet B, Khvorostyanov D, Beekmann M, Blond N, Colette A, Coll I, Curci G, Foret G, Hodzic A, Mailler S, Meleux F, Monge JL, Pison I, Siour G, Turquety S, Valari M, Vautard R, Vivanco MG (2013) CHIMERE 2013: a model for regional atmospheric composition modelling. Geoscientific Model Development 6 (4):981-1028.
Morillas L, Portillo-Estrada M, Gallardo A (2013) Wetting and drying events determine soil N pools in two Mediterranean ecosystems. Applied Soil Ecology 72 (0):161-170.
Moyo CC, Kissel DE, Cabrera ML (1989) Temperature effects on soil urease activity. Soil Biology and Biochemistry 21 (7):935-938
Myers MG, McGarity JW (1968) The urease activity in profiles of five great soil groups from northern New South Wales. Plant and Soil 28 (1):25-37
Myers RG, Sharpley AN, Thien SJ, Pierzynski GM (2005) Ion-sink phosphorus extraction methods applied on 24 soils from the continental USA. Soil Science Society of America Journal 69 (2):511-521
Nannipieri P, Ceccanti B, Cervelli S, Sequi P (1978) Stability and kinetic properties of humus-urease complexes. Soil Biology and Biochemistry 10:143-147
Naseby D, James L (2002) Enzymes and micro organisms in the rhizosphere. Enzymes in the environment.
Nuria R, Jerome M, Leonide C, Christine R, Gerard H, Etienne I, Patrick L (2011) IBQS: A synthetic index of soil quality based on soil macro-invertebrate communities. Soil Biology and Biochemistry 43 (10):2032-2045.
Pal S, Chhonkar PK (1981) Urease activity in relation to soil characteristics. Pedobiologia 21 (152-158) Payne RJ, Dise NB, Stevens CJ, Gowing DJ, Partners B (2013) Impact of nitrogen deposition at the
species level. Proceedings National Academy of Sciences of United States of America 110 (3):984-987.

58
Pellerin S, Recous S, Roger-Estrade J (2006) La composante chimique. In: Quae E (ed) L'agronomie aujourd'hui. Editions Quae, pp 177-198
Pettit NM, Smith ARJ, Freeedman RB, Burns RG (1976) Soil urease: activity, stability, and kinetics properties. Soil Biology and Biochemistry 8:479-484
Pope CA, Thun MJ, Namboodiri MM, Dockery DW, Evans JS, Speizer FE, Heath CW (1995) Particulate air-pollution as a predictor of mortality in a prospective -study of US adults. American Journal of Respiratory and Critical Care Medicine 151 (3):669-674
Praveen-Kumar, Aggarwal RK (1998) Interdependence of ammonia volatilization and nitrification in arid soils. Nutrient Cycling in Agroecosystems 51 (3):201-207
Qian P, Schoenau JJ (2002) Practical applications of ion exchange resins in agricultural and environmental soil research. Canadian Journal of Soil Science 82 (1):9-21
Rao MA, Violante A, Gianfreda L (2000) Interaction of acid phosphatase with clays, organic molecules and organo-mineral complexes: kinetics and stability. Soil Biology and Biochemistry 32 (7):1007-1014.
Rao S (1983) Urea adsorption in some Trinidad soils. Tropical Agriculture 60 (3):201-204 Regan KM, Nunan N, Boeddinghaus RS, Baumgartner V, Berner D, Boch S, Oelmann Y, Overmann J,
Prati D, Schloter M, Schmitt B, Sorkau E, Steffens M, Kandeler E, Marhan S (2014) Seasonal controls on grassland microbial biogeography: Are they governed by plants, abiotic properties or both? Soil Biology and Biochemistry 71:21-30. d
Renella G, Landi L, Garcia Mina JM, Giagnoni L, Nannipieri P (2007) Microbial and hydrolase activity after release of indoleacetic acid and ethylene-polyamine precursors by a model root surface. Applied Soil Ecology 47 (2):106-110
Reynolds CM, Wolf DC (1987) Influence of urease activity and soil properties on ammonia volatilization from urea. Soil Science 143 (6):418-425
Richardson AE, Barea JM, McNeill AM, Prigent-Combaret C (2009) Acquisition of phosphorus and nitrogen in the rhizosphere and plant growth promotion by microorganisms. Plant and Soil 321 (1-2):305-339
Robinson DA, Hockley N, Dominati E, Lebron I, Scow KM, Reynolds B, Emmett BA, Keith AM, de Jonge LW, Schjønning P, Moldrup P, Jones SB, Tuller M (2012) Natural Capital, Ecosystem Services, and Soil Change: Why Soil Science Must Embrace an Ecosystems Approach. Vadose zone journal 11 (1).
Roemheld V, Kirkby EA (2010) Research on potassium in agriculture: needs and prospects. Plant and Soil 335 (1-2):155-180.
Rosso L, Lobry JR, Bajard S, Flandrois JP (1995) Convenient model to describe the combined effects of temperature and pH on microbial-growth. Applied and Environmental Microbiology 61 (2):610-616
Rosso L, Lobry JR, Flandrois JP (1993) An unexpected correlation between cardinal temperatures of microbial growth highlighted by a new model. Journal of Theorical Biology 162:447-463
Salome C, Coll P, Lardo E, Villenave C, Blanchart E, Hinsinger P, Marsden C, Le Cadre E (2014) Relevance of use-invariant soil properties to assess soil quality of vulnerable ecosystems: the case of Mediterranean vineyards. Ecological Indicators 43:83-93.
Scheer C, Rowlings DW, Firrel M, Deuter P, Morris S, Grace PR (2014) Impact of nitrification inhibitor (DMPP) on soil nitrous oxide emissions from an intensive broccoli production system in sub-tropical Australia. Soil Biology and Biochemistry 77:243-251.
Shi XW, Sun ML, Zhou B, Wang XY (2009) Identification, characterization, and overexpression of a phytase with potential industrial interest. Canadian Journal of Microbiology 55 (5):599-604
Sigg L, Behra P, Stumm W (2006) Chimie aux interfaces. In: Dunod (ed) Chimie des milieux aquatiques. Dunod, pp 337-395
Sinsabaugh RL, Lauber CL, Weintraub MN, Ahmed B, Allison SD, Crenshaw C, Contosta AR, Cusack D, Frey S, Gallo ME, Gartner TB, Hobbie SE, Holland K, Keeler BL, Powers JS, Stursova M,

59
Takacs-Vesbach C, Waldrop MP, Wallenstein MD, Zak DR, Zeglin LH (2008) Stoichiometry of soil enzyme activity at global scale. Ecology Letters 11 (11):1252-1264.
Steinweg JM, Dukes JS, Wallenstein MD (2012) Modeling the effects of temperature and moisture on soil enzyme activity: Linking laboratory assays to continuous field data. Soil Biology and Biochemistry 55 (0):85-92.
Sutton MA, Oenema O, Erisman JW, Leip A, van Grinsven H, Winiwarter W (2011) Too much of a good thing. Nature 472 (7342):159-161.
Sylvain ZA, Wall DH (2011) Linking soil biodiversity and vegetation: implications for a changing planet. American Journal of Botany 98 (3):517-527.
Tang XY, Bernard L, Brauman A, Daufresne T, Deleporte P, Desclaux D, Souche G, Placella SA, Hinsinger P (2014) Increase in microbial biomass and phosphorus availability in the rhizosphere of intercropped cereal and legumes under field conditions. Soil Biology and Biochemistry 75:86-93.
Tilman D, Cassman KG, Matson PA, Naylor R, Polasky S (2002) Agricultural sustainability and intensive production practices. Nature 418 (6898):671-677.
Trasar-Cepeda C, Leiros MC, Gil-Sotres F (2008) Hydrolytic enzyme activities in agricultural and forest soils. Some implications for their use as indicators of soil quality. Soil Biology and Biochemistry 40 (9):2146-2155.
Vergutz L, Manzoni S, Porporato A, Novais RF, Jackson RB (2012) Global resorption efficiencies and concentrations of carbon and nutrients in leaves of terrestrial plants. Ecological Monographs 82 (2):205-220
Vitousek PM, Porder S, Houlton BZ, Chadwick OA (2010) Terrestrial phosphorus limitation: mechanisms, implications, and nitrogen-phosphorus interactions. Ecological Applications 20 (1):5-15.
Wagg C, Bender SF, Widmer F, van der Heijden MGA (2014) Soil biodiversity and soil community composition determine ecosystem multifunctionality. Proceedings of the National Academy of Sciences of the United States of America 111 (14):5266-5270.
Wang ZN, Lu JY, Yang HM, Zhang X, Luo CL, Zhao YX (2014) Resorption of nitrogen, phosphorus and potassium from leaves of lucerne stands of different ages. Plant and Soil 383 (1-2):301-312.
Wardle DA, Bardgett RD, Klironomos JN, Setala H, van der Putten WH, Wall DH (2004) Ecological linkages between aboveground and belowground biota. Science 304 (5677):1629-1633.
Weiske A, Benckiser G, Ottow JCG (2001) Effect of the new nitrification inhibitor DMPP in comparison to DCD on nitrous oxide (N2O) emissions and methane (CH4) oxidation during 3 years of repeated applications in field experiments. Nutrient Cycling in Agroecosystems 60 (1-3):57-64.
Wienhold BJ, Andrews SS, Karlen DL (2004) Soil quality: a review of the science and experiences in the USA. Environmental Geochemistry and Health 26 (2-3):89-95.
Wilson MA, Tran NH, Milev AS, Kannangara GSK, Volk H, Lu GQM (2008) Nanomaterials in soils. Geoderma 146 (1-2):291-302.
Withers PJA, Sylvester-Bradley R, Jones DL, Healey JR, Talboys PJ (2014) Feed the Crop Not the Soil: Rethinking Phosphorus Management in the Food Chain. Environmental Science & Technology 48 (12):6523-6530.
Zantua MI, Dumesnil LC, Bremner JM (1977) Relationships between soil urease activity and others soil properties. Soil Science America Journal 41:350-352

60
Annexes

61
Annexe 1 : f iches synthétiques des encadrements

62
FICHE SYNTHETIQUE THESE DE DOCTORAT DE CHRISTOPHE TROUILLEFOU
2010-2014
Formation initiale : M1 en Master Matériaux Minces ou Divisés, Université de Provence, Marseille, M1 (2009-2010) Management de l'Environnement, Valorisation et Analyse, Université Paul Cézanne, Marseille, L3 (2008) Génie de l'Environnement et aménagement, Université de Provence, IUP DENTES, Marseille
M2 : master matériaux, université de Provence Aix Marseille 1. Financement : bourse CIFRE et fonctionnement sur collaboration de recherche (Projet 2). Encadrement: 1 directeur de thèse (C. Plassard, DR2 INRA HDR, UMR Eco&Sols), 1 co directeur (E. Belamie, MC EPHE, Institut Claude Gerhardt), 1 co directrice (E. Le Cadre, MC Montpellier SupAgro) . Valorisation des travaux: Christophe Trouillefou a valorisé sa thèse dans 1 article ACL, 1 enveloppe Soleau et 2 brevets en cours de rédaction. Christophe Trouillefou est intervenu pour effectuer des TD de 1ère année d’école en thermodynamique des réactions et des transferts. Historique du projet et insertion professionnelle de l’étudiant Lors d’une précédente collaboration (stage M1 P. Collet), j’avais rencontré E. Belamie et discuté avec lui des potentialités des matériaux mésoporeux. Lors d’une discussion informelle avec la direction R&D de Timac Agro international, mon employeur avant mon recrutement à Montpellier SupAgro, nous nous sommes convaincus de la nécessité de concevoir de nouveaux engrais qui accompagneront les pratiques agro écologiques des agriculteurs. L’idée d’un engrais à base de matériaux mésoporeux est née mais pour le mener à bien il fallait que je m’entoure de E. Belamie et Claude Plassard pour accompagner de projet. Bien que nous soyons 3 co encadrants, notre organisation, compréhension mutuelle des contraintes d’emploi du temps respectives, et respect des compétences de chaque ont permis d’encadrer efficacement C. Trouillefou pour faire la preuve de notre concept. C. Trouillefou avait en outre le profil et le tempérament adéquat pour ce type de sujet très exploratoire, et entre deux disciplines. Bilan personnel : Je retiens de cette thèse que l’approche multi disciplinaire est une réelle source d’innovation et que nous sommes peut être trop frileux pour oser aller vers des disciplines éloignées des nôtres. Je pense que les succès rencontrés lors de cette thèse sont aussi dus à l’entente entre les encadrants, l’écoute et le respect mutuel, mais aussi la solidarité pour que Christophe ait toujours un contact possible lors des périodes d’emploi du temps saisonnièrement chargées pour E. Belamie et moi.

63
FICHE SYNTHETIQUE POST DOCTORAT DE CLEMENCE SALOME
2012-2013
Formation initiale : M1 Master Biologie, Géosciences, Agroressources et Environnement de l’Université des Sciences et Techniques Université Montpellier 2, Spécialité Ecologie Fonctionnelle et Développement Durable, parcours Fonctionnement des Ecosystèmes Naturels et Cultivés (FENEC) M2 : Sol: Organisation, Fonctionnement Gestion" de la spécialité "Environnements continentaux et hydrosciences" de la mention SAGEP: "Sciences Agronomiques, Environnement et Paysage" du Master "Sciences et technologies du vivant, AgroParisTech Thèse : université de Neuchatel, Suisse Financement :.collaboration de recherche avec Timac Agro International (Projet 3) Valorisation des travaux : 1 publication et 1 en préparation, 1 journée de formation auprès de la division recherche et développement de Timac Agro International, 1 sortie terrain avec les 2ème année d’école (spécialité viticulture œnologie ) et master vigne et vin. Historique du projet et insertion professionnelle de l’étudiant : à l’issue de la thèse de Patrice Coll, j’ai souhaité continuer la valorisation de la base de données acquises. J’ai rencontré la direction de Timac Agro International à qui j’ai exposé le projet. Convaincus par la nécessité d’une meilleure formation de leurs technico commerciaux sur le fonctionnement du sol, et par le souhait de se développer sur les régions viticoles, le directeur R&D a accepté de financer une année post doctorale pour extraire l’information de la base de données. A l’issu de son année post doctorale, Clémence a choisi de ne pas continuer dans la recherche pour se tourner vers le conseil agronomique et la formation en Suisse où réside son conjoint. Bilan personnel : c’est ma première expérience d’encadrement post doctoral. J’ai apprécié de travailler avec un jeune chercheur dont les compétences différentes des miennes m’ont permis de progresser scientifiquement. A la différence d’un étudiant en doctorat, la personne est formée à la démarche scientifique et on attend de cette personne de prendre en charge le projet. C’est ce qu’a fait Clémence avec de grandes qualités scientifiques mais également humaines. J’ai apprécié ses qualités pédagogiques lors d’une sortie terrain avec mes étudiants de la spécialité viticulture-œnologie.

64
FICHE SYNTHETIQUE THESE DE DOCTORAT DE PATRICE COLL
2008-2011
Formation initiale : IUT, ingénieur agronome, spécialité Viticulture-œnologie Montpellier SupAgro. M2 : ingénieur agronome, spécialité Viticulture-œnologie Montpellier SupAgro. Financement : bourse Montpellier SupAgro/ADEME, et financement projet AIDY (Projet 5) et AO interne UMR Eco&Sols (Projet 7). Encadrement: 1 directeur de thèse (C. Villenave, CR1 IRD HDR, UMR Eco&Sols), 1 co directrice (E. Le Cadre, MC Montpellier SupAgro, UMR Eco&Sols) . Valorisation des travaux: Patrice Coll a publié 2 articles en premier auteur et 2 articles en co auteur. Il a communiqué ses résultats oralement dans 2 conférences internationales avec actes, et vulgarisé ses travaux dans différents supports. Patrice Coll a participé aux Unités d’Enseignement que je coordonne : UE géochimie et écologie du sol en 2ème année du Tronc Commun de la formation ingénieur Montpellier SupAgro. Historique du projet et insertion professionnelle de l’étudiant Je connais Patrice depuis sa rentrée en première année à Montpellier SupAgro. J’ ai interagi avec lui plus particulièrement lors de sa spécialisation en viticulture œnologie. Fils de viticulteur, Patrice était intéressé par le fonctionnement des sols viticoles. Nos échanges ont abouti sur la nécessité d’une meilleure compréhension du fonctionnement des sols viticoles. Ainsi, nous lui avons proposé un stage de fin d’études d’ingénieur qui portait sur l’évaluation du fonctionnement du sol sous vigne associée ou non à un enherbement. Les résultats de son M2 nous ont incité à demander une bourse de thèse à l’ADEME et à Montpellier SupAgro que nous avons obtenu. Immédiatement après sa thèse, il a été recruté dans un bureau d’études, conformément à son projet professionnel défini lors du Nouveau Chapitre de la Thèse. Patrice a su mobiliser ses connaissances et en acquérir de nouvelles comme les statistiques multivariées. Nous sommes restés en contact personnellement et professionnellement car nous étudions la possibilité de valoriser les spectres NIRS/MIRS acquis sur ses échantillons de thèse. Bilan personnel : C’est la deuxième thèse que j’ai co encadrée, 3 ans après mon arrivée dans l’UMR, et qui a débuté un an après celle de Nicolas Devau. La viticulture œnologie est une des spécialités de Montpellier SupAgro dans laquelle j’interviens. Ce contact privilégié avec les étudiants m’a permis de repérer Patrice et de définir avec lui un sujet de thèse correspondant à nos attentes scientifiques respectives. Les qualités d’organisation et d’autonomie mais également une formation adaptée et des relations avec le monde viticole, ont permis à Patrice de prendre en main son sujet. Lors de la thèse de Patrice, nous avons associé un Projet d’Elève Ingénieur pour l’étude de la perception de la qualité des sols par les viticulteurs, et organisé une sortie (pluvieuse) sur le terrain avec les étudiants de la spécialité Viticulture Œnologie et du master Vigne et Vin pour obtenir des données. Le personnel de l’UMR était également présent. Je pense pouvoir dire que c’était un bon moment de rencontre entre l’UMR et les étudiants de l’école et pour moi une façon différente de faire des liens. Les étudiants ont ensuite élaboré une fiche de synthèse des résultats qui a été jugée par l’UMR et reprise en notation par les enseignants. Le soutien de l’UMR a été très important à la fois sur le plan financier que par l’implication des personnes dans la collecte de données. Je garde un excellent souvenir de cette thèse car je me suis sentie encadrante à part entière et ai beaucoup appris au contact de Patrice et des viticulteurs.

65
FICHE SYNTHETIQUE THESE DE DOCTORAT DE NICOLAS DEVAU
2007-2010
Formation initiale : Université Montpellier 2 M2 : Master Biologie, Géosciences, Agroressources et Environnement de l’Université des Sciences et Techniques Université Montpellier 2, Spécialité Ecologie Fonctionnelle et Développement Durable, parcours Fonctionnement des Ecosystèmes Naturels et Cultivés (FENEC) Financement : bourse INRA/Région Languedoc Roussillon et ANR ANR Systerra Perfcom Peuplements complexes performants en agriculture bas intrants – Interaction multitrophiques et facilitation intergénotypiques. Encadrement: 1 directeur de thèse (F. Gérard, CR1 INRA, UMR Eco&Sols), 1 co directrice (E. Le Cadre, MC Montpellier SupAgro, UMR Eco&Sols) et 1 co encadrant de thèse (P. Hinsinger, DR1 INRA, UMR Eco&Sols) Valorisation des travaux de thèse : Nicolas Devau a publié 5 articles en premier auteur dans des revues internationales à comité de lecture (Devau et al. 2011a; Devau et al. 2011b; Devau et al. 2010a; Devau et al. 2009; Hinsinger et al. 2011c) à l’issu de sa thèse et a participé à deux conférences internationales avec actes (Devau et al. 2008; Devau et al. 2010b). Nicolas Devau a participé à l’unité d’enseignement optionnelle que je coordonne : UE géochimie et écologie du sol en 2ème année du Tronc Commun de la formation ingénieur Montpellier SupAgro. Historique du projet et insertion professionnelle de l’étudiant J’ai rencontré Nicolas Devau lors du stage d’immersion de la promotion FENEC 2006-2007 que je co-encadrais avec Benoit Jaillard (DR INRA). Nos discussions sur l’importance de la géochimie dans la compréhension de la disponibilité des nutriments ont motivé cet écologue à faire un virage thématique. Jeune recrue dans l’UMR Eco&Sols, je me suis entourée de mes collègues F. Gérard et P. Hinsinger pour les aspects géochimiques et fonctionnement de la rhizosphère. Ma contribution dans cette thèse est l’approche expérimentale pour étudier l’effet des variations du pH et la co définition du sujet de M2 et du sujet de thèse. A l’issu de cette thèse, Nicolas Devau a obtenu un poste de chercheur au BRGM. Bilan personnel : Le M2 et la thèse de Nicolas Devau se sont déroulés immédiatement après mon recrutement à Montpellier SupAgro. Cette période a été chargée pour moi car coïncidant avec une préparation de cours nouveaux et parfois éloignés de ma formation et la mise en œuvre d’un projet de recherche dans une UMR en reconstruction (fusion d’ UMR et d’UR). Le co encadrement était nécessaire pour mener à bien ce travail dans ce contexte. J’ai retenu de cette expérience que le co encadrement avec des chercheurs seniors bien que profitable nécessite une organisation et une communication définies dès le début de la thèse pour faire coïncider activité d’enseignements et de recherche, et clarifier les rôles respectifs auprès de l’étudiant. Cette thèse m’a permis de définir rapidement mon projet de recherche et de progresser rapidement en géochimie.

66

Publication N°1

ORIGINAL PAPER
Protected activity of a phytase immobilized in mesoporous silicawith benefits to plant phosphorus nutrition
Christophe Marcel Trouillefou • Edith Le Cadre •
Thomas Cacciaguerra • Frederique Cunin •
Claude Plassard • Emmanuel Belamie
Received: 2 September 2014 / Accepted: 10 November 2014! Springer Science+Business Media New York 2014
Abstract Phosphorus (P) is one of the main nutrientsrequired for plant growth and is absorbed and metabolized
in the form of orthophosphate ions (Pi). In agriculture, P is
a major component of fertilizers. Forecast shortages in Pmine stocks within the coming decades call for alternative
sources of this element for agricultural use. In the present
study, we explore the possibility of incorporating phytasenear the plant root system. Phytase is an enzyme capable of
mobilizing the main organic form of P as phytate, which
can represent up to 90 % of the total P stock in soils. Wereport the immobilization of phytase in KIT-6 silica mes-
oporous materials with large pores of 8.6 nm. The enzy-
matic activity is localized in the porous network, and themain kinetic features of the free phytase appear to be
maintained within the functional material (pHopt = 5–5.5
and Topt = 55 "C). Most importantly, the enzyme
immobilized in the pores shows a higher temperature sta-bility and appears to be protected from protease degrada-
tion. Finally, phytase-loaded KIT-6 proved efficient at
hydrolyzing phytate and delivering inorganic P to growingMedicago truncatula plants, which accumulated this newly
available P in both roots and shoots.
Keywords KIT-6 ! Mesoporous materials ! Immobilizedenzymes ! Phytase ! Environment ! Phosphorus
1 Introduction
In agriculture, efficient plant growth most often requiresfertilizing the soil with several mineral elements, among
which phosphorus plays a crucial role in vegetal develop-
ment. The manufacture of most fertilizers containingphosphorus relies on limited mine stocks. Because of the
fast-growing worldwide demand for this resource, a phos-
phorus crash has been predicted and seems to beapproaching [1]. This shortage in Phosphorus (P) resources,
together with eutrophication issues due to P accumulation,calls for a better and more sustainable management of the P
supply [2]. Organic P is partly stored in soils in the form of
inositol phosphate (phytate), which could be an alternativesource of P, provided the phytate can be hydrolyzed to
produce the orthophosphate ions required for plant nutrition
[3–5], and may help to reduce legacy soil P [2]. Phytase isan enzyme produced by many fungi and bacteria, which
specifically hydrolyze phytate, thus releasing inorganic
phosphate into the medium.Plants have a very low capacity to release this phytase
into their root environment [6, 7] and benefit from an
association with the aforementioned microorganismslocated in close vicinity to their root system. The main
C. M. Trouillefou ! T. Cacciaguerra ! F. Cunin ! E. BelamieInstitut Charles Gerhardt, UMR 5253, Equipe MACS, EcoleNationale Superieure de Chimie, Montpellier, France
C. M. Trouillefou ! E. Le CadreMontpellier SupAgro, UMR 1222, Eco&Sols, 2, Place PierreViala, 34060 Montpellier Cedex 02, France
C. M. Trouillefou (&)TIMAC-Agro International, Centre de Recherche enAgro-sciences, 55 Bd Jules Verger, 35800 Dinard, Francee-mail: [email protected]
C. PlassardINRA, UMR 1222, Eco&Sols, 2, Place Viala,34060 Montpellier Cedex 02, France
E. Belamie (&)Ecole Pratique des Hautes Etudes, Paris, Francee-mail: [email protected]
123
J Sol-Gel Sci Technol
DOI 10.1007/s10971-014-3577-0

limitations of this association for optimal plant nutrition are
the short-term viability of phytases released by microor-ganisms in the environment [4] and the very low diffusivity
of inorganic phosphate in soils [3]. These limitations could
be partly overcome by providing the plants with enzymesimmobilized in a porous network with sustained activity
located near the hair root system. Organic scaffolds, typi-
cally comprised of natural polymers (alginate, gelatin,chitosan, etc.), would be good candidates except for the
usually large porosity of the hydrated gels [8] and theirrapid biodegradation in soils due to soil enzymes (prote-
ases, chitinases, cellulases) secreted by microorganisms.
Alternatively, inorganic particulate materials have beenused to encapsulate proteins. Such inorganic materials are
resistant to environmental conditions and to enzymatic
degradation. Clays were not considered because of thestrong protein absorption and denaturation on such charged
surfaces. Instead, we turned to siliceous materials origi-
nally developed for fine chemistry purposes, with well-defined nanometer-size porosity and pore dimensions that
can be tuned to accommodate most proteins [9]. The
encapsulated proteins can be protected from denaturingagents and even stabilized by their interaction with the pore
surface, thus increasing their lifetime [10, 11]. Confine-
ment and the local chemical environment inside the porescan even lead to increased activity of the immobilized
enzymes [12]. For some applications, especially in the fine
chemical industry, such supported catalysis allows for theeasy recycling of expensive catalysts by simply filtering off
the supporting particles.
In the present study, we were aiming to immobilize andstabilize phytase enzymes into porous silica microparticles
to be used as alternative fertilizing agents, thanks to their
ability to mobilize inorganic P naturally present in mostagricultural soils. First, we synthesized and fully charac-
terized KIT-6 mesoporous materials with a tri-dimensional
porous structure and pores large enough to accommodatethe rather bulky phytase molecule (ca. 11 9 8.5 9
8.5 nm3). In parallel, MCM-41 silica with pores smaller
than the shortest axis of the enzyme, was used here as anegative control for the enzyme intrusion inside the
material. We report herein the adsorption behavior and
kinetics of phytase onto and into both materials and assessthe subsequent structural changes to the porosity of the
supporting materials. We studied the enzymatic activity of
the phytase-loaded materials in terms of the main enzy-matic kinetic features (substrate concentration, tempera-
ture, pH) and, most importantly, the protection of phytase
against protease activity. Finally, as a proof of concept wereport on the enhanced accumulation of P in Medicago
truncatula plants grown in the presence of phytase-loaded
mesoporous materials with phytate as the sole exogenoussource of P.
2 Materials and methods
2.1 Synthesis of mesoporous materials
The synthesis of large-pore silica materials such as KIT-6was performed in solution under strongly acidic conditions
(pH \ 1) [9, 13]. The synthesis was performed by addition
of 4.07 g of tribloc-copolymer pluronic P123 (Aldrich), 8 gHCl 36 % and 144 g H2O. The mixture was stirred at
35 !C until complete dissolution of the pluronic P123, and
3.98 g of butanol (Prolabo) were added and stirred foranother 2 h. Finally, 8.6 g of TEOS (Fluka) were added to
the mixture and stirred for 24 h. Overall, the molar ratios
for the synthesis of KIT-6 were 1 TEOS/0.017 P123/1.3BuOH/5.308 HCl/194 H2O. The resulting solid was filtered
and dried at 80 !C.
MCM-41, a classical bi-dimensional mesoporous mate-rial [14], was synthesized with small pores (\4 nm) and
used as a negative control for enzyme adsorption experi-
ments. It was obtained by mixing 2.6 g C18TAB (Aldrich)and 4 g SiO2 (Aerosil" 200, Degussa) in a basic solution
(pH [ 13) with 0.66 g NaOH (Prolabo) and 32.5 g H2O.
According to the procedure developed by Galarneau et al.[15], two hydrothermal post-treatments were performed to
strengthen the pore walls and improve the stability of the
material during calcination. This treatment is a dissolution/redeposition process that decreases the radius of curvature
on the particle surface and at the pore entrance [15, 16]. Themolar ratios for the synthesis mixture of MCM-41 were 1
SiO2/0.1 C18TAB/0.25 NaOH/54.5 H2O. Both hybrid
materials were calcined at 550 !C for 8 h in a muffle fur-nace, following a heating ramp at a rate of 2 !C/min.
2.2 Porous texture characterization by nitrogenvolumetry
Nitrogen volumetry was used to determine the main tex-tural characteristics of the materials (pore diameter, mes-
oporous surface area, porous volume), and their evolution
upon exposition to solutions of the enzyme [17, 18].Adsorption–desorption isotherms were obtained at 77 K
with an ASAP2020 apparatus from Micromeritics. Prior to
the sorption analysis, the samples were outgassed for 6 h(10-5 Torr) at 250 !C for the as-synthesized ordered silica,
or at 100 !C for the enzyme-impregnated samples to avoid
protein calcination. The samples surface area was deter-mined by the BET (Brunauer, Emmett and Teller) method.
2.3 Enzyme properties
The phytase used in the present study (myo-inositol
hexakisphosphate phosphohydrolase, EC 3.1.3.8) belongsto the group of histidine acid phytases able to hydrolyze 5
J Sol-Gel Sci Technol
123

of the 6 phosphomonoester bonds of phytate. We worked
with a recombinant protein produced by overexpressing thePhy-A gene from Aspergillus niger in yeast (Pichia pas-
toris) using methanol as a promoter, according to Boze
et al. [19] and Brunel et al. [20]. The phytase has amolecular mass of 85 kDa and an isoelectric point of 4.8
[21–23]. The enzyme extract, pure at 99 %, was produced
at the ‘‘Halle de Biotechnologie’’ (UMR IATE/UMR SPO,Montpellier, France) with an initial phytase activity of
59.8 ± 2.3 U/mL of enzyme extract (with 1 U = 1 lmolof orthophosphate produced per minute). A total protein
mass concentration of 45 mg/mL was determined in the
extract by a BCA Protein Assay (Pierce), yielding a spe-cific activity of approximately 1,330 U/mg of phytase.
2.4 Phytase activity measurements
The phytase activity was measured by quantifying the rate
of release of orthophosphate ions (Pi) from ultrapuresodium phytate (Sigma-Aldrich, Ref P0109). Unless
otherwise stated, the activity was measured using the
diluted free enzyme (1/30,000) or a fixed quantity offunctionalized mesoporous solid by the difference of Pi
concentration at time zero t0 and after 5 min of incubation
with the substrate at 37 !C, t5. The reaction mixture con-tained 300 lL of acetate buffer (0.5 M, pH 5.5), 100 lL of
enzyme sample (solution or dispersed mesoporous parti-
cles), and 100 lL of phytate solution in the same buffer atthe concentration indicated in the figure captions, typically
5 mM. The reaction was stopped with 500 lL trichloro-
acetic acid (1N) either before adding the substrate (timezero) or after incubation. The free Pi concentration was
determined by adding 100 lL of CH3COONa 1 M–100 lL
of the acidic incubated sample to neutralize the samplebefore the addition of the Malachite Green’s reactants.
Afterwards, 40 lL of each of the two reactants used in the
Malachite green method [24] were added before readingthe absorption at 630 nm.
2.5 Effect of pH and temperature on phytase activity
The enzyme activity was studied over pH values ranging
from 3.5 to 8. Buffer solutions of different pH were madeby adding acetic acid to sodium acetate (0.5 M), and used
to run the enzyme reaction as described above.
The temperature dependence of phytase activity wasstudied at pH 5.5 in the 5–75 !C temperature range with
10 !C increments. At each temperature, the substrate was
pre-incubated for 5 min at the target temperature beforeaddition of the enzyme. All measurements at different
temperatures were made with independent samples. The
temperature stability of the free and immobilized phytasewas assessed at two extreme temperatures well below
(4 !C) and above (55 !C) the expected denaturation tem-
perature [25]. The samples were kept at a given tempera-ture for 10, 20 and 30 min, and then rapidly cooled on ice
for 10 min. The samples were equilibrated at 37 !C for
5 min before measuring the enzymatic activity, as descri-bed above.
2.6 Phytase loading, adsorption kinetics and adsorptionisotherm
Based on the phytase dimensions and the porous volume
determined for KIT-6, we estimated that approximately
450 lg of proteins loaded head-to-tail into the elongatedpores would fill 100 lL of KIT-6 porous volume. In what
follows, 19 thus corresponds to 450 lg of phytase for
100 lL of porous volume. Given the porosity characteris-tics of both materials, 100 lL of porous volume corre-
sponds to 75.2 mg of KIT-6 and 130 mg of MCM-41. The
effect of the adsorption behavior of the phytase was studiedby varying the pH of the medium around the phytase iso-
electric point (pI = 4.8). Given that the point of zero
charge (PZC) for silica is approximately pH 2 [26], themesoporous surface is negatively charged for all values of
pH tested: 4, 4.8 and 5.5. The adsorption kinetic and
adsorption isotherm experiments were performed underbatch conditions at 18 !C. The mesoporous solid was ini-
tially prehydrated with 5 mL of buffer solution (pH 5.5)
and kept under stirring for 30 s. For the adsorption kinetic,a mass of solid representing a porous volume of 100 lL as
explained above was immersed in a solution containing
45 mg of phytase (1009) and kept under gentle stirring. Atdifferent times (00/100/200/400/1 h/3 h/24 h/48 h), the sam-
ple was centrifuged for 3 min and 250 lL were withdrawn
from the supernatant for total protein titration. Theadsorption isotherm was constructed by keeping the mes-
oporous silica in contact with increasing phytase concen-
trations under gentle stirring for 3 days; for KIT-6: 19,29, 109, 309, 509, 1009, 3009 and for MCM-41: 19,
109, 309, 509, 1009. The proportion of enzyme immo-
bilized into and onto the silica materials was estimatedwith the BCA assay by subtracting the amount of protein
remaining in the supernatant from the total amount initially
introduced for impregnation.The Langmuir–Freundlich adsorption model [27] was
used to describe the adsorption behavior of phytase onto
mesoporous materials with the following general equation:
qe ¼qmKLFCn
e
1þ KLFCne
where, qe is the amount of phytase loaded onto the meso-
porous material at equilibrium (lg phytase/mg mesoporousmaterial); qm is the maximum adsorption capacity, it rep-
resents a measure of total number of binding sites available
J Sol-Gel Sci Technol
123

per gram of sorbant (lg phytase/mg mesoporous material);
Ce is the supernatant concentration at equilibrium (lg/mL);
KLF is the affinity constant for adsorption in the langmuir–freundlich model (L/mg); n is the Langmuir–Freundlich
coefficient, and was adjusted to n = 0.95 to best fit the
experimental data.
2.7 Proteolytic treatment
KIT-6 impregnated with phytase was submitted to prote-
olytic treatment with trypsin to assess the protective effectof enzyme confinement into the mesopores. The standard
amount of mesoporous solid impregnated with phytase
(109, 509, 1009) was centrifuged, the supernatant dis-carded, and 200 lL of bovine trypsin solution (0.05 %)
were added for 5–20 min at room temperature (25 !C). The
solids were then thoroughly rinsed, and the remainingphytase activity was determined as described above.
2.8 Plant growth experiment
Medicago truncatula L. Jemalong strain A17 (from INRA,
Mauguio, France) [28] was used as a plant model in ourexperiment. The seeds were sterilized by soaking them for
5 min in a solution of CaClO2 (30 g/L) under agitation and
washed with sterile deionized water. The seeds were keptwet at 4 !C for 4 days to break their dormancy before
being placed to germinate in Petri dishes (12 9 12 cm)
containing sterile agarose gel [10 g/L agarose (QBiogene,ref. AGAH0500) and 2 g/L glucose] for 3 days at 26 !C in
the dark. Then, the plantlets were grown in Petri dishes
(12 9 12 cm) filled with fine sand (50–70 particle mesh,Sigma-Aldrich, ref. 14808-60-7) washed repeatedly with
deionized water and absolute ethanol and sterilized by
drying overnight at 150 !C. First, the sand (99 g) wassoaked with 16.5 mL of a MES (2-(N-morpholino)eth-
anesulfonic acid) buffer solution at pH 5.5. To avoid
nutritional deficiencies, 8 mL of a mineral solution wereadded with the following composition: KNO3 (0.1 M),
CaCl2 (0.07 M), FeEDDHA (140 lM) and micronutrient
solution (2 mL/L). The micronutrient solution was com-posed of H3BO3 (45 mM); (NH4)6MoO7O24 (0.3 mM);
ZnSO4 (15 mM); MnSO4 (18 mM); CuSO4 (4 mM), sup-
plemented with 1.6 mL of MgSO4 (1 M). A final concen-tration of 2.7 mM Na-phytate (Sigma ref. P0109) was
reached by adding 5 mL of a concentrated solution steril-
ized by filtration at 0.2 lm were then added and consideredas the sole source of phosphate. In one set of conditions,
the nutrition solution was devoid of phytate, and instead
KH2PO4 was added (final concentration of 49 mM), thusproviding a non-limiting source of free inorganic phos-
phorus from the start of the experiment. Finally, except for
negative control conditions in the absence of enzyme, the
phytase-loaded mesoporous solid KIT-6/109 was added asa suspension in water (1 mL at 7.52 g/L). Ultrapure water
(18 Mohm) adjusted to pH 5.5 with HCl (12N) was used to
complete the soil solution volume to 33 ml. The plants(four per dish) were placed in sterile conditions and grown
for 30 days at approximately 26 !C with a photoperiod of
11 h of natural light supplemented with mercury vaporlamps during the night and watered with ultrapure water at
pH 5.5 regularly to compensate for evaporation. After-
wards, the plants were harvested and the soil solution wasbrought back to its initial volume by addition of ultrapure
water before measuring the free inorganic P concentration.
Each plant was analyzed separately, the shoots and rootsbeing separated for acid mineralization with 10 mL HCl
(6N) at 110 !C for 16 h [29]. The Malachite green method
was used to determine the P quantity in the soil solutionand in the mineralized plants.
3 Results and discussion
3.1 Protein immobilization into mesoporous materials
The porosity of the calcined materials, before and after
protein adsorption, was characterized using nitrogen sorp-tion. All materials, before and after phytase immobilization,
gave type IV isotherms with an H2-type hysteresis loop
(Fig. 1) typical of mesoporous materials with moderate poresize distribution [17]. The main porous features of the
materials, ‘‘as synthesized’’ and after enzyme impregnation,
determined by nitrogen sorption, are summarized in Table 1.
Fig. 1 Nitrogen absorption/desorption isotherms at 77 K for as-synthesized KIT-6 (red open circles) after impregnation KIT-6/I (redclosed circles) and after re-calcination (550 !C for 8 h) KIT-6/IC(black closed circles); for as-synthesized MCM-41 (blue opensquares) and after impregnation MCM-41/I (blue closed squares).All samples have been impregnated with 45 mg phytase (1009) for3 days (Color figure online)
J Sol-Gel Sci Technol
123

Under our conditions, we found a pore diameter of 3.8 nm
for MCM-41 and 8.6 nm for KIT-6 for the as-synthesizedmaterials, in good agreement with previous studies [9, 13,
14]. As expected, the longest axis of the A. niger phytase
(PDB entry 3K4P [30]) being slightly below 7.5 nm, theprotein is bigger than the pores of MCM-41 but smaller than
the pores of KIT-6. Upon loading with a large excess of
enzyme (1009) followed by washing and drying, both theporous volume and the specific surface area were decreased
significantly by approximately 30 %, most likely indicating
that part of the mesoporosity became inaccessible (Table 1).The main changes in the N2 sorption isotherm after re-
calcination of impregnated KIT-6 are that the higher
pressure plateau is not reached, and the hysteresis loop isless steep in the p/p! region (0.7–0.85) where condensation
occurs in the mesopores. Such a shape for the hysteresis
loop, which mostly reveals a less ordered interconnectedporosity, is typical of a cage-like structure [31, 32] most
likely originating from pore-blocking by the adsorbed
protein. Partial dissolution and re-precipitation of silicamay also occur upon impregnation with an aqueous solvent
[15, 33], although such rearrangement of the silica network
must be limited because the initial porous structure ismostly restored by calcination of the protein. The average
Derjaguin-Broekhoff-de Boer (DBdB) estimated pore
diameter was mostly unaffected by impregnation and re-calcination.
3.2 Phytase adsorption and desorption
We quantified the specific loading capacity of MCM-41
and KIT-6 by impregnating the materials with increasingly
concentrated phytase solutions. Protein adsorption iso-
therms presented in Fig. 2a were in relatively goodagreement with a simple Langmuir–Freundlich adsorption
model in the lower concentration range. However, beyond
a free phytase concentration of 3 mg/mL, the experimentaldata strongly deviated in excess of the values predicted by
the model, which can be attributed to the formation of
enzyme multi-layers adsorbed on the external surface.The specific loading capacity expressed in microgram of
phytase per milligram of material is approximately twice aslarge for KIT-6 compared to MCM-41, giving 6.3 and
3.5 lg/mg, respectively. We also observed that decreasing
the pH of the impregnation solution to the enzyme iso-electric point, pI (pH 4.8) and below (pH 4) resulted in,
respectively, an 8 and 3 % decrease in adsorbed amount
with KIT-6, compared to pH 5.5. All experiments wereperformed well above the point of zero charge of silica
(pH \ 3) [26, 34], so the material surface is expected to be
slightly negatively charged. A moderately repulsive elec-trostatic interaction with the negatively charged enzyme
(pH [ pI) thus appeared to improve adsorption, and all
subsequent adsorption experiments were carried out at pH5.5.
For both materials, the impregnation kinetics showed a
relatively fast adsorption rate in the first 10 h of contact,with approximately 87 % of the protein incorporated, with
respect to the amount measured at the quasi-plateau
reached after 48 h (Fig. 2). In contrast, desorption wasrather slow and amounted to approximately 0.05 % at the
plateau reached after approximately 2 days. Indeed, the
adsorption isotherm in Fig. 3a shows that for the condi-tion 19, approximately 3.2 lg of protein are adsorbed into
KIT-6, which, given the specific activity of the free enzyme
(1,330 U/mg), amounts to approximately 190 U/mg ofmaterial. Under the same conditions, only 0.1 U is released
per mg of material (Fig. 2). Replacing the release solution
by fresh buffer after 10 days did not result in moredesorption, indicating that the release plateau was not due
to saturation of the release medium (Fig. 2).
3.3 Immobilized enzymatic activity
For KIT-6, the incorporated phytase activity was approxi-mately 8 U per mg of mesoporous material with an initial
loading amount of 4.5 mg phytase (Fig. 3b), suggesting
that a large proportion of the enzymatic activity is limitedby the diffusion of the substrate through the mesopores.
The relatively low apparent enzymatic activity with respect
to the amounts of protein effectively loaded, 9 U instead of33 U (Fig. 3a), i.e., *30 %, is therefore likely due mostly
to enzymes located at the surface of the particles [35].
Phytase activity measured as a function of phytaseconcentration in the incubation medium followed relatively
Table 1 Main porous features of the materials as determined bynitrogen adsorption/desorption volumetry: pore diameter, pore vol-ume and BET surface area
Mesoporoussilica
Porea diameter(nm)
SBET
(m2g-1)Porea volume(cm3g-1)
MCM-41 3.8 875 0.8
MCM-41/I
19 4.5 854 1.0
509 4.3 682 0.6
1009 3.8 625 0.5
KIT-6 8.6 480 1.4
KIT-6/I
19 8.9 476 1.5
309 8.4 344 1.0
1009 8.2 311 0.9
KIT-6/IC 9.5 330 1.3
a Calculated from desorption branch by BJH method
J Sol-Gel Sci Technol
123

similar evolutions for the free and for immobilized phytase
with a typical hyperbolic curve (Fig. 4a). As expected, the
enzyme activity was much stronger for the free phytasethan for the immobilized phytase, owing to the diffusion
constraints in the latter case. A slight decrease in activity
was noticeable at the highest substrate concentration underall conditions, apparently less pronounced for the enzyme
associated with KIT-6 (12 %) than for the free enzyme or
associated with MCM-41 (20 %). The maximum activityobtained for KIT-6 impregnated with the enzyme was
approximately twice the maximum activity reached with
MCM-41 under the same conditions.For the freshly immobilized enzymes only, a striking
singularity was visible in the low substrate concentration
region, below 40 lM (Fig. 4b). In both cases (KIT-6 andMCM-41), the activity went through a first maximum at
approximately 10 lM phytate and then decreased slightly
to a secondary minimum at 15 lM phytate before
increasing again. The phytase activity then reached a pla-teau in the 20–40 lM region and increased once again to
finally reach Vmax at approximately 200 lM phytate
(Fig. 4a). However, upon aging for 4 months at 4 !C inacetate buffer at pH 5.5, both materials appeared to evolve,
yielding much smoother curves with a slightly lower
activity in this low concentration range. We attribute thesuccession of concentration regimes with the impregnated
mesoporous materials to distinct locations of the enzymatic
activities, with a different accessibility to the substrate. Inparticular, it is likely that, in the case of MCM-41, because
the protein is too large to enter the porosity, most of the
protein is adsorbed on the outer surface of the particleswith direct access to the substrate at the bulk concentration.
Fig. 2 Adsorption and desorption kinetics of phytase on mesoporoussilica KIT-6 (red circles) and MCM-41 (blue squares). a Adsorptionkinetics measured on mesoporous materials loaded with a quantityequivalent to 1009 (see ‘‘Materials and methods’’ section). b Activity
of the phytase desorbed from a previously impregnated KIT-6/I (19),in 10 mL of acetate buffer at pH 5.5. Phytase activities weremeasured at pH 5.5, 37 !C and with a phytate concentration of 5 mM(Color figure online)
Fig. 3 a Phytase adsorption isotherms for KIT-6/I and MCM-41/I.The materials were impregnated for 3 days by immersion in enzymesolution at different concentrations. Calculated isotherms, accordingto the Langmuir–Freundlich model (see Ref. [24]), are drawn in
dotted lines (n = 0.95). b Phytase enzymatic activity measured inKIT-6 materials as a function of the amount of phytase used forloading. The temperature was 37 !C, and the phytate concentrationwas 5 mM
J Sol-Gel Sci Technol
123

The diffusion constraints are those that apply to catalytic
species attached to a flat surface [35]. Another smallerproportion of the enzyme can be positioned at the mouth of
the pores with less accessibility to the substrate. This
second population would also account for the partial poreblocking observed for both materials by nitrogen adsorp-
tion upon impregnation (Table 1). In the case of KIT-6, a
third population of enzymes can be inserted into theinternal porosity with even more limited access to the
phytate due to the diffusion constraints and the upstream
enzymatic activities causing substrate depletion inside thepores. After 4 months of aging, the desorption and dena-
turation of the enzymes adsorbed on the surface, together
with the rearrangement of the silica network in aqueousbuffer, could lead to a more homogeneous repartition of the
catalytic sites (Fig. 4b) and explain the smoother aspect of
the curve compared to fresh samples.
For both impregnated mesoporous materials and the
free enzyme in solution, the optimal pH was located inpH values ranging from 5 to 5.5 (Fig. 5a). The activity
of the functionalized materials became very limited at
the lower (pH 3.2) and upper (pH 8.7) ends of the pHrange investigated, in contrast to the free phytase
behavior that also showed a strong decrease in activity at
higher pH but had a second optimum of activity at acidicpH, which was reported to be located at approximately
pH 2.5 [23].
Similarly, the optimum temperature lies in a 45–55 !Cregion for the immobilized and free phytase. However, as
Fig. 5b shows, the immobilized enzyme activity increases
in this range while the immobilized enzyme activity of thefree phytase starts decreasing. The optimum temperature
Tmax therefore appears to be slightly larger for the immo-
bilized than for the free enzyme.
Fig. 4 Phytase activity of the free phytase (stars), KIT-6/I (13)(circles) and MCM-41/I (13) (squares) freshly impregnated as afunction of substrate concentration. a Phytase activities measuredover the whole range of phytate concentrations studied (0–2 mM).
b Zoom of (a) in the low phytate concentration region for freshlyimpregnated materials (open symbols, dotted line) and the samesamples after 4 months aging (full symbols, straight line). The linesare guides to the eye (Color figure online)
Fig. 5 Effect of pH and temperature on phytase activity whether freein the solution or freshly impregnated in the mesoporous silica KIT-6/I (13) and MCM-41/I (13). a The effect of the pH on activity was
measured at 37 !C with 2 mM phytate. b The effect of thetemperature on activity was measured at pH 5.5 with 2 mM phytate
J Sol-Gel Sci Technol
123

To evaluate the possible stabilizing effect of immobili-zation into the mesoporous material, the evolution of the
enzyme activity was followed at 55 !C, which corresponds
to Tmax for the immobilized phytase. It clearly appeared(Fig. 6) that under these conditions the free enzyme was
not stable, as its activity dropped rapidly with time at 55 !C
(down to 20 % after 48 h, data not shown), while theactivity of the immobilized phytase remained mostly con-
stant over 30 min.
3.4 Protection of immobilized phytase against protease
activity
The set of data presented so far strongly suggested that at
least part of the phytase used to impregnate KIT-6 meso-
porous silica is immobilized inside the porous network,
possibly accounting for higher temperature stability com-
pared with the free enzyme. However, phytase adsorptionisotherms (Fig. 3a) suggested that for high protein
amounts, multilayers may form on the outer particles sur-
face. It is difficult to determine directly the proportion ofenzyme actually included in the porosity based on the
overall enzymatic activity because of the very different
substrate diffusion constraints between the particle surfaceand sites located deep in the pores. We used bovine trypsin,
a small protease (4 nm in diameter), to remove the proteinadsorbed in excess outside the porosity. The enzymatic
activity associated with the porous materials was evaluated
before and after trypsin treatment. The initial rate obtainedfor KIT-6/I after trypsinization was about one-third of the
rate of the initial sample (Fig. 7a), indicating clearly that
part of the enzyme associated with the material had beenhydrolyzed. Although trypsin is much smaller than the pore
diameter, preliminary tests showed that the proportion of
removed phytase did not evolve much with time up to20 min (Fig. 7b), strongly suggesting that the adsorbed
phytase is concealed deep within the pores.
Interestingly, the trypsinization of samples impregnated109, 509 and 1009, i.e., with an increasing excess of
protein, gave an identical remaining phytase activity
(Fig. 7a). In the case of KIT-6/109, this amounts to nearly35 % of the initial activity measured before treatment. For
the sake of comparison, it can be noted that MCM-41/19
conserved only 7 % of its apparent enzymatic activity afterthe same treatment. This relatively large remaining phytase
activity for KIT-6 after trypsin treatment is in good
agreement with our hypothesis of enzymes filling theaccessible porosity and the excess proteins forming mul-
tiple layers on the outer particles surface. The remaining
activity was approximately 2.7 phytase units, whatever theinitial amount used for impregnation. This remaining
Fig. 6 The temperature stability for the impregnated mesoporoussilica KIT-6/I (13) and the free phytase. The samples were exposed at55 !C for the desired duration and then rapidly cooled to 4 !C.Activity measurements were performed after equilibration at 37 !C(pH 5.5), with a phytate concentration of 1 mM
Fig. 7 Effect of trypsin treatment on the activity of phytase-loadedKIT-6. a Enzymatic activity of samples loaded with increasingamounts of phytase (109, 509 and 1009), before and after a 5 mintreatment with trypsin. b Evolution of enzymatic activity kinetics for
KIT-6/I (19) before and after (KIT-6/IT) exposition to trypsin(500 lL at a 0.5 g/L concentration) for 5, 10 and 20 min. Measure-ments were done at 37 !C and pH 5.5 with 5 mM phytate (Colorfigure online)
J Sol-Gel Sci Technol
123

activity corresponds to 20 % of the activity expected at 19
for the free enzyme. Such a discrepancy most likely arisesfrom only partial filling of the pores but also from the
limited diffusion of the substrate inside the porosity, which
lowers the apparent activity of the immobilized enzyme.
3.5 Phosphorus available for growing plants
We then investigated whether the inorganic P released by
the hydrolysis of phytate catalyzed by the KIT-6-boundphytase was efficiently taken up by growing plants. We
chose M. truncatula as a model plant because of its rapid
growth and its low seed P content, making the plantletshighly dependent upon external P for their growth. The
main data regarding the free Pi available in the soil solu-
tion, dry mass of plantlets after 30 days cultivation andtotal P accumulation are summarized in Table 2. Overall,
all the conditions tested proved suitable for plant growth
and mostly differed in both available free Pi and plantaccumulation of P.
First, the amount of inorganic phosphorus (Pi) available
per dish was evaluated after 30 days incubation with orwithout KIT-6/109, in the absence or presence of plants
(Table 2). Obviously, the amount of Pi for the negative
control (no phytase, no plant) is extremely low and mostlikely corresponds to spontaneous hydrolysis of phytate or
contamination by inorganic phosphorus in the phytate
solution. As expected, in the presence of phytase-loadedKIT-6, the amount of Pi available at the beginning of the
experiment was largely increased to approximately
300 lmol Pi per dish. However, after 30 days in theabsence of plants, the concentration of free Pi decreased to
approximately 220 lmol Pi per dish (Table 2), likely due
to spatial variability and low mobility of P and phytate. The
presence of plantlets (four per dish) for 30 days resulted in
a net decrease of approximately 60 lmol of Pi per dish.Even in the absence of phytase-loaded KIT-6, the presence
of the plant induced an increase in the Pi concentration.
This increase is most likely due to the production by M.truncatula of its own phytase whose secretion was
hypothesized by Xiao et al. [36]. However, this enzyme is
able to hydrolyze phytate only at a limited yet significant(p = 0.0004) extent. Finally, to assess the ability of the
plants to absorb the Pi released by the hydrolysis of phytate
catalyzed by the enzyme loaded-material, the P content in
Table 2 Analytical results of plant growth experiment with (? plants) or without (- plants) and with (? KIT-6/109) or without (- KIT-6/109)phytate-impregnated mesoporous material
Treatments Amount of free Pi in solution(lmol/Petri dish)
Dry mass (mg/plant) in Total P accumulation(lmol/plant)
tinitial tfinal Roots Leaves
? plants ? phytate - KIT-6/109 (control 1) 0.3 (0.3) 4.7 (2.1) 4.5 (3.6) 32.6 (11.0) 4.2 (0.8)
? phytate ? KIT-6/109 15.7 (3.3) 154.1 (30.6) 7.4 (1.2) 23.9 (19.3) 10.8 (9.4)*
? KH2PO4 (49,25 mM) (control 2) 64.3 (0.7) 28.9 (8.2) 4.3 (2.6) 25.5 (5.5) 26.2 (8.7)*
- plants ? phytate - KIT-6/109 (control 1) 0.18 (0.13) 0.68 (0.08)
? phytate ? KIT-6/109 301.6 (115.3) 218.79 (28.3)
? KH2PO4 (49,25 mM) (control 2) 65.0 (5.2) 57.6 (1.9)
Data are means with standard deviation between brackets (n = 6) and correspond to (1) the amount of free orthophosphate (Pi) assayed insolution before (tinitial) and after harvest (tfinal), (2) the dry biomass (mg) of leaves and roots and (3) the total P accumulated in Medicagotruncatula plants. Total P accumulated was obtained by addition of P content of leaves and roots. P content was obtained by multiplying drybiomass per % P (data not shown)
* t-student comparison of the mean with mean of control 1, significant at p \ 0.05
Fig. 8 Total amounts of P assayed in roots (brown bars) and shoots(green bars) in M. truncatula seedlings grown for 30 days understerile conditions with phytate as the sole source of P, without(Control) or with (KIT-6/103) the phytase-containing mesoporousmaterial. Bars are the means with SEM (n = 5). The results of theF-test are given, showing that P amounts accumulated in roots andshoots of plants grown with KIT-6/103 were statistically greater thanthe P amounts measured in plants grown without KIT-6/103 (Colorfigure online)
J Sol-Gel Sci Technol
123

the roots and shoots of each plant was determined (Fig. 8).
The amount of P accumulated by the plant in the presenceof KIT-6/109 is approximately 10 lmol per plant, 2.5
times higher than the control, and the difference is signif-
icant both in roots and shoots. This accumulation in theplants accounts for most (66 %) of the net decrease in Pi
concentration in the soil solution between the conditions in
the absence and presence of the plant. It should be notedthat when inorganic P is added directly to the nutrition
medium at a non-limiting concentration (KH2PO4 49 mM),the total P accumulated by the plants amounts to
26.2 ± 8.7 lmol/plant, which is significantly higher
(p = 0.0187) than with 2.7 mM phytate and KIT-6immobilized phytase (Table 2).
4 Conclusions
Immobilization of a phytase capable of hydrolyzing phy-tate, an organic form of phosphate present in natural soils,
was successfully achieved in KIT-6 porous silica. The
pores of the 3-D cubic mesoporous network are indeedlarge enough ([8.5 nm in diameter) to accommodate the
bulky phytase protein. Most of the adsorption into the
porous network of the silica particles occurred within thefirst 10 h of contact. Very little was released back to the
medium, indicating limited leaking and thus stable immo-
bilization by simple adsorption. In the perspective ofapplications for supported catalysis, it is crucial that the
enzyme stay associated to the supporting scaffold, allowing
for the efficient recycling of the catalyst material. Althoughthe kinetics might apparently be affected by adsorption
onto the pore walls and by diffusion constraints on the
substrate and products in the mesopores, the main enzy-matic features remain very similar to those of the free
phytase. Most interestingly for their use in soils as fertil-
izers, the enzymes loaded into KIT-6 appeared partiallyprotected from protease degradation. In addition, as sug-
gested by a slight shift in optimal temperature, the thermal
stability of phytase was greatly enhanced upon immobili-zation in the mesoporous silica. Such stabilization could
prove very useful for the processing of phytase with other
components of the fertilizer compound, to improve shelf-life, and also for the long-term activity of the enzyme in
soils. Finally, as a proof of concept, we demonstrated that
not only is phytase-loaded KIT-6 efficient at hydrolyzingphytate but phytase-loaded KIT-6 also provides inorganic P
that can be taken up by growing plants and accumulated in
both roots and shoots. Our strategy consisting of mobiliz-ing organic P accumulated in the soil (legacy P) is one way
of addressing recent concerns regarding the management of
P resources [2].
Acknowledgments The authors thank Jean-Claude Yvin and Ti-mac-Agro International for financial support (contract # 061021) ofthe collaborative project, the ‘‘Halle de Biotechnologies’’ (UMRIATE/UMR SPO, Montpellier, France) for the production of therecombinant phytase. Christophe Trouillefou is the recipient of aPh.D. fellowship (CIFRE 98/2011) from TIMAC-Agro Internationaland ANRT. We are grateful to Marie-France Driole for her help in thesynthesis of the mesoporous materials, and to Francesco Di Renzo forfruitful discussions.
References
1. Cordell D, Drangert J-O, White S (2009) The story of phospho-rus: global food security and food for thought. Glob EnvironChang 19(2):292–305. doi:10.1016/j.gloenvcha.2008.10.009
2. Withers PJA, Sylvester-Bradley R, Jones DL, Healey JR, TalboysPJ (2014) Feed the crop not the soil: rethinking phosphorusmanagement in the food chain. Environ Sci Technol48(12):6523–6530. doi:10.1021/es501670j
3. Schachtman DP, Reid RJ, Ayling SM (1998) Phosphorus uptakeby plants: from soil to cell. Plant Physiol 116(2):447–453. doi:10.1104/pp.116.2.447
4. Giaveno C, Celi L, Richardson AE, Simpson RJ, Barberis E(2010) Interaction of phytases with minerals and availability ofsubstrate affect the hydrolysis of inositol phosphates. Soil BiolBiochem 42(3):491–498. doi:10.1016/j.soilbio.2009.12.002
5. MacDonald GK, Bennett EM, Potter PA, Ramankutty N (2011)Agronomic phosphorus imbalances across the world’s croplands.Proc Natl Acad Sci USA 108(7):3086–3091. doi:10.1073/pnas.1010808108
6. Richardson AE, George TS, Jakobsen I, Simpson RJ Plant utili-zation of inositol phosphates. In, 2007. CAB International,pp 242-260. doi:10.1079/9781845931520.0242
7. Hayes JE, Simpson RJ, Richardson AE (2000) The growth andphosphorus utilisation of plants in sterile media when supplied withinositol hexaphosphate, glucose 1-phosphate or inorganic phos-phate. Plant Soil 220(1–2):165–174. doi:10.1023/a:1004782324030
8. Vandenberg GW, Scott SL, Sarker PK, Dallaire V, de la Noue J(2011) Encapsulation of microbial phytase: effects on phosphorusbioavailability in rainbow trout (Oncorhynchus mykiss). AnimFeed Sci Tech 169(3–4):230–243. doi:10.1016/j.anifeedsci.2011.07.001
9. Kleitz F, Kim TW, Ryoo R (2005) Design of mesoporous silica atlow acid concentrations in triblock copolymer-butanol-watersystems. Bull Korean Chem Soc 26(11):1653–1668
10. Falahati M, Saboury AA, Ma’mani L, Shafiee A, Rafieepour HA(2012) The effect of functionalization of mesoporous silicananoparticles on the interaction and stability of confined enzyme.Int J Biol Macromol 50(4):1048–1054. doi:10.1016/j.ijbiomac.2012.02.032
11. Zimmerman AR, Chorover J, Goyne KW, Brantley SL (2004)Protection of mesopore-adsorbed organic matter from enzymaticdegradation. Environ Sci Technol 38(17):4542–4548. doi:10.1021/es035340?
12. Zhou C, Jiang B, Sheng ZC, Zhu SM, Shen SB (2011) Covalentcrowding strategy for trypsin confined in accessible mesoporeswith enhanced catalytic property and stability. Korean J ChemEng 28(3):853–859. doi:10.1007/s11814-010-0412-3
13. Kleitz F, Choi SH, Ryoo R (2003) Cubic Ia3d large mesoporoussilica: synthesis and replication to platinum nanowires, carbonnanorods and carbon nanotubes. Chem Commun 17:2136–2137.doi:10.1039/b306504a
14. Kresge CT, Leonowicz ME, Roth WJ, Vartuli JC, Beck JS (1992)Ordered mesoporous molecular-sieves synthesized by a liquid-
J Sol-Gel Sci Technol
123

crystal template mechanism. Nature 359(6397):710–712. doi:10.1038/359710a0
15. Galarneau A, Nader M, Guenneau F, Di Renzo F, Gedeon A(2007) Understanding the stability in water of mesoporous SBA-15 and MCM-41. J Phys Chem C 111(23):8268–8277. doi:10.1021/jp068526e
16. Galarneau A, Driole MF, Petitto C, Chiche B, Bonelli B, Ar-mandi M, Onida B, Garrone E, di Renzo F, Fajula F (2005) Effectof post-synthesis treatment on the stability and surface propertiesof MCM-48 silica. Microporous Mesoporous Mater83(1–3):172–180. doi:10.1016/j.micromeso.2005.03.020
17. Sing KSW, Everett DH, Haul RAW, Moscou L, Pierotti RA,Rouquerol J, Siemieniewska T (1985) Reporting physisorptiondata for gas solid systems with special reference to the determi-nation of surface-area and porosity (Recommendations 1984).Pure Appl Chem 57(4):603–619. doi:10.1351/pac198557040603
18. Brunauer S, Emmett PH, Teller E (1938) Adsorption of gases inmultimolecular layers. J Am Chem Soc 60:309–319. doi:10.1021/ja01269a023
19. Laborde C, Chemardin P, Bigey F, Combarnous Y, Moulin G,Boze H (2004) Overexpression of ovine leptin in Pichia pastoris:physiological yeast response to leptin production and character-ization of the recombinant hormone. Yeast 21(3):249–263.doi:10.1002/yea.1073
20. Brunel L, Neugnot V, Landucci L, Boze WN, Moulin G, Bigey F,Dubreucq E (2004) High-level expression of Candida parapsi-losis lipase/acyltransferase in Pichia pastoris. J Biotechnol111(1):41–50. doi:10.1016/j.jbiotec.2004.03.007
21. Wodzinski RJ, Ullah AHJ (1996) Phytase. In: Neidleman SL,Laskin AI (eds) Advances in Applied Microbiology, vol 42,pp 263–302. doi:10.1016/s0065-2164(08)70375-7
22. Nagashima T, Tange T, Anazawa H (1999) Dephosphorylation ofphytate by using the Aspergillus niger phytase with a high aaffinity for phytate. Appl Environ Microbiol 65(10):4682–4684
23. Wyss M, Pasamontes L, Friedlein A, Remy R, Tessier M, Kro-nenberger A, Middendorf A, Lehmann M, Schnoebelen L,Rothlisberger U, Kusznir E, Wahl G, Muller F, Lahm HW, VogelK, van Loon A (1999) Biophysical characterization of fungalphytases (myo-inositol hexakisphosphate phosphohydrolases):molecular size, glycosylation pattern, and engineering of prote-olytic resistance. Appl Environ Microbiol 65(2):359–366
24. Ohno T, Zibilske LM (1991) Determination of low concentra-tions of phosphorus in soil extracts using malachite green. SoilSci Soc Am J 55(3):892–895
25. Tijskens LMM, Greiner R, Biekman ESA, Konietzny U (2001)Modeling the effect of temperature and pH on activity of enzymes:the case of phytases. Biotechnol Bioeng 72(3):323–330. doi:10.1002/1097-0290(20010205)72:3\323:aid-bit9[3.0.co;2-i
26. Iler RK (1979) The Chemistry of Silica: Solubility, Polymeriza-tion, Colloid and Surface Properties and Biochemistry. volCopyright (C) 2014 American Chemical Society (ACS). AllRights Reserved. Wiley
27. Hossain KZ, Monreal CM, Sayari A (2008) Adsorption of ureaseon PE-MCM-41 and its catalytic effect on hydrolysis of urea.Colloids and Surf B: Biointerfaces 62(1):42–50. doi:10.1016/j.colsurfb.2007.09.016
28. Huguet T, Prosperi JM (1996) Medicago truncatula : a legumemodel-plant. In: Genier G, Prosperi JM (eds) The genus medi-cago in the mediterranean region: current situation and prospectsin research, Cahiers Options Mediterraneennes, vol 18. CI-HEAM, Zaragoza, pp 171–175
29. Ali MA, Louche J, Legname E, Duchemin M, Plassard C (2009)Pinus pinaster seedlings and their fungal symbionts show highplasticity in phosphorus acquisition in acidic soils. Tree Physiol(Oxford, UK) 29 (Copyright (C) 2014 American ChemicalSociety (ACS). All Rights Reserved): 1587–1597. doi:10.1093/treephys/tpp088
30. Oakley AJ (2010) The structure of Aspergillus niger phytasephyA in complex with a phytate mimetic. Biochem Biophys ResCommun 397(4):745–749. doi:10.1016/j.bbrc.2010.06.024
31. Van der Voort P, Benjelloun M, Vansant EF (2002) Rationali-zation of the synthesis of SBA-16: controlling the micro- andmesoporosity. J Phys Chem B 106(35):9027–9032. doi:10.1021/jp0261152
32. Zhao DY, Huo QS, Feng JL, Chmelka BF, Stucky GD (1998)Nonionic triblock and star diblock copolymer and oligomericsurfactant syntheses of highly ordered, hydrothermally stable,mesoporous silica structures. J Am Chem Soc120(24):6024–6036. doi:10.1021/ja974025i
33. Bass JD, Grosso D, Boissiere C, Belamie E, Coradin T, SanchezC (2007) Stability of mesoporous oxide and mixed metal oxidematerials under biologically relevant conditions. Chem Mater19(17):4349–4356. doi:10.1021/cm071305g
34. Kosmulski M (2009) pH-dependent surface charging and pointsof zero charge. IV. Update and new approach. J Colloid InterfaceSci 337(2):439–448. doi:10.1016/j.jcis.2009.04.072
35. Illanes A, Gonzalez JM, Gomez JM, Valencia P, Wilson L (2010)Diffusional restrictions in glyoxyl-agarose immobilized penicillinG acylase of different particle size and protein loading. Electron JBiotechnol 13 (1). doi:10.2225/vol13-issue1-fulltext-12
36. Xiao K, Harrison MJ, Wang ZY (2005) Transgenic expression ofa novel M. truncatula phytase gene results in improved acquisi-tion of organic phosphorus by Arabidopsis. Planta 222(1):27–36.doi:10.1007/s00425-005-1511-y
J Sol-Gel Sci Technol
123

Publication N°2

Ecological Indicators 43 (2014) 83–93
Contents lists available at ScienceDirect
Ecological Indicators
j o ur na l ho me page: www.elsev ier .com/ locate /eco l ind
Relevance of use-invariant soil properties to assess soil quality ofvulnerable ecosystems: The case of Mediterranean vineyards
Clémence Salomea, Patrice Coll a,b, Egidio Lardoc, Cécile Villenaved,e, Eric Blancharte,Philippe Hinsinger f, Claire Marsdena, Edith Le Cadrea,∗
a Montpellier SupAgro, UMR Eco&Sols, 34060 Montpellier, Franceb Laboratoire Rière, 38 avenue de Grande-Bretagne, 66000 Perpignan, Francec University of Basilicata, DICEM, 75100 Matera, Italyd ELISOL Environnement, UMR Eco&Sols, 34060 Montpellier, Francee IRD, UMR Eco&Sols, 34060 Montpellier, Francef INRA, UMR Eco&Sols, 34060 Montpellier, France
a r t i c l e i n f o
Article history:Received 4 June 2013Received in revised form 17 February 2014Accepted 18 February 2014
Keywords:Reference networkIndicatorsCarbonatesTextureAvailable nutrientsOrganic matterMicrobial biomassSoil respirationNematodes
a b s t r a c t
Vineyard landscapes in Mediterranean areas represent a strong cultural legacy and support a crucial socio-economic sector. The sustainability of these landscapes is threatened by rapid changes of soil quality, inthe context of global change and intensive management practices. Considering the Languedoc-Roussillonregion of southern France as representative of Mediterranean soil and climate conditions, we evaluatedthe topsoil quality of vineyards at the regional scale, based on a set of 31 physical, chemical and biolog-ical soil indicators measured on 164 commercial vineyard plots. Almost all soil parameters were highlyvariable among plots. Biological activity was low but no systematic perturbation of the trophic web wasnoticed. The regional variability of use-invariant soil properties (such as calcium carbonate content andtexture) was characterized and taken into account for the analysis of dynamic indicators. Invariant soilproperties explained up to 25% of the variance of dynamic chemical and biological indicators. Conse-quently as a tool to improve soil management decision and recommendations, we proposed a groupingof the 164 vineyard plots into functional soil groups determined by soil invariant properties. Informationredundancy between different dynamic indicators was analyzed, and their interpretation and limitationsas indicators of topsoil quality were discussed. Our study has produced detailed topsoil indicator base-lines that can be immediately used as references for winegrowers to appraise the topsoil quality of theirvineyard in comparison with others.
© 2014 Elsevier Ltd. All rights reserved.
1. Introduction
Vineyards deliver environmental, social and economic servicesto humankind. Since the classical or probably even the Neolithicera, grape vines have been cultivated in Europe. Landscapes ofoutstanding beauty such as Alto Douro, Lavaux or Saint-Emilionare world heritage sites listed by UNESCO and should be consid-ered as a legacy of past generations. All over the world wheregrape vines are grown, they are associated with the concept ofterroir. The terroir is defined as a unique ecosystem in a givenplace including soil, climate and the vine (Van Leeuwen et al.,
∗ Corresponding author at: Montpellier SupAgro, UMR Eco&Sols, bâtiment 12, 2place Pierre Viala, 34060 Montpellier, France. Tel.: +33 0499 613 036;fax: +33 0499 612 119.
E-mail address: [email protected] (E. Le Cadre).
2004). The terroir concept also embraces wine-growing and wine-making practices (Van Leeuwen and Seguin, 2006). Grape vines aregrown in patches across the Mediterranean biome, in geographi-cally distinct regions around the world: Europe (France, Portugal,Spain, Italy, Greece), North America (California) and South Amer-ica, but also Australia and South Africa (Jones et al., 2005) andare often located on soils unsuitable for other crops. Winegrow-ers commonly practice chemical weeding, tillage, green pruningand intensive pesticide application in order to control yields andto obtain high quality grapes. There are side effects to these prac-tices that can deteriorate soil functioning as they promote soilerosion, soil organic matter depletion, pollution and losses of bio-diversity (Coulouma et al., 2006; Hildebrandt et al., 2008; Komareket al., 2010; Lagacherie et al. (2006) Martinez-Casasnovas et al.,2009; Michaud et al., 2007; Nascimbene et al., 2012; Raclot et al.,2009). Vineyard soil functioning and associated ecosystem servicesare therefore threatened, especially in vulnerable areas such as
http://dx.doi.org/10.1016/j.ecolind.2014.02.0161470-160X/© 2014 Elsevier Ltd. All rights reserved.

84 C. Salome et al. / Ecological Indicators 43 (2014) 83–93
Mediterranean climatic regions (Schroter et al., 2005), yet they arestill poorly documented. Another factor affecting vineyard soils isthe recent boom of conversions to organic management practices,but studies on the consequences of such changes on soil functioningare scarce and often assigned to a limited geographical area (Collet al., 2011, 2012a). A comprehensive understanding of vineyardsoil functioning in different terroir contexts and under the effect ofchanges in climate and viticulture practices is needed, and can beapproached through the assessment of soil quality.
Soil quality is defined as the ability of soil to function as a vitalliving system and to deliver ecosystem services related to plantand animal production, regulation of nutrient cycles and pollutionand conservation of biodiversity (Doran and Parkin, 1994; Doranand Zeiss, 2000; Karlen et al., 1997; Kibblewhite et al., 2008). Soilquality is evaluated for a specific land use and final user (Arshadand Martin, 2002). In practice, two different types of soil qualityare distinguished (Karlen et al., 1997; Wienhold et al., 2004): (i)inherent (or use-invariant) soil quality and (ii) dynamic soil qual-ity. The former is intimately linked to pedogenetic processes; it isalmost invariant at the human scale and can be used for land-useplanning. In contrast, dynamic soil quality is influenced by land use,agricultural practices, soil management and climate change and isconsequently likely to vary over a short time period, especially forthe topsoil, i.e. the upper soil layer (0–15 to 0–30 cm). These twotypes of soil quality are based on specific measurable parameters.Inherent soil quality parameters mainly include stoniness, particlesize, soil depth and calcium carbonate contents. For dynamic soilquality stakeholders typically use chemical or physical parametersto evaluate total or available nutrient or water contents, levels ofpollutants and risk of erosion. However, biological parameters haverecently emerged as indicators able to provide a broader picture ofsoil quality due to their better sensitivity to environmental changes(Bastida et al., 2008; Fränzle, 2006). Potential biological indicatorsare numerous. Among them, microorganisms (mainly bacteria andfungi) and nematodes are particularly relevant for large-scale soilquality studies (Schloter et al., 2003) and are known to be partic-ularly active in the topsoil. Soil nematodes are present in all soiltypes, occupying all trophic levels, and they are directly involvedin the cycles of nutrients such as N and P (Irshad et al., 2011).In addition, indices based on the relative abundance of nematodefunctional guilds (combination of trophic group and life strategy)have been related to farming practices or land use (Bongers, 1990;Ferris et al., 2001; Villenave et al., 2001; Zhang et al., 2012). Micro-bial biomass, soil respiration, metabolic quotient, and the ratio oforganic carbon from microbial biomass to total soil organic carbonare commonly recognized as indicators of the effects of agriculturalpractices or land use on soil quality (Bastida et al., 2008; Kaschuket al., 2011; Mader et al., 2002; Probst et al., 2008).
The measurement and analysis of a spectrum of physical, chem-ical and biological indicators can thus provide a much-neededholistic understanding of soil quality in the particular context ofMediterranean vineyards. The appropriate scale for such a studyis the regional scale, at which the wine-growing socio-economicsector is structured and which encompasses the field of action ofa number of producer, consultant and commercial organizations.A regional scale evaluation provides a general assessment of soilquality for the whole region, while it also offers a framework allow-ing finer analyses for specific situations. This issue is particularlyimportant for winegrowers who require management advice tail-ored to their terroir specificities. Contextualized soil managementrecommendations have as yet been made difficult by the inexis-tence of a complete and representative set of reference values fordynamic soil properties. The range of variation of dynamic soilproperties can be partly determined by inherent soil properties(Dequiedt et al., 2009; Rutgers et al., 2008), and if this correlation ischaracterized and quantified it can help to produce easily consulted
tables of reference values of dynamic properties for different soiltypes.
To attain these objectives we established an extensive net-work of 164 commercial Mediterranean vineyards in SouthernFrance, covering a diversity of soils and management practices,on which we measured a large number of inherent and dynamictopsoil parameters. We deliberately promoted biological indica-tors in our study as (i) these indicators are not frequently used bywine growers in spite of their ability to provide important informa-tion on soil functioning and because (ii) physical indicators relatedto erosion processes (aggregate stability) or soil compaction havealready been widely studied in Languedoc Roussillon vineyardsand reference values are already available (see publications by LeBissonnais et al., 2007; Raclot et al., 2009 or Coulouma et al., 2006and Lagacherie et al., 2006).
We specifically aimed to: (i) produce an evaluation of the soilquality of Mediterranean vineyards through the analysis of a num-ber of inherent and dynamic topsoil parameters, with emphasis onrarely studied biological parameters, and to (ii) quantify the contri-bution of inherent soil properties to dynamic soil quality in orderfinally to (iii) propose an operational classification of soils allow-ing the appraisal by winegrowers of their soil quality in a range ofspecific terroir contexts.
2. Materials and methods
2.1. Study sites and sampling procedures
Nine areas representative of the main wine-growing landscapesfound in the Languedoc-Roussillon region were defined, as equiva-lents of the ecological zones proposed by Arshad and Martin (2002)to be relevant units for soil quality monitoring. The areas weredelimited based on expert knowledge of regional geology, geomor-phology and vegetation cover (Fig. 1). Within each representativearea, plots were selected to cover the diversity of vineyard practicesand included both organic and conventional vineyards. Altogether,164 commercial vineyard plots were sampled as follows in the dif-ferent representative areas: 18 plots in Aigues-Mortes (Ai-Mortes);21 plots in Faugères (Faug); 19 plots in Jonquières-Saint-Vincent (J-St-V); 19 plots in Lesquerde (Lesq), 21 plots in Montagnac (Mont);15 plots in Saint-Hippolyte-du-Fort (St-H-du-F); 23 plots in Saint-Victor-la-Coste (St-V-la-C); 11 plots in Terrats (Terrats) and 17 plotsin Vergèze (Verg). The surface area of the studied plots ranged from0.2 to 2 ha.
The climate in the Languedoc-Roussillon region is typicallyMediterranean, with a mean annual temperature of 14.7 ± 0.6 ◦Cand a mean annual rainfall of 694 ± 58 mm (averages based ondata collected from 2000 to 2010 by Météo-France in nine weatherstations representative of the studied areas). Soils were sampledbetween March 5 and May 22, 2009, with no more than 2 consec-utive days of sampling for each area. For each of the 164 plots, tentopsoil sub-samples were taken randomly in the vineyard from 0to 15 cm layer at the center of the inter-row, using a gouge auger.Sub-samples were carefully homogenized to form a single repre-sentative composite topsoil sample per plot.
2.2. Soil analyses
Thirty-one parameters were analyzed: 7 inherent physicalparameters, 8 dynamic chemical parameters and 16 dynamic bio-logical parameters (Table 1). We decided to include pH in dynamicparameters because soil pH evolves during the transformation andcycling of carbon and nitrogen, both influenced by vineyard man-agement (Bolan and Hedley, 2003), and because liming practicescan result in significant changes in soil pH.

C. Salome et al. / Ecological Indicators 43 (2014) 83–93 85
Fig. 1. Localization of the nine representative areas where the 164 vineyard plots were sampled. Each zone was given the name of the town where the majority of plotswere sampled. The top left box situates the Languedoc-Roussillon region (in gray) on an administrative map of France. Map background: SRTM Digital Elevation Model, 90 mresolution.
The proportions (w/w) of soil particles larger than 1 cm in dia-meter (P 1 cm) and between 0.2 and 1 cm (P 2 mm) were deter-mined by sieving and weighing. Soil texture, total and activecalcium carbonate (CaCO3 tot and CaCO3 act), organic carbon (Corg)and total nitrogen (Ntot) contents and the effective cation exchangecapacity (CEC), as determined with the Cobaltihexamine method,were measured at the routine, national Laboratory of Soil Analy-ses of INRA (LAS INRA-Arras, France), using standard methods on2 mm-sieved soil (Pansu and Gautheyrou, 2006). A single waterextract (soil:extractant ratio 1:10 and 2 h of contact) was usedto determine the pH and the contents of available phosphorus(P), potassium (K) and copper (Cu). The solution was centrifuged(2000 × g during 20 min at 20 ◦C) and filtered at 0.2 !m. The K andCu contents were measured by flame atomic absorption spectrom-etry (Varian A600) and the P content was determined using themalachite green method (Ohno and Zibilske, 1991).
Soil microbial biomass carbon content (MBC) was quantifiedusing the fumigation-extraction method (Wu et al., 1990). A TOC-V CSH (Shimadzu) carbon analyzer was used to measure organiccarbon content in fumigated and non-fumigated samples. Soil res-piration was measured according to ISO 14239 (1997); 10 g of drysoil were moistened to 100% of water holding capacity and thenincubated for 28 days at 28 ◦C in the presence of 20 ml of 0.5 MNaOH solution. Emitted C-CO2 combined with part of the NaOH,and the non-combined NaOH was titrated using a Titrino plus 848titrator with 1 M HCl. The respiration flux was deduced by compari-son with controls without soil. Three ratios related to the efficiencyof substrate utilization were calculated: MBC/Corg, C-CO2/Corg andthe metabolic quotient (qCO2), defined in this case as the amountof C-CO2 respired (CO2) over the 28-day incubation period dividedby MBC.
Soil nematodes were extracted from 200 g of wet soil using theOostenbrink elutriation method, together with sieving and cot-tonwood extraction (ISO 23611-4, 2007). Nematodes were fixed
in a formaldehyde solution (4%) and a representative sub-samplewas mounted on glass slides for identification at high magnifica-tion (400×). Around 150 nematodes per sample were identifiedto genus level and grouped into 5 trophic groups: Obligate Plant-Feeders (OPF), Facultative Plant-Feeders (FPF), Bacterial-feeders(Ba), Fungal-feeders (Fu) and Omnivores and Predators (Om-Pr).The combination of trophic groups and colonizer-persister (cp)value (Bongers, 1990) was used to classify each nematode taxonin a functional guild (Bongers and Bongers, 1998). Five nematodeecological indices were then calculated: Maturity Index (MI), PlantParasitic Index (PPI) (Bongers, 1990), Enrichment Index (EI), Struc-ture Index (SI) (Ferris et al., 2001) and Nematode Channel Ratio(NCR) (Yeates, 2003).
2.3. Statistical analyses
First, Principal Component Analyses (PCA) were performedseparately on inherent soil parameters, dynamic chemical param-eters and dynamic biological parameters in order to comparethe distribution of plots and representative areas for these dif-ferent sets of parameters. In order to assess the magnitude ofvariance ascribable to representative areas, between-class anal-yses (BCA) were performed for each set of parameters, followedwith a Monte-Carlo test for result significance. Data concerningnematode trophic groups were transformed into proportions oftotal abundance to avoid a mass effect. All data were centeredand scaled. We then performed a Redundancy Analysis (RDA) todetermine the impact of use-invariant soil properties (inherent soilproperties and representative areas) on dynamic soil parameters.To make the calculations possible, representative areas were codedas dummy variables, and data were centered and scaled. A posthoc, operational classification of soils, was proposed on the basisof the RDA analysis results (cf. Section 3 for details). Each plot wasassigned to one of the six soil groups. Soil dynamic parameters

86 C. Salome et al. / Ecological Indicators 43 (2014) 83–93
Table 1Soil inherent and dynamic parameters characterized in the study (abbreviations andunits).
Inherent soil parametersCoarse particles between 0.2
and 1 cmP 2 mm % (w/w) soil not sieved
Coarse particles >1 cm P 1 cm % (w/w) soil not sievedClay content Clay % (w/w) soil sieved at
2 mmSilt content Silt % (w/w) soil sieved at
2 mmSand content Sand % (w/w) soil sieved at
2 mmTotal calcium carbonate
contentCaCO3 tot g kg−1 soil sieved at
2 mmActif calcium carbonate
contentCaCO3 act g kg−1 soil sieved at
2 mm
Dynamic soil parametersChemical parameterspH Without unitTotal soil organic carbon
contentCorg g kg−1 soil
Total soil nitrogen content Ntot g kg−1 soilC/NAvailable P content P mg kg−1
Available K content K mg kg−1
Available Cu content Cu mg kg−1
Effective cation exchangecapacity
CEC C cmol+ kg−1
Biological parametersMicrobial biomass carbon MBC mg C kg−1
Soil respiration CO2 !g g−1 over 28 daysMetabolic quotient qCO2 mg C CO2 g−1 MBC over
28 daysCarbon content from microbial
biomassMBC/Corg Without unit
Respired Carbon to Corg ratio C CO2/Corg Without unitTotal nematode abundance NemTot ind. 100 g−1 soilProportion of obligate
plant-feeding nematodesOPF % (ind/ind)
Proportion of facultativeplant-feeding nematodes
FPF % (ind/ind)
Proportion of bacterial-feedingnematodes
Ba % (ind/ind)
Proportion of fungal-feedingnematodes
Fu % (ind/ind)
Proportion ofomnivores + predatorynematodes
Om Pr % (ind/ind)
Maturity Index MI Without unitPlant Parasitic Index PPI Without unitEnrichment Index EI Without unitStructure Index SI Without unitNematode Channel Ratio NCR Without unit
were then compared between groups with ANOVAs or MANOVAsand Tukey post hoc tests. Data were square root or log transformedwhen necessary to satisfy normality criteria. All statistical analyseswere conducted with the R software (R Core Team, 2012) usingVegan and Ade4 packages for multivariate analyses.
3. Results
3.1. Description of inherent and dynamic parameters anddistribution of plots according to the 9 representative areas
Inherent soil parameters showed high contrast between repre-sentative areas (Table 2 and Fig. 2A). About two-thirds of vineyardplots were carbonated with total calcium carbonate contentsranging from 20 to 740 g kg−1 and reactive calcium carbonatecontents from 0.55 to 16.70 g kg−1. Carbonated soils were found inthe areas of Aigues-Mortes, Montagnac, Saint-Hippolyte-du-Fort,Saint-Victor la Coste, Vergèze, and one plot from Faugères. Soilsfrom Aigues-Mortes and Lesquerde were characterized by high
sand content (respectively 88 and 81%) whereas sand contents var-ied between 17% and 52% for the other areas. The highest clayand silt contents were measured in soils from Montagnac, Saint-Hippolyte-du-Fort and Vergèze. The nine representative areasexhibited various degrees of stoniness. Soil particles with a sizelarger than 2 mm were present in plots from all representative areasexcept Aigues-Mortes. However particles larger than 1 cm (P 1 cm)were mainly found in soils from Jonquières-Saint-Vincent wherethey represented from 50 to 90% of topsoil mass. In some cases plotsfrom different representative areas shared very similar inherentproperties, as illustrated by Terrats and Faugères or by Montagnacand St-Hippolyte-du Fort (Fig. 2A). Between-class analysis revealedthat 80% of the variance was ascribable to representative areas(Monte Carlo test p < 0.001).
Dynamic chemical parameters also varied considerablybetween plots (Table 2). Organic carbon content ranged from 3.9to 64 g kg−1. The mean values of Corg and Ntot amounted to, respec-tively, 13.25 and 1.07 g kg−1. The C/N ratio had a mean value of 12.5,a minimum of 6.7 and a maximum of 29.3. CEC ranged between 1.4and 24.7 cmol+ kg−1 and pH ranged between 4.99 and 8.6 (exceptfor one plot whose higher pH of 9.11 suggested soil salinity orsodicity). Total P values ranged between 0 and 20 mg kg−1, Cucontents between 0.08 and 1.29 mg kg−1 and K contents between7.80 and 176.6 mg kg−1. C/N ratios and pH showed relatively lowvariability, with coefficients of variation lower than 23% whilethose of water-extractable P, K and Cu ranged from 57.7 to 78.8%.Ordination of plots according to chemical parameters (Fig. 2B)revealed a distribution of plots along a first axis characterizedby Corg, Cu and K contents and along a second axis characterizedby CEC, pH and P content. These two axes accounted for 60% ofthe total variance. The segregation of the representative areasusing chemical dynamic parameters was less obvious than usinginherent parameters and occurred mainly along the second axis.Likewise, BCA revealed that 46% of the variance was ascribable torepresentative areas (Monte Carlo test p < 0.001).
The 164 plots also differed considerably in their biologicalparameters (Table 2). Means of microbial biomass carbon (MBC)and 28-day soil respiration amounted to 78 mg C kg−1 soil and1.19 !g C g−1 soil respectively, with high coefficients of variation(64.7 and 71.3%). The MBC/Corg ratio varied from 0.18 to 1.15, themetabolic quotient (qCO2) from 0.04 to 6.52 mg C CO2 g−1 MBC andthe CO2/Corg ratio from 0.07 to 26.24. The largest coefficient of vari-ation was found for the metabolic quotient (134.5%), followed bythe CO2/Corg ratio (98.7%), while the MBC/Corg ratio showed a coef-ficient of variation of 35.7%. Mean total nematode abundance was857.5 ind. 100 g−1 dry soil with a coefficient of variation of 70.7%.The percentages of the different trophic groups of nematodes werealso highly variable, especially for obligate plant-feeding nema-todes and the group of omnivores and predators. Plant parasiticnematodes averaged 16% and ranged from 0 to 62% while omni-vores and predators averaged 9% and ranged from 0 to 47%. Bacterialand fungal-feeding nematodes averaged respectively 29.5% and26.5% of the nematode community. In most of the plots, EI wasbelow 50, whereas SI ranged between 5 and 88 with a mean equalto the median around 50. Mean MI and PPI were respectively2.39 and 2.33 and similar to the median values. The NCR indexdisplayed the same values for mean and median at 0.53. The nema-tode indices displayed lower coefficients of variation (especiallyMI and PPI) than nematode abundances. The two first axes of thecanonical representation of plots according to biological parame-ters explained 42% of total variance (Fig. 2C). Parameters mainlycontributing to site dispersion along the two first axes were thoserelative to nematofauna: MI and SI indices (loaded on the nega-tive and positive values respectively on axes 1 and 2), total numberof nematodes (NemTot) and proportion of obligate plant-feedingnematodes (OPF) (negative values on both axes 1 and 2), and

C. Salome et al. / Ecological Indicators 43 (2014) 83–93 87
Table 2Mean and distribution parameters of the 31 parameters in the 164 studied vineyard plots. For the abbreviation of the parameters see Table 1. ND = not detected.
Mean ± standard deviation Median Minimum Maximum Coefficient of variation
Soil inherent parametersP 1 cm (%) 13.7 ± 23.3 4.7 0 90.0 169.8P 2 mm (%) 17.8 ± 14.9 16.8 0 57.8 83.3Clay (%) 22.1 ± 14.0 17.6 3.6 68.5 63.2Silt (%) 28.9 ± 13.2 31.8 2.0 60.5 45.7Sand (%) 49.0 ± 23.8 46.2 5.6 93.3 48.6Tot CaCO3 (g kg−1) 157.1 ± 178.2 111.0 ND 714.0 113.4Act CaCO3 (g kg−1) 3.4 ± 4.3 0.8 ND 16.7 128.4
Soil dynamic parameterspH 7.6 ± 0.96 8.1 5.0 9.1 12.7Corg (g kg−1) 13.2 ± 6.3 11.9 3.9 64.0 48.1Ntot (g kg−1) 1.07 ± 0.44 1.03 0.28 4.19 40.8C/N 12.5 ± 2.8 12.7 6.7 29.3 22.2P (mg kg−1) 3.8 ± 3.0 3.2 0 20.0 78.8K (mg kg−1) 44.1 ± 25.4 37.5 7.8 176.6 57.7Cu (mg kg−1) 0.41 ± 0.26 0.35 0.08 1.29 63.8CEC C (cmol+ kg−1) 10.4 ± 5.7 9.6 1.4 24.7 54.4
MBC (mg C kg−1) 78.0 ± 50.4 69.7 8.2 413.5 64.7CO2 (!g g−1) 1.19 ± 0.85 1.08 0.02 5.02 71.3qCO2 (mg C CO2 g−1 MBC over 28 days) 0.52 ± 0.7 0.35 0.04 6.52 134.5C CO2/Corg 2.62 ± 2.59 2.13 0.07 26.24 98.7MBC/Corg (%) 0.57 ± 0.2 0.56 0.18 1.15 35.7NemTot (ind. 100 g−1 soil) 858 ± 607 760 36 3638 70.7OPF (%) 16.3 ± 13.4 13.8 0 62.3 82.7FPF (%) 19.1 ± 11.2 17.5 0.7 50.3 58.5Ba (%) 29.5 ± 12.8 28.5 4.7 67.4 43.4Fu (%) 26.5 ± 13.0 25.1 3.3 80.0 49.0Om Pr (%) 8.7 ± 5.6 7.8 0 47.3 64.9MI 2.39 ± 0.28 2.35 1.80 3.59 11.6PPI 2.33 ± 0.24 2.28 2.00 3.03 10.5EI 40.2 ± 10.6 40.4 6.3 75.9 26.3SI 50.1 ± 17.7 50.4 5.9 88.7 35.4NCR 0.53 ± 0.16 0.53 0.15 0.88 31.0
Fig. 2. Principal component analyses (PCA) performed with the different sets of parameters. (A) Inherent soil parameters; (B) chemical dynamic parameters; (C) biologicaldynamic parameters. Above: projection of plots and representative areas; below: projection of parameters. For parameter abbreviations see Table 1. Ellipses highlight thenine representative areas: Aigues-Mortes (Ai-Mortes), Faugères (Faug), Jonquières-Saint-Vincent (J-St-V), Lesquerde (Lesq), Montagnac (Mont), Saint-Hippolyte-du-Fort(St-H-du-F), Saint-Victor-la-Coste (St-V-la-C), Terrats (Terrats), Vergèze (Verg).

88 C. Salome et al. / Ecological Indicators 43 (2014) 83–93
Fig. 3. RDA triplot of dynamic indicators (dotted arrow and italic text) explained by inherent indicators and representative areas (continuous arrow and underlined text). Opendots represent the plots. For the abbreviation of soil indicators, see Table 1. Abbreviations of the nine representative areas are: Aigues-Mortes (Ai-Mortes), Faugères (Faug),Jonquières-Saint-Vincent (J-St-V), Lesquerde (Lesq), Montagnac (Mont), Saint-Hippolyte-du-Fort (St-H-du-F), Saint-Victor-la-Coste (St-V-la-C), Terrats (Terrats), Vergèze(Verg).
fungal-feeding nematodes (Fu) (positive value on axis 1). Themetabolic quotient and CO2/Corg ratio also contributed (positivevalue on axis 2). Although canonical ordination did not clearlydiscriminate between areas, BCA analysis revealed that 24% of bio-logical parameter variance was ascribable to representative areas(Monte Carlo test p = 0.001).
3.2. Influence of representative areas and inherent parameters ondynamic parameters
The first two canonical axes of the RDA significantly explained25% of the variance (Fig. 3). Nematode abundance (NemTot),microbial biomass carbon (MBC), MBC/Corg, pH, proportion ofobligate plant-feeding nematodes (OPF), and Corg content werepositively influenced along the first axis by calcium carbonate con-tent and areas of Saint-Victor-la-Coste, Vergèze and Montagnac.Conversely, high proportions of fungal-feeding nematodes (Fu)and high metabolic quotients (qCO2) were found in sites with-out calcium carbonate and with particles larger than 2 mm. Areasof Lesquerde, Faugères and Terrats also contributed to the forma-tion of this first axis. The second axis revealed a textural gradientwith clay and silt contents positively influencing CEC, Ntot, soilrespiration, C-CO2/Corg and to a lesser extent the proportion of fac-ultative plant-feeding nematodes. On the other side of the axis,sand content positively influenced bacterial-feeding nematodesand available P content. Note that the Aigues-Mortes area alsohighly contributed to this axis and strongly influenced the PPI.The NCR, Cu content and C/N ratio were positively explained by
this second canonical axis. The other parameters such as SI andMI, K content and proportions of omnivore + predator nematodesshowed shorter projections, indicating that their variations werenot strongly influenced by area and/or by inherent soil proper-ties. The area of Jonquières-Saint-Vincent did not contribute toexplaining the dynamic parameters in the canonical ordination.However this representative area and soil particles larger than 1 cmcontributed significantly to a third axis (data not shown) whichexplained a part of the variance of available P content and bacterial-feeding nematode relative abundance.
3.3. Operational classification of soils
The RDA analysis confirmed that most of the dynamic param-eters were basically affected by the calcium carbonate contentand textural properties of topsoils, which characterized and dis-criminated most of the representative areas. We proposed on thisbasis to classify the 164 vineyard plots into six soil groups basedon texture classes using the FAO triangle, and active calcium car-bonate content (presence or absence). We decided to separate allJonquières-Saint-Vincent vineyards as an entire group given thatthese soils were characterized by a large proportion of stones.Parameters measured on 2 mm-sieved samples of such stony soils,with very specific water and heat transfer characteristics, may thusnot be representative of whole soil functioning. Soil groups arepresented in Table 3. Three of these groups corresponded to a sin-gle representative area (groups 1, 4 and 6) whereas groups 2 and3, and to a lesser extent group 5 contained plots from different

C. Salome et al. / Ecological Indicators 43 (2014) 83–93 89
Table 3Characterization of the 6 soil groups according to inherent indicators and pH (mean standard deviation). The representative areas from which plots originated are specifiedas well as the number of plots.
Group Texture (FAO) Carbonate status P 1 cm (%) P 2 cm (%) pH Number of plots per area Total numberof plots
1-Alkaline sandy Coarse Carbonated 0.0 ± 0.1 0.9 ± 0.5 8.5 ± 0.2 Aigues-Mortes (18) n = 182-Alkaline fine textured Fine Carbonated 3.8 ± 4.8 25.5 ± 15.2 8.2 ± 0.1 Montagnac (10), Vergèze (8),
St-Hippolyte-du-Fort (11),Faugères (1)
n = 30
3-Alkaline medium textured Medium Carbonated 2.4 ± 2.6 13.2 ± 11.4 8.2 ± 0.2 Montagnac (11), Vergèze (9),Saint-Victor-la-Coste (23),Saint-Hippolyte-du-Fort (4)
n = 47
4-Coarse mildly acidic Coarse Non-Carbonated 12.9 ± 3.6 31.8 ± 3.8 6.5 ± 0.9 Lesquerde (19) n = 195-Mildly acidic medium textured Medium Non-carbonated 13.2 ± 7.6 29.6 ± 6.0 6.5 ± 0.8 Terrats (11) and Faugères (20) n = 316-Neutral stony Stony soils Non-carbonated 72.1 ± 22 0.0 ± 0.0 7.3 ± 0.5 Jonquières-Saint-Vincent (19) n = 19
representative areas. Descriptive statistics (boxplots) of dynamicparameters according to soil groups are given in Figs. 4 and 5.The ANOVA or MANOVA results showed significant differencesbetween soil groups for all parameters except for qCO2, C-CO2/Corgand the proportion of omnivores + predators (Om Pr). Nematodeindices showed weak differences between groups in comparisonwith other dynamic parameters: due to their construction whichtakes into account the relative abundance of soil animals belong-ing to different functional groups, they are more independent ofsoil characteristics than most of the other biological parameters.Interestingly parameters such as Corg, MBC, Ntot, CO2, and MBC/Corgshowed similarities in their response patterns to soil groups. Notethat some of these parameters were highly correlated, namelyMBC and Corg (r = 0.84), MBC and Ntot (r = 0.78), MBC and CEC(r = 0.65).
4. Discussion
4.1. The soil-group approach for soil quality evaluation
Our study highlights the complementarity of studying inherentas well as chemical and biological dynamic soil parameters whenassessing soil quality, as illustrated by the different distributionsof vineyard plots obtained with the different sets of parameters(PCAs in Fig. 2). Part of the variation in measured dynamic proper-ties (25%) was significantly explained by inherent properties, withdifferent sensitivities according to the dynamic parameter consid-ered.
These findings support the statements made by Herrick (2000)and more recently by Pulleman et al. (2012), who pointed outthe importance of taking into account inherent soil properties for
Fig. 4. Boxplots of the dynamic soil parameters according to soil groups. 1-Alkaline sandy soils, 2-alkaline fine textured soils, 3-alkaline medium textured soils, 4-coarsemildly acidic soils, 5-mildly acidic medium textured soils, 6-neutral stony soils. Letters are the results of a Tukey HSD post hoc test following an ANOVA. For the abbreviationsand units of the parameters, see Table 1.

90 C. Salome et al. / Ecological Indicators 43 (2014) 83–93
Fig. 5. Boxplots of the proportion of the different trophic groups of nematodesaccording to soil groups. 1-Alkaline sandy soils, 2-alkaline fine textured soils, 3-alkaline medium textured soils, 4-coarse mildly acidic soils, 5-mildly acidic mediumtextured soils, 6-neutral stony soils. Letters are the results of a Tukey HSD post hoctest following a MANOVA. For trophic group abbreviations see Table 1.
the correct interpretation of dynamic parameter values. A part ofthe remaining measured variation in dynamic soil parameters isexpected to be explained by management practices which wouldbe easier to evaluate within a given soil group. On this basis,we defined groups of Mediterranean vineyard soils with differentpotential functioning, as Rutgers et al. (2008) did at the Netherlandsscale. Our soil group approach offers the possibility of monitor-ing the effect of wine-growing practices on vineyard sustainabilitywhile taking into account the specificities and the potential of ter-roirs as defined in the present paper. Viticulture practices may notbe evenly represented in each soil group, meaning that some effectsattributed to inherent soil parameters may be partly linked to vine-yard management.
Our six soil groups were based on calcium carbonate content,texture and stoniness rather than on soil classification as only theproperties of the topsoil (0–15 cm) were considered. Soil classifi-cation requires a complete soil profile analysis in pits frequentlydug to a 1 or 2 m depth. It is recommended as part of the processof planting a new vineyard, in order to take whole-profile inherentsoil quality into account in the selection of sites suitable for differ-ent land uses (e.g. Mueller et al., 2007) or of appropriate vine var-ieties and rootstocks. Focusing only on the topsoil is neverthelessjustified in our case, as we are ultimately interested in character-izing dynamic soil quality in relation to management practices,which can be expected to have the strongest impact on the topsoillayer. Winegrowers point out the lack of advice from consultantsabout soil quality management with respect to their terroir speci-ficities (Coll et al., 2012b); a significant part of these characteristicscorrespond with the inherent soil parameters we measured. Ourapproach is a reasonable trade-off for winegrowers, taking intoaccount analysis cost and knowledge requirements; it could plau-sibly be applied within a framework of regular monitoring of soilquality for viticultural decision-making.
In contrast with Karlen et al. (2003), we did not consider thepH as an inherent soil property. The pH buffer capacity in soilsarises from dissolution/precipitation of aluminosilicates or calciumcarbonates at low and high soil pH values respectively, but formedium pH buffer capacity arises from protonation/deprotonationreactions on variable mineral and organic surface charges (Aitkenand Moody, 1994). In the latter case, the pH can change rapidly dueto proton addition or loss associated with the transformation andcycling of elements (C, N), or due to liming practices. The choiceof pH as an inherent or dynamic parameter is thus a matter of
debate, like the choice of organic carbon in other studies (Karlenet al., 2003).
Also, a survey of management practices (data not shown)revealed that some winegrowers practiced liming. We thereforedecided to classify pH as a dynamic indicator even though it isrelevant only for non-carbonated soils.
Despite the above-mentioned biases, we believe that our soilgroups are relevant for wine growers who commonly measure theinherent parameters we used, and who can therefore easily assigntheir soil to the correct group.
4.2. Relationships between inherent and dynamic parameters
In our study, Corg and Ntot were significantly influenced bytexture and calcium carbonate contents. Hassink (1994, 1997)elucidated the relationships between texture and organic matterbut the relationship between CaCO3 and organic matter was lessobvious. Following Bronick and Lal (2005), we hypothesize thatCa2+ favors physical protection of organic matter in these soils bypromoting soil aggregation (Puget et al., 2000; Six et al., 2004).Concerning CEC, as expected (van Erp et al., 2001) we measuredthe lowest values in sandy soils depleted in organic matter (groups1 and 4), and the highest values in the more clayey soils exhibit-ing a higher soil organic matter content (group 2). These resultssuggest that a larger beneficial effect of organic matter applicationor cover crops is expected in groups 1 and 4 than in other soils.Water extractable Cu contents were of the same order of magnitudeas values reported for Cu-contaminated soils (Courchesne et al.,2006; Michaud et al., 2007) and for other conventional and organicvineyards located in Languedoc-Roussillon (Coll et al., 2011). Thisobservation is the result of the use of large amounts of Cu-basedsprays such as the Bordeaux mixture to prevent fungal diseases(Chaignon et al., 2003). We could have expected to find the low-est values for groups 2 and 3 as organic matter and high pH areknown to limit Cu availability (Sauvé et al., 2000). However, a num-ber of studies in vineyard soils have shown a positive correlationbetween soil organic matter content and Cu contamination (e.g.Chaignon et al. (2003) in some Languedoc-Roussillon vineyards).These results stress the need to consider other extraction proce-dures to correctly interpret Cu availability and to obtain a broaderevaluation of Cu contamination and its toxicity for organisms aspointed out by Komarek et al. (2010). We propose a similar con-clusion concerning the evaluation of P or K availability. Complexgeochemical processes involved in the availability of these nutri-ents would require more than one extraction procedure to establishan effect of inherent soil properties on the availability of thesenutrients for plants. In addition, considering only the topsoil prop-erties may not be relevant for assessing the nutrition of deep-rootedplants such as Vitis spp.
Microbial parameters varied consistently with previously pub-lished results. Microbial biomass carbon displayed the sameresponse pattern between soil groups as Corg. A high correlationbetween these two parameters has already been observed in manystudies (Dequiedt et al., 2009; Fierer et al., 2009), highlighting theirredundancy for large scale datasets. Among the three ratios pro-posed to assess the efficiency of substrate utilization (MBC/Corg,qCO2 and CO2/Corg), the MBC/Corg ratio was significantly affectedby carbonates as well as by texture, with maximum values inclayey soils. This result contradicts a study by Sparling (1992) whofound higher MBC/Corg ratios in sandy soils than in fine-texturedsoils. However our values of MBC/Corg were systematically dis-tributed at the lower end of the range of values found by Sparling(1992), and we can suggest that their hypothesis of a protectionby clay minerals of organic matter against mineralization may notbe generalizable to our soil conditions. Moreover, the Mediter-ranean climate of our site is characterized by drought periods

C. Salome et al. / Ecological Indicators 43 (2014) 83–93 91
that may favor microbial activity in clayey soils, at the expense oforganic matter content. Clayey soils retain more moisture (Satishand Dong, 2007) and consequently may offer a more favorablehabitat for microorganisms than sandy soils in drought-stressedenvironments. These results stress the relevance of the regionalapproach and we agree with Sparling (1992) that values of theMBC/Corg index should only be interpreted within similar soil typeand climate zones. Probst et al. (2008) as well as Wardle andGhani (1995) reported an increase in qCO2 with decreasing pH, claycontent and microbial biomass carbon. Although we found no sig-nificant difference in mean qCO2 between soil groups, we noteddifferent ranges of variation. The qCO2 parameter displayed highvariation in groups 4 and 5 whereas it remained stable in the othersoil groups. Assessing qCO2 as an indicator of soil quality wouldbe relevant only in soils displaying inherent properties similar tothose of groups 4 and 5 (both non carbonated). One should note thatCO2 emission originating from calcium carbonate dissolution canoccur in calcareous soils (Bertrand et al., 2007; Emmerich, 2003;Tamir et al., 2011); and CO2 respired in closed-chamber protocolscan also re-precipitate in carbonated soils (Oren and Steinberger,2008). In addition, Dong et al. (2013) highlighted that the overesti-mation of soil respiration varied depending on the type and amountof carbonate present in the soil. For these reasons we believe thisparameter is not a suitable indicator for carbonated soils, except forcomparisons within a group of soils that present similar carbonatecharacteristics and concentrations.
Studying nematode communities provided further informationcorroborating different soil functioning between soil groups. Thedifference in nematode abundance between groups 4 and 5 andgroups 1, 2, 3 and 6 was probably due to a pH effect as pointedout by Mulder et al. (2005) and Popovici and Ciobanu (2000). LikeLiskova et al. (2008) we observed a change in the trophic structureof the nematode community according to soil groups. Whereas theproportion of fungal-feeding nematodes was highest in mildly acidsoils (groups 4 and 5), the proportion of obligate plant-feeders washighest in carbonated soils (groups 1, 2 and 3). The first result wasprobably due to a change in the bacteria/fungi ratio with decreasingpH (Bååth and Anderson, 2003). The second result corroboratesfindings by Rahman et al. (2007), who observed a decrease in plantparasitic nematodes with decreasing pH. This highlights the pos-sibility of a higher nematode phytopathogenic stress on vineyardsin carbonated soils and especially in sandy soils of group 1, whichalso exhibited the highest PPI (higher proportion of plant parasiticnematodes). However this phytopathogenic stress has to be con-firmed by the identification of nematodes at the species level giventhat the main plant-parasitic nematode associated with vineyardsis Xiphimena index and, according to Sultan and Ferris (1991), thesurvival of this species is low in sandy soils. The higher proportion ofbacterial-feeding nematodes in the sandy soils from group 1 (whichlogically also displayed the highest NCR) than in soils from groups2 and 3 pointed out differences in the soil foodweb and decomposi-tion pathway according to soil texture. Despite the methodologicalconstraints associated with their identification, nematodes appearto be good indicators of soil food web and decomposer communitystructure because of the comprehensive information provided bytheir analysis. Moreover, nematofaunal indices (SI and EI) were notsignificantly influenced by the soil type whereas they were signifi-cantly influenced by management practices (Villenave et al., 2013;companion paper in prep); so they can be compared between soilswhatever the inherent characteristics of these soils.
With dynamic soil parameter distributions tabulated by class ofinherent soil properties, we believe that stakeholders can easilyappraise their topsoil quality. We chose not to specify thresh-old benchmark values related to a “good” soil functioning, as didRutgers et al. (2008) for different land uses and soil types in theNetherlands. Defining thresholds for each soil parameter implicitly
assumes additivity and equal importance of all parameters, whilethey are in fact interrelated in different ways and their relativeimportance can depend on winegrower priorities. Coll et al. (2011)demonstrated that changes in vineyard practices could improvesome parameters while negatively affecting others. As a conse-quence, it may be difficult to define practices that improve all soilfunctions simultaneously.
4.3. Global vineyard topsoil quality in the Languedoc-Roussillonregion
Studying the range of values of dynamic parameters providesinformation about some trends in global topsoil quality in Mediter-ranean vineyards as assessed in the Languedoc-Roussillon region.The most relevant result is the low organic matter content in thesesoils. Even though we measured Corg contents up to 64 g kg−1, themedian value was 11.9 g kg−1, which can be qualified as low. More-over, a quarter of the 164 plots contained less than 10 g kg−1, whichis, according to Jones et al. (2004), a threshold value of Corg forsoil erosion risk. Improvement of the organic status of these soilsmust therefore be promoted (Le Bissonnais et al., 2007) and prac-tices minimizing losses of soil carbon should be considered (Carlisleet al., 2006; Steenwerth et al., 2010). Biological parameters suchas MBC, nematode abundance or the MBC/Corg ratio indicated alow biological activity in these soils and a poor resource utiliza-tion efficiency in comparison with other crops or pastures (Carter,1991; Sparling, 1992; Villenave et al., 2013), or with other vineyardsunder different climatic conditions (Probst et al., 2008). Moreoverthe low Enrichment and Maturity indices (EI and MI) obtained fromnematode faunal analysis indicated poor resource availability aswell as disturbance or contamination of the soil. This result corrob-orates studies by Coll et al. (2011) and Manachini (2001) in othervineyards in Mediterranean regions. However, our findings alsopointed out that vineyard soils in the Languedoc-Roussillon regionwere not systematically characterized by low SI values indicativeof a degraded soil food web. As a consequence of this survey,we can consider that Languedoc-Roussillon vineyards generallyexhibit low topsoil quality regarding resources and the intensityof biological activity but not necessarily regarding its functioningthrough soil food web structure. Mildly acidic and/or sandy soilsdisplayed the lowest soil quality focusing both on biological andorganic status and the efficiency of microbial activity. This sug-gests that these soils may be more vulnerable and less resilientto perturbations. It is necessary, especially in these soils, to look forand promote management practices that improve biological activ-ity and organic matter content (Steenwerth and Belina, 2008) aswell as the efficiency of substrate utilization.
5. Conclusion
Most of the dynamic parameters were strongly affected byinherent soil properties, emphasizing the need to consider theinherent potential of different soils in assessing their quality andevaluating management practices. For this reason we proposed asoil classification based on stoniness, carbonate content and tex-ture for the appraisal of topsoil quality using various indicators.We underlined the importance of using appropriate indicators fora holistic approach toward topsoil quality in a specific terroir. Com-pleting those indicators of topsoil functioning with indicators oferosion risk, such as aggregate stability, would nevertheless be nec-essary to assess topsoil quality in a more comprehensive manner,and to struggle against the main threats of these vulnerable soils.This study was conducted in vineyards of the Languedoc-Roussillonin the Mediterranean part of France but could be reproduced forany other land use type and climatic region, under the condition

92 C. Salome et al. / Ecological Indicators 43 (2014) 83–93
that a sufficient database is produced to reveal structural trends.Baselines provided by such studies would allow stakeholders tocompare their topsoil quality even with minimum knowledge insoil sciences. The evaluation of topsoil quality can reveal endan-gered soil functions and thus provide farmers with guidelines forthe prioritization and adaptation of farming practices allowing sus-tainable soil management.
Acknowledgments
Authors gratefully thank the TIMAC Agro, Ademe andMontpellier SupAgro for the financial support of this research. Theyalso thank Jean-Pierre Barthès, Guillaume Coulouma and StéphaneFollain from UMR LISAH for their help in the selection of the ninerepresentative areas and 164 plots, and Tanguy Daufresne for hishelpful advice. This study would never have taken place withoutthe support of 95 winegrowers, directors of cooperative wineriesand managers of large wine-growing estates.
References
Aitken, R., Moody, P., 1994. The effect of valence and ionic-strength on the measure-ment of pH buffer capacity. Soil Research 32, 975–984.
Arshad, M.A., Martin, S., 2002. Identifying critical limits for soil quality indicators inagro-ecosystems. Agriculture, Ecosystems & Environment 88, 153–160.
Bååth, E., Anderson, T.H., 2003. Comparison of soil fungal/bacterial ratios in a pHgradient using physiological and PLFA-based techniques. Soil Biology and Bio-chemistry 35, 955–963.
Bastida, F., Zsolnay, A., Hernández, T., García, C., 2008. Past, present and future ofsoil quality indices: a biological perspective. Geoderma 147, 159–171.
Bertrand, I., Delfosse, O., Mary, B., 2007. Carbon and nitrogen mineralization in acidic,limed and calcareous agricultural soils: apparent and actual effects. Soil Biologyand Biochemistry 39, 276–288.
Bolan, N.S., Hedley, M.J., 2003. Role of carbon, nitrogen, and sulfur cycles in soilacidification. In: Rengel, Z. (Ed.), Handbook of Soil Acidity. Marcel Dekker Inc.,New York, pp. 29–56.
Bongers, T., 1990. The maturity index—an ecological measure of environmental dis-turbance based on nematode species composition. Oecologia 83, 14–19.
Bongers, T., Bongers, M., 1998. Functional diversity of nematodes. Applied Soil Ecol-ogy 10, 239–251.
Bronick, C.J., Lal, R., 2005. Soil structure and management: a review. Geoderma 124,3–22.
Carlisle, E.A., Steenwerth, K.L., Smart, D.R., 2006. Effects of land use on soil respi-ration: conversion of oak woodlands to vineyards. Journal of EnvironmentalQuality 35, 1396–1404.
Carter, M.R., 1991. The influence of tillage on the proportion of organic-carbon andnitrogen in the microbial biomass of medium-textured soils in a humid climate.Biology and Fertility of Soils 11, 135–139.
Chaignon, V., Sanchez-Neira, I., Herrmann, P., Jaillard, B., Hinsinger, P., 2003. Copperbioavailability and extractability as related to chemical properties of contami-nated soils from a vine-growing area. Environmental Pollution 123, 229–238.
Coll, P., Le Cadre, E., Blanchart, E., Hinsinger, P., Villenave, C., 2011. Organic viticultureand soil quality: a long-term study in Southern France. Applied Soil Ecology 50,37–44.
Coll, P., Le Cadre, E., Villenave, C., 2012a. How are nematode communities affectedduring a conversion from conventional to organic farming in southern Frenchvineyards? Nematology 14, 665–676.
Coll, P., Le Velly, R., Le Cadre, E., Villenave, C., 2012b. La qualité des sols: associerperceptions et analyses des scientifiques et des viticulteurs. Etude et Gestiondes Sols 19, 79–89.
Coulouma, G., Boizard, H., Trotoux, G., Lagacherie, P., Richard, G., 2006. Effect of deeptillage for vineyard establishment on soil structure: a case study in SouthernFrance. Soil and Tillage Research 88, 132–143.
Courchesne, F., Kruyts, N., Legrand, P., 2006. Labile zinc concentration and free cop-per ion activity in the rhizosphere of forest soils. Environmental Toxicology andChemistry 25, 635–642.
Dequiedt, S., Thioulouse, J., Jolivet, C., Saby, N.P.A., Lelievre, M., Maron, P.A., Martin,M.P., Prevost-Boure, N.C., Toutain, B., Arrouays, D., Lemanceau, P., Ranjard, L.,2009. Biogeographical patterns of soil bacterial communities. EnvironmentalMicrobiology Reports 1, 251–255.
Dong, Y.S., Cai, M., Liang, B., Zhou, B., 2013. Effects of additional carbonates on CO2emissions for calcareous soils during the closed jar incubations. Pedosphere 23(2), 137–142.
Doran, J.W., Parkin, T.B., 1994. Defining and Assessing Soil Quality. SSSA Spec. Publ.No. 35, Soil Sci. Soc. Am., Inc. and Am. Soc. Agron., Inc., Madison, WI.
Doran, J.W., Zeiss, M.R., 2000. Soil health and sustainability: managing the bioticcomponent of soil quality. Applied Soil Ecology 15, 3–11.
Emmerich, W.E., 2003. Carbon dioxide fluxes in a semiarid environment with highcarbonate soils. Agricultural and Forest Meteorology 116, 91–102.
Ferris, H., Bongers, T., de Goede, R.G.M., 2001. A framework for soil food web diag-nostics: extension of the nematode faunal analysis concept. Applied Soil Ecology18, 13–29.
Fierer, N., Strickland, M.S., Liptzin, D., Bradford, M.A., Cleveland, C.C., 2009. Globalpatterns in belowground communities. Ecology Letters 12, 1238–1249.
Fränzle, O., 2006. Complex bioindication and environmental stress assessment. Eco-logical Indicators 6, 114–136.
Hassink, J., 1994. Effects of soil texture and grassland management on soil organicC and N and rates of C and N mineralisation. Soil Biology & Biochemistry 26,1221–1231.
Hassink, J., 1997. The capacity of soils to preserve organic C and N by their associationwith clay and silt particles. Plant and Soil 191, 77–87.
Herrick, J.E., 2000. Soil quality: an indicator of sustainable land management?Applied Soil Ecology 15, 75–83.
Hildebrandt, A., Guillamon, M., Lacorte, S., Tauler, R., Barcelo, D., 2008. Impact ofpesticides used in agriculture and vineyards to surface and groundwater quality(North Spain). Water Research 42, 3315–3326.
Irshad, U., Villenave, C., Brauman, A., Plassard, C., 2011. Grazing by nematodes on rhi-zosphere bacteria enhances nitrate and phosphorus availability to Pinus pinasterseedlings. Soil Biology & Biochemistry 43, 2121–2126.
ISO 23611-4, 2007. Soil quality—sampling of soil invertebrates—Part 4: Sampling,extraction and identification of soil-inhabiting nematodes.
Jones, G.V., White, M.A., Cooper, O.R., Storchmann, K., 2005. Climate change andglobal wine quality. Climatic Change 73, 319–343.
Jones, R.J.A., Hiederer, R., Rusco, E., Loveland, P.J., Montanarella, L., 2004. The mapof organic carbon in topsoils in Europe, Version 1.2, September 2003: Explana-tion of Special Publication Ispra 2004 No.72 (S.P.I.04.72). European Soil BureauResearch Report No.17, EUR 21209 EN, 26pp. and 1 map in ISO B1 format. Officefor Official Publications of the European Communities, Luxembourg.
Karlen, D.L., Ditzler, C.A., Andrews, S.S., 2003. Soil quality: why and how? Geoderma114, 145–156.
Karlen, D.L., Mausbach, M.J., Doran, J.W., Cline, R.G., Harris, R.F., Schuman, G.E., 1997.Soil quality: a concept, definition, and framework for evaluation. Soil ScienceSociety of America Journal 61, 4–10.
Kaschuk, G., Alberton, O., Hungria, M., 2011. Quantifying effects of different agri-cultural land uses on soil microbial biomass and activity in Brazilian biomes:inferences to improve soil quality. Plant and Soil 338, 467–481.
Kibblewhite, M.G., Ritz, K., Swift, M.J., 2008. Soil health in agricultural systems.Philosophical Transactions of the Royal Society B: Biological Sciences 363,685–701.
Komarek, M., Cadkova, E., Chrastny, V., Bordas, F., Bollinger, J.C., 2010. Contaminationof vineyard soils with fungicides: a review of environmental and toxicologicalaspects. Ecological Indicators 36, 138–151.
Lagacherie, P., Coulouma, G., Ariagno, P., Virat, P., Boizard, H., Richard, G., 2006.Spatial variability of soil compaction over a vineyard region in relation withsoils and cultivation operations. Geoderma 134, 207–216.
Le Bissonnais, Y., Blavet, D., De Noni, G., Laurent, J.Y., Asseline, J., Chenu, C., 2007.Erodibility of Mediterranean vineyard soils: relevant aggregate stability meth-ods and significant soil variables. European Journal of Soil Science 58, 188–195.
Liskova, M., Cerevkova, A., Hanel, L., 2008. Nematode communities of forest ecosys-tems in association with various soil orders. Russian Journal of Nematology 16,129–142.
Mader, P., Fliessbach, A., Dubois, D., Gunst, L., Fried, P., Niggli, U., 2002. Soil fertilityand biodiversity in organic farming. Science 296, 1694–1697.
Manachini, B., 2001. Nematode diversity in vineyard soil under different agriculturalmanagement regimes, Bulletin OILB/SROP 24.
Martinez-Casasnovas, J.A., Ramos, M.C., Garcia-Hernandez, D., 2009. Effects of land-use changes in vegetation cover and sidewall erosion in a gully head of thePenedes region (northeast Spain). Earth Surface Processes and Landforms 34,1927–1937.
Michaud, A.M., Bravin, M.N., Galleguillos, M., Hinsinger, P., 2007. Copper uptake andphytotoxicity as assessed in situ for durum wheat (Triticum turgidum durumL.) cultivated in Cu-contaminated, former vineyard soils. Plant and Soil 298,99–111.
Mueller, L., Schindler, U., Behrendt, A., Eulenstein, F., Dannowski, R., 2007. TheMuencheberg Soil Quality Rating (SQR). Field Guide for Detecting and AssessingProperties and Limitations of Soils for Cropping and Grazing. http://www.zalf.de/de/forschung/institute/lwh/mitarbeiter/lmueller/Documents/fieldmueller.pdf
Mulder, C., Van Wijnen, H.J., Van Wezel, A.P., 2005. Numerical abundance and biodi-versity of below-ground taxocenes along a pH gradient across the Netherlands.Journal of Biogeography 32, 1775–1790.
Nascimbene, J., Marini, L., Paoletti, M.G., 2012. Organic farming benefits local plantdiversity in vineyard farms located in intensive agricultural landscapes. Envi-ronmental Management 49, 1054–1060.
Ohno, T., Zibilske, L.M., 1991. Determination of low concentrations of phosphorus insoil extracts using malachite green. Soil Science Society of America Journal 55,892–895.
Oren, A., Steinberger, Y., 2008. Coping with artifacts induced by CaCO3-CO2-H2Oequilibria in substrate utilization profiling of calcareous soils. Soil Biology &Biochemistry 40, 2569–2577.
Pansu, M., Gautheyrou, J., 2006. Handbook of Soil Analysis. Mineralogical, Organicand Inorganic Methods. Springer, Berlin/Heidelberg.
Popovici, I., Ciobanu, M., 2000. Diversity and distribution of nematode communitiesin grasslands from Romania in relation to vegetation and soil characteristics.Applied Soil Ecology 14, 27–36.

C. Salome et al. / Ecological Indicators 43 (2014) 83–93 93
Probst, B., Schuler, C., Joergensen, R.G., 2008. Vineyard soils under organic andconventional management—microbial biomass and activity indices and theirrelation to soil chemical properties. Biology and Fertility of Soils 44, 443–450.
Puget, P., Chenu, C., Balesdent, J., 2000. Dynamics of soil organic matter associatedwith particle-size fractions of water-stable aggregates. European Journal of SoilScience 51, 595–605.
Pulleman, M., Creamer, R., Hamer, U., Helder, J., Pelosi, C., Pérès, G., Rutgers, M., 2012.Soil biodiversity, biological indicators and soil ecosystem services—an overviewof European approaches. Current Opinion in Environmental Sustainability 4,529–538.
Core Team, R., 2012. R: A Language and Environment for Statistical Computing.Foundation for Statistical Computing, Vienna, Austria.
Raclot, D., Le Bissonnais, Y., Louchart, X., Andrieux, P., Moussa, R., Voltz, M., 2009. Soiltillage and scale effects on erosion from fields to catchment in a Mediterraneanvineyard area. Agriculture, Ecosystems & Environment 134, 201–210.
Rahman, L., Chan, K.Y., Heenan, D.P., 2007. Impact of tillage, stubble managementand crop rotation on nematode populations in a long-term field experiment. Soiland Tillage Research 95, 110–119.
Rutgers, M., Mulder, C., Schouten, A.J., Bloem, J., Bogte, J.J., Breure, A.M., et al., 2008.Soil Ecosystem Profiling in the Netherlands With Ten References for BiologicalSoil Quality. Report 607604009, RIVM, Bilthoven.
Satish, C.G., Dong, W., 2007. Water Retention in Soil, Encyclopedia of Soil Science,2nd edition. Taylor & Francis, pp. 1864–1869.
Sauvé, S., Hendershot, W., Allen, H.E., 2000. Solid-solution partitioning of metals incontaminated soils: dependence on pH, total metal burden, and organic matter.Environmental Science & Technology 34, 1125–1131.
Schloter, M., Dilly, O., Munch, J.C., 2003. Indicators for evaluating soil quality. Agri-culture, Ecosystems & Environment 98, 255–262.
Schroter, D., Cramer, W., Leemans, R., Prentice, I.C., Araujo, M.B., Arnell, N.W., Bon-deau, A., Bugmann, H., Carter, T.R., Gracia, C.A., de la Vega-Leinert, A.C., Erhard,M., Ewert, F., Glendining, M., House, J.I., Kankaanpaa, S., Klein, R.J.T., Lavorel,S., Lindner, M., Metzger, M.J., Meyer, J., Mitchell, T.D., Reginster, I., Rounsevell,M., Sabate, S., Sitch, S., Smith, B., Smith, J., Smith, P., Sykes, M.T., Thonicke, K.,Thuiller, W., Tuck, G., Zaehle, S., Zierl, B., 2005. Ecosystem service supply andvulnerability to global change in Europe. Science 310, 1333–1337.
Six, J., Bossuyt, H., Degryze, S., Denef, K., 2004. A history of research on the linkbetween (micro)aggregates, soil biota, and soil organic matter dynamics. Soiland Tillage Research 79, 7–31.
Sparling, G., 1992. Ratio of microbial biomass carbon to soil organic carbon as asensitive indicator of changes in soil organic matter. Soil Research 30, 195–207.
Steenwerth, K., Belina, K.M., 2008. Cover crops enhance soil organic matter, carbondynamics and microbiological function in a vineyard agroecosystem. AppliedSoil Ecology 40, 359–369.
Steenwerth, K.L., Pierce, D.L., Carlisle, E.A., Spencer, R.G.M., Smart, D.R., 2010. Avineyard agroecosystem: disturbance and precipitation affect soil respirationunder Mediterranean conditions. Soil Science Society of America Journal 74,231–239.
Sultan, S.A., Ferris, H., 1991. The effect of soil moisture and soil particle size on thesurvival and population increase of Xiphinerna index. Revue de Nématologie 14,345–351.
Tamir, G., Shenker, M., Heller, H., Bloom, P.R., Fine, P., Bar-Tal, A., 2011. Can soilcarbonate dissolution lead to overestimation of soil respiration? Soil ScienceSociety of America Journal 75, 1414–1422.
van Erp, P.J., Houba, V.J.G., van Beusichem, M.L., 2001. Actual cation exchange capac-ity of agricultural soils and its relationship with pH and content of carbon andclay. Communications in Soil Science and Plant Analysis 32, 19–31.
Van Leeuwen, C., Friant, P., Chone, X., Tregoat, O., Koundouras, S., Dubourdieu, D.,2004. Influence of climate, soil, and cultivar on terroir. American Journal ofEnology and Viticulture 55, 207–217.
Van Leeuwen, C., Seguin, G., 2006. The concept of terroir in viticulture. Journal ofWine Research 17, 1–10.
Villenave, C., Bongers, T., Ekschmitt, K., Djigal, D., Chotte, J.L., 2001. Changes in nema-tode communities following cultivation of soils after fallow periods of differentlength. Applied Soil Ecology 17, 43–52.
Villenave, C., Jimenez, A., Guernion, M., Pérès, G., Cluzeau, D., Mateille, T., Martiny,B., Fargette, M., Tavoillot, J., 2013. Nematodes for soil quality monitoring: resultsfrom the RMQS BioDiv Programme. Open Journal of Soil Science 3, 30–45.
Wardle, D.A., Ghani, A., 1995. A critique of the microbial metabolic quotient (qCO(2))as a bioindicator of disturbance and ecosystem development. Soil Biology &Biochemistry 27, 1601–1610.
Wienhold, B.J., Andrews, S.S., Karlen, D.L., 2004. Soil quality: a review of the scienceand experiences in the USA. Environmental Geochemistry and Health 26, 89–95.
Wu, J., Joergensen, R.G., Pommerening, B., Chaussod, R., Brookes, P.C., 1990. Mea-surement of soil microbial biomass C by fumigation extraction—an automatedprocedure. Soil Biology & Biochemistry 22, 1167–1169.
Yeates, G.W., 2003. Nematodes as soil indicators: functional and biodiversity aspects.Biology and Fertility of Soils 37, 199–210.
Zhang, X.K., Li, Q., Zhu, A.N., Liang, W.J., Zhang, J.B., Steinberger, Y., 2012. Effects oftillage and residue management on soil nematode communities in North China.Ecological Indicators 13, 75–81.

Publication N°3

This article appeared in a journal published by Elsevier. The attachedcopy is furnished to the author for internal non-commercial researchand education use, including for instruction at the authors institution
and sharing with colleagues.
Other uses, including reproduction and distribution, or selling orlicensing copies, or posting to personal, institutional or third party
websites are prohibited.
In most cases authors are permitted to post their version of thearticle (e.g. in Word or Tex form) to their personal website orinstitutional repository. Authors requiring further information
regarding Elsevier’s archiving and manuscript policies areencouraged to visit:
http://www.elsevier.com/copyright

Author's personal copy
Applied Soil Ecology 50 (2011) 37– 44
Contents lists available at ScienceDirect
Applied Soil Ecology
journa l h o me page: www.elsev ier .com/ locate /apsoi l
Organic viticulture and soil quality: A long-term study in Southern France
Patrice Coll a, Edith Le Cadrea,∗, Eric Blanchartb, Philippe Hinsingerc, Cécile Villenaveb
a Montpellier SupAgro, UMR Eco&Sols, 34060 Montpellier, Franceb IRD, UMR Eco&Sols, 34060 Montpellier, Francec INRA, UMR Eco&Sols, 34060 Montpellier, France
a r t i c l e i n f o
Article history:Received 12 May 2011Received in revised form 19 July 2011Accepted 24 July 2011
Keywords:Conventional viticultureBioindicatorsOrganic matterMicrobial biomassNematodesEarthworms
a b s t r a c t
The rate of conversion of conventional vineyards into organic farming is currently increasing. This resultsin modifications of agricultural practices such as the application of organic manure, the use of tillage orgrass-cutting to control weeds and the application of natural pesticides with preventive action. One ofthe aims of organic farming is to preserve the environment. In this context, the objective of our workwas to evaluate the long-term effects of organic viticulture on soil quality. The study was conducted in acommercial vineyard where plots which had been organically managed for 7 (Organic7), 11 (Organic11)and 17 years (Organic17) were compared to conventionally managed plots (Conventional). Soil physicaland chemical parameters (bulk density, organic matter, available phosphorus, potassium and coppercontents) and biological parameters (soil microbial biomass, density of nematode trophic groups anddensity and biomass of earthworm ecological categories) were measured. The organic farming led toan increase in soil organic matter, potassium content, soil microbial biomass, plant-feeding and fungal-feeding nematode densities. However, organic farming increased soil compaction, decreased endogeicearthworm density and did not modify the soil micro-food web evaluated by nematofauna analysis.Our study highlights the difficulty to show the benefits of organic farming on global soil quality in thisparticular pedoclimatic area and set of farming practices.
© 2011 Elsevier B.V. All rights reserved.
1. Introduction
For food and beverage safety issues, environmental consid-erations and economic interests are prompting more and morewinegrowers to convert conventionally managed vineyards intoorganic farming. From 2001 to 2008, the area of organically man-aged French vineyards increased by 110%: 13,426 ha in 2001(AgenceBIO, 2002) and 28,190 ha in 2008 (AgenceBIO, 2009). Con-ventional viticulture uses agrochemicals such as manufacturedinorganic fertilizers and synthetic chemical pesticides. In contrast,these are banned in organic farming, while only organic fertilizers,crushed rocks and a few non synthetic pesticides are allowed (Briaret al., 2007). Instead of applying herbicides, weeds are managedby tillage or grass-cutting in organic farming. As a consequence,organic farming claims to reduce disturbance intensity of agricul-tural practices on the environment (Reganold et al., 1987), andespecially on soil. Indeed, soil is a non-renewable resource and mostvineyard soils are considered as highly degraded in terms of loss
∗ Corresponding author at: Montpellier SupAgro, UMR Eco&Sols, bâtiment 12, 2Place Pierre Viala, 34060 Montpellier Cedex 2, France. Tel.: +33 4 99 61 30 36;fax: +33 4 99 61 21 19.
E-mail addresses: [email protected] (P. Coll), [email protected](E. Le Cadre).
of organic carbon as a result increasing erosion and diminution ofnutrient contents (Le Bissonnais et al., 2007; Martinez-Casasnovasand Ramos, 2009), accumulation of metals and organic pollutants(Chaignon et al., 2003; Komarek et al., 2010) or compaction due totractor traffics (Coulouma et al., 2006). One of the main objectives oforganic farming is to give more importance to soil biological func-tioning in order to improve its physical (affecting the circulation ofwater, aeration), chemical (affecting the availability of nutrients)and biological (affecting the biodiversity and fate of organic mat-ter) properties (Van Bruggen and Semenov, 2000). Furthermore, inwine production, the soil is considered, together with climate, asa key component of Terroir (Van Leeuwen et al., 2004) which caninfluence the wine quality (Van Leeuwen and Seguin, 2006).
As defined by Doran and Parkin (1994) “the soil quality is theability of a soil to function within ecosystem boundaries to sustainbiological productivity, maintain environmental quality, and pro-mote plant and animal health”. Soil quality is generally evaluatedby the interpretation of physical, chemical or biological indicators.Among physical and chemical indicators, those most used by wine-growers are soil bulk density, pH, availability of major nutrients (N,P, K, Ca, Mg), organic matter content which is known to increase soilwater holding capacity (Teixeira et al., 2011), to promote soil aggre-gation (Le Bissonnais et al., 2007; Morlat and Chaussod, 2008) andto constitute a pool of available nutrients (Haynes, 1999). Biologicalindicators or bioindicators are considered to give an evaluation of
0929-1393/$ – see front matter © 2011 Elsevier B.V. All rights reserved.doi:10.1016/j.apsoil.2011.07.013

Author's personal copy
38 P. Coll et al. / Applied Soil Ecology 50 (2011) 37– 44
soil functioning because soil organisms have intimate relationshipswith their surroundings (Franzle, 2006), and then can give infor-mation about soil degration or improvement (Bispo et al., 2011).The most widely studied are microorganisms and soil fauna (Huberet al., 2008; Bispo et al., 2011). Microorganisms are involved in dif-ferent key processes in the ecosystems, such as the decompositionof organic matter, humus formation, soil aggregation, retention andcycling of nutrients, and various symbiotic and parasitic relation-ships with plants (Paul and Clark, 1996). Other useful bioindicatorsare nematodes and earthworms. To evaluate the soil food web, thesoil nematodes are pertinent bioindicators because they presentan important diversity of trophic groups such as plant-feeders,bacterial-feeders, fungal-feeders, omnivores and predators (Yeateset al., 1993; Villenave et al., 2004). Indeed, they are implicatedin soil organic matter mineralization processes (Neher, 2001). Inaddition, they are ubiquitous and thus present in all pedo-climaticsituations including habitats that vary from pristine to extremelydegraded (Bongers and Ferris, 1999). Other representatives of soilfauna are earthworms. They are described as bioindicators of soilquality as they modify soil physical properties. In particular theymaintain soil structure and modify soil hydrodynamic functioning(Eijsackers et al., 2005). They provide additional information aboutthe fate of organic matter. As a consequence both nematodes andearthworms give different and therefore complementary data onsoil functioning.
Several authors compared vineyard soil characteristics afterinorganic and organic fertilizer application (Morlat and Chaussod,2008; Bustamante et al., 2011) and under different grass man-agement practices (Monteiro and Lopes, 2007; Smith et al., 2008;Steenwerth and Belina, 2008). Until now, scientific knowledge con-cerning the effects of organic viticulture on soil functioning isscarce, except the studies of Reeve et al. (2005), Probst et al. (2008)and Reinecke et al. (2008). There is thus a great need to evaluateif soil quality is altered by changing practices during the conver-sion of vineyards into organic farming. Former studies have focusedon earthworms and microbial biomass (Reuter and Kubiak, 2003;Ingels et al., 2005; Whitelaw-Weckert et al., 2007), but fewer stud-ies were conducted on nematodes as bioindicators of vineyard soilquality (Sanchez-Moreno and Ferris, 2007; Rahman et al., 2009).To our knowledge, none of this research combined several physi-cal, chemical and biological indicators to give a complete overviewof soil quality of vineyards.
In this work, we measured the long-term effects of organicviticulture by physical and chemical indicators (organic matter con-tent, availability of major nutrients and contaminant (Cu), bulkdensity) as well as by bioindicators (microbial biomass, nematodesand earthworms). With our methodology, we can then evaluateif intensive practices denoted as conventional are more dam-aging to soil quality and biological functions than are arguablyorganic practices. The present study was conducted on 24 vine-yard plots: 10 were conventionally managed, while the othershad different ages of conversion into organic farming (7, 11 and17 years).
2. Material and methods
2.1. Site description, management and field plot design
This study was conducted in May 2009 in Cruscades, which islocated in the South of France, in the Languedoc-Roussillon region(43◦11′29.13′′N, 2◦49′1.78′′E; 26–50 m elevation). The climate istypically Mediterranean with 14.7 ◦C mean annual temperature,600 mm of annual rainfall and 1380 mm of annual ETP Penman-Monteith (average value based on data collected from 2000 to 2010by Météo-France). The plots did not present any slope. The soil wassilty-clay, with 42 ± 2% of silt, 36 ± 1% of clay and 22 ± 2% of sand.
It was calcareous (208 ± 7 g of total CaCO3 kg−1), yielding a pH inwater of 8.3. The soil water-holding capacity was 20.6 ± 0.5% (w/w).
The study was conducted on 24 commercial wine grape vine-yard plots whose mean area was around 1.5 ha. They presenteddifferent varieties of grape (Vitis vinifera L.) such as Cabernet-Sauvignon, Carignan N, Chardonnay, Cinsault, Grenache N, Merlot,Mourvèdre, Pinot N and Syrah. The rootstocks were mainly R110and R140, but Riparia and 410a were also present. The yearof plantation varied from 1932 to 2003. The plantation densitywas comprised between 3300 and 5000 vines per hectare. Tenplots were managed according to conventional farming (Conven-tional) and the others according to organic farming (Organic).Five plots have been organically managed since September 2001,officially certified in 2004 (Organic7). Four plots have been organ-ically managed since September 1997 (Organic11) and the last5 plots since September 1991 (Organic17). These 4 sets of plotswill be referred to as treatments here below. Conventional agri-cultural practices were identical for each treatment before theorganic conversion as well as organic agricultural practices afterthe conversion (Table 1). Four representative subplots (5 vines × 4inter-rows) per plot were sampled. Consequently, 96 subplots werestudied.
2.2. Sampling procedure
The sampling was conducted in springtime, a few days after mildraining events and could be considered to occur within the sametime frame (on May 2009, from 4th to 15th for earthworms andfrom 22nd to 28th for soil). The soil water content was 14.7 ± 0.3%(w/w) for earthworm sampling and 11.2 ± 0.2% (w/w) for soil sam-pling. Soil and earthworms were sampled in the 0–15 cm topsoil inthe center of the inter-row. There were one soil and one earthwormsample per subplot. Each soil sample consisted of a composite offour subsamples, one per inter-row, taken with a gouge auger.Soil used to measure bulk density was sampled according to thecylinder method. Soil samples were sieved at 1 cm before biologi-cal analyses and at 2 mm before physical and chemical analyses.To sample earthworms, a monolith of soil of 45 cm × 45 cm on15 cm depth was extracted per subplot. Earthworms were sam-pled by the hand-sorting method and placed in alcohol solutionat 75%, then transferred into a 4% formaldehyde solution to bestored.
2.3. Physical and chemical analyses
Soil used to measure bulk density was dried at 105 ◦C for 1 weekand weighed rapidly thereafter (ISO 11272, 1998). Total organiccarbon (TOC) and total nitrogen (N) contents were measured bydry combustion according to the ISO 10694 (1995) norm for TOCand the ISO 13878 (1998) norm for N. The effective cation exchangecapacity (CEC) was determined according to the cobaltihexaminechloride method (ISO 23470, 2007). A water extract (soil:extractantratio 1:10 and 2 h of contact) was used to determine the contents ofavailable phosphorus (P), potassium (K) and copper (Cu). The solu-tion was centrifuged (2000 × g during 20 min at 20 ◦C) and filteredat 0.2 !m. The P content was determined by the green malachitemethod (Ohno and Zibilske, 1991). The K and Cu contents weremeasured by flame atomic absorption spectrometry (Varian A600).
2.4. Biological analyses
Soil microbial biomass carbon (MB) was determined followingthe fumigation-extraction method (Wu et al., 1990). The organiccarbon from fumigated and non-fumigated soils was measuredwith a total organic carbon analyzer TOC-V CSH (Shimadzu). Nema-todes were extracted from 200 g of wet soil using the Oostenbrink

Author's personal copy
P. Coll et al. / Applied Soil Ecology 50 (2011) 37– 44 39
Table 1Agricultural practices in conventional farming and organic farming.
Soil management Fertilization (N–P–K) Vine phytosanitaryprotection
Tractor frequencyper year (year−1)
Rows Inter-rows
Conventional Chemical weeding(glyphosate,700 g ha−1, 1 year−1)
Tillage with tined tools(15 cm depth, 2 year−1)
Mineral (10–10–20,200 kg ha−1, 1 year−1)
Synthesis and natural(6 treatments year−1)
14
Organic Tillage (10 cm of depth,1 year−1)
Mouldboard ploughing(25 cm depth, 4 year−1)
Compost (90% of OM)(9–5–0, 500 kg ha−1,1 year−1)
Natural (8treatments year−1)
18
elutriation technique, complemented with sieving and cotton-wood extraction (ISO 23611-4, 2007). Nematodes were fixed in a4% formaldehyde solution and a representative sub-sample wasmounted on glass slides for identification at high magnification(×400). An average of 150 nematodes per sample was identifiedto family level and grouped into 5 trophic groups: plant-feeders(PF), bacterial-feeders (Ba), fungal-feeders (Fu), omnivores (Om)and predators (Pr). Earthworms were gently dried before beingweighed and counted. Adult and juvenile earthworms were dis-tinguished and distributed into 2 ecological categories: endogeicsand anecics.
2.5. Statistical analyses
An univariate approach using generalized and linear mixedmodels for hierarchical data (Pinherio and Bates, 2000; Bolker et al.,2009) was used to study the differences between treatments foreach observed variable. Prior to the analysis and when necessary,the distribution of observed variables were adjusted to Gaussiandistribution using proper transformations (square root or logarith-mic). The variables describing density data belonging to nematodetrophic groups and earthworm ecological categories were not nor-malized because they rather followed Poisson distribution. Thefunctions lmer and glmer from the library lme4 of the R 2.11.1 soft-ware (R Development Core Team, 2011) were used to computemixed models from variables having, respectively, Gaussian andPoisson distributions. The multiple comparisons of mean amongtreatments were then tested using Markov Chain Monte Carlo sam-ples.
Based on the results of the univariate approach, a linear dis-criminant analysis was conducted to discriminate observationsamong the 4 treatments (Conventional, Organic7, Organic11 andOrganic17). In order to do this, this multivariate analysis com-puted the best discriminant functions to differentiate objectsamong treatments, while minimizing variability within a treat-ment (Legendre and Legendre, 1998). Bulk density, total organiccarbon (TOC) and total nitrogen (N) contents, soil microbial biomasscarbon (MB), available phosphorus (P), potassium (K) and copper(Cu) contents, effective CEC (CEC), plant-feeding (PF), bacterial-feeding (Ba), fungal-feeding (Fu), combined omnivore and predator(Om + Pr) nematode densities and endogeic earthworm density andbiomass were the variables integrated in the discriminant anal-
ysis. This analysis was performed using the XL-Stat software forWindows®. The results were presented in the form of correlationscircle of variables, distribution of the 96 observations along the twodiscriminant axes and confusion matrix comparing a priori (real)and a posteriori (calculated) classification of observations using thecross-validation technique.
3. Results
3.1. Physical and chemical parameters
The Organic plots tended to have a higher bulk density thanthe Conventional plots but only bulk density of Organic11 wassignificantly higher than that of Conventional plots (Table 2).The TOC content significantly increased from Conventional toOrganic17 (+32%). A marked rise was measured between Organic7and Organic11 (+15%). Concerning the total N content, 2 differentgroups were identified. Conventional and Organic7 had signifi-cantly lower N content than Organic11 and Organic17. A steepdecrease in available P content was measured between Conven-tional and Organic7 (−58%) but, thereafter, a continuous increaseof available P content was noticed between Organic7 to Organic11(+43%) and Organic11 to Organic17 (+65%). The available K con-tent significantly increased from Conventional to Organic17 (+81%).No significant difference was measured for available Cu contentbetween treatments but one should note that the highest valueswere measured in Organic plots. The highest values of effective CECwere measured for Organic7 and Organic11. In these treatments,effective CEC was significantly higher (+27%) in comparison withConventional and Organic17.
3.2. Biological parameters
Organic11 and Organic 17 had significantly higher soil MBthan Conventional and Organic7 (+34%) (Table 3). The lowesttotal nematode density was measured for Conventional plots.The total nematode density was significantly higher in Organic7(+45%) and in Organic17 (+79%) than in Conventional plots. Theplant-feeder density was significantly higher in Organic7 (+126%)and in Organic17 (+187%) than in Conventional plots. Plant-feeding nematodes were dominated by facultative plant-feederswith Tylenchidae family (data not shown). Among obligate plant-
Table 2Physical and chemical parameters: bulk density, total organic carbon (TOC), total nitrogen (N), available phosphorus (P), potassium (K) and copper (Cu) contents and effectivecation exchange capacity (CEC) in conventional farming (Conventional) and organic farming for 7 years (Organic7), 11 years (Organic11) and 17 years (Organic17).
Bulk density (g cm−3)* TOC (mg g−1)* N (mg g−1)* P (mg kg−1)* K (mg kg−1)¥ Cu (mg kg−1)ns CEC (cmol+ kg−1)*
Conventional 1.21 ± 0.03 b 10.2 ± 0.3 c 1.00 ± 0.02 b 1.06 ± 0.12 a 27 ± 3 c 0.22 ± 0.03 a 16.3 ± 0.5 bOrganic7 1.31 ± 0.01 ab 10.8 ± 0.4 bc 1.01 ± 0.03 b 0.45 ± 0.04 b 30 ± 3 bc 0.35 ± 0.07 a 19.9 ± 0.7 aOrganic11 1.41 ± 0.02 a 12.4 ± 0.4 ab 1.25 ± 0.05 a 0.64 ± 0.04 ab 45 ± 5 ab 0.34 ± 0.06 a 20.7 ± 0.8 aOrganic17 1.29 ± 0.01 ab 13.5 ± 0.5 a 1.36 ± 0.04 a 1.05 ± 0.06 a 49 ± 5 a 0.39 ± 0.07 a 15.7 ± 0.4 b
Means ± standards errors are presented. Means differing significantly are denoted with different lowercase letters; ns, not significant.* Threshold significant at 95%.¥ Threshold significant at 90%.

Author's personal copy
40 P. Coll et al. / Applied Soil Ecology 50 (2011) 37– 44
Table 3Soil microbial biomass (MB) and nematode trophic group density in conventional farming (Conventional) and organic farming for 7 years (Organic7), 11 years (Organic11)and 17 years (Organic17).
Microorganisms Nematofauna (ind. (100 g dry soil)−1)
MB (!g C g−1)¥ Plant-feeders* Bacterial-feedersns Fungal-feeders¥ Omnivores–predators¥ Total¥
Conventional 77 ± 7 b 210 ± 17 c 402 ± 29 a 212 ± 15 b 112 ± 12 b 936 ± 49 cOrganic7 73 ± 3 b 474 ± 62 ab 422 ± 36 a 303 ± 38 a 156 ± 20 a 1355 ± 115 abOrganic11 100 ± 5 a 403 ± 69 b 440 ± 55 a 303 ± 37 a 101 ± 17 b 1248 ± 137 bcOrganic17 101 ± 4 a 603 ± 62 a 541 ± 60 a 417 ± 51 a 113 ± 13 b 1672 ± 143 a
Means ± standards errors are presented. Means differing significantly are denoted with different lowercase letters; ns, not significant.* Threshold significant at 95%.¥ Threshold significant at 90%.
feeders, Paratylenchus sp. and Tylenchorynchus sp. dominated andalmost no Xiphinema sp. were found whatever the treatment,just 7.5 and 12.1 ind. (100 g dry soil)−1 for 2 samples (data notshown). No significant difference was measured for bacterial-feeder densities between treatments. However, the lowest densitywas observed for Conventional plots. The fungal-feeder densityincreased from Conventional to Organic17. It was significantlyhigher in Organic7 (+43%) and in Organic17 (+97%) than in Conven-tional plots. The combined density of omnivores and predators wassignificantly higher (+44%) in Organic7 than in other treatments.
There were many samples without earthworms in all the treat-ments, and especially in the Organic plots (Table 4). The totalearthworm density was significantly higher in Conventional thanin Organic plots (−44% between Conventional and Organic7 and−55% between Conventional and Organic17). Endogeics were themost represented (more than 85% of total density) compared tothe anecics in both Conventional and Organic plots. The anecicdensity was low whatever the treatment and not significantly dif-ferent between treatments. The highest biomass of earthwormswas observed in the Conventional plots. Contrary to the density,the biomass was mainly represented by the anecics.
3.3. Discriminant analysis
The discriminant analysis (Fig. 1 and Table 5) was significantat = 0.001 according to the Wilks test and each discriminantaxis explained a significant portion of the overall variance of thedatabase (p < 0.01). The first two discriminant functions explained93% of the dataset variability (Fig. 1A). The first axis explained 68%of the dataset variability and was mainly defined by total N and TOCcontents, plant-feeding nematode density, available K content andfungal-feeding nematode density. The axis 2 contributed 25% of thedataset variability and was correlated to effective CEC and avail-able P content. The distribution of observations along the 2 axesshowed a clear discrimination of the 4 treatments (Fig. 1B). The firstaxis clearly discriminated the 4 treatments and therefore, a gradi-ent starting from Conventional to Organic17 was found along thisaxis. On the other hand, the second axis was less discriminant as itonly discriminated Conventional and Organic17 from Organic7 andOrganic11. Some overlaps were observed between treatments and
were associated to the variability of observations in a given treat-ment. The confusion matrix (Table 5) compared the classification ofplots predicted by the model of discriminant analysis and the realclassification constituted from experimental plot design. The con-fusion matrix showed that the discriminant analysis successfullyclassified 79% of the 96 observations. The a posteriori classificationof Conventional and Organic17 plots were respectively correct ata rate of 88 and 90% whereas, Organic7 and Organic11 plots werecorrectly classified, respectively at a rate of 75% and 55%.
4. Discussion
4.1. Soil quality indicators to study the transition to organicfarming
This study was conducted on commercial vineyards. Fourteenplots which have been organically managed for 7, 11 and 17 yearswere compared to 10 conventionally managed plots. We anal-ysed the long-term effects of organic management on vineyard soilquality determined by physical, chemical and also biological indi-cators. Measurements on grape production were not included todefine soil quality because the diversity of plant material wouldnot have given reliable data to compare the different treatments.As reviewed by Bastida et al. (2008), the multiparametric indicesare a promising tool to objectively describe the changes of soilquality but the weighting of different functions is subjective anddoes not depend on statistical (objective) method. In this study,our statistical approach was different because we used a combina-tion of statistical tools that clearly distinguish the four treatmentswhich organized themselves along the first axis, defining a gradi-ent starting from Conventional to Organic17. Indeed, no significantdifference appeared before 11 years of organic farming for totalorganic carbon (TOC), total nitrogen (N) and available potassium(K) contents, soil microbial biomass (MB) and fungal-feeding nema-tode density (Fu). However, other soil indicators, such as availableP content rapidly decreased after conversion. Some authors, suchas Martin et al. (2007), explained such a trend as an exhaustionof available P pools built up from successive mineral P fertiliz-ers. Afterwards, we observed an increase of available P content asreported by Garcia-Ruiz et al. (2009) and Liu et al. (2007) on differ-
Table 4Proportion of samples without earthworm, density and biomass of endogeic and anecic earthworms in conventional farming (Conventional) and organic farming for 7 years(Organic7), 11 years (Organic11) and 17 years (Organic17).
Samples without earthworm (%) Density (ind m−2) Biomass (g m−2)
Endogeics¥ Anecicsns Total¥ Endogeicsns Anecicsns Totalns
Conventional 45 12.5 ± 2.6 a 1.1 ± 0.5 a 13.6 ± 2.6 a 4.5 ± 1.1 a 15.5 ± 8.9 a 19.9 ± 9.1 aOrganic7 75 6.9 ± 5.5 b 0.7 ± 0.7 a 7.6 ± 5.5 b 0.6 ± 0.6 a 1.1 ± 1.1 a 1.8 ± 1.3 aOrganic11 75 6.1 ± 4.0 b 0.6 ± 0.6 a 6.7 ± 4.0 b 1.0 ± 0.9 a 8.1 ± 8.1 a 9.0 ± 8.1 aOrganic17 60 4.4 ± 2.0 b 1.7 ± 0.9 a 6.1 ± 2.1 b 0.3 ± 0.1 a 11.3 ± 7.0 a 11.7 ± 7.0 a
Means ± standards errors are presented. Means differing significantly are denoted with different lowercase letters; ns, not significant.¥ Threshold significant at 90%.

Author's personal copy
P. Coll et al. / Applied Soil Ecology 50 (2011) 37– 44 41
Fig. 1. Discriminant analysis performed on physical, chemical and biological param-eters for conventional farming (Conventional) and organic farming for 7 years(Organic7), 11 years (Organic11) and 17 years (Organic17). (A) Correlations circleof variables: bulk density, total organic carbon (TOC), total nitrogen (N), availablephosphorus (P), potassium (K) and copper (Cu) contents, effective cation exchangecapacity (CEC), soil microbial biomass (MB), density of plant-feeding (PF), bacterial-feeding (Ba), fungal-feeding (Fu), omnivore and predator (Om + Pr) nematodes anddensity and biomass of endogeic earthworms. (B) Distribution of the 96 observationsand of the centroids (prominent symbols) of each treatment along the 2 discriminantaxes.
ent crops. Conversely, available K content increased progressivelyfrom Conventional to Organic17 whereas Gosling and Shepherd(2005) observed K was significantly higher in the conventionalfields than in the low fertility organic fields. One should notethat the quantity of compost applied was too low to explain theobserved trends for P and K (25 kg P ha−1 year−1 and no K, Table 1).Previous studies have shown that microorganisms release organicacids which can increase the availability of P (Arcand and Schneider,
2006) and K (Basak and Biswas, 2009). Phosphatases excreted bymicroorganisms, and more particularly fungi, have also the abil-ity to mineralize organic P (Rodriguez and Fraga, 1999). Thus, theincrease of microbial biomass after organic conversion and activ-ities of some microorganisms could explain why after 7 years oforganic farming, the available P and K contents increased. The totalnematode density, especially plant-feeders (PF) and total earth-worm density, especially endogeic density responded more sharplyand quickly to the organic conversion. Garcia-Ruiz et al. (2009)did the same observation for the plant-feeder density in one siteof olive groves after 7–8 years of organic practices. In our case,plant-feeders that increased in density were mainly the facultativeplant-feeders Tylenchidae and phytoparasitics, Tylenchorynchus sp.Xiphinema sp., grapevine fanleaf virus vector (GFLV) were almostabsent in each treatment. However, it is known that the highestdensity of Xiphinema sp. occurred at 40–110 cm depth and yet wesampled it in the 0–15 cm topsoil (Villate et al., 2008). For earth-worm density, Scullion et al. (2007) observed some positive effectsafter 10 years of organic farming on grass-arable rotations. Gradualchanges of soil properties in converting plots into organic farminghave been measured by several authors and discussed by Martiniet al. (2004). The other studied indicators did not present anychange and should be considered as not sensitive enough to mon-itor the conversion to organic viticulture in these pedo-climaticconditions. So, organic matter, available P and K, microbial biomass,nematodes and earthworms could be considered as a basis to aguideline to best transition strategies in vineyards.
4.2. Effects of organic farming on soil organisms
In organic farming, plant nutrition is based on the mineraliza-tion of organic matter by soil organisms. Several authors reportednegative effects of Cu on soil organisms (Wightwick et al., 2010).We observed, as Beni and Rossi (2009), trends of higher availableCu contents in Organic treatments than in Conventional ones. Asa matter of facts, Cu salts are the only efficient fungicides againstdowny mildew, allowed in organic farming. Furthermore, Brun et al.(2001) showed Cu accumulates in the upper layers of soils. Howeverin our study, we did not observe significant increase of availableCu after organic conversion. This might be related to the methodthat we used for measuring Cu availability. Michaud et al. (2007)have shown that in calcareous soils contaminated by Cu fungicides,water-extractable Cu varied little, compared to total soil Cu, orEDTA-extractable Cu.
Generally, grass cover and applications of organic matter havepositive effects on earthworms in vineyards (Peres et al., 1998;Paoletti, 1999; Eisenhauer et al., 2009). However, we measured thelowest density and biomass of earthworms in Organic plots. Thedensity of anecics was very low in all treatments but it was cer-tainly underestimated. Actually, the hand-sorting method withoutprior application of an expellant (such as mustard or formalde-hyde solution) did not allow to sample larger earthworms, suchas anecics, which can rapidly escape into deeper soil layers (Pelosiet al., 2009). However, the hand-sorting is appropriate for endogeicand their density strongly decreased between Conventional and
Table 5Confusion matrix comparing a priori (real) and a posteriori (calculated) classification of observations using the cross-validation technique.
A posteriori classification Correct classifications (%)
Conventional Organic7 Organic11 Organic17
A priori classificationConventional 35 3 2 0 88Organic7 3 12 1 0 75Organic11 0 3 11 6 55Organic17 1 0 1 18 90

Author's personal copy
42 P. Coll et al. / Applied Soil Ecology 50 (2011) 37– 44
Organic7. The tillage which was more frequent to control weedsunder organic management could also explain these observations.Several authors highlighted negative effects of tillage on earth-worm density and biomass (Emmerling, 2001; Paoletti, 1999 ondifferent crops). Furthermore, with the organic conversion, theshallow tillage was replaced by a deeper mouldboard ploughing.Short-term studies (3 and 6 years) of Metzke et al. (2007) and Peignéet al. (2009) on different tillage systems under organic annual cropfarming did not observe higher earthworm density or biomassunder shallow tillage in comparison with mouldboard ploughing.However, we could hypothesize that mouldboard ploughing haslong-term negative effect on earthworms. Villenave et al. (2009)demonstrated that tillage also tends to disturb omnivore andpredator nematodes. In the same way, we did not measure anymodification of the densities of these nematodes with organic farm-ing and their low densities in every plot indicated a simple andshort soil micro-food web in all these vineyards (Ferris et al., 2001).Soil compaction, as evaluated by the measure of bulk density, washigher in Organic plots. This was the consequence of the increaseof the traffic for tillage and phytosanitary treatments in organicmanagement. Bouwman and Arts (2000) observed a decrease offree-living nematode density in a heavily compacted soil comparedwith a slightly compacted soil. They explained that nematodesreacted negatively to the decreased pore space habitats due to soilcompaction. In our case, bacterial and fungal-feeding nematodedensity was globally higher in Organic plots despite an increasedbulk density. Hansen (1996) and Hansen and Engelstad (1999)showed that soil compaction had negative effects on earthworms.So, soil compaction could explain, with ploughing, the decrease ofearthworm density that we observed in organic viticulture. Moreglobally, agricultural practices in organic conversion cause somedamage on soil organisms.
4.3. Organic matter, microbial biomass and nematodes
The soil organic matter plays essential roles in soil function-ing and it can be considered as the keystone of soil managementunder organic farming. Under Organic plots, we measured higherTOC contents. Many authors observed the same positive effect oforganic farming as Briar et al. (2007) on different annual crops andVestberg et al. (2009) on strawberry crops. The sole applicationof compost (261 kg of organic carbon ha−1 year−1) would lead toa content of 11.2 mg of TOC g−1 of soil after 17 years of organicfarming whereas we measured it at 13.5 mg g−1. Thus, the moreabundant grass cover in Organic treatments contributed certainlyin the increase of TOC contents and microbial biomass as observedby Potthoff et al. (2006). Organic matter constitutes a source ofnutrients for microorganisms (Calbrix et al., 2007) which increasedafter the conversion into organic farming and root-exudates areknown too to stimulate microbial growth (Bouwman and Arts,2000; Whitelaw-Weckert et al., 2007). In the same way, Rahmanet al. (2009) showed positive effects of grass cover on the den-sity of plant-feeding and microbivorous nematodes which agreedwith our results. An increase of plant-feeding nematodes intensi-fies root C fluxes activating microbial biomass from the rhizosphereand microbivorous nematodes stimulate microorganisms (Dentonet al., 1999). Conversely, as there were more microorganisms inOrganic plots, we consistently found more fungal-feeding nema-tode density in organic plots, which is in line with Ferris et al.(1996), Villenave et al. (2004) and Villenave et al. (2010). However,only an increasing trend was observed for bacterial-feeding nema-tode density in Organic plots. The nematodes are good indicatorsof soil decomposition pathway (Ferris et al., 2004). The bacterial-feeders/fungal-feeders ratio decreased with organic farming, asobserved by Mc Sorley and Frederick (1999). So, the decompositionpathway becomes dominated by fungi under Organic plots in com-
parison with Conventional plots. The increase of fungi after organicconversion was also observed by different authors as Gryndler etal. (2006) for arbuscular mycorrhizal fungi. Thus, the applicationof compost and the presence of a grass cover on Organic plots ledto increase soil organic matter, microbial biomass and nematodedensity, especially plant-feeders and fungal-feeders whereas ratiobacteria/fungi decreased.
5. Conclusion
Through our experimental design, we studied long-term effectsof different changes of agricultural practices inherent to organicviticulture on soil quality. In this study, we have demonstratedthat a transition period of 7–11 years, depending on the consideredindicator, was needed to clearly separate Conventional and Organicfarming practices in Southern French vineyards. Apart from classi-cal sensitive indicators used to study organic transition like organicmatter content, soil microbial biomass, or bulk density, the easy-to-use chemical available P and K contents should also be consideredas sensitive indicators. Moreover, our results address the importantquestion of P and K mining with organic practices during transitionperiod. However afterwards, the increase of soil organic matter andrelated biological activities could partly counteract the observeddecrease during the transition period. According to our results, theutilization of soil nematodes as bioindicators of soil quality shall bepromoted. Indeed, the study of microbivorous provided some infor-mation about microbial biomass and bacteria/fungi ratio. As foromnivore and predator nematodes, they were reliable indicatorsof environmental perturbations. Despite the diversity of indicators,we have highlighted the difficulty to show the benefits of organicfarming on global soil quality in this particular pedoclimatic area,and for the set of farming practices that were investigated.
Acknowledgements
We thank Louis Fabre, Xavier Sabouraud, Regis Loevenbruck,Jean-Jacques Loze and Gérard Pélissa for allowing us to analyse theirvineyards. We also thank Hervé Aholoukpé, Hubert Alcin, DidierArnal, Didier Blavet, Georg Carlsson, Benoît Cloutier-Hurteau, CathyColl, Gabrielle Daudin, Fan Deng, Marney Isaac, Sylvia Julien, SihamKhoulassa, Ernest Kouakoua, Rym Maougal, Aurélie Metay and Emi-lie Russello for their help in earthworm sampling. Special thanks goto Jean-Pierre Barthès for his expert advice on soils, Inès Sneessensand Malalatiana Razafindrakoto for her help in the laboratoryanalyses, and Julien Papaïx, Philippe Deleporte and Benoît Cloutier-Hurteau for assistance with statistics. We gratefully acknowledgeTerri Andon for carefully reading the manuscript and English revi-sion.
Patrice Coll’s PhD grant was provided by the Agence del’Environnement et de la Maîtrise de l’Energie (ADEME, France) andby Montpellier SupAgro (France). This work was financially sup-ported by the INRA AIDY project (Analyse Intégrée de la DYnamiquedes systèmes biophysiques, techniques et de décision lors de laconversion à la viticulture biologique).
References
AgenceBIO, 2002. L’agriculture biologique – Chiffres clés, Broché, Paris.AgenceBIO, 2009. L’agriculture biologique – Chiffres clés, La documentation
Franc aise, Paris.Arcand, M.M., Schneider, K.D., 2006. Plant- and microbial-based mechanisms to
improve the agronomic effectiveness of phosphate rock: a review. An. Acad.Bras. Cienc. 78, 791–807.
Basak, B.B., Biswas, D.R., 2009. Influence of potassium solubilizing microorganism(Bacillus mucilaginosus) and waste mica on potassium uptake dynamics by sudangrass (Sorghum vulgare Pers.) grown under two Alfisols. Plant Soil 317, 235–255.
Bastida, F., Zsolnay, A., Hernández, T., García, C., 2008. Past, present and future ofsoil quality indices: a biological perspective. Geoderma 147, 159–171.

Author's personal copy
P. Coll et al. / Applied Soil Ecology 50 (2011) 37– 44 43
Beni, C., Rossi, G., 2009. Conventional and organic farming: estimation of someeffects on soil, copper accumulation and wine in a Central Italy vineyard.Agrochimica 53, 145–159.
Bispo, A., Blanchart, E., Delmas, A.B., Laval, K., 2011. Icateurs de la qual-ité des sols. In: Girard, M.C., Walter, C., Rémy, J.C., Berthelin, J., Morel,J.L. (Eds.), Sols et Environnement. , 2e édition. Dunod éditions, Paris,pp. 509–527.
Bolker, B.M., Brooks, M.E., Clark, C.J., Geange, S.W., Poulsen, J.R., Stevens, M.H.H.,White, J.S.S., 2009. Generalized linear mixed models: a practical guide for ecol-ogy and evolution. Trends Ecol. Evol. 24, 127–135.
Bongers, T., Ferris, H., 1999. Nematode community structure as a bioindicator inenvironmental monitoring. Trends Ecol. Evol. 14, 224–228.
Bouwman, L.A., Arts, W.B.M., 2000. Effects of soil compaction on the relationshipsbetween nematodes, grass production and soil physical properties. Appl. SoilEcol. 14, 213–222.
Briar, S.S., Grewal, P.S., Somasekhar, N., Stinner, D., Miller, S.A., 2007. Soil nematodecommunity, organic matter, microbial biomass and nitrogen dynamics in fieldplots transitioning from conventional to organic management. Appl. Soil Ecol.37, 256–266.
Brun, L.A., Maillet, J., Hinsinger, P., Pepin, M., 2001. Evaluation of copper avail-ability to plants in copper-contaminated vineyard soils. Environ. Pollut. 111,293–302.
Bustamante, M.A., Said-Pullicino, D., Agullo, E., Andreu, J., Paredes, C., Moral, R.,2011. Application of winery and distillery waste composts to a Jumilla (SE Spain)vineyard: effects on the characteristics of a calcareous sandy-loam soil. Agric.Ecosyst. Environ. 140, 80–87.
Calbrix, R.L., Barray, S., Chabrerie, O., Fourrie, L., Laval, K., 2007. Impact of organicamendments on the dynamics of soil microbial biomass and bacterial commu-nities in cultivated land. Appl. Soil Ecol. 35, 511–522.
Chaignon, V., Sanchez-Neira, I., Herrmann, P., Jaillard, B., Hinsinger, P., 2003.Copper bioavailability and extractability as related to chemical proper-ties of contaminated soils from a vine-growing area. Environ. Pollut. 123,229–238.
Coulouma, G., Boizard, H., Trotoux, G., Lagacherie, P., Richard, G., 2006. Effect of deeptillage for vineyard establishment on soil structure: a case study in SouthernFrance. Soil Tillage Res. 88, 132–143.
Denton, C.S., Bardgett, R.D., Cook, R., Hobbs, P.J., 1999. Low amounts of root her-bivory positively influence the rhizosphere microbial community in a temperategrassland soil. Soil Biol. Biochem. 31, 155–165.
Doran, J.W., Parkin, T.B., 1994. Defining and Assessing Soil Quality, SSSA Spec. Publ.No. 35. Soil Sci. Soc. Am., Inc. and Am. Soc. Agron., Inc., Madison, WI.
Eijsackers, H., Beneke, P., Maboeta, M., Louw, J.P.E., Reinecke, A.J., 2005. The implica-tions of copper fungicide usage in vineyards for earthworm activity and resultingsustainable soil quality. Ecotoxicol. Environ. Saf. 62, 99–111.
Eisenhauer, N., Milcu, A., Sabais, A.C.W., Bessler, H., Weigelt, A., Engels, C., Scheu,S., 2009. Plant community impacts on the structure of earthworm com-munities depend on season and change with time. Soil Biol. Biochem. 41,2430–2443.
Emmerling, C., 2001. Response of earthworm communities to different types of soiltillage. Appl. Soil Ecol. 17, 91–96.
Ferris, H., Venette, R.C., Lau, S.S., 1996. Dynamics of nematode communities in toma-toes grown in conventional and organic farming systems, and their impact onsoil fertility. Appl. Soil Ecol. 3, 161–175.
Ferris, H., Bongers, T., de Goede, R.G.M., 2001. A framework for soil food web diag-nostics: extension of the nematode faunal analysis concept. Appl. Soil Ecol. 18,13–29.
Ferris, H., Venette, R.C., Scow, K.M., 2004. Soil management to enhance bacterivoreand fungivore nematode populations and their nitrogen mineralisation function.Appl. Soil Ecol. 25, 19–35.
Franzle, O., 2006. Complex bioindication and environmental stress assessment. Ecol.Indic. 6, 114–136.
Garcia-Ruiz, R., Ochoa, V., Vinegla, B., Hinojosa, M.B., Pena-Santiago, R., Liebanas,G., Linares, J.C., Carreira, J.A., 2009. Soil enzymes, nematode community andselected physico-chemical properties as soil quality indicators in organic andconventional olive oil farming: Influence of seasonality and site features. Appl.Soil Ecol. 41, 305–314.
Gosling, P., Shepherd, M., 2005. Long-term changes in soil fertility in organic arablefarming systems in England, with particular reference to phosphorus and potas-sium. Agric. Ecosyst. Environ. 105, 425–432.
Gryndler, M., Larsen, J., Hrselova, H., Rezacova, V., Gryndlerova, H., Kubat, J., 2006.Organic and mineral fertilization, respectively, increase and decrease the devel-opment of external mycelium of arbuscular mycorrhizal fungi in a long-termfield experiment. Mycorrhiza 16, 159–166.
Hansen, S., 1996. Effects of manure treatment and soil compaction on plant pro-duction of a dairy farm system converting to organic farming practice. Agric.Ecosyst. Environ. 56, 173–186.
Hansen, S., Engelstad, F., 1999. Earthworm populations in a cool and wet district asaffected by tractor traffic and fertilisation. Appl. Soil Ecol. 13, 237–250.
Haynes, R.J., 1999. Labile organic matter fractions and aggregate stability undershort-term, grass-based leys. Soil Biol. Biochem. 31, 1821–1830.
Huber, S., Prokop, G., Arrouays, D., Banko, G., Bispo, A., Jones, R.J.A., Kibblewhite,M.G., Lexer, W., Möller, A., Rickson, R.J., Shishkov, T., Stephens, M., Toth, G.,van den Akker, J.J.H., Varallyay, G., Verheijen, F.G.A., Jones, A.R., 2008. Environ-mental Assessment of Soil for Monitoring: Volume I Indicators & Criteria, EUR23490 EN/1. Office for the Official Publications of the European Communities,Luxembourg.
Ingels, C.A., Scow, K.M., Whisson, D.A., Drenovsky, R.E., 2005. Effects of cover crops ongrapevines, yield, juice composition, soil microbial ecology, and gopher activity.Am. J. Enol. Vitic. 56, 19–29.
ISO 10694, 1995. Soil quality—determination of organic and total carbon after drycombustion (elementary analysis).
ISO 11272, 1998. Soil quality—determination of dry bulk density.ISO 13878, 1998. Soil quality—determination of total nitrogen content by dry com-
bustion (elementary analysis).ISO 23470, 2007. Soil quality—determination of effective cation exchange capacity
(CEC) and exchangeable cations using a hexamminecobalt trichloride solution.ISO 23611-4, 2007. Soil quality—sampling of soil invertebrates—part 4: sampling,
extraction and identification of soil-inhabiting nematodes.Komarek, M., Cadkova, E., Chrastny, V., Bordas, F., Bollinger, J.C., 2010. Contamination
of vineyard soils with fungicides: a review of environmental and toxicologicalaspects. Environment International 36, 138–151.
Le Bissonnais, Y., Blavet, D., De Noni, G., Laurent, J.Y., Asseline, J., Chenu, C., 2007.Erodibility of Mediterranean vineyard soils: relevant aggregate stability meth-ods and significant soil variables. Eur. J. Soil Sci. 58, 188–195.
Legendre, P., Legendre, L., 1998. Numerical ecology, 3rd English edition. Elsevier,Amsterdam.
Liu, B., Tu, C., Hu, S.J., Gumpertz, M., Ristaino, J.B., 2007. Effect of organic, sustain-able, and conventional management strategies in grower fields on soil physical,chemical, and biological factors and the incidence of Southern blight. Appl. SoilEcol. 37, 202–214.
Martin, R.C., Lynch, D.H., Frick, B., van Straaten, P., 2007. Phosphorus status on Cana-dian organic farms. J. Sci. Food Agric. 87, 2737–2740.
Martinez-Casasnovas, J.A., Ramos, M.C., 2009. Soil alteration due to erosion, plough-ing and levelling of vineyards in north east Spain. Soil Use Manage. 25, 183–192.
Martini, E.A., Buyer, J.S., Bryant, D.C., Hartz, T.K., Denison, R.F., 2004. Yield increasesduring the organic transition: improving soil quality or increasing experience?Field Crop Res. 86, 255–266.
Mc Sorley, R., Frederick, J.J., 1999. Nematode population fluctuations during decom-position of specific organic amendments. J. Nematol. 31, 37–44.
Metzke, M., Potthoff, M., Quintern, M., Hess, J., Joergensen, R.G., 2007. Effect ofreduced tillage systems on earthworm communities in a 6-year organic rotation.Eur. J. Soil Biol. 43, S209–S215.
Michaud, A.M., Bravin, M.N., Galleguillos, M., Hinsinger, P., 2007. Copper uptakeand phytotoxicity as assessed in situ for durum wheat (Triticum turgidumdurum L.) cultivated in Cu-contaminated, former vineyard soils. Plant Soil 298,99–111.
Monteiro, A., Lopes, C.M., 2007. Influence of cover crop on water use and per-formance of vineyard in Mediterranean Portugal. Agric. Ecosyst. Environ. 121,336–342.
Morlat, R., Chaussod, R., 2008. Long-term additions of organic amendments in a Loirevalley vineyard. I. Effects on properties of a calcareous sandy soil. Am. J. Enol.Vitic. 59, 353–363.
Neher, D.A., 2001. Role of nematodes in soil health and their use as indicators. J.Nematol. 33, 161–168.
Ohno, T., Zibilske, L.M., 1991. Determination of low concentrations of phosphorusin soil extracts using malachite green. Soil Sci. Soc. Am. J. 55, 892–895.
Paoletti, M.G., 1999. The role of earthworms for assessment of sustainability and asbioindicators. Agric. Ecosyst. Environ. 74, 137–155.
Paul, E.A., Clark, M.F., 1996. Soil Microbiology and Biochemistry. Academic Press,San Diego.
Peigné, J., Cannavaciuolo, M., Gautronneau, Y., Aveline, A., Giteau, J.L., Cluzeau, D.,2009. Earthworm populations under different tillage systems in organic farming.Soil Tillage Res. 104, 207–214.
Pelosi, C., Bertrand, M., Capowiez, Y., Boizard, H., Roger-Estrade, J., 2009. Earth-worm collection from agricultural fields: comparisons of selected expellantsin presence/absence of hand-sorting. Eur. J. Soil Biol. 45, 176–183.
Peres, G., Cluzeau, D., Curmi, P., Hallaire, V., 1998. Earthworm activity and soil struc-ture changes due to organic enrichments in vineyard systems. Biol. Fertil. Soils27, 417–424.
Pinheiro, J.C., Bates, D.M., 2000. Mixed-Effects Models in S and S-plus. Springer, NewYork.
Potthoff, M., Steenwerth, K.L., Jackson, L.E., Drenovsky, R.E., Scow, K.M., Joergensen,R.G., 2006. Soil microbial community composition as affected by restorationpractices in California grassland. Soil Biol. Biochem. 38, 1851–1860.
Probst, B., Schuler, C., Joergensen, R.G., 2008. Vineyard soils under organic andconventional management—microbial biomass and activity indices and theirrelation to soil chemical properties. Biol. Fertil. Soils 44, 443–450.
Rahman, L., Whitelaw-Weckert, M.A., Hutton, R.J., Orchard, B., 2009. Impact of floorvegetation on the abundance of nematode trophic groups in vineyards. Appl.Soil Ecol. 42, 96–106.
Reeve, J.R., Carpenter-Boggs, L., Reganold, J.P., York, A.L., McGourty, G., McCloskey,L.P., 2005. Soil and winegrape quality in biodynamically and organically man-aged vineyards. Am. J. Enol. Vitic. 56, 367–376.
Reganold, J.P., Elliott, L.F., Unger, Y.L., 1987. Long-term effects of organic and con-ventional farming on soil-erosion. Nature 330, 370–372.
Reinecke, A.J., Albertus, R.M.C., Reinecke, S.A., Larink, O., 2008. The effects of organicand conventional management practices on feeding activity of soil organisms invineyards. Afr. Zool. 43, 66–74.
Reuter, S., Kubiak, R., 2003. Soil Management Systems to Support Soil MicrobialBiomass in Vineyards. Springer, Dordrecht.
Rodriguez, H., Fraga, R., 1999. Phosphate solubilizing bacteria and their role in plantgrowth promotion. Biotechnol. Adv. 17, 319–339.

Author's personal copy
44 P. Coll et al. / Applied Soil Ecology 50 (2011) 37– 44
Sanchez-Moreno, S., Ferris, H., 2007. Suppressive service of the soil food web: effectsof environmental management. Agric. Ecosyst. Environ. 119, 75–87.
Scullion, J., Neale, S., Philips, L., 2007. Earthworm casting and burrowing activ-ity in conventional and organic grassarable rotations. Eur. J. Soil Biol. 43,S216–S221.
Smith, R., Bettiga, L., Cahn, M., Baumgartner, K., Jackson, L.E., Bensen, T., 2008. Vine-yard floor management affects soil, plant nutrition, and grape yield and quality.Calif. Agric. 62, 184–190.
Steenwerth, K., Belina, K.M., 2008. Cover crops enhance soil organic matter, carbondynamics and microbiological function in a vineyard agroecosystem. Appl. SoilEcol. 40, 359–369.
Teixeira, R.F.M., Domingos, T., Costa, A., Oliveira, R., Farropas, L., Calouro, F., Barradas,A.M., Carneiro, J., 2011. Soil organic matter dynamics in Portuguese natural andsown rainfed grasslands. Ecol. Model. 222, 993–1001.
Van Bruggen, A.H.C., Semenov, A.M., 2000. In search of biological indicators for soilhealth and disease suppression. Appl. Soil Ecol. 15, 13–24.
Van Leeuwen, C., Friant, P., Chone, X., Tregoat, O., Koundouras, S., Dubourdieu, D.,2004. Influence of climate, soil, and cultivar on terroir. Am. J. Enol. Vitic. 55,207–217.
Van Leeuwen, C., Seguin, G., 2006. The concept of terroir in viticulture. J. Wine Res.17, 1–10.
Vestberg, M., Kukkonen, S., Saari, K., Tuovinen, T., Palojarvi, A., Pitkanen, T., Hurme,T., Vepsalainen, M., Niemi, M., 2009. Effects of cropping history and peat amend-ments on the quality of a silt soil cropped with strawberries. Appl. Soil Ecol. 42,37–47.
Villate, L., Fievet, V., Hanse, B., Delemarre, F., Plantard, O., Esmenjaud, D., van Helden,M., 2008. Spatial distribution of the dagger nematode Xiphinema index andits associated Grapevine fanleaf virus in French vineyard. Phytopathology 98,942–948.
Villenave, C., Ekschmitt, K., Nazaret, S., Bongers, T., 2004. Interactions betweennematodes and microbial communities in a tropical soil following manipulationof the soil food web. Soil Biol. Biochem. 36, 2033–2043.
Villenave, C., Ba, A.O., Rabary, B., 2009. Diagnostic du fonctionnement biologique dusol par l’analyse de la nématofaune: semis direct versus labour sur les hautesterres près d’Antsirabé (Madagascar). E.G.S. vol. 16, pp. 369–378.
Villenave, C., Saj, S., Pablo, A.L., Sall, S., Djigal, D., Chotte, J.L., Bonzi, M., 2010. Influ-ence of long-term organic and mineral fertilization on soil nematofauna whengrowing Sorghum bicolor in Burkina Faso. Biol. Fertil. Soils 46, 659–670.
Whitelaw-Weckert, M.A., Rahman, L., Hutton, R.J., Coombes, N., 2007. Permanentswards increase soil microbial counts in two Australian vineyards. Appl. SoilEcol. 36, 224–232.
Wightwick, A.M., Salzman, S.A., Reichman, S.M., Allinson, G., Menzies, N.W., 2010.Inter-regional variability in environmental availability of fungicide derived cop-per in vineyard soils: an Australian case study. J. Agric. Food Chem. 58, 449–457.
Wu, J., Joergensen, R.G., Pommerening, B., Chaussod, R., Brookes, P.C., 1990. Mea-surement of soil microbial biomass C by fumigation extraction—an automatedprocedure. Soil Biol. Biochem. 22, 1167–1169.
Yeates, G.W., Bongers, T., Degoede, R.G.M., Freckman, D.W., Georgieva, S.S., 1993.Feeding-habits in soil nematode families and genera—an outline for soil ecolo-gists. J. Nematol. 25, 315–331.

Publication N°4

Soil pH controls the environmental availability of phosphorus:Experimental and mechanistic modelling approaches
Nicolas Devau a, Edith Le Cadre b, Philippe Hinsinger a, Benoît Jaillard a, Frédéric Gérard a,*
a INRA, UMR 1222 Eco&Sols – Ecologie Fonctionnelle et Biogéochimie des Sols (INRA-IRD-SupAgro), Place Viala, F-34060 Montpellier, Franceb Supagro, UMR 1222 Eco&Sols – Ecologie Fonctionnelle et Biogéochimie des Sols (INRA-IRD-SupAgro), Place Viala, F-34060 Montpellier, France
a r t i c l e i n f o
Article history:Received 19 February 2009Accepted 10 September 2009Available online 17 September 2009
Editorial handling by R. Fuge
a b s t r a c t
Inorganic P is the least mobile major nutrient in most soils and is frequently the prime limiting factor forplant growth in terrestrial ecosystems. In this study, the extraction of soil inorganic P with CaCl2 (P–CaCl2) and geochemical modelling were combined in order to unravel the processes controlling the envi-ronmentally available P (EAP) of a soil over a range of pH values (pH ! 4–10). Mechanistic descriptions ofthe adsorption of cations and anions by the soil constituents were used (1-pK Triple Plane, ion-exchangeand NICA-Donnan models). These models are implemented into the geochemical code Visual MINTEQ. Anadditive approach was used for their application to the surface horizon of a Cambisol. The geochemicalcode accurately reproduced the concentration of extracted P at the different soil pH values (R2 = 0.9,RMSE = 0.03 mg kg"1). Model parameters were either directly found in the literature or estimated by fit-ting published experimental results in single mineral systems. The strong agreement between measure-ments and modelling results demonstrated that adsorption processes exerted a major control on the EAPof the soil over a large range of pH values. An influence of the precipitation of P-containing mineral is dis-counted based on thermodynamic calculations. Modelling results indicated that the variations in P–CaCl2
with soil pH were controlled by the deprotonation/protonation of the surface hydroxyl groups, the dis-tribution of P surface complexes, and the adsorption of Ca and Cl from the electrolyte background.Iron-oxides and gibbsite were found to be the major P-adsorbing soil constituents at acidic and alkalinepHs, whereas P was mainly adsorbed by clay minerals at intermediate pH values. This study demon-strates the efficacy of geochemical modelling to understand soil processes, and the applicability of mech-anistic adsorption models to a ‘real’ soil, with its mineralogical complexity and the additionalcontribution of soil organic matter.
! 2009 Elsevier Ltd. All rights reserved.
1. Introduction
Inorganic P is the least mobile major nutrient in most soils andis often the prime limiting factor for plant growth in terrestrial eco-systems (e.g. Hinsinger, 2001; Raghothama and Karthikeyan, 2005)as well as for biota in aquatic ecosystems (e.g. Smith et al., 1999).Furthermore, the concentration of P that is potentially available forplants, hereafter referred to as environmentally available P (EAP),is seldom correlated with the total concentration of P in a soil orsediment. This difference reveals that the EAP is the result of com-plex interactions between physical, chemical and biological pro-cesses (Murrmann and Peech, 1969; Sharpley and Tunney, 2000;Hinsinger, 2001; Lanno et al., 2004; Linge and Oldham, 2004;Marschner et al., 2005). Moreover, these processes are also influ-enced by soil solution variables such as ionic strength, concentra-tions of anions or cations, pH, etc. Change in soil conditions isparticularly large and rapid in the bio-influenced zone near the
root, the rhizosphere, where the conditions, e.g. pH, can be quitedifferent from those of the bulk environment, thus resulting in al-tered environmental availability (Harmsen et al., 2005). Whenapplying this concept to P in soil–plant systems, the rhizospherecan indeed show large pH changes relative to the bulk soil, witha potentially large impact on the EAP (Gahoonia et al., 1992; Ber-trand et al., 1999; Hinsinger et al., 2003). However, it is particularlydifficult to predict to what extent and even in what direction (de-crease or increase) the EAP would change in response to a variationof soil pH (Hinsinger, 2001). Hinsinger et al. (2009) considered theeffects of pH variations on the EAP as the major limitation ofmost advanced plant nutrition models at predicting the uptake ofP by plants when the EAP is low (e.g. the model of Mollier et al.,2008).
In practice, the EAP is expressed as the concentration of inor-ganic P that is chemically extracted from a soil sample with a givenextracting agent (e.g. Anshumali and Ramanathan, 2007). In Eur-ope, up to 17 extraction methods have been used to assess theEAP, which suggests that none is satisfactory (Harmsen et al.,2005). The extraction of P from a soil sample by CaCl2 was first
0883-2927/$ - see front matter ! 2009 Elsevier Ltd. All rights reserved.doi:10.1016/j.apgeochem.2009.09.020
* Corresponding author. Tel.: +33 (0)4 99 61 30 24; fax: +33 (0)4 99 61 30 88.E-mail address: [email protected] (F. Gérard).
Applied Geochemistry 24 (2009) 2163–2174
Contents lists available at ScienceDirect
Applied Geochemistry
journal homepage: www.elsevier .com/ locate/apgeochem

proposed by Houba et al. (1990). Since then, this method has beenincreasingly used for environmental applications (McDowell andCondron, 2000; McDowell and Sharpley, 2001; Maguire and Sims,2002; McDowell et al., 2003; Harmsen et al., 2005; Rhoton andBighman, 2005; Hartz and Johnstone, 2006). The concentration ofP extracted by CaCl2 (hereafter referred to as P–CaCl2) is widelyused as a risk assessment indicator of P-losses from soils (McDo-well and Sharpley, 2001). In addition, the positive correlation be-tween P–CaCl2 and the concentration of P extracted with thewidely used Olsen method (common soil testing procedure in agri-cultural soils) further validates its potential use as an indicator ofthe EAP for assessing P available to plants (Ehlert et al., 2003).The extraction of P by CaCl2 has thus provided satisfactory resultsin many environmental applications. Nevertheless, the hierarchy ofthe processes and mechanisms controlling the EAP concentrationsin different soils still remain largely unknown (Hesketh and Broo-kes, 2000; Neyroud and Lischer, 2003). As suggested by Van Erp(2002), the mechanisms responsible for concentration variationsof ions extracted by CaCl2 can be better understood with numericalmodels, and especially by using mechanistic approaches.
Several geochemical models based on a mechanistic descriptionof adsorption processes have been developed over the last decade(e.g. Kinniburgh et al., 1999; Hiemstra and Van Riemsdijk, 1998).These tools have notably been used to simulate the influence ofpH, cations and anions on the concentrations of P adsorbed at equi-librium onto various solid phases (e.g. Frau et al., 2008). However,these studies concerned simple systems, made of a single mineralor a mixture of two minerals. To the best of the authors’ knowl-edge, only one previous study has been devoted to P adsorptionin complex systems such as soils (Gustafsson, 2001). This may bedue to the lack of equilibrium constants relevant to the range ofminerals and adsorbed cations and anions that can affect P adsorp-tion in soils.
The main objective of this study was to investigate the rele-vance of mechanistic adsorption models for simulating the EAPin a soil. For this purpose, generic model parameters were retrievedfrom the literature. Geochemical modelling was also used in an at-tempt to unravel the geochemical processes that control the EAP ina soil, as appreciated through P–CaCl2. Measurements and model-ling were both performed at various soil pH values, in order to cov-er a range of environmental conditions and thereby to betterchallenge the modelling approach of the EAP.
2. Material and methods
2.1. Soil properties and experimental data
A topsoil (0–20 cm depth) sampled at Cazevieille (Hérault,France) (43!460N, 3!470E) was studied. The site corresponds toxerotypic shrubland developed in a humid Mediterranean climate.The soil is classified as a Chromic Cambisol (FAO-UNESCO, 1989),with a silty clay texture.
The soil sample was air dried and sieved to 2 mm prior to chem-ical analysis. Measured chemical properties of the soil are providedin Table 1. The total concentration of P in the soil material, whichincludes occluded P, mineral P, adsorbed P etc., was estimated bydigestion with H2SO4 and HClO4 at a volume:volume ratio of20:1 (e.g. Li et al., 2008). The total adsorbed P concentration wasestimated by an ammonium oxalate extraction (Guo and Yost,1999). The cation exchange capacity (CEC) and the concentrationsof the cations adsorbed by the soil material were determined byextraction with cobalthexamine chloride (Lofts et al., 2001).
The mineralogy of the soil was determined using XRD analysisand standard chemical extractions. A Rigaku diffractometerequipped with a Co X-ray source and a CGR monochromator was
used. In addition to the primary minerals (quartz and K-feldspar),XRD analysis showed the presence of illite, kaolinite and Fe-oxides.The occurrence of Al-oxides was derived from chemical extrac-tions. To assess the amounts of kaolinite and illite in the soil mate-rial, the total concentrations of Si, Al, Fe and K measured in theclay-size fraction were assigned to the chemical composition ofkaolinite and illite, according to the following formulas: [Si4O10][Al4(OH)8] and ½ðSi6:7Al1:3ÞO20$½ðAl1:95Fe3þ
1:95ÞðFe2þ0:05Mg0:05ÞðOHÞ4$K1:3;
respectively (Fanning et al., 1989). Calculation showed that theclay concentration represented 70% of the clay-size fraction. With-in this proportion, it was further calculated that the respectiveabundance of illite and kaolinite was fairly close to each other,i.e. 54% and 46%, respectively. To estimate the concentrations ofAl- and Fe-oxides, extractions by ammonium oxalate and citrate–dithionite–bicarbonate (CDB) were used (Mehra and Jackson,1960; de Endredy, 1963). The concentration of Fe extracted byammonium oxalate was assumed to be ferrihydrite, which is apoorly-crystalline form of Fe-oxide (e.g. Gustafsson, 2001). Theamount of crystalline Fe-oxides was estimated by subtracting theconcentration obtained by ammonium oxalate from that obtainedby CDB extraction. It was assumed that the crystalline Fe-oxide de-tected in this soil was goethite (Mehra and Jackson, 1960; Carreiraand Lajtha, 1997). Regarding Al-oxides, their concentrations weredetermined from the amount of Al extracted by CBD extraction(Gustafsson, 2001). In this study, Al-oxides were assumed to begibbsite. Not surprisingly for a chromic Cambisol, the ratio be-tween Si and Al concentrations extracted by ammonium oxalateindicated the absence of allophane and imogolite type material(e.g. Gérard et al., 2002, 2003). The concentration of Al extractedby CuCl2 (Juo and Kamprath, 1979) showed little organically-bound Al, which is quite consistent with the neutral pH of the soil.
Air-dried and sieved (2 mm) soil subsamples were acidified oralkalinised by adding 5–200 mmol of either H2SO4 or KOH per kgof air-dry soil. After this, the water content of each sample was ad-justed to 0.58 g g&1 of soil (W/R = 0.58) and samples were incu-bated at 25 !C over 84 h. Extractions of inorganic P with CaCl2
(0.01 M) at a ratio of 1:5 were performed according to the proce-dure proposed by Houba et al. (1990). Each sample was shakenfor 30 min and left 15 min to settle down. Supernatants were fil-tered through 0.2 lm cellulose acetate membrane filter (VWRInternational). The concentration of P in the extracts was measured
Table 1Chemical properties of the studied soil (0–20 cm depth), a Chromic Cambisol sampledat Cazevieille, France. The names of the extractant are indicated in brackets.
pH (CaCl2) 7.2Organic C 31 g kg&1
Total Inorganic C 1.48 g kg&1
Total P 950 mg kg&1
CEC (cobalthexamine) 25 cmol(+) kg&1
Ca (cobalthexamine) 22.3 cmol(+) kg&1
Mg (cobalthexamine) 0.977 cmol(+) kg&1
Na (cobalthexamine) 0.121 cmol(+) kg&1
K (cobalthexamine) 0.213 cmol(+) kg&1
Fe (cobalthexamine) 0.0328 cmol(+) kg&1
Al (cobalthexamine) 0.0416 cmol(+) kg&1
Fe (ammonium oxalate) 1.63 g kg&1
Al (ammonium oxalate) 4.58 g kg&1
Si (ammonium oxalate) 1.34 g kg&1
P (ammonium oxalate) 125 mg kg&1
Fe (EDTA) 9.25 mg kg&1
Al (CuCl2) 3.4 mg kg&1
Fe (CDB) 32.5 g kg&1
Al (CDB) 5 g kg&1
Si (CDB) 2.2 g kg&1
Total Fe (in <2 lm fraction) 62 g kg&1
Total Al (in <2 lm fraction) 115 g kg&1
Total Si (in <2 lm fraction) 176 g kg&1
2164 N. Devau et al. / Applied Geochemistry 24 (2009) 2163–2174

with the malachite green method (Ohno and Zibilske, 1991; Huangand Zhang, 2006). The soil pH was measured in CaCl2 supernatantsusing a Metrohm-744 pH meter.
2.2. Geochemical modelling
The additive approach was used to simulate the EAP of the soilsamples set at different pH values. This approach considers that theproperties of the overall soil can be described as the sum of theindividual properties of its constituents (Davis et al., 1998;Gustafsson, 2001). In order to simulate the adsorption behaviourof the different soil constituents, three adsorption models wereused: (i) the 1-pK Triple Plane Model (TPM) for the adsorption ofanions and cations by minerals (Hiemstra and Van Riemsdijk,1998), (ii) ion-exchange for cation adsorption on permanent nega-tively charged sites of clays and (iii) NICA-Donnan for the adsorp-tion of cations by the soil organic matter.
The 1-pK TPM includes a multi-site complexation model (Hiem-stra et al., 1989) and a charge distribution model based on thePauling concept (Hiemstra and Van Riemsdijk, 1996). A singleequilibrium constant (K1) corresponding to the point of zero charge(PZC) of the mineral surfaces is used to describe protonation/deprotonation reactions. These reactions occur at hydroxyl sitesbound to Al or Fe atoms (noted „S) of the mineral structure, asrepresented by the following reaction:
BSOH!1=2ðsÞ þHþðaqÞ $ BSOHþ1=2
2ðsÞ ð1Þ
with the equilibrium constant K1 expressed as:
K1 ¼fBSOHþ1=2
2 gfH2OgfHþgfBSOH!1=2g
ð2Þ
where the parentheses represent the activity of the correspondingchemical species. The concentration of surface hydroxyl sites is afunction of the concentration of the mineral phase and of its specificsurface area and site density.
The adsorption of P as well as the other ions is also described bythe stoichiometry of the reactions and their equilibrium constants(K2). For example, for P adsorbed as an innersphere complex thereaction can be written as:
BSOH!1=2ðsÞ þHþðaqÞ þ PO3!
4ðaqÞ $ BSOPO2:5!3ðsÞ þH2O ð3Þ
with the equilibrium constant K2 given by:
K2 ¼fBSOPO2:5!
3 gfH2OgfBSOH!1=2gfHþgfPO3!
4 gð4Þ
According to the TPM, electrical charges of the adsorbed ionsare distributed in the double-diffuse layer represented by threeelectrostatic planes (Fig. 1). The first plane (0-plane) correspondsto the mineral surface. The 1-plane separates the inner- and outer-sphere of the Stern layer. The last electrostatic plane (2-plane) sep-arates the Stern layer from the diffuse layer (Hiemstra and VanRiemsdijk, 1996). This formalism distinguishes innersphere surfacecomplexes from outersphere surface complexes, also correspond-ing to specific and non-specific adsorption processes, respectively.Ligands are shared with the surface sites when innersphere com-plexes are formed while outersphere complex formation involveselectrostatic interactions between the adsorbed ion and the surfacesites. The distribution of electrical charges added by adsorbed ionsis positioned in the electrostatic planes and taken into account bymeans of the Boltzmann accumulation factors. These factors aredefined as (Hiemstra and Van Riemsdijk, 1996):
P0 ¼ e!ðFw0=RTÞ P1 ¼ e!ðFw1=RTÞ P2 ¼ e!ðFw2=RTÞ ð5Þ
Iron or aluminium
Double diffuse Layer
Stern Layer
Mineral
Diffuse Layer
0 1 2
P
Ca
CaCl
Cl
Electrostatic planes
P
Ca
P
Ca
Cl
P
P
Oxygen
Proton
Outersphere
Electrical potential
Innersphere
Fig. 1. Representation of the diffuse double layer at a mineral surface according to the Triple Plane Model (TPM). Three electrostatic planes separate innersphere complexesand outersphere complexes, which share ligands with the surface sites and are electrostatically bound with reactive surface hydroxyl sites, respectively.
N. Devau et al. / Applied Geochemistry 24 (2009) 2163–2174 2165

with:
r0 ¼ C1ðw0 # w1Þ r1 ¼ C1ðw1 # w0Þ þ C2ðw1 # w2Þr2 ¼ C2ðw1 # w2Þ ð6Þ
where the subscripts 0, 1 and 2 stand for the 0-, 1- and 2-plane ofthe diffuse layer, respectively, F is the Faraday constant(96485.34 C), R is the gas constant (8.3144 J mol#1 K#1), T standsfor the absolute temperature (K), r and w correspond to the electro-static potential (V) and the electrical charge (C m#2) of each plane,respectively. The parameters C1 and C2 (F m#2) denote the molecu-lar capacitances of inner and outer Stern layers, respectively.
Two types of adsorption sites are present on kaolinite and illite(Lackovic et al., 2003; Gu and Evans, 2007, 2008): (i) the edge sites(noted „S), where the adsorption of ions is modelled with the 1-pK TPM (see above) and (ii) permanent negatively charged sitesassociated with basal siloxane surfaces (noted „X#). The adsorp-tion of cations on permanent negatively charged sites can be de-scribed by the stoichiometry of the reactions and theirequilibrium constants (K2) without electrostatic terms. For exam-ple, for the exchange of Ca2+ by two protons the reaction can bewritten as:
2 B X# &Hþ þ Ca2þ $ 2 B X# & Ca2þ þ 2Hþ ð7Þ
with the equilibrium constant K2 given by:
K2 ¼fBX# & Hþg2fCa2þgf2 B X# & Ca2þgfHþg2 ð8Þ
The common assumption was made that the binding propertiesof the natural organic matter can be approximated by those of hu-mic substances (e.g. Dudal and Gérard, 2004), and used the NICA-Donnan model to account for the adsorption of Ca by humic sub-stances (e.g. Kinniburgh et al., 1996, 1999). In this model, cationand proton binding sites are carboxylic and phenolic groups, andthe variations in the binding affinity of these two groups are con-tinuously described with a bimodal statistic function. The totalamount of component i (protons or cations) adsorbed by a fulvicor humic acid (mol kg#1), Qi,tot, can be expressed as (Kinniburghet al., 1999):
Q i;tot ¼ni;j
nHj
X2
j¼1
Q j;maxKi;jK
eli Cni;j
iPiKi;jKel
i Cni;ji
" #
'P
iKi;jKeli C
npji;j
i
1þP
iKi;jKeli C
npji;j
i
2
64
3
75 ð9Þ
where the subscript i corresponds to a cation or a proton, the sub-script j corresponds to the type of binding sites (carboxylic or phe-nolic), ni,j and nHj represents the stoichiometry of the adsorptionreactions for cations and protons, respectively, ni,j (0 < ni,j 6 1) ac-counts for the ‘‘non ideal” behaviour of the adsorption reaction be-tween a cation i and a binding of the type j, Qj,max stands for themaximum number of sites of type j (mol kg#1), Ci refers to the dis-solved concentration of the ith cation (mol l#1), Ki,j is the medianequilibrium constant for the adsorption of a cation i to the bindingsite j, p (0 < p 6 1) stands for the width of the distribution of eachgroup of sites, Kel
i is the electrostatic contribution of the ith ad-sorbed cation, which is calculated with a Donnan model. In theNICA-Donnan model, the electrostatic potential surrounding humicsubstances are supposed constant and uniform within the domainof the gel phase and it drops to zero at the boundary between themolecule and the solution.
The numerical modelling was performed with the chemicalequilibrium software Visual MINTEQ (Gustafsson, http://www.lwr.kth.se/English/OurSoftware/vminteq/). In this geochemi-cal software, thermodynamic data for aqueous species and miner-als are from the MINTEQA2 version 4.0 database (USEnvironmental Protection Agency, 1999).
2.3. Model parameters
The thermodynamic stability of the major Ca-phosphate miner-als likely to form during the course of the experiments, especiallyunder alkaline pH conditions, were tested (Murrmann and Peech,1969; Carreira and Lajtha, 1997; McDowell et al., 2003). As poten-tial secondary phases, the most common were considered:hydroxyapatite (Ca5(PO4)3OH), octacalcium phosphate (Ca8(H-PO4)2(PO4)4&5H2O) and dicalcium phosphate dihydrate (CaH-PO4&2H2O). Their equilibrium constants (#44.33, #47.08 and#18.99, respectively) were those reported in McDowell and Sharp-ley (2001). Corresponding chemical reactions are written in termsof PO3#
4 , Ca2+, and H+ species.The total concentration of P used as model input corresponds to
the sum of the total dissolved and adsorbed P. This value was set tothe value measured in the ammonium oxalate extract (see Table 1).Regarding Ca, the model input used was the sum of the Ca ex-tracted by cobalthexamine chloride solution (see Table 1) andthe Ca supplied by the CaCl2 extracting solution (0.01 M). With re-spect to total Cl, the concentration in the CaCl2 extracting solutionwas used.
The values of the parameters used in the 1-pK TPM are shown inTable 2a and b. The specific surface area, PZC, and site density ofthe five minerals considered in the study are within the range ofvalues reported in the literature. With respect to the site density,the values used for ferrihydrite and gibbsite correspond to the den-sity of surface hydroxyl sites sharing a bond with one Fe or Al atom(Manning and Goldberg, 1996). These types of surface hydroxylsites are usually called single coordinated group. For goethite, sur-face hydroxyl sites sharing bonds with three Fe atoms, i.e. triplecoordinated groups, are also taken into account (Hiemstra andVan Riemsdijk, 1996). In accordance with Wieland and Stumm(1992), the single coordinated groups were considered for theacid/base properties of illite and kaolinite. This type of binding siteis localized at the edges of the clay minerals. As mentioned before,clays minerals develop two types of adsorption sites. It was as-sumed that the second type, corresponding to permanent nega-tively charged sites, represented 16% and 35% of the edge-sitesconcentrations for kaolinite and illite, respectively (Lackovicet al., 2003; Gu and Evans, 2008).
The inner capacitance (C1) and the outer capacitance (C2) usedfor goethite were obtained from Hiemstra and Van Riemsdijk(2006). The same values were used for ferrihydrite (Gustafssonet al., 2009). Concerning the inner capacitance of gibbsite, the valueused by Gustafsson (2001) was selected. The outer capacitance ofthis Al-oxide was set to the value used for Fe-oxides based onthe similarity of the inner capacitances between Fe- and Al-oxides,because of the lack of consistent value for the type of electrolytesolution used in the present study (Sahai and Sverjensky, 1997).With respect to kaolinite and illite, the inner and outer capaci-tances values proposed by Lackovic et al. (2003) were used. Notethat the same capacitance values were used to fit the publishedexperimental data that enabled the determination of the originalsurface complexation constants (see below) and to fit P adsorptionin the studied soil.
Three types of P innersphere complexes, as observed by infraredspectroscopy (e.g. Tejedor-Tejedor and Anderson, 1990; Perssonet al., 1995), were considered. The first type (BSOPO2:5#
3 ) is calledmonodentate surface complex as it shares only one ligand withthe binding sites. In contrast, bidentate and protonated bidentatesurface complexes (BSO2PO2#
2 and „SO2POOH#, respectively)share two ligands with two surface hydroxyl sites. These surfacecomplexes have the same reaction stoichiometry and charge distri-bution for all studied minerals (Gustafsson, 2001; Manning andGoldberg, 1996), except the monodentate complex that is biproto-nated once formed at the surface of gibbsite (Gustafsson, 2001).
2166 N. Devau et al. / Applied Geochemistry 24 (2009) 2163–2174

Therefore, only the equilibrium constants (log K2) vary with thenature of the mineral (see Table 2b).
Chloride is known to be adsorbed as an outersphere complexby mineral surfaces (Hiemstra and Van Riemsdijk, 1996; Heet al., 1997; Gustafsson, 2001; Gu and Evans, 2007). The Ca canbe either adsorbed as innersphere or outersphere complexesdepending on the mineral. Calcium adsorption onto goethiteand ferrihydrite has been comprehensively studied (e.g. Rahne-maie et al., 2005b). These works revealed that Ca adsorption ontosuch Fe-oxides occurred as innersphere monodentate surfacecomplexes.
It was assumed that all the soil organic C corresponds to ‘active’humic substances regarding metal binding and that these are en-tirely made of humic acids (e.g. Dudal and Gérard, 2004; Lumdson,2004). The predominance of humic acids was also supported by thelow concentration of dissolved organic C that was measured at thenative soil pH (data not shown), which indicated the relative sta-bility of the soil organic matter (Lofts et al., 2001). The parametersproposed by Milne et al. (2001, 2003) were used for Ca binding andacid–base properties of a generic humic acid.
2.4. Undetermined binding properties
In contrast with Fe-oxides, which are well-documented with re-spect to P and Ca binding properties (see Table 2b), the parametersfor the adsorption of P and Ca onto clay minerals and the adsorp-tion of Ca onto gibbsite are apparently lacking in the literature.To obtain these parameters, published experimental data mea-sured in single mineral systems have been reinterpreted with the1-pK TPM. The number of unknowns was also limited by consider-ing that Ca and P adsorption involve the same reaction stoichiom-etry and charge distribution as other cations and anions that areknown to exhibit similar adsorption properties (Manning andGoldberg, 1996; Ponthieu et al., 2006; Sverjensky, 2006). Therefore,only the equilibrium constants of the different surface reactionswere estimated here.
Concerning the adsorption of P onto kaolinite and illite, thecharge distribution and reaction stoichiometry determined forAs(V) adsorption by Manning and Goldberg (1996) was used. Theseauthors considered three types of innersphere complexes: mono-dentate, bidentate, and protonated bidentate. Equilibrium constants
Table 2(a) Properties of soil minerals and soil organic matter and (b) model parameters used to simulate the concentration of inorganic phosphorus extracted with CaCl2. Values in italicsare from the present study. >RCO represents the reactive surface sites of natural organic matter, „SO stands for a reactive surface hydroxyl bound to a metal (Fe or Al) at thesurface of a metal oxide mineral or an aluminol group outcropping at the clay mineral edges, „X! represents the permanent negatively charged sites on basal plane of clays.
Goethite Ferrihydrite Gibbsite Kaolinite Illite Carboxylic Phenolic
(a)Concentration (g l!1) 6.174 0.324 1 35.12 39.94 – –Specific surface area (m2 g!1) 105a 750c 54e 23.6g 26.19k – –Site density (site nm!2) 6.15a 4c 4c 0.82g 2k – –Site density (mmol kg!1) – – – 4.5h 6.25j – –Point of zero charge (log K1) 9.2a 8.5c 10c 4.36i 3.46k – –Innersphere capacitance (F m!2) 0.9b 0.9d 1.1c 1.5j 1.5j – –Outersphere capacitance (F m!2) 0.74b 0.74d 0.74f 5j 5j – –Qmax (mol kg!1) – – – – – 3.35l 2.55l
nH – – – – – 0.81l 0.78l
nCa – – – – – 0.63l 0.75l
p – – – – – 0.49l
(b)Thermodynamic equilibrium constant (log K2)Surface complexes„SOPO3
!2.5 20.8a 19.7c – 20.8 17.44 – –„SO2PO2
!2 25.59a 26.01c 25.45c 25.5 26 – –„SO2POOH! 31.79a 32.61c 33.05c 32.6 30 – –„SOPO3H2!0.5 – – 32.5c – – – –„SOCaOH!0.5 !8.63m !8.63d !15 – !8 – –„SO2CaOH – – !15 !7 – – –„SO2Ca – – 4 – 1.5 – –„SOCa1.5 – – – 3.1 3.1 – –2„X! " Ca – – – 0.32 0.62 – –„SOK0.5 – – – !2.5g – – –„SONa0.5 – – !2.7n – !2.7o – –„SOCl!0.5 7.1a 7.1c 7.8n 7.9g 7.9o – –>RCOH – – – – – 2.93p 8p
>RCOCa – – – – – !1.37l !0.43l
a Hiemstra and Van Riemsdijk (1996).b Hiemstra and Van Riemsdijk (2006).c Gustafsson (2001).d Assumed to be equal to those of goethite (see text).e Manning and Goldberg (1996).f Assumed to be equal to those of Fe-oxides (see text).g He et al. (1997).h Gu and Evans (2008).i Duc et al. (2005).j Lackovic et al. (2003).k Liu et al. (1999).l Milne et al. (2003).
m Rahnemaie et al. (2005b).n Sahai and Sverjensky (1997).o Gu and Evans (2007).p Milne et al. (2001).
N. Devau et al. / Applied Geochemistry 24 (2009) 2163–2174 2167

associated with P adsorption reactions at kaolinite and illite surfaceswere fitted from experimental data reported by Dimirkou et al.(1997) and Manning and Goldberg (1996), respectively. In theseprevious works, KCl or NaCl were used as background electrolytes.Equilibrium constants for the adsorption of K and Na onto theseclays are given in Table 2b. These monovalent cations form outer-sphere complexes (Rahnemaie et al., 2005a).
The adsorption of Ca onto Al-oxides mineral has already beendescribed using innersphere bidentate surface complexes (Sverjen-sky, 2006), which would differ by the number of protons releasedfrom the mineral surface during their formation (ranging from 0 to2). Their equilibrium constants were obtained by fitting experi-mental data provided by Huang and Stumm (1973).
Concerning the complexes formed during Ca adsorption ontokaolinite and illite, spectrometry data on the adsorption of Cdby Lackovic et al. (2003) were reinterepeted. The considerationof data relative to Cd adsorption as a proxy for Ca is in agree-ment with the crystal chemical theory which stipulates that dif-ferent divalent cations form similar innersphere and outerspherecomplexes on edge sites of clays. Calcium adsorption was simu-lated on permanent negative charged sites by ion-exchange withthe release of two protons, as commonly made with variousdivalent cations (Lackovic et al., 2003; Gu and Evans, 2008).Accordingly, the adsorption of Ca on the edge sites of kaolinitewas controlled by the formation of an outersphere bidentate sur-face complex and an innersphere bidentate surface complexassociated with the release of two protons. The exchange reac-tion between Ca and two protons was also taken in accounton permanent negative charged sites of this clay mineral. Ther-modynamic equilibrium constants for these reactions were ob-tained by modelling the zeta potential of kaolinite measuredafter the adsorption of different quantities of Ca (Vane and Zang,1997). The electrostatic potential of the head end of the diffuselayer (2-plane) was linked to the zeta potential using the follow-ing equation (Zarzycki et al., 2007):
f ¼ wd expð#jZÞ ð10Þ
where f is the zeta potential (V), j is a constant (termed as the De-bye’s parameter) and Z is the distance between the electrostaticplane of the 2-plane and the plane of shear, which is related tothe ionic strength.
Concerning the adsorption of Ca onto illite, the formation of asingle innersphere monodentate surface complex and two biden-tate surface complexes, an outersphere and an innersphere sur-face complexe, was considered. As for kaolinite, the exchangebetween two protons and Ca was considered on the permanentnegatively charged sites (Gu and Evans, 2007). The experimentaldata supplied by Konan et al. (2007) was simulated in an at-tempt to determine the equilibrium constants for these surfacereactions.
2.5. Statistics
The statistical analyses were performed with the R soft-ware (CRAN, 2006). The goodness-of-fit of the simulation ofthe concentrations in P–CaCl2 vs. soil pH was estimated byPearson’s correlation coefficient and the Root Mean Square Er-ror (RMSE):
RMSE ¼
ffiffiffiffiffiffiffiffiffiffiffiffiffiffiffiffiffiffiffiffiffiffiffiffiffiffiffiffiffiffiffiffiX1
i¼n
ðXo;i # Xc;iÞn
vuut ð11Þ
where n is the number of samples, corresponding to different soilpH values, Xo,i is the measured P concentrations and Xc,i is the con-centration calculated by the model.
3. Results
3.1. Estimation of missing binding properties
Results of the simulations of P adsorption data for kaolinite andillite are shown in Fig. 2a and b. The model adequately reproducedthe measured concentrations of P adsorbed onto kaolinite at differ-ent pH values (R2 = 0.85, RMSE = 0.1 lmol g#1). Experimental datarelative to the adsorption of P onto illite were also simulated quiteaccurately (R2 = 0.87, RMSE = 0.035 mmol kg#1). Note that theadsorption of P onto these two clay minerals decreased from pH6 toward alkaline pH values (by 40% and 80% for kaolinite and illite,respectively). Under more acidic conditions, kaolinite adsorbed aquasi-constant concentration of P, i.e. a plateau was reached frompH 6 toward more acidic pH values. In contrast, the concentrationof P adsorbed onto illite decreased markedly with decreasing pHbelow pH 6.
Experimental and simulated results relative to Ca adsorptiononto gibbsite, kaolinite and illite are presented in Fig. 3. By adjust-ing the equilibrium constants for the adsorption of Ca onto gibb-site, the model reproduced reasonably well the experimentaldata (R2 = 0.8, RMSE = 0.3 lmol m#2). From neutral to mildly alka-line conditions (pH 9.5), quite good agreement was obtained be-tween measurements and modelling results. Above pH 9.5, themodel progressively underestimated proton concentrations thatare competitively released by Ca adsorption. The discrepancyreached 16% for hyperalkaline conditions (pH 11). The model alsoreproduced quite accurately (R2 = 0.9, RMSE = 0.6 mV) the zeta po-tential of kaolinite as measured by Vane and Zang (1997) over Caconcentrations ranging from 1 to 1000 mg l#1 (Fig. 3b). Regardingthe simulation of experimental conditions for Ca adsorption ontoillite (Konan et al., 1997), the model was also able to satisfactorilyreproduce the concentration of adsorbed Ca until saturation
0
5
10
15
20
3 4 5 6 7 8 9 10 pH
(a)Kaolinite
P ad
sorr
bed
(mg
kg-1
)
0.6
0
1.4
1.2 (b)
0.2
0.4
0.8
1
2 4 6 8 10
Illite
Pads
orrb
ed (m
g kg
-1)
pH
Fig. 2. Relationship between pH and concentration of P adsorbed onto (a) kaolinitein 0.1 M KCl at two total P concentrations (40 and 89 lM), measured by Dimirkouet al. (1997) and (b) illite in 0.1 M NaCl and at a P concentration of 6.7 lM, fromManning and Goldberg (1997). Symbols represent experimental data and thecontinuous line corresponds to the modelling results.
2168 N. Devau et al. / Applied Geochemistry 24 (2009) 2163–2174

(Fig. 3c) with respect to Ca hydroxide (R2 = 0.9, RMSE =0.05 mmol l!1). Note that the thermodynamic equilibrium con-stant defined by Konan et al. (2007) was used for Ca hydroxide(log K = 32.70).
3.2. Geochemical processes
Fig. 4a shows the measured values of P–CaCl2 as a function ofsoil pH. The different amounts of added alkali or acid have resultedin pH values ranging from 3.9 to 9.8, while the initial, untreatedsoil pH was 7.2. A little increase in P–CaCl2 was observed atpH < 5.8 and a more pronounced increase above pH 7.4. Comparedwith the value at native pH, P–CaCl2 concentrations increased up toa factor of 7 under alkaline conditions (pH 9.8). It can also be seenin Fig. 4a that the model accurately simulated P–CaCl2 over the en-tire range of soil pH (R2 = 0.8, RMSE = 0.03 mg kg!1). In the acidicand neutral pH range (pH < 7.4), simulated data were very closeto the actual concentrations (R2 = 0.85, RMSE = 0.02 mg kg!1). Atthe two most alkaline soil pH values (pH 8.9 and 9.8), the discrep-
ancy between simulated and measured concentrations was slightlylarger (R2 = 0.7, RMSE = 0.08 mg kg!1).
The stability diagram made for Ca-phosphate minerals (Fig. 4b)showed us that the solutions extracted with CaCl2 were undersat-urated with respect to the less soluble Ca-phosphate form(hydroxyapatite) at pH < 8, approximately. At larger pH, the ex-tracted solutions were oversaturated with respect to hydroxyapa-tite but remained undersaturated with respect to octacalciumphosphate and dicalcium phosphate dihydrate.
Similarly to hydroxyapatite, the solutions extracted with CaCl2
below pH 8 were undersaturated with respect to calcite (Fig. 4c).
pH
4
0
1
2
3
5
6
3 4 5 6 7 8 9 10 11 12
(a) 10
0x µ
mol
es H
+ re
leas
ed.m
-2
Gibbsite
-35
-25
-15
-5 0
15
25
0.1 1 10 100 1000
Ca concentration (mg l-1)
Zet
a po
tent
ial (
mV
)
(b) Kaolinite
5
1.5
0
0.5
1
2
2.5
0 2 4 6 8 10
Saturation Ca(OH)2
[Ca2+
] (X
10-2
mol
l-1)
Added mass of Ca(OH)2 per gram of illite (X 10-2)
(c) Illite
Fig. 3. (a) Proton release by gibbsite caused by Ca adsorption as a function of pH in0.1 M NaCl at a Ca concentration of 1 mM (Sverjensky, 2006); (b) zeta potential ofkaolinite in 0.01 M KCl as a function of dissolved Ca concentration (Vane and Zang,1997); (c) Ca concentrations in solution in presence of illite at increasing total Caconcentrations (Konan et al., 2007). Symbols represent experimental data and thecontinuous line corresponds to the modelling results.
-10
P co
ncen
tratio
n (m
g kg
-1)
pH +
pH
2PO
4
(b)-8
-14
pH - 1/2pCa
-20
-18
-16
-12
HAOCP
DCPD
6 2 3 4 5 7 8 9 10
Soil pH
Nat
ive
soil
pH (a)
0
0.1
0.2
0.3
0.4
0.5
3 4 5 6 7 8 9 10
-25 -20 -15 -10 -5 0 5
10 15 20 25
2 3 4 5 6 7 8 9 10
Satu
ratio
n in
dex
Soil pH Hy
Goethite
drox
(c)
yapatite
Ferrih
Octocalcium
ydrite Gibbsite
Calcite Dicalcium dihydrated
Fig. 4. (a) Relationship between soil pH and concentration of P extracted with CaCl2
(0.01 M) of the surface horizon of the studied soil (Chromic Cambisol, Cazevieille,France). The soil was acidified by adding H2SO4 and alkalinised by adding KOH. Thesymbols stand for the measured data, with the error bars corresponding to±standard deviation (n = 3). The continuous line corresponds to simulated values(R2 = 0.80, RMSE = 0.03 mg kg!1). (b) Stability diagram for three potentially precip-itating Ca-phosphate minerals: dicalcium dehydrated (DCPD), octacalcium (OCP)and hydroxyapatite (HA), showing the equilibrium state of the solutions extractedwith CaCl2 (symbols). (c) Saturation Index of Al- and Fe-oxides, calcite and P-minerals as a function of soil pH. Aqueous Fe and Al concentrations weredetermined from their concentration measured in the CEC. Iron is assumed asFe3+. Partial pressure of CO2 was set to the value in the atmosphere (10!3.5 atm).
N. Devau et al. / Applied Geochemistry 24 (2009) 2163–2174 2169

It was also calculated that Al- and Fe-oxides were oversaturatedover the investigated pH range. Note that kaolinite and illite satu-ration indexes were not calculated since Si concentration was notmeasured in the experiments.
3.3. Phosphorus and electrolyte adsorption mechanisms
Geochemical modelling enabled the study of the contributionsof different soil constituents: (i) to P adsorption and to (ii) Caand Cl adsorption (i.e. adsorption of electrolyte ions) in the studiedsoil.
Iron-oxides were the major P-adsorbing phases at acid andalkaline pH values. The contribution of Fe-oxides increased quitesharply at alkaline pH (at pH > 8). Under these conditions, Fe-oxi-des adsorbed up to 70.4 mg of P per kg of soil; i.e. 53% of the totaladsorbed P (Fig. 5a). As the soil pH increased from acid to neutralvalues, P adsorption was progressively controlled to larger extentsby clays and particularly illite than by Fe- and Al-oxides.
Fig. 5b shows that the model simulated an increase of Ca adsorp-tion by the soil organic matter and that adsorption by minerals alsoincreased as the soil pH increased. From the most acid to the mostalkaline conditions, the concentration of adsorbed Ca increased from3% to 13% of the total Ca concentration. Calcium was essentially ad-sorbed by soil organic matter, which is assumed to be made of humicacids. Over the entire pH range, the percentage of Ca adsorbed by thehumic acid remained quite stable, ranging from 86% to 91% of the to-tal adsorbed Ca. Illite adsorbed the largest Ca concentration, whichremained almost steady over the entire pH range (Fig. 5d). In con-trast, the adsorption of Ca onto kaolinite increased substantiallywith increasing pH. Iron and Al-oxides adsorbed significant amountsof Ca at alkaline pH only. Amongst soil minerals, goethite contrib-uted much more to Ca adsorption, as this Fe-oxide adsorbed a max-
imum of 190 mg kg!1 of Ca whereas gibbsite and ferrihydriteadsorbed only 11 and 48 mg kg!1, respectively.
The concentrations of adsorbed Cl calculated by the model areplotted in Fig. 5c. The concentration decreased from 142 mg kg!1
to 25 mg kg!1 as the pH of the soil samples increased from acidicto alkaline conditions. On average, adsorbed Cl amounted to about3% of the Cl concentration in the electrolyte solution. Illite exhib-ited the largest concentrations of adsorbed Cl and the adsorptionof Cl onto kaolinite was important at acidic pH only. In contrast,Al- and Fe-oxides always adsorbed traces of Cl.
The distribution of the three P surface complexes (monoden-tate, bidentate and protonated bidentate) can also be modelled(Fig. 6). Over the entire explored pH range, P was predominantlyadsorbed as monodentate surface complexes (about 73 mg kg!1,i.e. 54% of the total adsorbed P). Protonated bidentate surface com-plexes occurred only at acidic pH but contributed weakly to thesurface speciation. The maximum concentration of P adsorbed asprotonated bidentate surface complexes amounted to 12.6 mgkg!1 (about 10%) at the most acidic soil pH (pH 3.9). The concentra-tions of bidentate and monodentate surface complexes wereequivalent from pH 6.5 to 8. At pH > 8, monodentate complexespredominated, representing up to 80% of the total adsorbed P,reaching 113 mg kg!1 at the most alkaline soil pH (pH 9.8).
3.4. Relationship between the adsorption of cations and anions
Fig. 7a illustrates the variations in the concentrations of Ca andP adsorbed onto illite as a function of its surface charge. It can beseen that both P and Ca adsorption increased with increasing illitesurface charge although these ions have opposite charges. Further-more, adsorbed Ca increased by 25% while adsorbed P increased by68% when illite surface charge varied from 0.31 to 0.67.10!3
IlliteKaolinite Gibbsite Ferrihydrite Goethite Humic acids
Ads
orbe
d Cl
con
cent
ratio
ns (m
g kg
-1)
Soil pH
0
40
80
120
160
4 5 6 7 8 9
(c)
0
20
40
60
80
100
120
140 (a)
4 5 6 97 8Ads
orbe
d P
conc
entra
tions
(mg
kg-1
)
Soil pH
Ads
orbe
d Ca
conc
entra
tions
(mg
kg-1
)
0
1
2
3
4
5 (b)
Soil pH
Ads
orbe
d Ca
conc
entra
tions
(g k
g-1)
4 5 6 7 8 9
900
600
300
0 4 5 6 9 7 8
Soil pH
(d)
Fig. 5. Concentrations of P (a), Ca (b) and Cl! (c) adsorbed onto the different constituents of the studied soil (Chromic Cambisol, Cazevieille, France) as a function of soil pH. (d)Focus on the concentration of calcium adsorbed onto the different soil minerals.
2170 N. Devau et al. / Applied Geochemistry 24 (2009) 2163–2174

C(+)m!2. This indicates that the adsorption of Ca was less sensitiveto a variation of illite surface charge than the adsorption of P.
Fig. 7b shows the concentrations of P and Cl adsorbed by kaolin-ite as a function of soil pH. Under acidic conditions, the concentra-tions of adsorbed P and Cl exhibited opposite behaviours. Theconcentration of P adsorbed onto kaolinite increased up to pH5.4, with a maximum value of 34 mg kg!1, while the concentrationof adsorbed Cl decreased from 72 mg kg!1 to zero.
4. Discussion
4.1. Controlling geochemical process
The simulation of P–CaCl2 performed with mechanistic adsorp-tion models provided adequate results. This success suggests thatthe adsorption process controlled the EAP of the studied soil over a
large range of pH conditions around the native pH. This finding isfurther confirmed by the fact that the degree of P saturation (i.e.the ratio between P concentration and the amount of Al and Fe ex-tracted by ammonium oxalate) was low, as defined by Litaor et al.(2003) and McDowell et al. (2003) for soils where adsorption seemsto be the predominant geochemical process controlling EAP. Theundersaturation of phosphate minerals obtained from pH 4 to aboutpH 8 also reinforces the finding that adsorption processes controlledEAP in the studied soil (see Fig. 4b). Under alkaline conditions, theformation of the least soluble Ca-phosphate tested here (hydroxyap-atite) may explain the modest difference between measured andcalculated P–CaCl2 concentrations (see Fig. 4a). Such a shift with soilpH in the geochemical process controlling the EAP has already beenreported by McDowell et al. (2003). It was also found that P–CaCl2
extracts were always oversaturated with respect to Fe- and Al-oxi-des thus precluding any effect of their dissolution (Fig. 4c). The influ-ence of the precipitation of Fe- and Al-oxides is negligible, as iscommonly assumed in adsorption studies performed under similarpH and temperature conditions (e.g. Hiemstra and Van Riemsdijk,1996, 2006; Gustafsson, 2001). By the same token, the influence ofclay dissolution or precipitation on the adsorption process can beneglected (e.g. Gu and Evans, 2007, 2008).
4.2. Validity of estimated binding properties
The results of the modelling also suggests that the three surfacecomplexes involved in the adsorption of As(V) onto kaolinite andillite (Manning and Goldberg, 1996) can also be used to describeP adsorption. Furthermore, the fitted equilibrium constant valuesfor P adsorption (see Table 2b) were larger than those reportedby Manning and Goldberg (1996) for As(V) for a constant-capaci-tance model, which are the only data available for comparison pur-poses. Such comparison between metal binding constants that areconsistent with the 1-pK TPM and those consistent with the con-stant-capacitance model has already been made by Lackovicet al. (2003) and Gu and Evans (2007, 2008). Consistently, suchhigher affinity of P relative to As(V) for adsorption by clay surfaceswas also obtained by Violante and Pigna (2002). This may be due tothe lesser negative charge brought in by P when it is adsorbed,thereby favouring its adsorption.
Strong agreement was also obtained by modelling published re-sults of Ca adsorption onto gibbsite, kaolinite, and illite. This resultsuggests that the innersphere and outersphere surface complexesreported for other divalent metal cations can be used to simulateCa adsorption (Lackovic et al., 2003; Rahnemaie et al., 2005b; Sver-jensky, 2006). The equilibrium constants for Ca adsorption ontogibbsite were higher than those obtained by Sverjensky (2006)for Mg adsorption with the same electrostatic adsorption model.In the same way, the equilibrium constants for Cd adsorption ontokaolinite and illite proposed by Lackovic et al. (2003) were higherthan those calibrated here for Ca adsorption. These differences inthe log K2 for Ca complexes relative to those for Cd and Mg com-plexes are in agreement with the crystal chemical theory stipulat-ing that the equilibrium constant increases with increasing ionicradius of the adsorbed cation (Zhang et al., 2004; Rahnemaieet al., 2005b; Sverjensky, 2006).
Lastly, it was observed that the equilibrium constants for Caadsorption on permanent negatively charged sites of illite and kao-linite were close to the values found for the exchange between Caand Na by Tournassat et al. (2007) and Kopittke et al. (2006).
4.3. Distribution of adsorbed P: mineral composition and electrolyteinfluences
Results showed that the contribution of the various soil miner-als to P adsorption changed with soil pH (see Fig. 5a). In particular,
Ads
orbe
d P
conc
entr
atio
ns (m
g kg
-1)
120
0
Soil pH
40
80
160
4 5 6 7 8 9
Protonated Bidentate Bidentate Monodentate
Fig. 6. Distribution of P surface complexes as a function of soil pH.
Ads
orbe
d P
conc
entr
atio
ns (
mg
kg-1
)
40 (a)
30
Illite surface charge (10-3C(+) m-²)
0
10
20
0.3 0.4 0.5 0.6 0.7 0
10
20
30
P
CaA
dsor
bed
Ca
conc
entr
atio
ns (
mg
kg-1
) A
dsor
bed
Cl c
once
ntra
tions
(mg
kg-1
)
10
Soil pH
Ads
orbe
d P
conc
entr
atio
ns (m
g kg
-1)
0
20
30
40
50
3 4 5 6 7 8 9 10
0
20
40
60
80
P
Cl
(b)
Fig. 7. (a) Concentrations of P and Ca adsorbed onto illite as a function of its surfacecharge; (b) concentration of P and Cl! adsorbed onto kaolinite as a function of soilpH.
N. Devau et al. / Applied Geochemistry 24 (2009) 2163–2174 2171

significant contribution of clay minerals to the adsorption of P be-tween pH 5.8 and pH 7.4 was found. Such a high affinity of clay forP adsorption had also been observed by Manning and Goldberg(1996). The present work provides quantitative insights in the rel-ative contribution of clay minerals and Fe- or Al-oxides andshowed an unexpected, substantial contribution of kaolinite and il-lite over the large, investigated pH range, with illite being animportant component. Modelling also revealed the importance ofthe background electrolytes on the adsorption properties of theseclay minerals. First, the concentration of P adsorbed onto illiteand to a lesser extent onto kaolinite increased with increasing soilpH, although deprotonation of the surface hydroxyl sites increased,thus leading to more anion-repulsive surfaces. This can be ex-plained by surface deprotonation being counterbalanced by Caadsorption, which resulted in positive charges in the double-dif-fuse layer. Such a build up of surface positive charges led to en-hance P adsorption (see Fig. 7a). Therefore, the P–CaCl2
concentrations remained stable in the range of neutral pH. At alka-line soil pH, Ca adsorption did not compensate for the deprotona-tion of mineral surfaces and thus P–CaCl2 concentrations increased.This promoting mechanism for P adsorption has already been ob-served with Al/Fe-oxides and clay minerals (Rietra et al., 2001; Ma-sue et al., 2007). Consistently, numerical simulations indicated thatthe adsorption of Ca onto illite and kaolinite is particularly impor-tant (see Fig. 5d). The high intensity of this mechanism for illite hasalso been observed by Smith et al. (2002), who studied As(V)adsorption in the presence of Ca. Such a great affinity of Ca towardillite and kaolinite binding sites should be ascribed to their lowPZC, relative to Fe- and Al-oxides (see Table 2b).
It was also calculated by modelling that the adsorption of P de-creased at very acidic soil pH, leading to larger values of P–CaCl2
(see Fig. 4a). This result was rather surprising because of theincreasing protonation of mineral surfaces with decreasing pH con-ditions, which would imply an increased adsorption of P (Hiemstraand Van Riemsdijk, 1996; He et al., 1997). Decreasing P adsorptionunder acidic conditions had however also been observed by Geelh-oed et al. (1997) and Hiemstra and Van Riemsdijk (1998). This ef-fect appears even more pronounced with clay minerals (He et al.,1997). Again, the influence of the background electrolyte can ex-plain this result. The numerical simulation revealed that kaoliniteadsorbed significant amounts of Cl only at acidic pH values, i.e. be-low pH 6 (see Fig. 5c). Moreover, the adsorption of this monovalentanion increased with decreasing pH and the increase in Cl adsorp-tion was quite well correlated (in the acidic pH range) with the de-crease in P adsorption onto this clay mineral (see Fig. 7b).Consequently, such an inverse correlation between adsorbed Cland adsorbed P may be indicative of a competition between thesetwo anions toward kaolinite binding sites, ultimately resulting inincreased P–CaCl2 at acidic pH.
The concentration of P adsorbed onto gibbsite and Fe-oxidesvaried with soil pH with a similar pattern to P–CaCl2. Indeed,the concentration of P adsorbed onto Al- and Fe-oxides increasedin both the acidic and alkaline pH domains, where these mineralscontributed to as much as 50% of the total adsorbed P, the remain-ing part being bound to clay minerals. At acidic pH, the large con-tribution of Fe-oxides and gibbsite can be explained by their highPZC, especially for gibbsite (see Table 2a). At alkaline pH, thoseminerals replaced clay minerals in playing a major role in Padsorption due to their high surface charge, despite that Caadsorption onto clay minerals occured (see above). In spite of this,a marked increase in P–CaCl2 was observed (see Fig. 4a). Such Pdesorption at alkaline pH has been widely described in differentsingle mineral systems (e.g. Barrow et al., 1980; Hiemstra andVan Riemsdijk, 1998). This was caused by the large extent of thedeprotonation of all mineral surfaces under these pH conditions,which was apparently not compensated for by the additional po-
sitive charges accompanying the adsorption of Ca onto Al- and Fe-oxides.
4.4. Influence of phosphorus surface complexes
The slight increase in P–CaCl2 under acidic pH may also be re-lated to the strength of P surface complexes. The numerical simu-lation indicated that protonated bidentate complexes contributedsignificantly to P adsorption in the acidic pH range only (seeFig. 6). Because of the Boltzman factors (e.g. Rietra et al., 2000),the formation of this type of surface complex adds more negativecharges onto mineral surfaces than bidentate and monodentatecomplexes, which dominated surface complexation under lessacidic and near neutral conditions. Such additional negativecharges increased the repulsive interactions between P and min-eral surfaces, which led to decreasing P adsorption.
Monodentate surface complexes dominated P surface specia-tion under alkaline pH conditions (see Fig. 6). Their formation re-sulted in less negative charges at the mineral surfaces thanbidentate surface complexes and thus decreased the repulsion ofanions. However, it appeared that this mechanism, inasmuch asthat associated to the adsorption of Ca, was not efficient enoughto counterbalance the effect of the deprotonation of binding sites,which led to increased P–CaCl2 under these pH conditions (see pre-vious section).
The numerical modelling also revealed that monodentate com-plexes are the most abundant P surface complexes for goethiteover the entire pH range. This was not observed in a study per-formed by Rietra et al. (2001) in solutions containing Ca and P.The predominance of monodentate species may be due to thelow saturation of goethite surface sites (7.5%) achieved in the pres-ent work. The low saturation of goethite surface sites led todecreasing repulsive effects, which promoted the formation ofmonodentate complexes that are more stable than bidentate com-plexes under these conditions (Rose et al., 1997). Nevertheless,spectrometric data such as provided by EXAFS are required to iden-tify the actual nature of the surface complexes (Tejedor-Tejedorand Anderson, 1990).
5. Conclusions
Mechanistic adsorption models (1-pK Triple Plane Model, ion-exchange and NICA-Donnan) were used to simulate the concentra-tion of environmentally available P (EAP) in the topsoil of a Chro-mic Cambisol over a range of pH values. Strong agreement wasfound with the experimental data. In this modelling investigation,the properties of the individual minerals and those of the soil or-ganic matter were considered through an additive approach. Theconcentration of inorganic P extracted by CaCl2 (P–CaCl2) was usedas an indicator of the EAP. Based on thermodynamic equilibriumconsiderations, it appears that the dissolution–precipitation ofCa-phosphate minerals did not control the EAP over the investi-gated range of pH values (from pH 4 to 10). This process may haveplayed a role only under the most alkaline pH conditions, explain-ing the moderate overestimation of P–CaCl2 by the model at suchpH. This work made it possible to rank the contribution of differentsoil minerals to P adsorption and to show an unexpected, majorcontribution of clay minerals, except in the most acidic conditions.The use of CaCl2 as background electrolyte required to account forthe adsorption of Ca and Cl by soil constituents, which were foundto exert a promoting and competing effect on P adsorption, respec-tively. The influence of the distribution of P surface complexes onthe variation of P–CaCl2 as a function of pH was highlighted aswell. A major finding provided by the model is that while P adsorp-tion and EAP varied little over a large range of pH values (5–7.5, or
2172 N. Devau et al. / Applied Geochemistry 24 (2009) 2163–2174

even 4.5 to about 8 according to measured values), the relativecontribution of the various minerals and binding sites did varyconsiderably. From a functional point of view, this means that inthis pH range, any pH change would thus result in P ions desorbingfrom sites or mineral surfaces and re-adsorbing onto some other.This may provide a chance for plant roots that are capable of alter-ing the rhizosphere pH to recover some of these P ions in spite ofthe apparent little change of EAP with pH.
This study thus demonstrated: (i) the possibility of modellingcomplex systems in general, and in the present case of geochemicalmodelling, with generic parameter values as a unique tool tounderstand complex, interacting physico-chemical processes insoils; (ii) the applicability of mechanistic adsorption models to a‘real’ soil, with its mineralogical complexity and the additionalcontribution of soil organic matter. All model parameters were ta-ken from the literature or obtained by fitting published experimen-tal values in single mineral systems. Indeed, the proposedmechanistic modelling is a promising approach to model the EAPand study a number of environmental issues related to P dynamicsin soils.
Acknowledgements
The authors are indebted to the technical assistance in the lab-oratory provided by Muhammad Arshad, Jean-Louis Aznar, MichaëlClairotte and Lucien Roger. We also acknowledge the LanguedocRoussillon Regional Authorities for funding this research. The com-ments and suggestions of an anonymous reviewer and Dr. M.Azaroual are greatly appreciated.
References
Anshumali, A., Ramanathan, A., 2007. Phosphorus fractionation in surficialsediments of Pandoh Lake, Lesser Himalaya, Himachal Pradesh, India. Appl.Geochem. 22, 1860–1871.
Barrow, N., Bowden, M., Posner, A., Quirk, J., 1980. Describing the effects ofelectrolyte on the adsorption of phosphate by a variable charge surface. Aust. J.Soil Res. 18, 395–404.
Bertrand, I., Hinsinger, P., Jaillard, B., Arvieu, J.C., 1999. Dynamics of phosphorus inthe rhizosphere of maize and rape grown on synthetic, phosphated calcite andgoethite. Plant Soil 211, 111–119.
Carreira, J.A., Lajtha, K., 1997. Factors affecting phosphorus sorption along aMediterranean, dolomitic soil and vegetation chronosequence. Eur. J. Soil Sci.48, 139–149.
CRAN, 2006. R: A language and Environment for statistical computing.Davis, J., Coston, J., Kent, D., Fuller, C., 1998. Application of the surface complexation
concept to complex mineral assemblages. Environ. Sci. Technol. 32, 2820–2828.de Endredy, A.S., 1963. Estimation of free iron oxides in soils and clays by a
photolytic method. Clay Miner. 5, 209–217.Dimirkou, A., Ioannou, A., Papadopoulos, P., 1997. Kinetics of phosphorus sorption
by hematite and kaolinite–hematite (k–h) system. Commun. Soil Sci. Plant 27,1071–1090.
Duc, M., Gaboriaud, F., Thomas, F., 2005. Sensitivity of the acid–base properties ofclays to the methods of preparation and measurement 1. Literature review. J.Colloid Interf. Sci. 289, 139–147.
Dudal, Y., Gérard, F., 2004. Accounting for natural organic matter in aqueouschemical equilibrium models: a review of the theories and applications. EarthSci. 66, 199–216.
Ehlert, P., Morel, C., Fotyma, M., Destain, J.-P., 2003. Potential role of phosphatebuffering capacity of soils in fertilizer management strategies fitted toenvironmental goals. J. Plant Nutr. Soil Sci. 166, 409–415.
Fanning, D., Vissarion, Z., El-Desoky, M., 1989. Micas and kaolinite. In: Dixon, E.,Weed, A. (Eds.), Minerals in Soil Environments. Madison, Wisconsin, pp. 552–624.
FAO-UNESCO, 1989. Soil Map of the world at 1: 5 000 000.Frau, F., Biddau, R., Fanfani, L., 2008. Effect of major anions on arsenate desorption
from ferrihydrite-bearing natural samples. Appl. Geochem. 23, 1451–1466.Gahoonia, T.S., Claassen, N., Jungk, A., 1992. Mobilization of phosphorus in different
soils by ryegrass supplied with ammonium or nitrate. Plant Soil 140, 241–248.Geelhoed, J.S., Van Riemsdijk, W., Findenegg, G.R., 1997. Simulation of the effect of
citrate exudation from roots on the plant availability of phosphate adsorbed ongoethite. Eur. J. Soil Sci. 50, 379–390.
Gérard, F., François, M., Ranger, J., 2002. Processes controlling silica concentration inleaching and capillary soil solutions of an acidic brown forest soil (Rhône,France). Geoderma 107, 197–226.
Gérard, F., Ranger, J., Ménétrier, C., Bonnaud, P., 2003. Silicate weatheringmechanisms determined using soil solutions held at high matric potential.Chem. Geol. 202, 443–460.
Gu, X., Evans, L., 2007. Modelling the adsorption of Cd(II), Cu(II), Ni(II), Pb(II), andZn(II) onto Fithian illite. J. Colloid Interf. Sci. 307, 317–325.
Gu, X., Evans, L., 2008. Surface complexation modelling of Cd(II), Cu(II), Ni(II), Pb(II)and Zn(II) adsorption onto kaolinite. Geochim. Cosmochim. Acta 72, 267–276.
Guo, Y., Yost, R., 1999. Quantifying the available soil phosphorus pool with the acidammonium oxalate method. Soil Sci. Soc. Am. J. 63, 651–656.
Gustafsson, J.P., 2001. Modelling competitive anion adsorption on oxide mineralsand an allophane-containing soil. Eur. J. Soil Sci. 52, 639–653.
Gustafsson, J.P., Dässman, E., Bäckström, M., 2009. Towards a consistent model forprediction of uranium(VI) removal from groundwater by ferrihydrite. Appl.Geochem. 24, 454–462.
Harmsen, J., Rulkens, W., Eijsackers, H., 2005. Bioavailability: concept forunderstanding or tool for predicting? Land Conserv. Reclam. 13, 161–171.
Hartz, T., Johnstone, P.R., 2006. Relationship between soil phosphorus availabilityand phosphorus loss potential in runoff and drainage. Commun. Soil Sci. Plant37, 1525–1536.
He, L.M., Zelazny, L.W., Baligar, C., Ritchney, K.D., Martens, D.C., 1997. Ionic strengtheffects on sulfate and phosphate adsorption on oxide-alumina and kaolinite:triple layer model. Soil Sci. Soc. Am. J. 61, 784–793.
Hesketh, N., Brookes, P.C., 2000. Development of an indicator for risk of phosphorusleaching. J. Environ. Qual. 29, 105–110.
Hiemstra, T., Van Riemsdijk, W., 1996. A surface structural approach to ionadsorption: the charge distribution (CD) model. J. Colloid Interf. Sci. 179, 488–508.
Hiemstra, T., Van Riemsdijk, W., 1998. Surface structural ion adsorption modellingof competitive binding of oxyanions by metal (hydr)oxides. J. Colloid Interf. Sci.210, 182–193.
Hiemstra, T., Van Riemsdijk, W., 2006. On the relationship between chargedistribution, surface hydration, and the structure of the interface of metalhydroxides. J. Colloid Interf. Sci. 301, 1–18.
Hiemstra, T., De Wit, C.M., Van Riemsdijk, H., 1989. Multisite proton adsorptionmodeling at the solid/surface interface of (hydr)oxides: a new approach: II.Application to various important (hydr)oxides. J. Colloid Interf. Sci. 133, 105–117.
Hinsinger, P., 2001. Bioavailability of soil inorganic P in the rhizosphere as affectedby root-induced chemical changes: a review. Plant Soil 237, 173–195.
Hinsinger, P., Bengough, A.G., Vetterlein, D., Young, I.M., 2009. Rhizosphere:biophysics, biogeochemistry and ecological relevance. Plant Soil 321, 117–152.
Hinsinger, P., Plassard, C., Caixian, T., Jaillard, B., 2003. Origins of root-mediated pHchanges in the rhizosphere and their responses to environmental constraints: areview. Plant Soil 248, 43–59.
Houba, V.J., Novozamsky, I., Lexmond, T.M., aVan der Lee, J.J., 1990. Applicability of0.01 M CaCl2 as a single extraction solution for the assessment of the nutrientstatus of soils and other diagnostic purposes. Commun. Soil Sci. Plant 21, 2281–2291.
Huang, C., Stumm, W., 1973. Specific adsorption of cations on hydrous c-Al2O3. J.Colloid Interf. Sci. 43, 409–420.
Huang, X.L., Zhang, J.Z., 2006. Surfactant-sensitized malachite green method fortrace determination of orthophosphate in aqueous solution. Anal. Chim. Acta580, 55–67.
Juo, A.S.R., Kamprath, E.J., 1979. Copper chloride as an extractant for estimating thepotentially aluminium pool in acids soils. Soil Sci. Soc. Am. J. 43, 35–38.
Kinniburgh, D.G., Milne, C.J., Benedetti, M.F., Pinheiro, J., Filius, J., Koopal, L.K., VanRiemsdijk, W.H., 1996. Metal ion binding by humic acid: application of theNica-Donnan model. Environ. Sci. Technol. 30, 1687–1698.
Kinniburgh, D.G., Van Riemsdijk, W.H., Koopal, L.K., Borkovec, M., Benedetti, M.F.,Avena, M.J., 1999. Ion binding to natural organic matter: competition,heterogeneity, stoichiometry and thermodynamic consistency. Colloids Surf. APhysicochem. Eng. Aspects 151, 147–166.
Konan, K.L., Peyratout, C., Bonnet, J.P., Smith, A., Jacquet, A., Magnoux, P., Ayrault, P.,2007. Surface properties of kaolin and illite suspensions in concentratedcalcium hydroxide medium. J. Colloid Interf. Sci. 307, 101–108.
Kopittke, P., So, H., Menzies, N., 2006. Effect of ionic strength and clay mineralogy onNa–Ca exchange and the SAR–ESP relationship. Eur. J. Soil Sci. 57, 626–633.
Lackovic, K., Angove, M., Wells, R., Johnson, B.J., 2003. Modeling the adsorption ofCd(II) onto Muloorina illite and related clay minerals. J. Colloid Interf. Sci. 257,31–40.
Lanno, R., Wells, J., Conder, J., Bradham, K., Basta, N., 2004. The bioavailability ofchemicals in soil for earthworms. Ecotox. Environ. Saf. 57, 39–47.
Li, H., Shen, J., Zhang, F., Clairotte, M., Drevon, J.J., Le Cadre, E., Hinsinger, P., 2008.Dynamics of phosphorus fractions in the rhizopshere of common bean(Phaseolus vulgaris L.) and durum wheat (Triticum turgidum durum L.) grownin monocropping and intercropping systems. Plant Soil 312, 139–150.
Linge, K., Oldham, C., 2004. Control mechanisms for dissolved phosphorus andarsenic in a shallow lake. Appl. Geochem. 19, 1377–1389.
Litaor, M.I., Reichmann, O., Belzer, M., Auerswald, K., Nishri, A., Shenker, M., 2003.Spatial Analysis of phosphorus sorption capacity in a semiarid altered wetland.J. Environ. Qual. 32, 335–343.
Liu, W., Sun, Z., Forsling, W., Du, Q., Tang, H., 1999. A Comparative study of surfaceacid–base characteristics of natural illites from different origins. J. Colloid Interf.Sci. 219, 48–61.
Lofts, S., Wof, C., Tipping, E., Clarke, N., Mulder, J., 2001. Modelling pH buffering andaluminium solubility in European forest soils. Eur. J. Soil Sci. 52, 189–204.
N. Devau et al. / Applied Geochemistry 24 (2009) 2163–2174 2173

Lumdson, D.G., 2004. Partitioning of organic carbon, aluminium and cadmiumbetween solid and solution in soils: application of a mineral-humic particleadditivity model. Eur. J. Soil Sci. 55, 271–285.
Maguire, R., Sims, T., 2002. Soil testing to predict phosphorus leaching. J. Environ.Qual. 31, 1601–1609.
Manning, B., Goldberg, S., 1996. Modeling competitive adsorption of arsenate withphosphate and molybdate on oxide minerals. Soil Sci. Soc. Am. J. 60, 121–131.
Marschner, P., Solaiman, Z., Rengel, J., 2005. Growth, phosphorus uptake, andmicrobial-community composition of a phosphorus efficient wheat cultivar insoils differing in pH. J. Plant Nutr. Soil Sci. 168, 334–351.
Masue, Y., Loeppert, R., Kramer, T., 2007. Arsenate and arsenite adsorption anddesorption behavior on coprecipitated aluminium:iron hydroxides. Environ. Sci.Technol. 41, 837–842.
McDowell, R.W., Condron, L.M., 2000. Chemical nature and potential mobility ofphosphorus in fertilized grassland soils. Nutr. Cycl. Agroecosys. 57, 25–233.
McDowell, R.W., Sharpley, A.N., 2001. Approximating phosphorus release from soilsto surface runoff and subsurface drainage. J. Environ. Qual. 30, 508–520.
McDowell, R.W., Mahieu, N., Brookes, P.C., Poulton, P.R., 2003. Mechanisms ofphosphorus solubilisation in a limed soil as function of pH. Chemosphere 51,685–692.
Mehra, O.P., Jackson, M.L., 1960. Iron oxide removal from soils and clays by adithionite–citrate system buffered with sodium bicarbonate. Clay Clay Miner. 7,317–327.
Milne, C.J., Kinniburgh, D., Tipping, E., 2001. Generic Nica-Donnan modelparameters for proton binding by humic substances. Environ. Sci. Technol. 35,2049–2059.
Milne, C., Kinniburgh, D., Van Riemsdijk, W., Tipping, E., 2003. GenericNICA!Donnan model parameters for metal-ion binding by humic substances.Environ. Sci. Technol. 37, 958–971.
Mollier, A., De Willigen, P., Heinen, M., Morel, C., Schneider, A., Pellerin, S., 2008. Atwo dimensional simulation model of phosphorus uptake including cropgrowth and P response. Ecol. Model. 210, 453–464.
Murrmann, R.P., Peech, M., 1969. Effect of pH on labile and soluble phosphate insoils. Soil Sci. Soc. Am. Proc. 33, 205–210.
Neyroud, J.A., Lischer, P., 2003. Do different methods used to estimate soilphosphorus availability across Europe give comparable results? J. Plant Nutr.Soil Sci. 166, 422–431.
Ohno, T., Zibilske, L.M., 1991. Determination of low concentrations of phosphorus insoil extracts using Malachite green. Soil Sci. Soc. Am. J. 55, 892–895.
Persson, P., Nilsson, N.I., Joberg, S., 1995. Structure and bonding of orthophosphateions at the iron oxide–aqueous interface. J. Colloid Interf. Sci. 177, 263–275.
Ponthieu, M., Juillot, F., Hiemstra, T., Van Riemsdijk, W.H., Benedetti, M.F., 2006.Metal ion binding to iron oxides. Geochim. Cosmochim. Acta 70, 2679–2698.
Raghothama, K.G., Karthikeyan, A.S., 2005. Phosphate acquisition. Plant Soil 274,37–49.
Rahnemaie, R., Hiemstra, T., Van Riemsdijk, W., 2005a. A new surface structuralapproach to ion adsorption: tracing the location of electrolyte ions. J. ColloidInterf. Sci. 293, 312–321.
Rahnemaie, R., Hiemstra, T., Van Riemsdijk, W., 2005b. Inner- and outer-spherecomplexation of ions at the goethite-solution interface. J. Colloid Interf. Sci. 297,379–388.
Rhoton, F., Bighman, J., 2005. Phosphate adsorption by ferrihydrite-Amended soils.J. Environ. Qual. 34, 890–896.
Rietra, R., Hiemstra, T., Van Riemsdijk, T., 2000. Electrolyte anion affinity and itseffect on oxyanion adsorption on goethite. J. Colloid Interf. Sci. 229, 199–206.
Rietra, R., Hiemstra, T., Van Riemsdijk, T., 2001. Interaction between calcium andphosphate adsorption on goethite. Environ. Sci. Technol. 35, 3369–3374.
Rose, J., Flank, A.M., Masion, A., Bottero, J.Y., Elmerich, P., 1997. Nucleation andgrowth mechanisms of Fe oxyhydroxide in the presence of PO4 ions. 2. P K-EdgeEXAFS Study. Langmuir 13, 1827–1834.
Sahai, N., Sverjensky, D., 1997. Evaluation of internally consistent parameters forthe triple-layer model by the systematic analysis of oxide surface titration data.Geochim. Cosmochim. Acta 61, 2801–2826.
Sharpley, A., Tunney, H., 2000. Phosphorus research strategies to meet agriculturaland environmental challenges of the 21st century. J. Environ. Qual. 29, 176–181.
Smith, E., Naidu, R., Altson, A., 2002. Chemistry of inorganic arsenic in soils: II. Effectof phosphorus, sodium and calcium on arsenic sorption. J. Environ. Qual. 31,557–563.
Smith, V., Tilman, G., Nekola, J., 1999. Eutrophication: impacts of excess nutrientinputs on freshwater, marine, and terrestrial ecosystems. Environ. Pollut. 100,179–196.
Sverjensky, D., 2006. Prediction of the speciation of alkaline earths adsorbed onmineral surfaces in salt solutions. Geochim. Cosmochim. Acta 70, 2427–2453.
Tejedor-Tejedor, I., Anderson, M., 1990. The protonation of phosphate on the surfaceof goethite as studied by CIR-FTIR and electrophoretic mobility. Langmuir 6,596–602.
Tournassat, C., Gailhanou, H., Crouzet, C., Braibant, G., Gautier, A., Lassin, A., Blanc,P., Gaucher, E., 2007. Two cation exchange models for direct and inversemodelling of solution major cation composition in equilibrium with illitesurfaces. Geochim. Comochim. Acta 71, 1098–1114.
US Environmental Protection Agency., 1999. INTEQA2/PRODEFA2. A geochemicalassessment model for environmental systems/User manual supplement forversion 4.0. Environmental Protection Agency, Athens, GA.
Van Erp, P.J., 2002. The potential of multi-nutrient soil extraction with CaCl2 innutrient management, Master thesis, Univ. Wagenigen, The Netherlands.
Vane, L.M., Zang, G., 1997. Effect of aqueous phase properties on clay particle zetapotential and electro-osmotic permeability: Implications for electro-kinetic soilremediation processes. J. Hazard. Mater. 55, 1–22.
Violante, A., Pigna, M., 2002. Competitive sorption of arsenate and phosphate ondifferent clay mineral and soils. Soil Sci. Soc. Am. J. 66, 1788–1796.
Wieland, E., Stumm, W., 1992. Dissolution kinetics of kaolinite in acidic aqueoussolution at 25 C. Geochim. Cosmochim. Acta 56, 3339–3355.
Zarzycki, P., Szabelski, P., Piasecki, W., 2007. Modelling of -potential of themontmorillonite/electrolyte solution interface. Appl. Surface Sci. 253, 5791–5796.
Zhang, Z., Fenter, P., Cheng, L., Sturchio, N., Bedzyk, M., Predota, M., Bandura, A.,Kubicki, J., Lvov, S., Cummings, P., Chialvo, A., Ridley, M., Benezeth, P., Anovitz,L., Palmer, D., Machesky, M., Wesolowski, D., 2004. Ion adsorption at the rutile–water interface. Linking molecular and macroscopic properties. Langmuir 20,4954–4969.
2174 N. Devau et al. / Applied Geochemistry 24 (2009) 2163–2174

Publication N°5

Which Formalism to Model the pH and TemperatureDependence of the Microbiological Processes in Soils?Emphasis on Nitrification
E. Le Cadre & F. Gérard & S. Génermont & T. Morvan &
S. Recous
Received: 19 July 2007 /Accepted: 14 May 2008 /Published online: 5 July 2008# Springer Science + Business Media B.V. 2008
Abstract We compared three formalisms derived from (1)medical sciences, (2) environmental, and (3) agronomicmodels to simulate the effects of pH and temperature on thenitrification rate in arable soils. We evaluated these formal-isms by implementing them in a simple growth model bycomparing modelled and measured nitrate contents of soilsamples with different initial soil pH after incubation at twotemperatures. We found that the formalisms derived frommedical sciences were more accurate and easily adapted tothe data, suggesting that such formalisms may be profitablyused in agronomic or environmental models.
Keywords Microbial growth .Model . Formalisms .
Environment . Soil
1 Introduction
Modelling microbial growth kinetics is essential in manyfields for purposes such as waste management, medi-cine, food or environment sciences. In agronomic orenvironmental models, the Monod and exponentialgrowth models are commonly used to convert through
Environ Model Assess (2009) 14:539–544DOI 10.1007/s10666-008-9155-5
DO09155; No of Pages
E. Le CadreGrande Paroisse,12 place de l’Iris,92062 Paris La Défense, France
F. GérardINRA, UMR 1222, INRA-SUPAGRO Unité Biogéochimiedu Sol et de la Rhizosphère,place Viala, 34060 Montpellier, Francee-mail: [email protected]
S. GénermontINRA, UMR 1091, INRA INAPG,Unité Environnement et Grandes Cultures,BP 01, 78850 Thiverval-Grignon, Francee-mail: [email protected]
T. MorvanINRA, UMR 1069, INRA–Agrocampus Rennes Sols, Agronomie,Spatialisation, 65 route de St Brieuc, CS 84215,35042 Rennes, Francee-mail: [email protected]
S. RecousINRA, UR 1158, Unité d’Agronomie,rue Fernand Christ,02007 Laon, Francee-mail: [email protected]
Present address:E. Le Cadre (*)INRA, UMR 1222, INRA–SUPAGROUnité Biogéochimie du Sol et de la Rhizosphère,place Viala,34060 Montpellier, Francee-mail: [email protected]

a yield term the bacteria growth into a reaction rate.They both have their own formalisms to cope with theeffect of important environmental factors such as pH andtemperature.
In the Monod model, the pH dependence of bacterialgrowth is often described by using a modified halfsaturation constant (KS). In the exponential growth model,the growth rate is weighted by a coefficient (C) rangingfrom 0 to 1, with 0 corresponding to a minimal pH and 1to optimal pH for microbial growth. In these two models,KS and C are determined empirically. In the Monod andexponential models, the temperature dependence of thereaction rate is often calculated according to the Arrheniuslaw or its derivative, the van’t Hoff relationship (hereafterreferred to as the Q10 law). A wide range of coefficientsfor the Q10 law can be found for the same reaction. Thus,the choice of the Q10 coefficient can be an importantsource of prediction uncertainties. Some authors were alsodismissive of the application of the Q10 law to modelcomplex biological processes [5]. In food or medicalsciences, since the late 1980s, modellers have madeconsiderable efforts to predict modification of bacterialgrowth rate as a function of pH, temperature, and wateractivity [9, 18, 19]. They proposed different formalismsthan those previously presented herein which are based oncardinal parameters that explicitly take into account theminimal, maximal, and optimal values of pH andtemperature. Therefore, these formalisms seem morecomprehensive to account for the effect of pH andtemperature on bacterial growth.
From the above summary, it arises that manyempirical formalisms are available from different disci-plines to describe the same effects, but no comparison oftheir accuracy has been done so far. In agronomic orenvironmental research, the most frequently modelledmicrobial process is nitrification because of its impor-tance in plant nutrition, water quality, and greenhousegas emission. Considering the pH effect on nitrification,models using the Monod description of nitrifier growthare based on different KS values with a number ofassumptions, which make the approach somehow unreliable[16]. Other models based on the exponential description ofnitrifier growth use a coefficient which is usually deducedfrom quadratic [2] or linear [4] relationships. For the effect oftemperature, the value of Q10 was found to range from 2 to 5depending on the soil type [13]. The pH and temperatureformalisms developed in medical and food sciences are notyet used in models devoted to agronomic and environmentalapplications.
The aim of the present work is to assess thefeasibility and advantages of substituting the standardpH and temperature formalisms by those proposed in thefood and medical sciences. Our reference microbial
kinetics is the nitrification rate. We describe nitrifiergrowth by means of the exponential approach, and wetested (1) a cardinal pH and temperature formalismproposed by [11] and (2) an empirical formalismproposed by [4]. To broaden the scope of our study, wealso compared results of modelling performed with thepH and temperature formalism used in the Monodapproach for nitrifier growth [16].
2 Methodology
2.1 Model Descriptions
The changes in soil nitrate content with time are calculatedfrom the nitrifier growth kinetics and by introducing a specificyield constant Y (Eq. 1). Several assumptions are made withrespect to microbial growth. First, neither the lag phase ofgrowth nor the maintenance energy is taken into account.Second, all cells are assumed to be initially active. Third,nitrogen (N) availability is not a limiting factor, and pH andtemperature are considered as the only factors susceptible tomodify growth rate.
It follows that the changes in N–NO3− content vs. time
can be expressed as:
d N ! NO!3
! "
d t¼ Y
dmdt
ð1Þ
with:
d md t
¼ mactualm ð2Þ
where [N–NO3−] is the nitrate content (mg kg−1 soil), Y is the
specific yield constant (moles of N–NH4+ per cell, mol cell−1),
μactual is the nitrifier growth rate (h−1) calculated at a given pH
and temperature, and m is the number of nitrifiers perkilogram of soil (cell kg−1).
2.1.1 First Formalism: Cardinal pH and TemperatureFormalism
In this formalism, hereafter referred to as the CTPmodel, μactualis expressed as a function of μopt, which is the maximumgrowth rate observed at the optimum temperature (Topt) andpH (pHopt). This is done by weighting the value of μopt withtwo functions, f1 and f2. The exact expression for thesefunctions depends on the temperature and pH conditions.
If Tmin<T<Tmax and pHmin<pH<pHmax, one have:
mactual ¼ moptf1f2 ð3Þ
if T<Tmin or T>Tmax or pH<pHmin or pH>pHmax:
mactual ¼ 0 ð4Þ
540 E. Le Cadre et al.

and, if T=Topt and pH=pHopt:
mactual ¼ mopt" ð5Þ
with:
f1 ¼T % Tmaxð Þ T % Tminð Þ2
Topt % Tmin! "
Topt % Tmin! "
T % Topt! "
% Topt % Tmax! "
Topt þ Tmin % 2T! "# $ ð6Þ
f2 ¼pH % pHminð Þ pH % pHmaxð Þ
pH % pHminð Þ pH % pHmaxð Þ % pH % pHopt! "2 ð7Þ
where Tmax stands for the maximal temperature above whichno growth occurs, Tmin is the minimum temperature belowwhich no growth occurs. The values of pHmax and pHmin arethe maximum and minimum pH for growth to occur.
2.1.2 Second Formalism: A Linear Relationship for pHand Q10
Two relationships have been proposed by [4] to account forthe influence of the pH (function f3) and temperature(function f4) on the growth rate:
mactual ¼ moptf3f4 ð8Þ
with:
f3 ¼ S pH % pHminð Þ ð9Þ
f4 ¼ QT%Tref
10ð Þ10
ð10Þ
The f3 function ranges from 0 to 1, with μactual=0 if pH<pHmin, and S is an experiment-derived factor. Concerningf4, T, and Tref are the actual and reference temperature,respectively.
2.1.3 Third Formalism: A Monod Approach
In this last method, the influence of the pH on the growthrate is described through an inhibition enzyme-likeexpression [16]:
mactual ¼ moptN % NHþ
4
# $
KS f5 þ N % NHþ4
# $ !
f6 ð11Þ
with:
f5 ¼ 1þ 10%pH
KI
% &ð12Þ
f6 ¼ QT%Tref
10ð Þ10
ð13Þ
where KI and KS (mol H+ l−1) are half saturation constantsthat cope with the presence and absence of H+ inhibition,respectively. For f6, the Q10 relationship is also used, as inthe second formalism (see Eq. 10).
We calculated μactual and inserted the result in theexponential growth model (see Eq. 2) to be compared withthe growth rates calculated by means of the two otherformalisms.
2.2 Model Parameters
We calculated the nitrification rate and biomass over time(see Eqs. 1 and 2) by using values for Y and μopt specific tothe Nitrosomonas species, which is one of the most commonbacterium in arable soils [1]. A value of 1.05×10¹¹ molcell−1 was taken for Y [8]. We set the optimum growth rate,μopt, to 0.036 h−1 [1]. The initial value of the biomassdensity (m) was fixed at 2×10⁸ cells kg−1 soil [16].
Different parameters are required depending on thetested formalism. In the CTP model, we set the optimumvalue for Nitrosomonas growth at pH 8 [8, 15]. Inaccordance with [14, 17], we used a minimum pH valueof 4.5. Considering these values and a symmetricbell-shaped relationship between pH and growth [2], wecalculated that the maximum pH for nitrification was11.5.
In the second formalism [4], the minimum pH was also setat 4.5, and the value of S at 0.3. This latter formalism doesnot require maximum or optimum pH as input parameters.For the last formalism (Monod approach), authors [16]estimated pKI to 6.3, with pKI=−logKI. The KS value forNitrosomonas was 2.08 mg N–NH4
+ l−1 (soil solution).For temperature, we chose Topt and Tref of 30°C [7] and
20°C, respectively (see Eqs. 6 and 10). In the CTP model of[11], the maximum and minimum temperatures werederived from the generic relationships determined by [12].We calculated Tmin=−1°C and Tmax=36°C. In the two otherformalisms, the Q10 value was set to 2.5 as an average ofQ10 values found in the literature.
Formalism to model microbiological processes in soils 541

2.3 Simulation and Validation Dataset
For validation purposes, we selected two datasets from theliterature [6, 10] and presented hereafter. Six differentarable soils, three slightly alkaline (pH about 7.9) and threeacid (pH about 5.6) soils, were sampled in northern andwestern France, from the 0–10 cm and 0–20 cm layers. Soilsamples were 2-mm moist sieved and incubated at 10°C(alkaline soils) and 15°C (acid soils) after addition ofammonium, either as ammonium sulfate or diammoniumphosphate and at two different concentrations (50 or100 mg N kg−1). Soil water content was carefullymaintained during incubation at a value of pF 2.7. In these
experiments, changes in the soil nitrate content over timewere analyzed at 0, 2, and 6 days for alkaline soils and at 0,3, and 7 days for acid soils.
Equations presented above were solved explicitly ona daily timestep over 7 days. Simulation ended whenN–NH4
+ concentration fell below 7 mg kg−1 soil.Feedback effects of pH variations subsequent to nitrifi-cation were not taken into account because, in theselected soils, no consequent pH variations were mea-sured (around 0.5 pH unit). The simulated N–NO3
−
contents were compared to measured values using thesoftware Statistica®, (Statsoft Inc, version 7.1, Tulsa,OK).
0
20
40
60
80
100
120
140
0 2 4 6 8 10 12
days
[NO
3- - N
] con
cent
ratio
n (m
g.kg
-1)
CTPMonodMc Innes & Fillerymeasures
Fig. 2 Modelled nitrate concen-tration (mg kg−1) over timecalculated according to the threeformalisms. Example given inacid soils. Black squares: meas-ures; diamonds: CTP; squares:Monod; triangles: McInnes andFillery [4]
Y CTP = 0.926x + 0.98, R2 = 0.88
Y Mc Innes & Fillery= 1.481x - 4.80, R2 = 0.95
Y Monod = 1.052x + 33.68, R2 = 0.44
0
20
40
60
80
100
120
140
0 20 40 60 80 100 120 140
[NO
3- -N] m
odel
led
(mg
kg-1
)
[NO3- -N] measured (mg kg-1)
CTP
Monod
Mc Innes and Fillery
1 : 1
Fig. 1 Comparison of modelledand measured N–NO3
− concen-trations (mg kg−1) for the acidsoils (oversized labels) and al-kaline soils (minor-sized labels)and for the three formalismstested in the study. Diamondlabels: CTP; square labels:Monod; triangle labels:McInnes and Fillery [4]
542 E. Le Cadre et al.

3 Results and Discussion
Results showed that the CTP model was the most accurateformalism to describe the nitrification rate over the entiredataset (Fig. 1).
Indeed, the correlation between modelled and measuredNO3
− contents was good (R2=0.88) and the linear regressionparameters were close to the 1:1 isoline representing the bestfit ([N–NO3
−]modelled=0.98+0.926 [N–NO3−]measured). The
second formalism, proposed by [4], showed a smallerdispersion (R2=0.95) but the regression parameters deviatedconsiderably from the 1:1 isoline ([N–NO3
−]modelled=−4.80+1.481 [N–NO3
−]measured). The linear regression curveobtained from the third formalism ([N–NO3
−]modelled=33.68+1.052 [N–NO3
−]measured) was far from the 1:1 and thedispersion was high (R2=0.44).
Taking into account the confidence limits of the linearregressions (p<0.05), we observed that the CTP formalismtended to slightly underestimate the nitrate content after7 days in the three acid soils (oversized symbols) and inone alkaline soil at day 6 (minor-sized symbols). The CTPformalism also slightly overestimated the nitrate content forthe two other alkaline soils at day 6 (Fig. 1, see minor-sizedsymbols). Using the second formalism, the simulatedvalues fell within the confidence interval of the linearregression during the first simulation days (<4 days)whatever the soil pH. The discrepancy associated with thethird formalism was substantial as the isoline is notcontained within the confidence limits of the respectivelinear regression. In this latter formalism, the simulatednitrification ceased from day 4, explaining the alignment ofdata points along the x-axis (Fig. 2).
The third formalism tended to clearly underestimate thecombined effect of the soil pH and temperature on bacteriagrowth for our dataset.
By calculating the values taken by the functions f2, f3, and f5involved in the different formalisms, we found that the latterfunction is less sensitive to pH variations. In none of thesimulations and for all formalisms, the feedback effect of soilacidification by nitrifiers is taken into account, yet this shouldexplain the errors in simulations after longer incubation times(6 to 10 days). The accuracy of the modelling differs within agiven group of soils (i.e., acid or alkaline) as depicted inFig. 1. Different explanations might account for this discrep-ancy, but the most probable is the existence of differentamounts of nitrifiers (initial biomass, m0) in the different soils,due to the history of the sampled field.
The three formalisms tested here require a knowledge ofseveral parameters. In the CTP formalism, six parametersare involved (pHmin, pHopt, pHmax, Tmin, Tmax, and Topt). Toreduce the number of parameters, we used the relationshipproposed by [12]. For this, two parameters (Tmin and Tmax)are obtained from Topt. Finally, the CTP formalism needs
only four parameters to be estimated. The two otherformalisms, i.e., McInnes and Fillery and Monod-like,required three parameters which were not so different fromthe CTP formalism. Moreover, the four remaining parametersin the CTP formalism are as simple to acquire as thoseinvolved in the other two formalisms. Note that the function f1increases slowly from Tmin up to 15°C and more rapidly untilTopt and finally sharply decreases to Tmax. Authors observedthe same pattern of nitrification rates in acid soils [3]. TheQ10 law cannot account for this pattern. However, all of theaforementioned formalisms are quite empirical, because theyare based more or less by mathematical data fit of observedgrowth, especially when it comes to dealing with pH.
Since CTP better describes the physiological responsesof bacteria to pH and temperature in our conditions anduses easily estimated parameters, we believe that the CTPformalism can be used to correct the microbial growth insoils for pH and temperature variations. Therefore, advan-ces in food or medical microbiology should be a source ofimprovement for microbiologically mediated processessimulated in agronomic and environmental models.
Acknowledgments Support for this research was provided by GrandeParoisse S.A., France. We wish to thank M. Pr. F.P. Flandrois for hishelpful discussions about microbial models in medical sciences.
References
1. Belser, L. W., & Schmidt, E. L. (1980). Growth and kinetics ofthree genera ammonium oxidizers nitrifiers. FEMS MicrobiologyLetters, 7, 213–216.
2. Darrah, P. R., White, R. E., & Nye, P. H. (1986). Simultaneousnitrification and diffusion in soil. V. The effects of pH change,following the addition of ammonium sulphate, on the activity ofnitrifiers. Journal of Soil Science, 37, 479–484. doi:10.1111/j.1365-2389.1986.tb00379.x.
3. Hayatsu, M., & Kosuge, N. (1993). Autotrophic nitrification inacid tea soils. Journal of Plant Nutrition and Soil Science, 39,209–217.
4. McInnes, R. J., & Fillery, I. R. P. (1989). Modelling and fieldmeasurements of the effect of nitrogen source on nitrification. SoilScience Society of America Journal, 53, 1264–1269.
5. McMeekin, T. A., Olley, J., Ratkowsky, D. A., & Ross, T. (2002).Predictive microbiology: towards the interface and beyond.International Journal of Food Microbiology, 73, 395–407doi:10.1016/S0168-1605(01)00663-8.
6. Morvan, T. (1999). Quantification et modélisation des flux d’azoterésultant de l'épandage de lisier, Unpublished thesis. Unpublishedthesis, Université Paris 6, Paris.
7. Myers, R. J. K. (1975). Temperature effects on ammonificationand nitrification in a tropical soil. Soil Biology & Biochemistry, 7,83–86. doi:10.1016/0038-0717(75)90003-6.
8. Prosser, J. (1989). Autotrophic nitrification in bacteria. Advancesin Microbial Physiology, 30, 125–181 doi:10.1016/S0065-2911(08)60112-5.
9. Ratkowsky, D. A., Olley, J., McMeekin, T. A., & Ball, A. (1982).Relationships between temperature and growth rate of bacteriacultures. Journal of Bacteriology, 149, 565–568.
Formalism to model microbiological processes in soils 543

10. Recous, S., Mary, B., & Faurie, G. (1990). Microbial immobi-lization of ammonium and nitrate in cultivated soils. SoilBiology & Biochemistry, 22, 913–922. doi:10.1016/0038-0717(90)90129-N.
11. Rosso, L., Lobry, J. R., Bajard, S., & Flandrois, J. P. (1995).Convenient model to describe the combined effects of temperatureand pH on microbial growth. Applied and EnvironmentalMicrobiology, 61, 610–616.
12. Rosso, L., Lobry, J. R., & Flandrois, J. P. (1993). An unexpectedcorrelation between cardinal temperatures of microbial growthhighlighted by a new model. Journal of Theoretical Biology, 162,447–463 doi:10.1006/jtbi.1993.1099.
13. Russell, C. A., Fillery, I. R. P., Bootsma, N., & McInnes, K. J.(2002). Effect of temperature and nitrogen source on nitrificationin a sandy soil. Communications in Soil Science and PlantAnalysis, 33, 1975–1989. doi:10.1081/CSS-120004836.
14. Sarathchandra, S. V. (1978). Nitrification activities and the pHchanges in the population of nitrifying bacteria in soil perfused attwo different H-ion concentration. Plant and Soil, 50, 99–111.doi:10.1007/BF02107160.
15. Suzuki, I., Dular, U., & Kwok, S. (1974). Ammonia orammonium ion as substrate for oxidation by Nitrosomonaseuropea cells and extracts. Journal of Bacteriology, 120, 556–558.
16. Venterea, R. T., & Rolston, D. E. (2002). Mechanisms andkinetics of nitric and nitrous oxide production during nitrificationin agricultural soil. Global Change Biology, 6, 303–316.doi:10.1046/j.1365-2486.2000.00309.x.
17. Weber, D. F., & Gainey, P. L. (1962). Relative sensitivity ofnitrifying organisms to hydrogen ions in soil and solutions. SoilScience, 94, 138–145. doi:10.1097/00010694-196209000-00002.
18. Witjes, T., Rombouts, F. M., Kant-Muermans, M. L. T., van’t Riet,K., & Zwietering, M. H. (2001). Development and validation of acombined temperature, water activity, pH model for bacteriagrowth rate of Lactobacillus curvatus. International Journal ofFood Microbiology, 63, 57–64 doi:10.1016/S0168-1605(00)00401-3.
19. Zwietering, M. H., Jongenburger, I., Rombouts, F. M., & van’tRiet, K. (1990). Modeling of the bacterial growth curve. Appliedand Environmental Microbiology, 56, 1875–1881.
544 E. Le Cadre et al.