Combined use of chemical, biochemical and physiological variables in mussels for the assessment of...
14
This article appeared in a journal published by Elsevier. The attached copy is furnished to the author for internal non-commercial research and education use, including for instruction at the authors institution and sharing with colleagues. Other uses, including reproduction and distribution, or selling or licensing copies, or posting to personal, institutional or third party websites are prohibited. In most cases authors are permitted to post their version of the article (e.g. in Word or Tex form) to their personal website or institutional repository. Authors requiring further information regarding Elsevier’s archiving and manuscript policies are encouraged to visit: http://www.elsevier.com/authorsrights
-
Upload
independent -
Category
Documents
-
view
0 -
download
0
Transcript of Combined use of chemical, biochemical and physiological variables in mussels for the assessment of...

This article appeared in a journal published by Elsevier. The attachedcopy is furnished to the author for internal non-commercial researchand education use, including for instruction at the authors institution
and sharing with colleagues.
Other uses, including reproduction and distribution, or selling orlicensing copies, or posting to personal, institutional or third party
websites are prohibited.
In most cases authors are permitted to post their version of thearticle (e.g. in Word or Tex form) to their personal website orinstitutional repository. Authors requiring further information
regarding Elsevier’s archiving and manuscript policies areencouraged to visit:
http://www.elsevier.com/authorsrights

Author's personal copy
Combined use of chemical, biochemical and physiological variables inmussels for the assessment of marine pollution along the N-NWSpanish coast
Juan Bellas a,*, Marina Albentosa b, Leticia Vidal-Liñán c, Victoria Besada a,M. Ángeles Franco a, José Fumega a, Amelia González-Quijano a, Lucía Viñas a,Ricardo Beiras c
aCentro Oceanográfico de Vigo, Instituto Español de Oceanografía, IEO, Subida a Radio Faro, 50, 36390 Vigo, SpainbCentro Oceanográfico de Murcia, Instituto Español de Oceanografía, IEO, Varadero, 1, 30740 San Pedro del Pinatar, Spainc ECIMAT, Universidade de Vigo, IIla de Toralla, 36331 Vigo, Galicia, Spain
a r t i c l e i n f o
Article history:Received 31 July 2013Received in revised form13 September 2013Accepted 20 September 2013
Keywords:Marine pollutionBiological effectsIntegrative assessmentScope for growthBiomarkerConfounding factorsMytilus galloprovincialis
a b s t r a c t
This study undertakes an overall assessment of pollution in a large region (over 2500 km of coastline) ofthe N-NW Spanish coast, by combining the use of biochemical (AChE, GST, GPx) and physiological (SFG)responses to pollution, with chemical analyses in wild mussel populations (Mytilus galloprovincialis). Theapplication of chemical analysis and biological techniques identified polluted sites and quantified thelevel of toxicity. High levels of pollutants were found in mussel populations located close to major citiesand industrialized areas and, in general, average concentrations were higher in the Cantabrian than inthe Iberian Atlantic coast. AChE activities ranged between 5.8 and 27.1 nmol/min/mg prot, showinginhibition in 12 sampling sites, according to available ecotoxicological criteria. GST activities rangedbetween 29.5 and 112.7 nmol/min/mg prot, and extreme variability was observed in GPx, showing ac-tivities between 2.6 and 64.5 nmol/min/mg prot. Regarding SFG, only 5 sites showed ‘moderate stress’(SFG value below 20 J/g/h), and most sites presented a ‘high potential growth’ (>35 J/g/h) correspondingto a ‘healthy state’. Multivariate statistical techniques applied to the chemical and biological dataidentified PCBs, organochlorine pesticides and BDEs as the main responsible of the observed toxicity.However, the alteration of biological responses caused by pollutants seems to be, in general, masked bybiological variables, namely age and mussel condition, which have an effect on the mussels’ response topollutant exposure.
� 2013 Elsevier Ltd. All rights reserved.
1. Introduction
Mussels, such as Mytilus spp., have been extensively used assentinel species of pollution in marine coastal monitoring pro-grams. These are sessile filter-feeding organisms which tend toaccumulate chemical pollutants in their tissues at higher concen-trations than the surrounding environment, providing geographicalpatterns of the bioavailable fraction of pollutants, and contributingto the identification of temporal trends in coastal pollution (e.g.Widdows et al., 1995; Sericano et al., 1995; Bellas et al., 2011a).
The recent European legislation for the protection of the marineenvironment, in particular the Marine Strategy Framework
Directive (MFSD, 2008/56/EC), demands an approach based notonly on the analytical chemistry of pollutants, but also on evalu-ating their effects on the ecosystems. In fact, MSFD’s descriptor 8indicates that to achieve the good environmental status (GES), ‘theconcentrations of contaminants [should be] at levels not giving riseto pollution effects’. Also, the Commission Decision (2010/477/EU) oncriteria and methodological standards on good environmental statusof marine waters emphasizes the need to evaluate and keep withinacceptable limits the biological effects of contaminants. Therefore,in order to meet these requirements, it is crucial that current ma-rine pollution surveillance programs include the integrated use ofboth chemical analysis of pollutants in different environmentalcompartments and biological techniques, to establish the link be-tween pollutant levels and their harmful effects on marine eco-systems, a topic which has long been considered to be poorlyunderstood (e.g. OSPAR Commission, 2012a; ICES, 2012). This is a
* Corresponding author. Tel.: þ34 986 492111; fax: þ34 986 498626.E-mail address: [email protected] (J. Bellas).
Contents lists available at ScienceDirect
Marine Environmental Research
journal homepage: www.elsevier .com/locate/marenvrev
0141-1136/$ e see front matter � 2013 Elsevier Ltd. All rights reserved.http://dx.doi.org/10.1016/j.marenvres.2013.09.015
Marine Environmental Research 96 (2014) 105e117

Author's personal copy
difficult task, since the relationship between pollutant concentra-tions present in the environment and their ecological impact is notstraightforward, and the mere presence of pollutants in water orsediments does not imply that they are bioavailable and that theyproduce adverse effects on living organisms (e.g. Long et al., 1995;His et al., 1999).
There is a wide variety of biological responses that can poten-tially be used to evaluate the effects of pollutants on marine eco-systems. The biological effects measured must fulfil certainrequirements: sensitivity to pollution, ecological relevance, repro-ducibility and reliability, simple standardization and cost-effectiveness (Calow, 1993; Oikari et al., 1993). These biologicalresponses may occur at different levels of biological organization.Among them, biomarkers may be defined as quantitative mea-surements of changes occurring at cellular, biochemical, molecular,or physiological levels, which can be measured in cells, body fluids,tissues or organs within an organism and that may be indicative ofxenobiotic exposure and/or effect (McCarthy and Shugart, 1990;Lam and Gray, 2003; Allen and Moore, 2004). Some biomarkershave been incorporated into environmental monitoring programs(ANZECC, 1992; UNEP, 1997; EVS and PLA, 1998; USEPA, 2000;OSPAR Commission, 2012a).
The measurement of enzymatic activities in marine organisms,including bivalves, have been widely used as biomarkers of oxida-tive stress caused by exposure to pollutants (gluthatione S-trans-ferases -GST-, glutathione peroxidase-GPx-) or as diagnosticbiomarkers of neurotoxic damage (acetylcholinesterase-AChE-)(Bocquené and Galgani, 1990; Regoli, 1998; Vidal-Liñán and Bellas,2013). GST are phase II (conjugation) enzymes involved in thedetoxification of organic xenobiotics such as PAHs, PCBs andmetals, both in fish and invertebrates, and also play a relevant rolein protection against oxidative stress (Sheehan et al., 2001). GPxprotect cells against the deleterious effects of oxyradical generationby maintaining endogenous reactive oxygen species at relativelylow levels and attenuating the damages related to their highreactivity (Livingstone et al., 1990). Acetylcholinesterase (AChE)regulates cholinergic nervous transmission by hydrolysis of theneurotransmitter acetylcholine. However, in presence of certainpollutants AChE activity is inhibited and causes the alteration of thenerve impulse (Rickwood and Galloway, 2004.). Regarding physi-ological biomarkers, the measurement of potential somatic andgonadal growth, has also achieved an advanced level of develop-ment. The Scope for Growth (SFG) is a biological tool that involvesthe calculation of the energy available in the organisms for growthunder laboratory standardized conditions. This method has beensuccessfully used as a measure of the stress caused by toxicants inmarine organisms (Widdows et al., 2002;Widdows and Staff, 2006;Albentosa et al., 2012).
The Joint Assessment and Monitoring Programme (JAMP, OSPARCommission) establishes that the following hazardous substances:metals (Hg, Cd, Pb), polycyclic aromatic hydrocarbons (PAHs), poly-brominated diphenyl ethers (PBDEs), polychlorinated biphenyls(PCBs) and organochlorinated pesticides: dichlorodiphenyl tri-chloroethane (DDT) and its metabolites, a- and g-hexa-chlorocyclohexane (a- and g-HCH), should be measured asmandatory determinants in marine pollution surveillance programs.
This study, carried out within the framework of the JAMP(OSPAR Commission), deals with the integrative assessment ofpollution in a large region (over 2500 km of coastline) of the N-NWIberian Peninsula. Since 1990, temporal trend studies of pollutantsaccumulated in mussel tissues are being carried out on a yearlybasis, in 20 sampling sites from this area (Spanish Marine Pollutionmonitoring program, SMP), introducing the study of biomarkers in2007 survey (Albentosa et al., 2012). The present survey (year2010), corresponds to the quinquennial spatial distribution studies
that are being carried out in 40 sampling sites, with the addedobjective of incorporating new (biochemical) biomarkers. Thesampling area, located within OSPAR Region IV (OSPARCommission, 2010), includes two different oceanographic regions,the Iberian Atlantic coast and the Cantabrian coast, in the Bay ofBiscay, characterized by different hydrographical, biogeochemicaland biological processes. The Iberian Atlantic coast is more pro-ductive than the Cantabrian area because the former is consideredas the northern limit of the upwelling system associated to theEastern North Atlantic anticyclonic gyre, which causes the uplift ofnutrient rich subsurfacewaters into the euphotic layer, promoting ahigh primary productivity in these waters (Álvarez et al., 2011).Within this coast, Galician Rías are complex and productive eco-systems, rich in living resources, which support high biodiversity(Gómez-Gesteira et al., 2011).
In the present study, biological responses were used in combi-nation with chemical analyses in wild mussel populations (Mytilusgalloprovincialis). The main goal of our work was to provide anoverall assessment of the coastal pollution in a large extension ofthe N-NW Spanish coast, with an intensive sampling effort (40sites), by combining the study of chemical, biochemical and phys-iological variables in wild mussel populations.
2. Materials and methods
2.1. Sampling
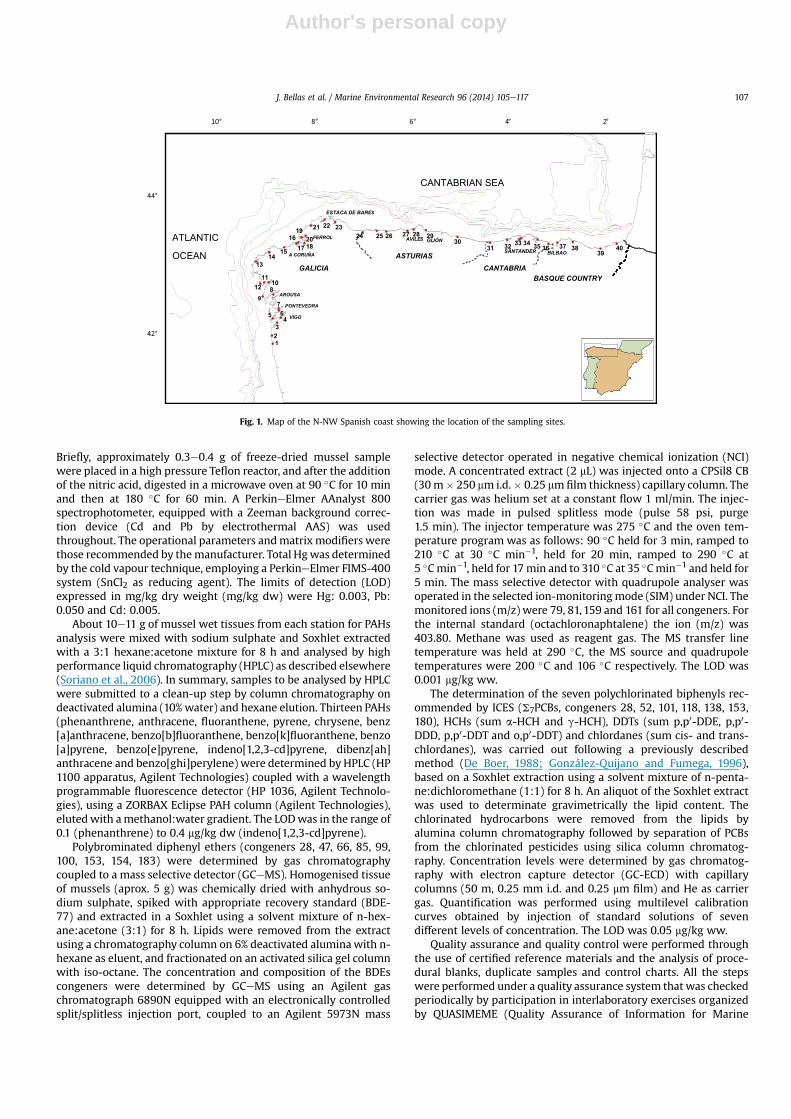
Fig. 1 shows the geographical situation of the 40 sampling sitesconsidered for the spatial distribution studies of the SMP along theN-NW Spanish Atlantic coast. Sampling sites were chosen on thebasis of their accessibility and availability of wild mussel pop-ulations, after a detailed study of their particular characteristics(pollution sources, presence of industrial areas, large cities, etc).
Mussels from 4 to 6 cm were collected during low tide inNovember 2010, when they present a more stable physiologicalstate in this area (Villalba, 1995; Cáceres-Martínez and Figueras,1998). Fifty mussels intended for chemical analyses and 30 mus-sels intended for physiological measurements were transported inan ice-box to the laboratory. Gills from 25 mussels intended forbiochemical analyses were dissectedwithin 2 h of collection, frozenin liquid nitrogen and stored at �80 �C until analysis.
2.2. Biometric measurements
Condition index (CI) was calculated as the ratio: (soft tissue dryweight/shell dry weight) � 100 (Lucas and Beninger, 1985). The dryweight of shells and soft tissues was recorded after drying at 105 �Cuntil constant weight. Mussel’s age was determined indirectly us-ing measurements of the average shell mass per unit area (Griffinet al., 1980), which has been shown to give a good indication ofthe relative age of bivalves (Frew et al., 1989; Yap et al., 2003). Shellthickness (ST) may be expressed as: (shell weight/2)/(shelllength � shell height), according to Yap et al. (2003). Length wasrecorded as the distance from the umbo to the opposite shellmargin and height was considered as the perpendicular to thelength line. A gill index (GI) was calculated as follows: GI ¼ (gilltissue dry weight/soft tissue dry weight) � 100. Lipids weredetermined gravimetrically after Soxhlet extraction with a solventmixture of n-pentane:dichloromethane (1:1) for 8 h (González-Quijano and Fumega, 1996).
2.3. Chemical analysis
Samples for metals analyses were digested with nitric acid(Suprapur, Merck) in a microwave oven (Besada et al., 2011a).
J. Bellas et al. / Marine Environmental Research 96 (2014) 105e117106
Author's personal copy
Briefly, approximately 0.3e0.4 g of freeze-dried mussel samplewere placed in a high pressure Teflon reactor, and after the additionof the nitric acid, digested in a microwave oven at 90 �C for 10 minand then at 180 �C for 60 min. A PerkineElmer AAnalyst 800spectrophotometer, equipped with a Zeeman background correc-tion device (Cd and Pb by electrothermal AAS) was usedthroughout. The operational parameters andmatrix modifiers werethose recommended by themanufacturer. Total Hgwas determinedby the cold vapour technique, employing a PerkineElmer FIMS-400system (SnCl2 as reducing agent). The limits of detection (LOD)expressed in mg/kg dry weight (mg/kg dw) were Hg: 0.003, Pb:0.050 and Cd: 0.005.
About 10e11 g of mussel wet tissues from each station for PAHsanalysis were mixed with sodium sulphate and Soxhlet extractedwith a 3:1 hexane:acetone mixture for 8 h and analysed by highperformance liquid chromatography (HPLC) as described elsewhere(Soriano et al., 2006). In summary, samples to be analysed by HPLCwere submitted to a clean-up step by column chromatography ondeactivated alumina (10%water) and hexane elution. Thirteen PAHs(phenanthrene, anthracene, fluoranthene, pyrene, chrysene, benz[a]anthracene, benzo[b]fluoranthene, benzo[k]fluoranthene, benzo[a]pyrene, benzo[e]pyrene, indeno[1,2,3-cd]pyrene, dibenz[ah]anthracene and benzo[ghi]perylene) were determined by HPLC (HP1100 apparatus, Agilent Technologies) coupled with a wavelengthprogrammable fluorescence detector (HP 1036, Agilent Technolo-gies), using a ZORBAX Eclipse PAH column (Agilent Technologies),elutedwith amethanol:water gradient. The LODwas in the range of0.1 (phenanthrene) to 0.4 mg/kg dw (indeno[1,2,3-cd]pyrene).
Polybrominated diphenyl ethers (congeners 28, 47, 66, 85, 99,100, 153, 154, 183) were determined by gas chromatographycoupled to a mass selective detector (GCeMS). Homogenised tissueof mussels (aprox. 5 g) was chemically dried with anhydrous so-dium sulphate, spiked with appropriate recovery standard (BDE-77) and extracted in a Soxhlet using a solvent mixture of n-hex-ane:acetone (3:1) for 8 h. Lipids were removed from the extractusing a chromatography column on 6% deactivated aluminawith n-hexane as eluent, and fractionated on an activated silica gel columnwith iso-octane. The concentration and composition of the BDEscongeners were determined by GCeMS using an Agilent gaschromatograph 6890N equipped with an electronically controlledsplit/splitless injection port, coupled to an Agilent 5973N mass
selective detector operated in negative chemical ionization (NCI)mode. A concentrated extract (2 mL) was injected onto a CPSil8 CB(30m� 250 mm i.d.� 0.25 mm film thickness) capillary column. Thecarrier gas was helium set at a constant flow 1 ml/min. The injec-tion was made in pulsed splitless mode (pulse 58 psi, purge1.5 min). The injector temperature was 275 �C and the oven tem-perature program was as follows: 90 �C held for 3 min, ramped to210 �C at 30 �C min�1, held for 20 min, ramped to 290 �C at5 �Cmin�1, held for 17min and to 310 �C at 35 �Cmin�1 and held for5 min. The mass selective detector with quadrupole analyser wasoperated in the selected ion-monitoringmode (SIM) under NCI. Themonitored ions (m/z) were 79, 81,159 and 161 for all congeners. Forthe internal standard (octachloronaphtalene) the ion (m/z) was403.80. Methane was used as reagent gas. The MS transfer linetemperature was held at 290 �C, the MS source and quadrupoletemperatures were 200 �C and 106 �C respectively. The LOD was0.001 mg/kg ww.
The determination of the seven polychlorinated biphenyls rec-ommended by ICES (S7PCBs, congeners 28, 52, 101, 118, 138, 153,180), HCHs (sum a-HCH and g-HCH), DDTs (sum p,p0-DDE, p,p0-DDD, p,p0-DDT and o,p0-DDT) and chlordanes (sum cis- and trans-chlordanes), was carried out following a previously describedmethod (De Boer, 1988; González-Quijano and Fumega, 1996),based on a Soxhlet extraction using a solvent mixture of n-penta-ne:dichloromethane (1:1) for 8 h. An aliquot of the Soxhlet extractwas used to determinate gravimetrically the lipid content. Thechlorinated hydrocarbons were removed from the lipids byalumina column chromatography followed by separation of PCBsfrom the chlorinated pesticides using silica column chromatog-raphy. Concentration levels were determined by gas chromatog-raphy with electron capture detector (GC-ECD) with capillarycolumns (50 m, 0.25 mm i.d. and 0.25 mm film) and He as carriergas. Quantification was performed using multilevel calibrationcurves obtained by injection of standard solutions of sevendifferent levels of concentration. The LOD was 0.05 mg/kg ww.
Quality assurance and quality control were performed throughthe use of certified reference materials and the analysis of proce-dural blanks, duplicate samples and control charts. All the stepswere performed under a quality assurance system that was checkedperiodically by participation in interlaboratory exercises organizedby QUASIMEME (Quality Assurance of Information for Marine
Fig. 1. Map of the N-NW Spanish coast showing the location of the sampling sites.
J. Bellas et al. / Marine Environmental Research 96 (2014) 105e117 107

Author's personal copy
Environmental Monitoring in Europe) Laboratory PerformanceStudies (QUASIMEME, 2010), and IAEA (International Atomic En-ergy Agency) (Wyse et al., 2003).
Pollutant concentrations in mussel tissues were compared withavailable environmental quality criteria. OSPAR Commission hasdeveloped assessment criteria for the interpretation of chemicalpollution data: Background Assessment Concentrations (BACs) andEnvironmental Assessment Criteria (EACs). BACs describe thethreshold value for the background level, using data from referencesites, and EACs indicate pollutant concentrations below which nochronic effects are expected to occur in marine species, includingthe most sensitive species (OSPAR Commission, 2009). Since EACshave not been agreed for metals, the European Union food standardlimits from Commission Regulation (EC) No. 1881/2006 have beenproposed as an alternative (OSPAR Commission, 2010). Also, theNorwegian Pollution Control Authority established a classificationsystem of pollutants in bluemussel to assess the degree of pollutionin coastal areas, using five categories ranging from Class I, ‘insig-nificantly polluted’, to Class V ‘extremely polluted’ (Green et al.,2012).
A chemical pollution index (CPI) was calculated for each site, tosummarize the chemical data, as the average of the ratios betweenthe pollutant concentrations (C) in each site and the correspondingenvironmental quality criterion (Ccrit) for each analyte (Bellas et al.,2011b; Beiras et al., 2012): CPI ¼ P
i[log(Ci/Ccriti)]. OSPAR BAC(OSPAR Commission, 2010) was used for PCBs, the environmentalquality standard (EQS) in biota proposed by the European Com-mission was used for BDEs (OSPAR Commission, 2012b), and theNorwegian level I (Green et al., 2012) for the other pollutants.
2.4. Biological responses
GST and GPx were analysed in the gills of 12 mussels, whichwere homogenized with an Ultra-Turrax, at 1:2 w/v ratio, in 0.05 Mpotassium-phosphate buffer at pH 7.5 containing 2 mM EDTA.Samples were centrifuged at 15,000 � g for 15 min at 4e7 �C. Forthe analysis of AChE activity, the gills of 12 mussels were weighedand homogenized with a Potter glass homogenizer at a 1:2 w/vratio, in 0.02 M phosphate buffer at pH 7.0 with 0.1% Triton X-100and centrifuged at 10,000�g for 10 min at 4 �C. Aliquots of thesupernatant were utilized for the spectrophotometric determina-tion of activity of the enzymes GST, GPx and AChE with an absor-bancemicroplate reader (Biotek ELx 808) at a constant temperatureof 20 �C.
GST activities were evaluated, according to Habig et al. (1974),using 1-chloro-2,4-dinitrobenzene (CDNB) as substrate. The mea-surement was carried out at 340 nm (extinction coefficient,ε¼ 9.6 mM�1 cm�1) in 0.1 M potassium-phosphate buffer at pH 6.5,60 mM CDNB and 10 mM GSH. GPx activity was measured in acoupled enzyme systemwhere NADPH is consumed by glutathionereductase to convert the formed oxidized glutathione form (GSSG)to its reduced form (GSH), according to Halliwell and Gutteridge(1999). The decrease of absorbance was monitored at 340 nm(ε ¼ 5.598 mM�1 cm�1) in 0.1 M potassium-phosphate buffer at pH6.5, 10 mM sodium azide (NaN3), 40 mM GSH, 20 unit/ml gluta-thione reductase, 2.4 mM NADPH and 2 mM hydrogen peroxide assubstrate. The activity of AChE was spectrophotometrically deter-mined, as described in Bocquené and Galgani (1998), by measuringthe increase in absorbance of the sample at 412 nm in the presenceof 2.6mM acetylthiocholine as substrate and 0.5mM5,50-dithiobis-2-dinitrobenzoic acid.
Protein concentrations in the supernatants were measured ac-cording to Lowry et al. (1951) by using bovine serum albumin asstandard. All the enzymatic activities were expressed as nmol/min/mg protein.
Scope for Growth (SFG) measurements were carried out in anopen-flow system according to Widdows and Staff (2006), withmodifications detailed in Albentosa et al. (2012), under thefollowing conditions: 1 mg total particulate matter/L, with anorganic content of 50%. This diet was obtained by mixing micro-algae (Isochrysis galbana, clone T-ISO) with ashed (800 �C) andfiltered (40 mm) marine sediment. Physiological rates were deter-mined at constant temperature (15 � 0.5 �C), in an open-flowsystem, with constant food supply. Clearance and ingestion rates,absorption efficiency, absorption rates, and respiration rates weremeasured. SFG was calculated from the energy balance equationaccording to this expression: (SFG ¼ (I � F) � R ¼ (I � AE) � R),where ‘I’ is the consumption of the energy available in the diet, ‘F’ isthe energy lost in the faeces, ‘AE’ is the absorption efficiency, and ‘R’is the energy consumed by respiration. All physiological measure-ments were expressed in energetic units (J/h).
An Integrated Biomarker Response (IBR) was calculated ac-cording to Beliaeff and Burgeot (2002), by combining the differentbiochemical (GST, GPx, AChE) and physiological (RR, IR, AR) vari-ables to a single value, which can be used to describe the toxicallyinduced stress level of populations in different stations. IBR wascalculated by means of star plots of the biomarker data. Star plotswere used to represent the scores (standardized data) of the above-mentioned biomarkers for each site. IBR index is the star plot area.
2.5. Statistical analysis
Principal Component Analysis (PCA) and Pearson correlationanalysis were applied to compare and establish relationships be-tween biological and chemical variables. PCA was used to obtain areduced number of new variables (principal components), thatresult from the linear combinations of the original variables, andallows to select the most relevant variables in the data set with theminimum loss of information. According to Peterson (2000) a factorloading �0.32, corresponding to an explained average variance of56.6%, is recommended. For this study a threshold factor loading of0.40 was selected for a good association between an original vari-able and a component.
Differences in biometric parameters between the Atlantic andCantabrian areas were tested using Student’s t-test (p < 0.05).
Data were log transformed to achieve normality and homoge-neity of variances. A difference at p < 0.05 was considered statis-tically significant. Statistical analyses were conducted using theSPSS� version 15.0.
3. Results
3.1. Biometric variables
Average length of collected mussels ranged between 41 and46 mm in all locations sampled. A high variability, though, wasfound in the other biometric variables (Table 1). The highest vari-ability was observed for the lipid contents, which ranged from 0.7to 2.12% ww, and for the gill weight (GW), which varied between0.32 and 0.95 g, indicating a difference of 3 times in both cases.Mussel dry weight (DW) (0.27e0.69 g) and condition index (CI)(7.6e15.7) showed also large differences between stations, withmaximum values 2.5 and 2.1 times higher than minimum values,respectively. Finally, the shell thickness index (ST) varied between0.14 and 0.24 g/cm2, corresponding to a 1.7 times difference.
Despite the high variability registered, significant differencesbetween the Atlantic and Cantabrian oceanographic regions wereonly observed for CI (t ¼ 0.88, p < 0.01) and lipid content (t ¼ 2.76,p < 0.01), with Atlantic mussels having higher CI and lipid content,whereas ST was similar among regions (p > 0.05).
J. Bellas et al. / Marine Environmental Research 96 (2014) 105e117108

Author's personal copy
3.2. Bioaccumulation of chemicals in mussels
Table 2 shows the concentrations of pollutants accumulated inwildmussels. The highest Hg values were registered in an area fromthe central part of the Cantabrian coast (sites 29, 30, 31 and 32). Hgconcentrations below the BAC (0.09 mg/kg dw) (OSPARCommission, 2010), were found in 33% of the studied areas,whereas no sample exceeded the limit for human consumption(2.5 mg/kg dw).
The highest Pb concentrations, ca. 10 times higher than thebackground values, were found in sites 28 and 32, and 31% of themeasured values were below the BAC (1.3 mg/kg dw), most of themin the Galician coast. Wild mussels close to these stations, exceededthe limit for human consumption (7.5 mg/kg dw), but it should benoted that these mussels are not commercialized.
The distribution of Cd on the sampling sites was quite homo-geneous, but unlike other metals, maximum values were found atsites located in the NW Galician coast, far from urban or industrialareas. Around 80% of the values obtained for Cd in mussel tissueswere below the BAC (0.96 mg/kg dw), and none exceeded the limitfor human consumption (5 mg/kg dw).
Comparing metals data with the Norwegian criteria for wildmussels (Green et al., 2012), most of the sampling sites would be
classified as class I or II (‘insignificantly’ or ‘moderately polluted’),and only three sampling sites would be classified as class III(‘markedly polluted’), 28 and 32 for Pb, and 30 for Hg.
Most of the PAHs values were below EAC. Only some indi-vidual PAHs were above this criterion in stations 4, 28, 29 and33. Stations 4 and 33 showed the highest values for theP
13PAHs. One of the PAHs that deserves particular attention isbenzo[a]pyrene (BaP), since this compound presents highcarcinogenic activity (Walker et al., 2001). None of the sampleswas above the EAC for this substance. However, whencomparing present data with the Norwegian criteria for BaP inwild mussels (Green et al., 2012), one sampling site (33) wouldbe classified as class V (‘extremely polluted’), three sites (4, 28and 29) as class IV (‘severely polluted’), three sites (27, 34 and37) as class III (‘markedly polluted’), and the rest of them (33sampling sites) would be classified as ‘moderately’ or ‘insignif-icantly polluted’.
In accordance with the criteria established by OSPAR for indi-vidual PCBs on mussels, the highest proportion of concentrationsbelow the BAC in this study correspond to the low chlorinatedPCBs, which are the most volatile. All stations showed PCBs con-centrations above BAC, at least for two of the individual conge-ners, and 80% of the stations showed PCBs values above the EAC, inparticular for congener 118. Stations 37 and 39 showed the highestPCB values. According to the Norwegian criteria for S7PCBs, sites19, 20, 33, 37 and 39 would be classified as ‘markedly polluted’,and the remaining sites as ‘moderately’ or ‘insignificantlypolluted’.
The highest DDTs concentrations were found in stations 19 and20, which were classified as ‘moderately polluted’ according to theNorwegian criteria, whereas highest HCHs and chlordanes con-centrations were found in stations 33 and 37, and 12 and 16,respectively, but they did not exceed the BAC.
BDEs concentrations in mussels, represented as the sum of thenine individual congeners, ranged between 0.052 and 0.741 mg/kgww, with a mean value of 0.229 mg/kg ww. Generally, the highestlevels of S9BDE were found in areas with high anthropogenicimpact. The highest concentrations were found in sites 20 and 39,followed by sites 19 and 35. Individually, BDE47 was the mostabundant congener in all samples, followed by BDE99, confirmingresults reported in other studies (Table 1S, supplementarymaterial). No BAC or EAC have so far been developed for BDEs,but in view of similar studies in other areas, it can be said thatconcentrations found in this study correspond generally to lowvalues (Christensen and Platz, 2001; Johansson et al., 2006; Gamaet al., 2006).
In order to identify the most important pollutants to be used inthe CPI calculation, PCAwas applied to the chemical database. PCAidentified three components from the chemical data set ac-counting for 75% of the variability. According to Beiras et al. (2012)only those chemicals showing loadings >0.7 in the PCA wereselected to calculate the CPI: Hg, Pb,
P7PCB,
PDDT,
P9BDE and
PHCH.Fig. 2a shows the CPI values calculated for each sampling site,
which takes positive values when pollutants exceed on average theenvironmental quality criteria and negative values otherwise. CPIcan be categorized into three groups in order to classify samplingstations attending to their pollution state: ‘low pollution’ whenCPI � 0, ‘moderate pollution’when 0 < CPI � 1 and ‘high pollution’when CPI > 1. The highest CPI values were found at stations 37, 39and 20, with CPI > 2, and another 7 stations (33, 32, 19, 28, 36, 29,40) showed CPI values >1, indicating ‘high pollution’. Nine stationsshowed CPI values between 0 and 1, indicating ‘moderate pollu-tion’, and 21 stations showed CPI values �0, indicating ‘lowpollution’.
Table 1Biometric variables of mussels (Mytilus galloprovincialis) from the N-NW Spanishcoast. DW: dry weight, GW: gill weight, GI: Gill Index, CI: condition index, ST: shellthickness. n.d. no data.
Site no Sampling sites Length(mm)
DW(g)
GW(g ww)
GI CI Lipids(% ww)
ST(g/cm2)
1 A Guarda 41.98 0.29 0.44 30.3 9.69 0.81 0.162 Sta. Ma Oia 43.42 0.33 0.50 30.3 11.25 1.27 0.143 Vigo 1 43.84 0.37 0.36 19.5 11.46 1.49 0.154 Vigo 2 43.99 0.46 0.45 19.6 13.68 1.40 0.165 Cabo Home 45.13 0.40 0.56 28.0 10.42 1.01 0.186 Pontevedra 1 42.11 0.39 0.43 22.1 11.21 1.72 0.177 Pontevedra 2 42.99 0.54 0.42 15.6 15.68 1.93 0.178 Chazo 42.52 0.42 0.52 24.8 10.34 1.78 0.209 Corrubedo 44.58 0.40 0.54 27.0 11.18 1.13 0.1710 Muros 1 41.96 0.33 0.52 31.5 7.75 1.68 0.2211 Muros 2 42.72 0.57 0.41 14.4 12.30 1.64 0.2312 Punta Insua 41.18 0.28 0.40 28.6 8.39 1.08 0.1813 Muxía 45.87 0.51 0.50 19.6 11.68 1.33 0.1914 Corme 43.84 0.41 0.37 18.1 10.35 1.12 0.1915 Caion 44.19 0.42 0.43 20.5 12.23 1.24 0.1616 Coruña 1 43.87 0.43 0.42 19.5 11.98 1.55 0.1717 Coruña 2 44.13 0.48 0.48 20.0 10.76 1.45 0.2118 Ares 42.59 0.40 0.42 21.0 10.95 2.12 0.1919 Ferrol 1 46.37 0.69 0.58 16.8 15.13 2.09 0.2020 Ferrol 2 45.70 0.41 0.44 21.5 8.86 1.71 0.2121 Cedeira 44.56 0.48 0.43 17.9 11.75 1.41 0.1922 Espasante 45.97 0.40 0.39 19.5 11.54 1.07 0.1523 Viveiro 42.17 0.40 0.44 22.0 9.60 1.36 0.2124 Ribadeo 43.57 0.59 0.56 19.0 12.15 1.68 0.2425 Navia 44.53 0.38 0.51 26.8 9.64 0.99 0.1826 Luarca 44.84 0.47 0.47 20.0 9.83 1.20 0.2227 Pravia 43.40 0.35 0.43 24.6 9.57 1.12 0.1828 Avilés 43.71 0.42 0.42 20.0 13.58 1.50 0.1529 Gijón 44.09 0.37 n.d. 51.4 9.21 0.95 0.1930 Ribadesella 44.43 0.37 0.50 27.0 8.88 1.10 0.1931 S.V. Barquera 43.94 0.49 0.57 23.3 11.01 1.37 0.2132 Suances 43.99 0.31 0.46 29.7 7.79 0.99 0.1933 Santander 1 42.53 0.43 0.57 26.5 9.34 1.13 0.2334 Santander 2 43.42 0.34 0.54 31.8 8.62 1.35 0.1935 Laredo 43.77 0.42 0.32 15.2 12.10 1.46 0.1736 Castro-Urdiales 43.14 0.27 0.34 25.2 7.60 1.27 0.1837 Bilbao 44.12 0.37 0.35 18.9 9.02 0.99 0.2038 Mundaka 44.97 0.35 0.42 24.0 8.14 0.70 0.2039 Orio 42.66 0.29 0.38 26.2 7.70 1.06 0.1840 Hondarribia 44.50 0.38 0.43 22.6 8.99 1.23 0.20
J. Bellas et al. / Marine Environmental Research 96 (2014) 105e117 109

Author's personal copy
3.3. Biological responses
Biomarker results showed AChE inhibition in 12 sites, accordingto the EAC values reported by ICES for the Spanish Mediterranean(ICES, 2012) (Table 3). The highest inhibition was observed in sta-tion 30 (5.8 nmol/min/mg prot). GST activities ranged between 29.5and 112.7 nmol/min/mg prot with 40% of the sampling sitesshowing higher values than the EAC value proposed by Vidal-Liñánet al. (2010) for this biomarker. Maximum values were observed instations 28 and 29. Extreme variability was observed in GPx be-tween sites. Activities ranged between 2.6 and 64.5 nmol/min/mgprot.
Regarding SFG, 60% of the sampling sites present a ‘high growthpotential’ (SFG > 25 J/g/h) corresponding to a ‘healthy state’, ac-cording to the ICES recommendations (ICES, 2013), whilst only onestation (17) presented an SFG value below 15 J/g/h, which corre-sponds to ‘low potential growth’ or ‘high stress’ (Table 3). However,we prefer to follow the Widdows et al. (2002) recommendations,where relative values to the maximum SFG obtained were used:‘high growth potential’/’low stress’ (>60% of reference value),‘moderate growth potential’/’moderate stress’ (20e60% of refer-ence value) and ‘low growth potential’/’high stress’ (<20% ofreference value). In our case, and following the reference value of
30 J/g/h considered in our previous surveys (Albentosa et al., 2012),the following assessment criteria have been used: sites with SFGvalues higher than 18 J/g/h can be considered ‘unstressed’, siteswith values between 6 and 18 J/g/h are ‘moderately stressed’ andsites with values lower than 6 J/g/h are ‘highly stressed’. Thus, sites17, 19 and 34 showed ‘moderate stress’. The physiological rate thatmost determines the SFG value is the CR, explaining almost 60% ofthe variability of the SFG. AE and RR explain 33% and 7% of thevariability, respectively. These three components are shown inTable 3. CR data have been standardized to both mussel weight andlength for the reasons explained below.
Fig. 2b shows the IBR values calculated for each sampling site.The lowest IBR values were obtained at sites 32, 15, 39 and 1,indicating the lowest impact level caused by toxic effects of pol-lutants. The highest IBR values were obtained at stations 19, 11, 17and 33, corresponding to a high toxically induced stress level.
3.4. Integrative assessment
In order to integrate biomarker responses and chemicals accu-mulated inmussels tissues a PCAwas carried out (Table 4). The dataset used in the analysis included the three biochemical biomarkers(AChE, GST and GPx) and the three components of the SFG (CR, AE
Table 2Concentrations of pollutants in the soft tissues of mussels (Mytilus galloprovincialis) from the N-NW Spanish coast. S13PAHs: sum of 13 polycyclic aromatic hydrocarbons,S9BDEs: sum of 9 polybrominated diphenyl ethers, S7PCBs: sum of 7 polychlorinated byphenyls,SDDTs: sum of p,p0-DDE, 4,40-DDD and 4,40-DDT, SHCHs: sum of a-HCH and g-HCH, Schlordanes: sum of trans-chlordane and cis-chlordane, CPI: Chemical Pollution Index. n.d. no data.
Site no Sampling sites Metals (mg/kg dw) S13PAHs (mg/kg dw) S9BDEs (mg/kg ww) Organochlorines (mg/kg ww) CPI
Hg Pb Cd S7PCBs SDDTs SHCHs Schlordanes
1 A Guarda 0.10 2.80 1.10 82.50 0.12 2.13 0.38 0.025 0.010 �1.052 Sta. Ma Oia 0.13 1.25 1.18 60.68 0.08 2.46 0.37 0.054 0.068 �1.173 Vigo 1 0.12 2.66 0.61 86.16 0.43 11.13 0.63 0.068 0.098 0.774 Vigo 2 0.09 2.61 0.50 3018 0.24 12.40 0.66 0.048 0.045 0.385 Cabo Home 0.08 1.33 0.96 73.68 0.08 2.41 0.33 0.078 0.112 �1.266 Pontevedra 1 0.10 1.52 0.77 87.11 0.18 1.48 0.49 0.071 0.062 �0.777 Pontevedra 2 0.18 1.18 0.52 310.6 0.25 2.77 0.62 0.074 0.054 �0.178 Chazo 0.08 0.75 0.59 277.9 0.10 1.74 0.52 0.118 0.110 �1.209 Corrubedo 0.08 0.86 1.57 63.17 0.10 1.13 0.22 0.036 0.150 �2.1610 Muros 1 0.09 1.10 0.81 75.20 0.09 1.66 0.49 0.047 0.060 �1.4611 Muros 2 0.11 n.d. 1.07 168.5 0.12 3.25 0.74 0.036 0.075 �0.3412 Punta Insua 0.08 1.60 2.01 41.04 0.05 0.95 0.17 0.082 0.222 �2.0813 Muxía n.d. 1.05 0.72 51.30 0.15 1.67 0.39 0.047 0.110 �1.3714 Corme 0.07 0.77 1.06 57.60 0.10 1.36 0.40 0.088 0.096 �1.4715 Caion 0.06 0.81 0.72 77.95 0.12 1.05 0.18 0.060 0.092 �2.1916 Coruña 1 0.08 3.29 0.58 434.4 0.31 13.49 0.49 0.032 0.378 0.3917 Coruña 2 0.19 1.59 0.55 457.0 0.19 12.61 0.59 0.058 0.104 0.4718 Ares 0.11 0.66 0.45 222.3 0.17 9.40 0.46 0.056 0.052 �0.5019 Ferrol 1 0.08 1.54 0.36 312.0 0.48 21.77 2.12 0.070 0.069 1.5920 Ferrol 2 0.14 1.76 0.55 330.5 0.74 23.90 2.62 0.091 0.061 2.0521 Cedeira 0.05 0.65 0.51 100.4 0.09 2.11 0.33 0.062 0.052 �1.8722 Espasante 0.08 0.88 0.60 89.45 0.07 2.84 0.26 0.080 0.070 �1.5623 Viveiro 0.11 1.85 0.78 118.6 0.17 2.43 0.39 0.056 0.047 �0.7224 Ribadeo 0.12 1.31 0.47 93.14 0.11 2.21 0.63 0.088 0.111 �0.7325 Navia 0.08 1.21 0.67 52.61 0.30 0.61 0.31 0.034 0.029 �1.7026 Luarca 0.14 1.97 0.63 86.45 0.16 0.90 0.51 0.044 0.054 �1.0027 Pravia 0.18 2.02 0.63 329.3 0.14 1.53 0.31 0.028 0.033 �1.1528 Avilés 0.27 24.63 1.06 1994 0.19 7.27 0.33 0.060 0.027 1.2829 Gijón 0.40 4.89 0.73 1230 0.28 9.95 0.40 0.056 0.070 1.2130 Ribadesella 0.62 2.14 0.63 163.3 0.13 1.69 0.32 0.104 0.029 0.0231 S.V. Barquera 0.38 2.36 0.50 207.3 0.37 2.46 0.30 0.062 0.069 0.1632 Suances 0.40 28.13 0.71 154.3 0.19 4.43 0.26 0.083 0.014 1.3033 Santander 1 0.22 6.69 0.85 3012 0.21 20.50 0.91 0.121 0.041 1.8734 Santander 2 0.19 3.33 0.64 369.7 0.23 8.56 0.58 0.109 0.042 0.9335 Laredo 0.16 2.83 0.52 209.4 0.43 3.86 0.52 0.044 0.033 0.2536 Castro-Urdiales 0.22 4.88 0.63 228.1 0.42 9.62 0.47 0.080 0.032 1.1937 Bilbao 0.19 4.14 0.73 557.1 0.38 45.13 1.18 0.131 0.087 2.3438 Mundaka 0.20 3.08 0.57 322.5 0.33 13.78 0.66 0.038 0.031 0.7939 Orio 0.16 3.68 0.60 380.7 0.56 37.30 1.51 0.066 0.036 2.1140 Hondarribia 0.10 4.61 0.51 146.8 0.30 14.21 0.71 0.067 0.050 1.01
J. Bellas et al. / Marine Environmental Research 96 (2014) 105e117110

Author's personal copy
and RR). Length standardization of CR was used instead of weightstandardization to avoid the correlation between CR and CI(r¼�0.515, p< 0.01). All the chemical variables were also includedin the analysis (Hg, Pb, S13PAH,
P9BDEs,
P7PCBs,
PDDTs,
PHCHs
andP
chlordanes). Cd was not included in the PCA since thiselement seems to be associated to natural upwelling processes. Theapplication of the PCA analysis to the variables mentioned abovecan be represented by five principal components that explain 69.6%of the variance in the original data set. The most important prin-cipal component, PC1, explains 21.9% of the total variance, and linksCR, organochlorines (S7PCBs and SDDTs) and S9BDEs. High load-ings (>0.6) of the four variables (negative for CR) were obtained,indicating a strong association between them. PC2 accounts for17.5% of the total variance, and groups GST, Hg, Pb and S13PAHs,although the loading of the GST was relatively low (0.456). PC3accounts for 11.3% of the total variance, and associates GST (nega-tively), GPx and SHCHs, being the loading of the GPx much higherthan the loading of the GST. PC4 explains 9.6% of the total varianceand associates inversely RR and AChE with
Pchlordanes. The
loading for RR is higher than for AChE, indicating a stronger relationbetween
Pchlordanes and RR. PC5, which explains only 9.1% of the
total variance, only shows weak association between AE and GST.A second PCA analysis was carried out to establish relationships
between biomarker responses and biological indices (Table 5).Regarding biomarkers, physiological (CR, AE and RR) andbiochemical (AChE, GST and GPx) responses were included in theanalysis, and among the biometric parameters ST, lipid content, CIand GI were selected. The PCA identified four components that
explain 67.7% of the variance in the original data set. PC1 explains26.1% of the total variance, and relates AE and RR (negatively) withlipids, CI and GI (negatively). PC2, accounts for 18.7% of the totalvariance, and groups GST (negatively), GPx and ST, pointing out astrong association between these variables. PC3 explains 12.3% ofthe total variance and shows positive loadings for the three com-ponents of the SFG: CR, AE and RR. PC4 explains 10.6% of the totalvariance and shows a negative relation between AChE and AE.
4. Discussion
4.1. Geographical patterns of chemical pollution
The study of chemical pollutants in the sampling area has beentackled in previous works, but most of them were local studies, orwere focused on one group of pollutants (e.g. González-Quijanoet al., 2006; Soriano et al., 2006; Besada et al., 2011b; Marigomezet al., 2013). This study undertakes by first time an overall assess-ment of the whole N-Atlantic Spanish coast integrating musselbioaccumulation, and a battery of physiological and biochemicalbiomarkers in wild mussel populations.
Overall, average levels of pollutants bioaccumulated in themussels (Fig. 2a) were higher in the Cantabrian than in the IberianAtlantic coast. In fact, although more than 50% of the Galicianpopulation is concentrated on the coast (>500 inhab/km2, INE,2007), results of previous studies indicate a low level of pollutionin the Galician coast, with the exception of localized areas in theinner part of the Rías (Prego and Cobelo-García, 2003; Bellas et al.,
Fig. 2. Chemical Pollution Index (CPI) (a), and Integrated Biomarker Response (IBR) (b) in mussels from the N-NW Spanish coast. CPI is categorized into three groups: ‘low pollution’when CPI � 0, ‘moderate pollution’ when 0 < CPI � 1 and ‘high pollution’ when CPI > 1.
J. Bellas et al. / Marine Environmental Research 96 (2014) 105e117 111

Author's personal copy
2011b). Rías of Vigo and Ferrol are the most industrialized of theGalician Rías. High
P13PAHs and
P7PCBs concentrations reported
here can be attributed to the influence of these anthropogenic ac-tivities. On the basis of the chemical analyses described here, the ríaof Ferrol might be classified as the most polluted of the Galician
Table 4Results of the Principal Component Analysis (PCA) between biomarker responsesand chemicals accumulated in mussels tissues. Variables with a loading value >0.4are marked in bold.
PC1 PC2 PC3 PC4 PC5
Eigen values 3.079 2.456 1.583 1.339 1.287Cumulative % variance 22.00 39.54 50.85 60.42 69.61Loadings of variablesCR L 60 mm L0.648 0.203 0.031 0.056 0.142AE �0.065 �0.184 �0.037 0.160 0.892RR w 1 g �0.192 0.389 0.095 0.641 0.024AChE �0.118 �0.238 �0.238 0.489 �0.399GST �0.227 0.456 L0.438 �0.285 0.401GPx �0.060 �0.204 0.868 �0.022 0.184Hg �0.017 0.746 �0.117 0.082 �0.010Pb �0.065 0.685 �0.104 0.383 �0.142P
13PAHs 0.137 0.707 0.224 0.020 �0.040P
7PCBs 0.791 0.231 0.200 �0.050 �0.256P
9BDEs 0.892 0.106 �0.076 �0.004 0.170P
DDT 0.930 �0.032 0.136 0.014 0.062P
HCH 0.183 0.313 0.711 0.002 �0.254P
Chlordanes �0.108 �0.135 �0.0323 L0.810 �0.184
Table 5Results of the Principal Component Analysis (PCA) between biomarker responsesand biological indices. Variables with a loading value >0.4 are marked in bold.
PC1 PC2 PC3 PC4
Eigen values 2.614 1.873 1.231 1.057Cumulative % variance 26.14 44.87 57.18 67.75Loadings of variablesCRL 60 mm �0.078 �0.186 0.756 0.139AE 0.409 �0.255 0.469 L0.473RR w 1 g L0.570 0.091 0.516 0.056AChE 0.173 �0.103 0.180 0.849GST 0.162 L0.673 0.175 �0.191GPx 0.286 0.737 0.373 �0.195ST �0.038 0.653 �0.270 �0.124Lipids 0.709 0.240 �0.267 0.207CI 0.893 �0.206 0.072 0.088GI L0.818 �0.031 �0.071 0.066
Table 3Physiological and biochemical variables of mussels (Mytilus galloprovincialis) from the N-NW Spanish coast. CR: clearance rate, AE: absorption efficiency, RR: respiration rate,SFG: Scope for Growth, AChE: acetylcholinesterase, GST: glutathione s-transferase, GPx: glutathione peroxidase, IBR: Integrated Biomarker Response. Clearance rate wasdoubly standardized, for an individual of 1 g dw and for an individual of 60 mm length.
Site no Sampling sites CR w 1 g
(L//h)CR w 60 mm
(L//h)AE(%)
RR w 1 g
(J/g/h)SFG w 1 g
(J/g/h)AChE(nmol/min/mg prot)
GST(nmol/min/mg prot)
GPx(nmol/min/mg prot)
IBR
1 A Guarda 4.97 3.97 70.5 7.56 36.67 11.95 29.47 6.59 2.362 Sta. Ma Oia 4.44 3.63 68.5 7.40 31.01 14.25 35.44 64.48 6.883 Vigo 1 5.30 4.52 66.3 6.11 38.56 10.65 67.12 12.08 4.554 Vigo 2 4.00 4.00 70.1 7.21 27.98 23.02 71.62 34.61 7.425 Cabo Home 4.35 3.84 72.3 6.66 32.97 10.23 64.08 12.66 7.696 Pontevedra 1 4.56 4.28 69.7 8.13 31.49 12.10 53.85 57.95 10.877 Pontevedra 2 3.55 4.12 65.6 5.85 23.52 20.43 55.70 8.89 5.868 Chazo 3.66 3.57 72.7 8.87 24.53 16.97 42.86 60.13 13.769 Corrubedo 3.77 3.35 66.8 7.84 24.02 9.51 54.52 6.64 12.8010 Muros 1 4.37 3.78 57.9 7.21 25.02 18.24 64.54 8.33 5.2911 Muros 2 3.24 3.91 69.8 6.72 21.80 13.25 81.66 31.62 15.8112 Punta Insua 5.98 4.72 65.1 8.79 39.79 8.20 77.93 33.63 8.8313 Muxía 4.43 4.39 65.0 8.91 27.31 15.05 68.18 10.15 8.2514 Corme 3.91 3.57 73.4 8.26 27.88 9.32 52.69 50.16 14.4915 Caion 4.17 3.93 72.4 7.21 30.99 27.11 75.64 8.22 1.5516 Coruña 1 3.88 3.73 57.4 6.73 21.53 9.16 58.47 8.24 13.3417 Coruña 2 2.93 2.99 57.6 6.49 14.80 12.37 39.52 6.71 15.5118 Ares 3.78 3.57 60.9 7.86 21.36 13.35 47.05 9.34 11.1419 Ferrol 1 2.70 3.17 73.0 6.99 17.60 8.74 53.69 50.20 21.7620 Ferrol 2 3.19 2.80 68.3 7.75 19.85 13.23 54.20 7.26 14.0921 Cedeira 3.78 3.83 69.7 9.94 23.37 18.04 49.42 42.39 14.0822 Espasante 5.10 4.29 71.3 9.37 35.89 14.10 61.51 22.05 5.7523 Viveiro 4.54 4.30 64.1 8.12 27.64 9.57 52.93 60.74 13.1624 Ribadeo 3.28 3.95 71.3 7.53 22.08 9.48 31.39 63.20 14.9025 Navia 4.52 3.88 76.6 10.97 32.64 10.83 54.50 2.63 7.3826 Luarca 3.95 3.82 74.1 8.46 28.25 13.59 61.34 50.67 14.1027 Pravia 5.41 4.59 64.3 9.87 33.56 14.30 65.94 11.03 4.2328 Avilés 4.09 3.87 76.2 9.85 29.52 10.83 101.48 11.69 14.0629 Gijón 4.74 4.10 69.7 9.28 32.31 13.22 112.72 10.54 9.0630 Ribadesella 4.37 3.72 69.1 7.50 30.41 5.80 73.92 11.16 12.1831 S.V. Barquera 3.88 4.07 66.9 7.89 24.87 11.26 53.39 9.30 11.3132 Suances 5.52 4.20 56.8 11.92 27.78 20.09 44.38 6.98 1.5233 Santander 1 4.11 4.18 58.3 9.78 20.60 12.08 36.03 48.88 15.3034 Santander 2 4.21 3.45 50.6 9.99 17.07 9.87 47.86 8.01 14.5335 Laredo 4.42 4.15 73.9 9.51 31.54 9.55 40.66 10.36 7.4836 Castro-Urdiales 5.41 3.91 65.0 10.09 33.94 8.52 43.69 40.43 6.8937 Bilbao 4.15 3.60 56.7 7.10 22.38 12.98 45.75 55.28 10.9538 Mundaka 4.11 3.27 67.8 7.87 27.03 9.76 59.38 7.29 10.9039 Orio 5.41 3.98 69.9 9.88 37.00 15.31 40.73 10.84 2.2040 Hondarribia 3.97 3.40 58.7 8.78 19.80 17.31 31.93 26.43 10.05
J. Bellas et al. / Marine Environmental Research 96 (2014) 105e117112

Author's personal copy
rías. We report maximum values ofP
9BDEs andP
DDTs for theentire sampling area, and very high
P7PCBs and
P13PAHs con-
centrations. In the ría of Pontevedra, besides shipbuilding and portactivities, it is worth mentioning a chlor-alkali plant and paper millcomplex, whose activity over the years has caused a chronic Hgpollution event. Temporal trend studies indicate that this situationhas improved due to the stoppage of emissions (Besada et al.,2002). The high
P13PAHs concentrations (especially anthracene)
reported here are also possibly associated to the wood processingwithin the paper mill complex (Soriano et al., 2006). The ría ofArousa is the least polluted of the main Galician rías, however, asSoriano et al. (2006), we report elevated levels of
P13PAHs in this
estuary which deserve a more detailed study. We also found highP
13PAHs concentrations in A Coruña which are attributed, in thiscase, to the oil refinery that causes chronic hydrocarbon pollutionin the inner part of the ría. Moreover,
P7PCBs concentrations are
high in this estuary, and are associated, as well as those reported inthe ría of Vigo, to the port activities. The highest Cd concentrationswere found in the Iberian Atlantic coast, but it should be noted thatCd spatial distribution, which is relatively homogeneous in thisarea, is strongly associated with the presence of inorganic nutrientsoriginated by natural upwelling, and therefore controlled by theregeneration process of the organic matter, rather than by pollu-tion. In fact, Cd concentrations in mussel tissues are directly relatedto the intensity of coastal upwelling (Segovia-Zavala et al., 2003),which is specially intense and abundant along this area (Cabanas,2000; Álvarez et al., 2011), and maximum Cd concentrations inmussels were found in the less industrialized but most naturallyproductive ría of Arousa (Beiras et al., 2003).
In the Cantabrian area, the coast nearby the cities of Gijón,Aviles, Santander and Bilbao has a degraded environmental qualitydue to the intense and diverse industrial (iron and steel industry,shipbuilding, chemical and pharmaceutical industry and woodprocessing) and port activities. Industrial and urban inputs from thecities of Avilés and Gijón have increased the levels of pollutants inthe area (Soriano et al., 2007; Besada et al., 2011a), as we report formetals,
P13PAHs and
P7PCBs. Santander bay holds a diversified
industrial activity in its margins, which is mainly affecting the innerpart of the bay (González-Quijano et al., 2006). Maximum levels ofP
13PAHs for the whole sampling area, and also high levels of Pb,P
7PCBs and organochlorine pesticides, were found in this bay.Moreover, Hg and Pb present their highest concentrations in thecoastal area of ca. 200 km situated between Cape Peñas and CapeAjo (between Avilés and Santander cities). The residues of aban-doned Hg and ZnePb mines in the vicinity of this coastal region,which were among the largest deposits in Europe at their time(Fernandez-Martinez et al., 2005; Irabien et al., 2008), may be thecause of the high concentrations found for these metals. Bilbaometropolitan area (>1 million inhabitants, 3625 inhab/km2, Leorriet al., 2008) is among the most densely populated and highlyindustrialized regions in the Bay of Biscay. Urban and industrialuntreated effluents have been discharged into the Nervión estuaryfor many years, giving rise to elevated concentrations of severalpollutants, as this study reports for
P7PCBs (maximum value),
organoclorine pesticides (P
HCH maximum value),P
13PAHs andmetals, which have severely deteriorated the estuary (Bartoloméet al., 2006; Soriano et al., 2007; Tueros et al., 2009). High levelsof
P13PAHs,
P9BDEs,
P7PCBs and
PDDTs were also detected in
site 39, a fishing village nearby Bilbao. These high pollution levelsmay be associated with the strong industry (especially the paperindustry) settled along the Oria river.
According to the pollutant data presented here, 6 from the 10highest calculated CPI values correspond to sampling sites locatednearby large cities: Bilbao, Ferrol, Santander, Avilés and Gijón,whereas four sites located nearby villages or small cities showed
also CPI values >1 (including the second highest CPI value): Orio,Suances, Castro-Urdiales, Hondarribia.
Studies of temporal trends of pollutants in mussel tissues fromthis area indicate a declining trend in several groups of pollutantsincluding PCBs, PAHs andmetals related to anthropogenic activities(Hg and Pb) (OSPAR Commission, 2010), although punctual in-creases in certain areas were also observed (Bellas et al., 2011a).
4.2. Interpretation of biological effects data
The use of biological responses in marine pollution studies hasbeen repeatedly advocated, but it is hampered by the interferenceof natural intrinsic and environmental variability, and the diffi-culties to develop adequate assessment criteria, that frequentlyshow spatial variation and have to be agreed at the level of marinesubregions. ICES has beenworking for over 20 years on this matter,and has agreed common BAC and EAC values for several biologicalresponses, but recently some controversial has arisen regarding theBAC and EAC values for SFG (ICES, 2013). SFG data depend on thestandardized laboratory conditions used in the measurements,mainly temperature and food concentration. In the present study,and following the methodology established by Albentosa et al.(2012) for the Spanish Marine Pollution monitoring program, afood concentration of 0.5 mg organic matter/L was used. Maximumandminimumvalues in the cited study were of the same range (39-9 J/g/h) as those observed in the present survey: 39-14 J/g/h.Albentosa et al. (2012) considered 30 J/g/h as a reference value,since values of 39 J/g/h were only observed in two sites and wereclassified as outliers, and the same reference value was used in thepresent study. According to these criteria, only 3 sites (17, 19 and34) showed ‘moderate stress’. In general, SFG values in the presentsurvey (mean SFG 27.4 J/g/h) were higher than those obtainedduring 2007 and 2008 surveys (mean SFG 24.0 J/g/h) for the samesampling sites. It is possible that a reference value of 35 J/g/h couldbe more appropriate for the 2010 data than the value of 30 J/g/hconsidered for the previous surveys. With this new reference value,two more stations (20 and 40) would be classified as ‘moderatelystressed’. Anyhow, a point worth noting is that not a single stationrecorded a ‘high stress’ situation with any of the reference valuesconsidered. All sites classified as ‘moderately stressed’ showedP
13PAHs andP
7PCBs concentrations above current environmentalcriteria. Sites 17, 19, 20 and 40 showed concentrations of congenersCB101, CB118 and CB138 above the OSPAR EAC, and sites 19, 20 and34 were classified as markedly polluted following criteria proposedby Green et al. (2012) for
P7PCBs (19, 20) and BaP (34).
Available BAC and EAC values have also been developed forAChE in mussels (ICES, 2013). However, the range of proposedvalues is too wide, suggesting some differences in the methodologyused among different research groups. Thus, BAC and EAC values of15 and 10 nmol/min/mg prot (Spanish Mediterranean waters), and26e30 and 19e21 nmol/min/mg prot (French Atlantic waters,French Mediterranean waters, Portuguese Atlantic waters), havebeen proposed. According to those criteria, 12 sites would showinhibition of the AChE activity when we use the Spanish Mediter-ranean EAC, andmost values (36 sites) whenwe use the French andPortuguese EACs. In this regard, and using the same methodologyapplied by the WGBEC for development of BAC and EAC, we obtainthe following criteria: BAC¼ 10 and EAC¼ 7 nmol/min/mg prot, forthe mussel populations of this study. Using this EAC, only site 30would show inhibition of the AChE activity. The observed AChEinhibition could be due to the high Hg concentration detected inthis site (0.62 mg/kg dw), which was classified as ‘markedlypolluted’ on the basis of the criteria proposed by Green et al. (2012).In agreement with our results, other authors reported inhibition ofcholinesterases in the crab Carcinus maenas and in the fish
J. Bellas et al. / Marine Environmental Research 96 (2014) 105e117 113
Author's personal copy
Pomatochistus microps exposed to Hg (Elumalai et al., 2007; Vieiraet al., 2009).
No available criteria exist for GST and GPx. The relation betweenboth enzymatic activities can be explained by their metabolic rolein the cell. GPx is an antioxidant enzyme known to regulateendogenous reactive oxygen species (ROS) at relatively low levels,to maintain normal functions of the cell (Livingstone et al., 1990).On the other hand, GST is a phase II biotransformation enzyme thatmay act as a complement of the antioxidant defense system of thecell (Sheehan et al., 2001). The definition of environmental criteriausing present data is conditioned by the high variability of theseenzymatic activities, particularly for GPx, along the sampling area,and a more profound study of these biomarkers is needed. BAC andEAC tentative values for GST are 44 and 57 nmol/min/mg prot, butno reliable values were obtained for GPx. On the basis of those EACvalues, 16 sites would show GST induction, the highest value beingfound in site 29, where mussels showed
P13PAHs and PCBs (con-
geners 101, 118, 138) values above the OSPAR EAC.Several authors have outlined the problems arising from the
interpretation of multiple biomarker responses in marine pollutionstudies (e.g. Allen and Moore, 2004; Brooks et al., 2009). Pollutantsact upon different receptors and present different modes of action,causing a variety of biochemical effects in organisms. Thus, indi-vidual biomarkers would indicate specific alterations on the or-ganism’s health status (Depledge et al., 1993), and contradictoryresults may be expected since, for instance, effects at the molecularor cellular level may not be detected at the whole organism level(Walker et al., 2001; Brooks et al., 2009), as we report here.With theaim of applying an integrated tool for the analysis of the individualbiomarkers that may provide an assessment of the overall healthstatus of the organism, beyond variations observed among differentbiological responses, we have used an Integrated BiomarkerResponse (IBR) (Beliaeff and Burgeot, 2002). Overall, the healthiestmussels according to the IBR were those collected from site 32.These mussels showed high physiological rates, high AChE activity(indicating absenceof neurotoxic effects), andGSTandGPxactivitiesclose to the baseline values calculated for this region. However, thissite showed the highest Pb levels in the study (28.1 mg/kg dw),indicating that those concentrations did not affect the biologicalresponses measured here. The highest IBR was detected in site 19,due to low SFG and AChE activity, and high GSTand GPx values. Thissite presented high
P9BDE concentrations, and was classified as
‘markedly polluted’ byP
7PCBs, and ‘moderately polluted’ byP
DDTs. Among the four sites with values below the IBR 10thpercentile, two of them (site 1 and 15), did not exceed the envi-ronmental criteria for any pollutant, whilst the other two (32 and39), were ‘markedly polluted’ by Pb and
P7PCBs, respectively. Also,
four sites showed IBR values above the 90th percentile (sites 19, 11,17 and 33), among which only one (site 11) did not exceed theenvironmental criteria for any pollutant, and the other three sitesexceeded the criteria for
P7PCBs,
P13PAHs and/or
PDDTs.
4.3. Linking chemical pollution and biological effects
The relationship between the presence of pollutants in theenvironment and the disruption of the biological responses usedhere has been suggested in previous studies (e.g. Widdows et al.,2002; Richardson et al., 2008; Vidal-Liñán et al., 2010; Albentosaet al., 2012). These relations were also demonstrated in labora-tory experiments with individual pollutants (Widdows and Donkin,1991; Donkin et al., 1997; Canesi et al., 1999; Akcha et al., 2000;Richardson et al., 2008). According to the PCA conducted withchemical variables and biological responses,
P13PAHs, Hg and Pb
are weakly associated to GST induction, but organochlorines(P
7PCBs,P
DDTs,P
HCHs,P
chlordanes) andP
9BDEs seem to be
the main responsible of the observed effects on physiological re-sponses and on GPx induction. This finding is supported by thesignificant correlations obtained between organochlorines and IBR(P
DDTs: r ¼ 0.371, p < 0.05, andP
HCHs: r ¼ 0.326, p < 0.05).Previous field studies have identified those pollutants as partiallyresponsible of the reduction in the physiological fitness and theinduction of the antioxidant activity of mussel’s populations(Widdows et al., 1997; Vidal-Liñán et al., 2010; Albentosa et al.,2012), and Donkin et al. (1997) quantified the effect of selectedorganoclorines (including g-HCH), on the clearance rate of Mytilusedulis in laboratory experiments. The calculated effect concentra-tions (ca. 300 mg/kg dw), though, are orders of magnitude higherthan the concentrations reported here (Table 1S, supplementarymaterial), indicating that organochlorines alone cannot explainthe observed toxicity. PAHs were also significantly correlated withthe decrease of the SFG, as previously reported in large scale studieson the Irish and North Seas (Widdows et al., 1995, 2002). Althoughthese authors attribute the inhibition of SFG mainly to hydrocar-bons, they report much higher concentrations than those found inthe present study. On the other hand Albentosa et al. (2012) did notfind an effect of PAHs on SFG. It is also worth to mention that thesignificant positive relationships observed between Cd and thephysiological responses, once again, point to a biogeochemical roleof this metal in the sampling area (e.g. Cullen et al., 1999; Finkelet al., 2007), rather than to an association to anthropogenic inputs.
The lack of correlation observed here between pollutants andbiochemical responses, with the exception of a single positivecorrelation between
PHCHs and GPx, is in disagreement with
other studies carried out in the Galician Rías (Vidal-Liñán et al.,2010, 2013). This may be related to the larger geographical scaleand the diversity of sampling sites in the present work, in contrastto small scale studies in homogeneous environmental scenarios,with few sampling sites. In this sense, GPx activity has been foundto be affected by environmental conditions such as food availabilityor the reproductive cycle (Borkovic et al., 2005), and high activitiesfound in relatively unpolluted sites may result from disturbance ofthe oxidative stress levels caused by natural factors rather than topollution (Bochetti and Regoli, 2006).
The application of CPI has been proven to be very useful toestablish relationships between pollutant concentrations and theireffects on living resources, at both the organism and the commu-nity levels (Bellas et al., 2011b; Beiras et al., 2012). However, despitethe individual relationships between pollutants and biological re-sponses detected here, no significant correlations were observedbetween any biological response and the CPI. As commented above,the wide range of the sampling area, covering two differentoceanographic regions, and the number of sampling sitesemployed, introduces inter-sites variation of the environmentalconditions that would reduce the strength of the correlationsobserved between chemical and biological variables.
The study of the variability of biological responses associated tobiotic and abiotic factors other than pollutants is among the mostrelevant pending issues needed to progress in relating the presenceof toxicants in the marine environment to adverse effects on eco-systems, particularly in large-scale studies covering a wide range ofenvironmental conditions. Environmental variables that affectbiochemical, metabolic or physiological activities may act as con-founding factors that alter the organisms’ responses to pollution(Moriarty, 1999). Thus, different studies have had difficulties inestablishing the link between pollutant exposure and biologicaleffects in mussel populations. Often, the lack of correlations hasbeen attributed to the presence of unmeasured pollutants (e.g.Brooks et al., 2009; Fernández et al., 2010), but confounding factorssuch as food availability, age differences or the period of thereproductive cycle have also been highlighted (Koehler, 1989;
J. Bellas et al. / Marine Environmental Research 96 (2014) 105e117114

Author's personal copy
Regoli, 1998; Viarengo et al., 2007; Albentosa et al., 2012). Currentinvestigation within our research group targets the issue ofmodelling the influence of confounding factors on biological re-sponses to pollution in wild mussels (BIOCOM project).
As it was pointed out in previous surveys (Albentosa et al., 2012)and in literature (Filgueira et al., 2008), we described a significantinfluence of CI on physiological responses, in particular on the CRstandardized to weight, CI explaining 52% of the CR variation(r ¼ �0.515, p < 0.01). In this regard, and taking into account thatthe effect of pollutants on the SFG is mainly explained by its effecton the CR (Smaal et al., 1991; Toro et al., 2003; Beiras et al., 2012),the length standardization of the CR has been proposed as moreappropriate than weight standardization for comparative purposes(Iglesias et al., 1996; Labarta et al., 1997). However, the overall in-fluence of mussel condition on SFG was not as clear as thatobserved in 2007 and 2008 surveys (Albentosa et al., 2012).Whereas in the cited study a correlation coefficient of r ¼ �0.617was described, in the present study this coefficient was not sig-nificant (p > 0.05). On this point, it is noted that mussel conditionrangewas 30% higher in the 2007e2008 study (max: 18.2, min: 6.8,range: 11.4), compared with the present study (max: 15.7, min: 7.6,range: 8.1). These data point to the inter-annual variability of foodavailability as responsible of mussel condition and it should betaken into account in the biomarkers’ responses in annual moni-toring programs.
Despite the significant effect of CI on mussel physiology, STappeared here as the main environmental influence on the SFGvalues. As well as it was described for previous surveys, a negativecorrelation between SFG and ST was found, being this relationshipstronger (r¼�0.566, p< 0.001) than described before (r¼�0.465)(Albentosa et al., 2012). In fact, Albentosa et al. (2012) reported astronger influence of CI than ST on the SFG, which may be inter-preted in terms of the high abundance of food, particularly during2008, associated to the high upwelling indices observed in that year(www.indiceafloramiento.ieo.es). The stronger influence of ST onthe SFG observed in the present survey may be related to the lowerfood availability for mussel populations, caused by lower meanupwelling indices registered both in the Atlantic (�335.27 m3/s � km) and Cantabrian (�521.64 m3/s � km) areas (www.indiceafloramiento.ieo.es), that would confer more importance tothe effect of age than condition on mussel physiology. The rela-tionship between ST and SFG is due to the negative effect of ST onfeeding, as absorption efficiency or respiration were not signifi-cantly related to ST. If we consider ST as being indicative of musselage (Frew et al., 1989; Yap et al., 2003), we should conclude thatfeeding rate is reduced with age. Similar results were described bySukhotin et al. (2003) with M. edulis, where a reduction in themussel pumping rate was observed in older animals, whereas therespiration rate did not demonstrate such age-specific differences.In a previous study, the same authors (Sukhotin et al., 2002) showedsignificantly lower growth rates associatedwith the ageing process.As respiration rates did not show a clear correlation with age,feeding rate decreases could be the cause of these lower growthrates, as it can be deduced fromour results. At the biochemical level,PCA grouped ST with GPx and GST, indicating a positive effect of STon GPx and negative on GST. This finding suggests that age mayincrease the level of endogenous ROS and, therefore, induce GPxbasal activity, and that may impair the response capacity of the cellagainst oxidative stress, by reducing GST activity, as has been pre-viously observed (Canesi and Viarengo, 1997).
5. Conclusions
High levels of pollutants were found in mussel populationslocated close to major cities and industrialized areas and, in
general, average concentrations were higher in the Cantabrian thanin the Iberian Atlantic coast. The combination of chemical variablesand biological responses identified certain pollutants (PCBs,organochlorine pesticides and BDEs) that are responsible, at least inpart, of toxic effects in mussel populations, and contributes toestablish the link between chemical pollution and harmful effectson marine organisms. However, the alteration of biological re-sponses caused by pollutants seems to be, in general, masked bybiological variables, namely age and mussel condition, which havean effect on the mussels’ response to pollutant exposure.
A more holistic approach inwhich pollutants are not consideredas the only source of variability on the biological responses of or-ganisms, but as an additional variable, is needed for the correctassessment of marine pollution. This approach requires, as hasalready been emphasized byWarren and Liss (1977), that pollutionstudies incorporate the analysis of other environmental variables,and that biological responses to pollution are examined in a widerange of environmental conditions.
Acknowledgements
Authors are grateful to the auxiliary staff of the oceanographiccenters of Vigo and Murcia (IEO), and ECIMAT (Universidade deVigo), for assistance in sample treatment and analysis. The studyhas been funded by a Fund Management Agreement between theIEO and the Spanish Ministry of Agriculture, Food an Environment(2010e2012), and by BIOCOM project (CTM2012-30737, SpanishMinistry of Economy and Competitiveness).
Appendix A. Supplementary data
Supplementary data related to this article can be found at http://dx.doi.org/10.1016/j.marenvres.2013.09.015.
References
Akcha, F., Izuel, C., Venier, P., Budzinski, H., Burgeot, T., Narbornne, J.-F., 2000.Enzymatic biomarker measurement and study of DNA adduct formation inbenzo[a]pyrene-contaminated mussels, Mytilus galloprovincialis. Aquat Toxicol.49, 269e287.
Albentosa, M., Viñas, L., Besada, V., Franco, M.A., González-Quijano, A., 2012. Firstmeasurements of the scope for growth (SFG) in mussels from a large scalesurvey in the North-Atlantic Spanish coast. Sci. Tot. Environ. 435e436, 430e445.
Allen, J.I., Moore, M.N., 2004. Environmental prognostics: Is the current use ofbiomarkers appropriate for environmental risk evaluation? Mar. Environ. Res.58, 227e232.
Álvarez, I., Gómez-Gesteira, M., de Castro, M., Lorenzo, M.N., Crespo, A.J.C., Días, J.M.,2011. Comparative analysis of upwelling influence between the western andnorthern coast of the Iberian Peninsula. Cont. Shelf Res. 31, 388e399.
ANZECC, 1992. Australian Water Quality Guidelines for Fresh and Marine Waters.National water quality management strategy paper no. 4. Australian and NewZealand Environment and Conservation council, Canberra.
Bartolomé, L., Tueros, I., Cortazar, E., Raposo, J.C., Sanz, J., Zuloaga, O., de Diego, A.,Etxebarria, N., Fernández, L.A., Madariaga, J.M., 2006. Distribution of traceorganic contaminants and total mercury in sediments from the Bilbao andUrdaibai Estuaries (Bay of Biscay). Mar. Pollut. Bull. 52, 1111e1117.
Beiras, R., Fernández, N., Bellas, J., Besada, V., González-Quijano, A., Nunes, T., 2003.Integrative assessment of marine pollution in Galician estuaries using sedimentchemistry, mussel bioaccumulation, and embryo-larval toxicity bioassays.Chemosphere 52, 1209e1224.
Beiras, R., Durán, I., Parra, S., Urrutia, M.B., Besada, V., Bellas, J., Viñas, L., Sánchez-Marín, P., González-Quijano, A., Franco, M.A., Nieto, O., González, J.J., 2012.Linking chemical contamination to biological effects in coastal pollutionmonitoring. Ecotoxicology 21, 9e17.
Beliaeff, B., Burgeot, T., 2002. Integrated biomarker response: a useful tool forecological risk assessment. Environ. Toxicol. Chem. 21, 1316e1322.
Bellas, J., González-Quijano, A., Vaamonde, A., Fumega, J., Soriano, J.A., González, J.J.,2011a. PCBs in wild mussels (Mytilus galloprovincialis) from the N-NW Spanishcoast: current levels and long-term trends during the period 1991e2009.Chemosphere 85, 533e541.
Bellas, J., Nieto, O., Beiras, R., 2011b. Integrative assessment of coastal pollution:development and evaluation of sediment quality criteria from chemicalcontamination and ecotoxicological data. Cont. Shelf Res. 31, 448e456.
J. Bellas et al. / Marine Environmental Research 96 (2014) 105e117 115

Author's personal copy
Besada, V., Fumega, J., Vaamonde, A., 2002. Temporal trends of Cd, Cu, Hg, Pb and Znin mussel (Mytilus galloprovincialis) from the Spanish North-Atlantic coast1991e1999. Sci. Total Environ. 288, 239e253.
Besada, V., Andrade, J.M., Schultze, F., González, J.J., 2011a. Comparison of the 2000and 2005 spatial distributions of heavy metals in wild mussels from the Nort-Atlantic Spanish coast. Ecotox. Environ. Safe 74, 373e381.
Besada, V., Andrade, J.M., Schultze, F., González, J.J., 2011b. Monitoring of heavymetals in wild mussel (Mytilus galloprovincialis) from the Spanish North-Atlantic coast. Cont. Shelf Res. 31, 457e465.
Bocquené, G., Galgani, F., 1998. Biological Effects of Contaminants: CholinesterasesInhibition by Organophosphate and Carbamate Compounds. In: ICES Tech-niques in Marine Environmental Sciences, vol. 22, p. 12.
Bocquené, G., Galgani, F., 1990. Characterization and assay conditions for use ofAChE activity from several marine species in pollution monitoring. Mar. Envi-ron. Res. 30, 75e89.
Borkovic, S.S., Saponjic, S.J., Pavlovic, Z.S., Blagojevic, P.D., Milosevic, M.S.,Kovacevic, B.T., Radojicic, M.R., Spasic, B.M., Zikic, V.R., Saicic, S.Z., 2005. Theactivity of antioxidant defence enzymes in the mussel Mytilus galloprovincialisfrom the Adriatic Sea. Comp. Biochem. Phys. Part C 141, 366e374.
Bochetti, R., Regoli, F., 2006. Seasonal variability of oxidative biomarkers, lysosomalparameters, metallothioneins and peroxisomal enzymes in the Mediterraneanmussel Mytilus galloprovincialis from Adriatic Sea. Chemosphere 65, 913e921.
Brooks, S., Lyons, B., Goodsir, F., Bignell, J., Thain, J., 2009. Biomarker responses inmussels, an integrated approach to biological effects measurements. J. Toxicol.Environ. Health Part A 72, 196e208.
Cabanas, J.M., 2000. Variabilidad temporal en las condiciones oceanográficas de lasaguas de la plataforma continental gallega. Algunas consecuencias biológicas.PhD thesis. Facultad de Ciencias. Departamento de Ecología y Biología Animal.Universidad de Vigo, Vigo, p. 155.
Cáceres-Martínez, J., Figueras, A., 1998. Long-term survey on wild and culturedmussels (Mytilus galloprovincialis Lmk.) reproductive cycles in the Ria de Vigo(NW Spain). Aquaculture 162, 141e156.
Calow, P., 1993. General Principles and overview. In: Calow, P. (Ed.), Handbook ofEcotoxicology, vol. I. Blackwell Scientific Publications Ltd, Cambridge, pp. 1e5.
Canesi, L., Viarengo, A., 1997. Age-related differences in glutathione metabolism inmussel tissues (Mytilus edulis L.). Comp. Biochem. Physiol. 116B, 217e221.
Canesi, L., Viarengo, A., Leonzio, C., Filippelli, M., Gallo, G., 1999. Heavy metals andglutathione metabolism in mussel tissues. Aquat. Toxicol. 46, 67e76.
Christensen, J.H., Platz, J., 2001. Screening of polybrominated diphenyl ethers inblue mussels, marine and freshwater sediments in Denmark. J. Environ. Monit.3, 543e547.
Cullen, J.T., Lane, T.W., Morel, F.M.M., Sherrell, R.M., 1999. Modulation of cadmiumuptake in phytoplankton by seawater CO2 concentration. Nature 402, 165e167.
De Boer, J., 1988. Chlorobiphenyls in bound and non-bound lipids of fishes; com-parison of different extraction methods. Chemosphere 17, 1803e1810.
Depledge, M.H., Amaral-Mendes, J.J., Daniel, B., Halbrook, R.S., Kloepper-Sams, P.,Moore, M.N., Peakall, D.B., 1993. The conceptual basis of the biomarkerapproach. In: Peakall, D.B., Shugart, L.R. (Eds.), Biomarkers e Research andApplication in the Assessment of Environmental Health. Springer, Berlin, Hei-delberg, pp. 15e29.
Donkin, P., Widdows, J., Evans, S.V., Staff, F.J., Yan, T., 1997. Effects of neurotoxicpesticides on the feeding rate of marine mussels (Mytilus edulis). Pestic. Sci. 49,196e209.
Elumalai, M., Antunes, C., Guilhermino, L., 2007. Enzymatic biomarkers in the crabCarcinus maenas from the Minho River estuary (NW Portugal) exposed to zincand mercury. Chemosphere 66, 1249e1255.
EVS and PLA, 1998. Technical Evaluation of Fish Methods in Environmental Moni-toring for the Mining Industry in Canada. Report prepared for Aquatic EffectTechnology Evaluation (AETE) Program, Canmet, Natural Resources Canada. EVSEnvironment Consultants and Paine Ledge Associates, North Vancouver BC,p. 66.
Fernández, B., Campillo, J.A., Martínez-Gómez, C., Benedicto, J., 2010. Antioxidantresponses in gills of mussel (Mytilus galloprovincialis) as biomarkers of envi-ronmental stress along the Spanish Mediterranean coast. Aquat Toxicol. 99,186e197.
Fernandez-Martinez, R., Loredo, J., Ordonez, A., Rucandio, M.I., 2005. Distributionand mobility of mercury in soils from an old mining area in Mieres, Asturias(Spain). Sci. Total Environ. 346, 200e212.
Filgueira, R., Labarta, U., Fernández-Reiriz, M.J., 2008. Effect of condition index onallometric relationships of clearance rate in Mytilus galloprovincialis Lamarck,1819. Rev. Biol. Mar. Oceanogr. 43, 391e398.
Finkel, Z.V., Quigg, A.S., Chiampi, R.K., Schofield, O.E., Falkowski, P.G., 2007. Phylo-genetic diversity in cadmium: phosphorus ratio regulation bymarine phyto-plankton. Limnol. Oceanogr. 52, 1131e1138.
Frew, R.D., Hunter, K.A., Beyer, R., 1989. Cadmium in the dredge oyster, Ostrea lutaria-Dependence on age, body weight and distribution in internal organs. Mar.Pollut. Bull. 20, 463e464.
Gama, A.C., Sanatcumar, P., Viana, P., Barceló, D., Bordado, J.C., 2006. The occurrenceof polybrominated diphenyl ethers in river and coastal biota from Portugal.Chemosphere 64, 306e310.
Gómez-Gesteira, M., Beiras, R., Presa, P., Vilas, F., 2011. Coastal Processes in North-western Iberia, Spain. Cont. Shelf Res. 31 (5), 367e375.
González-Quijano, A., Fumega, J., 1996. Determinación de congéneres individualesde bifenilos policlorados en organismos marinos. Informes Técnicos InstitutoEspañol Oceanografía 160, 1e27.
González-Quijano, A., García, A., Fumega, J., González, J.J., 2006. Temporal variationof PCB concentrations in mussel tissue in two areas of Santander Bay (Spain).Ciencias Marinas 32 (2B), 465e469.
Green, N.W., Schøyen, M., Øxnevad, S., Ruus, A., Høgåsen, T., Beylich, B.,Håvardstun, J., Rogne, Å.K.G., Tveiten, L., 2012. Hazardous Substances in Fjordsand Coastal Waters e 2011. Levels, Trends and Effects. Long-term Monitoring ofEnvironmental Quality in Norwegian Coastal Waters. NIVA. http://rapp.niva.no/symfoni/RappArkiv8.nsf/URL/451FAEE69D3C712AC1257B1F004D63EF/$FILE/6432-2012.pdf.
Griffin, J.J., Koide, M., Hodge, V., Goldberg, E.A., 1980. Estimating the ages of musselsby chemical and physical methods. In: Goldberg, E.D., Horibe, Y., Saruhashi, K.(Eds.), Isotope Marine Chemistry. Rokakuho, Tokyo, pp. 193e-209.
Habig, W.H., Pabst, M.J., Jakoby, W.B., 1974. Glutathione S-transferase. The firstenzymatic step in mercapturic acid formation. J. Biol. Chem. 249, 7130e7139.
Halliwell, B., Gutteridge, J.M.C., 1999. Free Radicals in Biology and Medicine. OxfordUniv. Press, Oxford.
His, E., Beiras, R., Seaman, M.N.L., 1999. The assessment of marine pollution. Bio-assays with bivalve embryos and larvae. In: Southward, A.I., Tyler, P.A.M.,Young, C. (Eds.), Advances in Marine Biology, vol. 37. Academic Press, London.
ICES, 2012. Integrated Marine Environmental Monitoring of Chemicals and TheirEffects. ICES cooperative research report N� 135. International Council for theExploitation of the Sea, Copenhaguen, p. 277.
ICES, 2013. Report of the ICES Working Group on Biological Effects of Contaminants(WGBEC), 10e15 March 2013, San Pedro del Pinatar, Spain. ICES CM 2013/SSGHIE:04, p. 37.
Iglesias, J.I.P., Pérez-Camacho, A., Navarro, E., Labarta, U., Beiras, R., Hawkins, A.J.S.,et al., 1996. Microgeographic variability in feeding, absorption and condition ofmussels (Mytilus galloprovincialis Lmk): a transplant experiment. J. Shellfish Res.15, 673e680.
INE (Instituto Nacional de Estadística), 2007. http://www.ine.es.Irabien, M.J., Cearrreta, A., Leorri, E., Gómez, J., Viguri, J., 2008. A 130 year of
pollution in the Suances estuary (southern Bay of Biscay): Implications forenvironmental management. Mar. Pollut. Bull. 56, 1719e1727.
Johansson, I., Héas-Moisan, K., Guiot, N., Munschy, C., Tronczynski, J., 2006. Poly-brominated diphenyl ethers (PBDEs) in mussels from selected French coastalsites: 1981e2003. Chemosphere 64, 296e305.
Koehler, A., 1989. Cellular effects of environmental contamination in fish from theRiver Elbe and the North Sea. Responses to marine organisms to pollutants.Mar. Environ. Res. 28, 417e424.
Labarta, U., Fernández-Reiriz, M.J., Babarro, J.M.F., 1997. Differences in physiologicalenergetics between intertidal and raft cultivated mussels Mytilus gallopro-vincialis. Mar. Ecol. Prog. Ser. 152, 167e173.
Lam, P.K.S., Gray, J.S., 2003. The use of biomarkers in environmental monitoringprogrammes. Mar Pollut. Bull 46, 182e186.
Leorri, E., Cearreta, A., Irabien, M.J., Yustab, I., 2008. Geochemical and microfaunalproxies to assess environmental quality conditions during the recovery processof a heavily polluted estuary: the Bilbao estuary case (N. Spain). Sci. Total En-viron. 396 (1), 12e27.
Livingstone, D.R., García Martínez, P., Michel, X., Narbonne, J.F., ÓHara, S., Ribera, D.,Winston, G.W., 1990. Oxyradical production as a pollutant-mediated mecha-nism of toxicity in the common mussel, Mytilus edulis L., and other molluscs.Funct. Ecol., 415e424.
Long, E.R., MacDonald, D.D., Smith, S.L., Calder, F.D., 1995. Incidence of adversebiological effects within ranges of chemical concentrations in marine andestuarine sediments. Environ. Manage. 19, 81e97.
Lowry, O.H., Rosenbrough, N.J., Farr, A.L., Randall, R.J., 1951. Protein measurementwith the folin phenol reagent. J. Biol. Chem. 193, 266e275.
Lucas, A., Beninger, P.G., 1985. The use of physiological condition indices in marinebivalve aquaculture. Aquaculture 44, 187e200.
Marigomez, I., Zorita, I., Izagirre, U., Ortiz-Zarragoitia, M., Navarro, P., Etxebarria, N.,Orbea, A., Soto, M., Cajaraville, M., 2013. Combined use of native and cagedmussels to assess biological effects of pollution through the integrativebiomarker approach. Aqua. Toxicol. 136e137, 32e48.
Moriarty, F., 1999. Ecotoxicology e the Study of Pollutants in Ecosystems, third ed.Academic Press, London.
McCarthy, J.F., Shugart, L.R., 1990. Biomarkers of Environmental Contamination.Lewis, Boca Raton, Florida.
Oikari, A., Boon, J.P., Fairbrother, A., Fossi, M.C., Rand, G., Renzoni, A.,Simmonds, M., 1993. Development and validation of biomarkers. In:Peakall, D.B., Shugart, L.R. (Eds.), Biomarkers. Research and Application in theAssessment of Environmental Health, Volume 68 of NATO ASI Series, Series H,pp. 63e77.
OSPAR Commission, 2009. Background Document on CEMP Assessment Criteria forQSR 2010. In: Monitoring and Assessment Series. OSPAR Commission, London.
OSPAR Commission, 2010. Quality Status Report 2010. OSPAR Commission, London.OSPAR Commission, 2012a. Cemp 2011 Assessment Report. In: Monitoring
Assessment Series. OSPAR Commission, London.OSPAR Commission, 2012b. Environmental Assessment Criteria (EACs) for Haz-
ardous Substances in the Marine Environment: OSPAR Contribution toAddressing the Challenge of Assessing Chemical Quality across All MarineWaters. OSPAR Commission, London.
Peterson, R.A., 2000. A meta-analysis of variance accounted for and factor loadingsin exploratory factor analysis. Marketing Lett. 11 (3), 261e275.
Prego, R., Cobelo-García, A., 2003. Twentieth century overview of heavy metals inthe Galician Rias (NW Iberian Peninsula). Environ. Pollut. 121, 425e452.
J. Bellas et al. / Marine Environmental Research 96 (2014) 105e117116

Author's personal copy
QUASIMEME,2010.QuasimemeLaboratory Performance Studies. Round60, 62 (Biota) -BT-1 Trace metals, BS-1 Brominated flame retardants, BT-4 Poly Aromatic Hydro-carbons, BT-2 Chlorinated organics. Report Issue 1: 260510, 17112010.
Regoli, F., 1998. Trace metals and antioxidant enzymes in gills and digestive gland ofthe Mediterranean mussel Mytilus galloprovincialis. Arch. Environ. Contam.Toxicol. 34, 48e63.
Richardson, B.J., Mak, E., De Luca-Abbott, S.B., Martin, M., McClellan, K., Lam, P.K.S.,2008. Antioxidant responses to polycyclic aromatic hydrocarbons and organo-chlorine pesticides in green lipped mussels (Perna viridis): do mussels ‘‘inte-grate” biomarker responses? Mar. Pollut. Bull. 57, 503e514.
Rickwood, C.J., Galloway, T.S., 2004. Acetylcholinesterase inhibition as a biomarkerof adverse effect: a study of Mytilus edulis exposed to the priority pollutantchlorfenvinphos. Aquat. Toxicol. 67, 45e56.
Segovia-Zavala, J.A., Delgadillo-Hinojosa, F., Vidal-Talamantes, R., Munoz-Barbosa, A., Gutierrez-Galindo, E.A., 2003. Mytilus californianus transplanted asupwelling bioindicators to two areas off Baja California, Mexico. Ciencias Ma-rinas 29, 665e675.
Sericano, J.L., Wade, T.L., Jackson, T.J., Brooks, J.M., Tripp, B.W., Farrington, J.W., et al.,1995. Trace organic contamination in the Americas: an overview of the USNational Status and Trends and the International “Mussel Watch” programs.Mar. Pollut. Bull. 31, 214e225.
Sheehan, D., Meade, G., Foley, V.M., Dowd, C.A., 2001. Structure, function andevolution of glutathione transferase for classification of non-mammalianmembers of an ancient superfamily. Biochem. J. 360, 1e16.
Smaal, A.C., Wagenvoort, A., Hemelraad, J., Akkerman, I., 1991. Response to stress ofmussels (Mytilus edulis) exposed in Dutch tidal waters. Com Biochem. Phys. C100, 197e200.
Soriano, J.A., Viñas, L., Franco, M.A., González, J.J., Ortiz, L., Bayona, J.M., Albaigés, J.,2006. Spatial and temporal trends of petroleum hydrocarbons in wild musselsfrom the Galician coast (NW Spain) affected by the Prestige oil spill. Sci. TotalEnviron. 370, 80e90.
Soriano, J.A., Viñas, L., Franco, M.A., González, J.J., Nguyen, M.H., Bayona, J.M.,Albaigés, J., 2007. Spatial and temporal trends of polycyclic aromatic hydro-carbons in wild mussels from the Cantabrian coast (N Spain) after the Prestigeoil spill. J. Environ. Monit. 9, 1018e1023.
Sukhotin, A.A., Abele, D., Pörtner, H.O., 2002. Growth, metabolism and lipid peroxi-dation inMytilus edulis L.: age and size effects. Mar. Ecol. Prog. Ser. 226, 223e234.
Sukhotin, A.A., Lajus, D.L., Lesis, P.A., 2003. Influence of age and size on pumpingactivity and stress resistance in the marine bivalve Mytilus edulis L. J. Exp. MarBiol. Ecol. 284, 129e144.
Toro, B., Navarro, J.M., Palma-Fleming, H., 2003. Use of clearance rate in Choromy-tilus chorus (Bivalvia: Mytilidae) as a non-destructive biomarker of aquaticpollution. Rev. Chi. Hist. Nat. 76, 267e274.
Tueros, I., Borja, A., Larreta, J., Rodriguez, J.G., Valencia, V., Millan, E., 2009. Inte-grating long-term water and sediment pollution data, in assessing chemicalstatus within the European Water Framework Directive. Mar. Pollut. Bull. 58,1389e1400.
USEPA, 2000. A Framework for an Integrated and Comprehensive Monitoring Planfor the Estuaries of the Gulf of Mexico. EPA, Washington, pp. 1e87.
UNEP, 1997. Report of the Meeting of Experts to Review the MED POL BiomonitoringProgramme. Athens, Greece, UNEP-(OCA)/MED WG, 132/7.
Viarengo, A., Lowe, D., Bolognesi, C., Fabbri, E., Koehler, A., 2007. The use of bio-markers in biomonitoring: A 2-tier approach assessing the level of pollutant-induced stress syndrome in sentinel organisms. Comp. Biochem. Phys. C 146,281e300.
Vidal-Liñán, L., Bellas, J., Campillo, J.A., Beiras, R., 2010. Integrated use of anti-oxidant enzymes in mussels, Mytilus galloprovincialis, for monitoringpollution in highly productive coastal areas of Galicia (NW Spain). Chemo-sphere 78, 265e272.
Vidal-Liñán, L., Bellas, J., 2013. Practical procedures for selected biomarkers inmussels, Mytilus galloprovincialis e implications for marine pollution moni-toring. Sci. Tot. Environ. 461e462, 56e64.
Vidal-Liñán, L., Bellas, J., Etxebarria, N., Nieto, O., Beiras, R., 2013. Glutathione S-transferase, glutathione peroxidase and acetylcholinesterase activities in mus-sels transplanted to harbour areas. In: 17th International Symposium onPollutant Responses in Marine Organisms (PRIMO 17). 5e8 May 2013. FAro(Portugal).
Vieira, L.R., Gravato, C., Soares, A.M.V.M., Morgado, F., Guilhermino, L., 2009. Acuteeffects of copper and mercury on the estuarine fish Pomatochistus microps:linking biomarkers to behavior. Chemosphere 76, 1416e1427.
Villalba, A., 1995. Gametogenic cycle of cultured mussel, Mytilus galloprovincialis, inthe bays of Galicia (NW Spain). Aquaculture 130, 269e277.
Walker, C.H., Hopkin, S.P., Sibly, R.M., Peakall, D.B., 2001. Principles of Ecotoxicology,second ed. Taylor & Francis, London.
Warren, C.E., Liss, W.J., 1977. Design and Evaluation of Laboratory Ecological SystemStudies. US Environmental Protection Agency, Duluth, Minnesota.
Widdows, J., Donkin, P., 1991. Role of physiological energetic in ecotoxicology.Comp. Biochem. Phys. 100C, 69e75.
Widdows, J., Staff, F.J., 2006. Biological Effects of Contaminants: Measurement ofScope for Growth in Mussels. In: ICES Techniques in Marine EnvironmentalSciences, vol. 40, p. 30.
Widdows, J., Donkin, P., Brinsley, M.D., Evans, S.V., Salkeld, P.N., Franklin, A.,Law, R.J., Waldock, M.J., 1995. Scope for growth and contaminant levels in NorthSea mussels Mytilus edulis. Mar. Ecol. Prog. Ser. 127, 131e148.
Widdows, J., Nasci, C., Fossato, V.U., 1997. Effects of pollution on the scope forgrowth of mussels (Mytilus galloprovincialis) from the Venice lagoon. Mar. En-viron. Res. 43, 69e79.
Widdows, J., Donkin, P., Staff, F.J., Matthiessen, P., Law, R.J., Allen, Y.T., et al., 2002.Measurement of stress effects (scope for growth) and contaminant levels inmussels (Mytilus edulis) collected from the Irish Sea. Mar. Environ. Res. 53,327e356.
Wyse, E.J., Azemard, S., Mora, S.J.D., 2003. World-wide Intercomparison Exercise forthe Determination of Trace Elements Andmethylmercury in Fish HomogenateIAEA-407. IAEA/AL/144; IAEA/MEL/72. International Atomic Energy Agency,Monaco.
Yap, C.K., Ismail, A., Tan, S.G., 2003. Effects of total soft tissue and shell thickness onthe accumulation of heavy metals (Cd, Cu, Pb, and Zn) in the green-lippedmussel Perna viridis. Russ. J. Mar Biol. 29, 323e327.
J. Bellas et al. / Marine Environmental Research 96 (2014) 105e117 117