Combined micro‐Raman, micro‐infrared, and field emission scanning electron microscope analyses...
31
Meteoritics & Planetary Science 43, Nr 1/2, 367–397 (2008) Abstract available online at http://meteoritics.org AUTHOR’S PROOF 367 © The Meteoritical Society, 2008. Printed in USA. Combined micro-Raman, micro-infrared, and field emission scanning electron microscope analyses of comet 81P/Wild 2 particles collected by Stardust A. ROTUNDI 1* , G. A. BARATTA 2 , J. BORG 3 , J. R. BRUCATO 4 , H. BUSEMANN 5, 6 , L. COLANGELI 7 , L. D’HENDECOURT 3 , Z. DJOUADI 3 , G. FERRINI 8 , I. A. FRANCHI 6 , M. FRIES 9 , F. GROSSEMY 3 , L. P. KELLER 10 , V. MENNELLA 7 , K. NAKAMURA 11 , L. R. NITTLER 5 , M. E. PALUMBO 2 , S. A. SANDFORD 12 , A. STEELE 9 , and B. WOPENKA 13 1 Dip. Scienze Applicate, Università degli Studi di Napoli “Parthenope”, Napoli 80133, Italy 2 INAF-Osservatorio Astrofisico di Catania, Via Santa Sofia 78, 95123 Catania, Italy 3 Institut d’Astrophysique Spatiale (IAS), CNRS, Université Paris-Sud, UMR8617, F-91405 Orsay-Cedex, France 4 INAF-Osservatorio Astronomico di Arcetri, L.go E. Fermi 5, 50125 Firenze, Italy 5 Department of Terrestrial Magnetism, Carnegie Institution of Washington, Washington, D.C. 20015–1305, USA 6 PSSRI, Open University, Milton Keynes MK7 6AA, UK 7 INAF-Osservatorio Astronomico di Capodimonte, Via Moiariello 16, 80131 Napoli, Italy 8 Novaetech s.r.l., Città della Scienza, via Coroglio 57d, 80124 Napoli, Italy 9 Geophysical Laboratory, Carnegie Institution of Washington, Washington, D.C. 20015–1305, USA 10 NASA Johnson Space Center, Houston, Texas 77058, USA 11 ESCG/Jacobs Engineering, NASA Johnson Space Center, Houston Texas 77058, USA 12 Astrophysics Branch, NASA Ames Research Center, Moffett Field, California 94035, USA 13 Department of Earth and Planetary Sciences and McDonnell Center for the Space Sciences, Washington University, Saint Louis, Missouri 63130–4899, USA * Corresponding author. E-mail: [email protected] (Submitted 12 April 2007; revision accepted 13 September 2007) Abstract–We report combined micro-infrared, micro-Raman, and field emission scanning electron microscope (FESEM) analyses of particles collected by the Stardust spacecraft during its flyby of comet 81P/Wild 2 on 2 January 2004 and successfully returned back to Earth on 15 January 2006. We present mid-infrared (IR) spectra of six of these particles. The CH 2 /CH 3 ratios inferred from the infrared data are greater than those seen in organics in the diffuse interstellar medium, possibly indicating the presence of longer or less branched aliphatic chains. The micro-Raman data offer insights into the state of the order of the carbonaceous component present in the particles. Raman parameters for most of the particles span a similar range to that observed in interplanetary dust particles (IDPs) and the most primitive meteorites. Both the IR and Raman data imply the presence of a very labile carbonaceous component. Hydrated silicates may be present in two particles of Track 35, one of which may also contain carbonates, but further investigations with other techniques need to be performed to confirm these findings. In some cases, the analyses are difficult to interpret because of the presence of compressed aerogel mixed with the grains. INTRODUCTION Comets are considered to be the most primitive bodies in the solar system, and for this reason they have been the targets of a number of recent space missions. After the Giotto and Vega encounters with the old (many passages close to the Sun) comet Halley in 1986 (Grewing et al. 1987) and the Deep Space 1 flyby of very old comet Borrelly in 2001 (Nelson et al. 2004), Stardust captured particles around the young comet 81P/Wild 2 on 2 January 2004 and returned them to Earth on January 15, 2006 (Brownlee et al. 2006). The returned cometary samples were collected in aerogel. On a limited number of these grains, extracted from tracks formed by the impact of the grains into the aerogel (Fig. 1), a preliminary examination was performed using a variety of analytical techniques in dedicated laboratories (see the special 2006 issue of Science [issue 314, #5806] and are now available for study by the general scientific community. The data presented here represent a portion of the preliminary examination (PE) effort.
-
Upload
independent -
Category
Documents
-
view
1 -
download
0
Transcript of Combined micro‐Raman, micro‐infrared, and field emission scanning electron microscope analyses...
Meteoritics & Planetary Science 43, Nr 1/2, 367–397 (2008)Abstract available online at http://meteoritics.org
AUTHOR’S PROOF
367 © The Meteoritical Society, 2008. Printed in USA.
Combined micro-Raman, micro-infrared, and field emission scanning electron microscope analyses of comet 81P/Wild 2 particles collected by Stardust
A. ROTUNDI1*, G. A. BARATTA2, J. BORG3, J. R. BRUCATO4, H. BUSEMANN5, 6, L. COLANGELI7,L. D’HENDECOURT3, Z. DJOUADI3, G. FERRINI8, I. A. FRANCHI6, M. FRIES9, F. GROSSEMY3,
L. P. KELLER10, V. MENNELLA7, K. NAKAMURA11, L. R. NITTLER5, M. E. PALUMBO2,S. A. SANDFORD12, A. STEELE9, and B. WOPENKA13
1Dip. Scienze Applicate, Università degli Studi di Napoli “Parthenope”, Napoli 80133, Italy2INAF-Osservatorio Astrofisico di Catania, Via Santa Sofia 78, 95123 Catania, Italy
3Institut d’Astrophysique Spatiale (IAS), CNRS, Université Paris-Sud, UMR8617, F-91405 Orsay-Cedex, France4INAF-Osservatorio Astronomico di Arcetri, L.go E. Fermi 5, 50125 Firenze, Italy
5Department of Terrestrial Magnetism, Carnegie Institution of Washington, Washington, D.C. 20015–1305, USA6PSSRI, Open University, Milton Keynes MK7 6AA, UK
7INAF-Osservatorio Astronomico di Capodimonte, Via Moiariello 16, 80131 Napoli, Italy8Novaetech s.r.l., Città della Scienza, via Coroglio 57d, 80124 Napoli, Italy
9Geophysical Laboratory, Carnegie Institution of Washington, Washington, D.C. 20015–1305, USA10NASA Johnson Space Center, Houston, Texas 77058, USA
11ESCG/Jacobs Engineering, NASA Johnson Space Center, Houston Texas 77058, USA 12Astrophysics Branch, NASA Ames Research Center, Moffett Field, California 94035, USA
13Department of Earth and Planetary Sciences and McDonnell Center for the Space Sciences, Washington University,Saint Louis, Missouri 63130–4899, USA
*Corresponding author. E-mail: [email protected]
(Submitted 12 April 2007; revision accepted 13 September 2007)
Abstract–We report combined micro-infrared, micro-Raman, and field emission scanning electronmicroscope (FESEM) analyses of particles collected by the Stardust spacecraft during its flyby ofcomet 81P/Wild 2 on 2 January 2004 and successfully returned back to Earth on 15 January 2006.We present mid-infrared (IR) spectra of six of these particles. The CH2/CH3 ratios inferred from theinfrared data are greater than those seen in organics in the diffuse interstellar medium, possiblyindicating the presence of longer or less branched aliphatic chains. The micro-Raman data offerinsights into the state of the order of the carbonaceous component present in the particles. Ramanparameters for most of the particles span a similar range to that observed in interplanetary dustparticles (IDPs) and the most primitive meteorites. Both the IR and Raman data imply the presenceof a very labile carbonaceous component. Hydrated silicates may be present in two particles ofTrack 35, one of which may also contain carbonates, but further investigations with othertechniques need to be performed to confirm these findings. In some cases, the analyses are difficultto interpret because of the presence of compressed aerogel mixed with the grains.
INTRODUCTION
Comets are considered to be the most primitive bodies inthe solar system, and for this reason they have been the targetsof a number of recent space missions. After the Giotto andVega encounters with the old (many passages close to theSun) comet Halley in 1986 (Grewing et al. 1987) and theDeep Space 1 flyby of very old comet Borrelly in 2001(Nelson et al. 2004), Stardust captured particles around theyoung comet 81P/Wild 2 on 2 January 2004 and returned
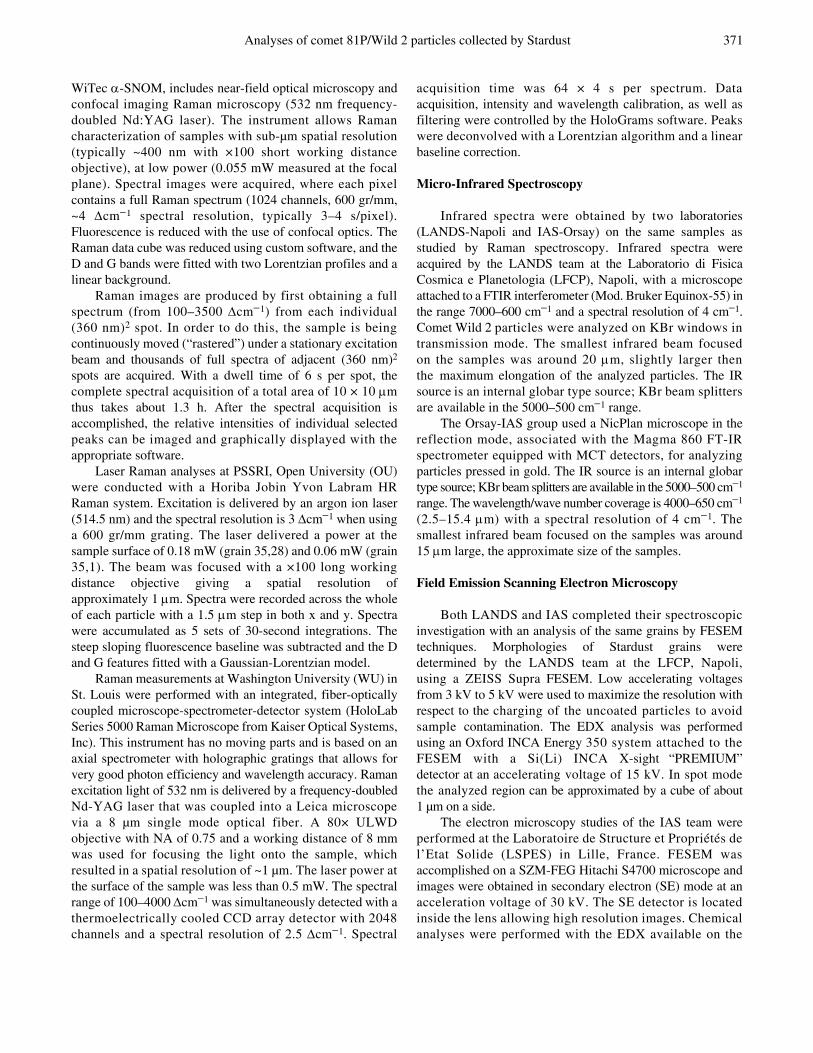
them to Earth on January 15, 2006 (Brownlee et al. 2006).The returned cometary samples were collected in aerogel.On a limited number of these grains, extracted from tracksformed by the impact of the grains into the aerogel(Fig. 1), a preliminary examination was performed using avariety of analytical techniques in dedicated laboratories (seethe special 2006 issue of Science [issue 314, #5806] and arenow available for study by the general scientific community.The data presented here represent a portion of the preliminaryexamination (PE) effort.

368 A. Rotundi et al.
One of the driving forces for comet exploration is toconfirm the historical theory, hypothesized by Halley,published by Newton in his Principia in 1686, and developedmore or less continuously ever since (Anders 1989; Oró etal. 2006) that comets may have played an important rolein the development of life on Earth. The extent to whichcomets enriched the primordial Earth with reactive C-bearing molecules and water is not known. The estimate ofthe endogenous contribution to Earth’s organic inventoryduring this period is in the order of 108–1010 kg yr−1 (Chyba andSagan 1997), while the flux of organic matter delivered tothe Earth via comets and asteroids, averaged over the heavybombardment period, may have been even larger at around1011 kg yr−1 (Oró et al. 2006).
Organic molecules have been detected in some comets byprevious comet flybys, e.g., comet Halley (Kissel andKrueger 1987; Fomenkova 1999), and by astronomicalobservations of comets like Hale-Bopp and Hyakutake (e.g.,Irvine et al. 2000; Bockelée-Morvan et al. 2004; Crovisier2004; Rodgers and Charnley 2004). The presence of C-bearing molecules in comets is to be expected based onnumerous astronomical observations in which complexorganic molecules have been detected, in dense molecularclouds and the diffuse interstellar medium (e.g., Sandfordet al. 1991; Pendleton et al. 1994; Kuan et al. 2003; Hollis etal. 2004). Dense clouds are known to contain mixedmolecular ices. The radiation processing of these icescould produce a host of organic species, including someof astrobiological interest (e.g., Bernstein et al. 1999,2002; Dworkin et al. 2001). Molecular clouds are the parentreservoirs of protoplanetary disks, like the solar nebula,where grains were further irradiated and the effects ofwhich may be at least as important as those occurring inthe diffuse interstellar medium (ISM). This is particularlytrue if accretion occurred during an active phase of theyoung Sun (T-Tauri phase; Strazzulla et al. 1991, 2003;Gil-Hutton 2002). Organic molecules in comets couldshow a higher complexity than the diffuse ISM due to
the reaction with fine grains of variable compositionssuch as ices and silicates as well as carbon grains andvarious molecules. Silicates act as catalysts for thereaction of organic molecules to higher complexity(Brucato et al. 2006a, 2006b). The catalytic effects ofcosmic dust analogues in prebiotic reactions have beenstudied in the laboratory at high temperatures (Hill and Nuth2003) and in conditions simulating the environmentsassumed for the early Earth (Saladino et al. 2004). A largesuite of complex organic molecules have been synthesizedin the gas phase on the surface of cosmic silicate dustanalogues (Hill and Nuth 2003; Saladino et al. 2005).
Due to the various reaction pathways outlined above,organic molecules in minor bodies of the solar system couldpotentially be more complex than in the ISM. A hint tothis may be seen in the difference between the CH2/CH3ratio derived for the IDPs (3.7; Matrajt et al. 2005) andthe considerably smaller ratio measured for lines of sightthrough the diffuse ISM (2.2; Sandford et al. 1991;Pendleton et al. 1994), suggesting longer aliphatic chainsare present in IDPs than in the diffuse ISM. Additionaldifferences are seen in the oxygen contents of these twotypes of organics. Carbon X-ray absorption near-edgestructure (C-XANES) and infrared (IR) spectroscopicanalyses detected significant concentrations of O in IDPs(Flynn et al. 2003; Keller et al. 2004) and in comet 81P/Wild 2 (Sandford et al. 2006; Cody et al. 2008), but IRspectral evidence indicates the organics in the diffuse ISMcontain relatively little oxygen (Pendleton and Allamandola2002; Dartois et al. 2005).
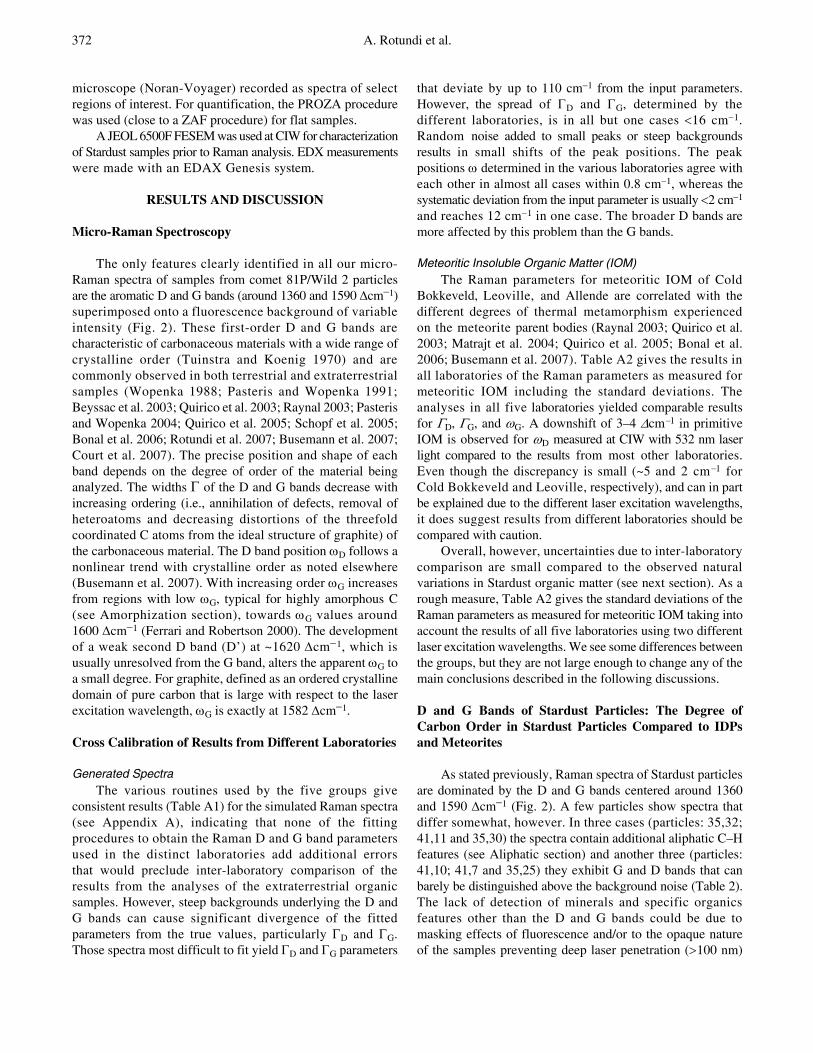
Raman spectra of disordered carbonaceous materials aredominated by two bands centered near 1360 and 1590 Δcm−1
(Fig. 2). The lower wave number D band (for disorder) isdue to a breathing mode involving aromatic rings while thehigher G band (for graphitic) is due to in-plane stretching of pairsof sp2-bonded C atoms in both rings and chains (e.g., Ferrariand Robertson 2000). The precise position and shape of eachband depends on the degree of order of the material beinganalyzed. With increasing ordering of the carbonaceousmaterial, i.e., the more similar the material becomes to“disordered graphite,” the widths Γ of the D and G bandsdecrease. So Raman spectroscopy is a complementarytool used to better understand the nature of the organicspresent in extraterrestrial matter.
Several studies have shown that many IDPs exhibitRaman spectra characteristic of the presence of amorphousaromatic carbon (Wopenka 1988; Raynal et al. 2001; Quiricoet al. 2005; Rotundi et al. 2007). In almost all Raman analyseson IDPs, the only features seen are the amorphous carbon “G”and “D” bands superimposed upon a fluorescencebackground of variable intensity, although features due tominerals have been detected in a few cases (e.g., Stadermannet al. 2006; Rotundi et al. 2007). The rarity of detectionsof minerals in Raman spectra could be due to somecombination of: a) fluorescence that masks weak features, b)
Fig. 1. An optical micrograph of Track 35. The dashed box indicateswhere grains from 17 to 32 were located prior to removal. Grain 1was also located in the main “bulb” region but on the upper portion.

Analyses of comet 81P/Wild 2 particles collected by Stardust 369
the opaque nature of the samples that prevents deep visiblelaser penetration, and c) the very high Raman scatteringefficiency of the amorphous carbon bands G and D withrespect to minerals (Quirico et al. 2005).
In this paper, we present Raman spectroscopic resultsobtained on 16 grains extracted from three tracks of theStardust aerogel cometary collector. Seven of these grainswere further analyzed by IR spectroscopy and/or by fieldemission scanning electron microscopy (FESEM), andenergy dispersive X-ray analyzer (EDX). FESEM-EDXexaminations provide additional information on morphology,mineralogy, and identification of C-rich entities. Our resultswill be compared to other primitive solar system samples likeIDPs and some meteorite grains. We characterize thesevarious samples in terms of the nature of the organic matterpresent, and compare our findings with what is known aboutorganic molecules in the ISM. Preliminary reports of some ofthese data can be found in Sandford et al. (2006) and Kelleret al. (2006).
EXPERIMENTAL
The analyses reported in this paper were performed aspart of the PE phase of the returned Stardust samples(Brownlee et al. 2006). These analyses were made in anumber of different laboratories on samples prepared invarious ways. Details of the types of samples examined aregiven below and summarized in Table 1. To comparedifferent results obtained by different groups, in particularfor the Raman analyses, some preliminary crosscalibrations were performed.
Sample Description and Preparation
Whole tracks in the aerogel collectors were extractedusing techniques developed at the Space Sciences Laboratory,University of California in Berkeley by A. Westphal and histeam (Westphal et al. 2004). Individual particles were“plucked” from these impact tracks. After extraction, theStardust grains to be delivered to the LANDS team weredeposited as bulk particles on special sample holders (SSH)(Rotundi et al. 2007). These SSHs kept the samples safeduring shipment and allowed, without sample manipulation,combined micro-IR (transmission), micro-Raman, FESEM,and EDX analyses (Rotundi et al. 2007). In the SSHconfiguration the particles lie on a KBr window, coatedwith a thin Cr layer to prevent sample charging under theFESEM beam. This also secures the particles without theneed for any sticking material or pressing into the KBr,thereby avoiding sample contamination and morphologymodification. Other Stardust grains were pressed in gold thatallows the same set of analyses, the differences being that IRdata are then acquired in the reflection mode rather than intransmission mode and the original grain morphologies are
modified. Two samples were microtomed thin sections, onemounted on an amorphous silicon dioxide/monoxidemembrane and one mounted on gold, following sulfurembedding. The “‘potted butt,” remaining after themicrotoming of one of these particles (17,1), was pressed ingold resulting in two small fragments (Table 1). Note that 11of the 16 analyzed particles came from a single impact track,C2054 Track 35 (Fig. 1, Table 1).
Analytical Techniques
Data were obtained using three different analyticaltechniques—micro-Raman spectroscopy, micro-infraredspectroscopy, and field emission scanning electronmicroscopy. Details of the application of these techniques to
b
Fig. 2. Raman spectra of selected Stardust samples compared tothose of interplanetary dust particles (Rotundi et al. 2007) andinsoluble organic matter from two meteorites (Busemann et al.2007). All spectra exhibit characteristic D and G bands due todisordered carbonaceous materials and fluorescence backgroundsof various intensities.
370 A. Rotundi et al.
the Stardust samples are described in the followingparagraphs.
Micro-Raman Spectroscopy
All groups performed Raman analyses on theirrespective samples. In order to allow the inter-comparison ofStardust Raman spectroscopic results obtained in thedifferent laboratories and assess the fitting routines usedby the different groups, we performed two systematic tests:(1) all groups reduced a set of simulated Raman spectra usingprocedures as close as possible to the protocols outlinedhereafter used for the Stardust samples; (2) all groupsanalyzed small fragments of meteoritic Insoluble OrganicMatter (IOM) extracted from three meteorites, the primitivecarbonaceous chondrite (CC) Cold Bokkeveld (CM2), theintermediate CC Leoville (CV3.0), and the thermallymetamorphosed CC Allende (CV3.2) (Alexander et al.2007). The three meteorite IOM samples were relativelyhomogeneous, and their average D and G band parametersare distinctly different, as one would expect due to thedifferent degrees of metamorphism those meteorites experienced(Busemann et al. 2007). Hence, they are well suited for inter-laboratory comparisons. The details of these calibrations canbe found in Appendix A.
Raman spectra were taken by the LANDS (LaboratoryAnalyses of Dust from Space) team at the Laboratorio di
Astrofisica Sperimentale, Catania using a continuous multi-line Ar ion laser beam at 514.5 nm wavelength. A confocalmicroscope (DILOR) focuses the laser beam onto the particlein a 1 µm diameter spot with a power mostly maintained at0.03 mW and always lower than 0.1 mW. The Raman scatteredlight arising from the illuminated spot is collected by the sameobjective and is collimated into a parallel beam that isreflected back along the same path of the laser. The Ramanscattered light is then focused on the entrance slit of the triplematespectrometer (SPEX) equipped with a CCD detector, allowingmeasurements with negligible performance losses (Rotundiet al. 2007). The spectral resolution used for Stardust particlewas 8 Δcm−1 with a peak accuracy of 1 Δcm−1. The D and Gfeatures were fitted with two Lorentzian bands and a linearbaseline.
Raman spectra were obtained by the Orsay-Institutd’Astrophysique Spatiale (IAS) team with a Labram HR800Horiba Jobin-Yvon spectrometer (national facility equipmentat Ecole Normale Supérieure, Lyon). Excitation is deliveredby an argon ion laser (514.5 nm) and the spectral resolution is1 Δcm−1 when using a 1800 gr/mm grating. The laser powerat the sample surface did not exceed 0.1 mW. The spatialresolution is 1 mm using a ×100 Olympus objective. Theanalytical procedure consisted of fitting the D and G bandswith two Lorentzian bands and a linear baseline.
Raman analyses made at the CIW were performed with amulti-function scanning probe microscope. The instrument, a
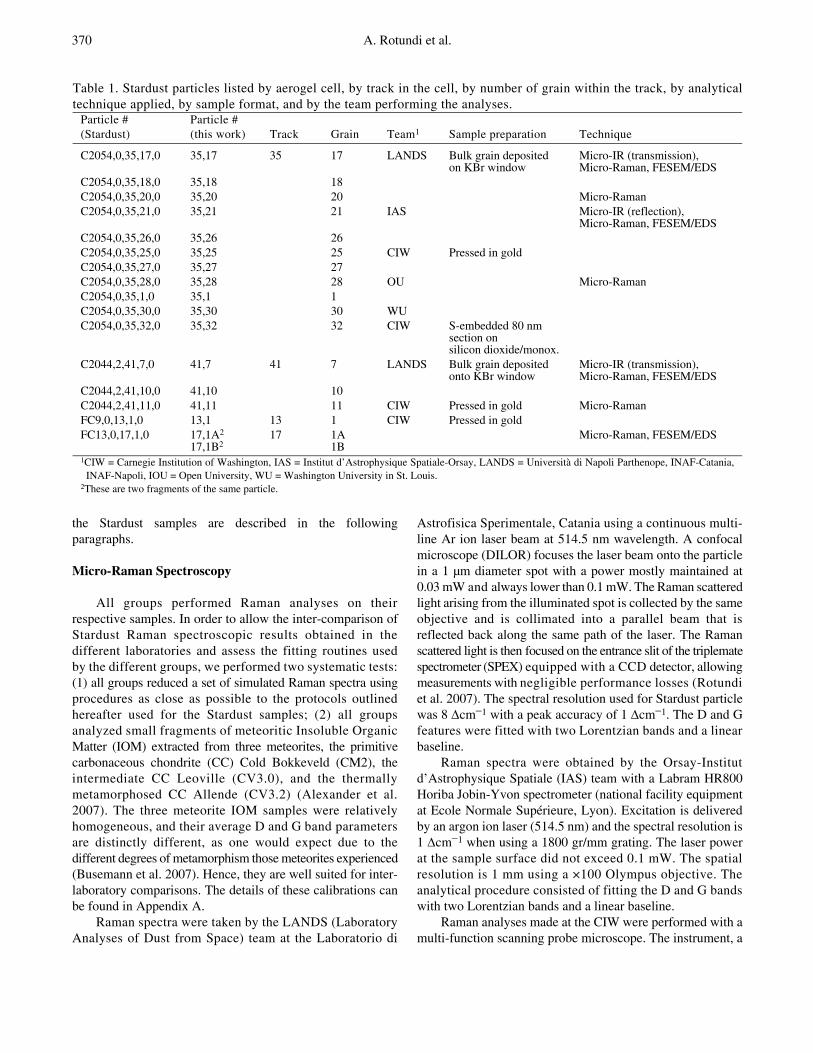
Table 1. Stardust particles listed by aerogel cell, by track in the cell, by number of grain within the track, by analyticaltechnique applied, by sample format, and by the team performing the analyses.
Particle #(Stardust)
Particle #(this work) Track Grain Team1 Sample preparation Technique
C2054,0,35,17,0 35,17 35 17 LANDS Bulk grain depositedon KBr window
Micro-IR (transmission), Micro-Raman, FESEM/EDS
C2054,0,35,18,0 35,18 18C2054,0,35,20,0 35,20 20 Micro-RamanC2054,0,35,21,0 35,21 21 IAS Micro-IR (reflection),
Micro-Raman, FESEM/EDSC2054,0,35,26,0 35,26 26C2054,0,35,25,0 35,25 25 CIW Pressed in goldC2054,0,35,27,0 35,27 27C2054,0,35,28,0 35,28 28 OU Micro-RamanC2054,0,35,1,0 35,1 1C2054,0,35,30,0 35,30 30 WUC2054,0,35,32,0 35,32 32 CIW S-embedded 80 nm
section on silicon dioxide/monox.
C2044,2,41,7,0 41,7 41 7 LANDS Bulk grain deposited onto KBr window
Micro-IR (transmission), Micro-Raman, FESEM/EDS
C2044,2,41,10,0 41,10 10C2044,2,41,11,0 41,11 11 CIW Pressed in gold Micro-RamanFC9,0,13,1,0 13,1 13 1 CIW Pressed in goldFC13,0,17,1,0 17,1A2
17,1B217 1A
1BMicro-Raman, FESEM/EDS
1CIW = Carnegie Institution of Washington, IAS = Institut d’Astrophysique Spatiale-Orsay, LANDS = Università di Napoli Parthenope, INAF-Catania,INAF-Napoli, IOU = Open University, WU = Washington University in St. Louis.
2These are two fragments of the same particle.
Analyses of comet 81P/Wild 2 particles collected by Stardust 371
WiTec α-SNOM, includes near-field optical microscopy andconfocal imaging Raman microscopy (532 nm frequency-doubled Nd:YAG laser). The instrument allows Ramancharacterization of samples with sub-µm spatial resolution(typically ~400 nm with ×100 short working distanceobjective), at low power (0.055 mW measured at the focalplane). Spectral images were acquired, where each pixelcontains a full Raman spectrum (1024 channels, 600 gr/mm,~4 Δcm−1 spectral resolution, typically 3–4 s/pixel).Fluorescence is reduced with the use of confocal optics. TheRaman data cube was reduced using custom software, and theD and G bands were fitted with two Lorentzian profiles and alinear background.
Raman images are produced by first obtaining a fullspectrum (from 100–3500 Δcm−1) from each individual(360 nm)2 spot. In order to do this, the sample is beingcontinuously moved (“rastered”) under a stationary excitationbeam and thousands of full spectra of adjacent (360 nm)2
spots are acquired. With a dwell time of 6 s per spot, thecomplete spectral acquisition of a total area of 10 × 10 μmthus takes about 1.3 h. After the spectral acquisition isaccomplished, the relative intensities of individual selectedpeaks can be imaged and graphically displayed with theappropriate software.
Laser Raman analyses at PSSRI, Open University (OU)were conducted with a Horiba Jobin Yvon Labram HRRaman system. Excitation is delivered by an argon ion laser(514.5 nm) and the spectral resolution is 3 Δcm−1 when usinga 600 gr/mm grating. The laser delivered a power at thesample surface of 0.18 mW (grain 35,28) and 0.06 mW (grain35,1). The beam was focused with a ×100 long workingdistance objective giving a spatial resolution ofapproximately 1 μm. Spectra were recorded across the wholeof each particle with a 1.5 μm step in both x and y. Spectrawere accumulated as 5 sets of 30-second integrations. Thesteep sloping fluorescence baseline was subtracted and the Dand G features fitted with a Gaussian-Lorentzian model.
Raman measurements at Washington University (WU) inSt. Louis were performed with an integrated, fiber-opticallycoupled microscope-spectrometer-detector system (HoloLabSeries 5000 Raman Microscope from Kaiser Optical Systems,Inc). This instrument has no moving parts and is based on anaxial spectrometer with holographic gratings that allows forvery good photon efficiency and wavelength accuracy. Ramanexcitation light of 532 nm is delivered by a frequency-doubledNd-YAG laser that was coupled into a Leica microscopevia a 8 µm single mode optical fiber. A 80× ULWDobjective with NA of 0.75 and a working distance of 8 mmwas used for focusing the light onto the sample, whichresulted in a spatial resolution of ~1 µm. The laser power atthe surface of the sample was less than 0.5 mW. The spectralrange of 100–4000 Δcm−1 was simultaneously detected with athermoelectrically cooled CCD array detector with 2048channels and a spectral resolution of 2.5 Δcm−1. Spectral
acquisition time was 64 × 4 s per spectrum. Dataacquisition, intensity and wavelength calibration, as well asfiltering were controlled by the HoloGrams software. Peakswere deconvolved with a Lorentzian algorithm and a linearbaseline correction.
Micro-Infrared Spectroscopy
Infrared spectra were obtained by two laboratories(LANDS-Napoli and IAS-Orsay) on the same samples asstudied by Raman spectroscopy. Infrared spectra wereacquired by the LANDS team at the Laboratorio di FisicaCosmica e Planetologia (LFCP), Napoli, with a microscopeattached to a FTIR interferometer (Mod. Bruker Equinox-55) inthe range 7000–600 cm−1 and a spectral resolution of 4 cm−1.Comet Wild 2 particles were analyzed on KBr windows intransmission mode. The smallest infrared beam focusedon the samples was around 20 μm, slightly larger thenthe maximum elongation of the analyzed particles. The IRsource is an internal globar type source; KBr beam splittersare available in the 5000–500 cm−1 range.
The Orsay-IAS group used a NicPlan microscope in thereflection mode, associated with the Magma 860 FT-IRspectrometer equipped with MCT detectors, for analyzingparticles pressed in gold. The IR source is an internal globartype source; KBr beam splitters are available in the 5000–500 cm−1
range. The wavelength/wave number coverage is 4000–650 cm−1
(2.5–15.4 μm) with a spectral resolution of 4 cm−1. Thesmallest infrared beam focused on the samples was around15 μm large, the approximate size of the samples.
Field Emission Scanning Electron Microscopy
Both LANDS and IAS completed their spectroscopicinvestigation with an analysis of the same grains by FESEMtechniques. Morphologies of Stardust grains weredetermined by the LANDS team at the LFCP, Napoli,using a ZEISS Supra FESEM. Low accelerating voltagesfrom 3 kV to 5 kV were used to maximize the resolution withrespect to the charging of the uncoated particles to avoidsample contamination. The EDX analysis was performedusing an Oxford INCA Energy 350 system attached to theFESEM with a Si(Li) INCA X-sight “PREMIUM”detector at an accelerating voltage of 15 kV. In spot modethe analyzed region can be approximated by a cube of about1 µm on a side.
The electron microscopy studies of the IAS team wereperformed at the Laboratoire de Structure et Propriétés del’Etat Solide (LSPES) in Lille, France. FESEM wasaccomplished on a SZM-FEG Hitachi S4700 microscope andimages were obtained in secondary electron (SE) mode at anacceleration voltage of 30 kV. The SE detector is locatedinside the lens allowing high resolution images. Chemicalanalyses were performed with the EDX available on the
372 A. Rotundi et al.
microscope (Noran-Voyager) recorded as spectra of selectregions of interest. For quantification, the PROZA procedurewas used (close to a ZAF procedure) for flat samples.
A JEOL 6500F FESEM was used at CIW for characterizationof Stardust samples prior to Raman analysis. EDX measurementswere made with an EDAX Genesis system.
RESULTS AND DISCUSSION
Micro-Raman Spectroscopy
The only features clearly identified in all our micro-Raman spectra of samples from comet 81P/Wild 2 particlesare the aromatic D and G bands (around 1360 and 1590 Δcm−1)superimposed onto a fluorescence background of variableintensity (Fig. 2). These first-order D and G bands arecharacteristic of carbonaceous materials with a wide range ofcrystalline order (Tuinstra and Koenig 1970) and arecommonly observed in both terrestrial and extraterrestrialsamples (Wopenka 1988; Pasteris and Wopenka 1991;Beyssac et al. 2003; Quirico et al. 2003; Raynal 2003; Pasterisand Wopenka 2004; Quirico et al. 2005; Schopf et al. 2005;Bonal et al. 2006; Rotundi et al. 2007; Busemann et al. 2007;Court et al. 2007). The precise position and shape of eachband depends on the degree of order of the material beinganalyzed. The widths Γ of the D and G bands decrease withincreasing ordering (i.e., annihilation of defects, removal ofheteroatoms and decreasing distortions of the threefoldcoordinated C atoms from the ideal structure of graphite) ofthe carbonaceous material. The D band position ωD follows anonlinear trend with crystalline order as noted elsewhere(Busemann et al. 2007). With increasing order ωG increasesfrom regions with low ωG, typical for highly amorphous C(see Amorphization section), towards ωG values around1600 Δcm−1 (Ferrari and Robertson 2000). The developmentof a weak second D band (D’) at ~1620 Δcm−1, which isusually unresolved from the G band, alters the apparent ωG toa small degree. For graphite, defined as an ordered crystallinedomain of pure carbon that is large with respect to the laserexcitation wavelength, ωG is exactly at 1582 Δcm−1.
Cross Calibration of Results from Different Laboratories
Generated SpectraThe various routines used by the five groups give
consistent results (Table A1) for the simulated Raman spectra(see Appendix A), indicating that none of the fittingprocedures to obtain the Raman D and G band parametersused in the distinct laboratories add additional errorsthat would preclude inter-laboratory comparison of theresults from the analyses of the extraterrestrial organicsamples. However, steep backgrounds underlying the D andG bands can cause significant divergence of the fittedparameters from the true values, particularly ΓD and ΓG.Those spectra most difficult to fit yield ΓD and ΓG parameters
that deviate by up to 110 cm−1 from the input parameters.However, the spread of ΓD and ΓG, determined by thedifferent laboratories, is in all but one cases <16 cm−1.Random noise added to small peaks or steep backgroundsresults in small shifts of the peak positions. The peakpositions ω determined in the various laboratories agree witheach other in almost all cases within 0.8 cm−1, whereas thesystematic deviation from the input parameter is usually <2 cm−1
and reaches 12 cm−1 in one case. The broader D bands aremore affected by this problem than the G bands.
Meteoritic Insoluble Organic Matter (IOM)The Raman parameters for meteoritic IOM of Cold
Bokkeveld, Leoville, and Allende are correlated with thedifferent degrees of thermal metamorphism experiencedon the meteorite parent bodies (Raynal 2003; Quirico et al.2003; Matrajt et al. 2004; Quirico et al. 2005; Bonal et al.2006; Busemann et al. 2007). Table A2 gives the results inall laboratories of the Raman parameters as measured formeteoritic IOM including the standard deviations. Theanalyses in all five laboratories yielded comparable resultsfor ΓD, ΓG, and ωG. A downshift of 3–4 Δcm−1 in primitiveIOM is observed for ωD measured at CIW with 532 nm laserlight compared to the results from most other laboratories.Even though the discrepancy is small (~5 and 2 cm−1 forCold Bokkeveld and Leoville, respectively), and can in partbe explained due to the different laser excitation wavelengths,it does suggest results from different laboratories should becompared with caution.
Overall, however, uncertainties due to inter-laboratorycomparison are small compared to the observed naturalvariations in Stardust organic matter (see next section). As arough measure, Table A2 gives the standard deviations of theRaman parameters as measured for meteoritic IOM taking intoaccount the results of all five laboratories using two differentlaser excitation wavelengths. We see some differences betweenthe groups, but they are not large enough to change any of themain conclusions described in the following discussions.
D and G Bands of Stardust Particles: The Degree ofCarbon Order in Stardust Particles Compared to IDPsand Meteorites
As stated previously, Raman spectra of Stardust particlesare dominated by the D and G bands centered around 1360and 1590 Δcm−1 (Fig. 2). A few particles show spectra thatdiffer somewhat, however. In three cases (particles: 35,32;41,11 and 35,30) the spectra contain additional aliphatic C–Hfeatures (see Aliphatic section) and another three (particles:41,10; 41,7 and 35,25) they exhibit G and D bands that canbarely be distinguished above the background noise (Table 2).The lack of detection of minerals and specific organicsfeatures other than the D and G bands could be due tomasking effects of fluorescence and/or to the opaque natureof the samples preventing deep laser penetration (>100 nm)
Analyses of comet 81P/Wild 2 particles collected by Stardust 373
into the samples. In addition, the very high Raman scatteringefficiency of the amorphous carbon with respect to covalentbonds in minerals and other chemical bonds in organicmatter generally causes the D and G bands to dominate thespectra (Quirico et al. 2005). This is particularly true forvisible laser excitation as used here due to resonance of the sp2
carbon sites.D and G band parameters derived from the Stardust spectra
as those reported in Fig. 2 are given in Table 2 and comparedin Fig. 3 to those observed in other extraterrestrial materials, suchas IDPs, primitive meteorites and IOMs extracted frommeteorites. Note that some of the G band parameters differslightly from those presented graphically by Sandford et al.(2006) due to minor refinement of data analysis techniques.Although the band intensity ratio ID/IG is often discussed as auseful parameter, this ratio is nonlinear with respect tometamorphic history when viewed over a wide range ofvalues, as both very thermally processed carbonaceous materialsand very disordered materials can show similar ID/IG values(Busemann et al. 2007). Thus, we concentrate here only on theband centers (ω) and widths (Γ). For most samples, uncertaintiesrepresent the standard deviations of parameters determinedfor multiple spots, though in a few cases errors are dominatedby counting statistics. Most samples were individual grains(Table 1); eleven extracted from along Track 35 (Fig. 1), twofrom Track 41, and two terminal particles from Track 13and Track 17, the former as a microtomed slice (Fig. 4) and thelatter as two fragments of a thick remnant of themicrotomed grain (see Stardust Online Catalog: http://curator.jsc.nasa.gov/stardust/ sample_catalog/index.cfm forfull description of tracks).
The D and G band parameters depend on the degree ofstructural disorder and chemical impurity in carbonaceousmaterials. Organic matter in meteorites and IDPs followssystematic trends on plots of band position versus width,
according to the degree of primitiveness inferred by othermeans, e.g., isotopic anomalies and mineralogicalcharacteristics, (Busemann et al. 2007). The Stardust samplesfollow similar trends and span almost the entire range ofparameters previously observed in meteorites and IDPs(Fig. 3).
In Fig. 3 the G and D band parameters of Wild 2 samplesrelative to IOM from a large number of meteorites (squares)from different classes (Busemann et al. 2007; CrossCalibration section) and some IDPs are compared. The shadedregions in Figs. 3c and 3d show the range of parameters observedin chemically unprocessed (i.e., without extraction) meteoritesof different types (Raynal 2003; Quirico et al. 2003, 2005;Bonal et al. 2006).
The dashed line in Figs. 3c and 3e illustrates a roughtrend obtained for the IOM G band data at CIW. Many ofthe chemically unprocessed meteorite data lie significantly tothe right of the IOM trend. This might reflect a contributionof soluble carbonaceous materials with different Ramanproperties in the chemically unprocessed samples, as well asdifferences in experimental setup and data analysis proceduresbetween the different studies (Busemann et al. 2007).
The general behavior of meteoritic organic matter inRaman parameter plots is consistent with the general behaviorexpected for disordered carbon as outlined above. For theG band, organics from the most primitive meteorites (e.g., CI,CR, and CM chondrites) show low band centers and largeband widths, indicating very disordered materials. Organicmatter from more thermally processed meteorites (e.g.,UOCs and CVs) show higher band centers (up to andexceeding 1590 Δcm−1) and narrower peaks. Meteoritescontaining graphite (e.g., enstatite chondrites) show evensmaller band widths (≤50 cm−1) and G band positions near1582 Δcm−1. Some of the most primitive IOM samples andsome Stardust samples have G band centers that are unusually
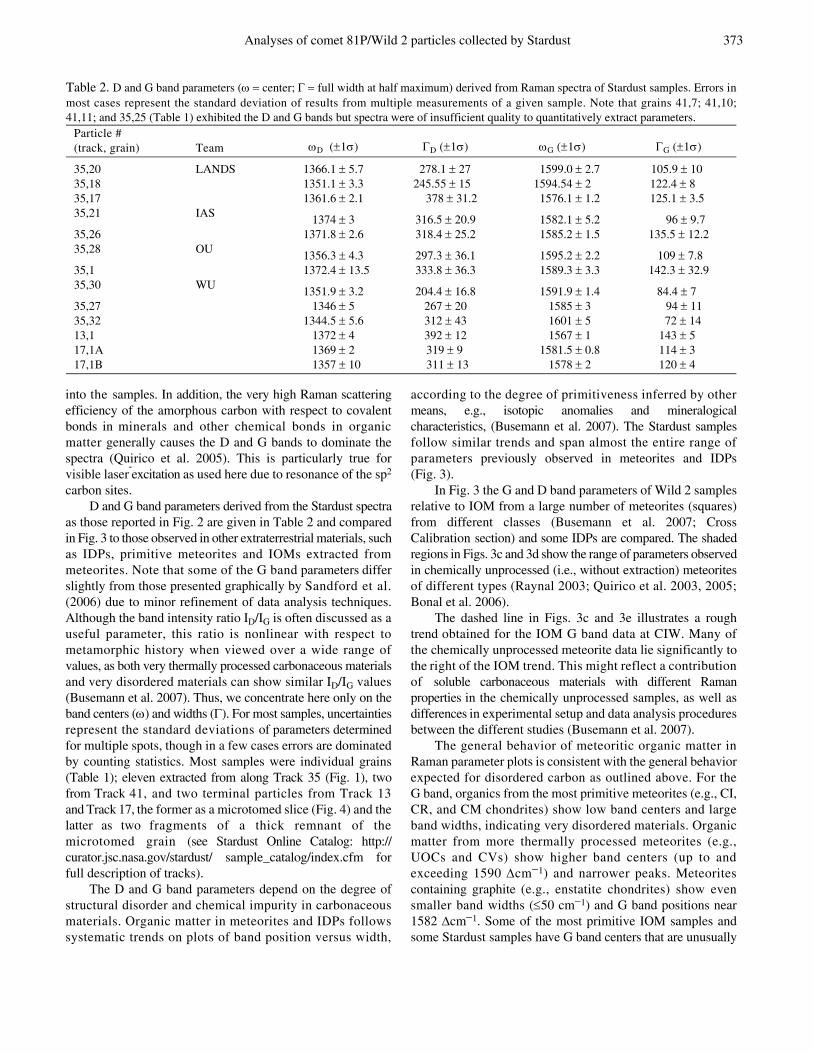
Table 2. D and G band parameters (ω = center; Γ = full width at half maximum) derived from Raman spectra of Stardust samples. Errors inmost cases represent the standard deviation of results from multiple measurements of a given sample. Note that grains 41,7; 41,10;41,11; and 35,25 (Table 1) exhibited the D and G bands but spectra were of insufficient quality to quantitatively extract parameters.
Particle # (track, grain) Team ωD (±1σ) ΓD (±1σ) ωG (±1σ) ΓG (±1σ)
35,20 LANDS 1366.1 ± 5.7 278.1 ± 27 1599.0 ± 2.7 105.9 ± 1035,18 1351.1 ± 3.3 245.55 ± 15 1594.54 ± 2 122.4 ± 835,17 1361.6 ± 2.1 378 ± 31.2 1576.1 ± 1.2 125.1 ± 3.535,21 IAS 1374 ± 3 316.5 ± 20.9 1582.1 ± 5.2 96 ± 9.735,26 1371.8 ± 2.6 318.4 ± 25.2 1585.2 ± 1.5 135.5 ± 12.235,28 OU 1356.3 ± 4.3 297.3 ± 36.1 1595.2 ± 2.2 109 ± 7.835,1 1372.4 ± 13.5 333.8 ± 36.3 1589.3 ± 3.3 142.3 ± 32.935,30 WU 1351.9 ± 3.2 204.4 ± 16.8 1591.9 ± 1.4 84.4 ± 735,27 1346 ± 5 267 ± 20 1585 ± 3 94 ± 1135,32 1344.5 ± 5.6 312 ± 43 1601 ± 5 72 ± 1413,1 1372 ± 4 392 ± 12 1567 ± 1 143 ± 517,1A 1369 ± 2 319 ± 9 1581.5 ± 0.8 114 ± 317,1B 1357 ± 10 311 ± 13 1578 ± 2 120 ± 4

374 A. Rotundi et al.
low (e.g., <1580 Δcm−1) for carbon samples of any origin.While sample heating is known to produce this effect(Everall and Lumsdon 1991), careful control of laser powerand calibration of heating effects conducted amongparticipating laboratories discounts this possibility. Asdiscussed in more detail in the next section, amorphization
due to irradiation can lead to such low values for ωG. Moreover,addition of heteroatoms like O or N can also cause down-shifting of G band centers in poorly ordered carbonaceousmaterials (e.g., Neuhaeuser et al. 2000). Potential evidencefor this in the most disordered Stardust sample (Track 13) isdiscussed below.
Fig. 3. Raman D and G band parameters (ω = center; Γ = full width at half maximum) of Stardust samples compared to those of meteorites andinterplanetary dust particles (IDPs). a, b) Stardust data. c, d) Stardust data compared to meteorites. “IOM” is insoluble organic matter separated fromwide range of meteorite classes (Busemann et al. 2007). Gray regions show the range of parameters measured in chemically unprocessedmeteorites (Quirico et al. 2003; Raynal 2003; Quirico et al. 2005; Bonal et al. 2006). e, f) Stardust data compared to interplanetary dustparticles (IDPs). The “LANDS” data are from Rotundi et al. (2007), the “ Muñoz” data are from Muñoz-Caro et al. (2006) and the WU IDP data pointis from Stadermann et al. (2006). Gray regions indicates range of IDP data reported graphically by Raynal et al. (2001). In (c) and (e) the long-dashedline is fit to the IOM data of Busemann et al. (2007). For clarity, only the average of the two (similar) Track 17 samples is shown in (d–f).
Analyses of comet 81P/Wild 2 particles collected by Stardust 375
Most primitive meteorites show very wide D bands(≥300 cm−1, Fig. 3d) and relatively high band centers (seeIOM in Table A2). Meteorites that have experienced morethermal processing show narrower D bands and lower D bandcenters compared to unprocessed meteorites.
Raman band parameter data for IDPs collected in thestratosphere (Bradley 2003; Brownlee 2003) are comparedwith the Stardust data in Figs. 3e and 3f. These IDP datawere acquired in some of the same laboratories as were theStardust data, though analytical conditions and dataanalysis procedures were not necessarily identical(Raynal et al. 2001; Muñoz-Caro et al. 2006; Rotundi etal. 2007). The grey areas indicate the range of IDP datareported graphically by Raynal et al. (2001). IDPs almostcertainly originate from both comets and asteroids(Brownlee et al. 1995; Rietmeijer 2002; Keller andMessenger 2005), although a specific source type for anyspecific particle cannot unambiguously be identified.They are considered to be among the most primitiveextraterrestrial materials available for study in thelaboratory. IDPs are highly unequilibrated aggregates ofnanoscale phases, have high C contents, and have highabundances of isotopically anomalous presolar grains andorganic matter. Interestingly, the IDPs exhibit Raman Dand G band parameters that span and extend beyond theranges observed in meteorites of different classes,indicating a previously unsampled range of origins and/orthermal histories (Raynal et al. 2001).
Most of the Stardust data lie near the IOM G band trend,while a few (mostly with large errors) overlap with theprimitive in situ meteorite data. The D and G band widths ofthe Stardust data lie at the primitive end of the meteoritictrends (Fig. 3d). For both D and G bands, the Stardust datacover a remarkably similar range to those of IDPs, perhapsstrengthening the association of the latter with comets. In thefollowing some of the Stardust grains are discussed in detail,ordered according to the tracks in which they were found.
Eleven of the 16 analyzed samples were picked from asingle impact track (Track 35) in the Stardust aerogelcollector (Fig. 1). These individual grains span a relativelywide range of D and G band parameters, comparable tothat observed for primitive meteorites and IDPs, indicatinga heterogeneous assortment of carbonaceous structures. Allbut one of the particles originated in a small region of theaerogel impact track (Fig. 1), so it is not possible to infer acorrelation between Raman band parameters and theposition of a given particle within the overall track. Most ofthe Track 35 grains that were analyzed by FESEM/EDXwere found to include large amounts of melted aerogel withsome traces of Mg and Fe originally present in cometarysilicates, as well as varying amounts of C, S, and Ca (seeMicro-IR, FESEM/EDX section). In view of the heatingexperienced by these grains, it is somewhat astonishing thatthe carbonaceous materials they contain exhibit varying
band parameters comparable to primitive meteorites andIDPs. However, we want to recall here that there isevidence of melted (thus heated) aerogel, but no evidence ofbulk grain heating. It is thus possible that the grain wasnot transformed too much by the slowing down in theaerogel and the heating that melted the aerogel did notcompletely transform the pre-existing carbonaceousmaterials. Studies of the alteration of organics uponimpact of Allende, Murchison, and Orgueil sampleswith impact velocity of 6.1 km/s into aerogel showed thatonly the Orgueil D band position (ωD) lowered afterimpact, whereas all other parameters did not vary (Fosteret al. 2007). Even if some of the observed range was dueto short term heating during impact into the aerogel,this heating was clearly heterogeneous and was lesssevere than the long period parent body heatingexperienced, e.g., by organic matter in CV chondrites(which typically have ωG > ∼1590 Δcm−1 and ΓD < ~80cm−1) (this work Table A2; Bonal et al. 2006; Busemannet al. 2007). Note that grain 35,17 that shows evidence forhydrated silicates and carbonates (see Micro-IR, FESEM/EDX section), also exhibits some of the most primitiveRaman signatures of any of the analyzed samples.
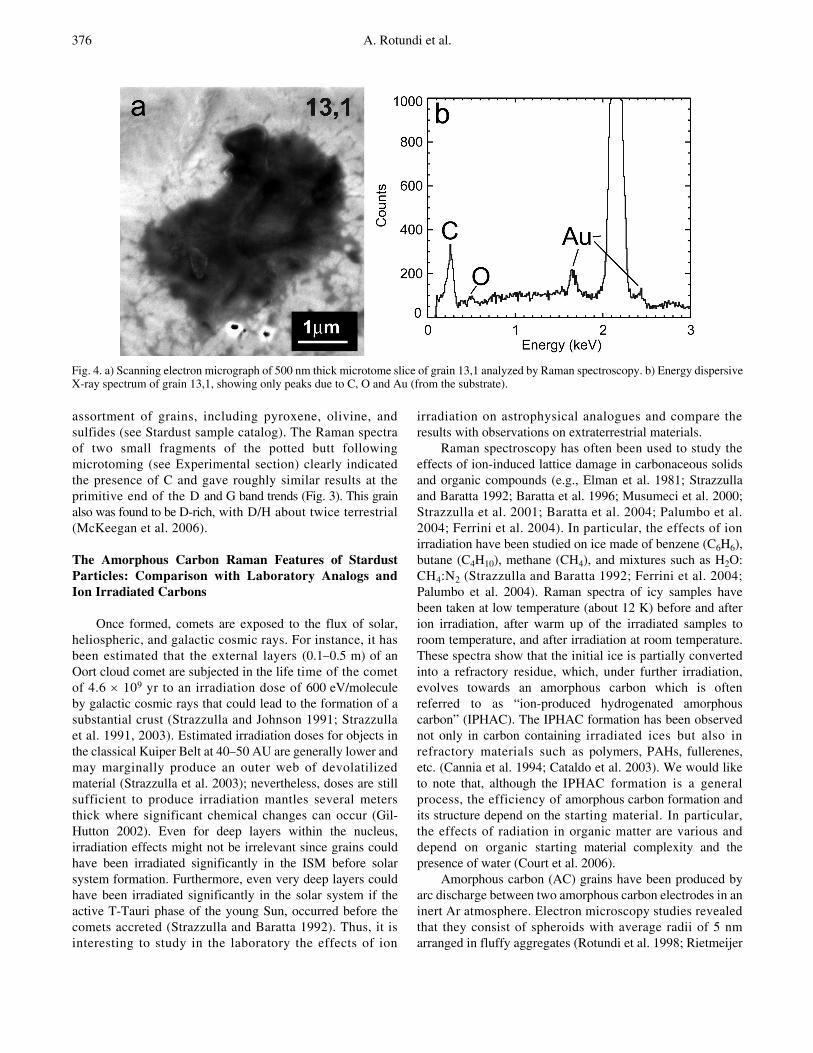
Grain 13,1 was extracted from a loose chip of aerogelfound on the avionics deck within the sample return canister;its original position on the aerogel collector tray is thereforeunknown. The particle was embedded in elemental S andsliced with a diamond microtome. SEM analysis of the0.5 mm thick slice indicated it to be almost pure C with minorO (Fig. 4) and the sample showed a distinctly disorderedC Raman spectrum (Fig. 2). The band parameters place itbeyond the most extreme primitive ends of the trends definedby meteoritic IOM. In fact, the Raman spectrum resemblesthat of amorphous carbon like that produced by irradiation ofcarbonaceous materials (Ferrini et al. 2004), namely the Dand G bands have almost merged into a single broad hump(see next section for more discussion). This slice was alsofound to be enriched in deuterium, with D/H about twice theterrestrial value (McKeegan et al. 2006), which excludes acontamination origin for this grain. Moreover, C-XANESanalysis (Sandford et al. 2006; Cody et al. 2008) of adjacentslices of this particle indicated lower abundances ofsp2-bonded C and higher N/C and O/C ratios than observed intypical chondritic organic matter. For example, IOM fromcarbonaceous chondrites has O/C = 0.04−0.22 and N/C upto 0.04, whereas the 13,1 particle has O/C and N/C ratios of0.21 ± 0.01 and 0.10 ± 0.03, respectively (Cody et al. 2008). Asdiscussed above, this high level of heteroatom abundancemight be partially related to the very low G band centerobserved for this sample. Further research into the effects ofheteroatom concentration on Raman bands of extraterrestrialcarbonaceous materials including more Stardust samples isnecessary for definitive evaluation, however.
TEM analyses of grain 17,1, indicate a heterogeneous
376 A. Rotundi et al.
assortment of grains, including pyroxene, olivine, andsulfides (see Stardust sample catalog). The Raman spectraof two small fragments of the potted butt followingmicrotoming (see Experimental section) clearly indicatedthe presence of C and gave roughly similar results at theprimitive end of the D and G band trends (Fig. 3). This grainalso was found to be D-rich, with D/H about twice terrestrial(McKeegan et al. 2006).
The Amorphous Carbon Raman Features of StardustParticles: Comparison with Laboratory Analogs andIon Irradiated Carbons
Once formed, comets are exposed to the flux of solar,heliospheric, and galactic cosmic rays. For instance, it hasbeen estimated that the external layers (0.1−0.5 m) of anOort cloud comet are subjected in the life time of the cometof 4.6 × 10⁹ yr to an irradiation dose of 600 eV/moleculeby galactic cosmic rays that could lead to the formation of asubstantial crust (Strazzulla and Johnson 1991; Strazzullaet al. 1991, 2003). Estimated irradiation doses for objects inthe classical Kuiper Belt at 40−50 AU are generally lower andmay marginally produce an outer web of devolatilizedmaterial (Strazzulla et al. 2003); nevertheless, doses are stillsufficient to produce irradiation mantles several metersthick where significant chemical changes can occur (Gil-Hutton 2002). Even for deep layers within the nucleus,irradiation effects might not be irrelevant since grains couldhave been irradiated significantly in the ISM before solarsystem formation. Furthermore, even very deep layers couldhave been irradiated significantly in the solar system if theactive T-Tauri phase of the young Sun, occurred before thecomets accreted (Strazzulla and Baratta 1992). Thus, it isinteresting to study in the laboratory the effects of ion
irradiation on astrophysical analogues and compare theresults with observations on extraterrestrial materials.
Raman spectroscopy has often been used to study theeffects of ion-induced lattice damage in carbonaceous solidsand organic compounds (e.g., Elman et al. 1981; Strazzullaand Baratta 1992; Baratta et al. 1996; Musumeci et al. 2000;Strazzulla et al. 2001; Baratta et al. 2004; Palumbo et al.2004; Ferrini et al. 2004). In particular, the effects of ionirradiation have been studied on ice made of benzene (C6H6),butane (C4H10), methane (CH4), and mixtures such as H2O:CH4:N2 (Strazzulla and Baratta 1992; Ferrini et al. 2004;Palumbo et al. 2004). Raman spectra of icy samples havebeen taken at low temperature (about 12 K) before and afterion irradiation, after warm up of the irradiated samples toroom temperature, and after irradiation at room temperature.These spectra show that the initial ice is partially convertedinto a refractory residue, which, under further irradiation,evolves towards an amorphous carbon which is oftenreferred to as “ion-produced hydrogenated amorphouscarbon” (IPHAC). The IPHAC formation has been observednot only in carbon containing irradiated ices but also inrefractory materials such as polymers, PAHs, fullerenes,etc. (Cannia et al. 1994; Cataldo et al. 2003). We would liketo note that, although the IPHAC formation is a generalprocess, the efficiency of amorphous carbon formation andits structure depend on the starting material. In particular,the effects of radiation in organic matter are various anddepend on organic starting material complexity and thepresence of water (Court et al. 2006).
Amorphous carbon (AC) grains have been produced byarc discharge between two amorphous carbon electrodes in aninert Ar atmosphere. Electron microscopy studies revealedthat they consist of spheroids with average radii of 5 nmarranged in fluffy aggregates (Rotundi et al. 1998; Rietmeijer
Fig. 4. a) Scanning electron micrograph of 500 nm thick microtome slice of grain 13,1 analyzed by Raman spectroscopy. b) Energy dispersiveX-ray spectrum of grain 13,1, showing only peaks due to C, O and Au (from the substrate).

Analyses of comet 81P/Wild 2 particles collected by Stardust 377
et al. 2004). Infrared spectroscopy has shown that the ACgrains contain hydrogen (−CH3 and −CH2, H/C ~ 4%) and asmall amount of oxygen (O/C < 0.5%) (Baratta et al. 1996).Raman spectra of AC grains irradiated with 3 and 30 keV He+
ions at different fluences (Baratta et al. 1996; Mennella et al.2003) imply a progressive decrease in the ID/IG ratio and ashift of the G band peak towards lower wave numbers. Theseresults are interpreted as evidence of a progressive disorderinduced by ion irradiation in AC grains.
Raman spectra of “highly ordered pyrolitic graphite”(HOPG), irradiated with 3 keV He+ ions at different ionfluences, show that ion irradiation at low fluences inducesdamage in the crystal lattice, as evidenced by the appearanceof an increasing D band. At higher fluences (>1016 ions cm−2),the damaged graphite crystal is fully converted into anamorphous carbon film (Compagnini and Baratta 1992;Strazzulla et al. 1995), showing that ions are able to amorphizeeven highly ordered crystalline materials as graphite.
In Fig. 5, irradiated AC (IPHAC, formed after ionirradiation of icy samples) plots in the top left corner of thegraph. For graphite and AC grains increasing ion irradiationfluences shift the G band to lower wave numbers and higherΓ, while metamorphism causes a modification of the G bandprofile in the opposite direction (Bonal et al. 2006; Busemannet al. 2007). The plot shows that Stardust grains arecompatible with the presence of amorphous carbonaceousmaterials that have been slightly irradiated. The mostdisordered AC in some Stardust grains (e.g., particle 13,1)could be indicative of ion irradiation of pre-existing, initiallymore ordered carbons or carbon containing ices (IPHAC) thathad suffered moderate metamorphism.
Aliphatic Hydrocarbons Detected with RamanSpectroscopy
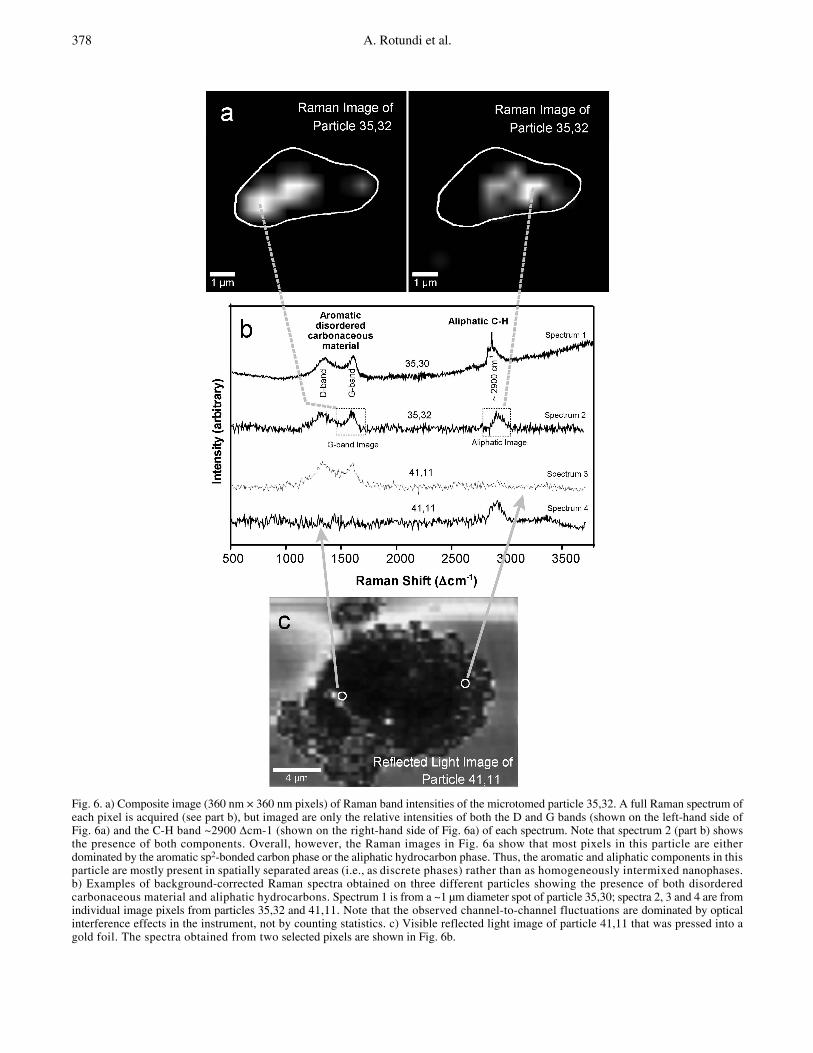
In addition to the broad D and G Raman bands, threeparticles also revealed Raman bands in the C-H stretchingregion (~2900 Δcm−1) indicative of aliphatic components.Such aliphatic signatures were revealed both by Ramanimaging (Fig. 6a) as well as by spot analysis (Fig. 6b: spectra1–4). Two of the particles were from Track 35 in Cell 2054(particle 32 and particle 35) and one particle was fromTrack 41 in Cell 2044 (particle 11). Particle 35,32 wasembedded in sulfur and microtomed, whereas particles 35,30and 41,11 were pressed in gold (see Experimental section).Examples of spectra obtained on all three particles are shownin Fig. 6b.
In principle, one can infer the general nature andcomposition of aliphatics from the exact positions and shapesof the 2800−3100 Δcm−1 C-H stretching modes. Thosepositions and shapes are observed to be different for the threedifferent Stardust particles (compare spectra 1, 2, and 4 inFig. 6b), and also differ slightly among different(360 nm)2 spots within the same particle. Particle 35,30showed very strong peaks for the C-H stretching
vibrations at 2848 and 2882 Δcm−1 and an additionalunusual weak band at 1439 Δcm−1 (Fig. 6b, spectrum 1),consistent with the presence of alkane-type saturatedhydrocarbons. Those bands cannot be caused byaromatic C-H stretches, because such modes would be atmuch higher wave numbers (>3000 Δcm−1). Thedetection of these bands was possible after sample 35,30was photo-bleached with the 532 nm laser beam for onehour, which decreased the overall fluorescencebackground. The bands are characteristic of an alkane, inwhich the C=H symmetric stretching vibration for methyl(CH3) is found at 2888 Δcm−1 and the symmetric C=Hstretching vibration for methylene (CH2) is found at 2849Δcm−1. An additional small band at 1439 Δcm−1 is probablycaused by the methylene wagging mode. However, alkaneswith such a spectrum have to be either (1) very highmolecular weight alkanes (if they are mixed with PAH-like condensed carbon ring structures), because lowerweight alkanes (i.e., short chains) would be in the form of agas or a liquid, or (2) alkanes in which the chains can beshorter (i.e., low molecular weight alkanes) as long as they areside chains of the PAHs and form alkylated PAHs. The factthat the observed bands are a good match to the strongestbands expected for polyethylene (Sandford et al. 2006) raisesthe question whether the cause of those bands could becontamination.
The other two particles (35,32 and 41,11) were measuredwith a different Raman instrument and did not have such well
Fig. 5. Full width at half maximum (ΓG) versus peak position (ωG)of the G band observed in Stardust grains compared with ionprocessed materials. Up triangles correspond to HOPG irradiatedwith 3 keV He+ ions at different fluences (ions cm−2): (A) 2.8 × 10¹³;(B) 1.2 × 10¹⁴; (C) 2.8 × 10¹⁴, (D) 1.4 × 10¹⁵; (E) 1.4 × 10¹⁶; (F) 2.8 ×10¹⁶. Solid gray circles refer to amorphous carbon (AC) grainsirradiated with 3 keV He+ ions. Numeric labels indicate differentirradiation fluences (ions cm−2), in particular (1) virgin; (2) 1014; (3)1015; (4) 1016; (5) 1017. The down triangle refers to amorphouscarbon (IPHAC) produced by ion irradiation of an ice mixtures madeof H2O:CH4:N2 = 1:6:3 with 30 keV He+ ions at 12 K (irradiationdose = 800 eV/molecule).
378 A. Rotundi et al.
Fig. 6. a) Composite image (360 nm × 360 nm pixels) of Raman band intensities of the microtomed particle 35,32. A full Raman spectrum ofeach pixel is acquired (see part b), but imaged are only the relative intensities of both the D and G bands (shown on the left-hand side ofFig. 6a) and the C-H band ~2900 Δcm-1 (shown on the right-hand side of Fig. 6a) of each spectrum. Note that spectrum 2 (part b) showsthe presence of both components. Overall, however, the Raman images in Fig. 6a show that most pixels in this particle are eitherdominated by the aromatic sp2-bonded carbon phase or the aliphatic hydrocarbon phase. Thus, the aromatic and aliphatic components in thisparticle are mostly present in spatially separated areas (i.e., as discrete phases) rather than as homogeneously intermixed nanophases.b) Examples of background-corrected Raman spectra obtained on three different particles showing the presence of both disorderedcarbonaceous material and aliphatic hydrocarbons. Spectrum 1 is from a ~1 µm diameter spot of particle 35,30; spectra 2, 3 and 4 are fromindividual image pixels from particles 35,32 and 41,11. Note that the observed channel-to-channel fluctuations are dominated by opticalinterference effects in the instrument, not by counting statistics. c) Visible reflected light image of particle 41,11 that was pressed into agold foil. The spectra obtained from two selected pixels are shown in Fig. 6b.

Analyses of comet 81P/Wild 2 particles collected by Stardust 379
resolved peaks in the C-H stretch region, but rather a singlebroad unresolved peak, whose exact peak position wasdifferent for the two particles. The peak position wasespecially high (2917 Δcm−1) in particle 35,32 which wasmounted on the amorphous SiO2/SiO membrane assubstrate. The Raman image obtained from this particle (Fig.6a) indicates that the aromatic C-C bonded phase (e.g.,material exhibiting D and G bands) of the disorderedcarbonaceous material (shown on the left-hand side ofFig. 6a) is spatially separated from the phase whosespectrum is dominated by the aliphatic C-H stretchingvibrations (shown on the right-hand side of Fig. 6a). However,in this particle we also found areas where these two phaseswere found in the same spectrum, i.e., within the spatialresolution limit of (360 nm)2 (see spectrum 2 in Fig. 6b).
In the case of particle 41,11 the aliphatic peak positionwas found at 2909 Δcm−1, and the aliphatics were discoveredto be intimately intermixed with the disordered aromatic carbonphase exhibiting the D and G bands. Indeed the aliphaticsseem to pervade the interior of this particle (Fig. 6c), whichargues against post-capture contamination. Given that this particle,as well as particle 35,30 were pressed in gold, a contaminationfrom the mounting medium can be excluded for those twoparticles. However, this leaves open the possibility that thealiphatic bands seen in these two particles are caused by thelimited amounts of organics that are present in aerogel. Ofinterest, however, is that the C-H peak positions aredifferent for the two particles, which indicates heterogeneityin alkane saturation and/or aliphatic functionalization.Specifically, the apparent absence of =CH3- stretch modesin particle 41,11 argues for either a cross-linked or a veryfunctionalized aliphatic phase.
Fundamentally, the two most likely sources for Stardustaliphatic materials are either native cometary materials and/orminor contaminants introduced during capture and/orcuration. Aliphatic hydrocarbons are common terrestrialcontaminants for extraterrestrial samples (e.g., Sephton etal. 2001). It is currently unclear whether the minorhydrocarbon contaminants in the aerogel can cause theobserved C-H Raman bands or whether contaminants existin sufficient quantity to generate a condensed phase uponpost-capture cooling. Curatorial procedures specificallylimited exposure of Stardust particles to organic andpolymeric contaminants, and neither particle 35,30 norparticle 41,11 were mounted in epoxy. In addition,contamination is an unlikely source for the aliphaticcompounds because different C-H Raman mode structureswere observed in those two particles.
In summary, three particles showed peaks in the 2900 Δcm−1
region characteristic of aliphatic hydrocarbons. At the moment,these aliphatic materials cannot be ruled out as contaminationand this issue needs further investigation beyond the PEphase of the Stardust Mission. Studying the trend of thealiphatics content versus sample surface area could inprinciple help diagnose whether contamination is important
(Sephton 2002), but it is not in fact possible to derive thisinformation for these samples due to the irregular layer withhigh porosity of aerogel present on the grains surface.
Combined Micro-IR Spectroscopy and FESEM-EDX
For eight particles, six extracted from Track 35 and twoextracted from Track 41, a combined FESEM/EDX, micro-FTIR, and micro-Raman analysis was performed (see Table 1).The Raman data for these eight particles have been describedin the previous section. For particles 35,21 and 35,26, studiedby the IAS team, FESEM/EDX analysis was applied as aninitial survey, whereas the other six, studied by the LANDSteam, micro-IR and micro-Raman spectroscopy were performedbefore FESEM/EDX analyses. In all cases, both the FESEMimaging and the EDX mapping results indicate the presenceof a considerable amount of aerogel mixed with the particle(Fig. 7). In particular, Si/Mg and Si/Fe were always found tobe much higher than what is expected for normal silicateminerals and were seen in some cases to reach values as highas 10. These results confirm the general observations madeduring PE of compressed or melted aerogel surrounding theparticles (Zolensky et al. 2006). Any interpretation of datafrom Stardust particles will have to take this fact into account.In particular, for the interpretation of the IR data, great care mustbe taken in the subtraction of the IR spectrum of the aerogel.
To assess the contribution of aerogel to infraredmeasurements of Stardust samples, aerogel slices weresectioned in the cells from which the grains analyzed herewere extracted. FTIR spectra of aerogel slices C2054,32,0,0,0and C2054,31,0,0,0, near the tracks containing some of theanalyzed particles, were acquired by the IAS and LANDSteams in 4000−600 cm−1 range at 2 cm−1 resolution andnormalized to background KBr spectra (Figs. 8−12). Aerogelspectra are dominated by a well-defined band at 1086 cm−1
with a shoulder at 1204 cm−1, due to its SiO2 composition.Further features observed in aerogel spectra are attributed toadsorbed H2O molecules (3745 cm−1 OH dangling bonds,3400 cm−1 OH stretching, 1670 cm−1 OH bending, and 809 cm−1
OH libration) and to CH aliphatic bonds (2970, 2939,2881, 2858 cm−1 CH stretching, 1464 and 1373 cm−1 CHbending).
All the spectra of the analyzed particles were corrected foraerogel contribution with the exception of particle 35,17 forwhich the subtraction of the aerogel spectrum was not necessary(Fig. 11). We note that the profiles of the aerogel features aresignificantly different from those observed in aerogel-contaminated cometary particles spectra. After subtraction of theaerogel contribution from that of the cometary particles, spectrawere obtained with a richness of signatures that was not detectedin the pure aerogel. Thus, the spectra could be assigned tocompounds originally present in the particles (although thesematerials may have undergone varying amounts of alterationor re-distribution due to impact processing).
The infrared CH stretching features in the 3050−2750 cm−1
380 A. Rotundi et al.
(3.28−3.64 μm) region are different in the particles comparedto the features produced by aerogel alone. In Fig. 12a, thespectrum of a piece of aerogel extracted close to Track 35 iscompared with the spectra obtained from the aerogel
contaminated particles from this track and the differences aremarked, suggesting that most if not all spectral featuresobtained from the four particles are intrinsic to the particlesand not due to the aerogel. A similar trend is noted for additional
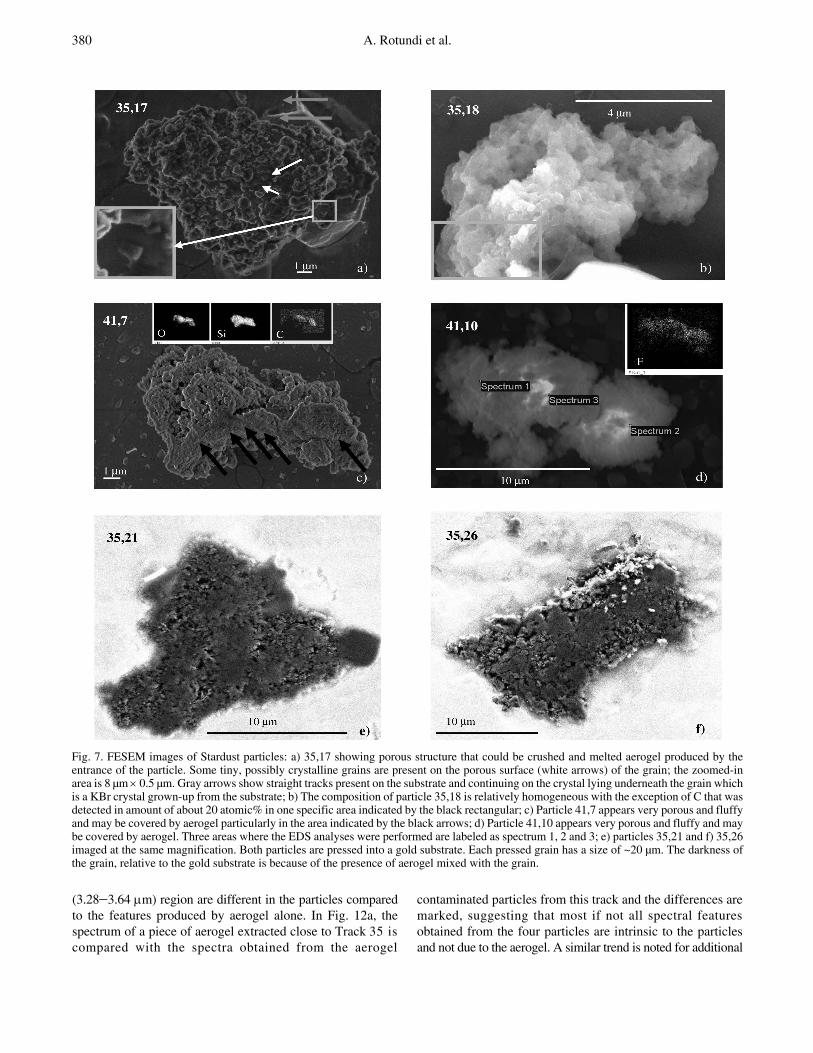
Fig. 7. FESEM images of Stardust particles: a) 35,17 showing porous structure that could be crushed and melted aerogel produced by theentrance of the particle. Some tiny, possibly crystalline grains are present on the porous surface (white arrows) of the grain; the zoomed-inarea is 8 µm × 0.5 µm. Gray arrows show straight tracks present on the substrate and continuing on the crystal lying underneath the grain whichis a KBr crystal grown-up from the substrate; b) The composition of particle 35,18 is relatively homogeneous with the exception of C that wasdetected in amount of about 20 atomic% in one specific area indicated by the black rectangular; c) Particle 41,7 appears very porous and fluffyand may be covered by aerogel particularly in the area indicated by the black arrows; d) Particle 41,10 appears very porous and fluffy and maybe covered by aerogel. Three areas where the EDS analyses were performed are labeled as spectrum 1, 2 and 3; e) particles 35,21 and f) 35,26imaged at the same magnification. Both particles are pressed into a gold substrate. Each pressed grain has a size of ~20 µm. The darkness ofthe grain, relative to the gold substrate is because of the presence of aerogel mixed with the grain.
Analyses of comet 81P/Wild 2 particles collected by Stardust 381
track analyses reported by Sandford et al. (2006) and Bajt et al.(Forthcoming), which yielded clear differences betweenthe IR spectra of material in and near some tracks and aerogeldistant from the tracks.
Major differences in abundances of heavy elements areseen in particles from track to track and for individual particleswithin a single track (Flynn et al. 2006), suggesting similardifferences may be seen in the infrared data. To underline thedifferences observed in the characterization of particlesoriginating from the same track, and thus the same incidentparticle or between tracks from different aerogel cells, we willdiscuss the results for four particles from Track 35 (particles 17
and 18, observed in the transmission mode and particles 21 and26 observed in the reflection mode), and two particles fromTrack 41 (particles 7 and 10).
IR/FESEM_EDX Analyses of Particles from Track 35 Particle 35,17 is the most distinctive in this study, based
on optical microscopy, FESEM/EDX, and IR micro-spectroscopy observations. In addition, the micro-Ramanspectra of this particle show that the carbon component inthis sample is among the most disordered and primitiveones (Fig. 3a). This particle has a yellowish appearancein the reflected light optical microscope. FESEM analyses(Fig. 7a) exhibit a morphology that recalls the aerogelporosity after impact of a hypervelocity circum-terrestrialparticle on collectors exposed outside the MIR station (Ferriniet al. 2001). On the porous surface, some tiny, possiblycrystalline, particles are present (white arrows in Fig. 7a) thatwere not observed on the other samples. The large crystallying under the right side of the particle is actually a KBrcrystal, part of the substrate probably accreted under theparticle (Fig. 7a). This can be deduced from the straighttracks present on the substrate continuing on the crystal(grey arrow) and by the shape of the tear edges of the thinlayer present on the crystal and on the substrate, i.e., theKBr Cr coating, (see the Experimental section). Theelemental analysis of this particle, reported in Table 3, showsan atomic ratio Si/O = 0.08, which is low compared to valuesof 0.25−0.5 expected for silicates, as well as for a possibleaerogel contamination. The EDX spectra acquired in differentareas of the particle reveal relatively homogeneous elementalcomposition with the exception of C that was detected torange from 1 wt% to 10 wt% in different areas. The infraredspectrum (Fig. 8), in which the main aerogel features at
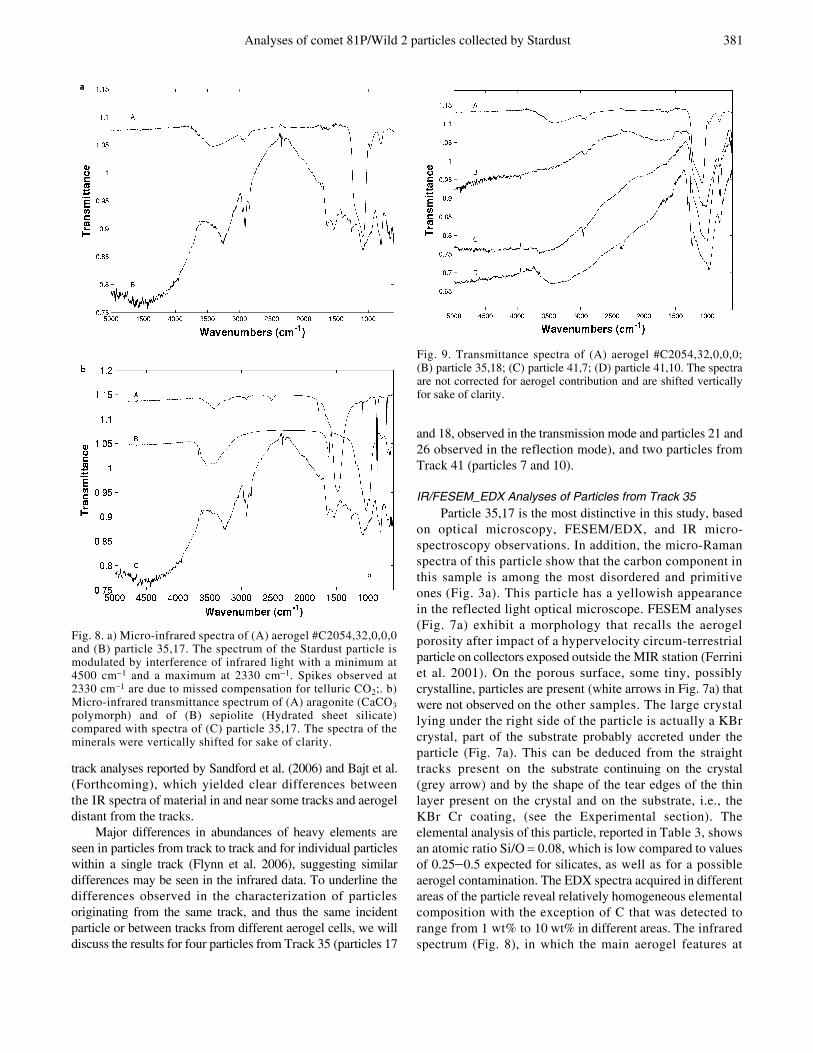
Fig. 8. a) Micro-infrared spectra of (A) aerogel #C2054,32,0,0,0and (B) particle 35,17. The spectrum of the Stardust particle ismodulated by interference of infrared light with a minimum at4500 cm−1 and a maximum at 2330 cm−1. Spikes observed at2330 cm−1 are due to missed compensation for telluric CO2;. b)Micro-infrared transmittance spectrum of (A) aragonite (CaCO3polymorph) and of (B) sepiolite (Hydrated sheet silicate)compared with spectra of (C) particle 35,17. The spectra of theminerals were vertically shifted for sake of clarity.
Fig. 9. Transmittance spectra of (A) aerogel #C2054,32,0,0,0;(B) particle 35,18; (C) particle 41,7; (D) particle 41,10. The spectraare not corrected for aerogel contribution and are shifted verticallyfor sake of clarity.

382 A. Rotundi et al.
1086 cm−1 and 1204 cm−1 are negligible, indicates that theamount of aerogel associated with this particle is low. Thisspectrum is complex: it shows several features superimposedon a continuum modulated by interference of infrared lightpassing through the particle. Interference phenomenabecome more pronounced when the size parameter x = 2πa/λ,where a is the particle radius and λ the wavelength, is similar tothe wavelength of light. This particle has a diameter of about13.5 μm, which corresponds in our spectral range to a sizeparameter >2.5, responsible for a broad continuum variationwith a minimum at 4500 cm−1 and maximum at 2330 cm−1,where the incomplete compensation for telluric CO2 generatesthe narrow “spikes” near 2350 cm−1. The peaks near 3250,1640, and 800 cm−1 are characteristic of H2O molecules.Aerogel is very hygroscopic, thus water adsorbed by theaerogel during particle capturing or adsorbed from thelaboratory environment could account for the presence ofthe H2O stretching, bending, and libration modes.Nevertheless, we note that among the six particles analyzedby FESEM/EDX and micro-IR spectroscopy, particle 35,17appears to be the least contaminated by aerogel. The IRspectrum of the particle shows the OH stretching band tobe more intense and narrower with respect to that present inthe aerogel spectrum and also shows a very weak SiOstretching band (Fig. 8a). The shape of the feature at3400 m−1 observed in the aerogel slice C2054, 32,0,0,0(Fig. 8) is broader and peaked at larger wavelength withrespect to this particle. This could be an indication that afraction of H2O molecules are present in the mineralogicalstructure of hydrated silicates. These IR observations areconsistent with the results of the EDX analysis, as the lowSi/O (the lowest among the analyzed particles, see Table 3)supports the presence of H2O observed in the IR spectrumthat is responsible for the high amount of oxygen detected.The combination of the micro-IR and EDX data suggests thatparticle 35,17 might contain phyllosilicates containing Ca,Al, Na. In fact, many hydrated silicates are characterized bybands peaked at about 1020 cm−1 due to SiO stretching mode(broad and intense), 1630 cm−1 due to H2O bending mode,and around 3550 cm−1 due to hydroxyl stretching mode(broad). For example, Montmorillonite [(Na,Ca)0.3 (Al,Mg)2Si4O10(OH)2.nH2O] and sepiolite Mg4Si6O15(OH)2.6H2Ospectra show features matching those present in the 35,17spectrum (Fig. 8). The bands at 1026, 914, and 843 cm−1 ofmontmorillonite may appear as the shoulders at 1028, 918,and 839 cm−1 in the spectrum of this particle and the bendingmode of H2O is responsible for the feature at 1638 cm−1. Theclay sepiolite Mg4Si6O15 (OH)2.6H2O shows intense peaks at1030 and 1626 cm−1 due to SiO stretching and H2O bendingmode, respectively, and two characteristic peaks at 690 and656 cm−1 are also present in this Stardust particle.
On the other hand, the IR spectrum of particle 35,17exhibits bands at 1450 cm−1, 860 cm−1, as a shoulder, and twotwin peaks at 700 and 714 cm−1. Recalling that the maincharacteristic bands of carbonates are centered at about 3420,
Fig. 10. a) Mid IR reflectance spectra of particles 35,21 (A) and 35,26(B) before the baseline correction. The baselines adopted are in dashedlines. The spectra are shown in the adsorption mode. (b) Mid IR spectrain absorption mode of a piece of aerogel (A) and of particle 35,21 (B)after the baseline correction c) Mid IR spectra in absorption mode of apiece of aerogel (A) and of particle 35,26 (B) after the baselinecorrection.

Analyses of comet 81P/Wild 2 particles collected by Stardust 383
1450, 860, and 730 cm−1 and that Ca and C are detected byEDX in this particle we infer the presence of carbonates inthis particle. This is supported by the comparison of thearagonite (CaCO3) spectrum (Salisbury et al. 1991) with thatof particle 35,17 (Fig. 8b).
Supporting data from techniques like X-ray diffractionand Transmission Electron Microscopy (TEM) that wouldunambiguously determine the mineralogy are essential tocorroborate the interpretation of the spectral features describedabove in terms of phyllosilicates and carbonates.
EDX analyses of particle 35,17 detected potassium andbromine, these elements can be interpreted as a contributionfrom the substrate, i.e., a KBr window (K/Br = 1 atomic%).However, an excess of K with respect to Br is measured (K/Br =4.4 atomic%) while we would rather expect an excess in Br ifthe presence of these elements was really exclusively due tothe substrate. This is what we find for particles 41,7 and 41,10
for which we measure a K/Br ratio of about 0.5 atomic%explicable as an artifact. In fact, the particle, lying over thesubstrate, shields the signal coming from the substrate with aselective X-rays absorption due to the different atomic number.Thus we can conclude that the K excess is indigenous toparticles 35,17.
Particle 35,18 is about 10 mm in size and has a very darkappearance in the reflected light optical microscope. As inthe case of particle 35,17, the morphology of this particle(Fig. 7b) is similar to that seen in aerogel after impact ofan hypervelocity circumterrestrial particle (Ferrini et al. 2001).The IR spectrum of the particle shows a common feature at1028 cm−1 due to SiO stretching mode and bands at 3400, 1600(noisy), and 802 cm−1 due to H2O (Fig. 9). The detection ofminerals is difficult, because the SiO stretching mode feature,probably due to the aerogel, is very intense (Fig. 9). The IRspectrum, corrected for aerogel contribution, does not show the
Fig. 11.IR spectra of particle 35,17 (up left); 35,18 (up right); 41,7 (bottom left) and 41,10 (bottom right) in the 600–2250 cm−1 range. Allthe spectra are corrected for aerogel contribution with the exception of particle 35,17 for which the subtraction procedure was not necessarybecause of the negligible aerogel contribution.
384 A. Rotundi et al.
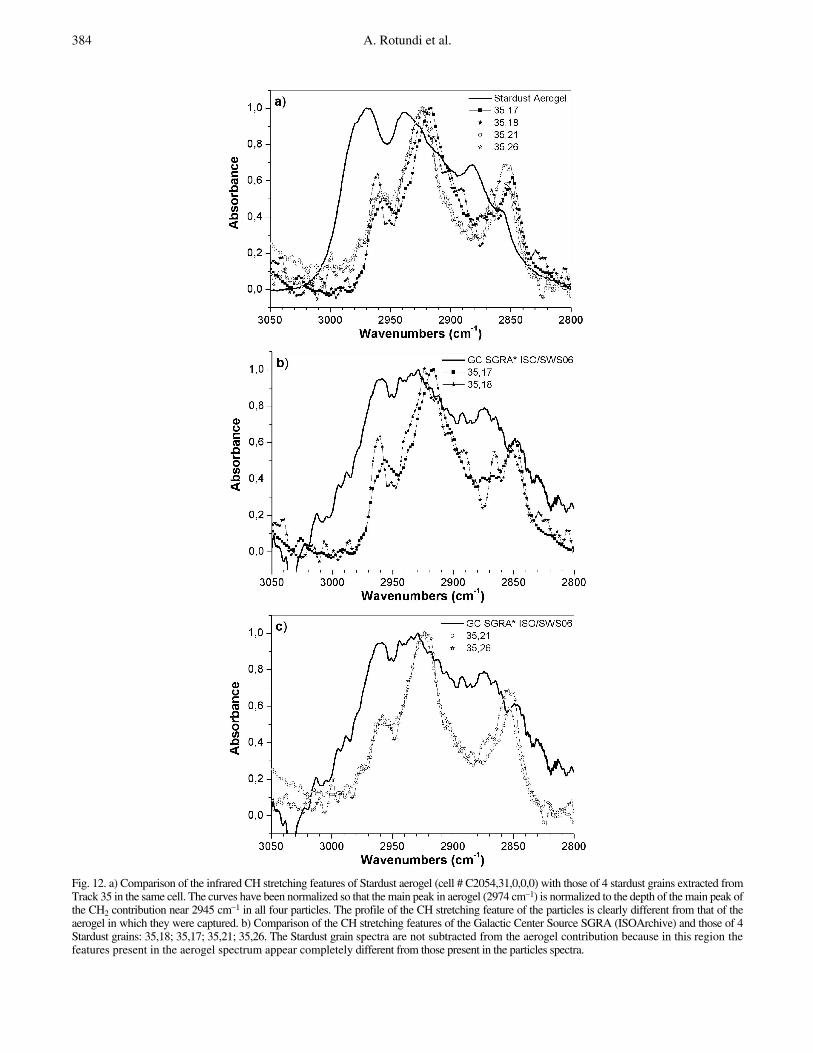
Fig. 12. a) Comparison of the infrared CH stretching features of Stardust aerogel (cell # C2054,31,0,0,0) with those of 4 stardust grains extracted fromTrack 35 in the same cell. The curves have been normalized so that the main peak in aerogel (2974 cm−1) is normalized to the depth of the main peak ofthe CH2 contribution near 2945 cm−1 in all four particles. The profile of the CH stretching feature of the particles is clearly different from that of theaerogel in which they were captured. b) Comparison of the CH stretching features of the Galactic Center Source SGRA (ISOArchive) and those of 4Stardust grains: 35,18; 35,17; 35,21; 35,26. The Stardust grain spectra are not subtracted from the aerogel contribution because in this region thefeatures present in the aerogel spectrum appear completely different from those present in the particles spectra.
Analyses of comet 81P/Wild 2 particles collected by Stardust 385
wide smooth band of amorphous silicate usually extendingin the 1300−800 cm−1 range with a peak at about 1020 cm−1.Characteristic crystalline silicate peaks are not observed inthe spectrum. All spectral features that remain after correctionfor the aerogel contribution are from C-based materials (seeOrganics section). C was detected by EDX analyses in theamount of about 20 atomic% in one specific area. In thisparticle, as in particle 35,17 the potassium content is higherthan bromide (K/Br = 2.4 atomic%) suggesting anindigenous presence of K in this cometary particle.
Particles 35,21 and 35,26 were pressed in gold andtheir infrared spectra were obtained in the reflection mode.FESEM imaging reveals similar features for both particles,as shown in Figs. 7e and 7f. They appear dark under thebeam, which is characteristic of light elements. The lateralsizes of the particles after pressing are around 20 μm. Theoverabundance of the light elements is confirmed by theEDX spectra of the two particles. The spectra are dominatedby Si (Mg/Si about 0.1 for both particles) and O, whereasMg and Fe—which are supposed to be the dominant cationsin silicates—are under represented by at least a factor of 10,suggesting that residual aerogel is present in these samples.
Figure 10a shows the raw spectra in the mid IR region(4000−600 cm−1) for the two particles. The IR beam reflectson the gold foil, resulting in the IR photons making twopassages through the particles. Hence log(1/R) is equivalentto absorbance. The typical propagation length of the IR beaminside the particles can be estimated: a typical particle thathas been flattened to ~17 μm size exhibits a thickness in
the 3−4 μm range and, therefore, the propagation length ofthe IR light inside the particle is of the order of thewavelength. This leads to complex scattering effectsaffecting the absorption spectrum of the sample (Raynalet al. 2000). Mainly the <2000 cm−1 (>5 mm) region isaffected. For instance, the bands at 1750 cm−1 for 35,21 andat 2300 and 1330 cm−1 for 35,26 are interpreted as opticalscattering effects predicted by Mie theory (Bohren andHuffman 1983). No precise refractive index can becalculated because of the complex composition of theparticles. Therefore, the baselines (dotted lines in Fig. 10)were empirically chosen to exclude the broadest lines.Figs. 10b and 10c show the corrected spectra and thespectrum of a piece of aerogel (C2054,31,0,0,0),respectively, as well as assigned band positions in the3600−600 cm−1 region. The 4000−2700 cm−1 region will bediscussed in the next section on organic features. Theinterpretation is arduous, because of the optical effects andthe presence of aerogel. However, we can identify somesignatures of silicates in the 1000 cm−1 region. In particle35,21 (Fig. 10b) we observe a mixture of amorphous andcrystalline silicates and a characteristic OH signature, markedby the presence of a broad band at 3377 cm−1 andaccompanied by a weak feature at 3617 cm−1. This ischaracteristic of isolated OH, as it is seen in phyllosilicates.For particle 35,26 (Fig. 10c) we cannot rule out that OHfeatures are from the aerogel. In contrast to particle 35,21,particle 35,26 is mainly composed of crystalline olivine(bands at 1017 and 871 cm−1) and hydration is not evident. IR
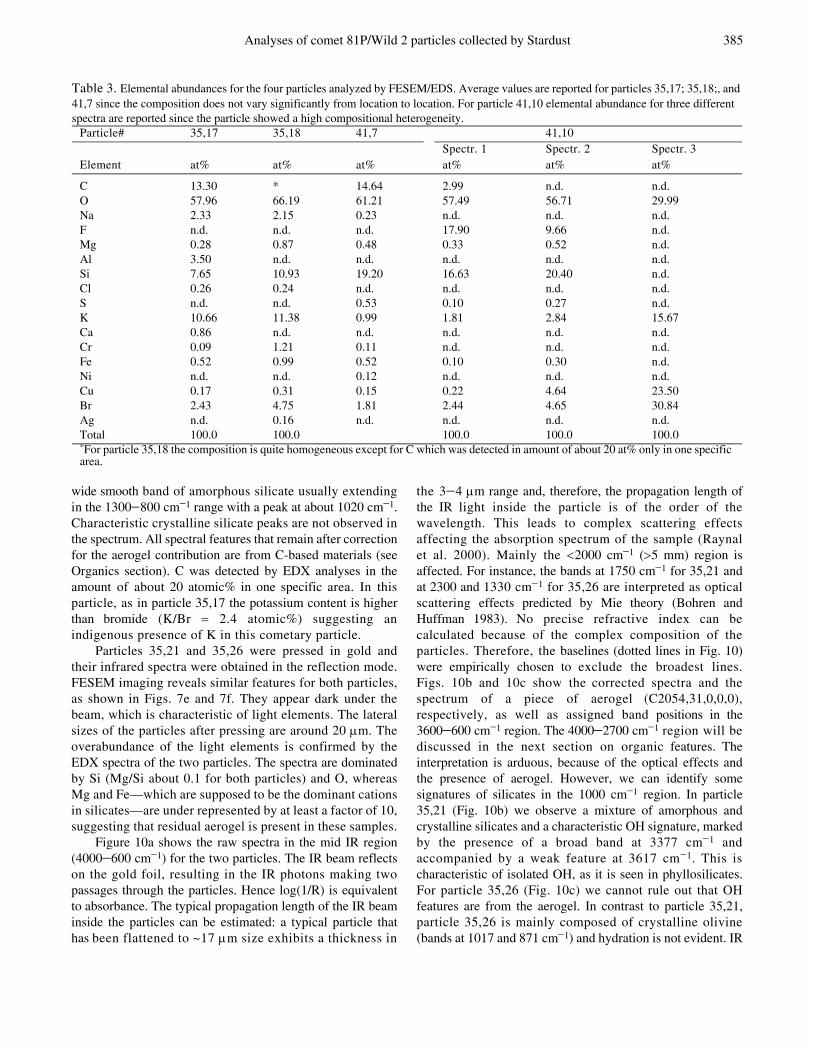
Table 3. Elemental abundances for the four particles analyzed by FESEM/EDS. Average values are reported for particles 35,17; 35,18;, and 41,7 since the composition does not vary significantly from location to location. For particle 41,10 elemental abundance for three different spectra are reported since the particle showed a high compositional heterogeneity.
Particle# 35,17 35,18 41,7 41,10Spectr. 1 Spectr. 2 Spectr. 3
Element at% at% at% at% at% at%
C 13.30 * 14.64 2.99 n.d. n.d.O 57.96 66.19 61.21 57.49 56.71 29.99Na 2.33 2.15 0.23 n.d. n.d. n.d.F n.d. n.d. n.d. 17.90 9.66 n.d.Mg 0.28 0.87 0.48 0.33 0.52 n.d.Al 3.50 n.d. n.d. n.d. n.d. n.d.Si 7.65 10.93 19.20 16.63 20.40 n.d.Cl 0.26 0.24 n.d. n.d. n.d. n.d.S n.d. n.d. 0.53 0.10 0.27 n.d.K 10.66 11.38 0.99 1.81 2.84 15.67Ca 0.86 n.d. n.d. n.d. n.d. n.d.Cr 0.09 1.21 0.11 n.d. n.d. n.d.Fe 0.52 0.99 0.52 0.10 0.30 n.d.Ni n.d. n.d. 0.12 n.d. n.d. n.d.Cu 0.17 0.31 0.15 0.22 4.64 23.50Br 2.43 4.75 1.81 2.44 4.65 30.84Ag n.d. 0.16 n.d. n.d. n.d. n.d.Total 100.0 100.0 100.0 100.0 100.0*For particle 35,18 the composition is quite homogeneous except for C which was detected in amount of about 20 at% only in one specific area.
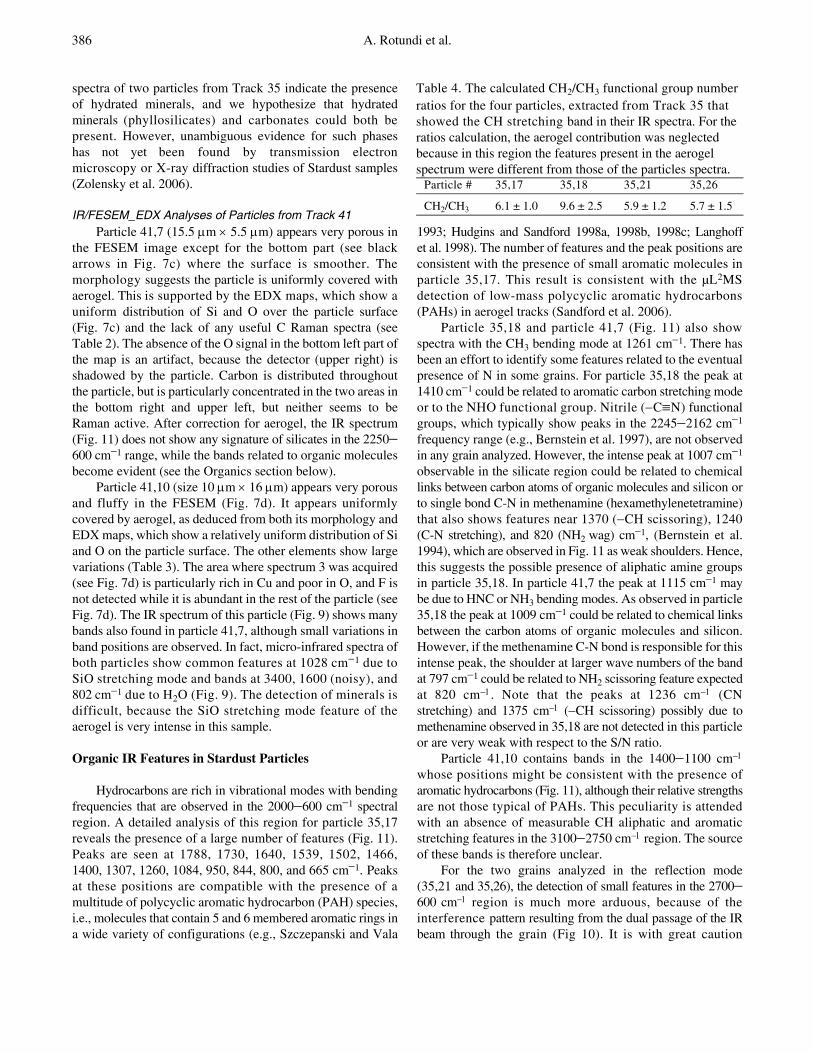
386 A. Rotundi et al.
spectra of two particles from Track 35 indicate the presenceof hydrated minerals, and we hypothesize that hydratedminerals (phyllosilicates) and carbonates could both bepresent. However, unambiguous evidence for such phaseshas not yet been found by transmission electronmicroscopy or X-ray diffraction studies of Stardust samples(Zolensky et al. 2006).
IR/FESEM_EDX Analyses of Particles from Track 41Particle 41,7 (15.5 μm × 5.5 μm) appears very porous in
the FESEM image except for the bottom part (see blackarrows in Fig. 7c) where the surface is smoother. Themorphology suggests the particle is uniformly covered withaerogel. This is supported by the EDX maps, which show auniform distribution of Si and O over the particle surface(Fig. 7c) and the lack of any useful C Raman spectra (seeTable 2). The absence of the O signal in the bottom left part ofthe map is an artifact, because the detector (upper right) isshadowed by the particle. Carbon is distributed throughoutthe particle, but is particularly concentrated in the two areas inthe bottom right and upper left, but neither seems to beRaman active. After correction for aerogel, the IR spectrum(Fig. 11) does not show any signature of silicates in the 2250−600 cm−1 range, while the bands related to organic moleculesbecome evident (see the Organics section below).
Particle 41,10 (size 10 μm × 16 μm) appears very porousand fluffy in the FESEM (Fig. 7d). It appears uniformlycovered by aerogel, as deduced from both its morphology andEDX maps, which show a relatively uniform distribution of Siand O on the particle surface. The other elements show largevariations (Table 3). The area where spectrum 3 was acquired(see Fig. 7d) is particularly rich in Cu and poor in O, and F isnot detected while it is abundant in the rest of the particle (seeFig. 7d). The IR spectrum of this particle (Fig. 9) shows manybands also found in particle 41,7, although small variations inband positions are observed. In fact, micro-infrared spectra ofboth particles show common features at 1028 cm−1 due toSiO stretching mode and bands at 3400, 1600 (noisy), and802 cm−1 due to H2O (Fig. 9). The detection of minerals isdifficult, because the SiO stretching mode feature of theaerogel is very intense in this sample.
Organic IR Features in Stardust Particles
Hydrocarbons are rich in vibrational modes with bendingfrequencies that are observed in the 2000−600 cm−1 spectralregion. A detailed analysis of this region for particle 35,17reveals the presence of a large number of features (Fig. 11).Peaks are seen at 1788, 1730, 1640, 1539, 1502, 1466,1400, 1307, 1260, 1084, 950, 844, 800, and 665 cm−1. Peaksat these positions are compatible with the presence of amultitude of polycyclic aromatic hydrocarbon (PAH) species,i.e., molecules that contain 5 and 6 membered aromatic rings ina wide variety of configurations (e.g., Szczepanski and Vala
1993; Hudgins and Sandford 1998a, 1998b, 1998c; Langhoffet al. 1998). The number of features and the peak positions areconsistent with the presence of small aromatic molecules inparticle 35,17. This result is consistent with the µL2MSdetection of low-mass polycyclic aromatic hydrocarbons(PAHs) in aerogel tracks (Sandford et al. 2006).
Particle 35,18 and particle 41,7 (Fig. 11) also showspectra with the CH3 bending mode at 1261 cm−1. There hasbeen an effort to identify some features related to the eventualpresence of N in some grains. For particle 35,18 the peak at1410 cm−1 could be related to aromatic carbon stretching modeor to the NHO functional group. Nitrile (−C≡N) functionalgroups, which typically show peaks in the 2245−2162 cm−1
frequency range (e.g., Bernstein et al. 1997), are not observedin any grain analyzed. However, the intense peak at 1007 cm−1
observable in the silicate region could be related to chemicallinks between carbon atoms of organic molecules and silicon orto single bond C-N in methenamine (hexamethylenetetramine)that also shows features near 1370 (−CH scissoring), 1240(C-N stretching), and 820 (NH2 wag) cm−1, (Bernstein et al.1994), which are observed in Fig. 11 as weak shoulders. Hence,this suggests the possible presence of aliphatic amine groupsin particle 35,18. In particle 41,7 the peak at 1115 cm−1 maybe due to HNC or NH3 bending modes. As observed in particle35,18 the peak at 1009 cm−1 could be related to chemical linksbetween the carbon atoms of organic molecules and silicon.However, if the methenamine C-N bond is responsible for thisintense peak, the shoulder at larger wave numbers of the bandat 797 cm−1 could be related to NH2 scissoring feature expectedat 820 cm−1. Note that the peaks at 1236 cm−1 (CNstretching) and 1375 cm−1 (−CH scissoring) possibly due tomethenamine observed in 35,18 are not detected in this particleor are very weak with respect to the S/N ratio.
Particle 41,10 contains bands in the 1400−1100 cm−1
whose positions might be consistent with the presence ofaromatic hydrocarbons (Fig. 11), although their relative strengthsare not those typical of PAHs. This peculiarity is attendedwith an absence of measurable CH aliphatic and aromaticstretching features in the 3100−2750 cm−1 region. The sourceof these bands is therefore unclear.
For the two grains analyzed in the reflection mode(35,21 and 35,26), the detection of small features in the 2700−600 cm−1 region is much more arduous, because of theinterference pattern resulting from the dual passage of the IRbeam through the grain (Fig 10). It is with great caution
Table 4. The calculated CH2/CH3 functional group number ratios for the four particles, extracted from Track 35 that showed the CH stretching band in their IR spectra. For the ratios calculation, the aerogel contribution was neglected because in this region the features present in the aerogel spectrum were different from those of the particles spectra.
Particle # 35,17 35,18 35,21 35,26
CH2/CH3 6.1 ± 1.0 9.6 ± 2.5 5.9 ± 1.2 5.7 ± 1.5
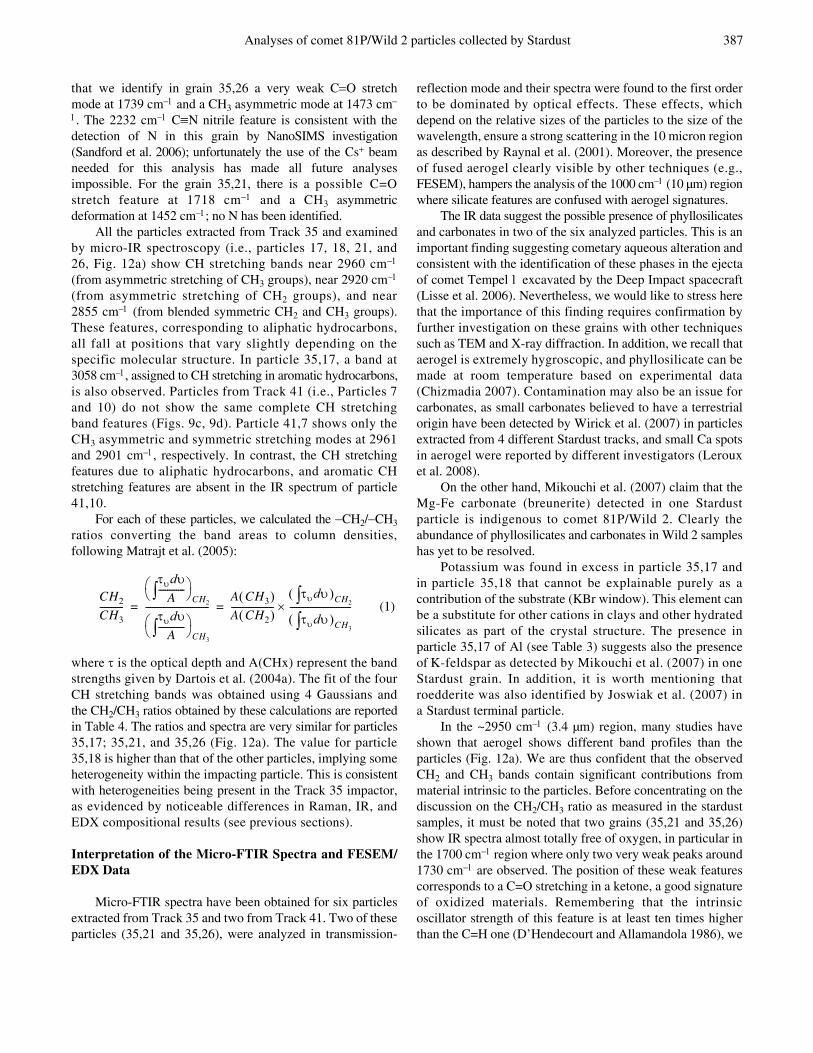
Analyses of comet 81P/Wild 2 particles collected by Stardust 387
that we identify in grain 35,26 a very weak C=O stretchmode at 1739 cm−1 and a CH3 asymmetric mode at 1473 cm−
1. The 2232 cm−1 C≡N nitrile feature is consistent with thedetection of N in this grain by NanoSIMS investigation(Sandford et al. 2006); unfortunately the use of the Cs+ beamneeded for this analysis has made all future analysesimpossible. For the grain 35,21, there is a possible C=Ostretch feature at 1718 cm−1 and a CH3 asymmetricdeformation at 1452 cm−1; no N has been identified.
All the particles extracted from Track 35 and examinedby micro-IR spectroscopy (i.e., particles 17, 18, 21, and26, Fig. 12a) show CH stretching bands near 2960 cm−1
(from asymmetric stretching of CH3 groups), near 2920 cm−1
(from asymmetric stretching of CH2 groups), and near2855 cm−1 (from blended symmetric CH2 and CH3 groups).These features, corresponding to aliphatic hydrocarbons,all fall at positions that vary slightly depending on thespecific molecular structure. In particle 35,17, a band at3058 cm−1, assigned to CH stretching in aromatic hydrocarbons,is also observed. Particles from Track 41 (i.e., Particles 7and 10) do not show the same complete CH stretchingband features (Figs. 9c, 9d). Particle 41,7 shows only theCH3 asymmetric and symmetric stretching modes at 2961and 2901 cm−1, respectively. In contrast, the CH stretchingfeatures due to aliphatic hydrocarbons, and aromatic CHstretching features are absent in the IR spectrum of particle41,10.
For each of these particles, we calculated the −CH2/−CH3ratios converting the band areas to column densities,following Matrajt et al. (2005):
(1)
where τ is the optical depth and A(CHx) represent the bandstrengths given by Dartois et al. (2004a). The fit of the fourCH stretching bands was obtained using 4 Gaussians andthe CH2/CH3 ratios obtained by these calculations are reportedin Table 4. The ratios and spectra are very similar for particles35,17; 35,21, and 35,26 (Fig. 12a). The value for particle35,18 is higher than that of the other particles, implying someheterogeneity within the impacting particle. This is consistentwith heterogeneities being present in the Track 35 impactor,as evidenced by noticeable differences in Raman, IR, andEDX compositional results (see previous sections).
Interpretation of the Micro-FTIR Spectra and FESEM/EDX Data
Micro-FTIR spectra have been obtained for six particlesextracted from Track 35 and two from Track 41. Two of theseparticles (35,21 and 35,26), were analyzed in transmission-
reflection mode and their spectra were found to the first orderto be dominated by optical effects. These effects, whichdepend on the relative sizes of the particles to the size of thewavelength, ensure a strong scattering in the 10 micron regionas described by Raynal et al. (2001). Moreover, the presenceof fused aerogel clearly visible by other techniques (e.g.,FESEM), hampers the analysis of the 1000 cm−1 (10 µm) regionwhere silicate features are confused with aerogel signatures.
The IR data suggest the possible presence of phyllosilicatesand carbonates in two of the six analyzed particles. This is animportant finding suggesting cometary aqueous alteration andconsistent with the identification of these phases in the ejectaof comet Tempel 1 excavated by the Deep Impact spacecraft(Lisse et al. 2006). Nevertheless, we would like to stress herethat the importance of this finding requires confirmation byfurther investigation on these grains with other techniquessuch as TEM and X-ray diffraction. In addition, we recall thataerogel is extremely hygroscopic, and phyllosilicate can bemade at room temperature based on experimental data(Chizmadia 2007). Contamination may also be an issue forcarbonates, as small carbonates believed to have a terrestrialorigin have been detected by Wirick et al. (2007) in particlesextracted from 4 different Stardust tracks, and small Ca spotsin aerogel were reported by different investigators (Lerouxet al. 2008).
On the other hand, Mikouchi et al. (2007) claim that theMg-Fe carbonate (breunerite) detected in one Stardustparticle is indigenous to comet 81P/Wild 2. Clearly theabundance of phyllosilicates and carbonates in Wild 2 sampleshas yet to be resolved.
Potassium was found in excess in particle 35,17 andin particle 35,18 that cannot be explainable purely as acontribution of the substrate (KBr window). This element canbe a substitute for other cations in clays and other hydratedsilicates as part of the crystal structure. The presence inparticle 35,17 of Al (see Table 3) suggests also the presenceof K-feldspar as detected by Mikouchi et al. (2007) in oneStardust grain. In addition, it is worth mentioning thatroedderite was also identified by Joswiak et al. (2007) ina Stardust terminal particle.
In the ~2950 cm−1 (3.4 µm) region, many studies haveshown that aerogel shows different band profiles than theparticles (Fig. 12a). We are thus confident that the observedCH2 and CH3 bands contain significant contributions frommaterial intrinsic to the particles. Before concentrating on thediscussion on the CH2/CH3 ratio as measured in the stardustsamples, it must be noted that two grains (35,21 and 35,26)show IR spectra almost totally free of oxygen, in particular inthe 1700 cm−1 region where only two very weak peaks around1730 cm−1 are observed. The position of these weak featurescorresponds to a C=O stretching in a ketone, a good signatureof oxidized materials. Remembering that the intrinsicoscillator strength of this feature is at least ten times higherthan the C=H one (D’Hendecourt and Allamandola 1986), we
CH2
CH3-----------
τυdυA
------------∫⎝ ⎠⎛ ⎞
CH2
τυdυA
------------∫⎝ ⎠⎛ ⎞
CH3
-----------------------------A CH3( )A CH2( )-------------------
τυdυ∫( )CH2
τυdυ∫( )CH3
----------------------------×= =

388 A. Rotundi et al.
can safely deduce that C=O is not present in these two grainsat levels more than ~1% of C=H. This observation, togetherwith the fact that Raman data clearly indicate only littlethermal metamorphism of many of our samples, implies thatat least some of the organic carbon in these grains has notsuffered much from aerogel entry. Such a statement is difficultfor the other studied grains because of the strong contributionof aerogel bands in this region. A similar effect has been notedin the hypervelocity capture of materials in aerogel, wherematerials in keystoned tracks were found to be oxidized at theentrance of the track while remaining in their initial oxidationstate within the terminal grain. This effect was noted both forsmall Allende grains that were fired in aerogel blocks at similarvelocities as the Stardust spacecraft’s flyby encounter withWild 2 or from aerogel collectors exposed outside the MIRstation to the extraterrestrial population present on low Earthorbits (Borg et al. 2006; Grossemy et al. 2006). Althoughthis oxidation was determined specifically from the state ofiron present in the samples, a similar behavior might beexpected for any material, mineral or organic, that reactswith the abundant oxygen of the aerogel during impact.However, the degree of heating decreases with depth in thetrack and the degree of oxidation should correspondinglydecrease. In addition, it is clear that the impact process is ahighly stochastic one and that fragile materials can often beprotected during deceleration by surrounding materials.Thus, while it is clear that organic materials do survivehypervelocity impact into aerogel, it is reasonable to considerthe possibility that some degree of oxidation could occurduring the impact process, along the track, and decreasing atthe end of it, just as recorded for the iron oxidation state insimulation experiments (Grossemy et al. 2006).
The CH2/CH3 Ratios in the Wild 2 Particles and Comparisonwith these Ratios in ISM and IDPs
The C=H stretching features seen in the Wild 2 samplescan be compared to those seen in the spectra of organics in thediffuse ISM and in IDPs. The C=H stretching features ofaliphatic hydrocarbons have been observed along many linesof sight in the diffuse ISM (Sandford et al. 1991; Pendletonet al. 1994; Whittet et al. 1997; Chiar et al. 2000; Dartois et al.2004b). In Fig. 12b and c we compare a spectrum in the C=Hstretching region of the galactic center SGR AW (ISOArchive), a line of sight that crosses a long path of diffusematter in our galaxy with the spectra of Wild 2 particles. Forthe galactic center data, the CH2/CH3 ratio is close to 2.2,similar to that seen in the diffuse ISM along many lines ofsight in our galaxy (Sandford et al. 1991; Pendleton et al.1994) and in the diffuse ISM in the external Seyfertgalaxies (Dartois et al. 2004a). The observed CH2/CH3 ratiosare clearly considerably higher in the spectra obtained fromthe Wild 2 grains described in this work.
In contrast to what is observed in the diffuse ISM, the
similarities between the CH2/CH3 ratios of IDPs and theStardust particles are striking. The CH2/CH3 ratios for threeof our Stardust particles is around 6 (Table 4); this comparesto values ranging from 3.4 to 5.5 for IDPs (Matrajt et al.2005). A similar comparison can also be made for theprimitive meteorite Tagish Lake (Matrajt et al. 2004) where aratio of 7.3 is found for the organic material, and particle35,18 for which the CH2/CH3 ratio is 9.6 ± 2.5.
It must be finally noted that the situation in the diffuse ISMis quite different to that in dense molecular clouds, where thealiphatic features are not nearly as prominent (Allamandolaet al. 1992; Brooke et al. 1996, 1999; Chiar et al. 1996) and thenumber of aliphatic C=H bonds is reduced by at least 55% withrespect to the diffuse regions (Muñoz-Caro et al. 2001).
To identify the nature of the carrier of these features, variouscosmic analog materials have been studied in the laboratory.This provides a critical means to assess the possibleinterstellar origin of the organic matter in the cometarymaterial as sampled by Stardust.
The ~2950 cm−1 (3.4 μm) structure observed inabsorption in many astrophysical objects (Pendleton et al.1994; Pendleton and Allamandola 2002; Dartois et al. 2004b)has been studied at length using various laboratorysimulations that are able to reproduce, with a high degree ofaccuracy, the observed lines, not only in the ~2950 cm−1
region but also at higher wavelengths. For instance, Pendletonand Allamandola (2002) have analyzed the spectrum ofdiffuse interstellar dust in the 1000–4000 cm−1 range andhave compared it with the spectra of 13 cosmic analogmaterials. To constrain the applicability of the candidatematerials, in addition to the profile of the ~2950 cm−1 regionband, further evaluation criteria have been considered, i.e.,the optical depth ratio of the C=H stretching feature to: a) thecorresponding deformation modes, b) the O-H stretch band at3333 cm−1, and c) the carbonyl band at 1724 cm−1. The mainconclusion is that the organic refractory material in thediffuse interstellar medium is mainly hydrocarbon in nature,with the carbon distributed between the aliphatic andaromatic forms, and with little oxygen and nitrogen. Thismaterial is more similar to plasma processed purehydrocarbon materials than to energetically processed iceresidues. Mennella et al. (2002) and Dartois et al. (2004b)have shown that the best match to the features identified in theIR spectra of diffuse ISM organics, around 2950, 1380, and1460 cm−1, is obtained with hydrogenated amorphous carbongrains and organic matter with a kerogen-like structure,respectively.
On the basis of the results of laboratory simulations of grainprocessing in space, modeling of carbon dust evolutionindicates that hydrogenation of carbon particles by H atomsmay be the key mechanism determining the presence of thealiphatic band around 2950 cm−1 in the spectrum of diffuseinterstellar dust (Mennella et al. 2002). In the diffuse interstellarmedium, competition between C-H bond formation and its
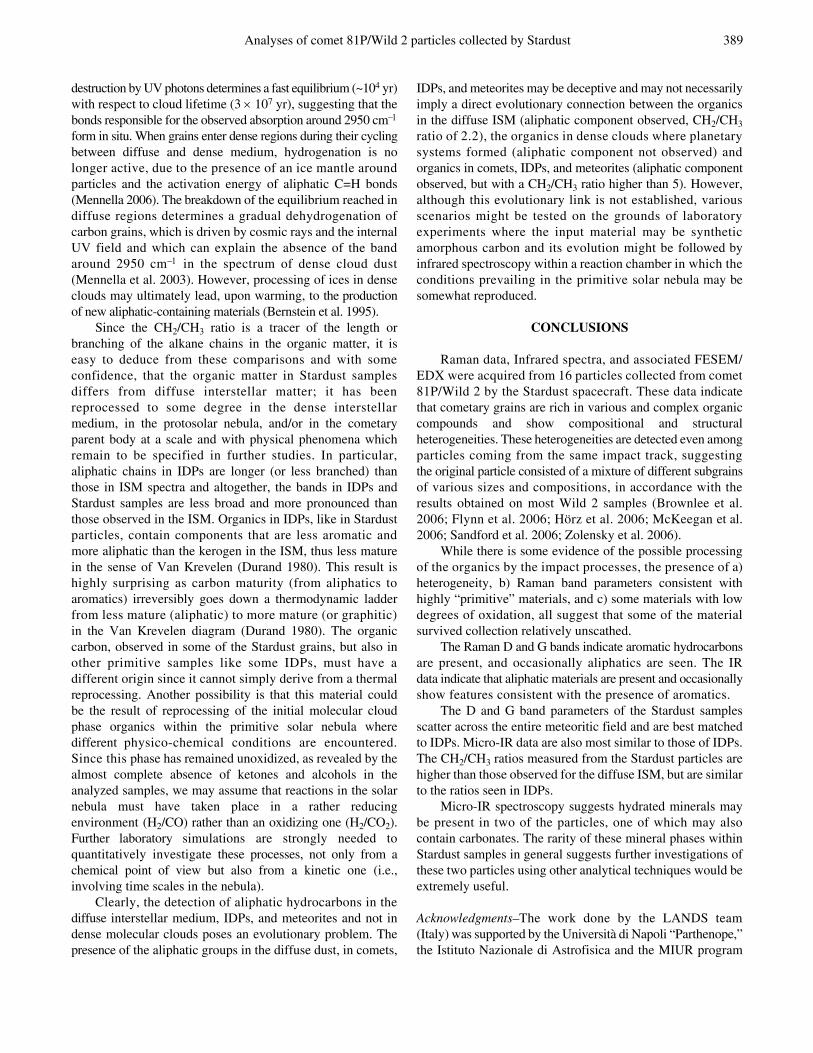
Analyses of comet 81P/Wild 2 particles collected by Stardust 389
destruction by UV photons determines a fast equilibrium (~104 yr)with respect to cloud lifetime (3 × 10⁷ yr), suggesting that thebonds responsible for the observed absorption around 2950 cm−1
form in situ. When grains enter dense regions during their cyclingbetween diffuse and dense medium, hydrogenation is nolonger active, due to the presence of an ice mantle aroundparticles and the activation energy of aliphatic C=H bonds(Mennella 2006). The breakdown of the equilibrium reached indiffuse regions determines a gradual dehydrogenation ofcarbon grains, which is driven by cosmic rays and the internalUV field and which can explain the absence of the bandaround 2950 cm−1 in the spectrum of dense cloud dust(Mennella et al. 2003). However, processing of ices in denseclouds may ultimately lead, upon warming, to the productionof new aliphatic-containing materials (Bernstein et al. 1995).
Since the CH2/CH3 ratio is a tracer of the length orbranching of the alkane chains in the organic matter, it iseasy to deduce from these comparisons and with someconfidence, that the organic matter in Stardust samplesdiffers from diffuse interstellar matter; it has beenreprocessed to some degree in the dense interstellarmedium, in the protosolar nebula, and/or in the cometaryparent body at a scale and with physical phenomena whichremain to be specified in further studies. In particular,aliphatic chains in IDPs are longer (or less branched) thanthose in ISM spectra and altogether, the bands in IDPs andStardust samples are less broad and more pronounced thanthose observed in the ISM. Organics in IDPs, like in Stardustparticles, contain components that are less aromatic andmore aliphatic than the kerogen in the ISM, thus less maturein the sense of Van Krevelen (Durand 1980). This result ishighly surprising as carbon maturity (from aliphatics toaromatics) irreversibly goes down a thermodynamic ladderfrom less mature (aliphatic) to more mature (or graphitic)in the Van Krevelen diagram (Durand 1980). The organiccarbon, observed in some of the Stardust grains, but also inother primitive samples like some IDPs, must have adifferent origin since it cannot simply derive from a thermalreprocessing. Another possibility is that this material couldbe the result of reprocessing of the initial molecular cloudphase organics within the primitive solar nebula wheredifferent physico-chemical conditions are encountered.Since this phase has remained unoxidized, as revealed by thealmost complete absence of ketones and alcohols in theanalyzed samples, we may assume that reactions in the solarnebula must have taken place in a rather reducingenvironment (H2/CO) rather than an oxidizing one (H2/CO2).Further laboratory simulations are strongly needed toquantitatively investigate these processes, not only from achemical point of view but also from a kinetic one (i.e.,involving time scales in the nebula).
Clearly, the detection of aliphatic hydrocarbons in thediffuse interstellar medium, IDPs, and meteorites and not indense molecular clouds poses an evolutionary problem. Thepresence of the aliphatic groups in the diffuse dust, in comets,
IDPs, and meteorites may be deceptive and may not necessarilyimply a direct evolutionary connection between the organicsin the diffuse ISM (aliphatic component observed, CH2/CH3ratio of 2.2), the organics in dense clouds where planetarysystems formed (aliphatic component not observed) andorganics in comets, IDPs, and meteorites (aliphatic componentobserved, but with a CH2/CH3 ratio higher than 5). However,although this evolutionary link is not established, variousscenarios might be tested on the grounds of laboratoryexperiments where the input material may be syntheticamorphous carbon and its evolution might be followed byinfrared spectroscopy within a reaction chamber in which theconditions prevailing in the primitive solar nebula may besomewhat reproduced.
CONCLUSIONS
Raman data, Infrared spectra, and associated FESEM/EDX were acquired from 16 particles collected from comet81P/Wild 2 by the Stardust spacecraft. These data indicatethat cometary grains are rich in various and complex organiccompounds and show compositional and structuralheterogeneities. These heterogeneities are detected even amongparticles coming from the same impact track, suggestingthe original particle consisted of a mixture of different subgrainsof various sizes and compositions, in accordance with theresults obtained on most Wild 2 samples (Brownlee et al.2006; Flynn et al. 2006; Hörz et al. 2006; McKeegan et al.2006; Sandford et al. 2006; Zolensky et al. 2006).
While there is some evidence of the possible processingof the organics by the impact processes, the presence of a)heterogeneity, b) Raman band parameters consistent withhighly “primitive” materials, and c) some materials with lowdegrees of oxidation, all suggest that some of the materialsurvived collection relatively unscathed.
The Raman D and G bands indicate aromatic hydrocarbonsare present, and occasionally aliphatics are seen. The IRdata indicate that aliphatic materials are present and occasionallyshow features consistent with the presence of aromatics.
The D and G band parameters of the Stardust samplesscatter across the entire meteoritic field and are best matchedto IDPs. Micro-IR data are also most similar to those of IDPs.The CH2/CH3 ratios measured from the Stardust particles arehigher than those observed for the diffuse ISM, but are similarto the ratios seen in IDPs.
Micro-IR spectroscopy suggests hydrated minerals maybe present in two of the particles, one of which may alsocontain carbonates. The rarity of these mineral phases withinStardust samples in general suggests further investigations ofthese two particles using other analytical techniques would beextremely useful.
Acknowledgments–The work done by the LANDS team(Italy) was supported by the Università di Napoli “Parthenope,”the Istituto Nazionale di Astrofisica and the MIUR program
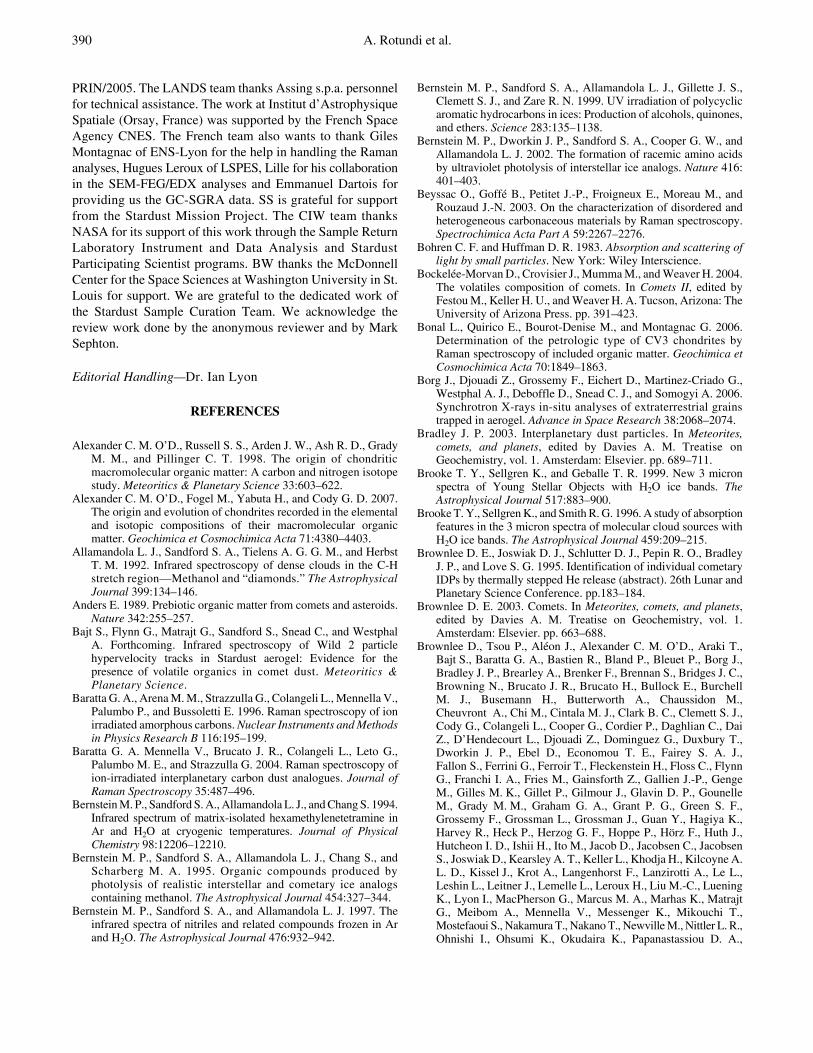
390 A. Rotundi et al.
PRIN/2005. The LANDS team thanks Assing s.p.a. personnelfor technical assistance. The work at Institut d’AstrophysiqueSpatiale (Orsay, France) was supported by the French SpaceAgency CNES. The French team also wants to thank GilesMontagnac of ENS-Lyon for the help in handling the Ramananalyses, Hugues Leroux of LSPES, Lille for his collaborationin the SEM-FEG/EDX analyses and Emmanuel Dartois forproviding us the GC-SGRA data. SS is grateful for supportfrom the Stardust Mission Project. The CIW team thanksNASA for its support of this work through the Sample ReturnLaboratory Instrument and Data Analysis and StardustParticipating Scientist programs. BW thanks the McDonnellCenter for the Space Sciences at Washington University in St.Louis for support. We are grateful to the dedicated work ofthe Stardust Sample Curation Team. We acknowledge thereview work done by the anonymous reviewer and by MarkSephton.
Editorial Handling—Dr. Ian Lyon
REFERENCES
Alexander C. M. O’D., Russell S. S., Arden J. W., Ash R. D., GradyM. M., and Pillinger C. T. 1998. The origin of chondriticmacromolecular organic matter: A carbon and nitrogen isotopestudy. Meteoritics & Planetary Science 33:603–622.
Alexander C. M. O’D., Fogel M., Yabuta H., and Cody G. D. 2007.The origin and evolution of chondrites recorded in the elementaland isotopic compositions of their macromolecular organicmatter. Geochimica et Cosmochimica Acta 71:4380–4403.
Allamandola L. J., Sandford S. A., Tielens A. G. G. M., and HerbstT. M. 1992. Infrared spectroscopy of dense clouds in the C-Hstretch region—Methanol and “diamonds.” The AstrophysicalJournal 399:134–146.
Anders E. 1989. Prebiotic organic matter from comets and asteroids.Nature 342:255–257.
Bajt S., Flynn G., Matrajt G., Sandford S., Snead C., and WestphalA. Forthcoming. Infrared spectroscopy of Wild 2 particlehypervelocity tracks in Stardust aerogel: Evidence for thepresence of volatile organics in comet dust. Meteoritics &Planetary Science.
Baratta G. A., Arena M. M., Strazzulla G., Colangeli L., Mennella V.,Palumbo P., and Bussoletti E. 1996. Raman spectroscopy of ionirradiated amorphous carbons. Nuclear Instruments and Methodsin Physics Research B 116:195–199.
Baratta G. A. Mennella V., Brucato J. R., Colangeli L., Leto G.,Palumbo M. E., and Strazzulla G. 2004. Raman spectroscopy ofion-irradiated interplanetary carbon dust analogues. Journal ofRaman Spectroscopy 35:487–496.
Bernstein M. P., Sandford S. A., Allamandola L. J., and Chang S. 1994.Infrared spectrum of matrix-isolated hexamethylenetetramine inAr and H2O at cryogenic temperatures. Journal of PhysicalChemistry 98:12206–12210.
Bernstein M. P., Sandford S. A., Allamandola L. J., Chang S., andScharberg M. A. 1995. Organic compounds produced byphotolysis of realistic interstellar and cometary ice analogscontaining methanol. The Astrophysical Journal 454:327–344.
Bernstein M. P., Sandford S. A., and Allamandola L. J. 1997. Theinfrared spectra of nitriles and related compounds frozen in Arand H2O. The Astrophysical Journal 476:932–942.
Bernstein M. P., Sandford S. A., Allamandola L. J., Gillette J. S.,Clemett S. J., and Zare R. N. 1999. UV irradiation of polycyclicaromatic hydrocarbons in ices: Production of alcohols, quinones,and ethers. Science 283:135–1138.
Bernstein M. P., Dworkin J. P., Sandford S. A., Cooper G. W., andAllamandola L. J. 2002. The formation of racemic amino acidsby ultraviolet photolysis of interstellar ice analogs. Nature 416:401–403.
Beyssac O., Goffé B., Petitet J.-P., Froigneux E., Moreau M., andRouzaud J.-N. 2003. On the characterization of disordered andheterogeneous carbonaceous materials by Raman spectroscopy.Spectrochimica Acta Part A 59:2267–2276.
Bohren C. F. and Huffman D. R. 1983. Absorption and scattering oflight by small particles. New York: Wiley Interscience.
Bockelée-Morvan D., Crovisier J., Mumma M., and Weaver H. 2004.The volatiles composition of comets. In Comets II, edited byFestou M., Keller H. U., and Weaver H. A. Tucson, Arizona: TheUniversity of Arizona Press. pp. 391–423.
Bonal L., Quirico E., Bourot-Denise M., and Montagnac G. 2006.Determination of the petrologic type of CV3 chondrites byRaman spectroscopy of included organic matter. Geochimica etCosmochimica Acta 70:1849–1863.
Borg J., Djouadi Z., Grossemy F., Eichert D., Martinez-Criado G.,Westphal A. J., Deboffle D., Snead C. J., and Somogyi A. 2006.Synchrotron X-rays in-situ analyses of extraterrestrial grainstrapped in aerogel. Advance in Space Research 38:2068–2074.
Bradley J. P. 2003. Interplanetary dust particles. In Meteorites,comets, and planets, edited by Davies A. M. Treatise onGeochemistry, vol. 1. Amsterdam: Elsevier. pp. 689–711.
Brooke T. Y., Sellgren K., and Geballe T. R. 1999. New 3 micronspectra of Young Stellar Objects with H2O ice bands. TheAstrophysical Journal 517:883–900.
Brooke T. Y., Sellgren K., and Smith R. G. 1996. A study of absorptionfeatures in the 3 micron spectra of molecular cloud sources withH2O ice bands. The Astrophysical Journal 459:209–215.
Brownlee D. E., Joswiak D. J., Schlutter D. J., Pepin R. O., BradleyJ. P., and Love S. G. 1995. Identification of individual cometaryIDPs by thermally stepped He release (abstract). 26th Lunar andPlanetary Science Conference. pp.183–184.
Brownlee D. E. 2003. Comets. In Meteorites, comets, and planets,edited by Davies A. M. Treatise on Geochemistry, vol. 1.Amsterdam: Elsevier. pp. 663–688.
Brownlee D., Tsou P., Aléon J., Alexander C. M. O’D., Araki T.,Bajt S., Baratta G. A., Bastien R., Bland P., Bleuet P., Borg J.,Bradley J. P., Brearley A., Brenker F., Brennan S., Bridges J. C.,Browning N., Brucato J. R., Brucato H., Bullock E., BurchellM. J., Busemann H., Butterworth A., Chaussidon M.,Cheuvront A., Chi M., Cintala M. J., Clark B. C., Clemett S. J.,Cody G., Colangeli L., Cooper G., Cordier P., Daghlian C., DaiZ., D’Hendecourt L., Djouadi Z., Dominguez G., Duxbury T.,Dworkin J. P., Ebel D., Economou T. E., Fairey S. A. J.,Fallon S., Ferrini G., Ferroir T., Fleckenstein H., Floss C., FlynnG., Franchi I. A., Fries M., Gainsforth Z., Gallien J.-P., GengeM., Gilles M. K., Gillet P., Gilmour J., Glavin D. P., GounelleM., Grady M. M., Graham G. A., Grant P. G., Green S. F.,Grossemy F., Grossman L., Grossman J., Guan Y., Hagiya K.,Harvey R., Heck P., Herzog G. F., Hoppe P., Hörz F., Huth J.,Hutcheon I. D., Ishii H., Ito M., Jacob D., Jacobsen C., JacobsenS., Joswiak D., Kearsley A. T., Keller L., Khodja H., Kilcoyne A.L. D., Kissel J., Krot A., Langenhorst F., Lanzirotti A., Le L.,Leshin L., Leitner J., Lemelle L., Leroux H., Liu M.-C., LueningK., Lyon I., MacPherson G., Marcus M. A., Marhas K., MatrajtG., Meibom A., Mennella V., Messenger K., Mikouchi T.,Mostefaoui S., Nakamura T., Nakano T., Newville M., Nittler L. R.,Ohnishi I., Ohsumi K., Okudaira K., Papanastassiou D. A.,
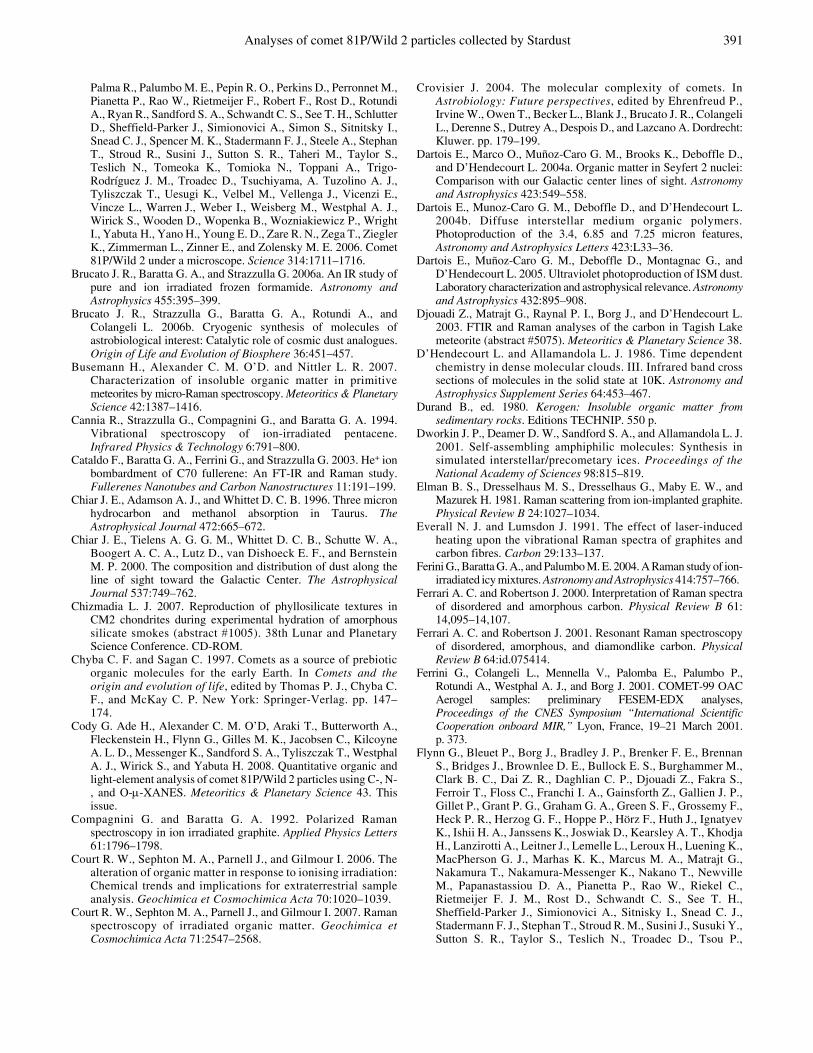
Analyses of comet 81P/Wild 2 particles collected by Stardust 391
Palma R., Palumbo M. E., Pepin R. O., Perkins D., Perronnet M.,Pianetta P., Rao W., Rietmeijer F., Robert F., Rost D., RotundiA., Ryan R., Sandford S. A., Schwandt C. S., See T. H., SchlutterD., Sheffield-Parker J., Simionovici A., Simon S., Sitnitsky I.,Snead C. J., Spencer M. K., Stadermann F. J., Steele A., StephanT., Stroud R., Susini J., Sutton S. R., Taheri M., Taylor S.,Teslich N., Tomeoka K., Tomioka N., Toppani A., Trigo-Rodríguez J. M., Troadec D., Tsuchiyama, A. Tuzolino A. J.,Tyliszczak T., Uesugi K., Velbel M., Vellenga J., Vicenzi E.,Vincze L., Warren J., Weber I., Weisberg M., Westphal A. J.,Wirick S., Wooden D., Wopenka B., Wozniakiewicz P., WrightI., Yabuta H., Yano H., Young E. D., Zare R. N., Zega T., ZieglerK., Zimmerman L., Zinner E., and Zolensky M. E. 2006. Comet81P/Wild 2 under a microscope. Science 314:1711–1716.
Brucato J. R., Baratta G. A., and Strazzulla G. 2006a. An IR study ofpure and ion irradiated frozen formamide. Astronomy andAstrophysics 455:395–399.
Brucato J. R., Strazzulla G., Baratta G. A., Rotundi A., andColangeli L. 2006b. Cryogenic synthesis of molecules ofastrobiological interest: Catalytic role of cosmic dust analogues.Origin of Life and Evolution of Biosphere 36:451–457.
Busemann H., Alexander C. M. O’D. and Nittler L. R. 2007.Characterization of insoluble organic matter in primitivemeteorites by micro-Raman spectroscopy. Meteoritics & PlanetaryScience 42:1387–1416.
Cannia R., Strazzulla G., Compagnini G., and Baratta G. A. 1994.Vibrational spectroscopy of ion-irradiated pentacene.Infrared Physics & Technology 6:791–800.
Cataldo F., Baratta G. A., Ferrini G., and Strazzulla G. 2003. He+ ionbombardment of C70 fullerene: An FT-IR and Raman study.Fullerenes Nanotubes and Carbon Nanostructures 11:191–199.
Chiar J. E., Adamson A. J., and Whittet D. C. B. 1996. Three micronhydrocarbon and methanol absorption in Taurus. TheAstrophysical Journal 472:665–672.
Chiar J. E., Tielens A. G. G. M., Whittet D. C. B., Schutte W. A.,Boogert A. C. A., Lutz D., van Dishoeck E. F., and BernsteinM. P. 2000. The composition and distribution of dust along theline of sight toward the Galactic Center. The AstrophysicalJournal 537:749–762.
Chizmadia L. J. 2007. Reproduction of phyllosilicate textures inCM2 chondrites during experimental hydration of amorphoussilicate smokes (abstract #1005). 38th Lunar and PlanetaryScience Conference. CD-ROM.
Chyba C. F. and Sagan C. 1997. Comets as a source of prebioticorganic molecules for the early Earth. In Comets and theorigin and evolution of life, edited by Thomas P. J., Chyba C.F., and McKay C. P. New York: Springer-Verlag. pp. 147–174.
Cody G. Ade H., Alexander C. M. O’D, Araki T., Butterworth A.,Fleckenstein H., Flynn G., Gilles M. K., Jacobsen C., KilcoyneA. L. D., Messenger K., Sandford S. A., Tyliszczak T., WestphalA. J., Wirick S., and Yabuta H. 2008. Quantitative organic andlight-element analysis of comet 81P/Wild 2 particles using C-, N-, and O-μ-XANES. Meteoritics & Planetary Science 43. Thisissue.
Compagnini G. and Baratta G. A. 1992. Polarized Ramanspectroscopy in ion irradiated graphite. Applied Physics Letters61:1796–1798.
Court R. W., Sephton M. A., Parnell J., and Gilmour I. 2006. Thealteration of organic matter in response to ionising irradiation:Chemical trends and implications for extraterrestrial sampleanalysis. Geochimica et Cosmochimica Acta 70:1020–1039.
Court R. W., Sephton M. A., Parnell J., and Gilmour I. 2007. Ramanspectroscopy of irradiated organic matter. Geochimica etCosmochimica Acta 71:2547–2568.
Crovisier J. 2004. The molecular complexity of comets. InAstrobiology: Future perspectives, edited by Ehrenfreud P.,Irvine W., Owen T., Becker L., Blank J., Brucato J. R., ColangeliL., Derenne S., Dutrey A., Despois D., and Lazcano A. Dordrecht:Kluwer. pp. 179–199.
Dartois E., Marco O., Muñoz-Caro G. M., Brooks K., Deboffle D.,and D’Hendecourt L. 2004a. Organic matter in Seyfert 2 nuclei:Comparison with our Galactic center lines of sight. Astronomyand Astrophysics 423:549–558.
Dartois E., Munoz-Caro G. M., Deboffle D., and D’Hendecourt L.2004b. Diffuse interstellar medium organic polymers.Photoproduction of the 3.4, 6.85 and 7.25 micron features,Astronomy and Astrophysics Letters 423:L33–36.
Dartois E., Muñoz-Caro G. M., Deboffle D., Montagnac G., andD’Hendecourt L. 2005. Ultraviolet photoproduction of ISM dust.Laboratory characterization and astrophysical relevance. Astronomyand Astrophysics 432:895–908.
Djouadi Z., Matrajt G., Raynal P. I., Borg J., and D’Hendecourt L.2003. FTIR and Raman analyses of the carbon in Tagish Lakemeteorite (abstract #5075). Meteoritics & Planetary Science 38.
D’Hendecourt L. and Allamandola L. J. 1986. Time dependentchemistry in dense molecular clouds. III. Infrared band crosssections of molecules in the solid state at 10K. Astronomy andAstrophysics Supplement Series 64:453–467.
Durand B., ed. 1980. Kerogen: Insoluble organic matter fromsedimentary rocks. Editions TECHNIP. 550 p.
Dworkin J. P., Deamer D. W., Sandford S. A., and Allamandola L. J.2001. Self-assembling amphiphilic molecules: Synthesis insimulated interstellar/precometary ices. Proceedings of theNational Academy of Sciences 98:815–819.
Elman B. S., Dresselhaus M. S., Dresselhaus G., Maby E. W., andMazurek H. 1981. Raman scattering from ion-implanted graphite.Physical Review B 24:1027–1034.
Everall N. J. and Lumsdon J. 1991. The effect of laser-inducedheating upon the vibrational Raman spectra of graphites andcarbon fibres. Carbon 29:133–137.
Ferini G., Baratta G. A., and Palumbo M. E. 2004. A Raman study of ion-irradiated icy mixtures. Astronomy and Astrophysics 414:757–766.
Ferrari A. C. and Robertson J. 2000. Interpretation of Raman spectraof disordered and amorphous carbon. Physical Review B 61:14,095–14,107.
Ferrari A. C. and Robertson J. 2001. Resonant Raman spectroscopyof disordered, amorphous, and diamondlike carbon. PhysicalReview B 64:id.075414.
Ferrini G., Colangeli L., Mennella V., Palomba E., Palumbo P.,Rotundi A., Westphal A. J., and Borg J. 2001. COMET-99 OACAerogel samples: preliminary FESEM-EDX analyses,Proceedings of the CNES Symposium “International ScientificCooperation onboard MIR,” Lyon, France, 19–21 March 2001.p. 373.
Flynn G., Bleuet P., Borg J., Bradley J. P., Brenker F. E., BrennanS., Bridges J., Brownlee D. E., Bullock E. S., Burghammer M.,Clark B. C., Dai Z. R., Daghlian C. P., Djouadi Z., Fakra S.,Ferroir T., Floss C., Franchi I. A., Gainsforth Z., Gallien J. P.,Gillet P., Grant P. G., Graham G. A., Green S. F., Grossemy F.,Heck P. R., Herzog G. F., Hoppe P., Hörz F., Huth J., IgnatyevK., Ishii H. A., Janssens K., Joswiak D., Kearsley A. T., KhodjaH., Lanzirotti A., Leitner J., Lemelle L., Leroux H., Luening K.,MacPherson G. J., Marhas K. K., Marcus M. A., Matrajt G.,Nakamura T., Nakamura-Messenger K., Nakano T., NewvilleM., Papanastassiou D. A., Pianetta P., Rao W., Riekel C.,Rietmeijer F. J. M., Rost D., Schwandt C. S., See T. H.,Sheffield-Parker J., Simionovici A., Sitnisky I., Snead C. J.,Stadermann F. J., Stephan T., Stroud R. M., Susini J., Susuki Y.,Sutton S. R., Taylor S., Teslich N., Troadec D., Tsou P.,

392 A. Rotundi et al.
Tsuchiyama A., Uesigi K., Vekemans B., Vicenzi E. P.,Vincze L., Westphal A. J., Wosniakiewicz P., Zinner E., andZolensky M. E. 2006. Elemental compositions of comet 81P/Wild 2 samples collected by Stardust. Science 314:1731–1735.
Flynn G. J., Keller L. P., Feser M., Wirick S., and Jacobsen C. 2003.The origin of organic matter in the solar system: Evidence fromthe interplanetary dust particles. Geochimica et CosmochimicaActa 67:4791–4806.
Fomenkova M. N. 1999. On the organic refractory component ofcometary dust. Space Science Reviews 90:109–114.
Foster N. J., Burchell M. J., Creighton J. A., and Kearsley A. T. 2007.Does capture in aerogel change carbonaceous Raman D and Gbands? (abstract #1647). 38th Lunar and Planetary ScienceConference. CD-ROM.
Gil-Hutton R. 2002. Color diversity among Kuiper belt objects: Thecollisional resurfacing model revisited. Planetary and SpaceScience 50:57–62.
Grewing M., Praderie F., and Reinhard R., eds. 1987. Exploration ofHalley’s comet. Berlin Heidelberg, New York, London, Paris,Tokyo: Springer.
Grossemy F., Borg J., and Simionovici A. 2006. In-situ Fe-XANESstudy of grains trapped in aerogel: an analytical test for theinterpretation of Stardust samples analyses. Meteoritics &Planetary Science 41:5276.
Hill H. G. M. and Nuth J. A. 2003. The catalytic potential of cosmicdust: Implications for prebiotic chemistry in the solar nebula andother protoplanetary systems. Astrobiology 3:291–304.
Hollis J. M., Jewell P. R., Lovas F. J., Remijan A., and Møllendal H.2004. green bank telescope detection of new interstellaraldehydes: Propenal and propanal. The Astrophysical Journal610:L21–L24.
Hörz F., Bastien R., Borg J., Bradley J. P., Bridges J. C., BrownleeD. E., Burchell M. J., Chi M., Cintala M. J., Dai Z. R.,Djouadi Z., Dominguez D., Economou T. E., Fairey S. A. J.,Floss C., Franchi I. A., Graham G. A., Green S. F., Heck P.,Hoppe P., Huth J., Ishii H., Kearsley A. T., Kissel J., Leitner J.,Leroux H., Marhas K., Messenger K., Schwandt C. S., See T. H.,Snead C., Stadermann F. J., Stephan I. T., Stroud R., Teslich N.,Trigo-Rodríguez J. M., Tuzzolino A. J., Troadec D., Tsou P.,Warren J., Westphal A., Wozniakiewicz P., Wright I., and ZinnerE. 2006. Impact features on Stardust: Implications for comet 81P/Wild 2 dust. Science 314:1716–1719.
Hudgins D. M. and Sandford S. A. 1998a. Infrared spectroscopyof matrix-isolated polycyclic aromatic hydrocarbons 1.PAHs containing 2 to 4 rings. Journal of Physical Chemistry 102:329–343.
Hudgins D. M. and Sandford S. A. 1998b. Infrared spectroscopy ofmatrix-isolated polycyclic aromatic hydrocarbons 2. PAHscontaining 5 or more rings. Journal of Physical Chemistry 102:344–352.
Hudgins D. M. and Sandford S. A. 1998c. Infrared spectroscopy ofmatrix-isolated polycyclic aromatic hydrocarbons 3. fluorantheneand the benzofluoranthenes. Journal of Physical Chemistry B:353–360.
Irvine W. M., Schloerb F. P., Crovisier J., Fegley B., Jr., and MummaM. J. 2000. Comets: A link between interstellar and nebular chemistry.In Protostars and planets IV, edited by Mannings V., Boss A., andRussell S. Tucson: The University of Arizona Press. pp. 1159–1200.
Joswiak D. J., Matrajt G., Brownlee D. E., Westphal A. J., andSnead C. J. 2007. A roedderite-bearing terminal particle fromStardust Track 56: Comparison with rare peralkaline chondrulesin ordinary chondrites (abstract #1338). 38th Lunar andPlanetary Science Conference. CD-ROM.
Keller and Messenger 2005. The nature and origin of interplanetarydust: High-temperature components. In Chondrites and the
protoplanetary disk, edited by Krot A. N., Scott E. R. D., andReipurth B. ASP Conference Series, vol. 341. pp. 657–667.
Keller L. P., Messenger S., Flynn G. J., Clemett S., Wirick S., andJacobsen C. 2004. The nature of molecular cloud material ininterplanetary dust. Geochimica et Cosmochimica Acta 68:2577–2589.
Keller L. P., Bajt S., Baratta G. A., Borg J., Bradley J. P., BrownleeD. E., Brucato J. R., Burchell M. J., Busemann H., Colangeli L.,D’Hendecourt L., Djouadi Z., Ferrini G., Flynn G., Franchi I. A.,Fries M., Grady M.M., Gilles M. K., Graham A., Grossemy F.,Kearsley A., Matrajt G., Nakamura-Messanger K., Mennella V.,NittlerL. R., Palumbo M. E., Rotundi A., Sandford S.A., SneadC. J., Stadermann F. J., Steele A., Tsou P., Wooden D., andZolensky M. 2006. Organics captured from comet 81P/Wild 2 bythe Stardust spacecraft. Science 314:1728–1731.
Kissel J. and Krueger F. R. 1987. The organic component in dustfrom comet Halley as measured by the PUMA mass spectrometeron board Vega 1. Nature 326:755–760.
Kuan Y., Charnley S. B., Huang H., Tseng W., and Kisiel Z. 2003.Interstellar glycine. The Astrophysical Journal 593:848–867.
Langhoff S. R., Bauschlicher Jr. C. W., Hudgins D. M., SandfordS. A., and Allamandola L. J. 1998. Infrared spectra of substitutedpolycyclic aromatic hydrocarbons. Journal of Physical ChemistryA 102:1632–1646.
Leroux H., Rietmeijer F. J. M., Velbel M. A., Brearley A. J., JacobD., Langenhorst F., Bridges J. C., Zega T. J., Stroud R. M.,Cordier P., Harvey R. P., Lee M., Gounelle M., and ZolenskyM. E. 2008. A TEM study of thermally modified comet 81P/Wild 2 dust particles by interactions with the aerogel matrixduring the Stardust capture process. Meteoritics & PlanetaryScience 43. This issue.
Lisse C. M., Van Cleve J., Adams A. C., A’Hearn M. F., FernándezY. R., Farnham T. L., Armus L., Grillmair C. J., Ingalls J.,Belton M. J. S., Groussin O., McFadden L. A., Meech K. J.,Schultz P. H., Clark B. C., Feaga L. M., Sunshine J. M. 2006.Spitzer spectral observations of the deep impact ejecta. Science313:635.
Matrajt G., Borg J., Raynal P. I., Djouadi Z., D’Hendecourt L., FlynnG., and Deboffle D. 2004. FTIR and Raman analyses of theTagish Lake meteorite: Relationship with the aliphatichydrocarbons observed in the diffuse interstellar medium.Astronomy and Astrophysics 416:983–990.
Matrajt G., Muñoz-Caro G. M., Dartois E., D’Hendecourt L.,Deboffle D., and Borg J. 2005. FTIR analysis of the organics inIDPs: comparison with the IR spectra of the diffuse interstellarmedium. Astronomy and Astrophysics 433:979–995.
Matthews M. J., Pimenta M. A., Dresselhaus G., DresselhausM. S., and Endo M. 1999. Origin of dispersive effects of theRaman D band in carbon materials. Physical Review B 59:R6585–R6588.
McKeegan K. D., Aléon J., Bradley J., Brownlee D., Busemann H.,Butterworth A., Chaussidon M., Fallon S., Floss C., Gilmour J.,Gounelle M., Graham G., Guan Y., Heck P. R., Hoppe P.,Hutcheon I. D., Huth J., Ishii H., Ito M., Jacobsen S. B.,Kearsley A., Leshin L. A., Liu M.-C., Lyon I., Marhas K.,Marty B., Matrajt G., Meibom A., Messenger S., Mostefaoui S.,Mukhopadhyay S., Nakamura-Messenger K., Nittler L.,Palma R., Pepin R. O., Papanastassiou D. A., Robert F.,Schlutter D., Snead C. J., Stadermann F. J., Stroud R., Tsou P.,Westphal A., Young E. D., Ziegler K., Zimmermann L., andZinner E. 2006. Isotopic compositions of cometary matterreturned by Stardust. Science 314:1724–1727.
Mennella V. 2006. Activation energy of CH bond formation incarbon grains irradiated with hydrogen atoms. The AstrophysicalJournal 647:L49–L52.

Analyses of comet 81P/Wild 2 particles collected by Stardust 393
Mennella V., Baratta G. A., Esposito A., Ferrini G., and PendletonY. J. 2003. The effects of ion irradiation on the evolution of thecarrier of the 3.4 micron interstellar absorption band. TheAstrophysical Journal 587:727–738.
Mennella V., Brucato J. R., Colangeli L., and Palumbo P. 2002. CHbond formation in carbon grains by exposure to atomic hydrogen:The evolution of the carrier of the interstellar 3.4 micron band.The Astrophysical Journal 569:531–540.
Mikouchi T., Tachikawa O., Hagiya K., Ohsumi K., Suzuki Y.,Uesugi K., Takeuchi A., and Zolensky M. E. 2007. Mineralogyand crystallography of comet 81P/Wild 2 particles (abstract#1946). 38th Lunar and Planetary Science Conference.CD-ROM.
Muñoz-Caro G. M., Ruiterkamp R., Schutte W. A., Greenberg J. M., andMennella V. 2001. UV photodestruction of CH bonds and theevolution of the 3.4 mm feature carrier. I. The case of aliphatic andaromatic molecular species. Astronomy and Astrophysics 367:347–354.
Muñoz-Caro G. M., Matrajt G., Dartois E., Nuevo M., D’HendecourtL., Deboffle D., Montagnac G., Chauvin N., Boukari C., and Le DuD. 2006. Nature and evolution of the dominant carbonaceousmatter in interplanetary dust particles: Effects of irradiationand identification with a type of amorphous carbon. Astronomyand Astrophysics 459:147–159.
Musumeci P., Calcagno L., Makhtari A., Baeri P., Compagnini G.,and Pirri C. F. 2000. Nuclear Instruments and Methods in PhysicsResearch B 166:404–409.
Negri F., di Donato E., Tommasini M., Castiglioni C., and Zerbi G.2004. Resonance Raman contribution to the D band of carbonmaterials: Modeling defects with quantum chemistry. Journal ofChemical Physics 120:11889–11900.
Nelson R. M., Rayman M. D., and Weaver H. A. 2004. The DeepSpace 1 encounter with comet 19P/Borrelly. Icarus 167:1–3.
Neuhaeuser M., Hilgers H., Joeris P., White R., and Windeln J. 2000.Raman spectroscopy measurements of DC-magnetron sputteredcarbon nitride_a-C:N/thin films for magnetic disk coatings.Diamond and Related Materials 9:1500–1505.
Oró J., Lazcano A., and Ehrenfreud P. 2006. Comets and the originand evolution of life. In Comets and the origin and evolution of life,edited by Thomas P. J., Hicks R. D., Chyba C. F., and McKayC. P. Berlin-Heidelberg: Springer. pp. 1–28.
Palumbo M. E., Ferrini G., and Baratta G. A. 2004. Infrared andRaman spectroscopies of refractory residues left over after ionirradiation of nitrogen-bearing icy mixtures. Advances in SpaceResearch 33:49–56.
Pasteris J. D. and Wopenka B. 1991. Raman spectra of graphite asindicators of degree of metamorphism. Canadian Mineralogist29:1–9.
Pasteris J. D. and Wopenka B. 2004. Necessary, but not sufficient:Raman identification of disordered carbon as a signature ofancient life. Astrobiology 3:727–738.
Pendleton Y. J., Sandford S. A., Allamandola L. J., Tielens A. G. G.M., and Sellgren K. 1994. Near-infrared absorption spectroscopyof interstellar hydrocarbon grains. The Astrophysical Journal437:683–696.
Pendleton Y. J. and Allamandola L. J. 2002. The organic refractorymaterial in the diffuse interstellar medium: Mid-infraredspectroscopic constraints. The Astrophysical Jjournal (Suppl. Ser.)138:75–98.
Quirico E., Raynal P.-I., and Buorot-Denise M. 2003. Metamorphicgrade of organic matter in six unequilibrated ordinary chondrites.Meteoritics & Planetary Science 38:795–811.
Quirico E., Raynal P.-I., Borg J., and D’Hendecourt L. 2005. Amicro-Raman survey of 10 IDPs and 6 carbonaceous chondrites.Planetary and Space Science 53:1443–1448.
Raynal P.-I. 2003. Étude en laboratoire de matière extraterrestre:implications pour la physico-chimie du Système Solaire primitif.Ph.D. Thesis. Université de Paris 6, Paris.
Raynal P. I., Quirico E., Borg J., Deboffle D., Dumas P., D’HendecourtL., Bibring J.-P., and Langevin Y. 2000. Synchrotron infraredmicroscopy of micron-sized extraterrestrial grains. Planetary andSpace Science 48:1329–1339.
Raynal P. I., Quirico E., Borg J., and D’Hendecourt L. 2001. Micro-Raman survey of the carbonaceous matter structure in stratosphericIDPs and carbonaceous chondrites (abstract #1341). 32nd Lunarand Planetary Science Conference. CD-ROM.
Rietmeijer F. J. M. 2002. The earliest chemical dust evolution in thesolar nebula. Chemie der Erde 62:1–45.
Rietmeijer F. J. M., Rotundi A., and Heymann D. 2004. C60 and giantfullerenes in soot condensed in vapors with variable C/H2 ratio.Fullerenes, Nanotubes and Carbon Nanostructures 12:659–680.
Rodgers S. D. and Charnley S. B. 2004. Physical processes andchemical reactions in cometary comae. In Comets II, edited byFestou M., Keller H. U., and Weaver H. A., Tucson, Arizona: TheUniversity of Arizona Press. pp. 505–522.
Rotundi A., Rietmeijer F. J. M., Colangeli L., Mennella V., PalumboP., and Bussoletti E. 1998. Identification of carbon forms in sootmaterials of astrophysical interest. Astronomy and Astrophysics329:1087–1096.
Rotundi A., Ferrini G., Baratta G. A., Palumbo M. E., Palomba E.,and Colangeli L. 2007. Combined micro-infrared and micro-Raman measurements on stratospheric interplanetary dustparticles. In Dust in planetary systems, edited by Krüger H. andGraps A. ESA Publication SP-643. pp. 149–153.
Saladino R., Crestini C., Ciciriello F., Costanzo G., Negri R., andDi Mauro E. 2004. A novel synthesis of biomolecular precursor.In Astrobiology: Future perspectives, edited by Ehrenfreud P.,Irvine W., Owen T., Becker L., Blank J., Brucato J. R., ColangeliL., Derenne S., Dutrey A., Despois D., and Lazcano A.Dordrecht: Kluwer. pp. 393–413.
Saladino R., Crestini C., Neri V., Brucato J. R., Colangeli L.,Ciciriello F., Di Mauro E., and Costanzo G. 2005. Synthesis-degradation of nucleic acids components by formamide andcosmic dust analogues. ChemBioChem 6:1368–1374.
Salisbury J. W., Walter L. S., Vergo N., and D’Aria D. M. 1991.Infrared (2.1–25 μm) spectra of minerals. John Hopkins UniversityPress.
Sandford S. A., Allamandola, L. J., Tielens A. G. G. M., Sellgren K.,Tapia M., and Pendleton Y. 1991. The interstellar C-H stretchingband near 3.4 microns–Constraints on the composition of organicmaterial in the diffuse interstellar medium. The AstrophysicalJournal 371:607–620.
Sandford S. A., Aléon J., Alexander C. M. O’D., Araki T., Bajt S.,Baratta G. A., Borg J., Bradley J. P., Brownlee D. E., BrucatoJ. R., Burchell M. J., Busemann H., Butterworth A., Clemett S. J.,Cody G., Colangeli L., Cooper G., D’Hendecourt L., Djouadi Z.,Dworkin J. P., Ferrini G., Fleckenstein H., Flynn G. J., FranchiI. A., Fries M., Gilles M. K., Glavin D. P., Gounelle M.,Grossemy F., Jacobsen C., Keller L. P., Kilcoyne A. L. D., LeitnerJ., Matrajt G., Meiborn A., Mennelle V., Mostefaoui S., NittlerL.R., Palumbo M. E., Papanastassiou D. A., Robert F., RotundiA., Snead C. J., Spencer M. K., Stadermann F. J., Steele A.,Stephan T., Tsou P., Tyliszczak T., Westphal A. J., Wirick S.,Wopenka B., Yabuta H., Zare R. N., and Zolensky M. E. 2006.Organics captured from comet 81P/Wild 2 by the Stardustspacecraft. Science 314:1720–1724.
Schopf J. W., Kudryavtsev A. B., Agresti D. G., Czaja A. D., andWdowiak T. J. 2005. Raman imagery: A new approach to assessthe geochemical maturity and biogenicity of permineralizedprecambrian fossils. Astrobiology 5:333–371.
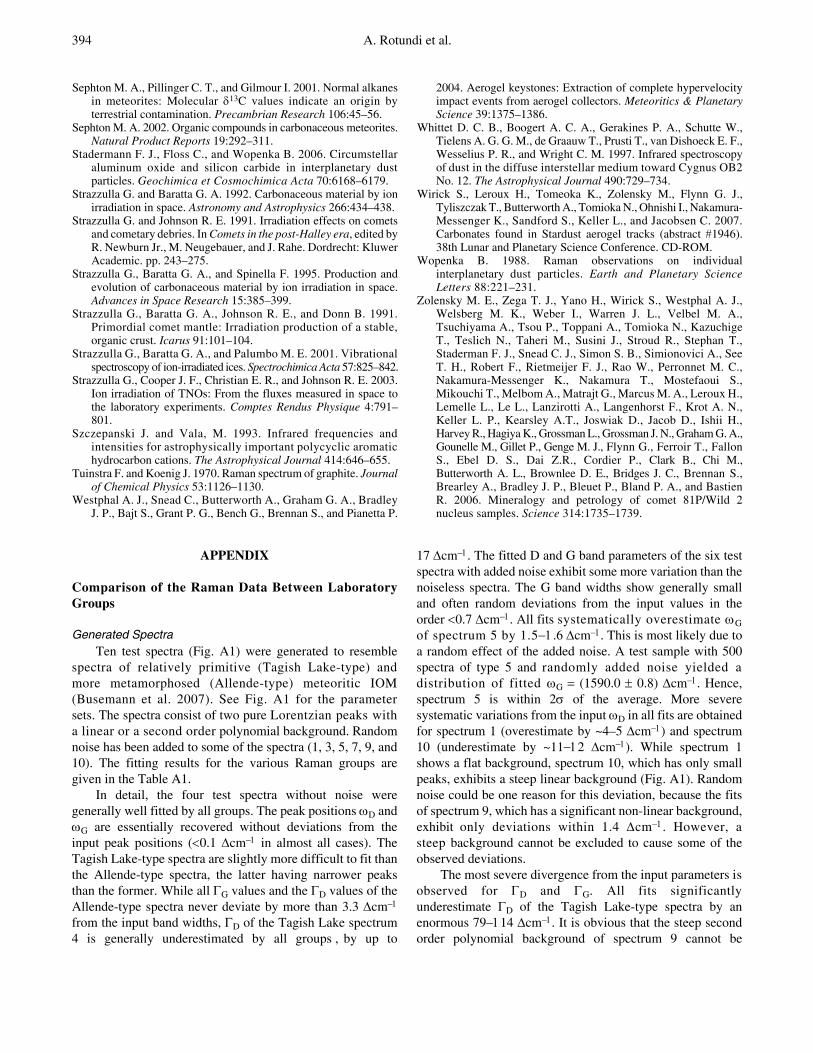
394 A. Rotundi et al.
Sephton M. A., Pillinger C. T., and Gilmour I. 2001. Normal alkanesin meteorites: Molecular δ13C values indicate an origin byterrestrial contamination. Precambrian Research 106:45–56.
Sephton M. A. 2002. Organic compounds in carbonaceous meteorites.Natural Product Reports 19:292–311.
Stadermann F. J., Floss C., and Wopenka B. 2006. Circumstellaraluminum oxide and silicon carbide in interplanetary dustparticles. Geochimica et Cosmochimica Acta 70:6168–6179.
Strazzulla G. and Baratta G. A. 1992. Carbonaceous material by ionirradiation in space. Astronomy and Astrophysics 266:434–438.
Strazzulla G. and Johnson R. E. 1991. Irradiation effects on cometsand cometary debries. In Comets in the post-Halley era, edited byR. Newburn Jr., M. Neugebauer, and J. Rahe. Dordrecht: KluwerAcademic. pp. 243–275.
Strazzulla G., Baratta G. A., and Spinella F. 1995. Production andevolution of carbonaceous material by ion irradiation in space.Advances in Space Research 15:385–399.
Strazzulla G., Baratta G. A., Johnson R. E., and Donn B. 1991.Primordial comet mantle: Irradiation production of a stable,organic crust. Icarus 91:101–104.
Strazzulla G., Baratta G. A., and Palumbo M. E. 2001. Vibrationalspectroscopy of ion-irradiated ices. Spectrochimica Acta 57:825–842.
Strazzulla G., Cooper J. F., Christian E. R., and Johnson R. E. 2003.Ion irradiation of TNOs: From the fluxes measured in space tothe laboratory experiments. Comptes Rendus Physique 4:791–801.
Szczepanski J. and Vala, M. 1993. Infrared frequencies andintensities for astrophysically important polycyclic aromatichydrocarbon cations. The Astrophysical Journal 414:646–655.
Tuinstra F. and Koenig J. 1970. Raman spectrum of graphite. Journalof Chemical Physics 53:1126–1130.
Westphal A. J., Snead C., Butterworth A., Graham G. A., BradleyJ. P., Bajt S., Grant P. G., Bench G., Brennan S., and Pianetta P.
2004. Aerogel keystones: Extraction of complete hypervelocityimpact events from aerogel collectors. Meteoritics & PlanetaryScience 39:1375–1386.
Whittet D. C. B., Boogert A. C. A., Gerakines P. A., Schutte W.,Tielens A. G. G. M., de Graauw T., Prusti T., van Dishoeck E. F.,Wesselius P. R., and Wright C. M. 1997. Infrared spectroscopyof dust in the diffuse interstellar medium toward Cygnus OB2No. 12. The Astrophysical Journal 490:729–734.
Wirick S., Leroux H., Tomeoka K., Zolensky M., Flynn G. J.,Tyliszczak T., Butterworth A., Tomioka N., Ohnishi I., Nakamura-Messenger K., Sandford S., Keller L., and Jacobsen C. 2007.Carbonates found in Stardust aerogel tracks (abstract #1946).38th Lunar and Planetary Science Conference. CD-ROM.
Wopenka B. 1988. Raman observations on individualinterplanetary dust particles. Earth and Planetary ScienceLetters 88:221–231.
Zolensky M. E., Zega T. J., Yano H., Wirick S., Westphal A. J.,Welsberg M. K., Weber I., Warren J. L., Velbel M. A.,Tsuchiyama A., Tsou P., Toppani A., Tomioka N., KazuchigeT., Teslich N., Taheri M., Susini J., Stroud R., Stephan T.,Staderman F. J., Snead C. J., Simon S. B., Simionovici A., SeeT. H., Robert F., Rietmeijer F. J., Rao W., Perronnet M. C.,Nakamura-Messenger K., Nakamura T., Mostefaoui S.,Mikouchi T., Melbom A., Matrajt G., Marcus M. A., Leroux H.,Lemelle L., Le L., Lanzirotti A., Langenhorst F., Krot A. N.,Keller L. P., Kearsley A.T., Joswiak D., Jacob D., Ishii H.,Harvey R., Hagiya K., Grossman L., Grossman J. N., Graham G. A.,Gounelle M., Gillet P., Genge M. J., Flynn G., Ferroir T., FallonS., Ebel D. S., Dai Z.R., Cordier P., Clark B., Chi M.,Butterworth A. L., Brownlee D. E., Bridges J. C., Brennan S.,Brearley A., Bradley J. P., Bleuet P., Bland P. A., and BastienR. 2006. Mineralogy and petrology of comet 81P/Wild 2nucleus samples. Science 314:1735–1739.
APPENDIX
Comparison of the Raman Data Between LaboratoryGroups
Generated SpectraTen test spectra (Fig. A1) were generated to resemble
spectra of relatively primitive (Tagish Lake-type) andmore metamorphosed (Allende-type) meteoritic IOM(Busemann et al. 2007). See Fig. A1 for the parametersets. The spectra consist of two pure Lorentzian peaks witha linear or a second order polynomial background. Randomnoise has been added to some of the spectra (1, 3, 5, 7, 9, and10). The fitting results for the various Raman groups aregiven in the Table A1.
In detail, the four test spectra without noise weregenerally well fitted by all groups. The peak positions ωD andωG are essentially recovered without deviations from theinput peak positions (<0.1 Δcm−1 in almost all cases). TheTagish Lake-type spectra are slightly more difficult to fit thanthe Allende-type spectra, the latter having narrower peaksthan the former. While all ΓG values and the ΓD values of theAllende-type spectra never deviate by more than 3.3 Δcm−1
from the input band widths, ΓD of the Tagish Lake spectrum4 is generally underestimated by all groups , by up to
17 Δcm−1. The fitted D and G band parameters of the six testspectra with added noise exhibit some more variation than thenoiseless spectra. The G band widths show generally smalland often random deviations from the input values in theorder <0.7 Δcm−1. All fits systematically overestimate ωGof spectrum 5 by 1.5−1.6 Δcm−1. This is most likely due toa random effect of the added noise. A test sample with 500spectra of type 5 and randomly added noise yielded adistribution of fitted ωG = (1590.0 ± 0.8) Δcm−1. Hence,spectrum 5 is within 2σ of the average. More severesystematic variations from the input ωD in all fits are obtainedfor spectrum 1 (overestimate by ~4–5 Δcm−1) and spectrum10 (underestimate by ~11−12 Δcm−1). While spectrum 1shows a flat background, spectrum 10, which has only smallpeaks, exhibits a steep linear background (Fig. A1). Randomnoise could be one reason for this deviation, because the fitsof spectrum 9, which has a significant non-linear background,exhibit only deviations within 1.4 Δcm−1. However, asteep background cannot be excluded to cause some of theobserved deviations.
The most severe divergence from the input parameters isobserved for ΓD and ΓG. All fits significantlyunderestimate ΓD of the Tagish Lake-type spectra by anenormous 79−114 Δcm−1. It is obvious that the steep secondorder polynomial background of spectrum 9 cannot be
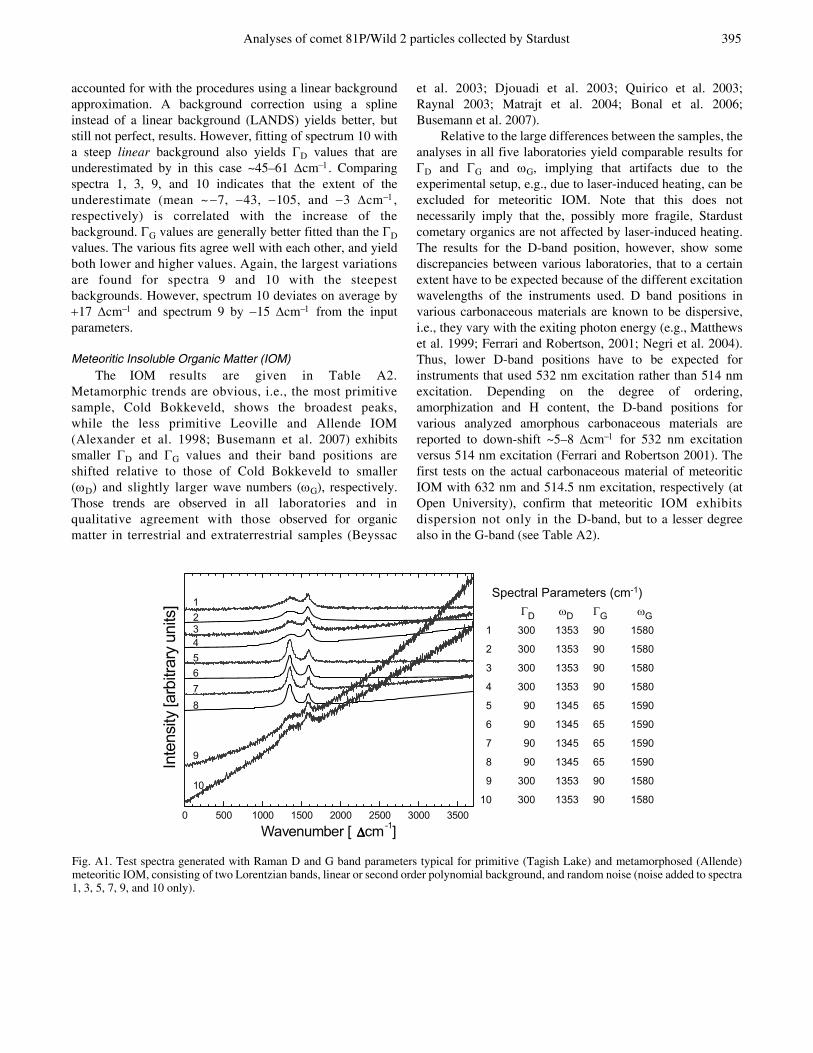
Analyses of comet 81P/Wild 2 particles collected by Stardust 395
accounted for with the procedures using a linear backgroundapproximation. A background correction using a splineinstead of a linear background (LANDS) yields better, butstill not perfect, results. However, fitting of spectrum 10 witha steep linear background also yields ΓD values that areunderestimated by in this case ~45–61 Δcm−1. Comparingspectra 1, 3, 9, and 10 indicates that the extent of theunderestimate (mean ~ −7, −43, −105, and −3 Δcm−1,respectively) is correlated with the increase of thebackground. ΓG values are generally better fitted than the ΓDvalues. The various fits agree well with each other, and yieldboth lower and higher values. Again, the largest variationsare found for spectra 9 and 10 with the steepestbackgrounds. However, spectrum 10 deviates on average by+17 Δcm−1 and spectrum 9 by −15 Δcm−1 from the inputparameters.
Meteoritic Insoluble Organic Matter (IOM) The IOM results are given in Table A2.
Metamorphic trends are obvious, i.e., the most primitivesample, Cold Bokkeveld, shows the broadest peaks,while the less primitive Leoville and Allende IOM(Alexander et al. 1998; Busemann et al. 2007) exhibitssmaller ΓD and ΓG values and their band positions areshifted relative to those of Cold Bokkeveld to smaller(ωD) and slightly larger wave numbers (ωG), respectively.Those trends are observed in all laboratories and inqualitative agreement with those observed for organicmatter in terrestrial and extraterrestrial samples (Beyssac
et al. 2003; Djouadi et al. 2003; Quirico et al. 2003;Raynal 2003; Matrajt et al. 2004; Bonal et al. 2006;Busemann et al. 2007).
Relative to the large differences between the samples, theanalyses in all five laboratories yield comparable results forΓD and ΓG and ωG, implying that artifacts due to theexperimental setup, e.g., due to laser-induced heating, can beexcluded for meteoritic IOM. Note that this does notnecessarily imply that the, possibly more fragile, Stardustcometary organics are not affected by laser-induced heating.The results for the D-band position, however, show somediscrepancies between various laboratories, that to a certainextent have to be expected because of the different excitationwavelengths of the instruments used. D band positions invarious carbonaceous materials are known to be dispersive,i.e., they vary with the exiting photon energy (e.g., Matthewset al. 1999; Ferrari and Robertson, 2001; Negri et al. 2004).Thus, lower D-band positions have to be expected forinstruments that used 532 nm excitation rather than 514 nmexcitation. Depending on the degree of ordering,amorphization and H content, the D-band positions forvarious analyzed amorphous carbonaceous materials arereported to down-shift ~5–8 Δcm−1 for 532 nm excitationversus 514 nm excitation (Ferrari and Robertson 2001). Thefirst tests on the actual carbonaceous material of meteoriticIOM with 632 nm and 514.5 nm excitation, respectively (atOpen University), confirm that meteoritic IOM exhibitsdispersion not only in the D-band, but to a lesser degreealso in the G-band (see Table A2).
Fig. A1. Test spectra generated with Raman D and G band parameters typical for primitive (Tagish Lake) and metamorphosed (Allende)meteoritic IOM, consisting of two Lorentzian bands, linear or second order polynomial background, and random noise (noise added to spectra1, 3, 5, 7, 9, and 10 only).
0 500 1000 1500 2000 2500 3000 3500
Inte
nsity
[arb
itrar
y un
its]
10
9
876
4
23
5
1
Wavenumber [ ΔΔΔΔcm-1]
Spectral Parameters (cm-1) ΓD ωD ΓG ωG 1 300 1353 90 1580
2 300 1353 90 1580
3 300 1353 90 1580
4 300 1353 90 1580
5 90 1345 65 1590
6 90 1345 65 1590
7 90 1345 65 1590
8 90 1345 65 1590
9 300 1353 90 1580
10 300 1353 90 1580
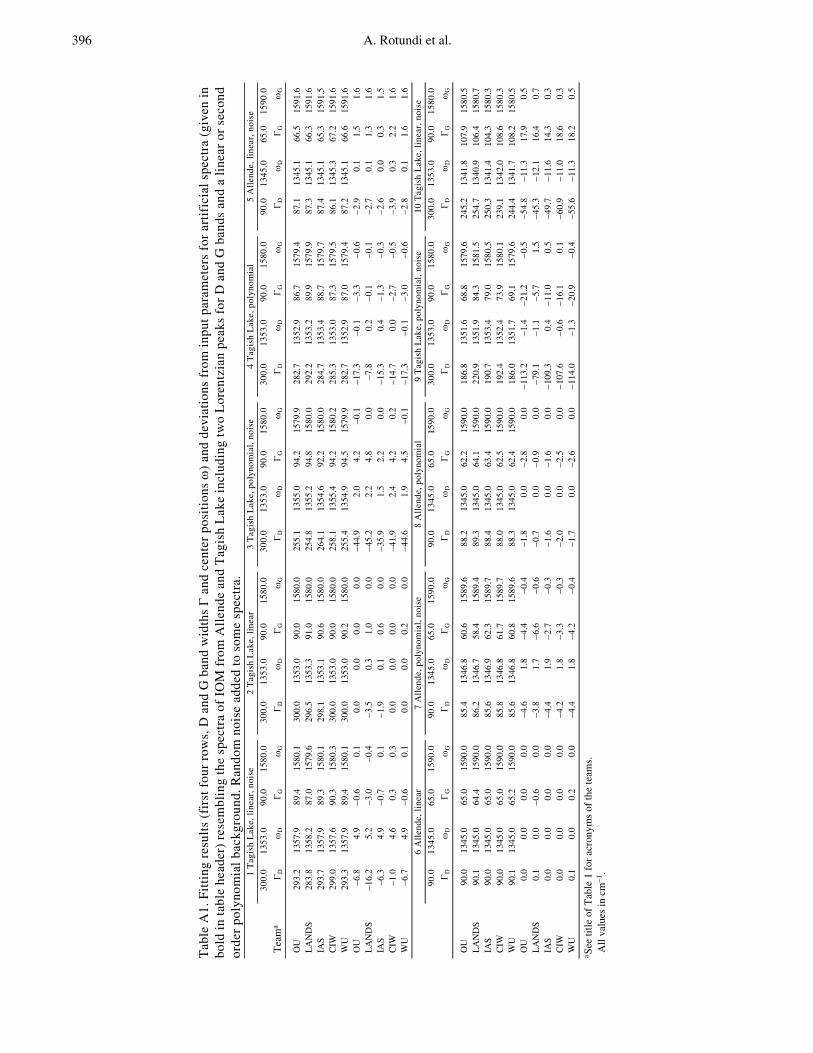
396 A. Rotundi et al.
Tab
le A
1. F
itti
ng r
esul
ts (
firs
t fou
r ro
ws,
D a
nd G
ban
d w
idth
s Γ
and
cent
er p
osit
ions
ω)
and
devi
atio
ns f
rom
inpu
t par
amet
ers
for
arti
fici
al s
pect
ra (
give
n in
bo
ld in
tabl
e he
ader
) re
sem
blin
g th
e sp
ectr
a of
IO
M f
rom
All
ende
and
Tag
ish
Lak
e in
clud
ing
two
Lor
entz
ian
peak
s fo
r D
and
G b
ands
and
a li
near
or
seco
nd
orde
r po
lyno
mia
l bac
kgro
und.
Ran
dom
noi
se a
dded
to s
ome
spec
tra.
1 T
agis
h L
ake,
line
ar, n
oise
2 T
agis
h L
ake,
line
ar3
Tag
ish
Lak
e, p
olyn
omia
l, no
ise
4 T
agis
h L
ake,
pol
ynom
ial
5 A
llen
de, l
inea
r, n
oise
300.
013
53.0
90.0
1580
.030
0.0
1353
.090
.015
80.0
300.
013
53.0
90.0
1580
.030
0.0
1353
.090
.015
80.0
90.0
1345
.065
.015
90.0
Tea
ma
ΓD
ωD
ΓG
ωG
ΓD
ωD
ΓG
ωG
ΓD
ωD
ΓG
ωG
ΓD
ωD
ΓG
ωG
ΓD
ωD
ΓG
ωG
OU
293.
213
57.9
89.4
1580
.130
0.0
1353
.090
.015
80.0
255.
113
55.0
94.2
1579
.928
2.7
1352
.986
.715
79.4
87.1
1345
.166
.515
91.6
LA
ND
S28
3.8
1358
.287
.015
79.6
296.
513
53.3
91.0
1580
.025
4.8
1355
.294
.815
80.0
292.
213
53.2
89.9
1579
.987
.313
45.1
66.3
1591
.6IA
S29
3.7
1357
.989
.315
80.1
298.
113
53.1
90.6
1580
.026
4.1
1354
.692
.215
80.0
284.
713
53.4
88.7
1579
.787
.413
45.1
65.3
1591
.5C
IW29
9.0
1357
.690
.315
80.3
300.
013
53.0
90.0
1580
.025
8.1
1355
.494
.215
80.2
285.
313
53.0
87.3
1579
.586
.113
45.3
67.2
1591
.6W
U29
3.3
1357
.989
.415
80.1
300.
013
53.0
90.2
1580
.025
5.4
1354
.994
.515
79.9
282.
713
52.9
87.0
1579
.487
.213
45.1
66.6
1591
.6O
U−6
.84.
9−0
.60.
10.
00.
00.
00.
0−4
4.9
2.0
4.2
−0.1
−17.
3−0
.1−3
.3−0
.6−2
.90.
11.
51.
6L
AN
DS
−16.
25.
2−3
.0−0
.4−3
.50.
31.
00.
0−4
5.2
2.2
4.8
0.0
−7.8
0.2
−0.1
−0.1
−2.7
0.1
1.3
1.6
IAS
−6.3
4.9
−0.7
0.1
−1.9
0.1
0.6
0.0
−35.
91.
52.
20.
0−1
5.3
0.4
−1.3
−0.3
−2.6
0.0
0.3
1.5
CIW
−1.0
4.6
0.3
0.3
0.0
0.0
0.0
0.0
−41.
92.
44.
20.
2−1
4.7
0.0
−2.7
−0.5
−3.9
0.3
2.2
1.6
WU
−6.7
4.9
−0.6
0.1
0.0
0.0
0.2
0.0
−44.
61.
94.
5−0
.1−1
7.3
−0.1
−3.0
−0.6
−2.8
0.1
1.6
1.6
6 A
llen
de, l
inea
r7
All
ende
, pol
ynom
ial,
nois
e8
All
ende
, pol
ynom
ial
9 T
agis
h L
ake,
pol
ynom
ial,
nois
e10
Tag
ish
Lak
e, li
near
, noi
se90
.013
45.0
65.0
1590
.090
.013
45.0
65.0
1590
.090
.013
45.0
65.0
1590
.030
0.0
1353
.090
.015
80.0
300.
013
53.0
90.0
1580
.0Γ
Dω
DΓ
Gω
GΓ
Dω
DΓ
Gω
GΓ
Dω
DΓ
Gω
GΓ
Dω
DΓ
Gω
GΓ
Dω
DΓ
Gω
G
OU
90.0
1345
.065
.015
90.0
85.4
1346
.860
.615
89.6
88.2
1345
.062
.215
90.0
186.
813
51.6
68.8
1579
.624
5.2
1341
.810
7.9
1580
.5L
AN
DS
90.1
1345
.064
.415
90.0
86.2
1346
.758
.415
89.4
89.3
1345
.064
.115
90.0
220.
913
51.9
84.3
1581
.525
4.7
1340
.910
6.4
1580
.7IA
S90
.013
45.0
65.0
1590
.085
.613
46.9
62.3
1589
.788
.413
45.0
63.4
1590
.019
0.7
1353
.479
.015
80.5
250.
313
41.4
104.
315
80.3
CIW
90.0
1345
.065
.015
90.0
85.8
1346
.861
.715
89.7
88.0
1345
.062
.515
90.0
192.
413
52.4
73.9
1580
.123
9.1
1342
.010
8.6
1580
.3W
U90
.113
45.0
65.2
1590
.085
.613
46.8
60.8
1589
.688
.313
45.0
62.4
1590
.018
6.0
1351
.769
.115
79.6
244.
413
41.7
108.
215
80.5
OU
0.0
0.0
0.0
0.0
−4.6
1.8
−4.4
−0.4
−1.8
0.0
−2.8
0.0
−113
.2−1
.4−2
1.2
−0.5
−54.
8−1
1.3
17.9
0.5
LA
ND
S0.
10.
0−0
.60.
0−3
.81.
7−6
.6−0
.6−0
.70.
0−0
.90.
0−7
9.1
−1.1
−5.7
1.5
−45.
3−1
2.1
16.4
0.7
IAS
0.0
0.0
0.0
0.0
−4.4
1.9
−2.7
−0.3
−1.6
0.0
−1.6
0.0
−109
.30.
4−1
1.0
0.5
−49.
7−1
1.6
14.3
0.3
CIW
0.0
0.0
0.0
0.0
−4.2
1.8
−3.3
−0.3
−2.0
0.0
−2.5
0.0
−107
.6−0
.6−1
6.1
0.1
−60.
9−1
1.0
18.6
0.3
WU
0.1
0.0
0.2
0.0
−4.4
1.8
−4.2
−0.4
−1.7
0.0
−2.6
0.0
−114
.0−1
.3−2
0.9
−0.4
−55.
6−1
1.3
18.2
0.5
a See
title
of
Tab
le 1
for
acr
onym
s of
the
team
s.A
ll va
lues
in c
m−1
.
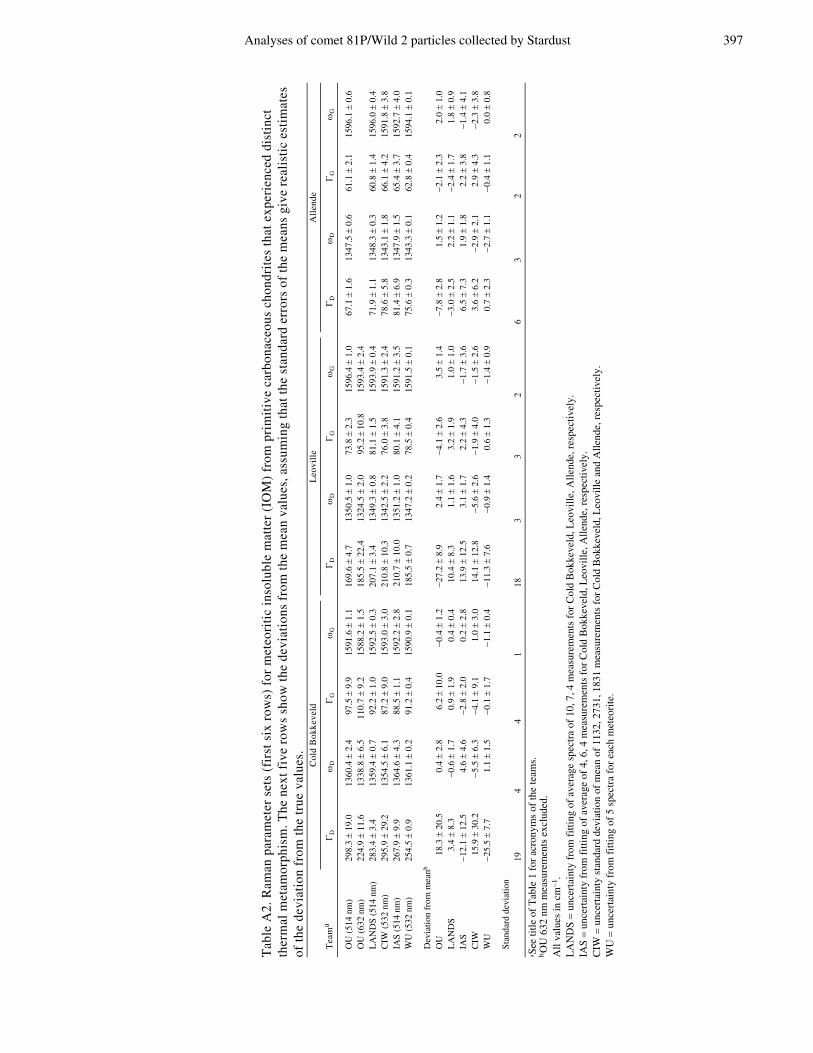
Analyses of comet 81P/Wild 2 particles collected by Stardust 397
Tab
le A
2. R
aman
par
amet
er s
ets
(fir
st s
ix r
ows)
for
met
eori
tic
inso
lubl
e m
atte
r (I
OM
) fr
om p
rim
itiv
e ca
rbon
aceo
us c
hond
rite
s th
at e
xper
ienc
ed d
isti
nct
ther
mal
met
amor
phis
m. T
he n
ext f
ive
row
s sh
ow th
e de
viat
ions
fro
m th
e m
ean
valu
es, a
ssum
ing
that
the
stan
dard
err
ors
of th
e m
eans
giv
e re
alis
tic
esti
mat
es
of th
e de
viat
ion
from
the
true
val
ues.
Col
d B
okke
veld
Leo
vill
eA
llen
de
Tea
ma
ΓD
ωD
ΓG
ωG
ΓD
ωD
ΓG
ωG
ΓD
ωD
ΓG
ωG
OU
(51
4 nm
) 29
8.3
± 19
.013
60.4
± 2
.497
.5 ±
9.9
1591
.6 ±
1.1
169.
6 ±
4.7
1350
.5 ±
1.0
73.8
± 2
.315
96.4
± 1
.067
.1 ±
1.6
1347
.5 ±
0.6
61.1
± 2
.115
96.1
± 0
.6O
U (
632
nm)
224.
9 ±
11.6
1338
.8 ±
6.5
110.
7 ±
9.2
1588
.2 ±
1.5
185.
5 ±
22.4
1324
.5 ±
2.0
95.2
± 1
0.8
1593
.4 ±
2.4
LA
ND
S (5
14 n
m)
283.
4 ±
3.4
1359
.4 ±
0.7
92.2
± 1
.015
92.5
± 0
.320
7.1
± 3.
413
49.3
± 0
.881
.1 ±
1.5
1593
.9 ±
0.4
71.9
± 1
.113
48.3
± 0
.360
.8 ±
1.4
1596
.0 ±
0.4
CIW
(53
2 nm
)29
5.9
± 29
.213
54.5
± 6
.187
.2 ±
9.0
1593
.0 ±
3.0
210.
8 ±
10.3
1342
.5 ±
2.2
76.0
± 3
.815
91.3
± 2
.478
.6 ±
5.8
1343
.1 ±
1.8
66.1
± 4
.215
91.8
± 3
.8IA
S (5
14 n
m)
267.
9 ±
9.9
1364
.6 ±
4.3
88.5
± 1
.115
92.2
± 2
.821
0.7
± 10
.013
51.2
± 1
.080
.1 ±
4.1
1591
.2 ±
3.5
81.4
± 6
.913
47.9
± 1
.565
.4 ±
3.7
1592
.7 ±
4.0
WU
(53
2 nm
)25
4.5
± 0.
913
61.1
± 0
.291
.2 ±
0.4
1590
.9 ±
0.1
185.
5 ±
0.7
1347
.2 ±
0.2
78.5
± 0
.415
91.5
± 0
.175
.6 ±
0.3
1343
.3 ±
0.1
62.8
± 0
.415
94.1
± 0
.1
Dev
iatio
n fr
om m
eanb
OU
18.3
± 2
0.5
0.4
± 2.
86.
2 ±
10.0
−0.4
± 1
.2−2
7.2
± 8.
92.
4 ±
1.7
−4.1
± 2
.63.
5 ±
1.4
−7.8
± 2
.81.
5 ±
1.2
−2.1
± 2
.32.
0 ±
1.0
LA
ND
S3.
4 ±
8.3
−0.6
± 1
.70.
9 ±
1.9
0.4
± 0.
410
.4 ±
8.3
1.1
± 1.
63.
2 ±
1.9
1.0
± 1.
0−3
.0 ±
2.5
2.2
± 1.
1−2
.4 ±
1.7
1.8
± 0.
9IA
S−1
2.1
± 12
.54.
6 ±
4.6
−2.8
± 2
.00.
2 ±
2.8
13.9
± 1
2.5
3.1
± 1.
72.
2 ±
4.3
−1.7
± 3
.66.
5 ±
7.3
1.9
± 1.
82.
2 ±
3.8
−1.4
± 4
.1C
IW15
.9 ±
30.
2−5
.5 ±
6.3
−4.1
± 9
.11.
0 ±
3.0
14.1
± 1
2.8
−5.6
± 2
.6−1
.9 ±
4.0
−1.5
± 2
.63.
6 ±
6.2
−2.9
± 2
.12.
9 ±
4.3
−2.3
± 3
.8W
U−2
5.5
± 7.
71.
1 ±
1.5
−0.1
± 1
.7−1
.1 ±
0.4
−11.
3 ±
7.6
−0.9
± 1
.40.
6 ±
1.3
−1.4
± 0
.90.
7 ±
2.3
−2.7
± 1
.1−0
.4 ±
1.1
0.0
± 0.
8
Stan
dard
dev
iatio
n19
44
118
33
26
32
2a S
ee ti
tle o
f T
able
1 f
or a
cron
yms
of th
e te
ams.
bO
U 6
32 n
m m
easu
rem
ents
exc
lude
d.A
ll va
lues
in c
m−1
.L
AN
DS
= un
cert
aint
y fr
om f
ittin
g of
ave
rage
spe
ctra
of
10, 7
, 4 m
easu
rem
ents
for
Col
d B
okke
veld
, Leo
ville
, Alle
nde,
res
pect
ivel
y.IA
S =
unce
rtai
nty
from
fitt
ing
of a
vera
ge o
f 4,
6, 4
mea
sure
men
ts f
or C
old
Bok
keve
ld, L
eovi
lle, A
llend
e, r
espe
ctiv
ely.
CIW
= u
ncer
tain
ty s
tand
ard
devi
atio
n of
mea
n of
113
2, 2
731,
183
1 m
easu
rem
ents
for
Col
d B
okke
veld
, Leo
ville
and
Alle
nde,
res
pect
ivel
y.W
U =
unc
erta
inty
fro
m f
ittin
g of
5 s
pect
ra f
or e
ach
met
eori
te.