A Review of Business Models for Shared Mobility and Mobility ...
Upload
independentCategory
view
1download
0
COMBINED MICROBIAL SURFACTANT-POLYMER SYSTEM FOR IMPROVED OIL MOBILITY AND CONFORMANCE CONTROL
FINAL PROGRESS REPORT
PERIOD: SET. 2001-AUG. 2005
CONTRACT NUMBER: DE-FG26-01NT41357
PROJECT START DATE: September 2001
PROJECT DURATION: September 2001 - August 2005
TOTAL FUNDING REQUESTED: $ 199,320
FIRST YEAR REQUEST: $88,900
TECHNICAL POINTS OF CONTACT: Jorge Gabitto Maria Barrufet Prairie View A&M State University Texas A&M University Department of Chemical Engineering Petroleum Engineering Department Prairie View, TX 77429 College Station TX, 77204 TELE:(936) 857-2427 TELE:(979) 845-0314 FAX: (936) 857-4540 FAX:(979) 845-0325 EMAIL:[email protected] EMAIL:barrufet@spindletop.
tamu.edu
2
COMBINED MICROBIAL SURFACTANT-POLYMER SYSTEM FOR IMPROVED OIL MOBILITY AND CONFORMANCE CONTROL
DISCLAIMER
This report was prepared as an account of work sponsored by an agency of the United States Government. Neither the United States Government nor any agency thereof, nor any of their employees, makes any warranty, express or implied, or assumes any legal liability or responsibility for the accuracy, completeness, or usefulness of any information, apparatus, product, or process disclosed, or represents that its use would not infringe privately owned rights. Reference herein to any specific commercial product, process, or service by trade name, trademark, manufacturer, or otherwise does not necessarily constitute or imply its endorsement, recommendation, or favoring by the United States Government or any agency thereof. The views and opinions of authors expressed herein do not necessarily state of reflect those of the United States Government or any agency thereof.

3
COMBINED MICROBIAL SURFACTANT-POLYMER SYSTEM FOR
IMPROVED OIL MOBILITY AND CONFORMANCE CONTROL
ABSTRACT
Many domestic oil fields are facing abandonment even though they still contain two-thirds of their original oil. A significant number of these fields can yield additional oil using advanced oil recovery (AOR) technologies. To maintain domestic oil production at current levels, AOR technologies are needed that are affordable and can be implemented by the independent oil producers of the future.
Microbial enhanced oil recovery (MEOR) technologies have become established as cost-effective solutions for declining oil production. MEOR technologies are affordable for independent producers operating stripper wells and can be used to extend the life of marginal fields. The demonstrated versatility of microorganisms can be used to design advanced microbial systems to treat multiple production problems in complex, heterogeneous reservoirs.
The proposed research presents the concept of a combined microbial surfactant-polymer system for advanced oil recovery. The surfactant-polymer system utilizes bacteria that are capable of both biosurfactant production and metabolically-controlled biopolymer production. This novel technology combines complementary mechanisms to extend the life of marginal fields and is applicable to a large number of domestic reservoirs. The research project described in this report was performed by Bio-Engineering Inc., a woman owned small business, Texas A&M University and Prairie View A&M University, a Historically Black College and University.
This report describes the results of our laboratory work to grow microbial cultures, the work done on recovery experiments on core rocks, and computer simulations. We have selected two bacterial strains capable of producing both surfactant and polymers. We have conducted laboratory experiments to determine under what conditions surfactants and polymers can be produced from one single strain. We have conduct recovery experiments to determine the performance of these strains under different conditions. Our results show a significant influence of nutrient regime on alternate production of surfactants or polymers for a Bacillus licheniformis strain, NIPER 1A.
The main conclusion of this work is that NIPER 1A can produce both surfactant and polymer by nutrient regime manipulation. Our experiments proved that this property leads to improved oil recovery by increasing alternatively, oil mobility and conformance control.

4
COMBINED MICROBIAL SURFACTANT-POLYMER SYSTEM FOR
IMPROVED OIL MOBILITY AND CONFORMANCE CONTROL
TABLE OF CONTENTS
DISCLAIMER 2
ABSTRACT 3
TABLE OF CONTENTS 4
STATEMENT OF WORK 6
TECHNICAL DESCRIPTION 7
INTRODUCTION 7
Enhanced Oil Recovery (MEOR) 7
Biosurfactants 10
Biopolymers 12
Goals 13
EXPERIMENTAL SECTION 14
Growth Experiments 14
Introduction 14
Bacterial Strains 15
Measuring Techniques 17
Colony Counting Procedures 17
Surface Tension Measurements 18
Viscosity Measurements 19
Chemical Analysis 19
Porous Media Tests 20
SIMULATION SECTION 22
Simulator Background 22
Mass Conservation Equations 23
Pressure Conservation Equations 24
Fluid and Soil Properties 24
Polymer Adsorption 25

5
Viscosity 25
Microbial Enhanced Oil Recovery Model 26
Surfactant/Brine/Oil Phase Behavior 27
TASK DESCRIPTION 28
Task 1 – Characterization of Surfactant and Polymer-Producing
Bacteria 28
Subtask 1.1 - General Bacterial Physiology 28
Subtask 1.2 - Surfactant Production 30
Subtask 1.3 - Polymer Production 32
Task 2 -Evaluation of Nutrient Regimes 33
Subtask 2.1 - Polymer Stimulation 33
Task 3 -Testing of Microbial Systems in Porous Media 36
Subtask 3.1 - Microbial Transport 36
Subtask 3.2 - Improved Oil Mobility 38
Subtask 3.3 - Improved Sweep Efficiency 41
Task 4 -Process Simulation 43
Subtask 4.1 - UTCHEM Simulator 43
CONCLUSIONS 46
REFERENCES 48
TABLES AND FIGURES 53
PROJECT INFORMATION 67
PUBLICATIONS AND PRESENTATIONS 67
STUDENTS 67

6
STATEMENT OF WORK (SOW)
Under this Statement of Work (SOW), Dr. Jorge Gabitto from the Chemical
Engineering Department at Prairie View A&M University (PVAMU), Dr. Maria Barrufet
from the Petroleum Engineering Department at Texas A&M University (TAMU) and Dr.
Rebecca Bryant from Bio-Engineering International Inc. (BEI) conducted research and
training in the area of microbial improved oil recovery techniques.
A research project was proposed to develop and prove the concept of a combined
surfactant-polymer microbial system for advanced oil recovery. The surfactant-polymer
system utilizes bacteria that are capable of both biosurfactant production and
metabolically-controlled biopolymer production. This novel technology combines
complementary mechanisms to extend the life of marginal fields and is applicable to a
large number of domestic reservoirs.
This research involved training of graduate and undergraduate students in state of the
art techniques. Technology transfer of the results generated by the project is achieved
through Dr. Bryant’s efforts, presentations on scientific/professional meetings, and
publications in refereed journals.
Dr. Gabitto acted as coordinator of the research team, conducted numerical
simulations using commercial software, and he was responsible for part of the
experimental program. Dr. Barrufet, Co-Principal Investigator, was responsible for part
of the experimental part. Dr. Bryant provided the microorganisms to be used in thee
project, advised the research team, and was responsible for transferring the project’s
findings to small independent producers.
7
TECHNICAL DESCRIPTION
INTRODUCTION
This report has been organized in a way that tries to maximize the amount of
information while minimizing the length. It starts with a brief introduction and a
statement of goals. An experimental part that tries to describe in a general way the
techniques used throughout the project follows. Technical introduction and explanations
of procedures are included in this section. A description about the commercial program
(UTCHEM) used for simulation calculations is also attached. All the project results are
listed in a section that describes the different specific tasks that comprise the project.
Specific details related to experimental work are also included in the tasks description.
The technical part concludes summarizing the project’s main findings and conclusions.
A list of publications/presentations related to the project is attached in a separate
section. A brief description of the students participating in the project and their
respective tasks is also included.
Enhanced Oil Recovery (MEOR)
The most common EOR methods are the chemical and the physical methods1.
Chemical methods of enhanced oil recovery are characterized by the addition of
chemicals to water in order to generate fluid properties or interfacial conditions that are
more favorable for oil displacement. Polymer flooding, using polyacrylamides or
polysaccharides, is conceptually simple and inexpensive, and its commercial use is
increasing despite the fact that it raises potential production by only small increments.
Surfactant flooding is complex, requiring detailed laboratory testing to support field
projects. It is also expensive and is only used in few large-scale projects. .
Microbial Enhanced Oil Recovery (MEOR) is an EOR method that uses
microorganisms and their metabolic products to improve oil production in the reservoir.
The majority of the MEOR work leading to field trials has been completed in about the
last 15 years. The technology has advanced from a laboratory-based evaluation of
microbial processes, to field applications internationally. MEOR has been recognized as

8
a potentially cost-effective method, particularly for stripper wells (well that produces less
than 10 bbl/day) 2.
The concept of using microorganisms and their activities in an enhanced oil recovery
procedure is not new. The first suggestion for using MEOR was made as early as in
1926, when Beckman reported the action of bacteria on mineral oil 3. As a result of his
work, he proposed that bacterial enzymes could be used in oil recovery. However, little
work was done until ZoBell started a series of systematic laboratory investigations in the
1940’s in connection with the American Petroleum Institute 4-6. The results and ideas
presented in ZoBell’s articles marked the beginning of a new era of research in petroleum
microbiology. Much more experimental work will have to be done by trained
microbiologists in cooperation with petroleum engineers before any definite
recommendations can be made.
A number of field trials were initiated during 1980’s and 1990’s. The conventional
method used was to inject an adapted mixture of bacteria into the reservoir together with
a cheap carbon source such as molasses. This process is limited to small onshore
installation due to the amount of molasses needed. In later years considerable work has
been done in analyzing the potential for doing MEOR on larger offshore fields7.
In this study we concentrated on microbial enhanced waterflooding. MEOR is
applied to existing waterfloods to improve their performance and enhance oil production
by treating the entire reservoir. MEOR materials are added, either continuously or
periodically, to the water holding tanks at the primary injection stations. Normal
waterflooding operations are not interrupted when the MEOR process is initiated in a
field.
In conventional MEOR methods a special culture of microorganisms is injected into
the reservoir. This bacterial culture is selected for each individual reservoir and it could
be injected as a pure culture, a mixed culture or an adapted culture. During the process, a
complete growth medium containing all major nutrients necessary for microbial growth
including carbon, nitrogen, and phosphorus, is injected into the reservoir to feed the
injected microorganisms. The microorganisms replicate and produce chemicals for oil
mobilization based entirely on the cost of nutrients. Bryant et al.8 presented the results of
two microbial enhanced waterflood fields performed by NIPER (National Institute for

9
Petroleum and Energy Research) at the Mink Unit site, Delaware, Oklahoma. After this
pilot project demonstrated a 13 % increase in oil production, an expanded field pilot
program at the Phoenix field site in the same area was initiated. The Phoenix field
showed a 19.6 % improvement in oil production, and using the nutrient cost only,
$2.33/incremental bbl of oil was calculated. The cost for the Mink unit site was
calculated to be $ 3.23/incremental bbl. of oil. Unlike commercial surfactant processes,
which are linked to the cost of the chemicals and energy involved in their manufacture,
microbial surfactant can be produced using inexpensive feedstock8. The microorganisms
can be regulated by the amount of nutrient present. In other words, if they are not fed,
they will disappear.
In the use of microorganisms in-situ for MEOR, it is necessary to use microbial
cultures that can survive in the reservoir environment, but also produce the chemicals in
sufficient quantities that are necessary for oil mobilization. Before the bacteria are
injected into the reservoir they must have very good growth under facultative anaerobic
conditions (e.g., can survive under both aerobic and anaerobic conditions), and a high
metabolic activity of molasses with important production of oil displacement agents 9.
Laboratory research has demonstrated that microbial products can change the
chemical and physical properties of oil, and selectively plug high permeability zones to
improve sweep efficiency 10-12. The transport of microorganisms in the reservoir rock has
also been studied in the laboratory and the results indicate that certain strains of microbes
can be transported through the reservoir rock under proper conditions. Associated with
these laboratory investigations mathematical simulations have been introduced to help
understand the mechanisms involved in the MEOR process 9,13.
The microorganisms play various roles in the reservoir. The most important ones
considered in this project are: production of surfactants, selective plugging of the
reservoir, polymer production, and alcohol production14. Microorganisms can produce
surfactants that can decrease surface and oil water interfacial tension to as low as 5*10-3
mN/m15. Interfacial tension between oil and water is normally about 10 mN /m15. In
general, a biosurfactant is easily dissolved in connate water or injection water and acts
favorable on the interface between oil and water. Interfacial tension reduction decreases
the pressure required to release oil trapped in the rock pores by capillary forces, which

10
displaces oil from the pores into the mobile liquid phase. Microbial biosurfactants
usually act in the same way as synthetic surfactants, and have the same characteristics15.
Another application for microorganisms in a waterflood is fluid diversion. Since
many types of microorganisms produce polymers, biomass and slimes, it has been
suggested that some microorganisms could be used in-situ to preferentially plug high
permeability zones in the reservoir, and thus improve sweep efficiency 16-17.
Microorganisms can also produce organic solvents like alcohol. Solvents decrease oil
viscosity, making it thinner and increasing flow14.
Biosurfactants
Biosurfactants are surface active agents produced by certain types of microorganisms
during their growth on insoluble substrates. Microbial compounds, which exhibit
particularly high surface activity are classified as biosurfactants. (Cooper18) Many
species have the capabilities to degrade hydrocarbons and to synthesize biosurfactants
(Syldatk and Wagner19; Riser-Roberts20).
There are five major kinds of biosurfactants that are widely used, they are,
glycolopids; phospholipids and fatty acids; lipopeptide-lipoproteins; polymeric
surfactants; and particulate surfactants21. The more relevant surfactants to this study are
the lipopeptide surfactants.
Glycolipids are the most commonly isolated and studied biosurfactants, they are
carbohydrates in combination with long-chain aliphatic acids or hydroxyl aliphatic acids.
The best examples of glycolipids studied from the point of view of surfactant
characterization and properties are rhamnolipids. Certain species of Pseudomonas
(Pseudomonas aeruginosa) are known to produce large amounts of glycolipids
containing one or two molecules of rhamnose linked to one or two molecules of β-
hydroxydecanoic acid units22.
Lipopetide antibiotics (Polymyxins), and Decapeptide antibiotics (Gramicidins) show
remarkable surface-active properties. Some peptide-containing lipids also exhibit
biosurfactant activity. They include ornithine-containing lipids from P. rubescens; and t.
thiooxydans; cerlipin; ornithine-taurine-containing lipid for Gluconobacter cerinus

11
IFO3267; lysine-containing lipids from Agrobacterium tumefaciens; and streptomyces
sioyaensin21.
Surfactin, a cyclic lipopetide, reported first by Arima et al.23 in B. subtilis ATCC-
21332, is one of the most effective biosurfactants known so far. It is capable of lowering
the surface tension from 72 to 27 mN/m, at a concentration as low as 0.005%. The ability
of surfactin to lyse red blood cells is of limited use, but this discovery has led to the
development of a quick method for the screening of biosurfactant producing microbes23.
Microbial biosurfactants include a wide variety of chemical structures, such as
glycolipids (Zajic et al.24, Finnerty et al.25), lipopeptides (Horowitz et al.26),
polysaccharide-protein complexes (Zajic et al.24), phospholipids (Beebe, and Umbreit27),
fatty acids and neutral lipids (Cooper18). Most biosurfactants consist of distinct
hydrophilic and hydrophobic moieties. The former can be either ionic or nonionic and
consist of mono-, di-, or polysaccharides, carboxylic acids, amino acids, or peptides. The
hydrophobic moieties are usually saturated, unsaturated or hydroxylated fatty acids. For
some high molecular weight surfactant molecules, such as protein-polysaccharide
complexes, different molecules contribute the hydrophilic and hydrophobic moieties.
The most widespread microbial surfactants are glycolipids. The rhamnolipids of
Pseudomonoas aeruginosa and the trehalose lipids of Rhodococcus erythropolis are
among the best studied biosurfactants. For both compounds the chain length of the
hydrophobic domain and the structure of the carbohydrate head group exhibit
considerable variability depending on the growth conditions. Surfactin consists of 3-
hydroxyl- 13 -methyl- tetradecanoic acid amidated to the N-terminal amine of
heptapeptide. The carboxyl terminal end of the peptide is further esterified to the
hydroxyl of the fatty acid. The ionizable side chains of glutamic. and aspartic acids
contribute significantly to the excellent surface active properties of the molecule.
The proper characterization of the activity of biosurfactants requires detailed
information on the thermodynamic properties of aqueous/non-aqueous surfactant
mixtures. This information is experimentally difficult to obtain and is not available for
any natural products. As a result the most frequently used indices for the performance of
biosurfactants are the surface and interfacial tension and the critical micelle
concentrations.

12
Several biosurfactants show low CMC values, reduce the surface tension of the
fermentation broth to less than 30 mN/m, and the interfacial tension against n-alkanes to
values below 1 mN/m (Guerra-Santos22). In particular the glycolipids produced by
Rhodococcus sp. H13 (Finnerty and Singer25), and the major surfactant from Bacillus
Licheniformis strain JF-2 have been shown to reduce the surface tension of aqueous
solutions to 26-27 mN/m and the interfacial tension against octane to 10-2 mN/m28.
These values compare favorably to those obtained with commercial synthetic surfactants.
It is important to note that in addition to the major biosurfactants both Rhodococcus sp.
H13A and Bacillus Licheniformis JF-2 (ATCC 39307) produce several additional surface
active agents which appear to act synergistically (Javaheri et al.28). Furthermore, some
biosurfactants also exhibit good thermal and chemical stability at temperature up to 75 οC
for at least 140 hours. The surfactants are stable at pH values between 5.5 and 12. The
surfactants slowly lose activity under more acidic conditions.
The interfacial properties of surfactants depend on the ionic composition of the
aqueous phase. Salinity and divalent cations (Mg2+, Ca2+, etc.) have significant influence
on surfactant production and phase behavior. High concentration of NaCl inactivates the
glycolipids of apicola. On the other hand, the interfacial tension of the fermentation
broth of Bacillus Licheniformis JF-2 decreases by more than an order of magnitude in the
presence of 10 wt% NaCl, but is not affected by calcium salts (McInerney et al.29).
Interestingly, this microorganism grows and produces surfactant under both aerobic and
anaerobic conditions and in the presence of up to 10 percent NaCl28, 29.
Biopolymers
Microbial polymer production offers a relatively inexpensive, environmental friendly
method for conformance control. Microorganisms can be used to selectively plug high
permeability zones and improve sweep. Effective permeability is reduced by biomass
growth and in-situ polymer production12. Step et al.12 used a polymer producing
microorganism designated as NIPER 11, which is most probably a strain of Leuconostoc
mesenteroides, to study conformance control. This microorganism ferments sucrose and
produces lactic acid, acetic acid, ethanol, and a dextran polymer. The biopolymer is
insoluble in the culture medium and does not produce significant viscosity increase. The

13
same microorganism produces copious amount of the same biopolymer using molasses as
carbon source12. Jenneman et al.30 used NIPER 11 and another strain of Leuconostoc
mesenteroides to produce rigid, bulk dextran gels using molasses as carbon source. Bulk
dextran gels resulted in in-depth permeability reductions higher than 90%.
Some strains of Bacillus licheniformis are known to produce biopolymers. Step et
al.12 reported a polymer-producing strain of Bacillus licheniformis, designated as TG2-32,
isolated from arid conditions in Arizona. This microorganism produces an external,
insoluble levan polymer. The polymer is a fructran polymer where the fructose units are
mainly linked by α-1-6 bonds. The average molecular weight is around 1000.
Ramsay et al.31; used a Bacillus licheniformis, strain (NRC 9012) to produce an
insoluble levan polymer which has potential applications as a selective plugging agent in
microbial enhanced oil recovery. The microorganism grows in sucrose, glucose, and
fructose, but produces polymer only on sucrose. Polymer production can be
metabolically activated by the use of nitrate salts as nitrogen source.
Goals
The main goal of the research described in this report is to develop a combined
microbial surfactant-polymer system using bacteria that produce both biosurfactant and
biopolymer. The analysis has been reduced to two different bacterial strains that were
judged capable of producing biosurfactants and biopolymers. One is Bacillus
licheniformis (NIPER 1A), which is a well-known surfactant producer (Bryant et al.32,
Lin et al.33). The other is a laboratory modified polymer producing, Leuconostic
mesenteroides (NIPER 11)12, 30.
Chemical analysis, physical properties determination and recovery experiments have
been used to determine the feasibility of using at least one as a surfactant/polymer
producer.

14
EXPERIMENTAL SECTION
Growth Experiments
Introduction
The main goal of the research described in this proposal is to develop a combined
microbial surfactant-polymer system using bacteria that produce both biosurfactant and
biopolymer. This concept is based on our experience with a bacterium, Bacillus
licheniformis, which is known to produce both products in sufficient quantities to make
the process feasible. Strains of Bacillus licheniformis have been previously reported both
for surfactant production (Bryant et al.32, Lin et al.33) and for polymer production;
(Ramsay et al.31; Bae et al.34) there are no reports in the literature of the two products
being investigated together for a combined process. A developed strain of B.
licheniformis, NIPER 1A, is used. NIPER 1A transports well through oil reservoirs and
produces copious amounts of biosurfactants. However, NIPER 1A produces only
minimal amounts of biopolymer using common nutrients. Ramsay et al.31 have reported
that the presence of ammonium ion seems to be an inhibitor to polymer production
leading the organism into a metabolic path that leads to surfactant-only production.
Detailed analysis of the relevant literature31, 32 ,33, 35 points also to the metabolic role
played by several enzymes and additives such as trypticase, tryptone, soytone, yeast
extract, etc.
Biosurfactants cause a decrease in the interfacial tension between oil and water
phases, which is the primary mechanism by which surfactant-producing bacteria mobilize
oil. NIPER 1A strains that produce large amounts of biosurfactant are being tested for
their effects on interfacial tension between aqueous and oil phases. Interfacial tension
values are measured at various stages of culture growth and over a reasonable range of
nutrient levels using appropriate laboratory equipment such as spinning drop or the du
Nuoy ring methods.
Polymer-producing bacteria polymerize carbohydrates present in growth substrate
into extra-cellular polysaccharide biopolymers. The production of soluble biopolymers
causes viscosity increases in the microbial growth medium. Polymer production can be
stimulated by nutrient manipulations and/or other external factors. Optimum polymer

15
production is determined by chemical assays and by measuring viscosity increases with a
tubular viscometer.
An important part of this research is to validate the concept that a microbial
surfactant-polymer system can be designed to advance current technology for improving
oil recovery from porous media in the laboratory. We do this in a series of experiments
designed to show advantages of concerted microbial polymer system blockage of watered
out high permeability zones and microbial surfactant-improved mobilization of oil from
oil-bearing zones. The two mechanisms for oil recovery that are developed in this
research program, increased oil mobility and profile modification, are tested individually
in coreflood experiments. The processes can then be combined in more complex models
to test the performance of the combined system under simulated reservoir conditions.
The majority of pure culture studies have used glucose as the substrate. When grown
in a batch culture, the change in microbial population with time follows the classical
growth curve (Fuyimoto, 196336). This curve has three quite distinct phases, namely lag,
exponential and stationary. The lag phase of growth represents the acclimation period of
an organism to its new environment. After the onset of cell division the organism moves
out of the lag period and continues dividing exponentially until such time as the medium
is no longer able to support growth. This exponential phase of growth is the most
important part of the growth curve as it represents the maximum rate of substrate
removal, and in wastewater treatment the aim is to remove the substrate as rapidly as
possible (Gaudy and Gaudy37). After a given period of time the microorganism
population reaches the stationary phase of growth and it is reasonable to assume that this
is a direct result of substrate depletion. In this case glucose and/or other sugars are said
to be the growth limiting substrate. The decline in population appearing in the last
portion of the growth curve represents the death period. In this period population decline
outnumbers population growth and the cells still alive remain dormant.
Bacterial Strains
The work done in the first two years of this project showed that NIPER 1A, a
laboratory modified strain of Bacillus licheniformis that produces copious amount of
surfactant, and NIPER11, a laboratory modified polymer-producing strain of Leuconostic

16
mesenteroides; are the microorganisms relevant to this study. Therefore, the
experimental work is related only to them.
Microorganisms require suitable nutrients as well as a favorable environment for
growth. First, the culture medium must contain those nutrients essential for the growth of
a given microorganism. Second, this medium must provide suitable surroundings for
growth, the proper pH, osmotic pressure, oxygen, temperature, etc. Many different
substances will serve satisfactorily as a culture medium. We have used in this work only
liquid cultures. Bryant et al.32 used also agar media prepared in petri dishes.
The microorganisms listed above were grown under different conditions in different
media. Two broths, Thioglycolate by Difco, and Tryticase soy broth by Difco, were
selected as the most suitable media to grow and maintain the aforementioned organisms.
These broths contain meat extract and dextrose as principal nutrients plus phosphorus and
nitrogen compounds. Good growth was achieved working under anaerobic or oxygen
limiting conditions. The growth under aerobic conditions was significantly less and in
some strains almost negligible. The original microorganisms were provided in these
cultures; therefore, it was convenient to keep the original cultures in these broths, placed
them in an oven at constant temperatures of 33 oC. In order to study effect of nutrients on
the microorganisms a medium E (ATCC 1502) complete or modified was also used. The
composition of all these media is summarized in Table 1. The cultures used in growth
experiments were prepared by taking a 10 ml sample, and placing it in 250 conical flasks
filled with a 1% peptone in deionized water solution. Later, sugars were added to study
the influence of different sugar sources. Sucrose, glucose, and commercial molasses
were added. Typically, 10% sugar solutions in peptone water were prepared. These
solutions will be referred as, sucrose -peptone broth, glucose -peptone broth, etc.
Growth conditions for NIPER 1A have been published in literature35. NIPER 1A was
observed to be limited to a salinity range of 0 to 5 wt% NaCl, with an upper temperature
limit of 35o C. This microbial system can tolerate a pH range from 4.5 to 8.0. Other
microbial strains were observed to tolerate a salinity up to 14 wt% NaCl, when grow in
Tryptic soy broth, and up to 5 wt% when grown in sucrose peptone broth. Its upper
temperature limit was 45o C, with a pH tolerance from 6.0 to 10.0. Optimum growth was
achieved around pH 7.

17
Measuring Techniques
A brief description of the laboratory techniques used in this project is given below.
Colony Counting Procedures
In this work, the Standard Plate count technique (SPC38) was used to enumerate the
microbial population. It is a direct quantitative measurement of the viable aerobic and
facultative anaerobic bacteria in a water environment, capable of growth on the selected
plating medium. An aliquot of the water sample is seeded into a sterile petri dish where a
tempered agar medium has been added. The plate is rotated to evenly distribute the
bacteria. Each colony that develops on or in the agar medium originates theoretically
from one single bacteria cell.
Although no one set of plate count conditions can enumerate all organisms present
but the number and types of bacteria that developed are influenced by the time and
temperature of incubation, the level of oxygen, the presence of specific nutrients in the
growth medium, the pH of the medium and competition among cells for nutrients. The
Standard Plate Count Method provides the uniform technique required for comparative
testing water quality in most situations. When the method applies to research work,
however, the consistency of the parameter and media becomes more important.
The preparation procedure used was, dissolve 1 g of peptone water (crystals) into 1
liter of distilled water, put 9 ml to each test tube. Autoclave at 121-124 οC for 15minutes
and allow to cool to room temperature. Dissolve 23 grams of Nutrient Agar inside 1 liter
of water and boil completely. Autoclave the solution at 121-124 οC for 15 minutes, and
place agar in a tempering water bath maintained at a temperature of 44-46 οC. Do not
hold agar at this temperature longer than three hours because it may form precipitates
which confuse the counting of colonies.
Put 9 ml of 0.1% peptone water in 10 different sterile test tubes, label them as 10-1 ,
10-2 ,…,10-10, make a 1:10 dilution using 1 ml of solution A with a 1 ml pipette, mix each
tube carefully by vortexing. Obtain 11 sterile petri dishes, label them with the
appropriate dilution i.e. 1, 10 -1, …10 -10. Begin with highest dilution, and working
backward, pipet 1.0 ml of aliquot from every diluted sample into their appropriate petri
dishes including the straight sample. Pour approximately 10 ml of nutrient agar (held at

18
45 οC) into each petri dish, swirl gently to disperse the sample evenly, put on all the
cover of the petri dishes, allow to cool down for 10 minutes. After the agar plates have
hardened on a level surface, invert the plates and immediately incubate at 35 οC for 24-
48hrs. Also put 1 ml of peptone water into a petri dish, add agar mix and incubate with
the others. This is the control plate, it will check the sterility of pipets, agar, dilution
peptone water, and petri dishes.
After the required incubation period, examine plates and select those with 30-300
colonies. Count these plates immediately by placing the plate to be counted on a colony
counter, a standard plastic petri dish has a surface area of 57 cm2; count the colonies in
13 squares usually highlighted on the surface of the colony counter a representative
distribution of colonies. Select 7 consecutive horizontal squares and 6 consecutive
vertical squares for counting, some colonies will contact with grid lines, count the
colonies individually, even if they are in contact with each other.
Record the sum of the colonies in these 13 cm2, and multiply by 4.32 to estimate the
colonies per plate. Then multiply by dilution to determine the count/ml, i.e., the number
of bacteria/ml of your original sample, record as S.P. Count /ml (Standard Plate Count
per ml). The count is also referred to as cfu/ml (Colony Forming Units per ml).
If there are less than 30 colonies on all plates, record the actual number of colonies on
the lowest dilution plated and report the count as, Estimated Standard Plate Count per
milliliter e.g. ESPC = 100 cfu/ml. If 1ml volumes of original sample produce counts less
than 30, actual counts are reported.
Surface Tension Measurements
Measurements of the surface tension of the different cultures were made using a
Fisher model 21 tensiomat tensiometer. The apparatus is based on the du Nuoy ring
method. In this method a ring (standard perimeter about 60 mm) is pulled through the
liquid/air interface and the maximum downward force directed to the ring is measured.
Note that the force will slightly decrease before the ring is ruptured to the air. This
method is not direct. One must use correction factors which take account the dimensions
of the ring (the perimeter, ring wire thickness and the effect of the opposite inner sides of

19
the ring to the measurement). All measurements were made at a temperature range of 20 -
23oC.
A variation of this procedure was introduced in order to measured low interfacial
tensions between the microbial solution and an oil phase. The method was based on the
procedure reported by Tsouris39 (2003). In this procedure a hydrocarbon (oil) phase is
placed on top of the microbial solution. The force needed to lift the platinum ring
through the interface between the microbial solution and the hydrocarbon phase gives a
direct measurement of interfacial tension. This method allows measurement of interfacial
tensions as low as 1 mN/m.
A spinning drop tensiometer available at the Petroleum Engineering Department at
TAMU was used in some measurements of very low interfacial tension values. This is a
method used when the surface tension values are so low that normal tensiometers, which
use other methods, are not able to make the measurement. A small drop of a sample is
injected inside a thin tube with another liquid. The tube is then spinned at a high speed
and the interfacial surface tension is calculated from the angular speed of the tube and the
shape of the drop. The denser medium, the culture, is used as the continuous phase. One
oil drop is introduced into the continuous phase.
Viscosity Measurements
Viscosity was measured using an Ube-Lode type viscometer. The apparatus allows
viscosity measurements in the range 1-10 cp at 25 oC. Only 2 ml of sample are needed
for the measurements. The apparatus is based on the Hagen-Pousielle equation that
predicts a linear relationship between a fluid viscosity and the time required for this fluid
to transverse the distance between two fixed marks on a cylindrical calibrated glass tube.
Chemical Analysis
Most of the prepared bacterial samples were kept under incubation for several
months. The polymer producing strains produced a copious amount of biopolymers
during that time. A white solid was clearly visible by the bottom of the assay tubes
commonly used during this research. NIPER 11 samples presented this behavior for all

20
samples. The precipitate was even noticeable in the prepared samples after incubation for
less than one week in an anaerobic environment. In cases where this behavior was not
appreciated alcohol solubility test were conducted. These simple tests are based on the
insolubility of biopolymers in an alcohol-water medium. The cells were removed from
the culture by centrifugation at 15,000 g for 15 minutes. Up to 3 V of methyl alcohol is
added to the assay tube until an alcohol-water medium is prepared. The change in
medium polarity produces precipitation of several biopolymers. A cloudy-white
coloration is indicative of polymer production. After incubation for several days a white
precipitate appears by the bottom of the essay tube.
Porous Media Tests
One of the purposes of the microbial polymer systems for improving oil recovery is to
block fluid flow through watered out thief zones in the reservoir and divert fluid flow into
less flow accessible regions of the reservoir. Polymer producing microbes were used for
their ability to produce abundant amount of polymer as verified in our laboratory tests.
Polymer-producing bacteria identified in this study were tested for their ability to reduce
the permeability of porous media. The ability of the polymer-producing bacteria to block
fluid flow and cause fluid diversion was also tested using coreflood experiments. The
other main purpose was to mobilize oil by decreasing surface tension at the oil-water
interface. Surfactant producing microbes were tested in coreflood experiments for their
ability to mobilize oil. These experiments were conducted at the Petroleum Engineering
Department at Texas A&M University. Dr. Bryant facilitated oil samples and the
original microbial samples.
The experimental set-up is shown in Figure 1. Blocks of Berea sandstone were
obtained and cut in cylindrical shape, 25 cm in length and 2.5 cm in diameter. The cores
were encased in rubber sleeves and placed inside Hassler coreholders. Coreflood
experiments were conducted to determine permeability reduction due to in situ
biopolymer production. Berea cores were injected with the appropriate culture-growing
medium. Microbes were injected and left incubating for six days and permeability was
determined.

21
Coreflood experiments were also carried out to determine residual resistance factors
(Frr). The aforementioned Berea cores were saturated with 0.5% brine solution and
injected with 1 PV growth medium inoculated with NIPER 11. The cores were shut in
for six days then flooded with brine, and flow rates and pressures were measured. The
residual resistance factors (Frr) were then calculated using the following equation,
Frr = (Qw/∆P)brine / Qw/∆P)AfterMicrobialInjection (1), here Qw is
the flow rate, and ∆P is the pressure difference between fluid input and output.
Recovery experiments were carried out using microbial cultures and different nutrient
media. After been placed in Hassler coreholders the Berea sandstone cores were
evacuated and flushed with a 2% brine solution. Crude oil was injected into the cores
until no additional water was produced, about 24 hours. Then, brine was injected until no
more crude oil was produced. The core thus simulated a waterflooded ROS condition
designated by Sorwf.
Oil samples were obtained from the Delaware-Childress field in northeastern
Oklahoma and from the Wilmington field in California. Delaware-Childress oil has a
gravity of 31 oAPI (0.87 g/cm3), and Wilmington 17 oAPI (0.97 g/cm3). The first
qualifies as a light/medium crude while the second was used as representative of heavy
oils.
The following experimental procedure was adopted, the Berea sandstone cores that
have been waterflooded to the residual saturation Sorwf, are prepared for microbial
injection. The pore volume of these cores varied from 25 to 30 ml. The cores were
injected with 0.2 PV of a bacterial cells solution (at a concentration of about 106 cells/ml)
in 1% peptone solution and 0.3 PV of 10% sugar solution. Glucose, molasses and
sucrose solutions were used as sugars. The cores were allowed to incubate at 33 oC for 1
week. The cores are flooded with brine at a rate of 0.3 to 0.6 m/day, and fractions of the
core effluents were collected. The amount of oil in each fraction was determined, and the
residual oil in the core, Sorcf, was calculated. The oil recovery efficiency (Er) was
calculated using the following equation,
Er = (Sorwf - Sorcf) / Sorwf (2).
Effluent fluids were separated and the water phase was separated for further analysis.
Surface tension, viscosity and colony count measurements were conducted on the

22
separated water phase. The same procedure was followed for the NIPER 1A and the
NIPER 11 cultures.
Some experiments were carried out using NIPER 1A cultures changing the nutrient
formulations. These experiments involved replacement of the ammonium salts by
sodium salts. More details are provided in the tasks description sections. Some recovery
experiments were carried out after the end point of the previous brine sweep. The cores
were injected with a 0.2 PV of a nutrient solution without ammonium salts. The residual
oil in the core was calculated. The cores were incubated at 33 oC for three days. Finally,
the cores were flooded with brine at a rate of 0.3 to 0.6 m/day, and fractions of the core
effluents were collected. The amount of oil in each fraction was determined, and the
final residual oil in the core, Sormf, was calculated. The total oil recovery efficiency (Ert)
was calculated using the following equation,
Ert = (Sorwf - Sormf) / Sorwf (3).
Comments and more details are given in the tasks description part.
SIMULATION SECTION
Simulator Background
UTCHEM, a chemical simulator developed by researchers at the University of Texas
at Austin40,41, has been used for the simulation program. UTCHEM is a multicomponent,
multiphase, three-dimensional compositional with variable temperature simulation
model. The basic equations are as follows:
1) the mass balance equations, which are solved up to 21 species;
2) the aqueous phase pressure, which is obtained by an overall mass balance on
volume occupying species (water, oil, surfactant, alcohol, and gas). The other
phase pressures are computed by using the capillary pressures between
phases;
3) the energy balance equation, which includes heat flow between the reservoir
and the overburden rocks.
The flow equations allow for compressibility of rock and fluids, dispersion and
molecular diffusion, chemical reactions, and phase behavior and are complemented by

23
constitutive equations. The model includes options for multiple wells completed either
horizontally or vertically. Aquifer boundaries are modeled as constant potential surfaces
or as closed surfaces.
The flow equations are solved using a block-centered finite-difference scheme. The
solution method is implicit in pressure and explicit in concentration (IMPES-like). Either
one, two-point upstream, or third-order spatial, discretization is used. A brief description
of the equations used in the code is provided below.
Mass Conservation Equations
The assumptions imposed when developing the flow equations are:
1) local thermodynamic equilibrium, except for tracers;
2) immobile solid phases;
3) slightly compressible rock and fluids;
4) Fickian dispersion;
5) ideal mixing; and
6) Darcy's law.
The boundary conditions are no flow and no dispersive flux across the impermeable
boundaries.
The mass continuity for component k in association with Darcy's law is given in terms of overall volume of component k per unit pore volume ( ~Ck ) as,
( )∂∂
φ ρt
C + (C u - D ) = Rk k kj j k~ ∇ • ∑ ∇ •
=k
j
n
rp
1 (4), where the
overall volume of component k is the summation over all phases including the adsorbed
phases,
kC~ = 1 - Ckk=1
ncv∃∑⎧
⎨⎩
⎫⎬⎭
∑=
S C j kjj
np
1+ kC∃ , for k= 1, ,ncv (5), ncv is the
total number of volume occupying components. These components are water, oil, surfactant, and gas, np is the number of phases, kC∃ is the adsorbed concentration of
species k, and kρ is the density of pure component k at a reference phase pressure Pr

24
relative to its density at reference pressure Pro, usually taken at a surface condition of 1
atm.
The phase flux from Darcy's law is given by,
uj = - - k j
rjkµ • ( ∇ ∇j jP - hγ ) (6), where k
is the intrinsic permeability tensor and h is the vertical coordinate, rjk , jµ , and jγ are the
relative permeability, viscosity, and specific weight for phase j. The source terms kR are
a combination of all rate terms for a particular component.
Pressure Conservation Equations
The pressure equation is developed by summing the mass balance equations over all
volume occupying components, substituting Darcy's law for the phase flux terms, using
the definition of capillary pressure, and noting that (∑=
cvn
1kkjC ) = 1. The pressure equation
in terms of the reference phase pressure (phase 1) is given by,
φ Ct tPj
∂
∂+ ∇ • k • λrTc ∇ Pj = - ∇ • k
j=1
ncv
∑ • λrTc ∇h +
+ ∇ • k rTcj=1
ncv
λ∑ • ∇ jwPc + j=1
ncv
kQ∑ (7), where the
total relative mobility including the correction for fluid compressibility is given by rTcλ
= rjck=1
ncv
λ∑ , and λrjc = k
r C rj
jk kj
k=1
ncv
µ ∑ . tC is the total compressibility calculated as the
volume weighted sum of matrix and component compressibilities.
Fluid and Soil Properties
Geological heterogeneities are the key factor that reduces the effectiveness of
chemical enhanced recovery processes because their success depends on the delivery of
injected chemicals and water into the subsurface. In order to capture some of the
geological features, reservoir properties such as formation permeability, porosity, residual
phase saturation, phase relative permeability, and phase capillary pressure are allowed to

25
vary spatially in UTCHEM. Phase trapping functions and adsorption of both surfactant
and polymer are modeled as a function of permeability.
Polymer Adsorption
Polymer adsorption can be an important mechanism for a chemical recovery project
since it causes retardation polymer consumption. The retention of polymer and surfactant
molecules in permeable media is due to both adsorption onto solid surfaces and trapping
within small pores. UTCHEM uses a Langmuir-type isotherm to describe the adsorption
level of a polymer or a surfactant, which takes into account the salinity, polymer
concentration, and soil permeability. The adsorption is irreversible with concentration and reversible with salinity. The adsorbed concentration ( pC∃ ) is given by,
pC∃ = min { pC~ , a (C - C )
1 + b (C - C )
p p p
p p p
~ ∃~ ∃ } (8).
The minimum is taken to guarantee that the adsorption is no greater than the total
polymer concentration. Adsorption increases linearly with effective salinity and
decreases as follows,
pa = ( pa 1 + pa 2 CSEP) k-0.5 (9).
The adsorption parameters ap1, ap2 and bp are found by matching laboratory polymer
adsorption data. The effective salinity for polymer (CSEP) is,
CSEP = C + ( - 1) C
C
51 61
w1
pβ (10), where
C51, C61, and Cw1 are the anion, calcium, and water concentrations in the aqueous phase and pβ is experimentally determined.
Viscosity
Liquid phase viscosities are modeled in terms of pure component viscosities and the
phase concentrations of the organic, water and chemicals,
kµ = ( )wk k
C + CC e w ok chkµ α + ( ) C e ok C + Co wk chk
kµ α + ( ) C e chk C + Cch wk ok
kµ α (11), for k =
water, oil or chemical.

26
The α parameters are determined by matching laboratory microemulsion viscosities
at several compositions. In the absence of polymer, water and oil phase viscosities are
reduced to pure water and oil viscosities. When polymer is present µw is replaced by µp
defined below.
The viscosity of the polymer solution depends on the concentration of polymer and
on salinity,
poµ = wµ {1 + (Apw Cpw + Apo pwC2 + Apch pwC3 ) SEP
SpC } (12), where
Cpw is the polymer concentration in water, wµ is the water viscosity, Api are constants.
The factor SEPSpC allows for dependence of polymer viscosity on salinity and hardness.
The reduction in the viscosity of the polymer solution is a function of shear rate (γ)
and is modeled by using Meter's equation,
pµ = wµ + ( poµ - wµ ) / ( 1 + { γ γ/ 1/2 }Pα -1) (13), where
1 2/γ is the shear rate at which viscosity is the average of poµ and wµ , and Pα is an
empirical coefficient.
Microbial Enhanced Oil Recovery Model
Microbial enhanced oil recovery (MEOR) process is based on the injection of large
quantities of nutrients in the reservoir. These nutrients accelerate the growth of both the
injected cultures and the indigenous microorganisms. During growth of bacteria, several
metabolites such as alcohols, surfactants, and polymers are produced. Among these bio-
products, surfactants, biomass, and polymers are potentially the most useful products for
improved oil recovery. The implementation includes very general kinetics and mass
transfer models so it can accommodate any number of substrates, electron acceptors, and
biological species. It can model the substrate inhibition, substrate competition, electron
acceptor inhibition, abiotic decay, biomass growth, and biomass attachment. The model
also includes permeability reduction due to biomass growth and retention. The formation
of products such as bio-surfactants and bio-polymers has been incorporated.
In the simplest case of a single subtrate and a single biological species it is generally
accepted that the mass of new cells (X) synthesized per unit mass of substrate (S)
removed is constant for a given substrate and bacterial species,

27
)(max
SKYSX
dtdS
s +=
µ (14).
The term µmax
Y can be replaced by the term k, which is referred to as the degradation
rate constant or maximum rate of substrate removal per unit weight of biomass. This
results in the following expression for the rate substrate degradation, dSdt
kSXK Ss
=+
(15).
Similarly an expression for the rate of biomass formation is, dXdt
YkSXK S
bXs
=+
− (16), where
µmax and Ks are the Monod kinetic parameters, b = endogenous decay constant, Y is the
yield coefficient, cell mass produced per mass of substrate biodegraded.
Similar equations can be written for several substrates, electron acceptors; attached,
and non-attached biomass.
If significant biomass growth occurs in the modeling domain, then the reservoir
porosity will be reduced, with a concomitant reduction in reservoir permeability. Because
biological growth is limited to the aqueous phase, porosity reduction occurs only at the
expense of the aqueous phase. Permeability in the flow direction is calculated based upon
the Carman-Kozeny40 equation:
kx = dp2 φ3 / 300 (1 – φ)2 (17), where kx
is the permeability in the flow direction (cm), and dp is the particle diameter (cm). The y
and z permeability values are adjusted using equation (17).
Surfactant/Brine/Oil Phase Behavior
The surfactant-oil-water phase can be represented as a function of effective salinity
once the binodal curve and the tie-lines are described. The phase behavior model in the
UTCHEM simulator uses Hand’s rule, and is based on the work by Nelson and Pope42,
among others. The effective salinity increases with the divalent cations bound to micelles
(Hirasaki43) and decreases as the temperature increases for anionic surfactants.

28
The formulation of the binodal curve using Hand’s rule is assumed to be the same in
all phase environments. Hand’s rule is based on the empirical observation that
equilibrium phase concentration ratios are straight lines on a log-log plot scale. The
binodal curve is computed from,
3
2
j
j
CC
= A { 3
1
j
j
CC
}B, with j = 1,2, or 3 (18), where A
and B are empirical parameters. For a symmetric binodal curve where B = -1 all phase concentrations are calculated explicitly in terms of oil concentration, 2 jC .
[ ]3 jC = 0.5 - A C + (A C ) + 4 A (1 - C ) 2j 2j2
2j , for j = 1,2, or 3 (19).
TASKS DESCRIPTION
Task 1 - Characterization of Surfactant and Polymer-Producing Bacteria
Subtask 1.1 - General Bacterial Physiology
The microorganisms selected for the microbial surfactant-polymer system were
characterized to determine how relevant physical and chemical factors affect their
growth. Growth experiments were conducted to determine optimum growth conditions.
The original microbial samples were provided by Dr. R. Bryant and grown in a
Thyoglycolate broth medium at ACORN Biotechnical, a private biotechnology company.
Surface tension and viscosity for NIPER 1A and NIPER 11A samples were recorded for
more than 10 consecutive months. Periodic plate counts were also measured in order to
determine microbial numbers. Figure 2 shows results for NIPER 1A samples grown in
both broth media. The microbial population is very resilient and remained viable for a
long period of time when provided with adequate nutrients. The microbes grown in
trypticase soy broth grew more than those grew on Brewer thioglycolate broth. These
results are typical of all our experiments. Probably the fact that the trypticase culture was
grown and maintain under anaerobic conditions influenced the results.
Typical results corresponding to our laboratory experiments are shown in Table 2.
We can see that NIPER 1A cultures produced a significant reduction in the medium
surface tension. This behavior was observed for all the NIPER 1A cultures grown
independently of the sugar used. In general sucrose and molasses cultures produced

29
similar results while the values measured using glucose cultures were lower. The same
trends were observed for standard plate counts (cfu/ml) and viscosity measurements.
These results verified that NIPER 1A is a good surfactant producer and that there is a
direct relationship between population size and surfactant production. The bigger the
population the bigger the amount of biosurfactant produced and, therefore, the lower the
surface tension is. NIPER 11 results showed a much smaller reduction in surface tension
even when the population growth of these microbes was about the same size of NIPER
1A populations. This result reflects the fact that NIPER 11 is a poor surfactant producer,
and no significant change has resulted from the use of different sugars as nutrients. Our
results confirmed than NIPER 11 is a good polymer producer, but it is not a good
surfactant producer.
In order to study the influence of different sugars on the growth rate 1 ml of the broth
inoculum was placed in 250 ml flasks containing 150 ml of modified medium E. The
modification involved adding 0.1% yeast extract and replacing the carbon source with
glucose, sucrose, fructose and molasses. Dr. Bryant provided the molasses used in these
experiments. They were originally obtained from Pacific Molasses Co. at Oklahoma city,
and its composition is as follows: mineral content: total ash 8.1%, calcium: 0.8%,
phosphorous: 0.08%, magnesium: 0.35%, potassium: 2.4%, sulfur: 0.8%, and sodium:
0.2%. The amount of total suspended solids is 74%, of which 3% is total protein, 48% is
total sugar (sucrose), and the remaining 23% is fiber. The concentration of molasses was
4% by weight in tap water.
Figure 3 shows a typical growth curve for the different carbon sources used in this
study. The growth curve depicts all the classical kinetic periods. At first, the number of
microorganisms did not show appreciable growth (lag period). After this lag period the
microbial population growths exponentially until reaches equilibrium and after
approximately four days started to decline in numbers. The same behavior was
appreciated for all our experiments in different growth media. Similar results were
obtained for the NIPER 11 samples.
NIPER 1A samples grown using glucose as carbon source grew well, albeit at smaller
rate, than the ones grown using pure sucrose or molasses as carbon sources. This was a
surprise because Javaheri et al.28 have reported glucose as the preferred carbon source for

30
growth of Bacillus licheniformis strain JF-2 (ATCC 39307). However, Ramsay et al.31
reported slower growth for Bacillus licheniformis strain NRC 9012 using glucose or a
glucose-fructose mixture than using sucrose as carbon source.
Subtask 1.2 - Surfactant Production
Biosurfactants cause a decrease in the surface tension between air and culture phases.
Biosurfactants also affect the interfacial tension between the aqueous, and oil phase,
which is the primary mechanism by which surfactant-producing bacteria mobilize oil.
Selected strains that produce large amounts of biosurfactants were tested for their effects
on interfacial tension between aqueous and oil phases. Surface tension was measured at
various stages of culture growth and over a reasonable range of nutrient levels using the
du Nuoy ring method. Some measurements of solution-oil interfacial tension were done
using the spinning drop method at the Petroleum Engineering Department at TAMU.
Figure 4 depicts typical surface tension values for cultures grown using medium E
and different carbon sources. These results correspond to the cultures depicted in Figure
3. Surfactant production was directly proportional to cell growth; as the cell density
increased the surface tension decreased. The greatest decreased in surface tension was
observed during the log phase (36 hours). Figures 3 and 4 prove that 84 hours is enough
time for surfactant production in flasks experiments.
NIPER 1A samples grown using glucose as carbon source produced very small
decrease in the measured surface tension, 5 to 10 mN/m. This effect cannot be explained
on the basis of microbial population size only. Bryant and Douglas35 have reported
similar behavior for NIPER 1A cultures. Lin et al.33 reported the opposite behavior in
their detailed analysis of the metabolic conditions for biosurfactant production using
Bacillus licheniformis JF-2 cultures. Lin et al.33 reported the maximum amount of
biosurfactant being produced by a culture that used glucose as the sole carbon source.
There was not appreciable difference between the cultures grown using pure sucrose and
molasses as carbon sources.
The surfactant produced by NIPER 1A is most likely a lipopeptide similar to surfactin
produced by Bacillus subtilis23. Cultures of Bacillus licheniformis JF-2 also produce a

31
biosurfactant lipopeptide, consisting of a C15 fatty acid tail linked to a peptide moiety
very similar to surfactin33.
These results verified that NIPER 1A is a good surfactant producer and that there is a
direct relationship between population size and surfactant production. NIPER 11 results
showed a much smaller reduction in surface tension even when the population growth of
these microbes was about the same size of NIPER 1A populations. This result reflects
the fact that NIPER 11 is a poor surfactant producer and no significant change has
resulted from the use of different sugars as nutrients.
Figure 5 depicts the interfacial tension (IFT) between a NIPER 1A culture, and an oil
phase (n-decane). The interfacial tension decreases continuously for the first 24 hours.
The IFT value becomes constant for longer periods of time. These data correspond to a
sucrose modified culture medium E with 0.1% yeast extract added.
The influence of brine concentration on interfacial tension for several oils was also
studied. Toluene, n-hexane and n-decane were used as representative oil phases. It has
been reported that NIPER 1A can produce biosurfactants up to 10 wt% brine content, but
the optimum values are produced by 4-5 wt% solutions. Excess of brine has been
reported as leading to suppression of biosurfactant production33. Figure 6 shows smaller
IFT values for hydrocarbon with high carbon number (n-decane) while aromatics
(toluene) produced the smallest measured IFTs. A 5 wt% brine concentration produced
the best IFT values. In this work we did not determine the optimal salinity concentration.
The optimal salinity is the concentration value that produces three faces in the microbial
culture/oil/biosurfactant system40. This condition is considered the most favorable for oil
recovery because produces the maximum oil solubility and the minimum interfacial
tension among all the phases present. This phase behavior receives the name of Winsor
type III or just type III.
The salinity value determines two other possible phase behaviors involving two
phases present. At low salinity below critical micelle concentration (CMC), the two
phases are an aqueous phase; containing all the surfactant, electrolytes, and dissolved oil;
and an excess oil phase. At values above the CMC, a microemulsion, and a mostly pure
oil phase are present. This type of phase behavior is called Winsor type I, or alternatively
type II(-). For high salinity, an excess water phase and a microemulsion phase containing
32
most of the surfactant and oil; and some solubilized water exist. This type of phase
behavior is called Winsor type II, or alternatively type II(+). The phase diagram is also
strongly influenced by the concentration of divalent ions (Ca2+, Mg2+, etc.).
In this work we only observed type II(-) phase behavior, i.e., an aqueous phase;
containing all the surfactant, electrolytes, and some dissolved oil; plus an excess oil
phase.
Subtask 1.3 - Polymer Production
Polymer-producing bacteria polymerize carbohydrates present in growth substrate
into extra-cellular polysaccharide biopolymers. The production of soluble biopolymers
causes viscosity increases in the microbial growth medium. Polymer production can be
stimulated by nutrient manipulations and/or other external factors. Characterization of
polymer-producing microorganisms included a study of biopolymer formation, and
viscosity increases. Optimum polymer production was determined by inspection,
chemical assays which included alcohol precipitation, and by measuring viscosity
increases with a viscometer.
Several experiments were conducted using a well-known polymer-producing microbe
NIPER 11. Stepp et al.12 reported that NIPER 11 is a strain of Leuconotoc mesenteroides
that ferments sucrose and produces lactic acid, acetic acid, ethanol and an insoluble
dextran polymer. These polysaccharide polymers consist of mostly linear
monosaccharides chains linked by α-1→6 bonds with generally short side branches. The
microbe grows using a variety of carbon sources, but only produces the dextran polymer
in the presence of sucrose30. This fact can be used to place the microbial population in
depth inside the reservoir and later on metabolically activate the biopolymer formation by
adding appropriate nutrients. Jenneman et al.30 studied the influence of nutrients on gel
production. The authors concluded that growth of Leuconotoc mesenteroides in a
synthetic sucrose-based medium resulted in production of rigid, bulk dextran gels,
whereas, growth on a beet-molasses medium produced a loose, colloidal gel.
Inspection of essay tubes seeded with 1 ml of NIPER 11 inoculum, and tryptic soy
broth growth medium (Table 1) produced copious amounts of biopolymer. A white paste
appears in the bottom of the essay tube within a few days from inoculation. The viscosity

33
of NIPER 11 cultures did not significantly increase though. This fact indicates that the
produced biopolymer is largely insoluble in the culture medium and; therefore, does not
increase the aqueous medium viscosity. This result agrees with the findings of Jenneman
et al.30.
Several Bacillus licheniformis strains produce biopolymers. Stepp et al.12 studied a
strain, designated as TG2-32, for possible use to improve conformance control. This
microorganism has been isolated from arid conditions in Arizona. This bacteria produced
a levan polymer similar to the one reported by Ramsay et al.31. These polymers are β-D-
Fructofurannans with linear chains of approximate 12 units and β-2→6 monosaccharide
bonds. Stepp et al.12 results support TG2-32 use as a permeability reducing agent.
However, NIPER 11 was found to be more effective in this role.
Ramsay et al.31 used a Bacillus licheniformis strain, NRC 9012, to produce a water-
insoluble, metabolically controlled, levan polymer. The microbial strain grows with
several carbon sources, but only produces polymer when fermenting sucrose in presence
of nitrate salts as nitrogen source. The authors concluded that the Bacillus culture or a
preparation of its extracellular enzymes might be used as a selective plugging agent in
undesirable, high permeability zones in oil reservoirs where the temperature is less than
50 oC, the pH is between 6 and 9, the salt concentration is less than 4%, and the pressure
less than 500 atm.
Several studies were carried out in order to determine the possibility of producing
polymers using NIPER 1A. These studies involved the used of the modified medium E,
ATCC 1502, described in Table 1. This medium without carbon and nitrogen sources
will inhibit growth, and shut-off surfactant production. The addition of sucrose as carbon
source and sodium nitrate as nitrogen source will trigger polymer production. Methanol
precipitation tests have been used to determine the polymer production. The polymer
production has also been tested in coreflood experiments. These experiments involved
accurate nutrient manipulation; therefore, are described in more detail in the next two
sections.
Task 2 -Evaluation of Nutrient Regimes
Subtask 2.1 - Polymer Stimulation
34
Biopolymers of interest for profile modification in MEOR applications have
polysaccharide (carbohydrate) backbones. Many of the biopolymers produced by
bacteria are glucans made of repeating glucose residues. Different linkages between the
glucose residues and functional group substitutions on the glucose monomer give the
different polymers their distinct properties. Nonetheless, they are all carbohydrates and
bacteria need nutrients rich in carbohydrates to produce the polymers. In addition, some
bacteria have additional nutrient requirements such as amino acids and vitamins. For a
microbial polymer system to be economically attractive for MEOR applications, it needs
a low-cost nutrient package that is rich in carbohydrates and any other essential nutrients.
A valuable feature of the microbial polymer systems investigated in this project is
that the microbial cells can be grown without producing polymer, and then stimulated by
nutrient manipulation to begin producing polymer. The advantage of this feature for
MEOR is that cells can be injected deeply into the reservoir and then stimulated by
nutrient injections to produce biopolymer in-situ. An important aspect of this research
was to investigate the use of nutrient systems to control and stimulate polymer
production. Different nutrient systems, including low-cost industrial grade products,
were examined to determine efficacy for stimulating polymer production.
Studies were carried out in order to determine the possibility of producing polymers
using NIPER 1A. These studies involved the used of the modified medium E, ATCC
1502, described in Table 1. This medium without carbon and nitrogen sources will
inhibit growth, and shut-off surfactant production. NIPER 1A is a spore-forming
microbe that in situations of nutrient depravation will form spores. These spores are 0.2-
0.5 µm in diameter and 1-2 µm in length. These spores can be injected without problem
inside reservoirs with permeability as low as 100 mDarcies. Appropriate nutrients can be
injected after microbial placement in order to activate cell growth and chemicals
production13, 44.
After several laboratory trials we found that adding 10 g/l of sucrose as carbon source
and 5 g/l of NaNO3 as nitrate source to our modified medium E will produce a paste-like
white precipitate after methanol treatment. A 1 ml NIPER 1A inoculum was injected into
a 10 ml essay tube filled with the modified medium plus the carbon and nitrogen source.
The tube was incubated at 33 oC for three days in an oven. The cells were removed by

35
centrifugation, methanol was added up to 3 V, and the supernatant recentrifuged at
25,000 g for 15 min. The top portion of the solution was clear with increasing opacity
towards the bottom of the tube where some solid had accumulated. The amount of
methanol was calculated depending upon previous experiments results. If there was no
previous success the amount of methanol was increased until the appearance of a
precipitate.
In similar experiments using NIPER 11 the amount of precipitate was significantly
higher than in the NIPER 1A cases. In most cases a precipitate was observed directly in
the culture before centrifugation and methanol addition.
The surface tension and viscosity of the bacterial solution were determined before and
after the precipitation experiments. These results allowed us to determine whether the
precipitate contained some biosurfactant. Determination of the polymer solubility was
done based upon the viscosity measurements. Soluble biopolymers, such as xanthams,
will increase the viscosity of the culture while insoluble ones such as some dextrans and
levans will not.
Table 2 shows typical viscosities and surface tension of our chemical experiments.
NIPER 1A cultures showed very little decrease in surface tension suggesting that the
precipitate is mostly a polymer and not a surfactant. There was very little viscosity
increase suggesting that the polymer is mostly insoluble. This polymer is most likely a
levan as reported by Stepp et al.12, and Ramsay et al31 for other Bacillus licheniformis
strains.
In conclusion our chemical experiments point to the production of a water-insoluble
biopolymer by feeding starving NIPER 1A cells with our modified medium E.
In order to study the influence of cheap nutrients on the biopolymer sucrose was
replace by molasses (20 g/l) in some experiments. The results were very similar to the
case were sucrose was used as carbon source. Visual observation would suggest that
even more polymer was produced using molasses instead of sucrose. This result suggests
that commercial molasses are an economic alternative to the use of sucrose.

36
Task 3 -Testing of Microbial Systems in Porous Media
An important part of this research was to validate the concept that a microbial
surfactant-polymer system can be designed to advance current technology for improving
oil recovery from porous media in the laboratory. We did this in a series of experiments
designed to show advantages of concerted microbial polymer system blockage of watered
out high permeability zones and microbial surfactant-improved mobilization of oil from
oil-bearing zones. The two mechanisms for oil recovery that were developed in this
research program, increased oil mobility and profile modification, were tested
individually in coreflood experiments. Recovery and permeability reduction experiments
were performed in order to study the performance of the microbial systems. The
processes were then combined in more complex experiments to test the performance of
the combined system.
Subtask 3.1 - Microbial Transport
Before any MEOR technique, such as in-situ surfactant and gas production or flow
diversion, can be realized, a basic understanding of how bacteria are transported through
porous media and how their retention affects the permeability of the media is needed.
Bacterial transport through, and retention by, porous media differ from particle transport
because cells increase in number and can produce polysaccharides, which affect their
ability to adhere to surfaces.
Several research efforts point to the need of studying very careful the placement of
microbial systems for plugging high permeability areas45, 46, 47. For plugging higher-
permeability strata containing larger pore throats, Jack et al.45 demonstrated the
importance of using live, polymer-producing bacteria (e.g., biofilms) vs. dead,
metabolically inactive bacteria (i.e., particulates). Lappan and Fogler46 concluded that
insoluble polymers (i.e., dextran) produced by the bacterium Leuconostoc mesenteroides,
are largely responsible for losses in permeability they observed in high-permeability
ceramic cores. However, Jack et al.45 indicated that exopolymer-producing bacteria are
not ideally suited for injection into a porous matrix since they are highly retained at the
inlet face. Subsequently, Thompson and Jack47 patented a novel method for injecting L.
mesenteroides whereby the bacterial inoculum was grown in a nutrient medium

37
containing glucose that did not stimulate exopolymer production and then, fed a sucrose-
containing medium (e.g., molasses) to trigger exopolymer production in-situ.
Experiments were conducted in Berea sandstone cores to study microbial transport in
porous media. NIPER 11 and NIPER 1A cultures were used. The microbes shape and
size have significant influence on their transport properties. NIPER 11 is a small
spherical strain of Leuconostoc Mesenteroides, while NIPER 1A is a rod-shaped strain of
Bacillus licheniformis.
A modification of the set-up depicted in Figure 1 was used. Berea sandstone cores of
2.5 cm diameter and 25 cm lehgth were used. The Berea cores were placed in Hassler-
type core holders following the procedure already described in the experimental section.
NIPER 11 cultures were grown in tryptic soy broth medium and NIPER 1A in medium E
plus 0.1 wt% yeast extract added. An inoculum was prepared by centrifugation at 14,000
g for 20 minutes. The bottom, containing the live cells, was separated washed and added
to the medium to be used in injection and incubated at 33 oC for 72 hours.
A 1 ml inoculum of NIPER 11 was injected into 1% peptone solution where 10 g/l of
glucose as carbon source was added. This medium promotes growth, but not polymer
production. The inoculum concentration was determined by colony counting as 2 108
cells/ml. The cores were injected with 3 PV of inoculum at 20 ft/day, followed by 8 PV
of sterile brine at 20 ft/day. No increase in pressure was observed during the corefloods.
Figure 7 shows typical results. It was found that retention of NIPER 11 in the Berea core
is very high. This result agrees with the findings of Parli et al.48. In the case of NIPER
1A the inoculum concentration by colony counting was found to be 1.35 108 cells/ml.
The cores were injected with 1.2 PV of inoculum at 20 ft/day, followed by 8 PV of sterile
brine at 20 ft/day. No increase in pressure was observed during the corefloods. Typical
results are shown in Figure 8. The transport rate of NIPER 1A inside the Berea core was
very low, even lower that the transport rate of NIPER 11 cultures.
All the injections were of inoculum in a growth-promoting nutrient system. Parli et
al.48 indicated that transport efficiency increases when cells are injected in a nutrient
system. The nutrient system may lessen the electrostatic and hydrophobic effects of the
cell, or it may compete for adsorption sites on the porous medium, thus allowing a greater
number of cells to transport through the core48.

38
These results point to the need to find better procedures for microbial placement. In
the case of NIPER 1A we can take advantage of the fact that the microbe in situations of
nutrient depravation will form spores. The spores are 0.2-0.5 µm in diameter and 1-2 µm
in length, and can be injected without problem inside reservoirs with permeability as low
as 100 mDarcies. Appropriate nutrients can be injected after microbial placement in
order to activate cell growth and chemicals production13,44.
Subtask 3.2 - Improved Oil Mobility
The microbial surfactant system produces biosurfactants, which mobilize crude oil by
lowering the interfacial tension between aqueous and non-aqueous phases. In addition,
microorganisms produce a variety of primary metabolites such as, alcohols, organic
acids, and carbon dioxide, which can act synergistically with the surfactants by further
reducing interfacial tension and reducing oil viscosity. A series of coreflood experiments
were designed to test the microbial surfactant system for mobilizing residual crude oil in
porous media.
Recovery experiments were carried out using NIPER 1A and NIPER 11 cultures.
The experimental set-up is a modification of the one shown in Figure 1. Blocks of Berea
sandstone were obtained and cut in cylindrical shape, 25 cm in length and 2.5 cm in
diameter. The cores were encased in rubber sleeves and placed inside in Hassler
coreholders. Then, the Berea sandstone cores were evacuated and flushed with a brine
2% solution. Crude oil was injected into the cores until no additional water was
produced, about 24 hours. Then, brine was injected until no more crude oil was
produced. The core thus simulated a waterflooded ROS condition designated by Sorwf.
Oil samples were obtained from the Delaware-Childress field in northeastern
Oklahoma and from the Wilmington field in California. Delaware-Childress oil has a
gravity of 31 oAPI (0.87 g/cm3), and Wilmington 17 oAPI (0.97 g/cm3). The first
qualifies as a light/medium crude while the second was used as representative of heavy
oils.
The following experimental procedure was adopted. The Berea sandstone cores that
have been waterflooded to the residual saturation Sorwf, are prepared for microbial
injection. The pore volume of these cores varied from 25 to 30 ml. The cores were

39
injected with 0.2 PV of a bacterial cells solution (at a concentration of about 106 cells/ml)
in 1% peptone solution and 0.3 PV of medium E with 10% sugar solution and 0.1% yeast
extract. Glucose, molasses and sucrose solutions were used as sugars. The cores were
allowed to incubate at 33 oC for 1 week. The cores are flooded with brine at a rate of 0.3
to 0.6 m/day, and fractions of the core effluents were collected. The amount of oil in
each fraction was determined, and the residual oil in the core, Sorcf, was calculated. The
oil recovery efficiency (Er) was calculated using the following equation,
Er = (Sorwf - Sorcf) / Sorwf (20).
Effluent fluids were separated and the water phase was separated for further analysis.
Surface tension, viscosity and colony count measurements were conducted on the
separated water phase. The same procedure was followed for the NIPER 1A and the
NIPER 11 cultures.
Table 3 shows typical results of our recovery experiments using the two types of oils
and cores of different absolute permeability. NIPER 1A populations produced a
significant decrease in the solutions surface tensions while NIPER 11 cultures only
slightly change the surface tension of the produced solutions. NIPER 11 cultures
increase slightly the viscosity of the solutions while NIPER 1A cultures did not do so.
Similarly to the laboratory measurements no significant differences in population values
were observed between the two kinds of microbes using the same sugars as nutrients.
Sucrose and molasses performed better as nutrient than glucose, but acceptable values
were measured for the glucose solutions. NIPER 1A solutions showed better recovery
efficiency (Er) than the NIPER 11 ones.
No significant difference in permeability reduction was observed between
experiments conducted using low permeability and medium permeability cores. Slightly
better recovery was measured using medium permeability cores than low permeability
cores.
Oil recovery results are shown in Figures 9 and 10. The results in Figure 9 were
obtained using NIPER 1A samples while the results shown in Figure 10 were measured
using NIPER 11 samples. Both microbial samples show increase recovery as the injected
brine volume increases compared to the residual oil saturation after waterflooding.
Residual recovery efficiency (Er) in the NIPER 1A cultures was above 53% (Table 2).

40
NIPER 11 cultures showed lower, but still respectable recovery values. Recovery values
for molasses nutrient solutions were only slightly smaller than the sucrose values in the
NIPER 1A experiments and practically the same in the NIPER 11 experiments. The
recovery curves are very similar, but the main mechanism of oil recovery in the case of
NIPER 1A is interfacial tension reduction while in the case of NIPER 11A is improved
areal sweep efficiency. NIPER 1A samples are well-known producers of surfactant while
NIPER 11A cultures produce abundant amounts of dextran biopolymers.
Similar residual oil saturation curves were obtained when heavy oil samples were
used (Chaffee). The residual recovery efficiency was higher in this case for NIPER 1A
samples, 72.2%, than in the experiments done using NIPER 11, 47.1%. A possible
explanation could be the higher permeability of the core used in the experiments with
NIPER 11 cultures. The NIPER 11 microbes could only partially shut-off the high
permeability pores, therefore, a significant amount of by-pass led to lower recovery
efficiency. These results are similar to the ones reported by Bryant and Douglas35.
More complex recovery experiments were carried out to study possible nutrient
manipulation in order to produce a biopolymer using NIPER 1A cultures. The cores
were injected with 0.2 PV of a bacterial cells solution (at a concentration of about 106
cells/ml) in 1% peptone solution and 0.3 PV of medium E with 1% sucrose solution and
0.5% NaNO3 without yeast extract. The cores were allowed to incubate at 33 oC for 1
week. The experiments were carried out following the procedure described above.
Typical results are presented in Figure 11. In this case there is less recovery than in the
surfactant-producing mode. The surface tension of the water effluent is very close to
water without any surfactant. The interfacial tension between the recovered oil and the
water solution is also close to the value in absence of surfactants, 8 mN/m. The recovery
for NIPER 1A cultures using the modified growth medium is better than equivalent
values measured using NIPER 11, Figure 10. We can speculate that there is some
surfactant production that helps to mobilize the oil followed by biopolymer production
that contributes to conformance control. The combination of these two processes
produces better recovery than the conformance control alone produced by NIPER 11.
Some experiments were carried out taking the core after injection of 3.3 PV, and
injecting 0.3 PV of the modified medium E including NaNO3 as nitrogen source. After
41
the new nutrient injection more brine was added. Typical results of these experiments are
shown in Figure 12. The extra injection of nutrients seems to increase recovery even
when the increase is modest. The change in nutrients can produce in-situ some polymer
that helps to mobilized the oil ‘turned loose’ by the previous surfactant production.
Subtask 3.3 - Improved Sweep Efficiency
The purpose of the microbial polymer systems for improving oil recovery is to block
fluid flow through watered out thief zones in the reservoir and divert fluid flow into less
accessible regions of the reservoir. Polymer-producing bacteria identified in this study
were tested in coreflood experiments for their ability to reduce the permeability of porous
media. These tests were designed to test performance and limitations of the novel
microbial polymer system.
Coreflood experiments were conducted to determine permeability reduction due to in
situ biopolymer production. The experimental set-up is shown in Figure 1. Berea cores
were injected with the medium E growing medium, using glucose as carbon source.
Microbes were injected and left incubating for six days and permeability was determined.
Coreflood experiments were also carried out to determine residual resistance factors
(Frr). The aforementioned Berea cores were saturated with 0.5% brine solution and
injected with 1 PV sucrose-peptone medium inoculated with NIPER 11. The cores were
shut in for six days then flooded with brine, and flow rates and pressures were measured.
The residual resistance factors (Frr) were then calculated using the following equation,
Frr = (Qw/∆P)brine / (Qw/∆P)AfterMicrobialInjection (21), here Qw
is the flow rate, and ∆P is the pressure difference between fluid input and output. The
residual resistance factor is a measured of the stability of the biological plugging system
following nutrient treatment and brine flush. It is also described as the mobility of the
water-rich phase before treatment divided by the mobility of the water-rich after
treatment,
Frr = (k/µ)brine / (k/µ)AfterMicrobialInjection (22), where k
is the permeability and m is the viscosity of the flowing phase. Since the viscosity of the
flowing phase does not change significantly before and after treatment, the expression
simplifies to,

42
Frr = (k)brine / (k)AfterMicrobialInjection (23).
Figures 13 and 14 show the experimental results obtained for residual resistance
factors for NIPER 11 and 1A cultures. The best results were obtained using the
backpressure regulator shown in Figure 1. NIPER 11 produced a significant increase in
the residual resistance factors values for the entire range of flow values studied. The high
residual resistance factor values are explained by a high microbial growth rate inside the
core pores. These results were supported by permeability measurements before and after
microbial injection. The residual resistance factor values decreased as the volumetric
flow rate increased. This behavior is attributed to looser microbial attachment to the
solid surface as flow rate increases. No significant differences in the experimental results
were observed changing the nutrient sugar.
Figure 14 shows equivalent results for NIPER 1A cultures. Residual resistance factor
values measured for NIPER 1A cultures were significantly lower than the ones measured
for NIPER 11. It seems that NIPER 1A microbes only change the porosity of the cores
due to cellular growth and not by high production of biopolymers as NIPER 11 cultures.
Experiments were also carried out using NIPER 1A cultures, and the modified
medium E without yeast extract, 10 g/l sucrose as carbon source, and 5 g/l of NaNO3 as
nitrate source. These cultures were found to produce a levan biopolymer when
fermenting sucrose in absence of ammonium ion and yeast extract. Figure 15 shows
typical results of these experiments. The residual resistance factor for NIPER 1A
cultures feeding on the modified medium E plus sucrose and NaNO3 as nitrate source is
almost three times as big as the values for the complete medium E plus yeast extract. The
difference is attributed to increase permeability reduction produced by the formation of
biopolymer by NIPER 1A under the modified culture medium. These results confirm the
conclusions drawn in the chemical analysis section. NIPER 1A cultures can produce a
biopolymer by nutrient manipulation. The product of this nutrient manipulation is an
insoluble biopolymer that can reduce permeability in cores.

43
Task 4 -Process Simulation
Subtask 4.1 - UTCHEM Simulator
A copy of UTCHEM, a chemical simulator developed by researchers at the
University of Texas at Austin (Saad, 198940, Delshad et al., 200241) was used by
researchers at Prairie View A&M University in this research. The simulator was used to
model experiments and evaluate alternative treatments. Simulations were conducted to
model oil mobilization by surfactant-producing microorganisms, and study permeability
modification by microbial polymer systems.
The UTCHEM simulator does not have the ability to perform the required
calculations in a single step; therefore, the required simulations should be obtained using
a combination of steps. The microbial population was assumed to be already present in
the simulation domain at a given base value. Nutrient injection was used to take the base
value to the desired population value. The base value could be given as a concentration
profile to simulate transport through the porous medium. The simulator accounts for cell
growth, loose and attached, but does not take into account the porosity reduction by
insoluble polymer production. This process was simulated by increasing cell size by a
given factor. Biosurfactant production was simulated by using surfactant injection. The
microbial injection, nutrient injection, growth, and bioproducts production should be
simulated in several different steps using the fact that the simulator can be stopped,
results recorded and a restart data file prepared. A typical procedure for injection of a
surfactant producing bacteria followed by nutrient injection, incubation and waterflood is,
1. Simulated injection.
2. Nutrient injection.
3. Growth step.
4. Waterflood plus surfactant injection.
The waterflood should be accompanied of a surfactant injection step to simulate in-
situ biosurfactant production.
Several microbial/nutrient coreflood experiments were simulated. In all simulations,
a 10-inch length, and 1 inch diameter core was used. NIPER 1A and NIPER 11 were the
chosen microorganisms. A typical experiment for NIPER 1A was, injection of the core

44
with 0.1 pore volume of microbes, and nutrient (4% molasses) followed by injection of
0.2 pore volumes of nutrient. The core was then shut-in for three days before the
initiation of waterflood.
Parameters of the microbial system used in these simulations were determined from
laboratory experiments or from simulation matches of laboratory tests using the
developed microbial transport model by Chase et al.49, and Chang et al.50. A maximum
growth rate of 8.4 day-1 was determined for microorganism NIPER 1A in the laboratory.
The decay rate constant measured from the population change during the period of 600
hours is 0.22 day-1. The cell yield coefficient, Y, of 0.5 is computed from the nutrient
consumption rate. The relative permeability values used were determined from a
microbial coreflood in the laboratory47. Table 4 lists the core information, and microbial
system parameters used in the simulation.
Figure16 shows the microbial population distribution along the Berea core after
injection of 2 and 5 PV. The microbial population decreases along the core and
waterflood due to the loss of microbes to rock adsorption. The distribution is more
homogeneous as the water injection increases due to microbial transport through the core.
Similar results are shown in Figure 17 for the nutrient concentration. The nutrient
concentration decreased with length due to adsorption to the solid while it decreased with
waterflood because of the microbial consumption. The profile becomes more
homogeneous as the injection process progresses. Oil saturation profiles at different
injection times are shown in Figure 18. The oil amount decreased constantly after the
water injection started.
The reduction in permeability caused by microbial growth is shown in Figure 19.
The permeability decreases following closely the microbial concentration profiles. It is
higher where the microbial concentration is higher. It also becomes more homogeneous
as the microbial distribution becomes more homogeneous. The permeability reduction
values are also small reflecting the fact that NIPER 1A is a poor polymer producer in this
simulation. Figure 20 depicts the interfacial tension (IFT) profile along the core. There
is also in this case a close relationship to the microbial concentration profile. The
interfacial tension decreases as the microbial population increases. In some areas the IFT
remains low despite the fact that the microbial population is also low due to transport of

45
the biosurfactant through the core. Reed and Healy51 reported that an interfacial tension
between oil and brine must reach 0.1 mN/m before any oil displacement begins and
values of 0.01 mN/m or less are necessary for substantial oil production. Therefore, we
can say based upon the criteria stated by Reed and Healy51 that there is surfactant
production only in the front third of the core length. The surfactant is transported
throughout the second third, and its concentration is very small in the last third.
Some simulations were run using data corresponding to NIPER 11. NIPER 11 is a
good polymer-producing microorganism; therefore, it produced higher permeability
reduction than NIPER 1A. An example of this behavior is shown in Figure 21. The
permeability is smaller in the front part of the core due to a non-homogeneous microbial
population profile. The pore-blocking effect of the biopolymer was simulated by
increasing the microorganisms size. The increased size was estimated using data taken
from Jenneman et al.30. A comparison between experimental data and simulation results
for oil recovery by a NIPER 11 culture is shown in Figure 22. The simulation results
predict correctly the shape of the recovery curve. However, the predicted results are
smaller than the measured data.
A proposed recovery strategy using NIPER 1A capacity of producing surfactant and
polymer was simulated. This recovery strategy was simulated using the following steps:
1. Simulated injection.
2. Nutrient injection.
3. Growth step.
4. Waterflood plus surfactant injection.
5. Second nutrient injection.
6. Waterflood with polymer production.
Figure 23 shows the simulation results. Better recovery was obtained by switching to
polymer production after the oil has been mobilized by decreasing capillary forces by
biosurfactant production. This recovery strategy is equivalent to have a surfactant flood
followed by a polymer sweep and it has been recognized as able to significantly improve
oil recovery52. Simulated results agreed well with experimental results. Better agreement
was achieved simulating the biosurfactant production than the biopolymer production.

46
The simulations results show that the UTCHEM simulator can be used as an effective
tool to study microbial enhanced oil recovery. These results also show that metabolically
controlled biochemical production can lead to better oil recovery.
CONCLUSIONS
Two microbial strains, NIPER 1A and NIPER 11 were studied for their ability to
produce biosurfactants and biopolymers when metabolically stimulated. Growth
experiments showed that both microorganisms grow well on several culture media.
NIPER 1A, surfactant producer, and NIPER 11, polymer producer, showed a lifetime
cycle of more than 9 months when provided enough amount of nutrients. The lifecycle of
both microorganisms reproduces the classical periods for bacterial growth.
NIPER 11 produces copious amount of biopolymer when fermenting sucrose; while it
grows well, but it does not produce polymer when using glucose as carbon source.
NIPER 1A produces good amount of biosurfactant when vitamins, enzymes and adequate
nitrogen sources are available. Ammonium salts should be used as nitrogen source in this
case plus yeast extract or trypticase/tryptone nutrients. NIPER 1A can produce some
amount of biopolymer when grown from initial starvation conditions using sucrose as
carbon source and sodium nitrate as nitrogen source without the vitamins, enzymes
already mentioned. This finding allows alternate production of biosurfactant and
biopolymer by metabolic control of NIPER 1A.
Commercial molasses can be used as carbon source with results similar to those using
sucrose. Replacement of sucrose by molasses should result in significant economic
savings.
Viscosity measurements showed that the biopolymer produced by NIPER 11 was
practically insoluble in an aqueous phase. The biopolymer produced by NIPER 1A was
also found to be insoluble in water solutions. NIPER 11 produces an insoluble polymer
that causes significant permeability reduction, but it does not produce significant amounts
of biosurfactant. NIPER 1A under the appropriate conditions produces a surfactant that
can significantly reduce the interfacial tension between an aqueous phase, and an oil
phase. Metabolic control of NIPER 1A produces a polymer that was found to reduce
permeability in Berea cores. The measured permeability reduction is smaller than the

47
values measured for NIPER 11, but higher than the data measured for surfactant-
producing NIPER 1A cultures.
The residual recovery curves were similar for NIPER 1A and NIPER 11 samples
using both light and heavy oils. Medium permeability cores produced more recovery
than low permeability cores. High surfactant production is the main recovery mechanism
during the NIPER 1A recovery experiments while improved sweep efficiency is the main
recovery mechanism during the NIPER 11 experiments. These conclusions are supported
by low surface tension values during the NIPER 1A experiments and higher residual
resistance factors during the NIPER 11 experiments.
NIPER 11 and NIPER 1A have low transport rates through the Berea cores. Specific
strategies should be used to assure homogeneous distribution of microbial population.
Growth of NIPER 11 using glucose as carbon source, and injection of NIPER 1A spores
inside the porous medium; followed by nutrient stimulation seem to be the most
appropriate placement strategies.
The UTCHEM commercial simulator can be used to simulate recovery processes
including, microbial injection, nutrient injection, bio-products formation and waterfloods.
The simulation should consist of several independent steps, modeled to achieve the
desired effect.
Simulation results showed importance of microbial placement and microbial transport
in porous media. The microbes tend to attach at the front of the core reducing
permeability in that zone while the rest of the core does not show significant permeability
reduction. Permeability reduction and surfactant production are mostly related to
microbial population than to transport through the porous medium.
A recovery process combining several steps that resemble traditional surfactant-
polymer flooding processes leads to improve recovery. This process includes, microbial
injection, nutrient injection, microbial growth, surfactant production, nutrient activation
and polymer production.
In conclusion: NIPER 1A cultures can produce a biopolymer by nutrient
manipulation. The product of this nutrient manipulation is an insoluble biopolymer that
can reduce permeability in cores. This property can be used to design better oil recovery
processes.

48
REFERENCES
1. Donaldson, E. C.; Chilingarian, G. V.; Yen, T. F. and –Sharma, M. K., “Chapter 1. Introduction” in Enhanced Oil Recovery, II, Processes and Operations, published by ELSEVIER – Amsterdam – Oxford – New York – Tokyo, 1-12, 1989.
2. Bryant, R. S.; Donaldson, E. C.; G. V.; Yen and Chilingarian, G. V., “Chapter 14. Microbial Enhanced Oil Recovery,” in Enhanced Oil Recovery, II, Processes and Operations, published by ELSEVIER – Amsterdam – Oxford – New York – Tokyo, 423-450, 1989.
3. Beckman, J. W., Ind. Eng. Chem., 4(10),3, 1926.
4. ZoBell, C. E., “Bacteriological Process for Treatment of Fluid-Bearing Earth Formations,” U.S. Patent, No 2,413,278, Dec.24, 1946.
5. ZoBell, C. E., “Bacteria release of Oil from Sedimentary Materials,” Oil Gas J., 46(13), 62 (1947).
6. ZoBell, C. E., “Recovery of Hydrocarbons,” U.S. Patent, No 2,641,566, June 9, 1953.
7. Moses, V.; Robinson, J. P.; and Springham, D. G., “Microbial Enhancement of Oil Recovery in North Sea Reservoirs: A Requirement for Anaerobic Growth on Crude Oil,” in Proceedings, International Conference on Microbial Enhancement of Oil Recovery, Oklahoma, May 16-21, 1983.
8. Bryant, R. S., Stepp, A. K.; Bertus, K. M.; Burchfield, T. E. and Dennis, M., “Microbial enhanced waterflooding field tests,” Proc. of the 1994 SPE/DOE Improved Oil Recovery Symposium, April 17-20, 1994, Tulsa, OK, SPE/DOE Paper No. 27751.
9. Bryant, R. S., Stepp, A. K.; Bertus, K. M.; Burchfield, T. E. and Dennis, M., “Microbial enhanced waterflooding field pilots.” DOE Report NIPER-EPR/OP-93/8. 1993.
10. Lin, S. C., Sharma, M. M. and Georgiou, G., “Production and deactivation of biosurfactant by Bacillus licheniformis JF-2,” Biotechnol. Prog. 9:138-145, 1993.
11. Stepp, A. K.; Bryant, R. S.; Llave, F. M. and Lindsey, R. P., “Biopolymer system for permeability modification in porous media,” Proc. of The Fifth

49
International Conference on Microbial Enhanced Oil Recovery and Related Biotechnology for Solving Environmental Problems, September 11-14, 1995, Plano, TX.
12. Stepp, A. K., Bryant; R. S.; Llave, F. M.; Evans, D. B. and Bailey, S. A., “Microbial methods for improved conformance control in porous media,” Proc. of the SPE/DOE Improved Oil Recovery Symposium, April 21-24, 1996, Tulsa, OK, SPE Paper 35357, 1996.
13. Cusack, F., Singh, S.; McCarthy; C.; Grieco, J.; De Rocco, M.; Nguyen, D.; Lappin-Scott, H. and Costerton, J. W., “Enhanced oil recovery - three-dimensional sandpack simulation of ultramicrobacteria resuscitation in reservoir formation,” J. Gen. Microbiol., 138:647-655, 1992.
14. Bryant, R. S., and Burchfield, T. E., “Review of Microbial Technology for Improving Oil Recovery,” SPE Res. Eng. (May):151-154, 1989.
15. Singer, M. E., “Microbial Biosurfactants,” in Microbes and Oil Recovery, Bioresources Publications, El Paso, Texas, 19-38, 1985.
16. Brown, L. R., Vadie, A. A.; Stephens, J. O. and Azadpour, A., “Enhancement of the sweep efficiency of waterflooding operations by the in-situ microbial population of petroleum reservoirs,” Proc. of The Fifth International Conference on Microbial Enhanced Oil Recovery and Related Biotechnology for Solving Environmental Problems, September 11-14, 1995, Plano, TX.
17. Jenneman, G. E., Gevertz, D.; Davey, M. E., Clark, J. B.; Wood, W. A.; Stevens, J. C. and Tankersley, C., “Development and application of microbial selective plugging processes,” Proc. of The Fifth International Conference on Microbial Enhanced Oil Recovery and Related Biotechnology for Solving Environmental Problems, September 11-14, 1995, Plano, TX.
18. Cooper, D.G., “Biosurfactants,” Microbiology Science, 3:145-149, 1986.
19. Syldatk, C. and Wagner, F., “Production of Biosurfactants. In: Biosurfactants and Biotechnolog,” Kosaric, N., Cairns, W.L., and Gary, N. C. C. (Eds). Marcel Decker, Inc., New York, 1987.
20. Riser-Roberts, E., Bioremediation of Petroleum Contaminated Sites, Boca Raton: C.K. Smoley. pp. 15-26, 1992.
21. Rosen, M.J., Surfactants and Interfacial Phenomena, 2nd edition John Wiley & Sons Inc. , New York., 1989.

50
22. Guerra-Santos, L. H.; Kappeli, O.; and Fiecher, A. “Dependence of Pseudomonas-aeruginosa continuous culture biosurfactant production on nutritional and environmental factors,” Appl. Microbiol. Biotechnol., 123, 1986.
23. Arima, K.; Kakinuma, A.; and Tamura, G., “Surfactin, a crystalline peptidelipid surfactant produced by Bacillus subtilis: isolation, characterization and its inhibition of fibrin clot formation,” Biochem. Biophys. Res. Com. 31:488-494, 1968.
24. Zajic, J.E.; Guignard, H.; and Gerson, D.F., “Properties and biodegradation of a bioemulsifier from Corynebacterium hydrocarboclastus,” Biotechnol. Bioeng. , 19:1303-1320, 1977.
25. Finnerty, W.R.; and Singer, M.E., “A Microbial Biosurfactant - Physiology, Biochemistry, and Applications,” Dev. Ind. Microbiol., 1984.
26. Horowitz, S.; Gilbert, J.N.; and Griffin, W.M., “Isolation and characterization of a surfactant produced by Bacillus licheniformis,”, J. Ind. Microbiol., 6:243-248, 1990.
27. Beebe, J.L.; and Umbreit, W.W., “Extracellular lipid of Thiobacillus thioxidants,” J. Bacteriol., 82:788-789, 1971.
28. Javaheri, M.; Jenneman, G. E.; McInerney, M. J., and Knapp, R. M., “Anaerobic Production of a Biosurfactant by Bacillus licheniformis JF-2,” Applied and Environ. Microbiology, 698-799, 1985.
29. McInerney, M.J.; Javaheri, M.; and Nagle, D.P., “Properties of the biosurfactant produced by Bacillus licheniformis strain JF-2.J,” Ind. Microbiol. 5:95-102, 1990.
30. Jenneman, G. E.; Lappan, R. E.; and Webb, R. H., “Bacterial Profile Modification with Bulk Dextran Gels Produced by In-Situ Growth and Metabolism of Leuconostoc Species,” SPE Journal, 5(4), 466-473, 2000.
31. Ramsay, J. A.; Cooper, D. G. and Neufeld, R. J., “Effects of oil reservoir conditions on the production of water-insoluble levan by Bacillus licheniformis,” Geomicrobiol. J. 7:155-165, 1989.
32. Bryant, R. S.; Burchfield, T. E.; Chase, K. L.; Bertus, K. M. and Stepp, A. K.,. “Optimization of microbial formulations for oil recovery: mechanisms of oil mobilization, transport of microbes and metabolites, and effects of additives,”

51
Proc of the 64th Annual Technical Conference and Exhibition of the Society of Petroleum Engineers, October 8-11, San Antonio, TX, SPE Paper 19686.
33. Lin, S. C.; Minton, M. A.; Sharma. M. M.; and Georgiou, G., “Structural and immunological characterization of a biosurfactant produced by Bacillus licheniformis JF-2,” Applied Environ. Microbiology, 60, 31-38, 1994.
34. Bae, J. H., Chambers, K. T.; and Lee, H. O., “Microbial profile modification using spores,” Presented at the 69th Annual Technical Conference and Exhibition of the Society of Petroleum Engineers, September 25-28, New Orleans, LA, SPE Paper 28617, 1994.
35. Bryant, R. S. and Douglas, J., “Evaluation of Microbial Systems in Porous Media for Enhanced Oil Recovery,” SPE Reservoir Engineering, SPE Paper 16284, May 1988.
36. Fujimoto. Y. ‘Kinetics of microbial growth and substrate consumption.” J. Theo. Biol., 5: 171-191, 1963.
37. Gaudy, A. F., Jr., E. T. Gaudy. “Microbiology for Environmental Scientists and Engineers,” McGraw Hill Book Co., New York, 1980.
38. National Research Council. “In Situ Bioremediation.” Water Science and Technology Board. Washington, D.C. National Academy Press, 1993.
39. Tsouris, C., “Interfacial Surface Tension Determination,” private communication, 2003.
40. Saad, N., “Field Scale Simulation of Chemical Flooding,” Ph. D. Dissertation, University of Texas, 1989.
41. Delshad, M.; Asakawa, K.; Pope, G. A.; and Sepehrnoori, K., “Simulations of Chemical and Microbial Enhanced Oil Recovery Methods,” SPE paper No 75237, presented in the SPE/DOE Improved Oil Recovery Symposium held in Tulsa, Oklahoma, 13-17, April 2002.
42. Nelson, R. C. and Pope G. A. “Phase Relationships in Chemical Flooding,” Society of Petroleum Engineering Journal, 18, 325-338(1978).
43. Hirasaki, G. J. “Application of the Theory of Multicomponent, Multiphase Displacement to Three-Component, Two-Phase Surfactant Flooding,” Society of Petroleum Engineering Journal, 21, 191-204(1981).

52
44. Lappin-Scott, H.; Cusack, F.; and Costerton, J. W., “Nutrient resuscitation and growth of starved cells in sandstone cores: A novel approach to enhanced oil recovery ,” Applied Environ. Microbiology, 54, 1373-1382, 1988.
45. Jack, T. R. et al., “Microbial Plugging of Enhanced Oil Recovery,” Microbial Enhanced Oil Recovery, Developments in Petroleum Science, E. C. Donaldson, G. V. Chiligarian, and T. F. Yen (eds.), Elsevier Science Publishers, Amsterdam, 2, 125, 1993.
46. Lappan, R. E.; and Fogler, H. S., “Effect of Bacterial Polysaccharide Production on Formation Damage,” SPEPE, (May), 167, 1992.
47. Thompson, B. G.; and Jack, T. R., “Method of Enhancing Oil Recovery by Use of Exopolymer-Producing Microorganisms,” U.S. Patent No 4,561,500, 1985.
48. Parli, J. A.; Stepp, A. K.; Evans, D. B.; Bryant, R.S.; and Jenneman, G.E., “Transport and Stability of Polymer-Producing Bacteria in Porous Media,” SPE paper No 39670, presented in the SPE/DOE Improved Oil Recovery Symposium, 19-22 April, Tulsa, Oklahoma, 1998.
49. Chase, K.L., R.S. Bryant, and T.E. Burchfield, K.M. Bertus, and A.K. Stepp, “Investigation of Microbial Mechanisms for Oil Mobilization in Porous Media.” Pres. at 1990 International Conference on Microbially Enhanced Oil Recovery, May 27 - June 1, 1990.
50. Chang, M-M., F. T. Chung, R.S. Bryant, H.W. Gao, and T.E. Burchfield, “Modeling and Laboratory Investigation of Microbial Transport Phenomena in Porous Media,” SPE paper No 22845. Pres. at the 66th SPE Annual Conference at Dallas, TX, Oct. 6-9, 1991.
51. Reed, R. L., and Healy, R. N., “Some Physicochemical Aspects of Microemulsion Flooding: A Review,” in D. O. Shah and R. S. Schechter, eds., Improved Oil Recovery by Surfactants and Polymer Flooding, Academic Press Inc., New York, 1977.
52. Alban, N., “Surfactant-Polymer Interactions in Oil Recovery,” Master Thesis, Prairie View A&M University, 2001.
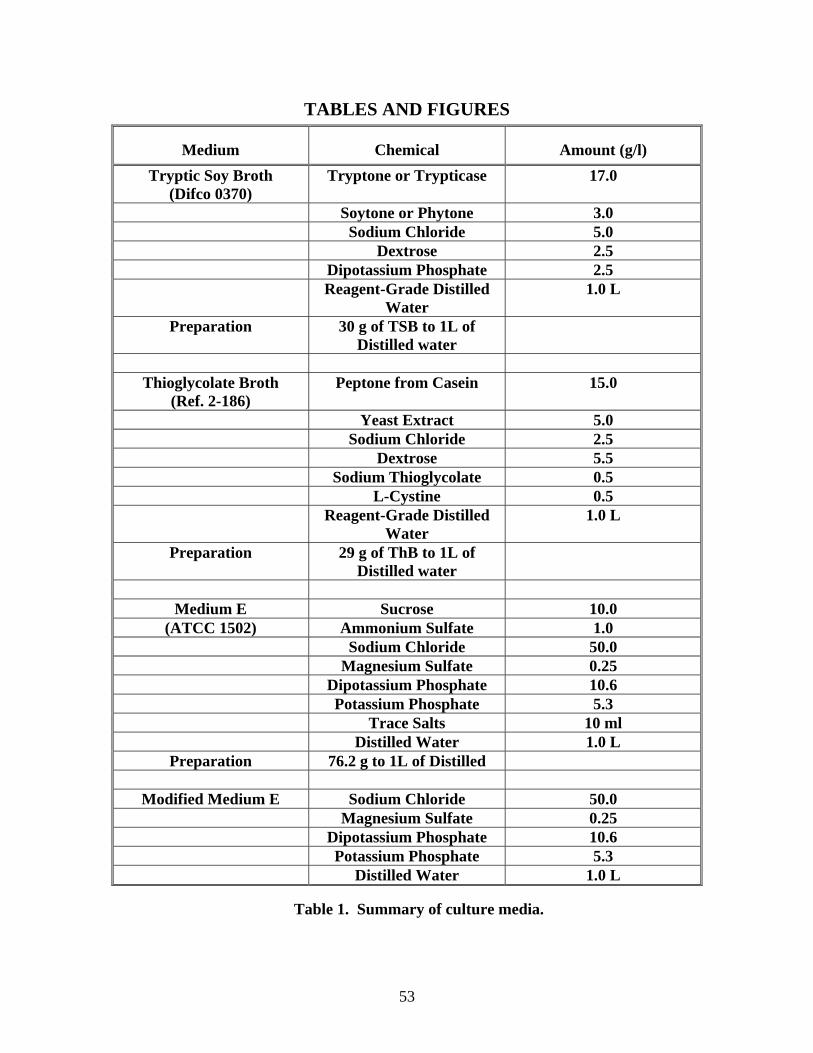
53
TABLES AND FIGURES
Medium Chemical Amount (g/l) Tryptic Soy Broth
(Difco 0370) Tryptone or Trypticase 17.0
Soytone or Phytone 3.0 Sodium Chloride 5.0 Dextrose 2.5 Dipotassium Phosphate 2.5 Reagent-Grade Distilled
Water 1.0 L
Preparation 30 g of TSB to 1L of Distilled water
Thioglycolate Broth
(Ref. 2-186) Peptone from Casein 15.0
Yeast Extract 5.0 Sodium Chloride 2.5 Dextrose 5.5 Sodium Thioglycolate 0.5 L-Cystine 0.5 Reagent-Grade Distilled
Water 1.0 L
Preparation 29 g of ThB to 1L of Distilled water
Medium E Sucrose 10.0
(ATCC 1502) Ammonium Sulfate 1.0 Sodium Chloride 50.0 Magnesium Sulfate 0.25 Dipotassium Phosphate 10.6 Potassium Phosphate 5.3 Trace Salts 10 ml Distilled Water 1.0 L
Preparation 76.2 g to 1L of Distilled
Modified Medium E Sodium Chloride 50.0 Magnesium Sulfate 0.25 Dipotassium Phosphate 10.6 Potassium Phosphate 5.3 Distilled Water 1.0 L
Table 1. Summary of culture media.

54
Microbe
Time
Nutrient
SPC/ml (c.f.u.)
Viscosity (cp)
Surface Tension (mN/m)
NIPER 1A 1 week Molasses 1.10E+07 1.05 29 NIPER 1A 1 week Sucrose 1.20E+07 1.08 28 NIPER 1A 1 week Glucose 3.50E+06 1.05 51 Blank 1 week NA NA 1.02 68 NIPER 11 1 week Molasses 1.15E+07 1.187 62 NIPER 11 1 week Sucrose 1.20E+07 1.176 64 Blank 1 week NA NA 1.020 68
Table 2. Summary of typical laboratory experiments.
Oil Microbe Sugar k (md)
SPC/ml Viscosity (cp)
Surface Tension (mN/m)
Sorwf (%PV)
Sorcf (%PV)
Er (%)
Delaware-Childers
NIPER 1A
Sucrose 180 2.1E+6 1.0 29 25 11.7 53.2
Delaware-Childers
NIPER 1A
Molasses 165 1.9E+6 1.0 31 24.5 11.3 53.9
Delaware-Childers
NIPER 1A
Glucose 152 1.1E+6 1.05 52 25.4 18.7 57.9
Delaware-Childers
NIPER 11
Sucrose 446 1.6E+6 1.2 66 23.6 14.9 36.9
Delaware-Childers
NIPER 11
Molasses 465 1.5E+6 1.25 64 24.8 15.8 36.3
Delaware-Childers
NIPER 11
Glucose 411 1.45E+6 1.2 63 26.1 17.4 37.2
Chaffee NIPER 1A
Sucrose 432 1.5E+6 1.03 29 39.7 11.1 72.0
Chaffee NIPER 11
Sucrose 716 1.4E+6 1.3 64 42.0 22.2 47.1
Table 3. Summary of typical recovery coreflood experiments.

55
Parameters Values Core Volume 128.6 cm3 Pore Volume 27.8 cm3 Porosity 0.216 Permeability 526 mD Injection rate 1.5 (ft/day) Diffusion coefficient, microbes 0.0055 ( ft2/day) Diffusion coefficient, nutrient
0.0083 (ft2/day)
Declogging rate constant 37 (day-1) Cell yield coefficient (Y) 0.5 Monod half growth constant 0.5 or 6.23 (lb/ft3) Maximum growth rate 8.4 (day-1) Decay rate 0.22 (day-1) Chemotaxis Coefficient 0
Table 4. Microbial system parameters used in NIPER 1A simulations
Figure 1. Experimental set-up for oil recovery experiments.
Fluid Separators
Test Core
Back Pressure Regulator
Fluid Delivery
Pump
Water
Pressure Pump
Output to Collectio
Ball Valve

56
1.0E+05
1.0E+06
1.0E+07
1.0E+08
0 2 4 6 8 10 12
Time (months)
Popu
latio
n C
ount
(cf
u/m
il Tryptic Soy BrothThyoglycolate Broth
Figure 2. Lifetime cycle for NIPER 1A microorganisms in different culture media.
1.0E+01
1.0E+02
1.0E+03
1.0E+04
1.0E+05
1.0E+06
1.0E+07
1.0E+08
0 10 20 30 40 50 60 70 80 90
Time (hours)
Popu
latio
n C
ount
(cf
u/m
il
GlucoseSucroseMolasses
Figure 3. Growth curve for NIPER 1A microorgamisms, and different carbon
sources.
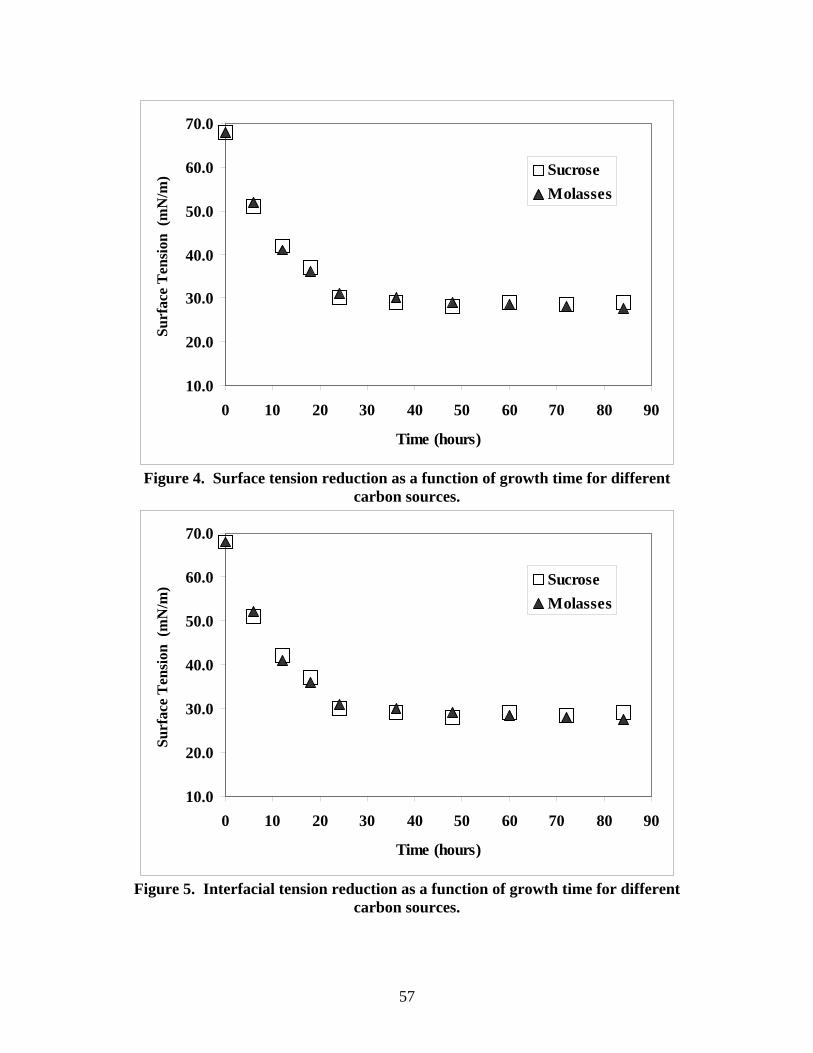
57
10.0
20.0
30.0
40.0
50.0
60.0
70.0
0 10 20 30 40 50 60 70 80 90
Time (hours)
Surf
ace
Ten
sion
(m
N/m
) SucroseMolasses
Figure 4. Surface tension reduction as a function of growth time for different
carbon sources.
10.0
20.0
30.0
40.0
50.0
60.0
70.0
0 10 20 30 40 50 60 70 80 90
Time (hours)
Surf
ace
Ten
sion
(m
N/m
) SucroseMolasses
Figure 5. Interfacial tension reduction as a function of growth time for different
carbon sources.

58
0.0
2.0
4.0
6.0
8.0
10.0
0 1 2 3 4 5 6
NaCl (wt%)
Inte
rfac
ial T
ensi
on (
mN
/mHexaneDecaneToluene
Figure 6. Interfacial tension reduction as a function of brine concentration for
different oil phases.
Figure 7. NIPER 11 retention in Berea cores, 3 PV microbial injection.
0.00
0.05
0.10
0.15
0 1 2 3 4 5 6 7 8 9 10 11 12
Fluid Injected, PV
Nor
mal
ized
Cel
l Cou
nts,
(cel
ls/m
l )
Microbial Injection
Brine Chaser

59
Figure 8. NIPER 1A retention in Berea cores, 1.2 PV microbial injection.
0
5
10
15
20
25
30
0 0.5 1 1.5 2 2.5 3 3.5
Injected Pore Volume
Sorf
c (%
PV)
SucroseMolasses
Figure 9. Residual oil saturation versus injected PV for NIPER 1A cultures.
0.00
0.05
0.10
0.15
0 1 2 3 4 5 6 7 8 9 10 11
Fluid Injected, PV
Nor
mal
ized
Cel
l Cou
nts,
(cel
ls/m
l )Microbial Injection
Brine Chaser

60
10
12
14
16
18
20
22
24
26
0 1 2 3 4
Injected Pore Volume
Sorf
c (%
PV)
Sucrose
Figure 10. Residual oil saturation versus injected PV for NIPER 11 cultures.
10
12
14
16
18
20
22
24
26
0 1 2 3 4 5
Injected Pore Volume
Sorf
c (%
PV)
NIPER 1A Nutrient Change
Figure 11. Residual oil saturation versus injected PV for NIPER 1A cultures using
modified medium E plus sodium nitrate.

61
0
5
10
15
20
25
30
0 1 2 3 4 5 6 7
Injected Pore Volume
S orf
c (%
PV)
MolassesNutrient change
Figure 12. Residual oil saturation versus injected PV for NIPER 1A cultures using
a combination of nutrients.
0
5
10
15
20
25
30
35
40
45
0.0E+00 5.0E-04 1.0E-03 1.5E-03 2.0E-03 2.5E-03
Volumetric Flow Rate, m3/Day
Res
idua
l Res
ista
nce
Fact
or, F
rr NIPER 11
Figure 13. Residual resistance factor as a function of volumetric flow for NIPER 11
cultures.

62
0.0
0.5
1.0
1.5
2.0
2.5
3.0
3.5
0.0E+00 5.0E-04 1.0E-03 1.5E-03 2.0E-03 2.5E-03
Volumetric Flow Rate, m3/Day
Res
idua
l Res
ista
nce
Fact
or, F
rr
NIPER 1A
Figure 14. Residual resistance factor as a function of volumetric flow for NIPER 1A
cultures using medium E plus yeas extract.
4.0
6.0
8.0
10.0
12.0
14.0
16.0
18.0
0.0E+00 5.0E-04 1.0E-03 1.5E-03 2.0E-03 2.5E-03
Volumetric Flow Rate, m3/Day
Res
idua
l Res
ista
nce
Fact
or, F
rr
NIPER 1A(Biopolymer)
Figure 15. Residual oil saturation versus injected flow rate for NIPER 1A cultures
using sodium nitrate.
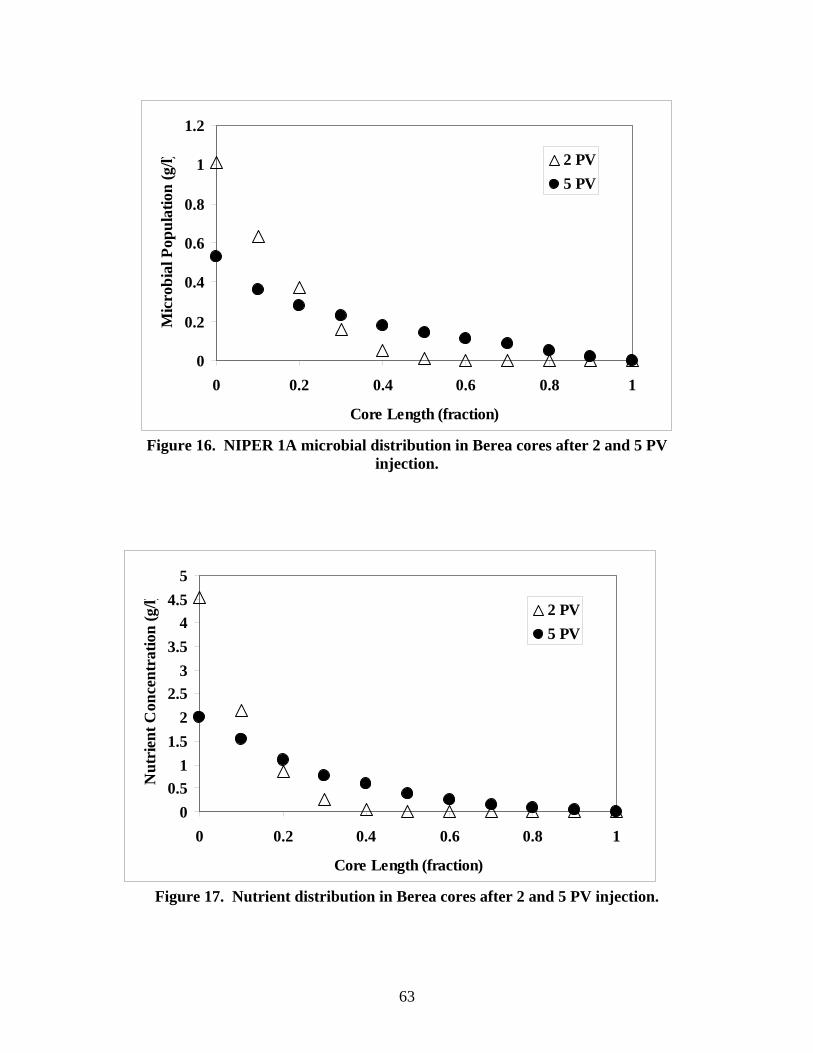
63
0
0.2
0.4
0.6
0.8
1
1.2
0 0.2 0.4 0.6 0.8 1
Core Length (fraction)
Mic
robi
al P
opul
atio
n (g
/l) 2 PV5 PV
Figure 16. NIPER 1A microbial distribution in Berea cores after 2 and 5 PV
injection.
00.5
11.5
22.5
33.5
44.5
5
0 0.2 0.4 0.6 0.8 1
Core Length (fraction)
Nut
rien
t Con
cent
ratio
n (g
/l) 2 PV5 PV
Figure 17. Nutrient distribution in Berea cores after 2 and 5 PV injection.

64
0
0.2
0.4
0.6
0.8
1
0 0.2 0.4 0.6 0.8 1
Core Length (fraction)
Oil
Satu
ratio
n
Initial2 PV5 PV
Figure 18. Oil saturation profiles for different injection volumes.
0.94
0.96
0.98
1
0 0.2 0.4 0.6 0.8 1
Core Length (fraction)
Perm
eabi
lity
Red
uctio
n (fr
actio
n)
2 PV5 PV
Figure 19. Permeability reduction in Berea cores after 2 and 5 PV injections.

65
0.001
0.01
0.1
1
10
100
0 0.2 0.4 0.6 0.8 1
Core Length (fraction)
Inte
rfac
ial T
ensi
on (m
N/m
Initial2 PV5 PV
Figure 20. Interfacial tension profiles in Berea cores for different injection volumes.
0.600
0.700
0.800
0.900
1.000
0 0.2 0.4 0.6 0.8 1
Core Length (fraction)
Perm
eabi
lity
Red
uctio
n (f
ract
ion
2 PV
Figure 21. Permeability reduction profile in the Berea core after 2 PV injection for
a NIPER 11 culture.

66
10
12
14
16
18
20
22
24
26
0 1 2 3 4 5
Injected Pore Volume
Sorf
c (%
PV)
Experimental DataSimulation Results
Figure 22. Comparison of experimental and simulation results for oil recovery by
NIPER 11.
Figure 23. Comparison of experimental and simulation results for oil recovery by
NIPER 1A.
0
5
10
15
20
25
30
0 1 2 3 4 5 6 7
Injected Pore Volume
S orf
c (%
PV)
Experimental DataSimulation Results
Microbial Injection
Nutrients Water Chaser

67
COMBINED MICROBIAL SURFACTANT-POLYMER SYSTEM FOR
IMPROVED OIL MOBILITY AND CONFORMANCE CONTROL
PROJECT INFORMATION PUBLICATIONS AND PRESENTATIONS
Enayet, Sh., and Gabitto, J. F., “Alternative Production of Biosurfactants and
Biopolymers by Metabolic Manipulation,” submitted for publication to Canadian Journal
of Petroleum Technology, 2005.
Gabitto, J. F., “Combined Microbial Surfactant-Polymer System for Improved Oil
Recovery,” paper presented at the Annual Meeting of the AIChE , Austin, TX, November
2004.
Eta, O., Rame, M., and Gabitto, J. F., “Combined Microbial Surfactant-Polymer
Strategies for Improved Oil Recovery,” paper presented at the Annual Meeting of the
AIChE, San Francisco, CA, November 2003.
STUDENTS
Mr. Oscar Eta participated during 2002 and 2003 in the research work done on this
project. Mr. Eta presented a research paper entitled “Combined Microbial Production of
Biosurfactants and Biopolymers by Metabolic Manipulation” as part of the requirements
to obtain the Master degree on Engineering at Prairie View A&M University.
Ms. Sharmila Enayet participated during 2004 and 2005 in the experimental research
work done on this project. She presented a research paper entitled “Alternative
Production of Biosurfactants and Biopolymers by Metabolic Manipulation” as part of the
requirements to obtain the Master degree on Engineering at Prairie View A&M
University.
Copyright © 2022 FDOKUMEN