Combinatorial Life Cycle Analysis (Environmental Impact Assessment) of Microalgae-based Biodiesel...
61
Combinatorial Life Cycle Analysis (Environmental Impact Assessment) of Microalgae-based Biodiesel Production Chains CN4118R – Final Year Project THE NATIONAL UNIVERSITY OF SINGAPORE Department of Chemical & Biomolecular Engineering Final Report 15 Jan 2014 Submitted by: Tan Wei Han, Denis (A0072022Y) Mentor: Yu Nan Supervisor: Dr. Lee Dong-Yup
Transcript of Combinatorial Life Cycle Analysis (Environmental Impact Assessment) of Microalgae-based Biodiesel...

Combinatorial Life Cycle Analysis (Environmental
Impact Assessment) of Microalgae-based
Biodiesel Production Chains
CN4118R – Final Year Project
THE NATIONAL UNIVERSITY OF SINGAPORE
Department of Chemical & Biomolecular Engineering
Final Report
15 Jan 2014
Submitted by: Tan Wei Han, Denis (A0072022Y)
Mentor: Yu Nan
Supervisor: Dr. Lee Dong-Yup

I am immensely grateful for the support and assistance provided by my project
supervisor, Dr. Lee Dong-Yup, and my project mentor, Ms. Yu Nan. They accorded me
with utmost flexibility to determine the direction of my research endeavour. The
project has taught me, amongst other things, the importance of perseverance and
endeavour.

Table of Contents
Abstract ................................................................................................................. I
List of Figures ....................................................................................................... III
List of Tables ........................................................................................................ IV
1 Introduction .................................................................................................... 1
2 Scope .............................................................................................................. 3
3 Literature Review ............................................................................................ 5 3.1 LCAs of Microalgae-based Biodiesel ........................................................................ 5
3.2 LCAs of Petroleum Diesel and Other Biodiesel ......................................................... 6
4 Methodology .................................................................................................. 7 4.1 General ............................................................................................................... 7
4.2 Stage 1: Cultivation ........................................................................................... 10
4.3 Stage 2: Harvesting............................................................................................ 11
4.4 Stage 3: Extraction ............................................................................................ 12
4.5 Stage 4: Conversion ........................................................................................... 13
4.6 Biodiesel Transport ........................................................................................... 14
5 Results and Discussion .................................................................................. 15 5.1 Stage 1: Cultivation ........................................................................................... 15
5.2 Stage 2: Harvesting............................................................................................ 18
5.3 Stage 3: Extraction ............................................................................................ 20
5.4 Stage 4: Conversion ........................................................................................... 23
5.5 Biodiesel Transport ........................................................................................... 25
5.6 Global Optimisation .......................................................................................... 25
5.7 Analysis of Environmentally Optimal Production Chain ...................................... 31
6 Conclusion and Future Work ......................................................................... 36
7 Supplementary Information .......................................................................... 37
References .......................................................................................................... 37
Annexes ............................................................................................................. 1-1 Annex 1 – Definition of Terms ................................................................................... 1-1
Annex 2 – Key Modelling Parameters Obtained from the Literature ........................... 2-1
Annex 3 – Options Considered for Harvesting Production Step ................................... 3-1
Annex 4 – Options Considered for Extraction Production Step .................................... 4-1

Annex 5 – Options Considered for Conversion Production Step .................................. 5-1
Annex 6 – Project Timeline ........................................................................................ 6-1

I
Abstract
Global energy demand is expected to increase by more than 35% from 2010 to 2035
of which 80% continues to be supplied by fossil fuels. This brings forth concerns of
environmental sustainability. Third-generation microalgae-based biodiesel appears
to hold the answer to some of these issues through its reduction of fossil fuel usage
while avoiding problems that plagued previous generation biodiesel. However, policy
makers are yet to be fully convinced. This study puts forth the following questions: Is
third-generation biodiesel environmentally benign? Are all methods of producing
third-generation biodiesel equally environmentally sustainable? If not, which
methods are more sustainable?
A cradle-to-pump environmental impact assessment (EIA) was undertaken to
determine the net energy ratio (NER), life cycle water footprint (WF), and global
warming potential (GWP) of various production methods of microalgae-based
biodiesel. A functional unit of fatty acid methyl ester (FAME) biodiesel produced
from 100000 kg of cultivated algal biomass was used. 11 cultivation methods, 45
harvesting methods, 144 lipid extraction methods, and 4 conversion methods were
considered. 16 optimistic scenarios were then selected for further study. The
environmental impacts of the 16 scenarios varied widely, indicating that not all
methods of producing biodiesel are equally sustainable. Through optimisation, this
study finds that the environmentally optimal production chain involves open thin-
layer photo-bioreactor cultivation, single-step chitosan harvesting, belt drying, and
dry direct in-situ trans-esterification. This production chain is calculated to have a
WF of 2.7 tonnes of water and GWP of 0.9 tonnes of CO2-equivalent greenhouse
gases (GHG) per gigajoule (GJ) of FAME biodiesel, well above that for the production
of an equivalent GJ of petroleum diesel (0.0098 tonnes of water and 0.24 tonnes of
CO2-equivalent GHG). The NER exceeds that of petroleum diesel (0.83) but is some
distance from that of corn biodiesel (3.22).

II
Hence, this study finds that microalgae-based biodiesel does not constitute an
unambiguous improvement over the diesel fuel currently in use, leading to the
conclusion that third-generation biodiesel today is not green. However, the
identified environmentally optimal production chain will assist to optimise R&D and
policy development efforts so that the much-vaunted environmental potential of
microalgae-based biodiesel can be attained sooner rather than later.
This study is the first life cycle study on biofuels involving optimisation across
multiple environmental criteria and further augments the literature by expanding
the scope of production methods considered.

III
List of Figures
Figure 1: Biodiesel Production Chain Schematic……………………………………………….. 07
Figure 2: System Boundary and Superstructure of Microalgae-based Biodiesel
Production Chain……………………………………………………………………………………………… 08
Figure 3: Cultivation Schematic………………………………………………………………………… 10
Figure 4: Harvesting Schematic………………………………………………………………………… 11
Figure 5: Extraction Schematic…………………………………………………………………………. 12
Figure 6: Conversion Schematic……………………………………………………………………….. 13
Figure 7: Delivery Schematic…………………………………………………………………………….. 14
Figure 8: Net Energy Ratio of various cultivation methods……………………………….. 17
Figure 9: Water Footprint of various cultivation methods………………………….…….. 17
Figure 10: GWP-100 of various cultivation methods…………………………………………. 17
Figure 11: Net Energy Ratio for various harvesting methods.……….….….….….….… 19
Figure 12: Water Footprint for various harvesting methods.……………………..…..… 19
Figure 13: GWP-100 of various harvesting methods…………………………………………. 19
Figure 14: Net Energy Ratio for 144 Extraction Combinations………………………….. 22
Figure 15: Water Footprint for 144 Extraction Combinations…………………………… 22
Figure 16: GWP-100 for 144 Extraction Combinations……………………………………… 22
Figure 17: Net Energy Ratio for Conversion Stage……………………………………..……… 24
Figure 18: GWP-100 for Conversion Stage………………………………………………………… 24
Figure 19: Procedure for Selection of 4 Options for Aggregated Extraction-
Conversion Process………………………………………..………………………………………………… 25
Figure 20: Schematic for Global Optimisation………………………………………..………… 26
Figure 21: Summary of EIA for 16 Scenarios……………………………………………………… 27
Figure 22: Net Energy Ratio for 16 Scenarios……………………………………………………. 28
Figure 23: Water Footprint for 16 Scenarios…………………………………………………….. 28
Figure 24: Global Warming Potential for 16 Scenarios……………………………………… 28
Figure 25: Environmentally Optimal Microalgae-based Biodiesel Production
Chain………………………………………………………………………..………………………………..……. 31
Figure 26: Life Cycle Energy Footprint for Environmentally Optimal Production
Chain………………………………………………………………………..………………………………..……. 32
Figure 27: Life Cycle Water Footprint for Environmentally Optimal Production
Chain………………………………..………………………………..……………………………………………. 33
Figure 28: Life Cycle GWP for Environmentally Optimal Production Chain……….. 34
Figure 29: Summary of Contribution of Each Stage to the 3 Environmental
Dimensions………………………………..………………………………..…………………………………… 35

IV
List of Tables
Table 1: Summary of Results of Local Optimisation for Cultivation Stage…………. 16
Table 2: Summary of 16 Scenarios for Global Optimisation……..………………………. 26
Table 3: Key Modelling Parameters Extracted or Calculated from Literature for
Cultivation Section……..…………………………………………..……………………………………….. 2-1
Table 4: Key Modelling Parameters Extracted or Calculated from Literature for
Harvesting Section……..…………………………………………..……………………………………….. 2-2
Table 5: Key Modelling Parameters Extracted or Calculated from Literature for
Cell Disruption Sub-section of Extraction Section…..………………………………………… 2-3
Table 6: Key Modelling Parameters Extracted or Calculated from Literature for
Drying Sub-section of Extraction Section…..………………………………………..…..………. 2-3
Table 7: Key Modelling Parameters Extracted or Calculated from Literature for
Lipid Extraction Sub-section of Extraction Section………………………………..………….. 2-3
Table 8: Key Modelling Parameters Extracted or Calculated from Literature for
Conversion Section…..………………………………………..…..……………………………………….. 2-4
Table 9: Options Considered for Harvesting Segment of Production Chain………. 3-1
Table 10: Options in Disruption Sub-Stage…..……………..……………..…………………….. 4-1
Table 11: Options in Drying Sub-Stage…..……………..……………..………….…..………….. 4-1
Table 12: Options in Lipid Extraction Sub-Stage…..……………..……………..…………….. 4-1
Table 13: Options in Conversion Sub-Stage…..……………..……………..…………………… 5-1
Table 14: Milestone Dates…..……………..……………..……………………..……………………… 6-1

1
1 Introduction
Global energy demand is expected to increase by more than 35% from 12,380
Million Tonnes of Oil Equivalent (MTOE) in 2010 to 16,730 MTOE in 2035 [1] due to
growing populations and emerging affluence [2]. Moreover, it is forecasted that with
business-as-usual conditions, fossil fuels will continue to supply almost 80% of the
world’s energy demand through 2040 [3]. This is clearly unsustainable as
consumption of fossil fuels accounts for the majority of global anthropogenic
greenhouse gas (GHG) emissions [4]. These emissions are well accepted by the
scientific community to be the foremost cause of climate change [5].
Biofuels, fuels produced from biomass [6], have emerged as renewable alternatives
to fossil-based sources of energy and have been much discussed in academia in the
past decade [4, 6-35]. They are believed to be (1) environmentally friendly, (2)
producible in a sustainable manner, and (3) biodegradable [21]. Of the various forms
of biofuels, biodiesel and bioethanol have been most aggressively pursued as
potential replacements for diesel and gasoline respectively [19]. In particular,
biodiesel has been the subject of much research as it is a potential direct
replacement for petroleum diesel which will surpass gasoline as the number one
global transportation fuel by 2020 [2].
Biodiesel can be produced from various types of feedstock. To date, there are three-
generations of biodiesel. First-generation biodiesel is produced primarily from edible
oils derived from rapeseed, palm oil, soybean, and sunflower [4, 19, 21, 36]. The
fundamental drawback of first-generation biodiesel is the threat they impose on
global food supply as their production creates direct competition for resources with
production of food since it requires the use of food crops [4, 17, 19, 21, 36-39].
Second-generation biodiesel is produced primarily from oils derived from either non-
edible parts of current food crops, or non-food crops like miscanthus and jatropha
[4, 19, 21, 26, 29, 33, 36]. They are an improvement over first-generation biodiesel
as there is no direct competition for food crop demand. However, land competition

2
is still significant [4, 19, 28, 39]. Third-generation biodiesel, thus, offers the most
promise as it can potentially avoid competition for food crops and minimize land
competition. Third-generation biodiesel feedstock is primarily made up of
microalgae [4, 12, 17, 21, 31, 32, 36] that grows at a time scale several orders of
magnitude below that of plant crops. It is important to note that in spite of its
apparent potential, large-scale microalgae-based biodiesel production is still nascent
and generally not commercially viable with production cost well in excess of
petroleum diesel sale price [40, 41]. There are, fortunately, a few burgeoning
commercial applications to date [42].
Despite the promises of biodiesel and biofuels in general, one cannot simply assume
that they are sustainable or green. In fact, the European Environment Agency
Scientific Committee has expressed concern and scepticism with regards to
bioenergy’s environmental sustainability, particularly its ability to reduce GHG
emissions [43]. To date, numerous life cycle assessments have been conducted on
biofuels [11, 13, 18, 20, 27, 32, 33, 37-39, 44-51] to determine their environmental
sustainability to mixed results. This study seeks to add to the growing literature on
this topic by answering the following questions: Is third-generation biodiesel truly
environmentally benign? Are all methods of producing third-generation biodiesel
equally environmentally sustainable? If not, which methods are more sustainable?

3
2 Scope
This project, conducted over 5 months, involves a cradle-to-pump environmental
impact assessment (EIA) on various methods of biodiesel production from
microalgae. The project milestones are listed in Annex 6.
Specifically, the net energy ratio (also known as energy returns on investment), life
cycle water footprint (WF), and global warming potential (GWP) of the various steps
in microalgae-based biodiesel production were quantified. These 3 criteria were
chosen as they were deemed to be the most significant environmental dimensions of
the present time [2-4, 52]. Definition of the nomenclature is provided in Annex 1.
Numerous options were considered at each of the four production process steps of
(1) cultivation, (2) harvesting, (3) extraction, and (4) conversion. The options
considered are not meant to be exhaustive but to be diverse and representative of
the different technologies available. Some novel technology was also included. A
review of the options at each process step is not the intention of this study so the
interested reader is referred to Brennan et. al [17] and Mata et. al [19] for two of the
many available in the literature.
All in all, 11 cultivation methods from, 45 harvesting methods from, 144 lipid
extraction methods, and 4 conversion methods were considered. The functional unit
for the entire production chain was chosen as fatty acid methyl ester biodiesel
(FAME) produced from 100000 kg cultivated algal biomass. Due to the enormous
number of production combinations possible, an exhaustive assessment of all1
production chains would be highly time-consuming. Instead, promising methods
were isolated from each of the production steps through local optimisation.
Optimisation aims to balance the trade-offs between possibly conflicting
environmental criteria of NER, WF, and GWP. In this study, a linear multi-objective
function involving the three environmental dimensions (NER, WF, GWP) was applied
1 In principle, a total of 11 x 45 x 144 x 4 = 285120 production chains are possible by combining the options considered at each of the 4 process steps.

4
for the optimisation process. The promising methods of each process step were
combined to create 16 scenarios for further analysis to determine the global
optimum based on NER, WF, and GWP.
Upon determining the environmentally optimal production chain, the NER, WF, and
GWP of that production chain was compared to their equivalent for petroleum diesel
and corn biodiesel. These diesels are currently used in the market and serve as a
sound basis to judge if microalgae-based biodiesel indeed constitute an
environmental improvement to the status quo.
This project not only adds to but also augments the growing literature of life cycle
assessments (LCA) conducted on biofuels [11, 13, 18, 20, 27, 33, 37-39, 44-51, 53].
Surprisingly, little has been written on the comparison between life cycle
environmental impact assessments of different microalgae-based biodiesel
production chains. To my knowledge, the only prior literature in this area was by
Yang et. al [51], Delrue et. al [53], Lardon et. al [37], Xu et. al [54], and Bretner et. al
[55]. This study applies the same combinatorial approach of Bretner et. al [55] albeit
with different modelling assumptions. Moreover, while Bretner et. al [55] focuses
solely on energetics to determine process optimality, this study expands the scope of
scenarios considered and is, to my knowledge, the first to simultaneously consider
and optimise across multiple environmental criteria.

5
3 Literature Review
3.1 LCAs of Microalgae-based Biodiesel
Various life cycle assessments on third-generation biodiesel have been conducted in
recent times to a wide range of disparate results. These include substantial prior
work on the energetics of microalgae-based biodiesel production. The life cycle NER
of biodiesel has been reported to range from 0.13 [55] to 5.9 [20] for open raceway-
based production and 0.23 [46] to 1.1 [56] for photobioreactor-based production.
Some of the variation can be explained by locational differences with studies
conducted in Asia [57], the United States [45], and across Europe [37] while the rest
accrue from differences in system boundary and modelling assumptions. Despite the
divergence, there is widespread consensus that open raceway production consumes
less energy than photobioreactor production resulting in the former having a higher
average NER than the latter.
For life cycle water footprint of microalgae-based biodiesel, there has been not
much prior work in the literature. The most notable findings were by Delrue et. al
[53] and Yang et. al [51] who listed the water footprint at 9.8 tonnes per GJ and 16
tonnes per GJ respectively. There is general agreement that the methods of
cultivation and the target recycle ratio have significant impact on the life cycle water
consumption.
The GWP of microalgae-based biodiesel production has had substantial prior work
though researchers typically focus their attention on carbon emissions and neglect
other greenhouse gases. There has also been significant variation on the GWP
findings ranging from -75.3 kg per GJ [56] to 0.534 tonnes per GJ [55].
The range of results on all 3 environmental dimensions attests to the uncertainty
inherent in life cycle studies. This does not negate the effectiveness of LCAs but
merely serves to highlight that LCAs are an important starting point for further, more
precise environmental impact research. It is useful to note that much of the detailed

6
studies undertaken are based on the open raceway cultivation method. More work
could be done on non-raceway cultivation of third-generation biodiesel and this
study answers the call by including other photobioreactor cultivation methods.
3.2 LCAs of Petroleum Diesel and Other Biodiesel
Sheehan et. al [58] undertook a holistic study on biodiesel and petroleum diesel life
cycles in 1998 and found that petroleum diesel had an NER of 0.83 while first-
generation biodiesel, in this case derived from corn feedstock, had an NER of 3.22.
Consequently, corn biodiesel is clearly more environmentally amendable than
petroleum diesel on the energy front. They also quantified the life cycle fossil carbon
emission for petroleum diesel and corn biodiesel. Sheehan et. al [58] found that
petroleum diesel has a cradle-to-grave life cycle CO2 emission of 0.240 tonnes per GJ
of diesel while corn biodiesel has a cradle-to-grave CO2 emission of 0.257 tonnes per
GJ of biodiesel. The figures fall to 0.032 tonnes and 0.04 tonnes respectively when
tailpipe emissions are omitted to quantify the cradle-to-pump carbon footprint.
Finally, the authors reported the life cycle water footprint of petroleum diesel and
corn biodiesel to be 0.0098 tonnes and 32.2 tonnes. The work of Sheehan et. al [58]
will serve as an evaluation basis for the results arising from this study.
7
4 Methodology
4.1 General
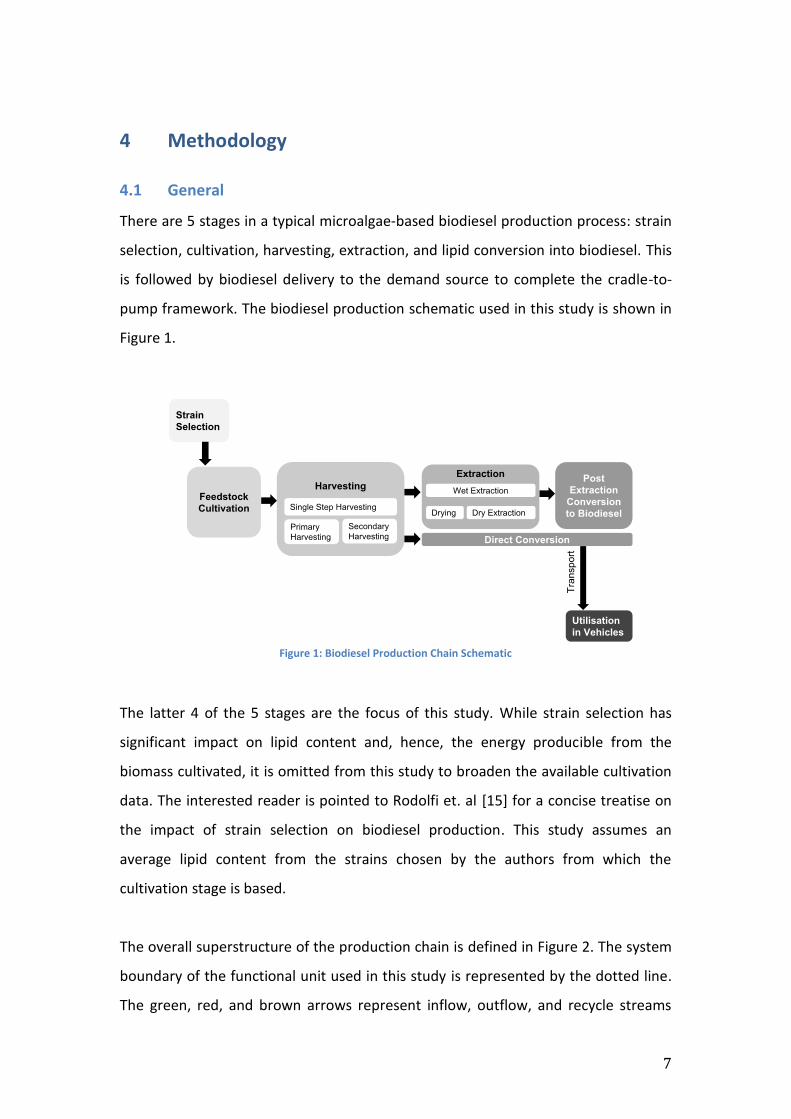
There are 5 stages in a typical microalgae-based biodiesel production process: strain
selection, cultivation, harvesting, extraction, and lipid conversion into biodiesel. This
is followed by biodiesel delivery to the demand source to complete the cradle-to-
pump framework. The biodiesel production schematic used in this study is shown in
Figure 1.
Figure 1: Biodiesel Production Chain Schematic
The latter 4 of the 5 stages are the focus of this study. While strain selection has
significant impact on lipid content and, hence, the energy producible from the
biomass cultivated, it is omitted from this study to broaden the available cultivation
data. The interested reader is pointed to Rodolfi et. al [15] for a concise treatise on
the impact of strain selection on biodiesel production. This study assumes an
average lipid content from the strains chosen by the authors from which the
cultivation stage is based.
The overall superstructure of the production chain is defined in Figure 2. The system
boundary of the functional unit used in this study is represented by the dotted line.
The green, red, and brown arrows represent inflow, outflow, and recycle streams

8
respectively. Water is assumed to be the only material recycled. This study also
omits from consideration any energy coupling process or co-location credits to
ensure a fair comparison with LCA of petroleum diesel and corn biodiesel conducted
by Sheehan et. al [58].
Figure 2: System Boundary and Superstructure of Microalgae-based Biodiesel Production Chain
Each stage, with its own functional basis, was modelled in Excel and/or OpenLCA
based on parameters obtained from the literature (see Annex 2). LCA allocation was
done based on energy content. The NER, life cycle water footprint, and GWP were
then computed for the numerous options considered at each of the 4 stages. Local
optimisation was done at each of the 4 stages to identify 2 of the most
environmentally optimistic options. The intention was for the 2 options from each
stage to be combined to obtain 16 (24) scenarios for further analysis. However, this
procedure was altered due to the interacting nature of the extraction and

9
conversion stages2. This will be elaborated further in Section 5.6. Global optimisation
was then pursued based on the 16 scenarios.
The linear multi-objective function, henceforth referred to as Equation 1, used for
both local and global optimisation (minimisation) in this study was:
1𝑁𝐸𝑅𝑖
⁄
(1𝑁⁄ ) ∑ 1
𝑁𝐸𝑅𝑖⁄𝑁
1
+𝑊𝐹𝑖
(1𝑁⁄ ) ∑ 𝑊𝐹𝑖
𝑁1
+𝐺𝑊𝑃𝑖
(1𝑁⁄ ) ∑ 𝐺𝑊𝑃𝑖
𝑁1
𝑤ℎ𝑒𝑟𝑒 𝑖 ∈ [1, 𝑁] 𝑎𝑛𝑑 𝑁 𝑖𝑠 𝑡ℎ𝑒 𝑛𝑢𝑚𝑏𝑒𝑟 𝑜𝑓 𝑜𝑝𝑡𝑖𝑜𝑛𝑠 𝑢𝑛𝑑𝑒𝑟 𝑐𝑜𝑛𝑠𝑖𝑑𝑒𝑟𝑎𝑡𝑖𝑜𝑛
Equation 1: Optimisation Equation
The function is a weighted sum of the 3 environmental criteria of this study. Each
criterion was given an equal weight, as there is no sound basis to tilt the balance
towards any particular criterion in any particular way. While WF and GWP are clearly
criteria that, upon minimisation, reflect environmental optimality, NER acts in
reverse. Hence, the reciprocal of NER was included in the objective function rather
than NER.
For local optimisation at each stage, only options with NER > 1 were considered as
production steps that already consume more energy than maximally producible are
not only at odds with environmental feasibility but also with economic realities. This
study would be less useful if the environmentally optimal production chain identified
is so far at odds with economic realities that it will never be utilised in a meaningful
way. Hence, options with NER < 1 were omitted.
Key modelling parameters obtained from the literature for this study are provided in
Annex 2 while detailed documentation is available in the supporting documentation.
2 Due to the interactive nature of the extraction and conversion stages (i.e. selection of conversion method affects choice of extraction method significantly and vice versa), the 16 scenarios were formed from 4 optimistic options in the aggregated extraction-conversion stage rather than the 2 scenarios from each of extraction and conversion stages. This is discussed in greater detail in Section 5.6.

10
4.2 Stage 1: Cultivation
The cultivation stage schematic is shown in Figure 3. The functional basis for this
stage is 100000 kg of dry biomass production. 11 different cultivation methods from
6 categories published by 10 different authors [18, 59-67] were considered. The 6
categories of cultivation methods considered were: raceway pond, tubular
photobioreactor, open thin-layer photobioreactor, flat-plate photobioreactor,
enclosed photobioreactor, and heterotrophic bioreactor. Both conventional
methods (raceway) and novel ones (tubular solarised airlift reactor) were
considered. Modelling parameters of all 11 cultivation methods can be found in
Table 3, Annex 2.
Figure 3: Cultivation Schematic
The EIA for 9 of the reactors were newly modelled from empirical data. The EIA for
the remaining 2 reactors were replicated from the life cycle assessment conducted
by Jorquera et. al [18], albeit with minor changes to the system boundary and
process parameters.
The cultivation stage forms the foundation for biodiesel production and is probably
the most significant step in the EIA. The cultivated biomass determines the
subsequent amount of lipid extractable and, hence, biodiesel producible.

11
4.3 Stage 2: Harvesting
The harvesting stage, shown in Figure 4, is primarily modelled based on the
dewatering methods reviewed by Uduman et. al [68]. The functional basis for this
stage is 1 m3 of 0.923%3 total suspended solids (TSS) cultured microalgae from the
cultivation process and the harvested output was taken to be 20% TSS microalgae
slurry.
Figure 4: Harvesting Schematic
45 options of both single-step and double-step dewatering were considered [10, 69-
79]. For brevity, the options are summarised in Annex 3 while the modelling
parameters can be found in Table 4. Annex 2. Both conventional methods
(gravitational sedimentation) and novel ones (ultrasonic aggregation) were included.
The harvesting stage is likely to be the least significant stage in the overall EIA as it is
not as energetically or resource intensive as the others.
3 An average output TSS from the 11 cultivation methods considered.

12
4.4 Stage 3: Extraction
The extraction schematic of this study is shown in Figure 5. The functional basis for
this stage is 1 m3 of 20% total suspended solids (TSS) microalgae slurry from the
harvesting stage.
Figure 5: Extraction Schematic
Extraction can be categorised into wet or dry extraction (with additional drying step).
Pre-extraction preparation can also include cellular disruption (not shown on
schematic). Hence, 3 sub-stages (cell disruption, drying, and lipid extraction) were
considered in this stage. Cell disruption data was obtained from Lee et. al [80] and
Bunge et. al [81], drying data was referenced from Baker & McKenzie [82],
Hassebrauck & Ermel [83], and Mujumdar [84], and lipid extraction data was based
on Lee et. al [85], Halim et. al [86], Andrich et. al [87], and Mendes et. al [88].
All in all, 6 cell disruption options, 6 drying options, and 4 lipid extraction options
were considered, giving rise to 144 (6 x 6 x 4) combinations of both wet and dry
extraction. For all 3 sub-stages, conventional and novel methods were included. For
instance, novel methods such as ultrasonic cell disruption and supercritical carbon
dioxide extraction were considered. For brevity, the different options are
summarised in Annex 4 while modelling parameters can be found in Tables 5 to 7,
Annex 2.

13
4.5 Stage 4: Conversion
The schematic of the conversion stage is reflected in Figure 6. The functional basis
for this stage is 1 kg of FAME biodiesel produced by lipid conversion.
Figure 6: Conversion Schematic
All in all, 4 options were considered. The 4 options arise from the 2 possible
dimensions of the lipid to biodiesel conversion processes: (1) extraction-
transesterification versus direct in-situ conversion and (2) dry versus wet. The
former distinguishes the conversion process by whether a separate (stage 3)
extraction step is required.
Direct conversion processes are believed to be more commercially feasible as less
process steps are required. The options are summarised in Annex 5 while modelling
parameters can be found in Table 8, Annex 2 with the data primarily referenced
from Batan et. al [56] and Johnson et. al [89].

14
4.6 Biodiesel Transport
Figure 7 shows the schematic of the biodiesel transport segment.
Figure 7: Delivery Schematic
A cradle-to-pump EIA for the production of microalgae-based biodiesel has to
include transport and delivery of the biodiesel product to the demand source. In this
study, the average delivery distance was taken to be 100 km and carried out by a
diesel-powered combination truck. Consequently, the functional basis for the
transport stage was the transport of 1 tonne of biodiesel for 100 km.
15
5 Results and Discussion
5.1 Stage 1: Cultivation
The results of the LCA-EIA (NER, water footprint, and GWP) for the cultivation step
are summarised in Figures 8 to 10.
The NER (0.07 to 8), water footprint (2 x 10⁶ to 75 x 106 kg of water), and GWP (-1.7 x
105 kg to 3.7 x 10⁵ kg) of the 11 cultivation methods varied significantly across
options, indicating the wide variation of environmental impacts accruing from
different cultivation methods.
The NER of the cultivation step is crucial in determining if a given microalgae-based
biodiesel production chain is green. Any cultivation process that has NER below 1
would imply that more energy, here assumed to be entirely from fossil-based
sources, is required in materials and operation of the cultivation method than is
maximally producible from the cultivated biomass. Moreover, the subsequent
downstream steps add to the input energy requirement, making the NER even lower
after accounting for the entire biodiesel production chain.
In this study, only 5 of the 11 cultivation methods were found to have an NER in
excess of 1: 1 of the 2 flat plate photobioreactor, all 3 open thin-layer
photobioreactors, and the raceway pond. The environmental impact findings of the
various cultivation methods are in general agreement with those of Jorquera et. al
[18], Husemann & Benemann [90], and Rodolfi et. al [15] in that raceway cultivation
remains the most energetically feasible cultivation method with an NER of 7.91.
The various cultivation methods considered all had environmental trade-offs.
Raceways offered the highest potential for energetic feasibility but at the expense of
high water footprint and GWP. On the other hand, the other cultivation methods
had lower WF at the expense of NER barely crossing 1.

16
Local optimisation was done in terms of cultivation categories (6) instead of
cultivation methods (11) in recognition of the potential significant variation in
environmental impact within each cultivation category4. Local optimisation identified
the open thin-layer cultivation method as the most environmentally optimal
followed by the raceway pond. Though the open thin-layer cultivation method had a
significantly lower NER than raceway cultivation, it made up for it through its much
lower WF and GWP. The values of the objective function (based on Equation 1) for
the 6 cultivation categories are summarised in Table 1.
S/N Cultivation Methods (11) Cultivation Category (6) Value of Objective Function (lower is better)
1 Yoo et. al, 2013 Open Thin-Layer -13.8
Doucha et. al, 2005
Doucha et. al, 2009
2 Jorquera et. al, 2010 Raceway 38.7
3 Jorquera et. al, 2010 Flat Plate -*
Cheng-Wu et. al, 2001
4 Molina et. al, 2000 Tubular -*
Richmond et. al, 1992
Bahadur et. al, 2013
5 Olaizola, 2000 Enclosed -*
6 Li, 2007 Heterotrophic -* Table 1: Summary of Results of Local Optimisation for Cultivation Stage
*Some or all of the cultivation methods in this category have NER < 1 and hence are omitted from
consideration
More details are available in the supporting documentation.
4 For instance, the 2 flat plate photobioreactors considered have relatively different environmental impacts with only 1 of them having an NER > 1.

17
0 1 2 3 4 5 6 7 8 9
Raceway (Jorquera)
Tubular (Molina)Tubular (Richmond)
Tubular (Bahadur)
Thin Layer (Doucha)Thin Layer (Doucha, updated)
Thin Layer (Yoo)
Flat Plate (Jorquera)Flate Plate (Cheng-Wu)
Enclosed (Olaizola)
Heterotrophic (Li)
NER per 100 ton Dry Biomass Cultivated
0 1 2 3 4 5 6 7 8
Raceway (Jorquera)
Tubular (Molina)Tubular (Richmond)
Tubular (Bahadur)
Thin Layer (Doucha)Thin Layer (Doucha, updated)
Thin Layer (Yoo)
Flat Plate (Jorquera)Flate Plate (Cheng-Wu)
Enclosed (Olaizola)
Heterotrophic (Li)
10^7 kg
Water Footprint per 100 ton Dry Biomass Cultivated
-2 -1 0 1 2 3 4
10^5 kg CO2 equivalent GHG
GWP-100 per 100 ton Dry Biomass Cultivated
Optimal
Legend
Figure 8: Net Energy Ratio of various cultivation methods
Figure 9: Water Footprint of various cultivation methods
Figure 10: GWP-100 of various cultivation methods

18
5.2 Stage 2: Harvesting
The NER (3 to 575) and GWP (0.12 kg to 13.6 kg) of the 45 options considered in the
harvesting section varied significantly, indicating the wide range of environmental
impacts accruing from different harvesting options. All harvesting techniques had
NER > 1, indicating that less energy is required for harvesting than the energy
producible from the harvested biomass. This is expected as harvesting is not a
resource and energetically intensive step along the production chain. However,
some harvesting methods required significantly more energy to put into effect than
others. This also contributed to their much higher GWP as energy consumption was
assumed to be from fossil sources that contribute to high levels of greenhouse gas
emission.
Water footprint (47.8 to 48.5 kg of water) of all 45 options was relatively similar due
to the modelling assumption of 95% recycle ratio.
Through local optimisation, single-step chitosan flocculation harvesting from
0.923% TSS to 20% TSS algal suspension was found to be the environmentally
optimal harvesting technique with the highest NER, lowest water footprint, and
lowest GWP. Two-step magnetophoretic harvesting followed by chitosan
flocculation was a close second. The values of the objective function were 1.038 and
1.041 respectively.
The summary of results (NER, water footprint, and GWP) for the harvesting step is
reflected in Figures 11 to 13.
More details are available in the supporting documentation.

19
47.4
47.6
47.8
48
48.2
48.4
48.6
1 3 5 7 9 11 13 15 17 19 21 23 25 27 29 31 33 35 37 39 41 43 45
kg
Water Footprint per m3 of 0.923% TSS Algal Slurry
0
2
4
6
8
10
12
14
1 3 5 7 9 11 13 15 17 19 21 23 25 27 29 31 33 35 37 39 41 43 45kg
CO
2 e
qu
ival
en
t G
HG
GWP-100 from Biodiesel Producible from 1m3 of 0.923% TSS Algal Slurry
0
100
200
300
400
500
600
700
1 3 5 7 9 11 13 15 17 19 21 23 25 27 29 31 33 35 37 39 41 43 45
NER per m3 of 0.923% TSS Algal Slurry Optimal
Legend
Figure 11: Net Energy Ratio for various harvesting methods
Figure 12: Water Footprint for various harvesting methods
Figure 13: GWP-100 of various harvesting methods

20
5.3 Stage 3: Extraction
The summary of results (NER, water footprint, and GWP) for the extraction step is
reflected in Figures 14 to 16.
From Figures 14 and 16, the NER and GWP results take the form of 6 similar clusters,
reflecting the 6 different drying methods (from no drying, spray drying, freeze
drying, thermal drying, drum drying to belt drying). Within each cluster, the results
primarily reflect the differences arising from the 4 different lipid extraction methods
considered (2 solvent and 2 supercritical CO2 methods). The differences stemming
from the different cell disruption techniques (from no disruption to osmotic shock)
are much more nuanced and cannot be distinguished with the naked eye. This is
because the environmental impact arising from different disruption techniques is
several magnitudes less than the effects from the various drying and lipid extraction
methods.
As is the case with the previous two stages, the NER (0.026 to 1.64) and GWP (2200
kg to 66600 kg) of the 144 options considered in the extraction section varied
significantly, indicating the wide range of environmental impacts accruing from
different extraction combinations. Prior to conducting the EIA, it was expected that
wet extraction methods, as indicated by the blue portions of Figures 11 to 13, would
have higher NER, lower WF, and lower GWP as environmental impact accruing to the
resource intensive drying process was avoided. However, these predictions are not
reflected in the findings.
This is primarily because while wet extraction methods had lower energy
consumption due to the omission of the drying sub-stage, they required more
energy during the lipid extraction sub-stage due to the larger volume of solution
mixture handled (solvent + slurry). The effects happen to cancel.
Water footprint (750 kg or 0 kg) differed between the 144 combinations only
depending on whether the extraction method was wet or dry. Water that had not
21
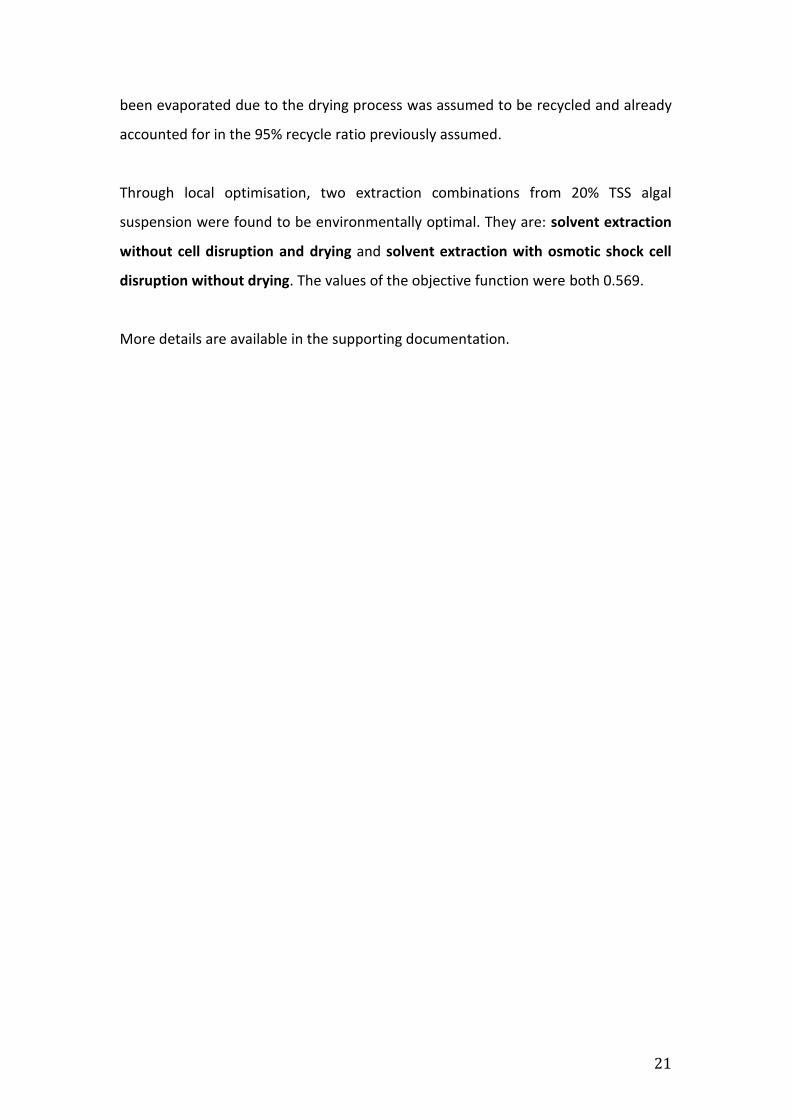
been evaporated due to the drying process was assumed to be recycled and already
accounted for in the 95% recycle ratio previously assumed.
Through local optimisation, two extraction combinations from 20% TSS algal
suspension were found to be environmentally optimal. They are: solvent extraction
without cell disruption and drying and solvent extraction with osmotic shock cell
disruption without drying. The values of the objective function were both 0.569.
More details are available in the supporting documentation.

22
a Optimal
Wet
Dry
Legend
0
10000
20000
30000
40000
50000
60000
70000
1 5 9
13
17
21
25
29
33
37
41
45
49
53
57
61
65
69
73
77
81
85
89
93
97
10
1
10
5
10
9
11
3
11
7
12
1
12
5
12
9
13
3
13
7
14
1
GW
P-1
00
a (k
g C
O2
eq
uiv
ale
nt)
GWP-100a (kg CO2 equivalent)
Figure 16: GWP-100 for 144 Extraction Combinations
0
100
200
300
400
500
600
700
800
1 5 9
13
17
21
25
29
33
37
41
45
49
53
57
61
65
69
73
77
81
85
89
93
97
10
1
10
5
10
9
11
3
11
7
12
1
12
5
12
9
13
3
13
7
14
1
Wat
er
Foo
tpri
nt
(kg)
Water Footprint (kg)
Figure 15: Water Footprint for 144 Extraction Combinations
0
0.2
0.4
0.6
0.8
1
1.2
1.4
1.6
1.8
1 5 9
13
17
21
25
29
33
37
41
45
49
53
57
61
65
69
73
77
81
85
89
93
97
10
1
10
5
10
9
11
3
11
7
12
1
12
5
12
9
13
3
13
7
14
1
NER
Figure 14: Net Energy Ratio for 144 Extraction Combinations

23
5.4 Stage 4: Conversion
The summary of results (NER and GWP) for the conversion stage is reflected in
Figures 17 and 18. WF was not considered for this production stage as most water
was assumed to be recycled. This has been accounted for by the 95% recycle ratio
previously assumed.
The dry conversion methods, as indicated by the red portions of Figures 17 and 18,
was found to have higher NER and lower GWP than their wet counterparts. This is
intuitive, as the volume of material handled during dry conversion was lower.
All in all, the NER (0.12 to 8.17) and GWP (0.91 kg to 151.4 kg) of the 4 options
considered in the conversion section varied widely, indicating the wide range of
environmental impacts possible from different conversion methods.
Through local optimisation, dry post-extraction transesterification to produce 1 kg
of FAME biodiesel was found to be the environmentally optimal conversion method.
Wet post-extraction transesterification was a distant second. The values of the
objective function were 0.080 and 0.119 respectively. More details are available in
the supporting documentation.
The findings, at first glance, seem to contradict prior belief that direct conversion
processes are more feasible as less process steps are involved. However, this is
erroneous. The EIA for this stage does not constitute a fair comparison between the
two categories of conversion methods as extraction was omitted (and separately
modelled in the previous stage). Consequently, the extraction and conversion stages
can be understood to be interactive and should not be considered in isolation of
each other. This will be expanded upon in the global optimisation portion of the
results and analysis.

24
a Optimal
Wet
Dry
Legend
0
1
2
3
4
5
6
7
8
9
Extraction - TransE (Wet) Extraction - TransE (Dry) Direct In Situ (Wet) Direct In Situ (Dry)
NER
Figure 17: Net Energy Ratio for Conversion Stage
0
20
40
60
80
100
120
140
160
Extraction - TransE (Wet) Extraction - TransE (Dry) Direct In Situ (Wet) Direct In Situ (Dry)
GW
P-1
00
a (k
g C
O2
eq
uiv
ale
nt)
GWP-100a (kg CO2 equivalent)
Figure 18: GWP-100 for Conversion Stage

25
5.5 Biodiesel Transport
From OpenLCA, transport of 1 tonne of FAME biodiesel by a diesel-powered
combination truck for a distance of 100km consumed 0.10 GJ of energy from fossil
sources and produced 8.0 kg of GHG equivalent CO2. More details are available in
the supporting documentation.
5.6 Global Optimisation
The optimal microalgae-based biodiesel production chain was obtained by global
optimisation. As previously discussed, the 16 scenarios were intended to be
assembled from the 2 most environmentally amendable options arising from local
optimisation of the 4 production stages. This remained the case for the cultivation
and harvesting stages. However, as the extraction and conversion stages were
interactive, simple combination of the 2 optimal methods from each of the
extraction and conversion stage might not give rise to the production chains that
included the global optimum. The interactive nature of the extraction and
conversion stages can be understood through a simple example. Consider direct
conversion methods: the lipid extraction sub-stage would, by definition, be rendered
obsolete so the choice of the conversion stage affects the choice of the previous
extraction stage, constituting interactive process steps.
Hence, extraction-conversion was treated as a single aggregated stage and 4 options
were chosen for it. The procedure for the selection of the 4 options is summarised in
Figure 19. The 16 options formed by combinatorial aggregation is summarised in
Table 2.
Figure 19: Procedure for Selection of 4 Options for Aggregated Extraction-Conversion Process
Choose 1 of the 4 conversion methods
Vary the extraction methods
Calculate NER, WF, and GWP for entire extraction-conversion process
Find extraction-conversion option that minimises Equation 1 – This is 1 of the 4
options
Change conversion method until all 4 are
exhausted
1 2 3
4 5
Repeat to Step 2
6

26
Consequently, the 16 scenarios can be simplified into the following schematic in
Figure 20. The interaction between the extraction and conversion stages are
apparent.
Table 2: Summary of 16 Scenarios for Global Optimisation
Figure 20: Schematic for Global Optimisation

27
Figure 21 summarises the results for the EIA of the 16 scenarios while more granular
breakdown of the EIA for the 16 scenarios are found in Figures 22 to 24. The optimal
production chain is also highlighted while its analysis is deferred to Section 5.7.
Figure 21: Summary of EIA for 16 Scenarios

28
0
2000000
4000000
6000000
8000000
10000000
12000000
14000000
16000000
18000000
1 2 3 4 5 6 7 8 9 10 11 12 13 14 15 16
Wat
er
Foo
tpri
nt
(kg)
Water Footprint
Figure 23: Water Footprint for 16 Scenarios
0
200000
400000
600000
800000
1000000
1200000
1400000
1600000
1800000
2000000
1 2 3 4 5 6 7 8 9 10 11 12 13 14 15 16
GW
P-1
00
a (k
g C
O2
eq
uiv
ale
nt)
GWP-100a
Figure 24: Global Warming Potential for 16 Scenarios
Optimal
Legend
0
0.2
0.4
0.6
0.8
1
1.2
1.4
1 2 3 4 5 6 7 8 9 10 11 12 13 14 15 16
NER
Figure 22: Net Energy Ratio for 16 Scenarios

29
From Figure 22, it can be seen that only production chains 3, 7, 11, and 15
(production chains with the same dry direct in-situ extraction-conversion method
but differing in cultivation and harvesting methods) had NER in excess of 1. These
production chains, given the chosen basis of FAME biodiesel produced from 100000
kg of cultivated biomass, are surprisingly not the ones with the lowest life cycle
energy consumption. They have life cycle energy footprints of around 680 GJ.
Instead, options 1, 5, 9, and 13 (production chains that differ from 3, 7, 11, and 15
respectively only by wet direct in-situ extraction-conversion method) have the
lowest total life cycle energy consumption of around 180 GJ due to the absence of
the energetically significant drying step. However, options 3, 7, 11, and 15, have
emerged as the only production chains with NER > 1 due to the much higher
conversion efficiency arising from dry direct conversion as compared with wet direct
conversion given today’s technology[89]. This meant that although wet direct
conversion consumes only a fraction of the energy of dry conversion, its conversion
efficiency is so much lower that the amount of FAME biodiesel produced by the
latter more than offset the energetic requirement, resulting in a much higher NER
for the latter. The wet direct conversion options (1, 5, 9, and 13) have NER of around
0.5.
The fact that NER is relatively invariant amongst options 3, 7, 11, and 15 highlights
that stages 3 and 4 (conversion-extraction) are more energetically important than
stages 1 and 2 for production methods involving dry direct in-situ transesterification.
Hence, it implies that the energetic bottleneck today lies in stages 3 and 4 and future
innovations to dry direct in-situ transesterification can be a big step to improving the
NER and energetic feasibility of microalgae-based biodiesel.
Option 11 emerges as the environmentally optimal production chain primarily by
distinguishing itself from 3, 7, and 15 on WF and GWP. This can be seen in Figures 23
and 24. The primary difference between the option set 3 & 7 and the option set 11 &
15 is the cultivation method. 3 & 7 involved the conventional raceway pond
cultivation method that has seen more commercial application while 11 & 15
involved the relatively novel open thin-layer photobioreactor that, to my knowledge,

30
has not seen large-scale commercial application. The latter has a higher life cycle
energy footprint but consumes much less water, required less material for
construction, and achieved much higher algal biomass productivity. Consequently,
11 & 15 were favoured on the WF and GWP dimension.
Finally, option 11 edges 15 as the environmentally optimal production chain
amongst those considered in this study due to the minor advantages (NER and WF)
single stage chitosan flocculation had over two stage magnetophoretic harvesting-
chitosan flocculation. Consequently, open thin-layer photo-bioreactor cultivation,
single-step chitosan harvesting, belt drying, and dry direct in-situ trans-
esterification is found to be the environmentally optimal production chain in this
study. All in all, for FAME biodiesel produced from 100000 kg cultivated algal
biomass in the most environmentally optimal production chain, the WF and GWP are
found to be 4350 tonnes and 1470 tonnes respectively while the NER is 1.22.

31
5.7 Analysis of Environmentally Optimal Production Chain
As discussed in Section 5.6, the identified environmentally optimal production chain
(Figure 25) involves the following production stages:
Stage 1: open thin-layer photo-bioreactor cultivation,
Stage 2: single-step chitosan harvesting,
Stage 3: belt drying, and
Stage 4: direct in-situ trans-esterification
The NER for the optimal production chain is found to be 1.22. This meant that 0.82
GJ of fossil energy is required to produce every 1 GJ of microalgae-based biodiesel.
The findings are relatively consistent with those in the literature with
photobioreactors generally reported to have NER between 0.23 and 1.1 (see
Literature Review Section). The slightly higher NER at 1.22 could be attributed to the
global optimisation that is the crux this study.
The breakdown of the life cycle energy footprint for this production chain is shown
in Figure 26. As highlighted in the previous section, stages 3 and 4 are the more
energetically significant stages of this production chain, accounting for 76% of total
energy consumption on aggregate. More specifically, stage 3 (belt drying) accounted
for almost half of all energy used. This finding is consistent with similar EIAs involving
dry extraction production stages, such as Lardon et. al [37] and Xu et. al [54] where
Figure 25: Environmentally Optimal Microalgae-based Biodiesel Production Chain

32
the drying stage was found to be the most energetically significant segment of the
production chain. This finding implies that gains from innovation in drying
technology seem to be the quickest path to commercial viability for third-generation
biodiesel as wet conversion techniques have extremely low conversion efficiency at
this point.
On the WF front, the WF of 4350 tonnes of water for the assumed basis of biodiesel
produced from 100000 kg of algal biomass works out to 2.7 tonnes per GJ of
biodiesel. The findings have the same order of magnitude as those in the literature
(see Literature Review Section). The slightly smaller figure compared to those of
Yang et. al (16 tonnes per GJ) [51] and Delrue et. al (9.8 tonnes per GJ) [53] could
again be attributed to the optimisation process used in this study.
It is also interesting to note that the cultivation stage accounts for the overwhelming
majority of water use (97%). This is reflected in Figure 27. On first glance, this result
may seem contradictory to the findings from the Figure 26 where the drying step has
been shown to be the biggest energy consumer in the production chain. One would
infer that the drying stage would also be a large source of water outlay. However,
close scrutiny unveils the source of this apparent conflict. In stage 2, a 95% recycle
ratio was assumed that accounts for the recycle of water from the harvesting step
Figure 26: Life Cycle Energy Footprint for Environmentally Optimal Production Chain
Stage 124%
Stage 20%
Stage 349%
Stage 427%
Delivery0%
Total Energy
Stage 1
Stage 2
Stage 3
Stage 4
Delivery

33
and all steps downstream of it. Adjusting the assumption would drastically change
the proportion of WF borne by the cultivation stage. Again, this finding is consistent
with the EIAs in the literature. For instance, Yang et. al [51] attributes 100% of
freshwater usage to the cultivation stage when recycle ratio is 100%.
For GWP, the findings of 1470 tonnes of CO2-equivalent GHG for the assumed basis
of biodiesel produced from 100000 kg algal biomass work out to 0.9 tonnes of CO2-
equivalent GHG per GJ of biodiesel.
The stage-by-stage breakdown of the GWP is reflected in Figure 28. Only the
cultivation stage has a negative GWP, indicating that the net emission of CO2
equivalent GHG is negative. This is intuitive because cultivation is the only stage that
consumes CO2 (CO2 is a feedstock for algal growth) while all other stages emit CO2
and other greenhouse gases. Aggregating all stages, the net GWP is still significantly
positive.
Figure 27: Life Cycle Water Footprint for Environmentally Optimal Production Chain
97%
Water Footprint
Stage 1
Stage 2
Stage 3
Stage 4
Delivery
34
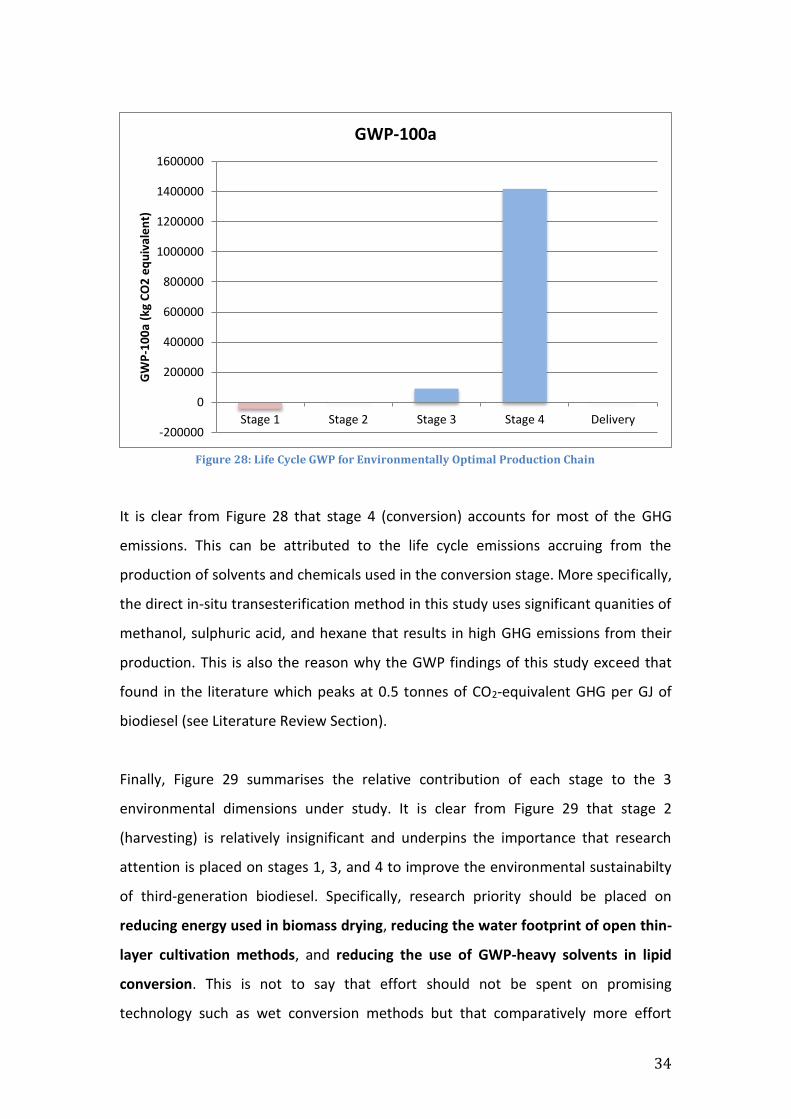
It is clear from Figure 28 that stage 4 (conversion) accounts for most of the GHG
emissions. This can be attributed to the life cycle emissions accruing from the
production of solvents and chemicals used in the conversion stage. More specifically,
the direct in-situ transesterification method in this study uses significant quanities of
methanol, sulphuric acid, and hexane that results in high GHG emissions from their
production. This is also the reason why the GWP findings of this study exceed that
found in the literature which peaks at 0.5 tonnes of CO2-equivalent GHG per GJ of
biodiesel (see Literature Review Section).
Finally, Figure 29 summarises the relative contribution of each stage to the 3
environmental dimensions under study. It is clear from Figure 29 that stage 2
(harvesting) is relatively insignificant and underpins the importance that research
attention is placed on stages 1, 3, and 4 to improve the environmental sustainabilty
of third-generation biodiesel. Specifically, research priority should be placed on
reducing energy used in biomass drying, reducing the water footprint of open thin-
layer cultivation methods, and reducing the use of GWP-heavy solvents in lipid
conversion. This is not to say that effort should not be spent on promising
technology such as wet conversion methods but that comparatively more effort
Stage 1 Stage 2 Stage 3 Stage 4 Delivery-200000
0
200000
400000
600000
800000
1000000
1200000
1400000
1600000
GW
P-1
00
a (k
g C
O2
eq
uiv
ale
nt)
GWP-100a
Figure 28: Life Cycle GWP for Environmentally Optimal Production Chain

35
should be placed on methods today that are in closer proximity to environmental
goals.
Comparing with the NER, WF, and GWP of petroleum diesel and soybean biodiesel
that have been discussed in the literature review segment, it is clear that third-
generation biodiesel still has some way to go before it can truly claim to be
environmentally sustainable. The NER of 1.22 clearly lags behind that of corn
biodiesel (3.22) although they do prove slightly less environmentally malignant than
petroleum diesel (0.83). The WF of 2.7 tonnes per GJ is in significant excess of that of
petroleum diesel (0.0098 tonnes per GJ) although it uses much less water than first-
generation biodiesel (32.2 tonnes). Finally, the GWP of 0.9 tonnes per GJ is far in
excess of both petroleum diesel (0.032 tonnes per GJ) and corn biodiesel (0.04
tonnes per GJ). Hence, today’s microalgae-based biodiesel production is some way
off its claims on environmental sustainability and definitely not an unambiguous
improvement over the status quo.
However, there is still much optimism with regards to third-generation biodiesel. For
instance, this study has pinpointed 3 aforementioned specific areas for researchers
and environmental policy makers to focus on to unlock the full potential of third-
generation biodiesel sooner rather than later.
-20%
0%
20%
40%
60%
80%
100%
Total Energy Water Footprint GWP-100a
Delivery
Stage 4
Stage 3
Stage 2
Stage 1
Figure 29: Summary of Contribution of Each Stage to the 3 Environmental Dimensions

36
6 Conclusion and Future Work
From the wide variation in NER, WF, and GWP findings across different options
considered at different production process steps, it is clear that some production
chains are much more environmentally benign than others.
Of all the production chains considered in this study, the environmentally optional
one involves open thin-layer photo-bioreactor cultivation, single-step chitosan
harvesting, belt drying, and direct in-situ trans-esterification. Using this production
chain, biodiesel produced from 100000 kg cultivated algal biomass has a WF and
GWP of 4350 tonnes of water and 1470 tonnes of CO2-equivalent GHG respectively
while the NER is 1.22. This works out to 2.7 tonnes of water used and 0.9 tonnes of
CO2-equivalent GHG produced per GJ of biodiesel.
With NER just over unity, large-scale microalgae-based biodiesel production remains
barely energetically feasible today despite its NER exceeding that of petroleum
diesel (0.83) [58]. Moreover, WF and GWP are well above that of an equivalent GJ of
petroleum diesel (0.0098 tonnes of water and 0.032 tonnes of GHG equivalent CO2
[58]). Consequently, large-scale microalgae-based biodiesel production today is
some distance from environmentally sustainable, contrary to conventional wisdom.
However, it is important to note that this study does not include novel industrial
solutions to reduce the environmental footprint of microalgae-based biodiesel
production. Localised solutions such as process integration [91, 92] and introduction
of novel additives [93] can further mitigate the environmental impact.
All in all, this project has accomplished the multiple objectives of:
Determining if third-generation biodiesel is indeed environmentally benign
given today’s technology;
Determining if all microalgae-based biodiesel production chains are equally
green; and

37
Identifying the production chain that is environmentally optimal if not all
methods are equally green.
This study pinpoints the areas in which future work in research and policy
development in biodiesel production should focus on to align with the objectives of
energy and environmental sustainability. This will allow the much-championed
environmental potential of microalgae-based biodiesel to be attained sooner rather
than later. The specific areas are:
Reducing energy used in biomass drying,
Reducing the water footprint of open thin-layer cultivation methods, and
Reducing the use of GWP-heavy solvents in lipid conversion
7 Supplementary Information
Working files, supporting documentation and modelling assumptions are available at
http://bit.ly/lca_eia.
References
[1] World Economic Outlook, "World Energy Outlook 2012," 2012. [2] ExxonMobil, "The Outlook for Energy: A View to 2040," 2013. [3] US Energy Initiative Administration, "International Energy Outlook 2013,"
2013. [4] Intergovernmental Panel on Climate Change, "Renewable Energy Sources and
Climate Change Mitigation: Special Report of the Intergovernmental Panel on Climate Change," 2012.
[5] R. K. Pachauri, "Climate change 2007. Synthesis report. Contribution of Working Groups I, II and III to the fourth assessment report," 2008.
[6] A. Demirbas, "Progress and recent trends in biodiesel fuels," Energy Conversion and Management, vol. 50, pp. 14-34, 2009.
[7] A. Demirbas, "Progress and recent trends in biofuels," Progress in Energy and Combustion Science, vol. 33, pp. 1-18, 2007.
[8] G. C. Dismukes, D. Carrieri, N. Bennette, G. M. Ananyev, and M. C. Posewitz, "Aquatic phototrophs: efficient alternatives to land-based crops for biofuels," Curr Opin Biotechnol, vol. 19, pp. 235-40, Jun 2008.
[9] M. J. Groom, E. M. Gray, and P. A. Townsend, "Biofuels and biodiversity: principles for creating better policies for biofuel production," Conserv Biol, vol. 22, pp. 602-9, Jun 2008.

38
[10] M. K. Danquah, L. Ang, N. Uduman, N. Moheimani, and G. M. Forde, "Dewatering of microalgal culture for biodiesel production: exploring polymer flocculation and tangential flow filtration," Journal of Chemical Technology & Biotechnology, vol. 84, pp. 1078-1083, 2009.
[11] S. C. Davis, K. J. Anderson-Teixeira, and E. H. Delucia, "Life-cycle analysis and the ecology of biofuels," Trends Plant Sci, vol. 14, pp. 140-6, Mar 2009.
[12] M. Fatih Demirbas, "Biorefineries for biofuel upgrading: A critical review," Applied Energy, vol. 86, pp. S151-S161, 2009.
[13] G. Finnveden, M. Z. Hauschild, T. Ekvall, J. Guinee, R. Heijungs, S. Hellweg, et al., "Recent developments in Life Cycle Assessment," J Environ Manage, vol. 91, pp. 1-21, Oct 2009.
[14] L. Gouveia and A. C. Oliveira, "Microalgae as a raw material for biofuels production," J Ind Microbiol Biotechnol, vol. 36, pp. 269-74, Feb 2009.
[15] L. Rodolfi, G. Chini Zittelli, N. Bassi, G. Padovani, N. Biondi, G. Bonini, et al., "Microalgae for oil: strain selection, induction of lipid synthesis and outdoor mass cultivation in a low-cost photobioreactor," Biotechnol Bioeng, vol. 102, pp. 100-12, Jan 1 2009.
[16] M. Balat and H. Balat, "Progress in biodiesel processing," Applied Energy, vol. 87, pp. 1815-1835, 2010.
[17] L. Brennan and P. Owende, "Biofuels from microalgae—A review of technologies for production, processing, and extractions of biofuels and co-products," Renewable and Sustainable Energy Reviews, vol. 14, pp. 557-577, 2010.
[18] O. Jorquera, A. Kiperstok, E. A. Sales, M. Embirucu, and M. L. Ghirardi, "Comparative energy life-cycle analyses of microalgal biomass production in open ponds and photobioreactors," Bioresour Technol, vol. 101, pp. 1406-13, Feb 2010.
[19] T. M. Mata, A. A. Martins, and N. S. Caetano, "Microalgae for biodiesel production and other applications: A review," Renewable and Sustainable Energy Reviews, vol. 14, pp. 217-232, 2010.
[20] A. L. Stephenson, E. Kazamia, J. S. Dennis, C. J. Howe, S. A. Scott, and A. G. Smith, "Life-Cycle Assessment of Potential Algal Biodiesel Production in the United Kingdom: A Comparison of Raceways and Air-Lift Tubular Bioreactors," Energy & Fuels, vol. 24, pp. 4062-4077, 2010.
[21] A. L. Ahmad, N. H. M. Yasin, C. J. C. Derek, and J. K. Lim, "Microalgae as a sustainable energy source for biodiesel production: A review," Renewable and Sustainable Energy Reviews, vol. 15, pp. 584-593, 2011.
[22] L. F. Razon and R. R. Tan, "Net energy analysis of the production of biodiesel and biogas from the microalgae: Haematococcus pluvialis and Nannochloropsis," Applied Energy, vol. 88, pp. 3507-3514, 2011.
[23] A. Yang, "Modeling and Evaluation of CO2Supply and Utilization in Algal Ponds," Industrial & Engineering Chemistry Research, vol. 50, pp. 11181-11192, 2011.
[24] N. N. A. N. Yusuf, S. K. Kamarudin, and Z. Yaakub, "Overview on the current trends in biodiesel production," Energy Conversion and Management, vol. 52, pp. 2741-2751, 2011.

39
[25] R. Chowdhury, S. Viamajala, and R. Gerlach, "Reduction of environmental and energy footprint of microalgal biodiesel production through material and energy integration," Bioresour Technol, vol. 108, pp. 102-11, Mar 2012.
[26] N. R. Countil, "Sustainable Development of Algal Biofuels in the United States," pp. 2-247, 2012.
[27] H. C. Ong, T. M. I. Mahlia, H. H. Masjuki, and D. Honnery, "Life cycle cost and sensitivity analysis of palm biodiesel production," Fuel, vol. 98, pp. 131-139, 2012.
[28] M. Dębowski, M. Zieliński, A. Grala, and M. Dudek, "Algae biomass as an alternative substrate in biogas production technologies—Review," Renewable and Sustainable Energy Reviews, vol. 27, pp. 596-604, 2013.
[29] S. A. Razzak, M. M. Hossain, R. A. Lucky, A. S. Bassi, and H. de Lasa, "Integrated CO2 capture, wastewater treatment and biofuel production by microalgae culturing—A review," Renewable and Sustainable Energy Reviews, vol. 27, pp. 622-653, 2013.
[30] S. D. Rios, C. M. Torres, C. Torras, J. Salvado, J. M. Mateo-Sanz, and L. Jimenez, "Microalgae-based biodiesel: economic analysis of downstream process realistic scenarios," Bioresour Technol, vol. 136, pp. 617-25, May 2013.
[31] C. M. Torres, S. D. Ríos, C. Torras, J. Salvadó, J. M. Mateo-Sanz, and L. Jiménez, "Microalgae-based biodiesel: a multicriteria analysis of the production process using realistic scenarios," Bioresource Technology, 2013.
[32] G. G. Zaimes and V. Khanna, "Microalgal biomass production pathways: evaluation of life cycle environmental impacts," Biotechnology for Biofuels, vol. 6, Jun 2013.
[33] G. G. Zaimes and V. Khanna, "Environmental sustainability of emerging algal biofuels: A comparative life cycle evaluation of algal biodiesel and renewable diesel," Environmental Progress & Sustainable Energy, pp. n/a-n/a, 2013.
[34] U. S. D. o. Energy, "Energy Demands on Water Resources," Report to Congress On the Interdependency of Energy and Water, pp. 1-80, 2006.
[35] M. Z. Jacobson, "Review of solutions to global warming, air pollution, and energy security," Energy & Environmental Science, vol. 2, pp. 148-173, 2008.
[36] G. Dragone, B. Fernandes, A. A. Vincente, and J. A. Teixeira, "Third generation biofuels from microalgae," Current Researchm Technology and Education Topics in Applied Microbiology and Microbial Biotechnology, 2010.
[37] L. Lardon, A. Helias, B. Sialve, J. P. Steyer, and O. Bernard, "Life-cycle Assessment of Biodiesel Production from Microalgae," Environmental Science Technology, vol. 43, 2009.
[38] P. K. Campbell, T. Beer, and D. Batten, "Life cycle assessment of biodiesel production from microalgae in ponds," Bioresour Technol, vol. 102, pp. 50-6, Jan 2011.
[39] P. Collet, A. Helias, L. Lardon, M. Ras, R. A. Goy, and J. P. Steyer, "Life-cycle assessment of microalgae culture coupled to biogas production," Bioresour Technol, vol. 102, pp. 207-14, Jan 2011.
[40] E. Stephens, I. L. Ross, Z. King, J. H. Mussgnug, O. Kruse, C. Posten, et al., "An economic and technical evaluation of microalgal biofuels," Nat Biotechnol, vol. 28, pp. 126-8, Feb 2010.

40
[41] Y. Chisti, "Biodiesel from microalgae," Biotechnol Adv, vol. 25, pp. 294-306, May-Jun 2007.
[42] Solazyme, "Meeting the growing need for renewable fuels," 2013. [43] E. E. A. S. Committee, "Opinion of the EEA Scientific Committee on
Greenhouse Gas Accounting in Relation to Bioenergy," 2011. [44] P. R. Adler, S. J. Del Grosso, and W. J. Parton, "Life-cycle assessment of net
greenhouse-gas flux for bioenergy cropping systems," Ecological Applications, vol. 17, pp. 675-691, 2007.
[45] A. F. Clarens, E. P. Resurreccion, M. A. White, and L. M. Colosi, "Environmental Life Cycle Comparison of Algae to Other Bioenergy Feedstocks," Environmental Science Technology, vol. 2010, pp. 1813-1819, 2009.
[46] H. H. Khoo, P. N. Sharratt, P. Das, R. K. Balasubramanian, P. K. Naraharisetti, and S. Shaik, "Life cycle energy and CO2 analysis of microalgae-to-biodiesel: preliminary results and comparisons," Bioresour Technol, vol. 102, pp. 5800-7, May 2011.
[47] E. D. Larson, "A review of life-cycle analysis studies on liquid biosystems for the transport sector," Energy for Sustainable Development, vol. X, 2006.
[48] M. Pehnt, "Dynamic life cycle assessment (LCA) of renewable energy technologies," Renewable Energy, vol. 31, pp. 55-71, 2006.
[49] G. Rebitzer, T. Ekvall, R. Frischknecht, D. Hunkeler, G. Norris, T. Rydberg, et al., "Life cycle assessment part 1: framework, goal and scope definition, inventory analysis, and applications," Environ Int, vol. 30, pp. 701-20, Jul 2004.
[50] K. Sander and G. Murthy, "Life cycle analysis of algae biodiesel," International Journal of Life Cycle Assessment, vol. 2010, pp. 704-714, 2010.
[51] J. Yang, M. Xu, X. Zhang, Q. Hu, M. Sommerfeld, and Y. Chen, "Life-cycle analysis on biodiesel production from microalgae: water footprint and nutrients balance," Bioresour Technol, vol. 102, pp. 159-65, Jan 2011.
[52] C. J. Vorosmarty, P. B. McIntyre, M. O. Gessner, D. Dudgeon, A. Prusevich, P. Green, et al., "Global threats to human water security and river biodiversity," Nature, vol. 467, pp. 555-61, Sep 30 2010.
[53] F. Delrue, P. A. Setier, C. Sahut, L. Cournac, A. Roubaud, G. Peltier, et al., "An economic, sustainability, and energetic model of biodiesel production from microalgae," Bioresour Technol, vol. 111, pp. 191-200, May 2012.
[54] L. Xu, D. W. Wim Brilman, J. A. Withag, G. Brem, and S. Kersten, "Assessment of a dry and a wet route for the production of biofuels from microalgae: energy balance analysis," Bioresour Technol, vol. 102, pp. 5113-22, Apr 2011.
[55] L. B. Brentner, M. J. Eckelman, and J. B. Zimmerman, "Combinatorial life cycle assessment to inform process design of industrial production of algal biodiesel," Environ Sci Technol, vol. 45, pp. 7060-7, Aug 15 2011.
[56] L. Batan, J. Quinn, B. Willson, and T. Bradley, "Net Energy and Greenhouse Gas Emission Evaluation of Biodiesel Derived from Microalgae," Environmental Science and Technology, vol. 2010, pp. 7975-7980, 2010.
[57] L. Yanfen, H. Zehao, and M. Xiaoqian, "Energy analysis and environmental impacts of microalgal biodiesel in China," Energy Policy, vol. 45, pp. 142-151, 2012.

41
[58] J. Sheehan, V. Camobreco, J. Duffield, M. Graboski, and H. Shapouri, "An Overview of Biodiesel and Petroleum Diesel Life Cycles," National Renewable Energy Laboratory, 1998.
[59] A. Bahadur, M. Zubair, and M. B. Khan, "Design, construction and evaluation of solarized airlift tubular photobioreactor," Journal of Physics: Conference Series, vol. 439, p. 012036, 2013.
[60] Z. Cheng-Wu, O. Zmora, R. Kopel, and A. Richmond, "An industrial-size flat plate glass reactor for mass production of Nannochloropsis sp. (Eustigmatophyceae)," Aqualculture, vol. 195, pp. 35-49, 2001.
[61] J. Doucha and K. Lívanský, "Outdoor open thin-layer microalgal photobioreactor: potential productivity," Journal of Applied Phycology, vol. 21, pp. 111-117, 2008.
[62] J. Doucha, F. Straka, and K. Lívanský, "Utilization of flue gas for cultivation of microalgae Chlorella sp.) in an outdoor open thin-layer photobioreactor," Journal of Applied Phycology, vol. 17, pp. 403-412, 2005.
[63] X. Li, H. Xu, and Q. Wu, "Large-scale biodiesel production from microalga Chlorella protothecoides through heterotrophic cultivation in bioreactors," Biotechnol Bioeng, vol. 98, pp. 764-71, Nov 1 2007.
[64] E. Molina, J. Fernandez, F. G. Acien, and Y. Chisti, "Tubular photobioreactor design for algal cultures," Journal of Biotechnology, vol. 92, pp. 113-131, 2001.
[65] M. Olaizola, "Commercial production of astaxanthin from Haematococcus pluvialis using 25,000-liter outdoor photobioreactor," Journal of Applied Phycology, vol. 12, pp. 499-506, 2000.
[66] A. Richmond, S. Boussiba, A. Vonshak, and R. Kopel, "A new tubular reactor for mass production of microalgae outdoors," Journal of Applied Phycology, vol. 5, pp. 327-332, 1993.
[67] J. J. Yoo, S. P. Choi, J. Y. Kim, W. S. Chang, and S. J. Sim, "Development of thin-film photo-bioreactor and its application to outdoor culture of microalgae," Bioprocess Biosyst Eng, vol. 36, pp. 729-36, Jun 2013.
[68] N. Uduman, Y. Qi, M. K. Danquah, G. M. Forde, and A. Hoadley, "Dewatering of microalgal cultures: A major bottleneck to algae-based fuels," Journal of Renewable and Sustainable Energy, vol. 2, p. 012701, 2010.
[69] A. B. Aragon, R. B. Padilla, and J. A. Fiestas Ros de Ursinos, "Experimental study of the recovery of algae cultured in effluents from the anaerobic biological treatment of urban wastewaters," Resources, Conservation and Recycling, vol. 6, pp. 293-302, 1992.
[70] BASF, "Technical Information: Zetag 7650," 2013. [71] E. S. Beach, M. J. Eckelman, Z. Cui, L. Brentner, and J. B. Zimmerman,
"Preferential technological and life cycle environmental performance of chitosan flocculation for harvesting of the green algae Neochloris oleoabundans," Bioresour Technol, vol. 121, pp. 445-9, Oct 2012.
[72] R. Bosma, W. A. v. Spronsen, J. Tramper, and R. H. Wifffels, "Ultrasound, a new separation technique to harvest microalgae," Journal of Applied Phycology, vol. 15, pp. 143-153, 2003.

42
[73] M. S. Farid, A. Shariati, A. Badakhshan, and B. Anvaripour, "Using nano-chitosan for harvesting microalga Nannochloropsis sp," Bioresour Technol, vol. 131, pp. 555-9, Mar 2013.
[74] J. Kim, B. G. Ryu, B. K. Kim, J. I. Han, and J. W. Yang, "Continuous microalgae recovery using electrolysis with polarity exchange," Bioresour Technol, vol. 111, pp. 268-75, May 2012.
[75] K. Lee, S. Y. Lee, N. Jeong-Geol, S. G. Jeon, and Ramasamy, "Magnetophoretic harvesting of oleaginous Chlorella sp. by using biocompatible chitosan/magnetic nanoparticle composites," Bioresource Technology, vol. 2013, 2013.
[76] E. Molina Grima, E.-H. Belarbi, F. G. Acien Fernandez, A. Robles Medina, and Y. Chisti, "<Molina_Dewatering.pdf>."
[77] N. Rossignol, L. Vandanjon, P. Jaouen, and F. Quemeneur, "Membrane Technology for the continuous separation microalgae/culture medium: compared performances of cross-flow microfiltration and ultrafiltration," Aqualcultural Engineering, vol. 20, pp. 191-208, 1999.
[78] D. Vandamme, S. C. Pontes, K. Goiris, I. Foubert, L. J. Pinoy, and K. Muylaert, "Evaluation of electro-coagulation-flocculation for harvesting marine and freshwater microalgae," Biotechnol Bioeng, May 6 2011.
[79] A. R. Volkel, H. B. Hsieh, N. Chang, K. Melde, and A. Kole, "Innovative Algae Dewatering Technology."
[80] J. Y. Lee, C. Yoo, S. Y. Jun, C. Y. Ahn, and H. M. Oh, "Comparison of several methods for effective lipid extraction from microalgae," Bioresour Technol, vol. 101 Suppl 1, pp. S75-7, Jan 2010.
[81] F. Bunge, M. Pietzsch, R. Muller, and C. Syldatk, "Mechanical Disruption of Arthrobacter SP. DSM 3747 In Stirred Ball Mills for the Release of Hydantoin-cleaving Enzymes," Chemical Engineering Science, vol. 47, pp. 225-232, 1992.
[82] C. G. J. Baker and K. A. McKenzie, "Energy Consumption of Industrial Spray Dryers," Drying Technology, vol. 23, pp. 365-386, 2005.
[83] M. Hassebrauck and G. Ermel, "Two examples of thermal drying of sewage sludge," Water science and technology, vol. 33, pp. 235-242, 1996.
[84] A. S. Mujumdar, "Handbook of Industrial Drying - Third Edition," CRC Press, Taylor & Francis Group, 2006.
[85] S. J. Lee, B.-D. Yoon, and H. M. Oh, "Rapid Method for the Determination of Lipid from the Green Alga Botryococcus Braunii," Biotechnology Techniques, vol. 12, pp. 553-556, 1998.
[86] R. Halim, B. Gladman, M. K. Danquah, and P. A. Webley, "Oil extraction from microalgae for biodiesel production," Bioresour Technol, vol. 102, pp. 178-85, Jan 2011.
[87] G. Andrich, U. Nesti, F. Venturi, A. Zinnai, and R. Fiorentini, "Supercritical fluid extraction of bioactive lipids from the microalgaNannochloropsissp," European Journal of Lipid Science and Technology, vol. 107, pp. 381-386, 2005.
[88] R. L. Mendes and H. L. Fernandes, "Applications of Supercritical CO2 Extraction to Microalgae and Plants," Journal of Chemical Technology & Biotechnology, vol. 1995, pp. 53-59, 1995.

43
[89] M. B. Johnson and Z. Wen, "Production of Biodiesel Fuel from the MicroalgaSchizochytrium limacinumby Direct Transesterification of Algal Biomass," Energy & Fuels, vol. 23, pp. 5179-5183, 2009.
[90] M. H. Huesemann and J. R. Benemann, "Biofuels from Microalgae: Review of Products, Processes and Potential, with Special Focus on Dunaliella sp," ed: Pacific Northwest National Laboratory (PNNL), Richland, WA (US), 2009.
[91] T. L. da Silva, L. Gouveia, and A. Reis, "Integrated microbial processes for biofuels and high value-added products: the way to improve the cost effectiveness of biofuel production," Appl Microbiol Biotechnol, Dec 13 2013.
[92] Y. Zhou, L. Schideman, G. Yu, and Y. Zhang, "A synergistic combination of algal wastewater treatment and hydrothermal biofuel production maximized by nutrient and carbon recycling," Energy & Environmental Science, vol. 6, p. 3765, 2013.
[93] M. Min, B. Hu, M. J. Mohr, A. Shi, J. Ding, Y. Sun, et al., "Swine Manure-Based Pilot-Scale Algal Biomass Production System for Fuel Production and Wastewater Treatment-a Case Study," Appl Biochem Biotechnol, Nov 8 2013.

1 - 1
Annexes
Annex 1 – Definition of Terms
Net Energy Ratio: The ratio of the total energy produced over life cycle energy
required for the unit plant operation. Here, the total energy produced is taken as the
energy of biomass that is maximally producible.
NER = ∑ 𝐸𝑛𝑒𝑟𝑔𝑦 𝑃𝑟𝑜𝑑𝑢𝑐𝑒𝑑
∑ 𝐸𝑛𝑒𝑟𝑔𝑦 𝑟𝑒𝑞𝑢𝑖𝑟𝑒𝑚𝑒𝑛𝑡𝑠
Water Footprint: Total water required for and exhausted during the unit plant
operation.
Global Warming Potential: Total emissions from the unit plant operation that has
been converted to that of emission of an equivalent mass of CO2. The definition
used in the LCAs are based on the 2000 Intergovernmental Panel on Climate Change
Revision over a time horizon of 100 years. GWP is calculated through OpenLCA.
FAME: Fatty Acid Methyl Esters.

2 - 1
Annex 2 – Key Modelling Parameters Obtained from the Literature
Variables Raceway (Jorquera)
Flat Plate (Jorquera)
Tubular (Molina)
Tubular (Bahadur)
Thin Layer (Doucha)
Thin Layer (Doucha, Updated)
Thin Layer (Yoo)
Flat Plate (Cheng-Wu)
Enclosed (Olaizola)
Tubular (Richmond)
Heterotrophic (Li)
No. of Units in Entire System to produce 100 ton Dry Biomass
23 113 917 21076 241 39 182649 1015 250 1301 15
Volume of 1 unit of reactor (m3)
350 9.02 0.20 0.02 0.73 2.00 0.025 1.00 25.0 0.140 11.0
Volumetric productivity (kg/(m3d))
0.0350 0.270 1.50 0.650 1.56 3.57 0.0600 0.270 0.0440 1.50 1.70
Illuminated area/volume ratio (m-1)
3.08 20.1 75.4 76.4 75.3 112 60.3 20.4 4.00 115 0
Occupied area/volume ratio (m-1)
2.86 11.0 0.600 57.5 75.3 112 60.3 3.00 4.00 70.6 1.32
Biomass concentration (kg/m3)
0.350 2.70 3.96 3.96 30.0 40.0 3.84 0.245 0.268 2.00 14.2
Energy consumption (W/m3)
3.72 53.0 2000 2000 500 500 12.9 479 68.6 2000 7490
Table 3: Key Modelling Parameters Extracted or Calculated from Literature for Cultivation Section

2 - 2
Basis: Uduman et. al, 2010 Lower Bound of Output TSS (%)
Upper Bound of Output TSS (%)
Lower Bound of Yield (%)
Upper Bound of Yield (%)
Lower Bound of Concentration Factor
Upper Bound of Concentration Factor
Energy Requirement in kWh/m3
Chemical Requirements
Centrifugation
12.0 40.0 95.0
120 8.00
Filtration
Natural filtration
1.00 6.00
89 15.0 60.0 0.400
Pressure filtration
5.00 27.0
89 50.0 245 0.880
Tangential flow filtration
70.0 89.0 5.00 40.0 2.06
Gravity Sedimentation 0.500 1.50
95
16.0 0.100
Flocculation-flotation 1.00 6.00 80.0 90.0
15.0 Alum, Ferric sulphate
Electrophoresis techniques
Electrolytic coagulation
99.5
95.0
1.15 Aluminium electrodes
Electrolytic flocculation
90.0
0.331
Basis: Danquah et. al, 2009 Lower Bound of Output TSS (%)
Upper Bound of Output TSS (%)
Lower Bound of Yield (%)
Upper Bound of Yield (%)
Lower Bound of Concentration Factor
Upper Bound of Concentration Factor
Energy Requirement in kWh/m3
Chemical Requirements
Vacuum Filtration 0.500 18.0
89
5.90
Polymer Flocculation 0.042 15.0
95.0
14.8 Zetag and Al
Basis: Beach et. al, 2012 Lower Bound of Output TSS (%)
Upper Bound of Output TSS (%)
Lower Bound of Yield (%)
Upper Bound of Yield (%)
Lower Bound of Concentration Factor
Upper Bound of Concentration Factor
Energy Requirement in kWh/m3
Chemical Requirements
Chitosan Flocculation
22.0
95.0
0.142 Chitosan
Basis: Lee et. al, 2013 Lower Bound of Output TSS (%)
Upper Bound of Output TSS (%)
Lower Bound of Yield (%)
Upper Bound of Yield (%)
Lower Bound of Concentration Factor
Upper Bound of Concentration Factor
Energy Requirement in kWh/m3
Chemical Requirements
Magnetophoretic Harvesting 0.042 15.0
99.0
0.142 Chitosan and Fe3O4
Basis: Bosma et. al, 2003 Lower Bound of Output TSS (%)
Upper Bound of Output TSS (%)
Lower Bound of Yield (%)
Upper Bound of Yield (%)
Lower Bound of Concentration Factor
Upper Bound of Concentration Factor
Energy Requirement in kWh/m3
Chemical Requirements
Ultrasonic Aggregation 0.0450 0.900
92.0
20.0 19.2
Table 4: Key Modelling Parameters Extracted or Calculated from Literature for Harvesting Section

2 - 3
No Disruption Autoclave Bead-beating Microwave Ultrasound Osmotic Shock
Basis Lee et. al, 2010 Lee et. al, 2010 Bunge, 1992 Lee et. al, 2010 Lee et. al, 2010 Lee et. al, 2010
Energy Use (kWh/m3) 0 6.37 27.8 3.33 6.25 0
Lipid Extraction Efficiency (%) 5.00 9.00 15.6 16.3 8.33 9.33
Normalised Energy Use (kWh/% change in m3) 0 1.59 2.62 0.294 1.88 0
Normalised Energy Use (MJ/% change in m3) 0 5.74 9.43 1.06 6.76 0
Normalised Energy Use based on Assumed Target Extraction Efficiency (MJ) 0 125 3.22 26.2 147 0
Chemicals - - - - - 10% NaCl solution used
Chemical requirement - - - - - 100
Table 5: Key Modelling Parameters Extracted or Calculated from Literature for Cell Disruption Sub-section of Extraction Section
No Drying Spray Drying Freeze Drying Thermal Drying Drum Dryer Belt Dryer
Energy Required (kJ/kg) 0 4870 5400 4850 3916.8 3340.8
Source - Baker, 2005 Mujumdar, 2006 Mujumdar, 2006 Hassebrauck & Ermel, 1996 Hassebrauck & Ermel, 1996
Table 6: Key Modelling Parameters Extracted or Calculated from Literature for Drying Sub-section of Extraction Section
Type Solvent Solvent Supercritical CO2 Supercritical CO2
Source Lee et. al, 1998 Halim et. al, 2011 Andrich et. al, 2005 Mendes et. al, 1995
Duration 50.0 450 360 500
Agitation 800 800
Energy Requirement (GJ/tonne biomass) 23.6 99.4 27.0 52.0
Energy Requirement with non-Ambient Consideration (GJ/tonne biomass) 23.6 99.4 40.3 1200
Solvent Requirement (mL/g dried biomass) 250 75.0 - -
Solvents Chloroform to Methanol Hexane to isopropanol CO2 CO2
Table 7: Key Modelling Parameters Extracted or Calculated from Literature for Lipid Extraction Sub-section of Extraction Section

2 - 4
Description Solvents Data Source Solvent Ratio (in order, wrt
Biodiesel g:kg)
Solvent 1 Requirement
(g per kg biodiesel)
Solvent 2 Requirement
(g per kg biodiesel)
Solvent 3 Requirement
(g per kg biodiesel)
Solvent 4 Requirement
(g per kg biodiesel)
FAME Conversion
Yield (%)
Energy Requirement
(GJ per kg biodiesel)
Extraction - TransE (Wet)
Methanol, Sodium
Methoxide (Cat), HCl,
NaOH
Batan et. al, 2010
0.1:0.0125:0.0071:0.005:1
0.100 0.0125 0.00710 0.00500 51.12 0.00419
Extraction - TransE (Dry)
Methanol, Sodium
Methoxide (Cat), HCl,
NaOH
Batan et. al, 2010
0.1:0.0125:0.0071:0.005:1
0.100 0.0125 0.0071 0.00500 63.7 0.00333
Direct In Situ (Wet)
Methanol, Sulphuric
Acid, Solvent: Hexane
Johnson, 2009
(3.4/0.791):(0.6/1):(4/X):(1/1000 x 0.296 x 0.95)
15300 2130 21600 - 8.45 0.0285
Direct In Situ (Dry)
Methanol, Sulphuric
Acid, Solvent: Hexane
Johnson, 2009
(3.4/0.791):(0.6/1):(4/X):(1/1000 x 0.296 x 0.95)
15300 2130 21600 - 72.79 0.00348
Table 8: Key Modelling Parameters Extracted or Calculated from Literature for Conversion Section

3 - 1
Annex 3 – Options Considered for Harvesting Production Step
The 45 options considered are listed in Table 9.
S/N Stage 1 Stage 2
1 Pressure filtration
2 Tangential flow filtration
3 Electrolytic coagulation
4 Electrolytic flocculation
5 Chitosan Flocculation
6 Centrifugation Pressure filtration
7 Centrifugation Tangential flow filtration
8 Centrifugation Electrolytic coagulation
9 Centrifugation Electrolytic flocculation
10 Centrifugation Chitosan Flocculation
11 Natural filtration Pressure filtration
12 Natural filtration Tangential flow filtration
13 Natural filtration Electrolytic coagulation
14 Natural filtration Electrolytic flocculation
15 Natural filtration Chitosan Flocculation
16 Gravity Sedimentation Pressure filtration
17 Gravity Sedimentation Tangential flow filtration
18 Gravity Sedimentation Electrolytic coagulation
19 Gravity Sedimentation Electrolytic flocculation
20 Gravity Sedimentation Chitosan Flocculation
21 Flocculation-flotation Pressure filtration
22 Flocculation-flotation Tangential flow filtration
23 Flocculation-flotation Electrolytic coagulation
24 Flocculation-flotation Electrolytic flocculation
25 Flocculation-flotation Chitosan Flocculation
26 Vacuum Filtration Pressure filtration
27 Vacuum Filtration Tangential flow filtration
28 Vacuum Filtration Electrolytic coagulation
29 Vacuum Filtration Electrolytic flocculation
30 Vacuum Filtration Chitosan Flocculation
31 Polymer Flocculation Pressure filtration
32 Polymer Flocculation Tangential flow filtration
33 Polymer Flocculation Electrolytic coagulation
34 Polymer Flocculation Electrolytic flocculation
35 Polymer Flocculation Chitosan Flocculation
36 Magnetophoretic Harvesting Pressure filtration
37 Magnetophoretic Harvesting Tangential flow filtration
38 Magnetophoretic Harvesting Electrolytic coagulation
39 Magnetophoretic Harvesting Electrolytic flocculation
40 Magnetophoretic Harvesting Chitosan Flocculation
41 Ultrasonic Aggregation Pressure filtration
42 Ultrasonic Aggregation Tangential flow filtration
43 Ultrasonic Aggregation Electrolytic coagulation
44 Ultrasonic Aggregation Electrolytic flocculation
45 Ultrasonic Aggregation Chitosan Flocculation Table 9: Options Considered for Harvesting Segment of Production Chain

3 - 2
The energy comparison for the harvesting step is enabled by the dewatering energy
usage per unit volume listed in the literature. The main papers used to obtain the
harvesting parameters are: Uduman et. al [68], 2010, Danquah et. al [10], 2009,
Beach et. al [71], Lee et. al [75], and Bosma et. al [72]. Both common dewatering
techniques and novel ones (Magnetophoretic) were considered.

4 - 1
Annex 4 – Options Considered for Extraction Production Step
There are 3 sub-stages considered within the extraction production step. They are: cell disruption, drying, and lipid extraction. 6 options are considered in cell disruption, 6 in drying, and 4 in lipid extraction. These are listed in Tables 10 to 12, resulting in a total of 6 x 6 x 4 = 144 combinations in the extraction step.
S/N Disruption Sub-Stage
1 No Disruption
2 Autoclave disruption
3 Bead-beating
4 Microwave disruption
5 Ultrasound disruption
6 Osmotic shock Table 10: Options in Disruption Sub-Stage
S/N Drying Sub-Stage
1 No drying
2 Spray drying
3 Freeze drying
4 Thermal drying
5 Drum drying
6 Belt drying Table 11: Options in Drying Sub-Stage
S/N Lipid Extraction Sub-Stage
1 Solvent extraction (Lee et. al)
2 Solvent Extraction (Halim et. al)
3 Supercritical CO2 extraction (Andrich et. al)
4 Supercritical CO2 extraction (Mendes et. al) Table 12: Options in Lipid Extraction Sub-Stage

5 - 1
Annex 5 – Options Considered for Conversion Production Step
The 4 options considered for the conversion production step are listed in Table 13.
S/N Conversion Stage
1 Wet post extraction transesterification (Batan et. al, 2010)
2 Dry post extraction transesterification (Batan et. al, 2010)
3 Wet direct in-situ transesterification (Johnson et. al, 2009)
4 Dry direct in-situ transesterification (Johnson et. al, 2009) Table 13: Options in Conversion Sub-Stage

6 - 1
Annex 6 – Project Timeline
This project has taken 5 months to its present state. Table 14 indicates the milestones that either have been achieved during this time or will
be achieved in the coming months.
S/N. Milestone Date
1 Completion of Cultivation EIA Studies 31 August 2013
2 Completion of Harvesting EIA Studies 24 September 2013
3 Completion of Interim Report 17 October 2013
4 Completion of Extraction Studies 14 November 2013
5 Completion of Conversion LCA Study 6 December 2013
6 Completion of Environmental Impact Analysis for entire Microalgae-based Biodiesel Production Chain 18 December 2013
7 Completion of FYP Project Review 24 December 2013
8 Completion of Draft FYP Final Report 31 December 2013
9 Projected Completion and Submission of Finalised FYP Final Report 15 January 2014
10 Projected Completion of Draft FYP Presentation 10 February 2014
11 Projected Completion and Submission of Finalised FYP Presentation 28 February 2014
12 Projected Completion of Draft FYP Poster 7 March 2014
13 Projected Completion and Submission of Finalised FYP Poster 14 March 2014 Table 14: Milestone Dates