Colorado Basin 3D structure and evolution, Argentine passive margin
43
1 Colorado Basin 3D Structure and Evolution, Argentine passive margin J. Autin (1) , M. Scheck-Wenderoth (1) , M. J. Loegering (1) , Z. Anka (1) , E. Vallejo (2) , J. F. Rodriguez (2) , F. Dominguez (2) , D. Marchal (2) , C. Reichert (3) , R. di Primio (1) , H.-J. Götze (4) (1) GFZ German Research Centre for Geosciences - Helmholtz-Zentrum Potsdam, Germany (2) Petrobras Argentina S.A., Buenos Aires, Argentina (3) Federal Institute for Geosciences and Natural Resources, Hannover, Germany (4) Institute for Geosciences, department of Geophysics, Christian-Albrechts-University, Kiel, Germany. Highlights The Colorado Basin is not entirely linked to the South Atlantic opening. Two different phases of extension are observed, the first is probably oblique. The Paleozoic structural inheritance controls the localisation of the deformation. ABSTRACT This 3D structural model of the Colorado Basin provides new insights into the crustal geometry of the basin and its evolution in relation with the Argentine passive margin. Three NW-SE segments (oblique to the N30°E-trending margin) structure the basin. The oldest infill is generally thought to be coeval with the rifting of the South Atlantic margins in Late Jurassic - Early Cretaceous. This coeval development of the Colorado Basin and of the passive margin is still under debate and gives rise to several hypotheses that we investigate in the light of our observations. We propose that reactivation of inherited structures is predominant in the evolution of the Colorado Basin: (1) the Western segment follows the continental continuation of the Colorado
-
Upload
independent -
Category
Documents
-
view
3 -
download
0
Transcript of Colorado Basin 3D structure and evolution, Argentine passive margin

1
Colorado Basin 3D Structure and Evolution, Argentine passive margin
J. Autin (1), M. Scheck-Wenderoth (1), M. J. Loegering (1), Z. Anka (1), E. Vallejo (2), J. F.
Rodriguez (2), F. Dominguez (2), D. Marchal (2), C. Reichert (3), R. di Primio (1), H.-J. Götze (4)
(1) GFZ German Research Centre for Geosciences - Helmholtz-Zentrum Potsdam, Germany
(2) Petrobras Argentina S.A., Buenos Aires, Argentina
(3) Federal Institute for Geosciences and Natural Resources, Hannover, Germany
(4) Institute for Geosciences, department of Geophysics, Christian-Albrechts-University, Kiel, Germany.
Highlights
The Colorado Basin is not entirely linked to the South Atlantic opening.
Two different phases of extension are observed, the first is probably oblique.
The Paleozoic structural inheritance controls the localisation of the deformation.
ABSTRACT
This 3D structural model of the Colorado Basin provides new insights into the crustal
geometry of the basin and its evolution in relation with the Argentine passive margin. Three
NW-SE segments (oblique to the N30°E-trending margin) structure the basin. The oldest infill
is generally thought to be coeval with the rifting of the South Atlantic margins in Late
Jurassic - Early Cretaceous. This coeval development of the Colorado Basin and of the
passive margin is still under debate and gives rise to several hypotheses that we investigate in
the light of our observations.
We propose that reactivation of inherited structures is predominant in the evolution of the
Colorado Basin: (1) the Western segment follows the continental continuation of the Colorado

2
transfer zone; (2) the Central segment consists in the continental continuation of the Tona
deformation zone; (3) the Eastern segment is superimposed over the Paleozoic Claromecó
Basin. In addition to the 3 segments, the Central High, separating the Central segment to the
Eastern segment, corresponds to the Paleozoic Sierras Australes Fold Belt.
The direction of extension responsible for the South Atlantic opening cannot explain the
syn-rift infill and thinning of the basin. The structural analysis shows two phases of syn-rift
deformation with different directions. Thus, we suggest that the Colorado Basin and the South
Atlantic margin are not coeval but that a first extensional event, probably oblique, predates
the extension responsible for the South Atlantic opening.
This event is then followed by the formation of the N30°-trending distal margin and the
reactivation of Paleozoic N70°-trending faults occurs under the NW-SE opening of the South
Atlantic. This two-phase evolution is consistent with the fault chronology and the two
directions of thinned crust observed in the distal margin.
1. INTRODUCTION
Passive margin studies increasingly show that their complex architecture needs to be
examined in three dimensions. Indeed, 2D conceptual models generally fail to include all the
lateral variation of the structures and the strong segmentation observed along these margins.
The development of 3D structural models of passive margins is accordingly a prerequisite in
order to address the whole complexity of the processes behind margin evolution.
The Colorado Basin is located offshore Argentina, in the Austral segment of the Western
South Atlantic margin (Figure 1). On both sides of the southern South Atlantic, huge wedges
of Seaward Dipping Reflections (SDRs) cover ocean-continent transitions (OCTs) indicating
volcanic passive margins (Austin and Uchupi, 1982; Franke et al., 2007; Gerrard and Smith,
1982; Gladczenko et al., 1997; Hinz, 1981; Hinz et al., 1999). In the Colorado Basin area, the

3
OCT is narrow and trends N30°E. Preceding the Early Cretaceous final breakup (Eagles,
2007; Gladczenko et al., 1997; Jokat et al., 2003; Lawver et al., 1998; Moulin et al., 2010;
Nürnberg and Müller, 1991; Peate, 1997; between 126-137 Ma, Rabinowitz and LaBrecque,
1979; Torsvik et al., 2009; Unternehr et al., 1988), the extension responsible for the South
Atlantic opening started in the Late Jurassic, around 150-155 Ma (Ghidella et al., 2007; Harry
and Sawyer, 1992; Nürnberg and Müller, 1991; Trumbull et al., 2007; Uliana et al., 1989).
The Colorado Basin, as the neighbouring Salado and San Jorge Basins, trends roughly E-W,
strongly oblique to the NNE-trending margin. It extends over 700 km in an E-W direction and
is about 200 km-wide. On the base of observations made in other South Atlantic basins
(Espírito Santo and Campos Basins, Estrella et al., 1984; Guardado et al., 1989), the oldest
syn-rift infill of the basin is proposed to be Late Jurassic - Early Cretaceous (Bushnell et al.,
2000; Franke et al., 2006; Fryklund et al., 1996; Juan et al., 1996). Nevertheless, this
assumption is based only on few wells penetrating the syn-rift along the rifted margin. E-W-
trending basins are specific for the South American side of the South Atlantic and differ from
the South African conjugate margin, where all the structures are roughly parallel to the
margin (Gerrard and Smith, 1982). The supposed coeval development of these E-W basins
and of the N30°E-trending passive margin has been already explained by at least 4
mechanisms and is still under debate: (1) The most frequent hypothesis explaining this
peculiar geometry proposes that these basins are aborted rifts resulting from a triple junction
(Asmus and Baisch, 1983; Franke et al., 2002; Yrigoyen, 1975). (2) Other authors also
propose that the basins developed as pull-apart basins associated with NW-SE dextral shear
systems (Franke et al., 2006; Keeley and Light, 1993; Tankard et al., 1995; Urien et al.,
1995). (3) In addition, most authors agree that pre-mesozoic structural inheritance may
influence the evolution of the Colorado Basin (Dominguez et al., 2011; Franke et al., 2006;
Pángaro and Ramos, 2012; Urien and Zambrano, 1973; Urien et al., 1995, 1981; Zambrano,

4
1980). This inheritance may have focused extensional deformation along pre-existing crustal
zones of weakness located obliquely to the direction of extension. (4) Some authors also
consider that the syn-rift deposits are not coeval and that a mesozoic rifting phase occurs
before the final opening of the South Atlantic (Macdonald et al., 2003). These authors
propose that early rifting was oblique (NE-SW extension), which created basins at high angle
to the trend of the ocean on the Argentine margin.
It is noteworthy that the Colorado Basin developed above a basement consisting of the
Gondwana Fold Belt (GFB), which corresponds to the Sierras Australes in Argentina
(Figure 1), to the Cape Fold Belt in South Africa (Cobbold et al., 1992; Daly et al., 1991;
Veevers et al., 1994; Visser and Praekelt, 1996) and the Weddell folding in the Ellsworth and
Pensacola mountains of Antarctica (Ford, 1972). Some evidence for the presence of the fold
belt below the Colorado Basin comes from seismic data: Strong reflectivity associated to
seismic velocities of more than 5 km.s-1 could be related to a series of imbricated thrust sheets
or asymmetric folds (Hinz et al., 1999). The pre-rift basement could thus contain Precambrian
igneous and metamorphic basement (Keeley and Light, 1993) and Ordovician to Permian
sediments. The latter are found in the outcropping Sierras Australes fold and thrust belt and in
the Claromecó Basin (Bushnell et al., 2000; Franke et al., 2006; Juan et al., 1996; Zambrano,
1980). As suggested by Franke et al. (2006), the pre-rift basement of the Colorado Basin
could also display syn-rift intrusions and basaltic injections into faults.
In order to investigate the structural evolution of the Colorado Basin, its accurate geometry
needs to be specified. In particular, we need to understand the relationship between the
Colorado Basin and the Argentine margin itself. Another major point of interest is the
possible influence of inherited structures on the present-day geometry. All these issues
involve the construction of a 3D structural model of the Colorado Basin. Based on an
excellent dataset, including seismic reflection and well data as well as published data, we built
5
a 3D model including sedimentary and crustal layers and the observed syn-rift faults. We are
thus able to carry out a detailed structural analysis and to derive possible explanations for the
atypical development of the Colorado Basin.
2. DATASET
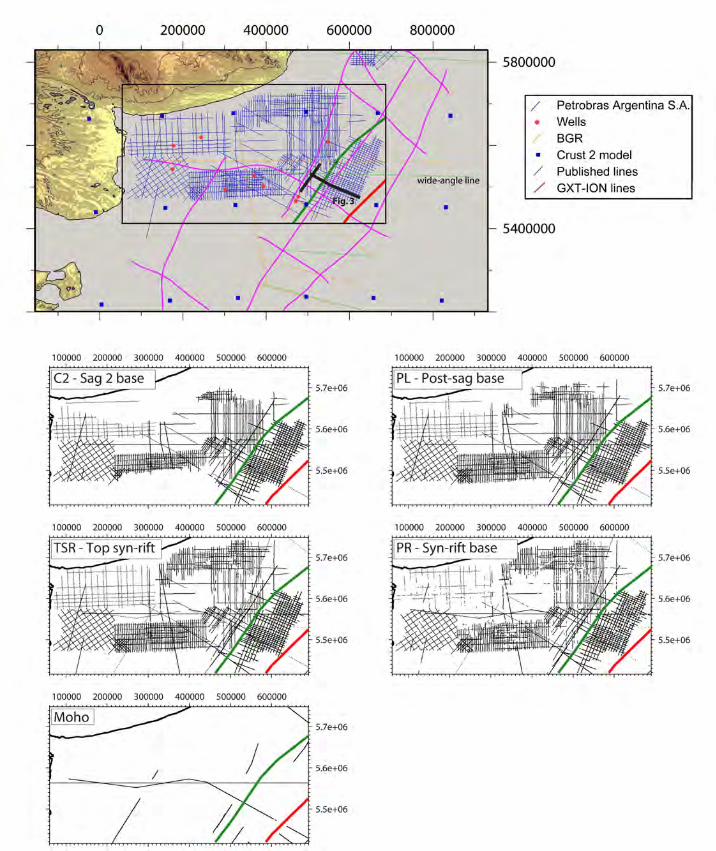
The construction of the structural model is based on a composite dataset (Figure 2). In the
frame of our partnership with Petrobras Argentina S. A. (PESA), we were provided with 2D
seismic lines from 9 surveys, with recording times ranging between 3 and 7.9 s TWT (two
way travel time), acquired between 1969 and 2002. The German Federal Institute for
Geosciences and Natural Resources (BGR) also provided seven 2D reflection seismic lines
acquired in 1998, which record 12 s TWT. In addition, the dataset has been completed by the
Marchal and Dominguez 2011 (confidential report) interpretation of the deep horizons (in
particular Moho horizon) coming from a deep imaging oriented PSTM & PSDM surveys
(ION-GXT ArgentinaSpan) which record respectively 16 s TWT and 36 km TVDSS.
In addition, we complement this dense seismic coverage by stratigraphic information from 9
wells (courtesy of PESA) and the associated check-shot data. Well tops are provided down to
the pre-rift basement, as well as preliminary interpretations of 9 seismic horizons (Figure 3).
The key depth levels include the top pre-rift and the top syn-rift, three horizons of the
Cretaceous to Paleocene sag phase (top Colorado I, top Colorado II and top Colorado III), and
the top of three Cenozoic units (top Pedro Luro, top Elvira and top Caotico). In addition, we
also included information from a confidential report (Marchal and Dominguez, 2011,
Petrobras Argentina S.A. confidential report).
The dataset also includes the deep cross-sections available in the literature, either reflection
seismic (Franke et al., 2007; Hinz et al., 1999) or wide-angle seismic lines (Franke et al.,
2006; Schnabel et al., 2008). Additionally, we use the topographic and bathymetric model

6
ETOPO1 with a resolution of 1 arc-minute (Amante and Eakins, 2009). We also integrate the
model Crust2 (Bassin et al., 2000) to close data gaps concerning the pre-rift basement and
Moho horizons, with a resolution of 2 degrees.
Finally, we integrate the check-shot data and the stacking velocities of the seismic lines
provided by the BGR, which allow us to constrain the velocity model.
3. METHODS
The seismic interpretations of horizons and faults were carried out in the time domain
(TWT) with PetrelTM Software (Schlumberger, version 2009). The seismic horizons provided
by PESA were re-interpreted and complemented, especially the pre-rift basement. These
horizons correspond to boundaries of sedimentary formations recognised in the wells and to
major discontinuities. Also, the major faults related to syn-rift deformation were picked and
correlated from line to line. We were also able to pick the Moho on the deep BGR seismic
time lines.
A velocity model defined in the PetrelTM Software was used to convert time data into depth
data. Therefore, the interval velocities of each seismic unit were obtained from check-shot
data of the wells and from the Dix-conversion of stacking velocities (Dix, 1955). These
interval velocities were finally corrected in order to fit the well tops.
This time-depth conversion was applied to the points picked along the horizons.
Subsequently, the depth-converted points were combined with depth points from ETOPO1
(seafloor), Crust2 (basement and Moho) or published data (basement and Moho). For each
horizon, these depth points were then interpolated using the minimum tension gridding
algorithm of the EarthVision Software (Dynamic Graphics, 2001) considering the faults as
interpolation discontinuities. We consider faults only for the pre-rift basement as the fault

7
offsets of the post-rift are small to negligible. The resulting 2D grids have a horizontal
spacing of 3 by 3 km.
As all the horizons were poorly constrained at the borders of the model (black frame, Figure
2), we needed to correct the effects of the extrapolation, which creates intersections between
the grids. To build a consistent structural model in 3D we followed two assumptions: First we
assumed that the sediment fill is confined between the seabed as upper boundary and the pre-
rift basement as lower boundary, as these two levels are the laterally best constrained ones.
Secondly, we considered that the sedimentary pattern corresponds to onlaps of the younger
horizon on the older ones. Thus, for each intersection, we flatten the younger grid on the older
one. Finally, we subtracted successive depth levels to obtain the thickness of the geological
units. These interpolated thicknesses were finally stacked to obtain a 3D structural model
using GMS (Geological Modelling System) developed at GFZ.
4. RESULTS
4.1. Seismic units and correlation with the sedimentary formation Our 3D structural model resolves 9 seismic units in the sedimentary cover, which we
recognize on the seismic lines shown on Figure 3 and Figure 4. We correlate the seismic units
with the sedimentary interfaces encountered in the wells (courtesy of PESA). The
stratigraphic units within the Colorado Basin are based on numerous studies (Bushnell et al.,
2000; Franke et al., 2006; Fryklund et al., 1996; Hinz et al., 1999; Kaasschieter, 1965, 1963;
Lesta et al., 1978; Turic and Diaz, 1987; Urien and Zambrano, 1973). The regional
stratigraphy is thoroughly covered in well-referenced studies by Fryklund et al. (1996; 1994)
and Bushnell et al. (2000) examined the potential petroleum systems in the eastern offshore
part of the basin. Loegering et al. (2013) established the resulting correlation of the seismic
units with the sedimentary units. Figure 4 shows the correlations and lithologies.

8
The pre-rift seismic unit is located below the top pre-rift horizon (PR on Figure 3 and Figure
4), which is an erosional unconformity. Its uppermost part shows top reflections that are
parallel and continuous, but highly faulted (Figure 3). They are highly reflective with high
amplitude and low frequencies. We observe these reflections only locally, below half grabens
and in the deep basin, and they are clearly eroded in some places. Keeley and Light, (1993)
attribute the pre-rift unit to the Precambrian igneous and metamorphic basement but it is
possibly related to the Ordovician to Lower Triassic sediments observed in the onshore
Sierras Australes belt and the Claromecó Basin (Bushnell et al., 2000; Franke et al., 2006;
Juan et al., 1996). We could not always observe these sediments on the seismic data, either
because they may have been eroded or the seismic resolution is not sufficient.
The syn-rift unit lies discordantly on the pre-rift unit. Its upper boundary corresponds to the
top syn-rift (TSR), which marks the top of the characteristic wedge-shaped geometry (Figure
3), typical of syn-rift deposition (Figure 4). Since syn-rift faulting is generally distributed in
space and time, the top syn-rift is not an isochronal horizon (e.g. Autin et al., 2010; Gernigon
et al., 2006, 2004). This implies that non-deformed sediments can be older than the breakup.
The reflections are continuous but highly faulted with low amplitude (sometimes transparent)
and medium frequencies. Following Juan et al. (1996), the syn-rift deposits are of Upper
Jurassic to Barremian age (160-125 Ma).
The early sag group (Sag 1) is composed of the Colorado I and II seismic units. It lies
disconformably on the top syn-rift (TSR) and is limited upward by the second sag horizon
(C2). Increasing curvature of the reflections with depth (Figure 3) indicates thermal
subsidence. Internal reflections are continuous with medium to high amplitudes and medium
to low frequencies.
The late sag group (Sag 2) is composed of the Colorado III and Pedro Luro seismic units. It
lies between the conformable sag horizons C2 and the erosional unconformity (PL) at the top

9
of Pedro Luro formation, which could represent a condensed horizon corresponding to a
period of 5 to 10 Ma. The group presents an increasing curvature of the reflections with depth,
though less curved than in the early sag group (Figure 3). The reflections are discontinuous
and rugged with variable amplitudes and high frequencies at its base and become continuous
with medium amplitudes and low frequencies upward.
The Post-sag group is composed of the Elvira and Shallow seismic units. It lies between
top-Pedro Luro and the seabed. Its geometry displays minor thickening toward the basin
centre (Figure 3) and progradation and erosion on the continental slope. Upward, the horizons
dip towards the NE (Figure 3, Franke et al., 2006). At its base, the reflections are continuous
with high amplitudes and low frequencies. The uppermost part of the Elvira unit presents
chaotic seismic facies (Caotico) with transparent and high frequencies reflections. In the
Shallow unit, the reflections are continuous with medium amplitudes and high frequencies.
4.2. Fault pattern The new complete data set allows to recognised more precisely the general E-W and NW-
SE trends in the Colorado Basin, already observed by Zambrano (1980). We separate the
study area into 6 parts identified after the segmentation of the Colorado Basin and the
structure of the margin. Figure 5 displays their location: the Western segment, the Central
segment, the Central high, the Eastern segment, the distal margin and the oceanic crust. The
best quality of the seismic data is available for the distal margin and the Eastern segment.
There, the lateral correlation of interpreted faults between individual seismic lines is possible
(Figure 6). To assess the syn-rift deformation, we analyse the normal faults affecting the pre-
rift basement. These faults show syn-rift wedges in their hanging wall (Figure 3 and Figure
4). In the basin, the fault trend is E-W to ENE-WSW on the Central high and NW-SE in the
Central and Eastern segments. We also observe ENE-trending normal faults on the northern
edge of the Eastern segment, close to the coast. Two slope breaks are present at the sea bed.

10
The western slope corresponds to the normal faults bounding the distal margin to the west
(along the green line in Figure 6). The eastern slope corresponds to the last normal faults
leading to the oceanic crust (OCT along the red line in Figure 6-a). In between, on the distal
margin, the normal faults show two main orientations: parallel to the margin (N030°E) on the
edges of the distal margin and E-W to NW-SE in the central part of the distal margin (Figure
6). The latter population contains faults of short length, which are truncated or vertically
shifted by the N030°-trending faults.
4.3. Structure of the sedimentary cover The pre-rift basement is rugged. On the edges of the basin, it reaches an average elevation
of 1000 mbsl (meters below sea level) whereas the deepest part is more than 12000 mbsl in
the Eastern segment (Figure 7). The topographic lows highlight the general trend of the
defined segments (Figure 5). Nevertheless, the deeper parts are noteworthy: the southern part
of the Central segment (11000 mbsl) and the deep elongated centre of the Eastern segment.
Both locations correspond to main syn-rift depocentres, with maximum thicknesses of 5700 m
in the Central segment and 4600 m in the Eastern segment. At the distal margin, the pre-rift
basement is shallow (~ 7000 mbsl) compared to the Eastern segment. We observe small syn-
rift depocentres (~3000 m-thick, number 1 on Figure 7, Syn-rift) in the central part of the
distal margin but also thicker ones (up to 5000 m-thick, number 2 on Figure 7, Syn-rift) along
the major faults, which bound the distal margin in the West.
The interpreted top syn-rift is a smooth surface, where we recognise the basin edges as well
as the higher elevation of the distal margin (Figure 7). Here again the deepest part is located
in the Eastern segment, where the surface descends eastward to 8000 mbsl. Looking at the
depocentres of the Sag 1 group (0-3200 m-thick), we observe three main depocentres: the
Southern part of the Central high (number 1 on Figure 7, Sag 1), the North-West Eastern
segment (number 2 on Figure 7, Sag 1) and the South-East Eastern segment along the western

11
faulted boundary of the distal margin (number 3 on Figure 7, Sag 1). This last depocentre
tends to follow the margin trend.
The deep topographic lows of the Sag 2 base (C2) and the coincident depocentres (0-
3000 m-thick) migrate progressively with time toward the Eastern segment and the distal
margin. In the Colorado Basin itself, sediment accumulation shows clear onlaps and a
downward curvature of the reflections, increasing with depth. On the distal margin, we
observe two margin-parallel depocentres (number 1 and 2 on Figure 7, Sag 2): (1) the western
depocentre is large and located adjacent to the great western fault escarpment (green line),
and (2) the eastern depocentre corresponds in the seismic data to prograding bodies on the
eastern slope, descending to the oceanic basin (red line). On the slope, the top of the unit is an
erosional surface.
The Post-sag group (0-2400 m-thick) depositional pattern is less localised than previously
(Figure 7). In the Eastern and Western segments, the depocentres are larger, thinner and
homogenously distributed. On the distal margin, both margin-parallel depocentres are
characterised by prograding bodies in the seismic data (Loegering et al., 2013). In the Caotico
unit, the seismic data show two prisms piled onto the slope and eroded at the top with deep
channels cutting the surface. The Elvira unit is also eroded on the margin slope. The thickest
part of the Shallow unit shows parallel horizons gently dipping toward the NE. The margin
trend is marked by strong erosion of the unit along the bathymetric slope. Two slope breaks
mark the present-day sea bed, going down eastwards to the large packages of SDRs, marking
the OCT (Franke et al., 2007).
4.4. Structure of the crust We constrain the Moho surface (Figure 7) with wide-angle seismic lines, reflection seismic
profiles and by the crustal model Crust 2 (Figure 2). The Moho is shallow under the oceanic
crust (16.8 km) and deepens to 39.5 km toward the continent. We identify two main shallow

12
areas of the Moho (27 km): below the Western segment and along the Eastern segment.
Another area of a relatively shallow Moho (30 km) is located in the Central segment. Toward
the East, the Moho becomes increasingly shallow and the isolines show a NW-SE trend below
and in the prolongation of the Eastern segment, below the distal margin. The crustal thickness
map (Figure 6 and 8, "pre-rift crust") illustrates the two main areas of thinned crust. They
have a NW-SE orientation and appear offset with respect to each other with an en-echelon
pattern. The western area of thinned crust (~22 km-thick) is located below the Western
segment and is similar below the Central segment (~20 km-thick). The eastern thinned area is
located below the Eastern segment (~18 km) and is extended across the distal margin (~16
km). The thinned crust below the Central segment and below the Eastern segment coincides
with the location of the thickest syn-rift depocentres.
It is noteworthy that the Central high displays a complex crustal structure. In spite of the
large total thickness of the sedimentary cover, the crust is relatively thick (~28 km). Moreover
this thick crust seems to follow a NW-SE trend, separating the two areas of thinner crust,
along the proposed prolongation of the Ventana Hills (Franke et al., 2006; Hinz et al., 1999),
constituting the Paleozoic “Sierras Australes” fold belt (Figure 7-c).
5. DISCUSSION
5.1. Structural analysis
5.1.1. Sedimentary succession The observed depocentres in the Colorado Basin correlate with the positive Bouguer
anomaly (Figure 8). Indeed, the (simple) Bouguer gravity anomaly is defined by the classical
gravity anomaly minus the attraction of the Bouguer plate. Thus an offshore basin causes
always positive Bouguer anomaly values due to the “numerical” replacement of off-shore
sediment densities by crustal rock densities (here ρ = 2670 kg.m-3). Therefore the mapped
depocentres of the Colorado basin fit perfectly the areas of positive Bouguer anomaly.

13
The study of the thickness maps together with the seismic lines allows us to assess changes
in the location and style of the deposits. During the syn-rift stage, all depocentres are fault-
controlled (Figure 6-b). The main depocentres are either related to NW-SE faults in the
Central and Eastern segments or to the major normal NE-SW faults, which separate the
Eastern segment from the distal margin. We recognise the syn-rift sediments by their wedge-
shaped geometry indicating syn-tectonic deposition (Figure 3). Descriptions of the
sedimentary succession published so far assume that all these wedges are Jurassic-Cretaceous
in age and formed during the same major tectonic event (Bushnell et al., 2000; Franke et al.,
2006; Fryklund et al., 1996; Juan et al., 1996). This implies that both NW-SE and NE-SW
normal faults are active simultaneously during the syn-rift period. Nevertheless, a close
scrutiny of the fault pattern could indicate a relative chronology among the different fault
populations. In the centre of the distal margin, E-W to NW-SE-trending faults are shorter than
in the Eastern segment and delimit smaller syn-rift depocentres. They appear to be cut or
shifted by the major margin-parallel faults, delimiting the distal margin boundaries. These
observations could indicate that the syn-rift deformation is poly-phase with a first event
causing the NW-SE-trending faults and a second event producing the margin-parallel faults.
Nevertheless, we need other observations to support this hypothesis (see below the succession
of different orientation of the sag depocentres). It is probable that the first extensional event is
oblique to the NW-SE faults since major dextral strike-slip movements are thought to occur in
this area since late Triassic time (Charrier, 1979; Criado Roqué et al., 1981; Fitzgerald et al.,
1990; Mpodozis, 1984; Riccardi, 1983; Uliana and Biddle, 1988; Uliana et al., 1989).
The seismic image of the sag depocentres (Colorado I, II and III and Pedro Luro on Figure
3) shows the classical downward curvature, with an undeformed pattern of the reflections,
which is typical for post-rift thermal subsidence on rifted margins. Nevertheless, the location
of these depocentres corresponds mainly to the Central and Eastern segments, and to the

14
margin-parallel faults (Sag 1 and 2 on Figure 7). This does not correspond to the classical
regional thermal subsidence observed during post-rift thermal cooling of the oceanic crust
(e.g. Bott, 1992). Obviously, the influence of the adjacent cooling oceanic crust is not
dominant in the Colorado Basin during its early sag phase (Sag1). Indeed, during the
deposition of the Colorado I and II units, the depocentres have E-W to NW-SE-trending axes
and are mainly restricted to the Colorado Basin itself (Figure 7). The margin-parallel
depocentres become larger and thicker only during the late sag phase (Sag 2) with, the
deposition of Colorado III and Pedro Luro units. This poly-phase evolution and the geometry
of the depocentres indicate different processes of sag subsidence. In the Colorado Basin, the
observed local and strong subsidence (Sag 1) rather appears to be related to the cooling of
extended continental crust below the basin. Then, during the late sag phase (Sag 2), the
progressive tilting of the margin due to the cooling oceanic crust starts to dominate the
subsidence pattern with NE-SW-trending depocentres. This dynamic contribute to the
oceanward migration of the depocentres and to progradation on the oceanic slope during the
deposition of Colorado-III and Pedro Luro units (Sag 2 on Figure 7).
During the deposition of the Elvira, Caotico and Shallow units (Post-sag on Figure 7),
subsidence is minor to absent in the Colorado Basin. The parallel seismic reflections (see
Neogene on Figure 5 in Franke et al., 2006) suggest that only basin infilling occurs. During
the deposition of the Shallow unit, the inclined seismic reflections suggest a supply from the
SW (Franke et al., 2006). On the distal margin, the margin-parallel sediment accumulations
(up to 1250 m-thick) are related to progradation of the sediments on the slope. On the margin,
erosion affects the Shallow unit along the oceanic slope.
5.1.2. Crustal structure of the Colorado Basin The structural analysis reveals that the Colorado Basin is strongly segmented into four main
features (Figure 5 and Figure 6): (1) The Western segment does not have the benefit of a
15
database with good seismic resolution, nevertheless, the main geometry of all the horizons
shows a NW-SE-trending depocentre. (2) In the Central segment, the depocentres and the
faults show a NW-SE trend. (3) On the Central high, the faults indicate a N70° trend in the
North and an E-W trend in the South. (4) In the Eastern segment, the excellent data coverage
and quality shows deep depocentres with a NW-SE trend, bounded by an array of NW-SE-
trending faults. To the East, the Colorado Basin meets the South Atlantic margin in the distal
margin.
Pángaro et Ramos (2011) interpret the same directions of the depocentres on gravimetric
anomalies maps. We also observe the strong segmentation of the basin on the pre-rift crustal
thickness map (Figure 7) where the thinnest crust lays below the largest depocentres in the
Central and Eastern segments. It is noteworthy that the thick crust below the Central high has
a NW-SE orientation and separates the Central and the Eastern segment along the Paleozoic
“Sierras Australes” fold belt (Figure 6-c).
Another peculiarity of the crust below the Colorado Basin is the reported high P-wave
velocities in the lower crust (6.9-7.2 km.s-1) derived from wide-angle seismic modelling
(Franke et al., 2006). Its subsequent gravity modelling indicates a high density lower crust (up
to 2960 kg.m-3) and locally a high density middle crust (up to 2900 kg.m-3). The authors
associate the latter with a possible magmatic intrusion below the Eastern segment.
5.1.3. Distal margin geometry Two sets of major N030°-trending, eastward-dipping normal faults structure the distal
margin (Figure 6-a): the western faults (along the green line) mark the slope that brings down
the distal margin compared to the Colorado Basin edges, and the eastern faults mark the slope
toward the oceanic crust. Unfortunately our data do not cover the OCT. Nevertheless, the
breakup structures were already well studied in the papers of Franke et al. (2006, 2007) and of
Dominguez et al. (2011).
16
The Colorado Basin meets the distal margin at the junction of the Eastern segment with the
western faults, where the successive depocentres follow both directions: NW-SE and margin-
parallel. It is noteworthy that the distal margin reaches a higher elevation than the adjacent
depocentre of the Eastern segment.
The peculiarity of the Colorado Basin resides in its relationship with the margin. Not only is
the basin perpendicular to the margin in its eastern part, but the distal margin also shows a
completely different structure than the Eastern segment (Figure 7): (1) the pre-rift basement is
deep in the Eastern segment, whereas it is shallow in the distal margin; (2) the Moho shows
little relief below the Eastern segment, whereas it shows a pronounced NW-SE-trending high
below the distal margin. These observations indicate different evolutions for these two parts
of the margin.
Although both areas show the strongest thinning of the crust along NW-SE-oriented axes,
they display a different thinning pattern. In the Eastern segment, the thinnest pre-rift crust is
related to a very deep pre-rift basement with moderate Moho shallowing (Figure 9-B). On the
distal margin, the thinnest pre-rift crust is related to moderately deep pre-rift basement
combined with a pronounced Moho shallowing (Figure 9-C). The fact that the distal margin is
characterised by both NW-SE and NE-SW-oriented zones of thinned crust (Figure 7, pre-ruft
crust) also suggests that a first extensional event (orthogonal or oblique to the NW-SE
direction) may have affected the area before the final opening of the South Atlantic ocean.
5.2. Colorado Basin formation As seen above, the Colorado Basin geometry perpendicular to the margin cannot be easily
explained. In the light of our observations we can discuss different hypotheses for its
formation.

17
5.2.1. Triple junction hypothesis The most frequently proposed hypothesis explaining this geometry is that the oblique basins
are aborted rifts resulting from a triple junction (Asmus and Baisch, 1983; Franke et al., 2002;
Yrigoyen, 1975). Indeed such a rift would explain the commonly assumed coeval
development of both directions of syn-rift deposits. And the very pronounced sag subsidence
in the Colorado Basin could be explained if the triple junction formation is associated with the
emplacement a magmatic lower crustal body and its subsequent cooling.
In a hotspot-related triple junction context, the three arms develop at equal distance
(McKenzie and Morgan, 1969), which is not the case in the Colorado Basin. This apparent
contradiction could be explained if structural inheritance influences the triple junction
geometry. However, even if the different fault directions could be reproduce by a triple-
junction model, the fault chronology rather suggests successive rifting events, first in the
Colorado Basin and then along the distal margin. Additionally, this model would not explain
the formation of an elevated basement in the distal margin. Moreover, the distal margin
clearly displays two directions of crustal thinning (as illustrated in Figure 10, syn-rift 2),
which hardly can be produced by the same extensional event.
5.2.2. Strike-slip hypothesis It has also been proposed that the basins develop as pull-apart basins associated with NW-
SE dextral shear systems (Franke et al., 2006; Keeley and Light, 1993; Tankard et al., 1995;
Urien et al., 1995). Indeed, the San Jorge Basin records several stages of strike-slip
deformation associated with transtensional basins since Late Triassic time (Charrier, 1979;
Criado Roqué et al., 1981; Fitzgerald et al., 1990; Mpodozis, 1984; Riccardi, 1983; Uliana
and Biddle, 1988; Uliana et al., 1989). As Fanke et al. (2006), we do not observe such
deformation but we agree that it cannot be excluded. Moreover, strike-slip transfer zones

18
described offshore (Franke et al., 2007) could also cross the Colorado Basin (CTZ, TDZ and
VTZ on Figure 7-b, Dominguez et al., 2011).
A pull-apart scenario of basin formation is consistent with the direction of extension
responsible for the South Atlantic opening and thus would explain the development of both
directions of faulting. Such basins are known to produce an intense syn-rift subsidence, which
would fit with the large accumulation of syn-rift deposits in the Eastern segment. On the other
hand, pull-apart basins rarely experience intense thermal cooling (Choi et al., 2011; e.g. in the
Dead Sea, Petrunin and Sobolev, 2006) and thus cannot explain the strong sag subsidence in
the Eastern and Central segments.
The en-echelon pattern of the Western, Central and Eastern segments is the best argument
for a pull-apart mechanism for basin formation. Moreover, this deformation is also consistent
with the minor uplift of the Moho below the segments (e.g. Petrunin and Sobolev, 2006).
Nevertheless, a dextral movement of the proposed strike-slip faults / transfer zones (Figure 6-
c) would not create left-stepping but right-stepping basins. A sinistral movement along these
features is in contradiction with the kinematic model of the opening of the South Atlantic.
Moreover, normal faults in pull-apart basins should be perpendicular to the strike-slip faults
(e.g. McClay and Dooley, 1995). However, in the Colorado Basin, normal faults are parallel
to the strike-slip faults.
The advantage of the pull-apart theory is that it would explain the different crustal geometry
of the distal margin compared to the basin segments. Indeed, the pull-apart deformation could
stop at the boundary between the Eastern segment and the less deformed distal margin.
Nevertheless the distal margin is clearly thinned in the NW-SE direction. It indicates that a
similar deformation affected the Eastern segment and the distal margin before the final
opening of the South Atlantic.

19
Finally, the Bouguer anomaly (Figure 8) shows a relative excess of mass below the Eastern,
Central and Western segments of the Colorado Basin, whereas pull-apart basins are generally
known to produce a negative Bouguer anomaly, as for example in the Dead Sea (Choi et al.,
2011; Garfunkel and Ben-Avraham, 1996; Götze et al., 2007).
5.2.3. Structural inheritance hypothesis Many authors agree that the evolution of the Colorado Basin may be strongly influenced by
structural inheritance (Dominguez et al., 2011; Franke et al., 2006; Pángaro and Ramos, 2012;
Urien and Zambrano, 1973; Urien et al., 1995, 1981; Zambrano, 1980). Pángaro and Ramos
(2012) present the Colorado Basin as a segmented, aborted rift dominated by simple shear
along south dipping Upper Paleozoic major compressive fault zones. Indeed, in the basin area,
most of the former structural evolution concerns NW-SE-trending structures (Figure 6) that
corresponds either to: (1) the prolongation of the onshore Paleozoic “Sierras Australes” fold
belt and Claromecó basin (Franke et al., 2006; Hinz et al., 1999; Juan et al., 1996), or to (2)
the continental prolongation of the offshore Ventana and Colorado transfer zones (Franke et
al., 2007) and to the "Tona" deformation zone (Figure 6-b, Dominguez et al., 2011). Certainly
these older structures could have played a role during the formation of the Colorado Basin,
where the Central and Eastern segments show similar orientation. Considering the pre-rift
configuration of the study area, we examine the presence of the “Sierras Australes” fold belt
and the Claromecó Basin below the Colorado Basin, as already proposed by Juan et al.
(1996), Hinz et al. (1999) and Franke et al. (2006). Pángaro and Ramos (2012) propose that
the suture zone and thus the fold belt is shifted northwards at the longitude of the Eastern
segment, forming the “Colorado syntaxis”. From our observations and following previous
authors, we ague that at least part of the fold belt remains in the Central High, in between the
Central and Eastern segment.

20
We think that the deformation induced by the reactivation of inherited Paleozoic structures
could certainly localise the observed strong NW-SE syn-rift subsidence, but such reactivation
cannot result from the extension related to the South Atlantic opening since the inherited
structures are strictly perpendicular to the margin. Thus, it explains neither the development
of both directions of syn-rift deformation, nor the strong sag subsidence in the Central and
Eastern segments. However, such inheritance and its reactivation could explain the en-
echelon pattern of the segments and the associated fault pattern. Moreover, the Paleozoic
Sierras Australes fold belt is transpressive and presents top-to-the-NE thrusts (Cobbold et al.,
1986, 1991; Rossello et al., 1997), of which major thrusts could have been reactivated with a
normal movement.
5.2.4. 2-phases model of evolution In the light of our observations, we propose a new model of evolution for the Colorado
Basin (Figure 10). We think that inheritance and reactivation are predominant in the evolution
of the Colorado Basin. We propose that: (1) The Western segment follows the continental
continuation of the Colorado transfer zone. (2) The Central segment corresponds to the
continental continuation of the Tona Deformation Zone proposed by Dominguez et al. (2011).
(3) The Central high corresponds to the Paleozoic Sierras Australes fold belt location (Franke
et al., 2006; Hinz et al., 1999; Juan et al., 1996), as the Central high presents a thicker crust,
which coincides with the thickened crust of the fold belt. (4) The Eastern segment
corresponds to the Claromecó Basin location (Franke et al., 2006; Hinz et al., 1999; Juan et
al., 1996).
We suggest that a first extensional event, possibly oblique rifting, occurred before the
extension responsible for the South Atlantic opening. This event could have induced the
reactivation of the inherited structures, which would explain the atypical en-échelon pattern of
the segments along the NW-SE direction. It thus explains the presence of NW-SE-oriented

21
normal faults and NW-SE-trending zones of thinned crust in the Colorado Basin and in the
distal margin. In this framework, we do not consider that all the described syn-rift deposits are
coeval. In this scenario, the first extensional event could explain the formation of all the
oblique basins along the Argentina margin (Salado, Colorado, Rawson, San Jorge Basins).
Such early rifting phase was described by MacDonald et al. (2003). These authors proposed
that Early opening of the South Atlantic was oblique (NE-SW extension), which created
basins at high angle to the trend of the ocean on the Argentine margin.
In our scenario, the first extensional event could coincide with the emplacement of dykes in
the South African conjugate margin. It has been reported that the continental rifting between
South America and Africa was accompanied by the intrusion of syenite and granite plutons,
as well as dolerite dykes, along the margin between 137 and 125 Ma (Kounov et al., 2009;
e.g. Trumbull et al., 2007). Nevertheless, in the South African conjugate margin of the
Colorado Basin, South of the Orange River, dykes could be older (post-Karoo, i.e. post-
Trias). Their direction is not parallel to the margin and varies from NWW-SEE to NW-SE
(De Beer et al., 2002; Mubu, 1995; Reeves, 2000; Trumbull et al., 2007), which could
possibly indicate an oblique direction of extension related to the earlier rifting event.
Following this first extension, we think that a second extensional event, during the opening
of the South Atlantic, produced the margin-parallel faults and lead to the final thinning of the
distal margin crust. This two-phase evolution is consistent with the fault chronology and with
the two directions of thinned crust observed in the distal margin. We propose that the N70°-
trending faults in the Central high result from the reactivation of Paleozoic structures of the
Sierras Australes fold belt, (such as compression-related strike-slip faults, Rossello et al.,
1997), during this second event.
Franke et al. (2006) model high densities at the base of the crust, which could correspond to
to several type of crustal body: (1) underplating or mafic intrusions emplaced during the

22
rifting and often related to Seaward Dipping Reflectors (SDRs) at the surface (Eldholm et al.,
2000; e.g. White and McKenzie, 1989), (2) serpentinised mantle exhumed during the final
extreme thinning of the crust (envisaged but not retained by Gernigon et al., 2004), and (3)
high degree metamorphic rocks inherited from a previous orogenic phase (Ebbing et al., 2006;
e.g. Gernigon et al., 2004). Franke et al. (2006) relate the modelled high density lower and
middle crust to a possible magmatic intrusion below the Eastern segment. In order to
constrain this hypothesis, we are currently working to determine the 3D geometry of such
lower crustal body and its relation with the segmentation of the basin. The emplacement of a
magmatic lower crustal body (magmatic intrusion into the crust, not an underplated body) and
its following cooling could explain the strong early sag subsidence. Indeed, the crystallization
and cooling of the intrusion induced crustal contraction (e.g. Sandrin and Thybo, 2008).
Finally, in the late sag phase, migration of the depocentres and their progradation on the
oceanic slope coincide in age with the expected cooling of the oceanic crust and could thus
indicate the progressive tilting of the margin..
CONCLUSIONS
Our 3D structural model of the Colorado Basin provides new insights on its crustal
geometry and evolution in relation with the Argentine passive margin. We propose that the
atypical en-échelon pattern of the segments of the Colorado Basin can be explained by the
reactivation of a strong structural inheritance in this area during an early extensional event,
which had not been observed so far. The structure and evolution of the basin segments
strongly differ from the distal margin.
In our new model of evolution, the structural inheritance is predominant: (1) The Western
segment could correspond to the NNW-SSE-trending continental continuation of the
Colorado transfer zone. (2) The Central segment could correspond to the NW-SE-trending

23
continental continuation of the Tona deformation zone, recently proposed by Dominguez et
al. (2011). (3) The Central high cross-cuts the Paleozoic Sierras Australes Fold Belt and could
have been created by reactivation of the Paleozoic N70°-trending strike-slip faults. (4) The
Eastern segment is the continuation of the NW-SE-trending Paleozoic Claromecó Basin
(Franke et al., 2006; Hinz et al., 1999; Juan et al., 1996), reactivated as a basin structure
during Jurassic rifting.
The accommodation of the syn-rift infill in the NW-SE-trending depocentres (Central and
Eastern segments), as well as the NW-SE-oriented zones of strongly thinned crust are not
compatible with the NW-SE direction of extension responsible for the South Atlantic
opening. An earlier extensional process appears to have produced this strong and localised
tectonic subsidence. This extensional event may have contributed to the reactivation of the
inherited structures. Moreover, it could coincide with the emplacement of dykes in the South
African conjugate margin. Finally, the formation of the N30°-trending distal margin and the
reactivation of the N70°-trending faults occur under the NW-SE extension of the South
Atlantic.
Acknowledgements
This study is part of the DFG project SAMPLE ‘South Atlantic Margin Processes and Links
with onshore Evolution’. We are deeply grateful to the seismic and well data providers,
Petrobras Argentina S.A. and the Federal Institute for Geosciences and Natural Resources
(BGR). We would like to thank Dieter Franke and Robert Trumbull for helpful discussions, as
well as Laurent Gernigon for his comments. We deeply thank P. R. Cobbold, D. Macdonald,
L. Gernigon and M. Moulin for their constructive reviews, which greatly improved the paper.
Z. Anka is head of a Helmholtz-University Young Investigator Group funded by the
Helmholtz Association’s Initiative and Networking Fund. The International Centre for Global

24
Earth Models (ICGEM) is one of the six centres of the International Gravity Field Service
(IGFS) of the International Association of Geodesy (IAG) and is based at the
Geoforschungszentrum – Helmholtz Centre in Potsdam (GFZ, Germany). The GMT software
package (Wessel and Smith, 1998) was used in the preparation of this paper.
REFERENCES
Amante, C., Eakins, B.W., 2009. ETOPO1 1 Arc-Minute Global Relief Model: Procedures, Data Sources and Analysis. NOAA Technical Memorandum NESDIS NGDC-24 19 p. Asmus, H.E., Baisch, P.R., 1983. Geological evolution of the Brazilian continental margin. Episodes 1983 3–9. Austin, J.A., Uchupi, E., 1982. Continental-oceanic crustal transition off Southwest Africa. AAPG Bulletin 66, 1328–1347. Autin, J., Leroy, S., Beslier, M.-O., D’Acremont, E., Razin, P., Ribodetti, A., Bellahsen, N., Robin, C., Al Toubi, K., 2010. Continental break-up history of a deep magma-poor margin based on seismic reflection data (northeastern Gulf of Aden margin, offshore Oman). Geophysical Journal International 180, 501–519. Barthelmes, F., 2009. Definition of functionals of the geopotential and their calculation from spherical harmonic models. Scientific Technical Report STR09/02, GFZ German Research Centre for Geosciences Potsdam, ISSN 1610- 0956 (http://icgem.gfz-potsdam.de/ICGEM/theory/str-0902.pdf). Bassin, C., Laske, G., Masters, G., 2000. The Current Limits of Resolution for Surface Wave Tomography in North America. EOS Trans AGU 81. Bott, M.H.P., 1992. Passive margins and their subsidence. Journal of the Geological Society 149, 805–812. Buggisch, W., 1987. Stratigraphy and Very Low Grade Metamorphism of the Sierras Australes de la Provincia de Buenos Aires (Argentina) and Implications in Gondwana Correlation. Zbl. Geol. Paläont. Teil I 7/8, 819–837. Bushnell, D.C., Baldi, J.E., Bettini, F.H., Franzin, H., Kovas, E., Marinelli, R., Wartenburg, G.J., 2000. Petroleum systems analysis of the eastem Colorado Basin, offshore northem Argentina, in: Mello, M.R., Katz, B.J. (Eds.), Petroleum Systems of South Atlantic Margin. pp. 403–416. Charrier, R., 1979. El Triásico en Chile y regiones adyacentes de Argentina: una reconstrucción paleogeográfica y paleoclimática. Universidad de Chile, Departamento de Geología, Comunicaciones, Santiago 26, 1–37. Choi, S., Götze, H.-J., Meyer, U., Group, D., 2011. 3-D density modelling of underground structures and spatial distribution of salt diapirism in the Dead Sea Basin. Geophysical Journal International 184, 1131–1146. Cobbold, P., Massabie, A.C., Rossello, E.A., 1986. Hercynian wrenching and thrusting in the Sierras Australes foldbelt, Argentina. Hercynica II, 135–148. Cobbold, P.R., Gapais, D., Rossello, E.A., 1991. Partitioning of transpressive motions within a sigmoidal foldbelt: the Variscan Sierras Australes, Argentina. Journal of Structural Geology 13, 743–758. Cobbold, P.R., Gapais, D., Rossello, E.A., Milani, E.J., Szatmari, P., 1992. Permo-Triassic intracontinental deformation in SW Gondwana, in: de Wit, M.J., Ransome, I.G.D., Balkema,
25
A.A. (Eds.), Inversion Tectonics of the Cape Fold Belt, Karroo and Cretaceous Basins of Southern Africa. Rotterdam, pp. 23–26. Criado Roqué, P., Mombrú, C.A., Ramos, V.A., 1981. Estructura e interpretación tectónica: Geología y Recursos Naturales de la Provincia de San Luis, in: Relatorio deI VIII Congreso Geológico Argentino. Buenos Aires, pp. 155–192. Daly, M.C., Lawrence, S.R., Kimun’a, D., Binga, M., 1991. Late Palaeozoic deformation in central Africa: a result of distant collision? Nature 350, 605–607. De Beer, C.H., Gresse, P.G., Theron, J.N., Almond, J.E., 2002. The geology of the Calvinia area area, Explanation of 1:250000-scale sheet 3118 Calvinia. Dix, C.H., 1955. Seismic velocities from surface measurements. Geophysics 20, 68–86. Dominguez, F., Marchal, D., Sigismondi, M., Espejón, C., Vallejo, E., 2011. Caracterización de dominios estructurales e influencia de estructuras preexistentes en hemigrábenes de rift en el sector centro-norte de la Plataforma Continental Argentina. Actas XVIII Congreso Geológico Argentino. Dynamic Graphics, 2001. Earth Vision. Dynamic Graphics Inc., Alameda, Saskatchewan, Canada. Eagles, G., 2007. New angles on South Atlantic opening. Geophysical Journal International 168, 353–361. Ebbing, J., Lundin, E., Olesen, O., Hansen, E.K., 2006. The mid-Norwegian margin: a discussion of crustal lineaments, mafic intrusions, and remnants of the Caledonian root by 3D density modelling and structural interpretation. Journal of the Geological Society 163, 47–59. Eldholm, O., Gladczenko, T.P., Skogseid, J., Planke, S., 2000. Atlantic volcanic margins: a comparative study. Geological Society, London, Special Publications 167, 411 –428. Estrella, G., Mello, M.R., Gaglionone, P.C., Asevedo, R.L.M., Tsubone, K., Rossetti, E., Concha, J., Brüning, I.M.R.A., 1984. The Espirito Santo Basin (Brazil) source rock characterization and petroleum habitat, in: Demaison, G., Murris, R.J. (Eds.), Petroleum Geochemistry and Basin Evaluation, AAPG Memoir 35. pp. 253–272. Fitzgerald, M.G., Mitchum, R.M., Uliana, M.A., Biddle, K.T., 1990. Evolution of the San Jorge Basin. AAPG Bulletin 74, 879–920. Ford, A.B., 1972. Weddell orogeny—Latest Permian to early Mesozoic deformation at the Weddell Sea margin of the Transantarctic Mountains, in: Antarctic Geology and Geophysics. Adie, R. J., Oslo, Norway, pp. 419–425, Universitetforlaget Oslo. Franke, D., Ladage, S., Schnabel, M., Schreckenberger, B., Reichert, C., Hinz, K., Paterlini, M., de Abelleyra, J., Siciliano, M., 2010. Birth of a volcanic margin off Argentina, South Atlantic. Geochem. Geophys. Geosyst. 11, Q0AB04. Franke, D., Neben, S., Hinz, K., Meyer, H., Schreckenberger, B., 2002. Deep crustal structure of the Argentine continental margin from seismic wide-angle and multichannel reflection seismic data. Presented at the AAPG Hedberg Conference “Hydrocarbon Habitat of Volcanic Rifted Passive Margins,” Stavanger, Norway. Franke, D., Neben, S., Ladage, S., Schreckenberger, B., Hinz, K., 2007. Margin segmentation and volcano-tectonic architecture along the volcanic margin off Argentina/Uruguay, South Atlantic. Marine Geology 244, 46–67. Franke, D., Neben, S., Schreckenberger, B., Schulze, A., Stiller, M., Krawczyk, C.M., 2006. Crustal structure across the Colorado Basin, offshore Argentina. Geophysical Journal International 165, 850–864. Fryklund, B., Marshal, A., Stevens, J., 1996. Cuenca del Colorado. Presented at the Geología y recursos naturales de la Plataforma Continental Argentina, Relatorio XIII Congreso Geológico Argentino y III Congreso de Exploración de Hidrocarburos.

26
Fryklund, R.E., 1994. Well summary reports: Cruz del Sur x-1, Estrella x-1, and Corona Austral x-1, Block Colorado Marine Basin (CCM-1). Post-drill interpretation: UTAL unpublished report, Buenos Aires, Argentina. Garfunkel, Z., Ben-Avraham, Z., 1996. The structure of the Dead Sea basin. Tectonophysics 266, 155–176. Gernigon, L., Lucazeau, F., Brigaud, F., Ringenbach, J.-C., Planke, S., Le Gall, B., 2006. A moderate melting model for the Vøring margin (Norway) based on structural observations and a thermo-kinematical modelling: Implication for the meaning of the lower crustal bodies. Tectonophysics 412, 255–278. Gernigon, L., Ringenbach, J.-C., Planke, S., Le Gall, B., 2004. Deep structures and breakup along volcanic rifted margins: insights from integrated studies along the outer Vøring Basin (Norway). Marine and Petroleum Geology 21, 363–372. Gerrard, I., Smith, G.C., 1982. Post-Paleozoïc succession and structure of the southwestern African continental margin. American Association of Petroleum Geologists Memoir 34, 49–74. Ghidella, M.E., Lawver, L.A., Gahagan, L.M., 2007. Break-up of Gondwana and opening of the South Atlantic: Review of existing plate tectonic models. U.S. Geological Survey and The National Academies USGS OF-2007-1047, doi:10.3133/of2007–1047.srp055. Gladczenko, T.P., Hinz, K., Eldholm, O., Meyer, H., Neben, S., Skogseid, J., 1997. South Atlantic volcanic margins. Journal of the Geological Society, London 154, 465–470. Götze, H.J., El-Kelani, R., Schmidt, S., Rybakov, M., Hassouneh, M., Förster, H.J., Ebbing, J., 2007. Integrated 3D density modelling and segmentation of the Dead Sea Transform. International Journal of Earth Sciences 96, 289–302. Guardado, L.R., Gamboa, L.A.P., Lucchesi, C.F., 1989. Petroleum geology of the Campos Basin, Brazil, a model for a producing Atlantic type basin, in: Edwards, J.D., Santogrossi, P.A. (Eds.), Divergent/passive Margin Basins, AAPG Memoir 48. pp. 3–80. Harrington, H.J., 1947. Explicación de las hojas geológicas 33 m y 34 m, Sierras de Curamalal y de la Ventana, Provincia de Buenos Aires. Bol. Dir. Nac. Min. 61, 1–43. Harry, D.L., Sawyer, D.S., 1992. Basaltic volcanism, mantle plumes and the mechanics of rifting: the Parana flood basalt province of South America. Geology 20, 207–210. Hinz, K., 1981. A hypothesis on terrestrial catastrophes: wedges of very thick oceanward dipping layers beneath passive continental margins. Geological Journal E22, 3–28. Hinz, K., Neben, S., Schreckenberger, B., Roeser, H.A., Block, M., Souza, K.G. de, Meyer, H., 1999. The Argentine continental margin north of 48°S: sedimentary successions, volcanic activity during breakup. Marine and Petroleum Geology 16. Jokat, W., Boebel, T., König, M., Meyer, U., 2003. Timing and geometry of early Gondwana breakup. J. Geophys. Res. 108, doi:10.1029/2002JB001802. Juan, R.C., Jager, J.D., Russell, J., Gebhard, I., 1996. Flanco norte de la cuenca del Colorado. Geología y recursos naturales de la plataforma continental Argentina, Relatorio XIII Congreso Geológico Argentino y III Congreso de Exploración de Hidrocarburos. Kaasschieter, J., 1963. Geology of the Colorado Basin. Tulsa Geological Society Digest 31, 177–187. Kaasschieter, J., 1965. Geologia de la Cuenca del Colorado. Acta Geologica Lilloana 7, 251–269. Keeley, M.L., Light, M.P.R., 1993. Basin evolution and prospectivity of the Argentine continental margin. Journal of Petroleum Geology 16, 451–464. Kounov, A., Viola, G., de Wit, M., Andreoli, M.A.G., 2009. Denudation along the Atlantic passive margin: new insights from apatite fission-track analysis on the western coast of South Africa. Geological Society, London, Special Publications 324, 287–306.

27
Lawver, L.A., Gahagan, L.M., Dalziel, I.W.D., 1998. A tight fit-Early Mesozoic Gondwana, a plate reconstruction perspective. Mem. Natl. Inst. Polar Res. Spec. Issue 53, 214–229. Lesta, P.J., Turic, M.A., Mainardi, E., 1978. Actualización de la información estratigráfica en la Cuenca del Colorado, in: VII Congreso Geológico Argentino. Actas, Neuquén, pp. 701–713. Llambias, E.J., Prozzi, C.R., 1975. Ventania, in: Relatorio VI Congr. Geol. Arg. Buenos Aires, pp. 79–101. Loegering, M.J., Anka, Z., Autin, J., di Primio, R., Marchal, D., Rodriguez, J.F., Franke, D., Vallejo, E., 2013. Tectonic evolution of the Colorado Basin, offshore Argentina, inferred from seismo-stratigraphy and depositional rates analysis. Tectonophysics. Macdonald, D., Gomez-Perez, I., Franzese, J., Spalletti, L., Lawver, L., Gahagan, L., Dalziel, I., Thomas, C., Trewin, N., Hole, M., Paton, D., 2003. Mesozoic break-up of SW Gondwana: implications for regional hydrocarbon potential of the southern South Atlantic. Marine and Petroleum Geology 20, 287–308. Marchal, D., Dominguez, F., 2011. Estudio Regional del Margen Passivo Argentino. Informe Confidencial, Petrobras Argentina S.A. Massabie, A.C., Rosello, E.A., 1984. La discordancia pre-formación Sauce Grande y su entorno estratigráfico, Sierras Australes de la Provincia de Buenos Aires, in: Nov. Congr. Geol. Arg. S.C. Bariloche, Buenos Aires, pp. 337–352. McClay, K., Dooley, T., 1995. Analogue models of pull-apart basins. Geology 23, 711. McKenzie, D.P., Morgan, W.J., 1969. Evolution of Triple Junctions. Nature 224, 125–133. Moulin, M., Aslanian, D., Unternehr, P., 2010. A new starting point for the South and Equatorial Atlantic Ocean. Earth-Science Reviews 98, 1–37. Mpodozis, C., 1984. Dinámica de los márgenes continentales activos. Seminario Actualización de la Geología de Chile, Servicio Nacional de Geología y Minería Miscelánea No. 4, A1–A22. Mubu, M.S., 1995. Aeromagnetic mapping and interpretation of mafic dyke swarms in southern Africa (PhD). ITC Delft.,. Nürnberg, D., Müller, R.D., 1991. The tectonic evolution of the South Atlantic from Late Jurassic to present. Tectonophysics 191, 27–53. Pángaro, F., Ramos, V.A., 2011. Endomamiento regional asociado a la ruptura del Gondwana en la Plataforma Continental y sus posibles implicancias geotectónicas. Presented at the Actas XVIII Congreso Geológico Argentino. Pángaro, F., Ramos, V.A., 2012. Paleozoic crustal blocks of onshore and offshore central Argentina: New pieces of the southwestern Gondwana collage and their role in the accretion of Patagonia and the evolution of Mesozoic south Atlantic sedimentary basins. Marine and Petroleum Geology 37, 162–183. Peate, D.W., 1997. The Paraná-Etendeka Province, in: Large Igneous Provinces: Continental, Oceanic, and Planetary Flood Volcanism. American Geophysical Union, Washington D.C., pp. 217–245. Petrunin, A., Sobolev, S.V., 2006. What controls thickness of sediments and lithospheric deformation at a pull-apart basin? Geology 34, 389–392. Rabinowitz, P.D., LaBrecque, J., 1979. The Mesozoic South Atlantic Ocean and evolution of its continental margins. Journal of Geophysical Research 84, 5973–6002. Reeves, C., 2000. The geophysical mapping of Mesozoic dyke swarms in southern Africa and their origin in the disruption of Gondwana. Journal of African Earth Sciences 30, 499–513. Riccardi, A.C., 1983. The Jurassic of Argentina and Chile, in: Moullade, M., Nairn, A.E.M. (Eds.), The Phanerozoic Geology of the World II, The Mesozoic B. Elsevier, Amsterdam, pp. 201–264.

28
Rossello, E.A., Massabie, A.C., López-Gamundí, O.R., Cobbold, P.R., Gapais, D., 1997. Late Paleozoic transpression in Buenos Aires and northeast Patagonia ranges, Argentina. Journal of South American Earth Sciences 10, 389–402. Sandrin, A., Thybo, H., 2008. Seismic constraints on a large mafic intrusion with implications for the subsidence history of the Danish Basin. Journal of Geophysical Research: Solid Earth 113, n/a–n/a. Schnabel, M., Franke, D., Engels, M., Hinz, K., Neben, S., Damm, V., Grassmann, S., Pelliza, H., Dos Santos, P.R., 2008. The structure of the lower crust at the Argentine continental margin, South Atlantic at 44°S. Tectonophysics 454, 14–22. Tankard, A.J., Uliana, M.A., Welsink, H.J., Ramos, V.A., Turic, M., Franca, A.F., Milani, E.J., Neves, B.B. de B., Eyles, N., Skarmeta, J., Ana, H.S., Wiens, F., Cirbían, M., Paulsen, O.L., Germs, G.J.B., Wit, M.J.D., Machacha, T., Miller, R.M., 1995. Structural and Tectonic Controls of Basin Evolution in Southwestern Gondwana During the Phanerozoic, in: Tankard, A.J., Soruco, R.S., Welsink, H.J. (Eds.), Petroleum Basins of South America. The American Association of Petroleum Geologists Memoir 62, pp. 5–52. Torsvik, T.H., Rousse, S., Labails, C., Smethurst, M.A., 2009. A new scheme for the opening of the South Atlantic Ocean and the dissection of an Aptian salt basin. Geophysical Journal International 177, 1315–1333. Trumbull, R.B., Reid, D.L., de Beer, C., van Acken, D., Romer, R.L., 2007. Magmatism and continental breakup at the west margin of southern Africa: A geochemical comparison of dolerite dikes from northwestern Namibia and the Western Cape. South African Journal of Geology 110, 477–502. Turic, M.E., Diaz, H., 1987. Cuencas del Salado y del Colorado. Actas Del Decimo Congreso Geologico Argentino 29–32. Uliana, M.A., Biddle, K.T., 1988. Mesozoic-Cenozoic paleogeographic and geodynamic evolution of southern South America. Revista Brasileira de Geociências 18, 172–190. Uliana, M.A., Biddle, K.T., Cerdán, J.J., 1989. Mesozoic extension and the formation of the Argentine sedimentary basins, in: Tankard, A.J., Balkwill, H.R. (Eds.), Extensional Tectonics and Stratigraphy of the North Atlantic Margins. American Association of Petroleum Geologists Memoir 46, pp. 599–614. Unternehr, P., Curie, D., Olivet, J.L., Goslin, J., Beuzart, P., 1988. South Atlantic fits and intraplate boundaries in Africa and South America. Tectonophysics 155, 169–179. Urien, C.M., Zambrano, J.J., 1973. The geology of the basins of the Argentinian continental margin and Malvinas Plateau, in: Nairn, A.E.M., Stehli, F.G. (Eds.), The Ocean Basins and Margins, the South Atlantic. Plenum Press, New York, pp. 135–169. Urien, C.M., Zambrano, J.J., Martins, L.R., 1981. The basins of southeastern South America (southern Brazil, Uruguay, and eastern Argentina), including the Malvinas Plateau and southern South Atlantic paleogeographic evolution, in: Volkheimer, W., Musacchio, E.A. (Eds.), Cuencas Sedimentarias Del Jurásico y Cretácico En América Del Sur. Comité Sudamericano del Jurasico y Cretacico, pp. 45–126. Urien, C.M., Zambrano, J.J., Yrigoyen, M.R., 1995. Petroleum Basins of Southern South America: An Overview, in: Tankard, A.J., Soruco, R.S., Welsink, H.J. (Eds.), Petroleum Basins of South America. The American Association of Petroleum Geologists Memoir 62, pp. 63–77. Veevers, J.J., Clare, A., Wopfner, H., 1994. Neocratonic magmatic-sedimentary basins of post-Variscan Europe and post-Kanimblan eastern Australia generated by right-lateral transtension of Permo-Carboniferous Pangaea. Basin Research 6, 141–157. Visser, J., Praekelt, H., 1996. Subduction, mega-shear systems and Late Palaeozoic basin development in the African segment of Gondwana. Geologische Rundschau 85, 632–646.

29
White, R., McKenzie, D., 1989. Magmatism at Rift Zones: The Generation of Volcanic Continental Margins and Flood Basalts. J. Geophys. Res. 94, 7685–7729. Yrigoyen, M.R., 1975. Geología del subsuelo y plataforma continental-Geología de la Provincia de Buenos Aires, in: Congreso Geológico Argentino. Relatorio, Buenos Aires. Zambrano, J.J., 1980. Comarca de la Cuenca Cretácica del Colorado. Presented at the Segundo Simposio de Geología Regional Argentina, Academia Nacional de Ciencias, Córdoba, pp. 1033–1070.
FIGURE CAPTIONS
Figure 1: Topographic and bathymetric map of the northern Argentine passive margin,
along the southern part of the Austral segment. White contours corresponds to the Late
Jurassic - Early Cretaceous basins. The Colorado Basin emplaces through the Gondwana Fold
Belt (GFB) (e.g. Visser and Praekelt, 1996), which corresponds to the Sierras Australes and
the associated Claromecó Basin. Inner Seaward Dipping Reflectors (SDRs) marking the
Continent-Ocean Boundary (COB) from Franke et al. (2010).
Figure 2: Dataset used for the construction of the 3D structural model: 2D seismic lines (3
to 7.9 s TWT) from Petrobras Argentina S. A. (PESA), 2D seismic lines (12 s TWT) acquired
by the German Federal Institute for Geosciences and Natural Resources (BGR),, deep 2D
seismic lines (16 s TWT and 36 km TVDSS) acquired by GXT-ION, 9 boreholes (PESA),
deep cross-sections available in the literature either reflection seismic (Franke et al., 2007;
Hinz et al., 1999) or wide-angle seismic lines (Franke et al., 2006; Schnabel et al., 2008), the
topographic and bathymetric model ETOPO1 (1 arc-minute resolution Amante and Eakins,
2009) and the Crust2 model, providing basement and Moho depth points (2 degrees resolution
Bassin et al., 2000). The black and white maps (black frame location) display data points used
for each horizon. Map projection: UTM 21S in meters.
Figure 3: Interpreted seismic lines in time (TWT). a) Line located across the deep
depocentre of the eastern part of the Colorado Basin (see location on Figure 2). b) Line
located along the Eastern segment and across the Distal Margin (see location on Fig. 2, thin

30
vertical line indicates the crossing of the seismic lines). Horizons: PR: top of pre-rift
basement, TSR: top syn-rift, C1: top of Colorado I, C2: top of Colorado II, C3: top of
Colorado III, PL: top of Pedro Luro, EL: top of Elvira, CA: top of Caotico.
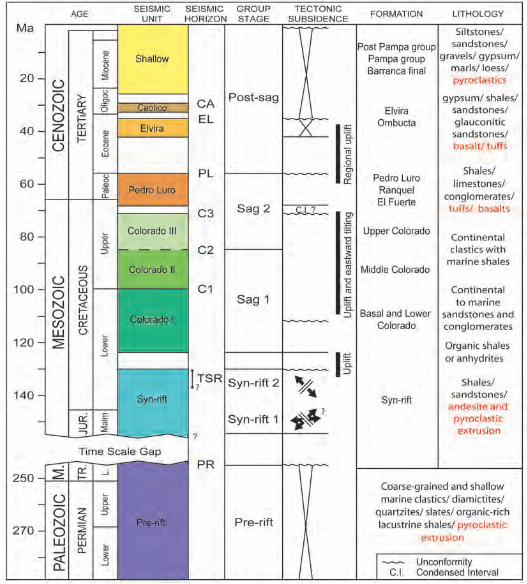
Figure 4: Seismic units and horizons and their correlation with main deformation and
subsidence stages, and with the stratigraphic chart. The stratigraphic chart is based on
Fryklund et al. (1996; 1994), Bushnell et al. (2000), Loegering et al. (2013) and the citations
therein (Buggisch, 1987; Estrella et al., 1984; Guardado et al., 1989; Harrington, 1947;
Kaasschieter, 1963; Keeley and Light, 1993; Lesta et al., 1978; Llambias and Prozzi, 1975;
Massabie and Rosello, 1984). Same abbreviations as Figure 3.
Figure 5: a) 3D structural model composed of 8 sedimentary layers and b) map of the top
syn-rift in depth showing the main segmentation of the Colorado Basin. The Western, Central
and Eastern segments strike NW-SE whereas the Central high strikes N70°. In the East, the
Colorado Basin joins the NE-SW distal margin, that leads to the oceanic crust. Green line:
alignment of faults bounding the western side of the distal margin. Red line: continental-
oceanic transition from Franke et al. 2007, 2010, eastern boundary of the distal margin. Map
projection: UTM 21S in meters.
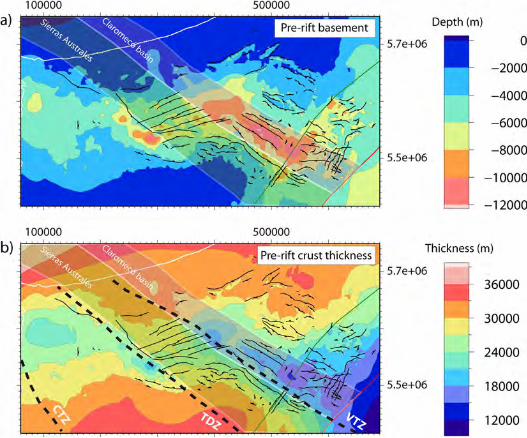
Figure 6: a) Major faults (black lines) affecting the pre-rift basement (background depth
map). The Colorado Basin is emplaced through the Paleozoic Sierras Australes fold belt and
the associated Claromecó Basin (Franke et al., 2006; Hinz et al., 1999; Juan et al., 1996). b)
Syn-rift 1 and syn-rift 2 depocentres with their respective major faults. c) Thickness map of
the pre-rift crust with the major faults. Dotted lines show the continental continuation of the
major transfer zones: VTZ - Ventana Transfer Zone, CTZ - Colorado Transfer Zone, TDZ -
Tona Deformation Zone (Dominguez et al., 2011). Green line: faults bounding the western
side of the distal margin. Red line: continental-oceanic transition, eastern boundary of the
distal margin. Maps projection: UTM 21S in meters.

31
Figure 7: Structural model of the Colorado Basin from Moho (bottom ) to sea bed (top).
Left: Depth map of the horizon. Right: Thickness map of the overlying seismic unit. Top:
seabed with domains and boundaries. Green line: faults bounding the western side of the
distal margin. Red line: continental-oceanic transition, eastern boundary of the distal margin.
The horizons are derived from different dataset (Figure 2): sea bed (ETOPO1 model),
sedimentary cover (TWT seismic lines), pre-rift basement (TWT seismic lines, time and depth
published lines, Crust2 model), Moho (deep TWT seismic lines (BGR - German Federal
Institute for Geosciences and Natural Resources), time and depth published lines, Crust2
model). Map projection: UTM 21S in meters.
Figure 8: A) Bouguer anomaly on- and off-shore in the vicinity of the Colorado basin
between latitude 36°S to 44°S and longitude 66°W to 52°W. B) Superimposition of the base
of the depocentres (Figure 7, syn-rift base) on the Bouguer anomaly (calculated with the
online gravity calculation service of the IGCEM). The (simple) Bouguer gravity anomaly is
defined by the classical gravity anomaly minus the attraction of the Bouguer plate. It is
calculated by the spherical approximation of the classical gravity anomaly minus 2πGρH
(equations 107 and 126 of Barthelmes, 2009). The topographic heights H (λ,φ) are calculated
from the spherical harmonic model DTM2006 used up to the same maximum degree as the
gravity field model. For H ≥ 0 (solid rocks) density ρ = 2670 kg.m-3, and for H < 0 (water)
density ρ = (2670−1025) = 1645 kg.m-3 is used to correct the gravity.
Figure 9: Crustal cross-sections: A - across the Central segment. B - across the Eastern
segment. C - along the distal margin. D – along the Eastern segment and across the distal
margin. Map projection: UTM 21S in meters.
Figure 10: Proposed scheme for the evolution of the Colorado Basin. Top: Pre-rift structural
configuration and future location of the segments (in grey). Centre: First extensional event
and development of the Central and Eastern segments. Bottom: Second extensional event

32
responsible for the South Atlantic opening. Paleozoic N70°E strike-slip faults could have
been reactivated in the Sierras Australes fold belt leading to the formation of the Central high
depression. VTZ - Ventana Transfer Zone, TDZ - Tona Deformation Zone (Dominguez et al.,
2011).