Superconducting Characteristics of 4-Å Carbon Nanotube-Zeolite Composite
Upload
independentCategory
view
1download
0
CD
Aa
b
c
a
ARRAA
KARCTZM
1
ttwiccteabe
peu
0d
Journal of Hazardous Materials 159 (2008) 348–353
Contents lists available at ScienceDirect
Journal of Hazardous Materials
journa l homepage: www.e lsev ier .com/ locate / jhazmat
olor removal from textile dyebath effluents in a zeolite fixed bed reactor:etermination of optimum process conditions using Taguchi method
hmet Baki Engina, Ozgur Ozdemirb, Mustafa Turanb,∗, Abdullah Z. Turanc
Sakarya University, Industrial Engineering Department, 54040 Sakarya, TurkeyIstanbul Technical University, Environmental Engineering Department, 34469 Istanbul, TurkeyIstanbul Technical University, Chemical and Metallurgical Engineering Department, 34469 Istanbul, Turkey
r t i c l e i n f o
rticle history:eceived 26 March 2007eceived in revised form 3 December 2007ccepted 13 February 2008vailable online 23 February 2008
eywords:dsorptioneal textile wastewater
a b s t r a c t
Taguchi method was applied as an experimental design to determine optimum conditions for colorremoval from textile dyebath house effluents in a zeolite fixed bed reactor. After the parameters weredetermined to treat real textile wastewater, adsorption experiments were carried out. The breakthroughcurves for adsorption studies were constructed under different conditions by plotting the normal-ized effluent color intensity (C/C0) versus time (min) or bed volumes (BV). The chosen experimentalparameters and their ranges are: HTAB concentration (Chtab), 1–7.5 g L−1; HTAB feeding flowrate (Qhtab),0.015–0.075 L min−1; textile wastewater flowrate (Qdye), 0.025–0.050 L min−1 and zeolite bed height (Hbed),25–50 cm, respectively. Mixed orthogonal array L16 (42 × 22) for experimental plan and the larger the bet-
olor removalaguchi methodeoliteodification
ter response category were selected to determine the optimum conditions. The optimum conditions werefound to be as follows: HTAB concentration (Chtab) = 1 g L−1, HTAB feeding flowrate (Qhtab) = 0.015 L min−1,textile wastewater flowrate (Qdye) = 0.025 L min−1 and bed height (Hbed) = 50 cm. Under these conditions,the treated wastewater volume reached a maximum while the bed volumes (BV) were about 217. WhileHTAB concentration, g L−1 (A); zeolite bed height, cm (D) and wastewater flowrate, L min−1 (C) werefound to be significant parameters, respectively, whereas, HTAB flowrate, L min−1 (B) was found to be an
ciuozto(mmr
bb
insignificant parameter.
. Introduction
The textile industries discharge wastewater originating fromhe dyeing and finishing processes. The use of organic dyes inhese industries has reached an amount of 700 000 tonnes/yearhile an annual world production of 30 million tonnes of textiles
s present [1]. Reactive azo dyes are presently the most importantompounds, constituting about 20–40% of the total dyes used foroloring [2]. Dye is the most ‘difficult to treat’ constituent of the tex-ile wastewater. Reactive dyes are hardly biodegraded in an aerobicnvironment. Hence, their presence in wastewater is undesirable,nd it is essential to remove coloring material from effluents beforeeing discharged in the environment. This is important in regions,specially, where water resources are scarce [3–5].
Such voluminous quantities pose considerable environmentalroblems because reactive dyes are water-soluble and cannot beasily removed by conventional methods such as chemical coag-lation/flocculation and biological methods [6]. The removal of
∗ Corresponding author. Tel.: +90 212 2856568; fax: +90 212 2856587.E-mail address: [email protected] (M. Turan).
mfi
ztflhL
304-3894/$ – see front matter © 2008 Elsevier B.V. All rights reserved.oi:10.1016/j.jhazmat.2008.02.065
© 2008 Elsevier B.V. All rights reserved.
olorants and other organic pollutants from industrial wastewaters considered an important application of the adsorption processsing suitable adsorbents [7]. The presence of 4.5 million tonnesf natural zeolites of high quality, mainly those of clinoptiloliteeolite in Turkey, creates an impetus for the utilization of clinop-ilolite in wastewater treatment [5]. The typical unit cell formulaf natural zeolite mineral, clinoptilolite, is given as Na6[(AlO2)6SiO2)30]·24H2O [8]. Zeolite has been studied in wastewater treat-
ent in recent years such as adsorption of ammonia [9,10], heavyetals [11–13] and reactive dyes [5,14] in batch mode and fixed bed
eactors.In the research and development stage, Taguchi method has
een found effective by means of improved productivity, whichrings along obtaining high quality items at low costs. Also, thisethod has been found applicable in a wide range of industrial
elds all over world [15–17].In this study, the color removal from real textile wastewater in a
eolite fixed bed reactor was investigated. The effect of experimen-al parameters such as HTAB concentration (Chtab), HTAB feedingowrate (Qhtab), textile wastewater flowrate (Qdye) and zeolite bedeight (Hbed) on the color removal were investigated using an16 (42 × 22) orthogonal array. The Taguchi experimental design
A.B. Engin et al. / Journal of Hazardous
Table 1Chemical composition of Gordes clinoptilolite
Constituent Zeolite (% by wt)
Purity 92–96SiO2 70.5CaO 2.90K2O 1.75AI2O3 13.5MgO 1.2TiO 0.05P2O5 0.05Fe2O3 1.10Na2O 0.40H2O 4.00LOIa 4.55p
mfu
2
2
iGTwozh
fipc1a
wmHruHwc
buna(b
HtaAwzps[
l
B
wdcit
2
cmoeiTdo
saAra
mgaeopaoosaoev
astp
S
wlao
dacf
H 7–7.65
a Loss on ignition.
ethod was used to determine optimum color removal conditionsor maximizing the treated wastewater volume related to bed vol-mes (BV).
. Materials and methods
.1. Experimental system
The clinoptilolite sample – hereafter referred as zeolite – usedn the experiments was received from Incal Mining Company in theordes region of Turkey. The chemical analysis of zeolite is givenable 1. In the experiments, real textile wastewater was used whichas supplied from a textile factory located in Kayseri, Turkiye. Inrder to increase the adsorption capacity, the surface of naturaleolite was modified with a typical quaternary amine surfactant.exadecyltrimethylammonium bromide (HTAB, C19H42BrN).
The laboratory-scale experimental set-up consists of zeolitexed bed column, HTAB solution and real textile wastewater tanks,eristaltic pump, flowmeter, valves and treated water tank. Theylindrical plexiglas column has a diameter of 3 cm and a height of00 cm. The particle size of clinoptilolite is 0.5–1 mm (35–18 mesh)nd has bed heights of 25 and 50 cm.
A sample of 15 g HTAB was dissolved in a known volume distilledater to obtain the desired concentration of HTAB solution. Experi-ents were performed to determine the optimum conditions usingTAB solution for preparing modified zeolite and subsequent color
emoval from real textile wastewater by modified zeolite in the col-mn system. The system is made of a fixed bed column to whichTAB solution (1–7.5 g L−1) or real textile wastewater is pumpedith a peristaltic pump (Seko PR1) from a tank to the top of the
olumn at a particular flowrate.The analysis for the cationic surfactant (HTAB) was performed
y a two-phase titration technique applied to anionic surfactantssing dimidium bromide and disulfine blue as indicators. This tech-ique is based on the formation of a complex structure betweennionic surfactant (sodium dodecylsulfate) and cationic reagentHTAB). The complex is soluble in chloroform and changes fromlue to pink in the presence of indicators [18,19].
The effectiveness of the modification of zeolite surface withTAB was tested by the color removal ability of the fixed bed reac-
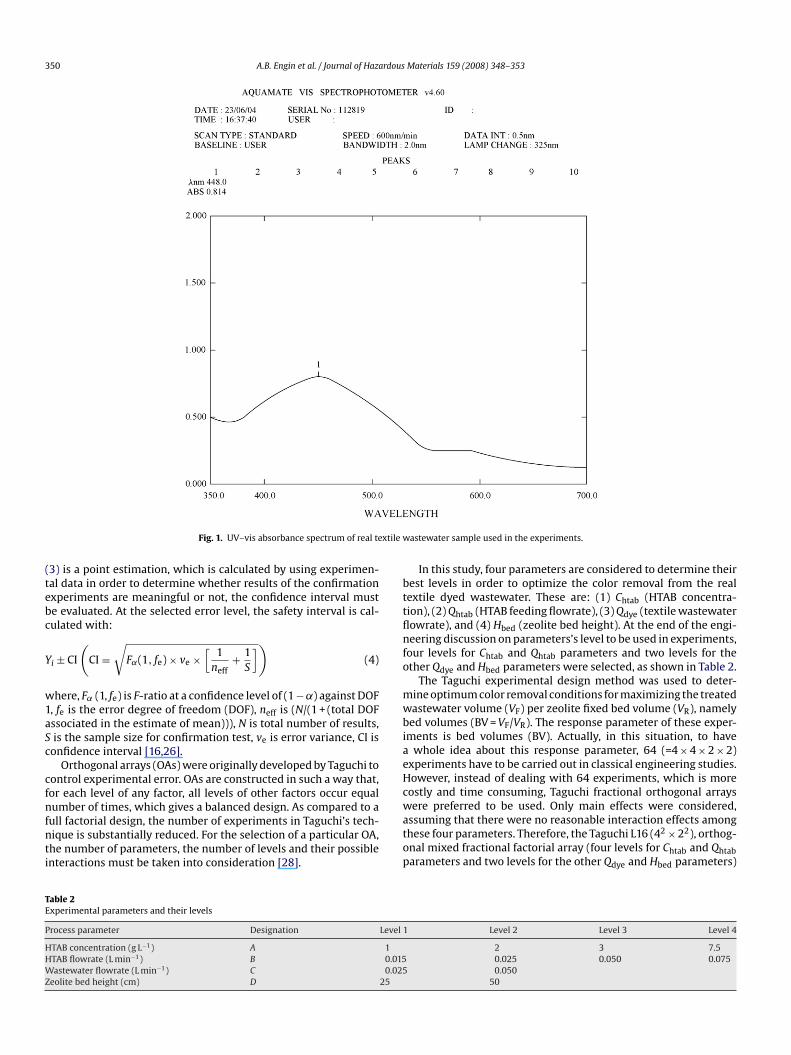
or. Color was measured by UV–vis spectrophotometer (Aquamate)t peak absorption wavelength of real textile wastewater (448 nm).bsorbance spectrum gave a peak at 448 nm between 350 and 700
avelength as shown in Fig. 1 [20]. Adsorption performance of theeolite bed was evaluated while bed volumes (BV) at breakthroughoint (C/C0 < 0.1) is maximum. The breakthrough curves were con-tructed by plotting the normalized effluent color intensity (C/C0)21] versus time and/or bed volumes (BV) which is defined as fol-
Y
wea
Materials 159 (2008) 348–353 349
ows [14]:
V = VF
VR= QFt
VR(1)
here VF is the total water volume passing through the columnuring the adsorption process (m3), VR is the fixed bed volume oflinoptilolite (m3), C0 is influent color intensity, C is effluent colorntensity, QF is the feed flowrate in the fixed bed (m3 s−1) and t ishe adsorption time (s).
.2. Taguchi method
The Taguchi method, which is developed by Taguchi, is aomplete application in design and analysis of experiments. Opti-ization of processes of engineering experimentation by this
r suchlike methods is expressed with the concept “qualityngineering”. The methods emphasize the application of engineer-ng knowledge rather than advanced statistical techniques [22].aguchi’s ideas do not focus on the mathematical aspects of theesign of experiments, but on the philosophy. In his methods, partsf classical methods are joined with cost considerations.
The greatest difference between the Taguchi methods and clas-ical methods is that in Taguchi’s experiments orthogonal arraysre used to assure the reproduction of the effects of parameters.nother difference is that various types of “signal to noise” (S/N)atios are used in a Taguchi study in order to measure variabilityround the target performance [23–25].
In the optimization of a process with various process perfor-ance characteristics for parameter design of Taguchi method,
iven steps should be followed [23,26]. First, performance char-cteristics are identified and process parameters that are to bestimated are selected. Second, it is decided that how many numberf parameter levels there are and what kind of mutual effects areossible for the process parameters. Next, appropriate orthogonalrray (OA) is selected and process parameters are assigned to therthogonal array. After that, experiments are ready to be run basedn the arrangement of the orthogonal array. Then, performancetatistics are calculated. After the calculations, experimental resultsre analyzed with the help of performance statistics and analysisf variance (ANOVA). Following is the selection of the optimal lev-ls of process parameters. Finally, optimal process parameters areerified through the confirmation experiment.
There are three basic S/N ratios. However, according to Fowlkesnd Creveling, the variety of S/N ratios is limitless [27]. In thistudy, the performance statistics of “the larger the better” was usedo define the optimum conditions [24,26]. “The larger the better”erformance statistics was given by,
NL = −10 log
(1n
n∑i=1
1
y2i
)(2)
here SNL is the S/N ratio or the performance characteristics as “thearger the better”, yi is the comparison variable in experiment i forcertain combination of control factor levels, and n is the numberf experiments performed for that combination.
Optimum operation conditions may have not been obtaineduring the entire experimental section. In such cases, the bal-nced characteristic OA can help predicating the performance valueorresponding to the optimum operation conditions, where theollowing additive model may be used:
i = � + Xi + ei (3)
here � is the overall mean of the performance value, Xi is the fixedffect of the quantity level combination used in ith experiment,nd ei is the random error in the ith experiment [16]. Because Eq.
350 A.B. Engin et al. / Journal of Hazardous Materials 159 (2008) 348–353
xtile w
(tebc
Y
w1aSc
cfnfnti
bttflnfo
mwbiaeHc
TE
P
HHWZ
Fig. 1. UV–vis absorbance spectrum of real te
3) is a point estimation, which is calculated by using experimen-al data in order to determine whether results of the confirmationxperiments are meaningful or not, the confidence interval muste evaluated. At the selected error level, the safety interval is cal-ulated with:
i ± CI
(CI =
√F˛(1, fe) × ve ×
[1
neff+ 1
S
])(4)
here, F˛ (1, fe) is F-ratio at a confidence level of (1 − ˛) against DOF, fe is the error degree of freedom (DOF), neff is (N/(1 + (total DOFssociated in the estimate of mean))), N is total number of results,is the sample size for confirmation test, ve is error variance, CI is
onfidence interval [16,26].Orthogonal arrays (OAs) were originally developed by Taguchi to
ontrol experimental error. OAs are constructed in such a way that,or each level of any factor, all levels of other factors occur equal
umber of times, which gives a balanced design. As compared to aull factorial design, the number of experiments in Taguchi’s tech-ique is substantially reduced. For the selection of a particular OA,he number of parameters, the number of levels and their possiblenteractions must be taken into consideration [28].
watop
able 2xperimental parameters and their levels
rocess parameter Designation Level
TAB concentration (g L−1) A 1TAB flowrate (L min−1) B 0.015astewater flowrate (L min−1) C 0.025
eolite bed height (cm) D 25
astewater sample used in the experiments.
In this study, four parameters are considered to determine theirest levels in order to optimize the color removal from the realextile dyed wastewater. These are: (1) Chtab (HTAB concentra-ion), (2) Qhtab (HTAB feeding flowrate), (3) Qdye (textile wastewaterowrate), and (4) Hbed (zeolite bed height). At the end of the engi-eering discussion on parameters’s level to be used in experiments,
our levels for Chtab and Qhtab parameters and two levels for thether Qdye and Hbed parameters were selected, as shown in Table 2.
The Taguchi experimental design method was used to deter-ine optimum color removal conditions for maximizing the treatedastewater volume (VF) per zeolite fixed bed volume (VR), namelyed volumes (BV = VF/VR). The response parameter of these exper-
ments is bed volumes (BV). Actually, in this situation, to havewhole idea about this response parameter, 64 (=4 × 4 × 2 × 2)
xperiments have to be carried out in classical engineering studies.owever, instead of dealing with 64 experiments, which is moreostly and time consuming, Taguchi fractional orthogonal arrays
ere preferred to be used. Only main effects were considered,ssuming that there were no reasonable interaction effects amonghese four parameters. Therefore, the Taguchi L16 (42 × 22), orthog-nal mixed fractional factorial array (four levels for Chtab and Qhtabarameters and two levels for the other Qdye and Hbed parameters)
1 Level 2 Level 3 Level 4
2 3 7.50.025 0.050 0.0750.050
50
A.B. Engin et al. / Journal of Hazardous Materials 159 (2008) 348–353 351
Table 3Taguchi L16 (42 × 22) orthogonal array and results for bed volumes (BV = VF/VR)
Experiment no. A B C D Yi
Chtab (g L−1) Qhtab (L min−1) Qdye (L min−1) Hbed (cm) BVi
1 1 1 1 1 1442 1 2 1 1 1083 1 3 2 2 1544 1 4 2 2 1495 2 1 1 2 1136 2 2 1 2 1287 2 3 2 1 438 2 4 2 1 429 3 1 2 1 128
10 3 2 2 1 8011 3 3 1 2 16612 3 4 1 2 13613 4 1 2 2 11014 4 2 2 2 110
wpu
3
topcvwpFt
tot((ti
mbteet(ap
TR
L
1234DR
B
T
P
�
�
pttc(i
ctidetAi7
15 4 316 4 4
as selected in order to be able to find out the optimum levels ofarameters [29]. In doing this, Minitab® 15 Statistical Software wassed.
. Results and discussion
The collected data were analyzed by using Minitab® 15 Statis-ical Software for the evaluation of the effect of each parametern the optimization criteria. In order to determine the effectivearameters and their confidence levels on the color removal pro-ess, an analysis of variance was performed. A statistical analysis ofariance (ANOVA) was performed to see which process parametersere statistically significant. F-test is a tool to see which processarameters have a significant effect on the dye removal value. The-value for each process parameter is simply a ratio of the mean ofhe squared deviations to the mean of the squared error.
The color removal from the real textile wastewater was inves-igated in different experimental conditions. To determine theptimum conditions for the color removal in the dyebath effluents,he effects of HTAB concentration (Chtab), HTAB feeding flowrateQhtab), textile wastewater flowrate (Qdye), and zeolite bed heightHbed) were investigated respectively. The experimental results andhe reaction conditions for which the effect of parameters werenvestigated are given in Table 3.
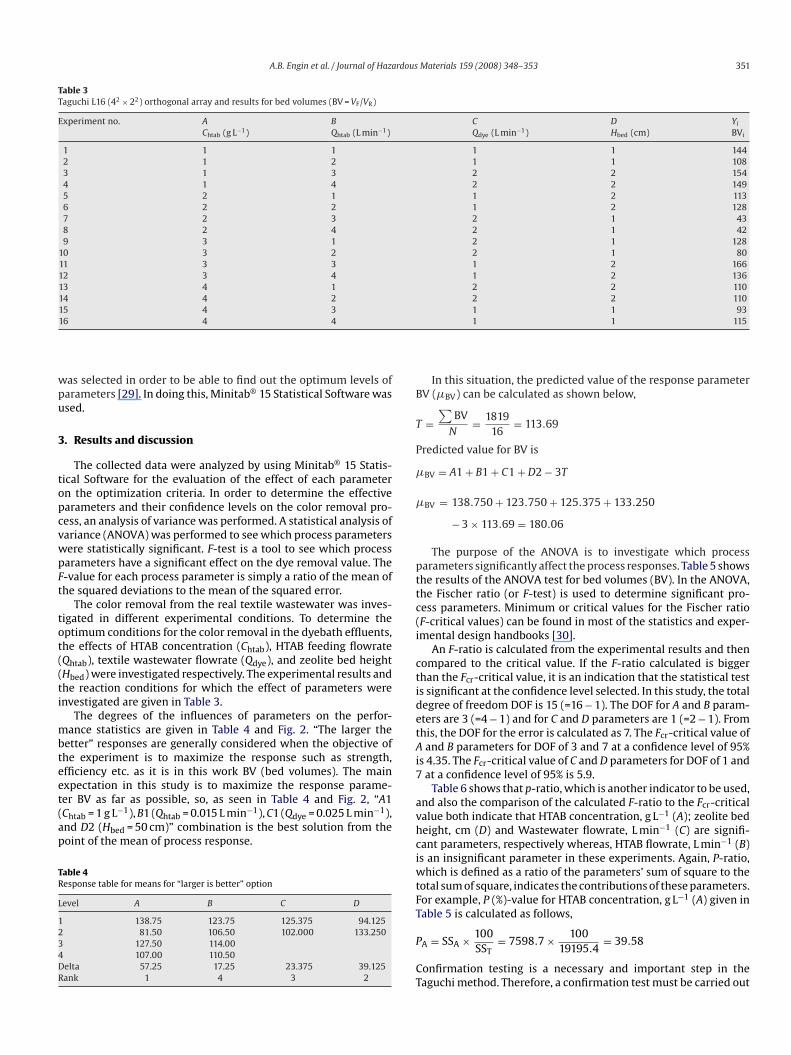
The degrees of the influences of parameters on the perfor-ance statistics are given in Table 4 and Fig. 2. “The larger the
etter” responses are generally considered when the objective ofhe experiment is to maximize the response such as strength,fficiency etc. as it is in this work BV (bed volumes). The mainxpectation in this study is to maximize the response parame-
er BV as far as possible, so, as seen in Table 4 and Fig. 2, “A1Chtab = 1 g L−1), B1 (Qhtab = 0.015 L min−1), C1 (Qdye = 0.025 L min−1),nd D2 (Hbed = 50 cm)” combination is the best solution from theoint of the mean of process response.able 4esponse table for means for “larger is better” option
evel A B C D
138.75 123.75 125.375 94.12581.50 106.50 102.000 133.250
127.50 114.00107.00 110.50
elta 57.25 17.25 23.375 39.125ank 1 4 3 2
avhciwtFT
P
CT
1 1 931 1 115
In this situation, the predicted value of the response parameterV (�BV) can be calculated as shown below,
=∑
BVN
= 181916
= 113.69
redicted value for BV is
BV = A1 + B1 + C1 + D2 − 3T
BV = 138.750 + 123.750 + 125.375 + 133.250
− 3 × 113.69 = 180.06
The purpose of the ANOVA is to investigate which processarameters significantly affect the process responses. Table 5 showshe results of the ANOVA test for bed volumes (BV). In the ANOVA,he Fischer ratio (or F-test) is used to determine significant pro-ess parameters. Minimum or critical values for the Fischer ratioF-critical values) can be found in most of the statistics and exper-mental design handbooks [30].
An F-ratio is calculated from the experimental results and thenompared to the critical value. If the F-ratio calculated is biggerhan the Fcr-critical value, it is an indication that the statistical tests significant at the confidence level selected. In this study, the totalegree of freedom DOF is 15 (=16 − 1). The DOF for A and B param-ters are 3 (=4 − 1) and for C and D parameters are 1 (=2 − 1). Fromhis, the DOF for the error is calculated as 7. The Fcr-critical value ofand B parameters for DOF of 3 and 7 at a confidence level of 95%
s 4.35. The Fcr-critical value of C and D parameters for DOF of 1 andat a confidence level of 95% is 5.9.
Table 6 shows that p-ratio, which is another indicator to be used,nd also the comparison of the calculated F-ratio to the Fcr-criticalalue both indicate that HTAB concentration, g L−1 (A); zeolite bedeight, cm (D) and Wastewater flowrate, L min−1 (C) are signifi-ant parameters, respectively whereas, HTAB flowrate, L min−1 (B)s an insignificant parameter in these experiments. Again, P-ratio,
hich is defined as a ratio of the parameters’ sum of square to theotal sum of square, indicates the contributions of these parameters.or example, P (%)-value for HTAB concentration, g L−1 (A) given inable 5 is calculated as follows,
A = SSA × 100SST
= 7598.7 × 10019195.4
= 39.58
onfirmation testing is a necessary and important step in theaguchi method. Therefore, a confirmation test must be carried out
352 A.B. Engin et al. / Journal of Hazardous Materials 159 (2008) 348–353
Fig. 2. The effect of each parameter on the optimization criteria of bed volumes (BV).
Table 5Results of ANOVA for bed volumes (BV)
Source DOF SS Adj SS Variance F-ratio Fcr p P (%)
A 3 7598.7 7598.7 2532.9 6.73 4.35 0.018 39.58B 3 652.7 652.7 217.6 0.58 4.35 0.648 3.40C 1 2185.6 2185.6 2185.6 5.81 5.39 0.047 11.38D 1 6123.1 6123.1 6123.1 16.26 5.39 0.005 31.90
Error 7 2635.4 2635.4 376.5 13.74
Total 15 19195.4 100.0
SS, sum of squares; DOF, degree of freedom; p, probability of F > F-ratio; P, percent contribution.
Table 6Significant process parameters, their optimal levels and optimal predicted value for BV process response
Parameter Optimal settings of process conditions Significant process parameters
Value Level
A, HTAB concentration (g L−1) 1 1 AB 1C 1D 2P
adst
±
So
1
1
wvn
vap(ti
4
, HTAB flowrate (L min−1) 0.015, Wastewater flowrate (L min−1) 0.025, Zeolite bed height (cm) 50redicted the BV process response 180.3
t the end of the optimization study. A confirmation test was con-ucted for bed volumes (BV) without repetition at the optimumetting of the process parameters. The 95% confidence interval ofhe confirmation test (CI) was calculated by using Eq. (4) as follows,
CI =√
F˛(1, fe) × ve ×[
1neff
+ 1S
]= ±57.33
o, predicted optimal range (for confirmation runs of one test) isbtained as;
80 − 57.33 < � < 180 + 57.33, which is;
22.67 < � < 237.3
here, fe = 7, N = 16, F0.05: 1 and 7 (tabulated F-value) = 5.59, S = 1,e = 376.5, total DOF associated in the estimate of mean = 8,eff = 1.78.
bs
ra
CD
The confirmation test indicates that 217 values for the bedolumes (BV) at the breakthrough point (C/C0 < 0.1) is in accept-ble limits. Hence, it can be concluded that the optimal levels ofarameters are: A1 (Chtab = 1 g L−1), B1 (Qhtab = 0.015 L min−1), C1Qdye = 0.025 L min−1), and D2 (Hbed = 50 cm). Under these condi-ions, the volume of treated textile effluents reaches a maximumn the process of color removal from real textile wastewater.
. Conclusions
Taguchi method is applied in color removal from textile dye-
ath effluents in a zeolite fixed bed reactor. The salient findings areummarized below.The most important parameter affecting the color removal fromeal textile wastewater in the zeolite bed reactor is HTAB. Thedsorption capacity of the HTAB modified zeolite bed shows a
rdous
pwHci(
vaf(
A
vUa1
R
[
[
[
[
[
[
[
[
[
[
[
[
[
[
[
[
[
[
[
A.B. Engin et al. / Journal of Haza
eak value by using HTAB concentration of 1 g L−1l, but decreasesith the increase of HTAB concentration from 1 g L−1 to 7.5 g L−1.owever, HTAB flowrate, L min−1 (B) is found to be an insignifi-ant parameter. Color removal is influenced from the parametersn the following order: HTAB concentration (A) > zeolite bed heightD) > wastewater flowrate (C).
Confirmation test indicates that 217 values for the bedolumes (BV) at the breakthrough point (C/C0 < 0.1) is incceptable limits. Finally, the optimal levels of parameters areound as: A1 (Chtab = 1 L min−1), B1 (Qhtab = 0.015 L min−1), C1Qdye = 0.025 L min−1), and D2 (Hbed = 50 cm).
cknowledgements
The authors wish to acknowledge the financial support pro-ided by the Scientific Research Center of the Istanbul Technicalniversity - Ph.D. Program (Project No. 31581) and the Scientificnd Technical Research Council of Turkey (TUBITAK) (Project No.05Y288).
eferences
[1] R. Abraham, Dyes Environmental Chemistry: Encyclopaedia of Chemical Tech-nology, vol. 8, Wiley, NY, 1993.
[2] A.R. William, T.F. Leonard, Water and salt reuse in the dyehouse, Textile Chem.Color. 29 (1997) 10–19.
[3] U. Pagga, D. Brown, The degradation of dye-stuffs: Part II behaviour of dyestuffsin aerobic biodegradation tests, Chemosphere 15 (1986) 479–491.
[4] W.B. Randall, G.D. Boardman, A.M. Dietrich, D.L. Michelsen, M. Padaki, Pilotscale study on anaerobic treatment of textile wastewaters, hazardous andindustrial wastes, in: Proceedings of the Mid Atlantic Industrial Waste Con-ference, 1993, pp. 218–227.
[5] B. Armagan, O. Ozdemir, M. Turan, M.S. Celik, The removal of reactive azodyes by natural and modified zeolites, J. Chem. Technol. Biotechnol. 78 (2003)725–732.
[6] T. Panswad, W. Luangdilok, Decolorization of reactive dyes with differentmolecular structures under different environmental conditions, Water Res. 34(2000) 4177–4184.
[7] Z. Al-Qodah, Adsorption of dyes using shale oil ash, Water Res. 34 (2000)
4295–4303.[8] D.W. Breck, Zeolite Molecular Sieves, Wiley, New York, 1974.[9] M. Turan, M.S. C elik, Regenerability of Turkish clinoptilolite for use in ammonia
removal from drinking water, J. Water Serv. Res. Technol. Aqua 52 (2003) 59–66.10] B.N.K. Nijoroge, S.G. Mwamachi, Ammonia removal from an aqueous solution
by the use of natural zeolite, J. Environ. Eng. Sci. 3 (2004) 147–154.
[
[
Materials 159 (2008) 348–353 353
11] G.M. Haggerty, R.S. Bowman, Sorption of chromate and other inorganic anionsby organo-zeolite, Environ. Sci. Technol. 28 (1994) 452–458.
12] M. Vaca-Mier, R.L. Callegas, R. Gehr, C.B. Jimenez, P.J. Alvarez, Heavy metalremoval with Mexican clinoptilolite: multi-component ionic exchange, WaterRes. 35 (2001) 373–378.
13] M. Turan, U. Mart, B. Yuksel, M.S. Celik, Lead removal in fixed-bed columns byzeolite and sepiolite, Chemosphere 60 (2005) 1487–1492.
14] Y.E. Benkli, M.F. Can, M. Turan, M.S. Celik, Modification of organo-zeolite surfacefor the removal of reactive azo dyes in fixed bed reactors, Water Res. 39 (2005)487–493.
15] H.S. Sii, T. Ruxton, J. Wang, Taguchi concepts and their applications in marineand offshore safety studies, J. Eng. Des. 12 (2001) 331–358.
16] M. Copur, C. Ozmetin, E. Ozmetin, M.M. Kocakerim, Optimization study of theleaching of roasted zinc sulphide concentrate with sulphuric acid solutions,Chem. Eng. Process. 43 (2003) 1007–1014.
17] J. Moghaddam, R. Sarraf-Mamoory, M. Abdollahy, Y. Yamini, Purification ofzinc ammoniacal leaching solution by cementation: determination of optimumprocess conditions with experimental design by Taguchi’s method, Sep. Purif.Technol. 51 (2006) 157–164.
18] V.W. Reid, G.F. Longman, E. Heinerth, Determination of anionic active deter-gents by two-phase titration, Tenside 4 (1967) 292–294.
19] G.W. Powers, The volumetric determination of organic sulfates or sulfonatesby the double indicator method, in: Communication C-225, Amoco ProductionCo., Tulsa, USA, 1970, pp. 1–4.
20] S. Sen, G.N. Demirer, Anaerobic treatment of real textile wastewater with afluidized bed reactor, Water Res. 37 (2003) 1868–1878.
21] S. Sirianuntapiboon, M. Srikul, Reducing red color intensity of seafood wastew-ater in facultative pond, Bioresour. Technol. 97 (2006) 1612–1617.
22] J. Antony, Multi-response optimization in industrial experiments usingTaguchi’s quality loss function and principal component analysis, Qual. Reliab.Eng. Int. 16 (2000) 3–8.
23] M.S. Phadke, Quality Engineering Using Robust Design, P. T. R. Prentice Hall,Englewood Cliffs, New Jersey, 1989.
24] R.K. Roy, A Primer on the Taguchi Method, Van Nostrand Reinhold, New York,1995.
25] C.Y. Nian, W.H. Yang, Y.S. Tarng, Optimization of turning operations with mul-tiple performance characteristics, J. Mater. Process. Technol. 95 (1999) 90–96.
26] E. Oguz, B. Keskinler, C. Celik, Z. Celik, Determination of the optimumconditions in the removal of Bomaplex Red CR-L dye from the textile wastew-ater using O3, H2O2, HCO3
− and PAC, J. Hazard. Mater. B131 (2006) 66–72.
27] W.Y. Fowlkes, C.M. Creveling, Engineering Methods for Robust Product Design:Using Taguchi Methods in Technology and Product Development, Addison-Wesley, New York, 1995.
28] S. Singh, H.S. Shan, P. Kumar, Parametric optimization of magnetic-field-assisted abrasive flow machining by the Taguchi method, Qual. Reliab. Eng.
Int. 18 (2002) 273–283.29] R.H. Lochner, J.E. Matar, Designing for Quality: An introduction to the Best ofTaguchi and Western Methods of Statistical Experimental Design, ProductivityPress, New York, 1990, p. 241.
30] D.C. Montgomery, Design and Analysis of Experiments, 5th ed., John Wiley &Son, New York, 2001.
Copyright © 2022 FDOKUMEN