Colombia - World Bank Documents
142
ReportNo. 4444-CO Colombia: Economic Development andPolicyJ Under Changing Conditions (In Two Volumes) Volume II: Statistical Appendix August 5, 1983 Latin America andthe Caribbean Regional Office FOR OFFICIAL USEONLY U Document of the Ubrd Bank This docwment has a restricted distrbution and maybe used by recipients only in the performance of their officia duties. Itscontents mayrot otherwise be discdosed withoutWorldBank authorization. Public Disclosure Authorized Public Disclosure Authorized Public Disclosure Authorized Public Disclosure Authorized Public Disclosure Authorized Public Disclosure Authorized Public Disclosure Authorized Public Disclosure Authorized
-
Upload
khangminh22 -
Category
Documents
-
view
0 -
download
0
Transcript of Colombia - World Bank Documents
Report No. 4444-CO
Colombia: Economic Development and PolicyJUnder Changing Conditions(In Two Volumes) Volume II: Statistical Appendix
August 5, 1983
Latin America and the Caribbean Regional Office
FOR OFFICIAL USE ONLY
U
Document of the Ubrd Bank
This docwment has a restricted distrbution and may be used by recipientsonly in the performance of their officia duties. Its contents may rot otherwisebe discdosed without World Bank authorization.
Pub
lic D
iscl
osur
e A
utho
rized
Pub
lic D
iscl
osur
e A
utho
rized
Pub
lic D
iscl
osur
e A
utho
rized
Pub
lic D
iscl
osur
e A
utho
rized
Pub
lic D
iscl
osur
e A
utho
rized
Pub
lic D
iscl
osur
e A
utho
rized
Pub
lic D
iscl
osur
e A
utho
rized
Pub
lic D
iscl
osur
e A
utho
rized
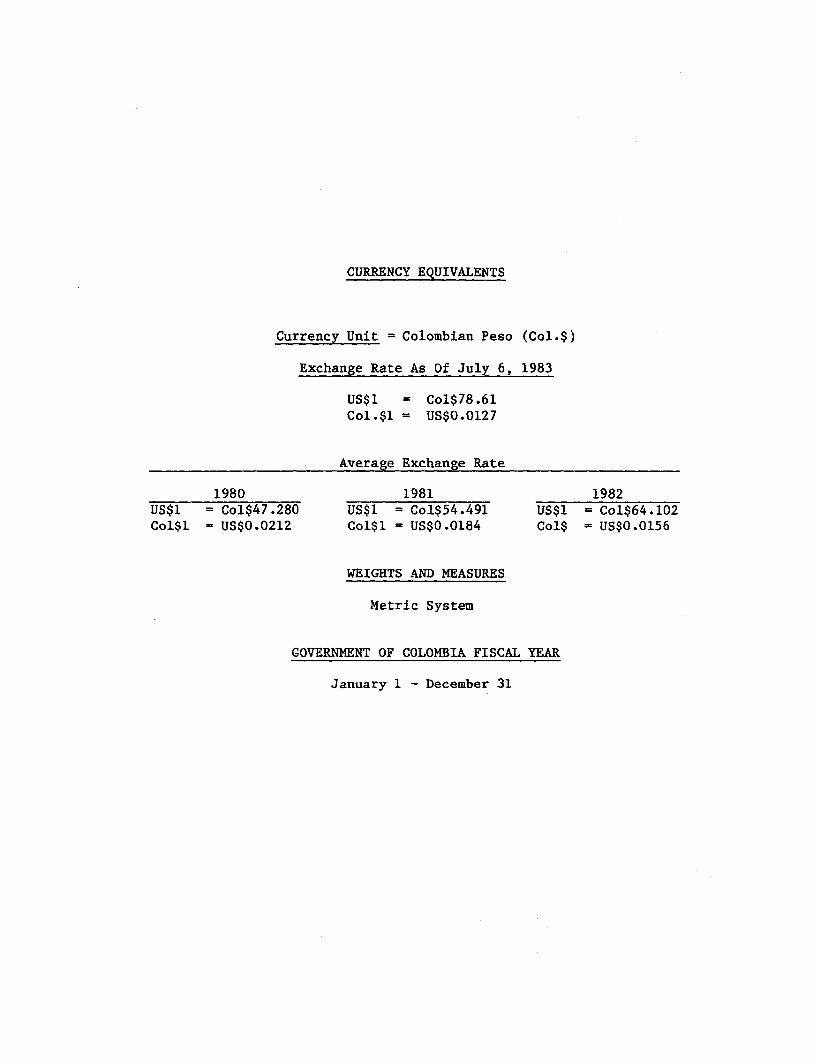
CURRENCY EQUIVALENTS
Currency Unit = Colombian Peso (Col.$)
Exchange Rate As Of July 6, 1983
US$1 = Col$78.61Col.$1 = US$0.0127
Average Exchange Rate
1980 1981 1982US$1 = Col$47.280 US$1 = Col$54.491 US$1 = Col$64.102Col$l - US$0.0212 Col$1 - US$0.0184 Col$ = US$0.0156
WEIGHTS AND MEASURES
Metric System
GOVERNMENT OF COLOMBIA FISCAL YEAR
January 1 - December 31

FOR OFFICIAL USE ONLYSTATISTICAL APPENDIX
Table of Contents
Table No. Standard Tables
(i) National Accounts Summary, 1976-82 (Millions of Pesos at CurrentPrices)
(ii) National Accounts Summary, 1976-82 (Millions of US Dollars atConstant 1978 Prices)
(iii) Balance of Payments, 1976-82 (Millions of US Dollars at CurrentPrices)
I. Population and Employmeni:
Table 1.1 Population and Its Distributior., 1951-83Table 1.2 Sources of Population Change, 1.951-82Table 1.3 Participation Rates in Seven Cities, 1976-83Table 1.4 Unemployment Rates in Seven Cities, 19.70, 1974-8:3Table 1.5 Income Distribution According to Different Estimates, 1960-78
II. National Accounts
Table 2.1 Gross Domestic Product at Factor Cost by Sector at CurrentPrices, 1960-82
Table 2.2 Gross Domestic Product at Factor Cost by Sector at ConstantPrices, 1960-82
Table 2.3 Gross Domestic Product by Type of Expenditure at Current MarketPrices, 1960-82
Table 2.4 Gross Domestic Product by Type of Expernditure at Constant MarketPrices, 1960-82
Table 2.5 Actual Resource Availability and Savings at Const:ant MarketPrices, 1970-82
Table 2.6 National Income Components, 1965, 1970, 1975, 1978-80Table 2.7 Investment and Its Financing, 1960-80Table 2.8 Sources of Investment Financing, 1967-80Table 21.9 Personal Income, 1960-80Table 2.10 Saving by Businesses and Households and. Liabilities of Financial
Intermediaries, 1967-82Table 2.11 Implicit Price Deflators for Gross Domestic ProdtLct, 1958-82Table 2.12 Sector Wages and Salaries as Percentage of Sector Value Added
and of Total Wages and Salaries, 1960, 1965, 1970, 1975-80Table 2.13 Actual and Projected Resource Availability and Savings at
Constant Market Prices, 1980-90
III. Balance of Payments
Table 3.1 Balance of Payments, 1970-82Table 3.2 Commodity Exports, 1970-81Table 3.3 Imports by Economic Category, 1970-81Table 3.4 Central Bank Gross Receipts of :Foreign Exchange, 1965-82Table 3.5 Central Bank Disbursements of Foreign Exchange, 1960, 1965-82Table 3.6 Supply and Distribution of Export Grade Green Coffee, 1958-59
to 1981-82
This document ias a restricted distribution and may be used by *ecipients only in the performance oftheir official duties. Its contents may not otherwise be disclosed without World Bank authorization.

- ii -
Table No.
Table 3.7 New York and Domestic Coffee Prices, Real and Nominal, 1970-82Table 3.8 Crude Petroleum Production, Apparent Domestic Consumption and
Net Exports, 1958-82Table 3.9 Imports by Principal Product Groups, 1970-81Table 3.10 Direction of Trade, 1960, 1965, 1970, 1976-82Table 3.11 International Monetary Reserves of the Central Bank, 1965, 1970,
1975-82Table 3.12 Official Market Rates of Exchange, 1970-83Table 3.13 Balance of Payments, Export Projections, 1980-90Table 3.14 Balance of Payments, Import Projections, 1980-90Table 3.15 Summary Balance of Payments, 1980-90
IV. External Debt
Table 4.1 External Public Debt Outstanding Including Undisbursed as ofDecember 31, 1981, Debt Repayable in Foreign Currency and Goods
Table 4.2 Service Payments, Commitments, Disbursements and OutstandingAmounts of External Public Debt, Projections Based on DebtOutstanding Including Undisbursed as of December 31, 1981, DebtRepayable in Foreign Currency and Goods
Table 4.3 External Public Debt Outstanding Including Undisbursed as ofDecember 31, 1981, Debt Repayable in Local Currency
Table 4.4 Service Payments, Commitments, Disbursements and OutstandingAmounts of External Public Debt. Projections Based on DebtOutstanding Including Undisbursed as of December 31, 1981, DebtRepayable in Local Currency
V. Public Finance
Table 5.1 Public Sector Resources for Investment, 1974-81Table 5.2 Analysis of Consolidated Public Sector Finances, 1974-81Table 5.3 Central Government Operations, 1974-81Table 5.4 National Government Operations, 1974-81Table 5.5 National Government Revenues, 1974-81Table 5.6 Tax Burden, 1972-81Table 5.7 Buoyancies with Respect to GDP of National Government Revenues,
1974-81Table 5.8 National Highway Fund Operations, 1974-81Table 5.9 Cavecinales Operations, 1974-81Table 5.10 Social Security Systems Operations, 1974-81Table 5.11 Nonfinancial Public Sector Transfers, 1974-81Table 5.11-1 National Government Current Transfers Received by the Rest of
Nonfinancial Public Sector, 1974-81Table 5.12 National Decentralized Agencies Operations, 1974-81Table 5.12-1 Summary Accounts of Major National Decentralized Agencies
Operations, 1974-81Table 5.13 National Nonfinancial Public Enterprises Operations, 1974-81Table 5.13-1 Summary Accounts of Major Nonfinancial Public Enterprises,
1974-81Table 5.14 Summary Accounts of the Departments Operations, 1974-81Table 5.15 Summary Accounts of the Municipalities Operations, 1974-81
- iii -
Table No.
Table 5.15-1 Summary Accounts of Major Municipal Nonfinancial PublicEnterprises, 1974-81
Table 5.16 Public Sector Gross Fixed Investment, ]L974-81Table 5.17 Real Public Sector Gross Fixed Investment, 1974-81Table 5.18 Summary Accounts of the National Financial Enterprises
Operations, 1974-81Table 5.19 Projections of the National Government Operations, 1980-86
VI. Monetary Statistics
Table 6.1 The Money Supply, Money Base and the Money Multiplier, 1970-82Table 6.2 Composition and Growth of the Honey Supply, 1960,, 1970-82Table 6.3 Commercial Bank Loans, by Quarter, 1970-82Table 6.4 Banking System Loans, by Quarter, 1970-82Table 6.5 Bogota and Medellin Stock Exchanges, 15170-82Table 6.6 Total Institutional Credit Outstanding by Sector, 1974-81Table 6.7 Total Institutional Credit Outstanding by Source, 1970-82Table 6.8 Total Institutional Credit Outstanding by Term, 1970-82Table 6.9 Credit to the Private Sector and the Role of the Development
Funds, 1970-82Table 6.10 Distribution of Liabilities of Major Private Financial
Intermediaries, 1967-82Table 6.11 Estimates of Real Interest Rates on Easily Available Assets,
1968-82Table 6.12 Effective Interest Rates on Selected Financial Assets, 1970-82Table 6.13 Nominal and Real Interest Rates on Three Month Certificates of
Deposits (CDs), 1980-83Table 6.14 Estimates of Subsidies of the Central Eank and PROEXPO Credit
Lines, 1980-81
VII. Agriculture
Table 7.1 Production of Principal Crops, 1970-82Table 7.2 Area Under Cultivation, Principal Crops, 1970-82Table 7.3 Crop Yields per Hectare, 1970-82Table 7.4 Gross Value of Agricultural Production, 1950-82Table 7.5 Indices of Physical Volume of G:ross Agricultural Production,
1950-82Table 7.6 Agricultuial Gross Value Added dat Constant 1970 P'rices, 1950-82Table 7.7 Agricultural Terms of Trade, 19655-82Table 7.8 Loans Extended to the Agricultural Sector, 1971-82Table 7.9 Value of Principal Agricultural Imports, 1971-82Table 7.10 Area Planted with Improved Seed for Selected Crops, 1970,
1975-82
VIII. Industry, Mineralsi and Energy
Table 8.1 Gross Value of Production of the Manufacturing Industries, 1970,1974-81
Table 8.2 Indices of Value Added at Constant Prices in the ManufacturingIndustries, 1970-81
- iv
Table No.
Table 8.3 Exports of Manufactured Goods as Percent of GDP and ofIndustrial Output, 1970-82
Table 8.4 Paid Employment in Manufacturing Industries by Type ofProduction, 1960, 1965, 1970-81
Table 8.5 Commercial Bank Credit to the Manufacturing Sector, 1965-82Table 8.6 Volume of Production of Minerals, 1970-81Table 8.7 Value of Production of Minerals, 1970-81Table 8.8 Energy Indicators, 1970-82Table 8.9 Production and Consumption of Petroleum Derivatives, 1970-82Table 8.10 Average Wholesale Coal Prices, 1970-82Table 8.11 Natural Gas Prices, 1975-82Table 8.12 Consumer Prices of Selected Petroleum Derivatives, 1970-82Table 8.13 Average Electrical Tariffs by Sector and Entity, 1970, 1975-81
IX. Wages and Prices
Table 9.1 Consumer Price Indices for Bogota, Medellin and the Nation,1970-83
Table 9.2 Consumer Price Indices by Expenditure Category, 1970-83Table 9.3 Wholesale Price Indices by Main Commodity Group, 1970-83Table 9.4 Wholesale and Consumer Price Indices and Growth Rates,1970-83Table 9.5 Average Annual Increase in Selected Price Indicators, 1960-82Table 9.6 Price Indices of Construction Materials in Bogota, 1977-83
X. Human Resources
Table 10.1 Student Population by Level of Education, Public and Private,1963, 1973, 1976-83
Table 10.2 Pupil Enrollment in Primary School, 1963, 1973, 1976-83Table 10.3 Pupil Enrollment in Secondary School by Type of Curriculum,
1963, 1973, 1976-83Table 10.4 First Semester Enrollment in Universities According to Type of
Program and Course of Study, 1975-81Table 10.5 Number of University Professors by Type of Academic Field and
Dedication, 1980 and 1981Table 10.6 Educational Level of the Labor Force as Reported in the National
Censuses of 1951, 1964 and 1973 and the Household Survey of 1978Table 10.7-1 Ten Main Causes of Death Among Pre-School Children, 1970,
1972-77Table 10.7-2 Ten Main Causes of Death Among Pre-School Children, 1970,
1972-77Table 10.7-3 Ten Main Causes of Death Among All Ages, 1970, 1972-77Table 10.8 Indirect Indicators of Nutritional Status, 1963-76Table 10.9 Recommended and Available Average Daily per Capita Dosage of
Calories and Nutrients for the Colombian Population and thePercentage of Adequacy of Supply, 1980
Table 10.10 Percentage of Adequacy of Calories and Nutrient Consumption :Lnthe Diet of Families from Various Geographical Areas, 1977
Table 10.11 Annual Needs for Basic Food Groups for Human Consumption andTheir Availability, 1966-81

Table (i) COLOMBIA: NATIONAL ACCOUNTS SUMMARY, 1976-82(millions of Pesos at current prices)
Preliminary Estimate~fl70 ltI WM I or% 1 001 10;976 1977 1710 1971
Gross Domestic Product 534,015 718,474 916,559 1,195,379 1,595,155 2,033,892 2,542,867
Resource Gap (M-X) -16,291 -24,379 -23,203 -29,838 -8,790 80,209 113,136Imports (GNFS) 78,125 98,880 129,431 163,469 263,876 331,190 413,060Exports (GNFS) 94,416 123,259 152,634 193,307 272,666 250,981 299,924
Total Expenditures 517,724 694,095 893,356 1,165,541 1,586,365 2,114,101 2,656,003
Consumption 406,371 524,955 684,414 896,349 1,185,029 1,561,187 2,000,673Private 367,641 476,801 618,690 805,229 1,052,525 1,383,997 1,771,955Public 38,730 48,154 65,724 91,120 132,504 177,190 228,718
Investment 111,353 169,140 208,942 269,192 401,336 552,914 655,330Fixed Investment 97,081 134,784 187,721 243,041 347,641 441,806 552,688Change in Stocks 14,272 34,356 21,221 26,151 53,695 111,108 102,642
Domestic Savings 127,644 193,519 232,145 299,030 410,126 472,705 542,194Net Factor Income -10,536 -9,738 -11,375 -10,583 -10,055 -23,3Z2 -44,936Current Transfers 1,313 1,432 1,663 4,067 7,852 13,187 14,294National Saving 118,421 185,213 222,433 292,514 407,923 462,570 511,552
Av-enage '-echange Ra-tes
Colombian Pesos per US$ 33.66 35.80 37.79 41.50 48.03 54.49 64.10Colombian Pesos per SDR 42.20 46.10 53.30 57.90 64.90 68.80 77.54
Note: Exports and imports of goods and NFS and net factor income were converted by IBRD staff from US dollars in the balanceof payments to Colombian pesos in the national accounts. The exchange rate used in the conversion is an annual averageof the implicit rates of daily customs declarations provided by Banco de la Republica. The item private consumption istreated as a residual.
Domestic Savings = Investment - Resource Gap.
National/Savings = Domestic Savings + Net Factor Income + Current Transfers.
Source: Banco de la Republica

Table (ii) COLOMBIA: NATIONAL ACCOUNTS SUMMARY, 1976-82(millions of US Dollars at Constant 1978 prices)
Preliminary Estimate1976 1977 1978 1979 1980 1981 1982
Gross Domestic Product 21,282 22,262 24,254 25,491 26,559 27,224 27,607Terne of Trade Effect 11 628 - -287 -92 -659 -439Gross Domestic Income 21,293 22,890 24,254 25,204 26,467 26,565 27,168
Resource Gap -557 -732 -614 -653 -282 1,147 1,413Imports GNFS 2,667 2,970 3,425 3,582 4,556 4,737 5,159Capacity to Import 3,224 3,702 4,039 4,235 4,838 3,590 3,746Exports GNFS 3,213 3,074 4,039 4,522 4,799 4,249 4,185
Total Expenditures 20,736 22,158 23,640 24,551 26,185 27,712 28,581
Consumption 15,944 16,673 18,111 18,901 19,324 19,899 21,044Private 14,414 15,080 16,372 17,032 17,258 17,687 18,752Public 1,530 1,593 1,739 1,869 2,066 2,212 2,292
Investment 4,792 5,485 5,529 5,650 6,861 7,813 7,537Fixed 4,211 4,403 4,967 5,064 5,808 5,989 6,109Change in Stocks 581 1,082 562 586 1,053 1,824 1,428
Domestic Saving 5,349 6,217 6,143 6,303 7,143 6,666 6,124Net Factor Income -402 -322 -301 -223 -174 -372 -622Current Transfers 50 47 44 86 136 210 198National Saving 4,997 5,942 5,886 6,166 7,105 6,504 5,700
Peso Deflators (1978-100)GDP 66.4 85.4 100.0 124.0 158.9 197.7 243.7Imports GNFS (US$ deflator) 87.0 93.0 100.0 110.7 120.6 128.3 124.9Exports GNFS (US$ deflator) 87.3 112.0 100.0 104.3 118.3 108.4 111.8Total Expenditures 66.0 83.0 100.0 125.6 160.3 201.9 245.9Government Consumption 67.0 80.0 100.0 129.0 169.7 211.9 264.0Private Consumtion 67.5 83.7 100.0 125.1 161.4 207.1 250.1Fixed Investmeat 61.0 81.0 100.0 127.0 158.4 195.2 239.4Change in Stocks 65.0 84.0 100.0 118.0 135.0 161.2 190.1
Exchange rate Index (US cents 112.3 105.6 100.0 91.1 78.7 69.4 59.0per Coloubtsn $)
Note: External trade price indices were derived from the dollar value and volume of exports and imports. Currenttransfers and net factor income were deflated by the International Price Index. Gross domestic products,Investment and government consumption were deflated by the implicit price indices from Banco de la Republicaand converted to US dollars by applying the average exchange rate for 1978. The item private consumption istreated as a residual.
Source: Banco de la Republica

Tmh1e (iin coT. MRTA! RALANCE OF PAYMENTS; 1976-82(millions of US Dollars at current prices)
Preliminary Estimate1976 1977 1978 1979 1980 1981 1982
Exports (GNFS) 2,805 3,443 4,039 4,658 5,677 4,606 4,679Hercnandise (FOB) (2,255) (2,727) (3,270) (3,581) (4,372) (3,458J (3,399)NFS (550) (716) (769) (1,077) (1,305) (1,148) (1,280)
Imports (GNFS) 2,321 2,762 3,425 3,939 5,494 6,078 6,444Merchandise (FOB) (1,665) (1,979) (2,564) (2,996) (4,300) (4,763) (5,175)NFS (656) (783) (861) (943) (1,194) (1,315) (1,269)
Resource Balance 484 681 614 719 183 -1,472 -1,765
Net Factor Income -313 -272 -301 -255 -210 -428 -701(Factor Receipts) (71) (72) (132) (267) (494) (647) (496)(Factor Payments) (384) (344) (433) (522) (204) (1,075) (1,197)
(M< Interest Paid) (198) (180) (172) (201) (195) (297) (434)
Net Current Transfers 39 40 44 98 164 242 223(Transfer Receipts) (65) (71) (73) (105) (171) (249) (298)(Transfer Payments) (26) (31) (29) (7) (7) (7) (75)
Current Balance 210 449 357 562 137 -1,658 -2,243M< Capital InflowDirect Investment 14 43 67 104 52 228 268Official Grant Aid 12 6 29 3 - - 24Net H< Loans (DRS) i09 195 92 606 779 1;,450 ;,168Disbursements (262) (371) (319) (1,041) (1,156) (1,972) (1,610)Repayments (153) (176) (227) (435) (377) (522) (442)Other M< (net) - - - - - - -
Net Credit from IF - - - - - - -Disbursements - - - - - - _
Repayments - - - - - - _
Net Short-Term Capital 7 -67 -21 -178 -67 181 170Capital Flows n.e.i. - - - 24 24 24 -Errors and Omissions 210 226 86 116 243 -113 -193
Change in Net Reserves -562 -852 -610 -1,237 -1,168 -112 806(- indicates increase)
Source: Banco de la Republica
- 4 -
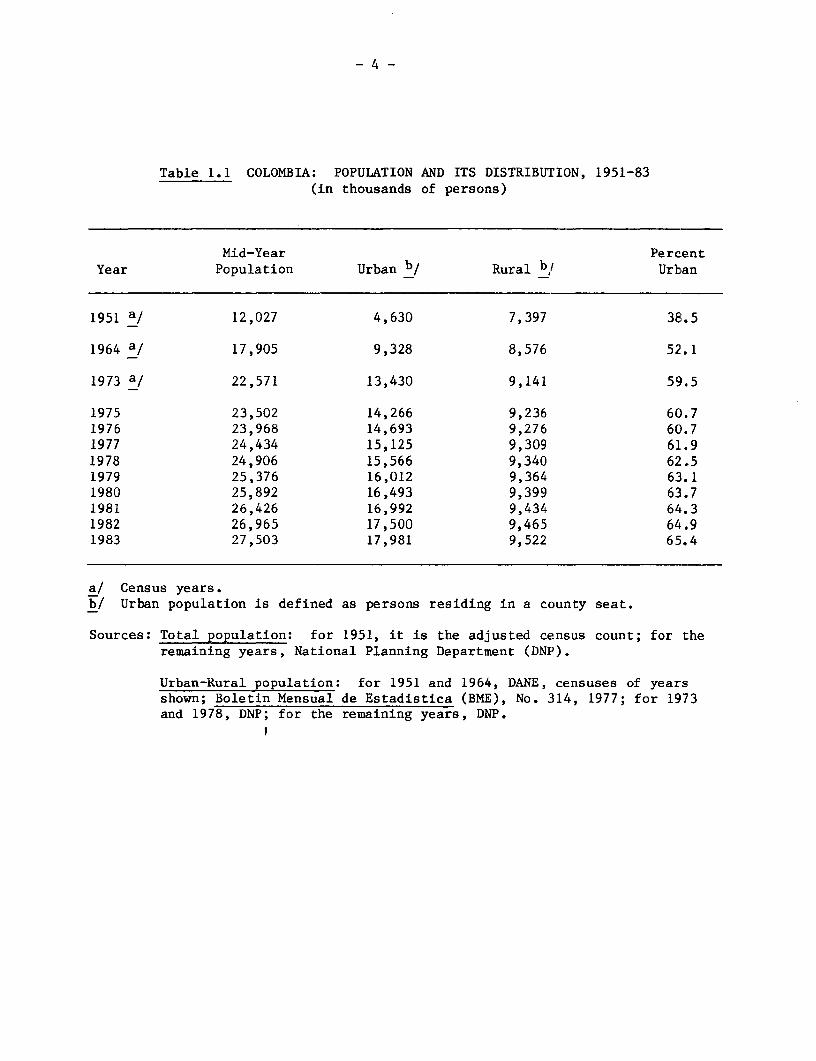
Table 1.1 COLOMBIA: POPULATION AND ITS DISTRIBUTION, 1951-83(in thousands of persons)
Mid-Year PercentYear Population Urban b/ Rural b/ Urban
1951 a/ 12,027 4,630 7,397 38.5
1964 a/ 17,905 9,328 8,576 52.1
1973 a/ 22,571 13,430 9,141 59.5
1975 23,502 14,266 9,236 60.71976 23,968 14,693 9,276 60.71977 24,434 15,125 9,309 61.91978 24,906 15,566 9,340 62.51979 25,376 16,012 9,364 63.11980 25,892 16,493 9,399 63.71981 26,426 16,992 9,434 64.31982 26,965 17,500 9,465 64.91983 27,503 17,981 9,522 65.4
a/ Census years.b/ Urban population is defined as persons residing in a county seat.
Sources: Total population: for 1951, it is the adjusted census count; for theremaining years, National Planning Department (DNP).
Urban-Rural population: for 1951 and 1964, DANE, censuses of yearsshown; Boletin Mensual de Estadistica (BME), No. 314, 1977; for 1973and 1978, DNP; for the remaining years, DNP.
I
- 5 -
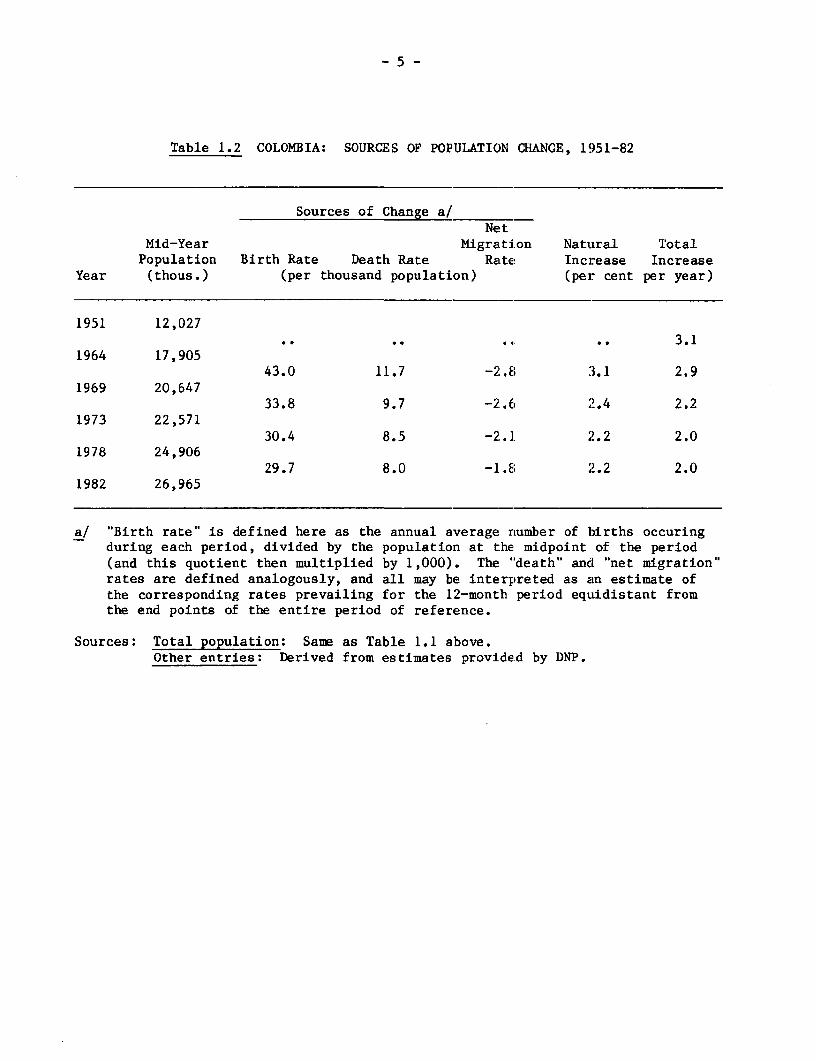
TabLe 1.2 COLOMBIA: SOURCES OF POPULATION CHANGE, 1951-82
Sources of Change a/Net
Mid-Year Migration Natural TotalPopulation Birth Rate Death Rate Rate Increase Increase
Year (thous.) (per thousand population) (per cent per year)
1951 12,0273.1
1964 17,90'i43.0 11.7 -2.8 3.1 2.9
1969 20,64733.8 9.7 -2.6 2.4 2.2
1973 22,57:130.4 8.5 -2.1. 2.2 2.0
1978 24,906i29.7 8.0 -1.8 2.2 2.0
1982 26,96-5
a/ "Birth rate" is defined here as the annual average number of births occuringduring each period, divided by the population at the midpoint of the period(and this quotient then multiplied by 1,000). The "death" and "net migration"rates are defined analogously, and all may be interpreted as an estimate ofthe corresponding rates prevailing for the 12-month period equidistant fromthe end poillts of the entire period of reference.
Sources: Total population: Same as Table 1.1 above.Other entries: Derived from estimates provided by DNP.

Ta1e 1.3: OOUIBTAI PARTICIPATI(W PAM3 IN 98vM C1TIF, 1976-83
1976 1977 1978 1979 1990 19818/ 1982 1983lhr. h. gap. SEc. NWr. hi. Sep. Se. p. .hi Sa. Diec. Mbr. .h.n Sep. Dec. max. am. Sep. Sec. Mhr. amj. Sep. Sec. KW. 3m. Sept. DeC. 1W.
ft okU 33.5 36.1 36.6 35.7 31L0 33.2 32.8 31.7 33.7 - 33.2 33.7 32.8 33.5 32.8 32.7 33.7 34.8 33.3 35.2 36.1 35.3 37.8 36.5 33.5 36.8 34.8 35.1 36.7
36.7 37.0 36.0 37.2 36.8 36.7 36.7 36.2 36.8 39.3 37.9 37.0 38.5 37.9 39.3 40.3 41.5 42.9 39.5 40.6 38.4 38.7 39.3 39.2 40.0 40.3 39.3 40.1 40.1
BKNW0 36.4 - 37.1 - 36.9 - 36.2 - 36.5 - 35.8 - 33.7 - 35.3 - 37.9 - 36.8 - 36.5 - 35.8 - 37.3 - 39.1 - 39.6
cn 38.0 36.9 37.1 36.9 37.5 38.3 389 38.1 38.5 - 40.4 38.8 39.7 40.0 42.1 44.2 43.7 43.2 42.9 39.0 40.6 39.2 41.9 40.2 40.3 41.2 41.3 41.1 40.5
mo1mm 35.6 - 31.6 - 34.3 - 36.3 - 31.6 - 35.8 - 32.3 - 35.3 - 36.9 - 38.2 - 36.5 34.7 35.9 - 34.9 - 36.9 - 35.3a
!hhiLln 33.8 33.2 35.6 35.9 36.9 36.1 37.6 37.3 37.6 - 37.8 40.2 39.7 39.5 39.7 40.7 40.7 40.2 41.8 42.5 40.7 40.4 38.7 37.2 38.2 39.0 39.4 38.7 39.7
S1mat 35.2 - 34.4 - 39.5 - 39.2 - 37.1 - 39.0 - 36.7 - 38.1 - 36.3 - 37.5 - 39.9 38.8 39.2 - 36.8 - 39.0 - 42.7
NJbs: 711cr to 1981, die aaweey wo cwfAicd ln him and S urfor die for =jar citfm mly. 7ha airey im orexiutal for dhe aou cities in .hi of 1981.
Omm partiripatimn rate is define - tt peartoui of de labor force In tie total popilaticm.
7Ba w1 kyed labor foroIchla p-r~ of w-kdng ag -ekedempal]oyment dhiring week of mrvwy but eportirng to bave wiorkd at least onie heaw (hiring waeek prior to the ewvey interview; wpaid familyw rkmksrepoting to lave wmeird at leat fiftaimit borsduing tNe wBek rior to tNe airvy Interview; persex of eDrirng aeg vAm claim to lava a 'Job' wr a " mu ew" hit ido did not work an die week pmevlom to theayesy; and pa-n of working w engl In paid emp1oinit.
lDe ujop1oyed aIr force iiaiunh: umoployied pereae of working apr vile unelertock specific acdre in searrh of a job duiring tie week prior to tie uryirey interview; uWi oyedica persons of wmnrking age %il didwtc take aibch action (hiring tN a ek prior to the a.rvey interview bit ehi did so xtthin die twelve .iettls prior to die interview; uniemployed persons of waiting ego initing response to job qpplictiomi peevineelyuijtttad; uweiployad perana of wonideg agmiee itDhzeen offered a job itichi Is tOD begin at sare future date; eel personse of uworking age ca traorary leav widt&su pay fer sDre Omr thirt days A"le ame lookingfor wDrk bit laid a job on die wee prior to, the sirvey.
Sourc: DA
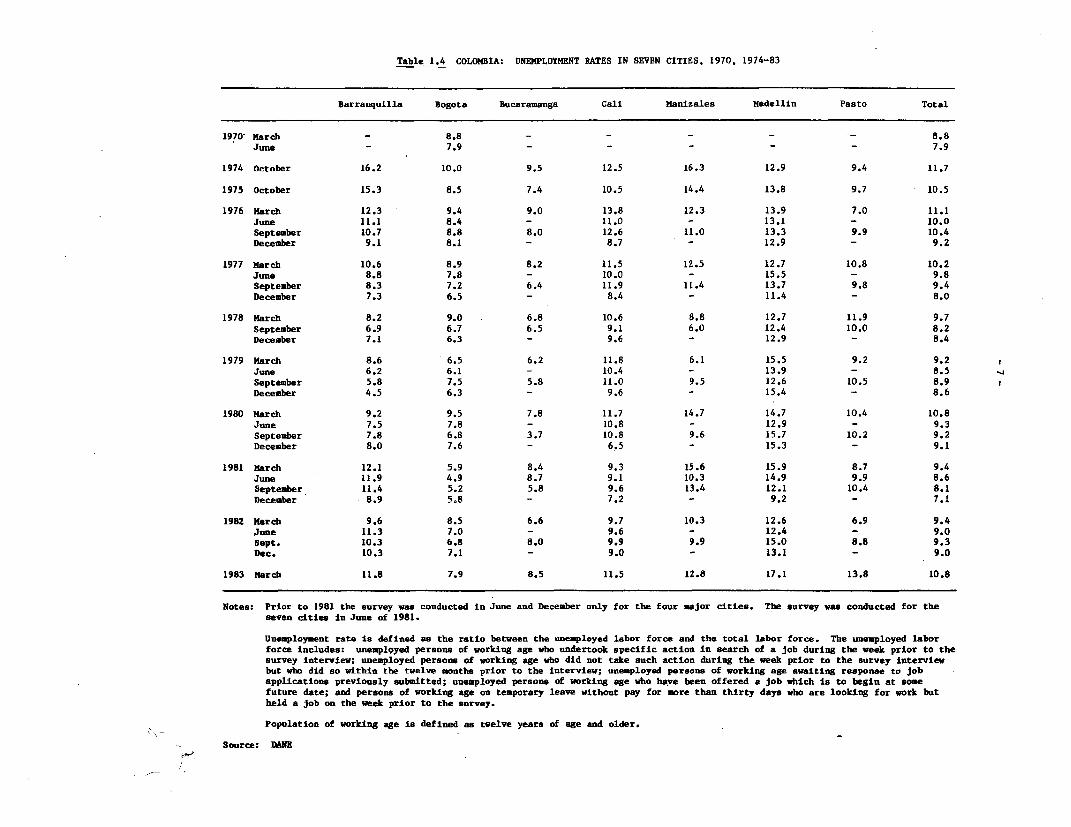
Table 1.4 COLOMBIA: UNEMPLOYMENT RATES IN SEVEN CITIES, 1970, 1974-83
Barranquilla Bogota Bucaramanga Cali Manizales Medellin Pasto Total
1970- March - 8.8 _ _ 8.8June - 7.9 - - - - - 7.9
1974 October 16.2 10.0 9.5 12.5 16.3 12.9 9.4 11.7
1975 October 15.3 8.5 7.4 10.5 14.4 13.8 9.7 10.5
1976 March 12.3 9.4 9.0 13.8 12.3 13.9 7.0 11.1June 11.1 8.4 - 11.0 - 13.1 - 10.0September 10.7 8.8 8.0 12.6 11.0 13.3 9.9 10.4December 9.1 8.1 - 8.7 - 12.9 - 9.2
1977 March 10.6 8.9 8.2 11.5 12.5 12.7 10.8 10.2June 8.8 7.8 - 10.0 - 15.5 - 9.8Septemer 8.3 7.2 6.4 11.9 11.4 13.7 9.8 9.4December 7.3 6.5 - 8.4 - 11.4 - 8.0
1978 March 8.2 9.0 6.8 10.6 8.8 12.7 11.9 9.7September 6.9 6.7 6.5 9.1 6.0 12.4 10.0 8.2December 7.1 6.3 - 9.6 - 12.9 - 8.4
1979 March 8.6 6.5 6.2 11.8 6.1 15.5 9.2 9.2 1June 6.2 6.1 - 10.4 - 13.9 - 8.5 4September 5.8 7.5 5.8 11.0 9.5 12.6 10.5 8.9 eDecember 4.5 6.3 - 9.6 - 15.4 - 8.6
1980 March 9.2 9.5 7.8 11.7 14.7 14.7 10.4 10.8June 7.5 7.8 - 10.8 - 12.9 - 9.3September 7.8 6.8 3.7 10.8 9.6 15.7 10.2 9.2December 8.0 7.6 - 6.5 - 15.3 - 9.1
1981 March 12.1 5.9 8.4 9.3 15.6 15.9 8.7 9.4June 11.9 4.9 8.7 9.1 10.3 14.9 9.9 8.6September 11.4 5.2 5.8 9.6 13.4 12.1 10.4 8.1December 8.9 5.8 - 7.2 - 9.2 - 7.1
1982 March 9.6 8.5 6.6 9.7 10.3 12.6 6.9 9.4June 11.3 7.0 - 9.6 - 12.4 - 9.0Sept. 10.3 6.8 8.0 9.9 9.9 15.0 8.8 9.3Dec. 10.3 7.1 - 9.0 - 13.1 - 9.0
1983 March 11.8 7.9 8.5 11.5 12.8 17.1 13.8 10.8
Notes: Prior to 1981 the survey was conducted in June and December only for the four major cities. The survey was conducted for theseven cities in June of 1981.
Unemployment rate is defined as the ratio between the unemployed labor force and the total labor force. The unemployed laborforce includes: unemployed persons of working age who undertook specific action in search of a job during the week prior to thesurvey interview; unemployed persons of working age who did not take such action during the week prior to the survey interviewbut who did so within the twelve months prior to the interview; unemployed persons of working age awaiting response to jobapplications previously submitted; unemployed persons of working age who ha,ve been offered a job which is to begin at somefuture date; and persona of working age on temporary leave without pay for more than thirty days who are looking for work butheld a job on the week prior to the survey.
Population of working age is defined as twelve years of age and older.
Source: DANK
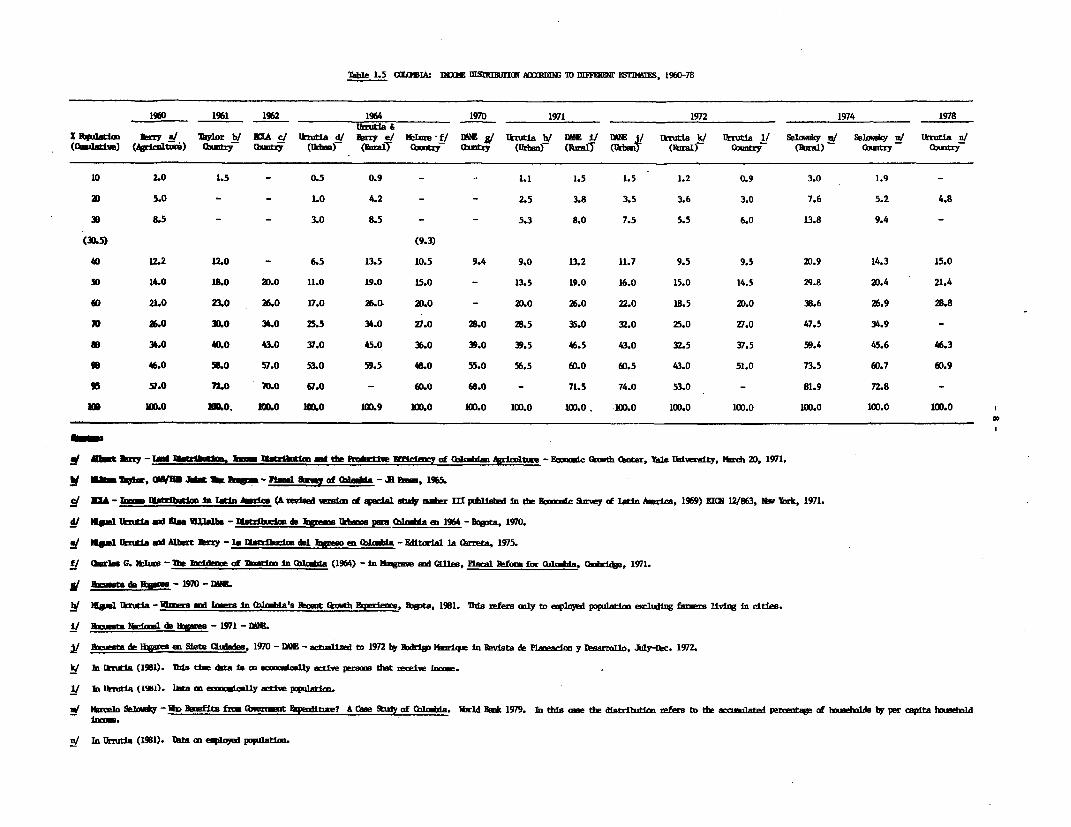
W1e 1.5 sL%IAI DUJ iSnlIj AD IW, D MLFur lMTD4 , 1960-78
1960 1961 1962 1964 1970 1971 1972 1974 1978
!krutia &z lkpqlat/a bRry A/ MIhYI W WA c/ Iruta d/ Bz e/ Itlure -f/ WE E Urrutia h/ ME i/ ME i/ urti k/ lTrutia 1/ l amky / Selam i' Uritia n/
(QAitiwe) (frnlturi) 0miy OIt (4Hir (Aialy Qbtxf (btty (Uba.nr (17 (J (lAzra1) (mtrf (1,ra1) 0buntrY cbt
10 2.0 1.5 - 0.5 0.9 - - 1.1 1.5 1.5 1.2 0.9 3.0 1.9 -
20 5.0 - - 1.0 4.2 - - 2.5 3.8 3.5 3.6 3.0 7.6 5.2 4.8
31 8.5 - - 3.0 8.5 - - 5.3 8.0 7.5 5.5 6.0 13.8 9.4 -
(30.5) (9.3)
40 12.2 12.0 - 6.5 13.5 10.5 9.4 9.0 13.2 11.7 9.5 9.5 20.9 14.3 15.0
5D 14.0 18.0 20.0 11.0 19.0 15.0 - 13.5 19.0 16.0 15.0 14.5 29.8 20.4 21.4
60 21.0 23.0 26.0 17.0 26.0. 20.0 - 20.0 26.0 22.0 18.5 20.0 38.6 26.9 28.8
M0 26.0 3D0. 34.0 25.5 34.0 27.0 28.0 28.5 35.0 32.0 25.0 27.0 47.5 34.9 -
SD 34.0 40.0 43.0 37.0 45.0 36.0 39.0 39.5 46.5 43.0 32.5 37.5 59.4 45.6 46.3
go 46.0 3.0 57.0 53.0 59.5 48.0 55.0 56.5 60.0 60.5 43.0 51.0 73.5 60.7 60.9
95 D.0 n.o 70.0 67.0 - 60.0 68.0 - 7L.5 74.0 53.0 - 81.9 72.8 -
M m o uo. M.o io M9 io no.o 10D.o 10D.0. 1OD.O 1OD.O 10.0 100.0 100.0 100.0
a/ mbt by - Uastrawfus, 1 Slz1bia1 dte ft1arime Efkmy of Qizmldm 4gicltue - Ewodc Irth Yale , UaI versity, Yarch 20, 1971.
EiltP %*%mr. MU5 l M sl au-y of 0ala - JI R, 1965.
C/ _A - 1DlEatrluma to latn hCa (A rewlaed wimi of qpedal a* maurm Mpuhad in tim FCxalc &Urey of lAtin Amria, 1969) EIW 12863, wb York, 1971.
d/ gal Uknfal i 10am UI1lal -Matribacia. de l'ram 1kn paIn klsad em 1964 - Boqota. 1970.
*/ &mgi Utia ald Albert Bnry - I& slahc.n del h.l I en th (efda - Edtoal la Carreta, 1975.
f/ nwl-r- G. ItIMz - 1la T4 of Thtim In CbIA (1964) -In ligm e 'at Qlil, Fiscnl 1efoja for (1ikxlda, CmkdKse, 1971.
j/ c de Bo - 70 - ME.
b/ M4el Ikrutia - wimes id lneis In (blsa's lomt Qawth , rieae R*Dta, 1981. Ihts refers oaly to employed popilatio ewlug Fa living In cities.
I1 Bmta liai b de mores - 1971 - DM.
a nim. de Rogars en Siete Cludes, 1970 - DOE - actaUmdi to 1972 by Rxdrtg Iinlrq In Bevsta d Pan n y Daarrollo, Jdlyr-Dc. 1972.
k/ hi Ikia (1981). as tur data Is m efraII.y artive perm dint receive .
I/ Jn lUr uti (ls81). Dia m ec ly actsi patim.
W/ lrelo S*Ioaly - liD DBnfits frI CMzt IOOditb"? A Can S9ty of (bkataa. ibrld E1* 1979. Tn thig cae the distdibun refers to the aroalated percentq of hameholds by per capita lrainld
n/ in Urnmtia (1981). Data am eplaped popdatia.

Tahle 2.1 aDJJMIA: GROSS DOfWSrIC PRUDUCT AT FACTUR C06T BY SECTOR AT CURRENT PRICES, 1960-82(millIons of ColombLan Pesos)
Pew- 1 of 2
1960 1961 1962 1963 1964 1965 1966 1967 1968 1969
Grcss DIeestic Product at F.C. 25.073.3 28.674.3 32,450.5 41,294.1 50,457.2 56,893.4 67.892.4 76,940.5 88,763.5 101,736.2
Agricu1ture/ i8,553.0 9,525.8 10,149.6 12,506.4 16,623.8 17,675.7 20,742.9 23,269.4 26,875.2 30,208.6
KtnLig 985.6 995.3 991.9 1,229.0 1,394.7 1,551.8 1,468.3 1,566.6 2,149.3 2,514.0
4,335.3 4,962.6 5,933.8 7,986.9 9,015.3 10,386.3 12,357.8 13,272.3 14,917.1 17,208.1
Oetruction 909.4 1,139.9 1,416.8 1,607.7 1,826.7 2,080.7 2,832.6 3,792.7 4,565.3 5,427.7
Electricity, Gm and IWter 227.2 247.3 357.9 463.7 566.9 740.2 871.0 1,159.5 1,325.5 1,515.0
T nscctattin and CesMiniMtiMn 1647.B 1869.0 2;333.6 3L0f1 n a,lI l _iQ3 R A, 4,L77 ? 5,04 7 6,0!33 7 7a. 27
Trm f 3,929.9 4,431.7 5,051.9 6,442.6 8,02B.0 9,735.7 11,725.3 13,372.4 15,259.4 17,172.4
Publc Admhnistration & Defense ci 1,373.8 1,718.4 1,992.4 2,689.9 3,025.9 3,394.5 4,298.6 4,892.8 5,542.7 6,631.9
Otber brancdu d/ 3,111.3 3,784.3 4,222.6 5,336.9 6,585.8 7,731.7 9,138.2 10,565.1 12,115.7 13,747.8
a/ Includes fishidg, hltirg and forestry.I CoEposed of comerce, bmdkfng, finance and insurance.
dCoosed of hute rentals aid personal services.
Sore: Banco de la Republica

Tale 2.1 MMA !XIESMC IECr AT FACR ST BY IR Ar aaW FRUES, 19S0-82(aillions of Coklldia Neso.)
1bF 2 of 2
akenialy ateUlinmy Mdmo* As BEnt of Total1970 1971 1972 1973 1974 1975 1976 1977 1978 1979 1980 1981 1W 1970 1982
&Os 1mstic Product at F.C. 119,796.9 140,531.8 172,231.8 226,384.5 307,797.1 386,371.6 494,272.1 662,613.6 841,155.7 1,032,638.9 1,425,078.4 1,796,575.4 2,241,601 100.0 100.0
Igriaibe i/ 34,244.8 38,828.1 49,221.3 66,644.2 88,171.6 113,340.0 148,040.5 211,950.5 255,682.0 310,571.7 392,954.0 483,339.6 591,782 28.6 26.4
NInIDg 2,528.0 2,968.9 2,953.6 3,438.0 4,124.8 4,980.5 5,985.5 7,576.8 11,179.2 14,846.4 27,974.9 32,215.1 44,832 2.1 2.0
IMnfacturirt 20,976.7 25,589.5 31,746.9 44,127.0 63,722.8 79,700.6 104,653.2 132,855.5 174,077.3 238,237.3 310,047.9 384,925.1 479,702 17.5 21.4
xstau atia 6,530.0 8,039.9 8,923.3 12,207.9 17,0B6.4 19,728.7 20,446.4 27,655.6 37,974.2 52,061.3 75,001.2 103,681.0 130,013 5.5 5.8
Electricity, Gas ad Miter 1,789.9 2,204.4 2,733.9 3,317.1 3,887.5 4,849.0 6,771.3 8,839.7 11,434.9 16,083.3 24,443.3 35,413.1 49,315 1.5 2.2
Trauportation and Camication 8,881.1 10,336.3 11,666.9 13,883.1 20,551.9 23,987.4 32,472.8 45,072.8 57,471.3 79,759.4 108,423.9 133,269.6 170,362 7.4 7.6
Trade b/ 20,760.2 23,513.6 29,683.8 39,218.0 55,786.2 69,619.7 88,156.4 117,509.6 149,940.9 181,805.0 233,202.2 293,299.4 363,139 17.3 16.2
Public Aufnistration & IDfense c/ 8,283.5 10,225.3 12,714.3 16,454.9 20,849.4 26,758.0 32,457.8 40,102.9 54.061.4 74,461.8 100,558,8 131,226.5 163,637 6.9 7.3
Other bran1bs d/ 15,804.7 18,825.8 22,587.8 27,094.3 33,616.5 43,407.7 55,288.2 71,050.2 89,334.5 114,812.7 152,472.2 199,206.0 248,818 13.2 11.1
a/ T1m firg, buting and fotry.b/ (essd of oace, bning, fima and inm,a.c/ BwqllE G noertit ierv1cs.
(Osai of hun reotal and personal erA..
Source: u de! la epublica

Table 2.2 COLCMIA: GE3SS DCWSTIC PRODUCT AT FAlal OCT BY SECT'R AT ONSTANT PRICES, 1960-82(mdlliom, of- 1970 0nln.,4i,Pn Pes
Page 1 of 2
1960 1961 1962 1963 1964 1965 1966 1967 1968 1969
Gross Dbee tic Product at F.C. 71,902.4 75,748.0 79.89.2 82,367.8 87,263.2 90,351.4 95,332.2 99,648.3 105,838.5 112,424.1
Agriculture 24,305.2 25,337.3 26,193.2 26,326.6 27,823.7 27,833.6 28,762.0 30,249.9 32,332.6 33,430.6
Minlig 1,862.0 1,741.1 1,733.8 1,951.0 2,109.0 2,267.2 2,180.9 2,209.0 2,133.5 2,518.4
kArifacurig 11,698.1 12,397.5 13,249.8 13,878.7 14,699.2 15,388.5 16,411.2 17,000.1 18,051.1 19,367.8
(k,NUytt.4t,n 3,114.6 3,537.5 3,786.1 3,439.8 3,444.7 3,526.3 4,148.6 5,010.1 5,521.7 6,048.1
K1strt4ty, 64 _ btAr 767.2 781.5 949.6 1,024.7 1,066.4 1,163.7 1,234.4 1,398.5 1,495.9 1,625.0
lbwrpoa utat ad Csv.castian 4,767.7 5,133.1 5,532.3 5,811.7 6,166.8 6,488.2 6,935.1 7,028.6 7,448.2 8,075.6
hbl k 11,279.8 11,944.0 12,782.8 13,196.6 14,372.7 15,047.0 16,106.8 16,363.7 17,487.5 18,786.5
%bUeII "UftaItem &on Odom 4,852.7 5,2D5.2 5,519.6 5,961.7 6,185.2 6,523.4 6,789.6 6,971.7 7,2D6.5 7,563.9
Other UtersceAs( 9,255.1 9,670.8 10,149.0 10,777.0 11,395.5 12,113.5 12,763.6 13,416.7 14,161.5 15,008.2
a/ Inchuxe fishitg, hantiWg and forestry.b/ Coo d of erce, bwkxidg, finae and injrance.c/ Equals Gavenri servioes.d/ osed of bIuse rentals and personal services.
Source: Baro de la Repiblca

Tabe 2.2 ILI& SS Gm D TIC FrH = Ar FA= C6Sr BY s1 AT Xrr aICES 1960-82
(mfl3ios of 1970 Coai,an Pews)PaW 2 of 2
fteliinar avIlinny Fatlimte GeS mur kwth Itate
1970 1971 1972 1973 1974 1975 1976 1977 1978 1979 1980 1981 1982 1970-60 1981-62
Gruss Dbtic PtodL at P.C. 119,796.9 126,721.8 136,743.5 147,178.0 156,707.5 163,399.2 170,226.5 178,325.7 194,817.6 203,664.3 211,929.9 217,22B.2 220.296.8 6.0 1.4
Agdri LVe 34,244.8 34,8B7.6 37,784.8 39,157.4 41,516.9 44,066.4 44,905.0 46,096.5 50,575.0 52,617.5 53,953.8 55,680.3 55,234.9 5.0 -0.8
Mdnrg 2,528.0 2,550.8 2,379.9 2,591.7 2,403.8 2,240.7 2,145.9 2,063.8 2,154.4 2,131.2 2,438.2 2,523.5 2,712.8 -2.0 7.5
l bza±uIxg 20,976.7 22,778.B 24,933.4 27,828.2 29,657.2 30,030.7 32,037.7 33,3K6.8 36,2a9.2 37,891.0 38,372.5 37,988.8 37,625.5 6.0 -1.0
abutrutm 6,530.0 6,859.6 6,993.9 7,839.2 8,142.4 7,795.9 6,686.2 7,067.0 7,334.9 7,235.3 7,936.2 8,706.0 9,054.0 1.0 4.0
Elctidity, G and Water 1,787.9 1,960.0 2,226.7 2,473.3 2,615.1 2,753.4 3,067.7 3,138.4 3,391.0 3,742.1 4,031.4 4,140.3 4,409.4 8.0 6.5
Trmmupuata md Cinmicati 8,P81.1 9,537.9 10,377.2 11,367.5 12,946.5 14,085.3 15,076.1 16,232.7 18,041.6 19,333.2 20,524.2 20,996.0 22,381.7 9.0 6.6
T-e b/ 20,760.2 22,430.9 24,220.6 26,227.4 28,231.8 29,497.8 31,698.2 33,724.4 37,795.1 36,799.7 40,335.6 40,835.8 40,590.8 7.0 -0.6
ftlikc hiiLtratim 6 Ibfene c/ 8,283.5 8,859.3 9,757.0 10,529.7 10,775.1 11,189.1 11,370.6 11.786.3 12,678.0 13,567.2 14,515.9 14,979.5 15,690.4 5.0 4.7
Othr d/ 15,8D4.7 16,856.9 18,070.0 19,163.6 20,418.7 21,749.9 23,239.1 24,829.8 26,558.4 28,347.1 29,822.1 31,378.0 32,597.3 6.0 3.9
a/ 1 i fliah , hmtlg and foretry.bi clbowd of oee, bmk, fine -id .
c/ Fqmsa Ger t auvieB .dl Qoa osm of ham restal ax paca3al eviesa.
Source: w de la opubUra

Table 2.3 OOLXMBIA: GROSS DCOESrIC PIoDUCr BY TYPE OF EXPENDITURE AT aJRRENT MARKET PRICES, 1960-82(millions of Colombian Pesos)
Page I of 2
1960 1961 1962 1963 1964 1965 1966 1967 1968 1969
Gross Domestic Product at m.p. 26,746.7 30,421.0 34,199.2 43,525.5 53,760.3 60,797.6 73,612.3 83,082.7 96,421.7 110,953.3
Grass Domestic Consunpttion 21,248.6 e 24,600.5 27,955.7 36,173.8 44,951.2 49,436.4 60,753.0 67,312.8 77,275.4 89,510.2
Private Consumptian (19,589.3) (22,584.5) (25,699.7) (33,024.8) (41,467.6) (45,482.1) (55,842.6) (61,596.0) (70,695.6) (81,677.4)
Government Conamption (1,659.3) (2,016.0) (2,356.0) (3,149.0) (3,483.6) (3,954.3) (4,910.4) (5,716.8) (6,579.8) (7,832.8)
Gross 1bmtic Investment 5,494.8 6,335.0 6,404.7 7,844.5 9,602.0 10,742.2 15,040.4 15,341.0 20,406.2 22,715.2
Gross Fixed Investment (4,844.9) (5,580.3) (6,136.9) (7,167.5) (8,653.8) (9,504.2) (12,303.6) (14,729.1) (18,815.1) (21,230.1) o
Change in Stocks (649.9) (754.7) (267.8) (677.0) (948.2) (1,238.0) (2.736.8) (611.9) (1.591.1) (1.485.1)
Exports of Goods & NFS 4,163.9 3,920.2 4,146.6 5,173.5 6,376.5 6,943.5 8,916.5 9,950.3 12,519.6 14,675.1
Inports of Goads & NFS 4,160.6 4,434.7 4,407.8 5,666.3 7,169.4 6,324.5 11,097.6 9,521.4 13,779.5 15,947.2
Net Factor Income from Abroad -302.3 -394.6 -499.9 -811.4 -797.4 -897.6 -1,242.9 -1,470.7 -2,003.2 -2,676.5
Gross National Product at m.p. 26,444.4 30,026.4 33,699.3 42,714.1 52,962.9 59,900.0 72,369.4 81,612.0 94,418.5 108,276.8
NtPe- Fr a nrts od nf (o saL NFq NnS asd N.et Factor T,cc-.,aore bRJ_,,, of T.o-n-t-8 f4,-,,,To rt-A tef '^- - - in ti2conversion is an anrual average of the implicit rates of daily customs declarations provided by Banco de la Republica. The private consumption item is a residualin the account. Gross National Product is derived as the difference between GDP and Net Factor Income from Abroad.
Sarwee: Banco de la Republica

TabJe 2.3 ODMUIA. MM i lc 1WFlUY ! TEE OF 1 lME1 Al a'r Km FRIM, 1960-82(illi of CoL'Inn Peos)
Page 2 of 2
1970 1971 1972 1973 1974 1975 1976 1977 1978 1979 1980 1981 1982
(}ass mestic Product at m p. 130,361.0 152,262.8 186,092.3 243,235.9 329,155.4 412,828.7 534,015.3 718,474.5 916,559.7 1,195,379.5 1,595,154.6 2,033,892.1 2,542,867.1
Gkee lstic Cmsption 104,446.0 123,770.6 149,497.9 199,580.8 260,330.8 335,234.1 406,370.5 524,955.1 684,943.3 897,677.5 1,190,943.9 1,563,409.4 1,989,360.0
Private (humption (94,484.0) (110,342.0) (134,848.7) (180,566.5) (237,172.5) (304,809.2) (367,640.1) (476,801.2) (619,219.0) (806,556.5) (1,058,439.6) 1,386,219.5) (1,760,642.3)
Q rment (mwtion (9,962.0) (13,428.6) (14,649.2) (19,014.3) (23,158.3) (30,424.9) (38,730.4) (48,153.9) (65,724.3) (91,120.0) (132,504.3) (177,189.9) (228,717.7)
Gmnes IDmestic Iovestaent 28,660.0 34,5B5.2 37,739.3 40,764.6 74,279.5 73,599.9 111,353.4 169,139.6 208,942.4 269,192.0 401,336.1 552,914.1 655,330.0
QGres FPi>d nwesbet (26,441.0) (31,603.7) (34,520.4) (42,534.6) (63,860.3) (77,572.1) (97,081.3) (134,784.0) (187,721.1) (243,041.3) (347,640.9) (441,805.5) (552,688.0)
Qwge in Stocks (2,219.0) (2,9B1.5) (3,218.9) (-1,770.0) (10,419.2) (-3,972.2) (14,272.1) (34,355.6) (21,221.3) (26,150.7) (53,695.2) (111,108.6) (102,642.0)
Faports of Goods & NkS 18,420.0 19,080.0 25,217.1 36,063.9 47,360.4 64,062.4 94,416.3 123,259.4 151,122.0 190,909.0 250,330.6 228,512.2 269,931.5
Thports of Goods & NWS 21,165.0 25,173.0 26,362.0 33,193.4 52,815.3 60,067.7 78,124.9 98,879.6 128,448.0 162,390.0 247,456.0 310,943.6 371,754.4
Nat Factor Incoe from Abroad -3,316.0 -3,448.0 -4,239.4 -5,012.0 -4,894.1 -7,782.2 -10,535.6 -9,737.6 -11,375.0 -10,582.0 -10,055.0 -23,322.0 -44,935.5
(koss National lProduct at m.p. 127,045.0 148,814.8 181,852.9 238,2Z3.9 324,261.3 405,046.5 523,479.7 708,736.9 905,184.7 1,184,797.5 1,585,099.6 2,010,570.1 2,497,931.6
Note: lizports ad 1_ports of Goods ard NFS and Nat Factor Incom arm Inlano of payments figures overted to Colo3bian opsos by IBKD staff. he exchange rate used in the monversion is n anal average
of the inplicit rates of daily customs declarations provided 1b Baoo de is Republica. The private consunption item is a residual in the accoLmt. Gross Natiolal Product is derived as the
ditterence betien Ga and Nit Factor Incxee from Abmad.
Source: Banc de la Republica

Table 2.4 uOlMIA: (IDSS DCxSrIC PODIIUT BY TYEE OF ENDMRE Af nOtSM WiMT PRICZS, 1960-82(millious of 1970 Colombian Pesos)
Fge 1 of 2
1960 1961 1962 1963 1964 1965 1966 1967 1968 1969
Gross Domestic Product at m.p. 78,085.8 82,193.7 86,685.9 89,206.5 95,095.2 97,797.7 103,348.8 107,628.2 114,558.8 121,775.3
Gross Daestic Consumption 58,626.6 62,371.8 67,529.7 70,973.6 76,877.7 76,475.7 83,181.8 84,592.4 89,488.4 96,536.2
Private Consunption (53,155.2) (56,599.9) (61,275.8) (64,359.5) (70,174.6) (69,349.4) (75,737.3) (76,759.9) (81,384.7) (87,831.8)
Covernint Consumption (5,471.4) (5,771-9) (6,253.9) (6,614.1) (6,703.1) (7,126.3) (7,444.5) (7,832.5) (8,103.7) (8,704.4)
Gross Domestic Investment 17,375.1 19,127.5 17,850.2 17,238.9 19,514.0 18,886.1 22,157.8 20,100.2 24,147.0 24,514.9 2
LA
Gross Fixed Investment (15,809.1) (17,152.6) (17,217.3) (15,840.5) (17,824.2) (16,831.6) (18,181.4) (19,386.5) (22,290.5) (22,847.2)
Change in Stokss (1,566.0) (1,974.9) (632.9) (1,398.4) (1,689.8) (2,054.5) (3,976.4) (713-7) (1,856.5) (1,667.7)
Lui luu &i tWD i ; ,63o.9, ,729.3 ;3,76u.4 i0,4 34S2.J i'34,2Lu.2 1.,13io.S i4,878.S 16,179.0 17/,3z2.5 i8,351.1
Iinxorts of Goods & NPS 11,554.8 12,034.9 12,454.4 12,434.3 15,506.7 12,702.9 16,868.9 13,243.4 16,604.1 17,626.9
Net Factor Iixxme fran Abroad -82.6 -1,290.5 -1,267.2 -1,662.9 -1,410.4 -1,443.9 -1,744.9 -1,905.2 -2,380.0 -2,937.5
Gross National Product at m.p. 77,203.2 80,903.2 85,418.7 87,543.6 93,684.8 96,353.8 101,603.9 105,723.0 112,178.8 118,837.8
Note: Taports aid imports cf Goods and NPS ard Net Factor Incaae are balance of payments figures deflatei by IBD staff usirg price irdices based ondoblar value ard voline of exports aid ijports and the International Price Index (IPI). Private cotamption is a residual item in the account.
Gross Natlonal Produ t = Gross Dmaestic Product + Net Factor Incae fran abroad
Source: Banco de la Reublica

Thle 2.4 COUIIA: GOC6SS 0)E;C PRU= BY TYPE OF EPENDIURE AT CON5TANr MAR7 ERICES, 1960-82(millns of 1970 (olomblan Pesos)
Papg 2 of 2
Pre Prlidxwy Estinate at 8quare (th Rate1970 1971 1972 1973 1974 1975 1976 1977 1978 1979 1980 1981 1982 1970-60 1981-82
Gross Domestic ProcdLet at m.p. 130,361.4 137,889.0 148,629.5 159,194.7 168,786.9 175,225.9 183,296.1 192,187.0 209,368.5 220,091.2 229,271.1 235,006.9 238,297.0 5.8 1.4
(ksa Ieatin powtion 104,445.1 111,387.7 118,907.2 131,916.6 138,381.5 143,015.0 147,477.3 154,805.8 168,563.5 176,233.5 184,126.0 189,568.4 192,599.8 5.7 1.6
Private Qiqptim (94,483.5) (99,581.5) (107,574.5) (119,685.2) (126,395.6) (130,296.5) (133,972.6) (140,819.2) (153,218.5) (159,731.5) (165,899.3) (170,046.8) (172,375.4) 5.8 1.4
CQernmnt Chiaptifr (9,961.6) (11,806.2) (11,332.7) (12,231.4) (11,985.9) (12,718.5) (13,504.7) (13,986.6) (15,345.0) (16,502.0) (18,226.7) (19,521.6) (20,224.4) 5.1 3.6
Gcoss Dlstic lnwesenet 28,660.3 30,767.3 30,193.3 26,836.6 35,651.6 29,460.9 36,856.8 42,020.2 42,647.0 43,813.7 52,625.5 59,408.3 57,585.7 6.0 -3.1
Gross Filed Inbestnt (26,440.8) (28,066.6) (27,786.2) (29,151.6) (31,700.0) (31,843.7) (32,801.6) (34,487.1) (38,736.8) (39,719.3) (45,293.8) (46,704.8) (47,638.9) 5.1 2.0
wauge in Stocks (2,219.5) (2,700.7) (2,407.1) (-2,315.0) (3,951.6) (-2,382.8) (4,055.2) (7,533.1) (3,910.2) (4,094.4) (7,331.7) (12,703.5) (9,946.8) - -21.7
Exports of Goods and N.F.S. 18,420.0 18,826.0 19,588.0 20,208.0 18,971.0 24,617.0 22,582.0 21,586.0 28,115.0 31,382.0 32,360.3 27,464.1 25,816.3 5.7 -6.0
luports of Goods and N.F.S. 21,164.0 23,092.0 20,059.0 19,766.5 24,217.2 21,867.0 23,620.0 26,225.0 29,957.0 31,338.0 39,840.7 41,433.9 37,704.8 5.7 -9.0
Net Factor Il,e frus abroad -3,315.6 -2,996.2 -3,029.0 -2,787.0 -2,007.2 -2,403.0 -2,811.1 -2,250.0 -2,104.1 -1,555.3 -1,619.0 -3,101.0 -4,349.1 -7.0 -127.7
Gross National Product at m.p. 127,045.8 134,892.8 145,600.5 156,407.7 166,779.7 172,822.9 180,485.0 189,937.0 207,264.4 218,535.9 227,652.1 231,905.9 233,947.9 6.0 0.8
83te: Exports and iuports of Caods and BPS aid 1et Factor L we are lelance of payments figures deflated lby IBRD staff using price indices besed ondollar valu ard volume of exports and imports and the Interrational Price ldoex (II). Private coxuiuuptimn is a residual item In the accmot.
Goos National Product - Gross Domestic Product + Net Factor Income f ro abroad
Source: Banco de la PepAhUica
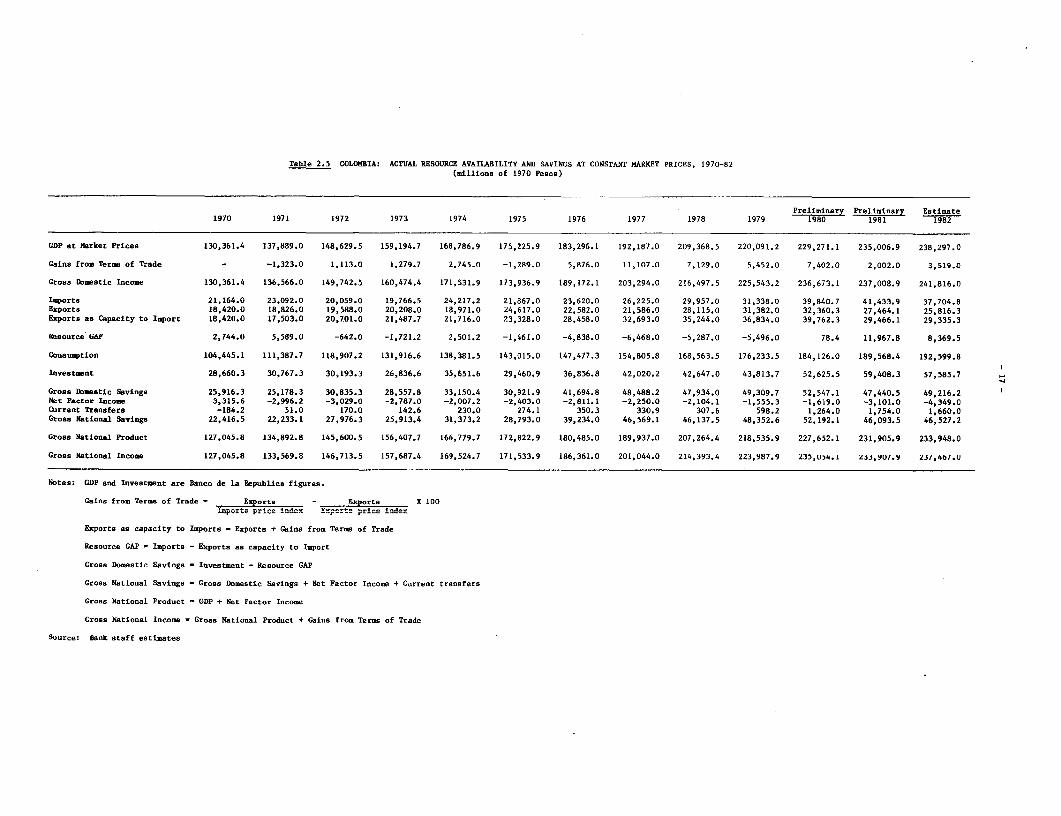
Table 2.5 COLOMBIA: ACTUAL RESOURCE AVAILABILITY AND SAVINGS AT CONSTANT MARKET PRICES, 1970-82(millions of 1970 Pesos)
Preliminary Preliminary Estimate1970 1971 1972 1973 1974 1975 1976 1977 1978 1979 1980 1981 1982
GDP at Market Prices 130,361.4 137,889.0 148,629.5 159,194.7 168,786.9 175,225.9 183,296.1 192,187.0 209,368.5 220,091.2 229,271.1 235,006.9 238,297.0
Gains from Terms of Trade - -1.323.0 1,113.0 1,279.7 2,745.0 -1,289.0 5,876.0 11,107.0 7,129.0 5,452.0 7,402.0 2,002.0 3,519.0
Gross Domestic Income 130,361.4 136,566.0 149,742.5 160,474.4 171,531.9 173,936.9 189,172.1 203,294.0 216,497.5 225,543.2 236,673.1 237,008.9 241,816.0
Imports 21,164.0 23,092.0 20,059.0 19,766.5 24,217.2 21,867.0 23,620.0 26,225.0 29,957.0 31,338.0 39,840.7 41,433.9 37,704.8Exports 18,420.0 18,826.0 19,588.0 20,208.0 18,971.0 24,617.0 22,582.0 21,586.0 28,115.0 31,382.0 32,360.3 27,464.1 25,816.3Exports as Capacity to Import 18,420.0 17,503.0 20,701.0 21,487.7 21,716.0 23,328.0 28,458.0 32,693.0 35,244.0 36,834.0 39,762.3 29,466.1 29,335.3
Resource GAP 2,744.0 5,589.0 -642.0 -1,721.2 2,501.2 -1,461.0 -4,838.0 -6,468.0 -5,287.0 -5,496.0 78.4 11,967.8 8,369.5
Consumption 104,445.1 111,387.7 118,907.2 131,916.6 138,381.5 143,015.0 147,477.3 154,805.8 168,563.5 176,233.5 184,126.0 189,568.4 192,599.8
Investment 28,660.3 30,767.3 30,193.3 26,836.6 35,651.6 29,460.9 36,856.8 42,020.2 42,647.0 43,813.7 52,625.5 59,408.3 57,585.7
Gross Domestic Savings 25,916.3 25,178.3 30,835.3 28,557.8 33,150.4 30,921.9 41,694.8 48,488.2 47,934.0 49,309.7 52,547.1 47,440.5 49,216.2Net Factor Income -3,315.6 -2,996.2 -3,029.0 -2,787.0 -2,007.2 -2,403.0 -2,811.1 -2,250.0 -2,104.1 -1,555.3 -1,619.0 -3,101.0 -4,349,0Current Transfers -184.2 51.0 170.0 142.6 230.0 274.1 350.3 330.9 307.6 598.2 1,264.0 1,754.0 1,660.0Gross National Savings 22,416.5 22,233.1 27,976.3 25,913.4 31,373.2 28,793.0 39,234.0 46,569.1 46,137.5 48,352.6 52,192.1 46,093.5 46,527.2
Gross National Product 127,045.8 134,892.8 145,600.5 156,407.7 166,779.7 172,822.9 180,485.0 189,937.0 207,264.4 218,535.9 227,652.1 231,905.9 233,948.0
Gross National Income 127,045.8 133,569.8 146,713.5 157,687.4 169,524.7 171,533.9 186,361.0 201,044.0 214,393.4 223,987.9 235,U54.1 Zjj3qU1.y zJi,4ot.u
Notes: GDP and Investment are Banco de la Republics figures.
Gains from Term of Trade EaPort. - Exports X 1001-portz price '.-dex Experts price inldei
Exports as capacity to Imports - Exports + Gains from Terms of Trade
Resource GAP - Imports - Exports as capacity to Import
Gross Domestic Savings - Investment - Resource GAP
Gross National Savings - Gross Domestic Savings + Net Factor Income + Current transfers
Gross National Product - GDP + Net Factor Income
Gross National Income - Gross National Product + Gains from Termr of Trade
Source: Bank staff estimates
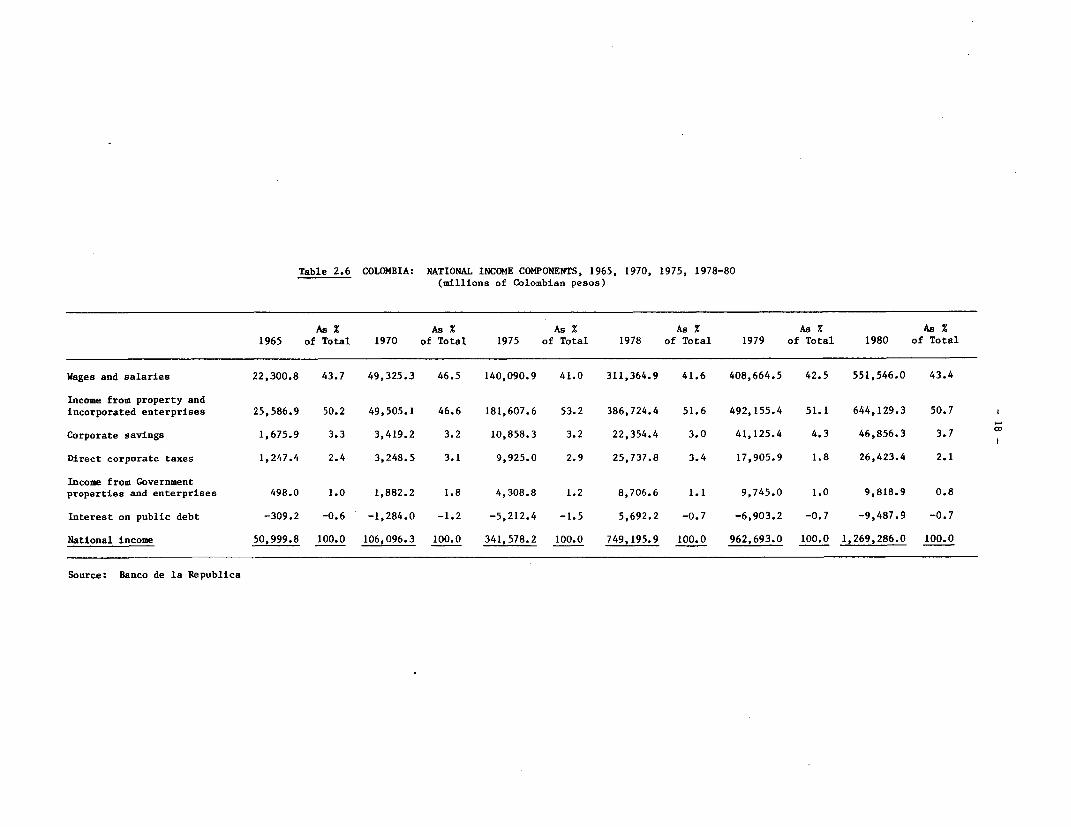
Table 2.6 COLOMBIA: NATIONAL INCOME COMPONENTS, 1965, 1970, 1975, 1978-80(millions of Colombian pesos)
As x As % As % As Z As X As %1965 of Total 1970 of Total 1975 of Total 1978 of Total 1979 of Total 1980 of Total
Wages and salaries 22,300.8 43.7 49,325.3 46.5 140,090.9 41.0 311,364.9 41.6 408,664.5 42.5 551,546.0 43.4
Income from property andincorporated enterprises 25,586.9 50.2 49,505.1 46.6 181,607.6 53.2 386,724.4 51.6 492,155.4 51.1 644,129.3 50.7
Corporate savings 1,675.9 3.3 3,419.2 3.2 10,858.3 3.2 22,354.4 3.0 41,125.4 4.3 46,856.3 3.7
Direct corporate taxes 1,247.4 2.4 3,248.5 3.1 9,925.0 2.9 25,737.8 3.4 17,905.9 1.8 26,423.4 2.1
Income from Governmentproperties and enterprises 498.0 1.0 1,882.2 1.8 4,308.8 1.2 8,706.6 1.1 9,745.0 1.0 9,818.9 0.8
Interest on public debt -309.2 -0.6 -1,284.0 -1.2 -5,212.4 -1.5 5,692.2 -0.7 -6,903.2 -0.7 -9,487.9 -0.7
National income 50,999.8 100.0 106,096.3 100.0 341,578.2 100.0 749,195.9 100.0 962,693.0 100.0 1,269,286.0 100.0
Source: Banco de la Republica

Table 2.7 C(ILUIA: DNESD4 AND 1S FANCING, 1960-80(millions of Coolobban Pesos)
Page 1 of 2
1960 1961 1962 1963 1964 1%5 1966 1967 1968 1969
Qross lxnestic Jwestxnt 5,494.8 6,335.0 6,404.7 7,844.5 9,602.0 10,742.2 15,040.4 15,341.0 20,406.2 22,715.2
Gross Fixed Investuent 4,844.9 5,580.3 6,136.9 7,167.5 8,653.8 9,504.2 12,303.6 14,729.1 18,815.1 21,230.1
Ciange in Stocks 649.9 754.7 267.8 677.0 948.2 1,238.0 2,736.8 611.9 1,591.1 1,485.1
Wpe of Capital Goods
Construction 2,697.1 3,272.1 3,841.9 4,421.1 5,247.8 5,976.8 7,468.5 9,738.3 11,723.9 13,873.2
Transportation Equipment 691.6 746.9 506.1 691.7 931.1 840.5 1,126.6 1,457.3 2,231.3 2,318.7
Machinery a"d Equipment 1,456.2 1,561.3 1,788.9 2,054.7 2,474.9 2,686.9 3,708.5 3,533.5 4,859.9 5,038.2
Sector of Iwestment
Private Sector 4,686.3 5,184.2 5,101.5 6,457.5 8,028.8 8,875.7 11,991.9 11,004.0 15,045.6 16,075.2
Public Sector 808.5 1,150.8 1,303.2 1,387.0 1,573.2 1,866.5 3,048.5 4,337.0 5,360.6 6,640.0
INVESiM FINAT1
Gmes Doestic Inestment 5,494.8 6,335.0 6,404.7 7,844.5 9,602.0 10,742.2 15,040.4 15,341.0 20,406.2 22,715.2
Gross National Saving 5,195.8 5,425.9 5,643.6 6,540.3 8,011.7 10,463.6 11,616.4 14,608.5 17,651.6 19,430.1
GEeral. C ernint Savings 1,248.3 1,042.7 622.6 618.2 1,946.0 2,202.8 3,446.9 4,311.1 5,609.5 7,904.4
Private Savings 3,947.5 4,383.2 5,021.0 5,922.1 6,065.7 8,260.8 8,169.5 10,297.4 12,042.1 11,525.7
GCrporate SavIngs 773.9 754.6 787.6 1,232.0 1,368.3 1,675.9 2,063.5 1,969.0 2,312.4 3,109.9
Pdrsonal Saving 506.7 824.8 1,100.6 609.3 393.2 1,588.9 -183.3 1,217.8 1,600.1 -597.2
Capital CoGmution Allances 2,666.9 2,803.8 3,132.8 4,080.8 4,304.2 4,996.0 6,289.3 7,110.6 8,129.6 9,013.0
Foreign Savings -299.0 -9.1 -761.1 -1,304.2 -1,590.3 -278.6 -3,424.0 -732.5 2,754.6 -3,285.1
Source: hBanc de la Republica

Table 2.7 CLHIAM flMUfB AND ITS FDqAIC, 1960-80(mllims of Colbomian Pesos)
Page 2 of 2
As percent ofGross Do1stic
Prelimft-y ivestment
1970 1971 1972 1973 1974 1975 1976 1977 1978 1979 1980 1979 1980
Gnss IDestic Investment 28,660.3 34,585.2 37,739.3 40,764.6 74,279.5 73,599.9 111,353.4 169,139.6 208,942.4 269,192.0 406,844.8 100.0 100.0
Grs Fixed nvest 26,440.8 31,603.7 34,520.4 42,534.6 63,860.3 77,572.1 97,081.3 134,784.0 187,721.1 243,041.3 356,151.6 90.3 87.5
QaFge in Stocks 2,219.5 2,981.5 3,218.9 -1,770.0 10,419.2 -3,972.2 14,272.1 34,355.6 21,221.3 26,150.7 50,693.2 9.7 12.5
I'pe of Cspital Goods
Construction 16,059.8 18,674.9 21,371.7 28,558.7 40,372.7 45,306.5 49,357.1 68,256.4 97,685.5 124,353.4 174,414.0 46.2 42.8
Transportation 8quipment 4,240.3 5,301.5 4,546.5 3,426.6 7,076.4 11,077.5 16,596.8 27,400.9 37,168.0 50,529.4 71,966.8 18.8 17.7
Machinery and Equipent 6,140.7 7,627.3 8,602.2 10,549.3 16,411.2 21,188.1 31,127.4 39,126.7 52,867.6 68,158.5 109,770.8 25.3 27.0
Sector of Investment °
Private Sector 20,928.2 25,462.9 27,104.9 27,464.4 56,461.4 50,339.0 88,257.5 140,847.6 171,533.3 217,250.2 329,767.8 80.7 81.1
Public Sector 7,732.1 9,122.3 10,634.4 13,300.2 17,818.1 23,260.9 23,095.9 28,292.0 37,409.1 51,941.8 77,077.0 19.3 18.9
IINENt FUIMI
Gross Dostic Investmint 28,660.3 34,585.2 37,739.3 40,764.6 74,279.5 73,599.9 111,353.4 169,139.6 208,942.4 269,192.0 406,844.8 100.0 100.0
Gross Natioaul Saving 23,430.9 25,769.5 32,895.1 39,564.2 64,769.0 69,167.3 112,440.5 186,871.3 226,072.6 292,498.5 397,478.9 108.7 97.7
GCeeral Gr nt Savings 7,660.8 7,730.3 8,695.1 9,082.7 14,263.9 16,099.7 30,593.4 37,389.5 64,836.4 64,233.9 93,184.2 23.9 22.9
Private Savirgs 15,770.1 18,039.2 24,200.0 30,481.5 50,505.1 53,067.6 81,847.1 149,481.8 161,236.2 228,264.6 304,294.7 84.8 74.8
Corporate Saving 3,419.2 5,186.9 4,750.9 6,104.4 7,956.3 10,858.3 13,062.5 20,208.5 22,354.4 41,125.4 46,856.3 15.3 11.5
Personal Savings 2,242.2 958.5 5,653.5 7,726.5 15,974.7 5,458.5 23,371.8 68,451.8 58,701.1 78,025.0 114,470.0 29.0 28.1
Capital C(siuaption Allowances 10,108.7 11,893.8 13,795.6 16,650.6 26,574.1 36,750.8 45,412.8 60,821.5 80,180.7 109,114.2 142,968.4 40.5 35.1
Foreign Saviw -5,229.4 -8,815.7 -4,844.2 -1,200.4 -9,154.1 -4,432.6 1,087.1 17,731.7 17,130.2 23,306.5 -9,365.9 8.7 -2.3
Source: Banon de la epublica

Table 2.8 COLOMBIA: SOURCES OF INVESTMENT FINANCING, 1967-80(ratios based on current market prices)
Total Sa-vin/ ar Perso.n.al Xvrina/ trnernreneat %ii4na/ Cr.ire-nt Acnount Business qavina/
Year GDP Investment Investment Deficit/Investment Investment
1967 .185 .079 .261 .068 .592
1968 .212 .078 .275 .135 .512
1969 .205 -.026 .348 .145 .534
1970 .220 .078 .267 .182 .472
1971 .227 .028 .224 .255 .494
1972 .203 .150 .230 .238 .491
1973 .168 .190 .223 .129 .558
1974 .226 .215 .192 .128 .465
197S -178- n074 219 .0iO .647
1976 .209 .210 .275 -.010 .525
1977 .235 .405 .221 -.105 .479
1978 .228 .281 .310 -.082 .491
1979 .225 .290 .239 -.087 .558
1980 .257 .281 .229 .023 .467
a/ Equals gross fixed investment plus changes in inventories at current prices.
Source: Banco de la Republica, mission estimates
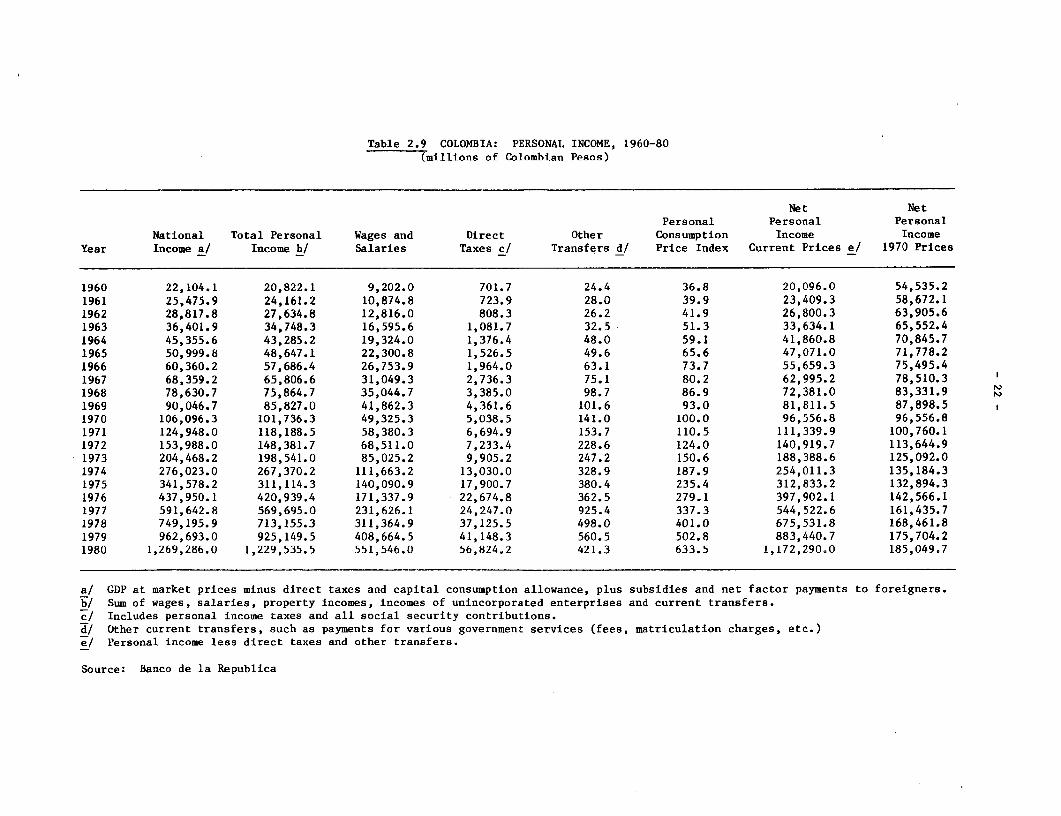
Table 2.9 COLOMBIA: PERSONAL INCOME, 1960-80(millions of Colombian Pesos)
Net NetPersonal Personal Personal
National Total Personal Wages and Direct Other Consumption Income IncomeYear Income a/ Income b/ Salaries Taxes c/ Transfers d/ Price Index Current Prices e/ 1970 Prices
1960 22,104.1 20,822.1 9,202.0 701.7 24.4 36.8 20,096.0 54,535.21961 25,475.9 24,161.2 10,874.8 723.9 28.0 39.9 23,409.3 58,672.11962 28,817.8 27,634.8 12,816.0 808.3 26.2 41.9 26,800.3 63,905.61963 36,401.9 34,748.3 16,595.6 1,081.7 32.5 51.3 33,634.1 65,552.41964 45,355.6 43,285.2 19,324.0 1,376.4 48.0 59.1 41,860.8 70,845.71965 50,999.8 48,647.1 22,300.8 1,526.5 49.6 65.6 47,071.0 71,778.21966 60,360.2 57,686.4 26,753.9 1,964.0 63.1 73.7 55,659.3 75,495.41967 68,359.2 65,806.6 31,049.3 2,736.3 75.1 80.2 62,995.2 78,510.31968 78,630.7 75,864.7 35,044.7 3,385.0 98.7 86.9 72,381.0 83,331.91969 90,046.7 85,827.0 41,862.3 4,361.6 101.6 93.0 81,811.5 87,898.51970 106,096.3 101,736.3 49,325.3 5,038.5 141.0 100.0 96,556.8 96,556.81971 124,948.0 118,188.5 58,380.3 6,694.9 153.7 110.5 111,339.9 100,760.11972 153,988.0 148,381.7 68,511.0 7,233.4 228.6 124.0 140,919.7 113,644.91973 204,468.2 198,541.0 85,025.2 9,905.2 247.2 150.6 188,388.6 125,092.01974 276,023.0 267,370.2 111,663.2 13,030.0 328.9 187.9 254,011.3 135,184.31975 341,578.2 311,114.3 140,090.9 17,900.7 380.4 235.4 312,833.2 132,894.31976 437,950.1 420,939.4 171,337.9 22,674.8 362.5 279.1 397,902.1 142,566.11977 591,642.8 569,695.0 231,626.1 24,247.0 925.4 337.3 544,522.6 161,435.71978 749,195.9 713,155.3 311,364.9 37,125.5 498.0 401.0 675,531.8 168,461.81979 962,693.0 925,149.5 408,664.5 41,148.3 560.5 502.8 883,440.7 175,704.21980 1,269,286.0 1,229,535.5 551,546.0 56,824.2 421.3 633.5 1,172,290.0 185,049.7
a/ GDP at market prices minus direct taxes and capital consumption allowance, plus subsidies and net factor payments to foreigners.b/ Sum of wages, salaries, property incomes, incomes of unincorporated enterprises and current transfers.c/ Includes personal income taxes and all social security contributions.d/ Other current transfers, such as payments for various government services (fees, matriculation charges, etc.)e/ Personal income less direct taxes and other transfers.
Source: Banco de la Republica

Table 2.10 COLOMBIA: SAVING BY BUSINESSES AND HOUSEHOLDS AND LIABILITIES OF FINANCIAL INTERMEDIARIES, 1967-82(billion pesos)
Change in Liabilities ofLiabilities of Financial
Business and Financial Intermediaries/Year Personal Saving Intermediaries (2)/(1) X 100 (1)/GDP X 100 GDP X 100
(1) (2) (3) (4) (5)
1967 10.3 2.5 24 12 15
1968 12.0 2.7 23 12 15
1969 11.3 3.9 35 10 16
1970 15.8 3.9 25 12 18
1971 18.0 4.5 25 12 18
1972 24.2 7.0 29 13 19
1973 30.5 14.1 46 13 201974 90A9 19oR 25 15 19
1975 53.1 22.0 41 13 20
1976 81.8 30.9 38 15 21
1977 149.5 34.6 23 21 21
1978 161.2 54.2 34 18 22
1979 228.3 48.1 21 19 21
1QRO 3n403 13200 43 19 24
1981 n.a. 175.9 n.a. n.a. 27
1982 n.a. 73.3 n.a. n.a. 25
Source: Column (1) Table 2.7; Column (4) Table 2.3; Column (2) and (5) Table 6.14; mission estimates

Table 2.11 COLOMBIA: IMPLICIT PRICE DEFLATORS FOR GROSS DOMESTIC PRODUCT, 1958-82(1970 = 100)
GovernmentCurrentPurchases Exports Imports
Total Gross of of ofGross Fixed Change Goods Goods GoodsDomestic Personal Domestic in and and NFS and NFS
Year Product Consumption Investment Inventories Services Services Services
1958 29.5 31.9 26.7 34.9 24.5 33.1 34.81959 31.4 33.9 29.1 35.1 27.6 29.9 34.71960 34.3 36.9 30.6 41.5 30.3 30.5 36.01961 37.0 39.9 32.5 38.2 34.9 30.8 36.81962 39.5 41.9 35.6 42.3 37.7 30.1 35.41963 48.8 51.3 45.2 48.4 47.6 38.5 45.61964 56.5 59.1 48.6 56.1 52.0 44.9 46.11965 62.2 65.6 56.5 60.3 55.5 45.9 49.81966 71.2 73.7 67.7 68.8 66.0 59.9 65.81967 77.2 80.2 76.0 85.7 73.0 61.5 71.91968 84.2 86.9 84.4 85.7 81.2 71.4 83.01969 91.1 93.0 92.9 89.0 89.6 80.0 90.51970 100.0 100.0 100.0 100.0 100.0 100.0 100.01971 110.4 110.5 112.6 110.4 113.7 101.7 107.91972 125.2 124.0 124.2 133.7 129.3 128.7 124.31973 152.8 150.6 145.9 76.5 155.5 179.1 166.71974 195.0 187.9 201.5 263.7 193.2 246.6 216.91975 235.6 235.4 243.6 166.7 239.2 252.5 275.11976 291.3 279.1 296.0 351.9 286.8 389.8 330.21977 373.8 337.3 390.8 456.1 344.3 577.9 375.91978 437.8 401.7 484.6 542.7 428.3 552.2 430.01979 543.1 504.1 611.9 638.7 552.2 608.3 518.21980 a/ 695.8 638.0 767.5 732.4 727.0 773.6 621.11981 b/ 865.5 815.2 946.0 874.6 907.7 832.0 750.51982 I 1,067.1 1,021.4 1,160.2 1,031.9 1,130.9 1,045.6 986.0
a/ Preliminary.b/ Estimate.
Note: Indices for personal consumption and external trade are IBRD staff estimates.
Source: Banco de la Republica
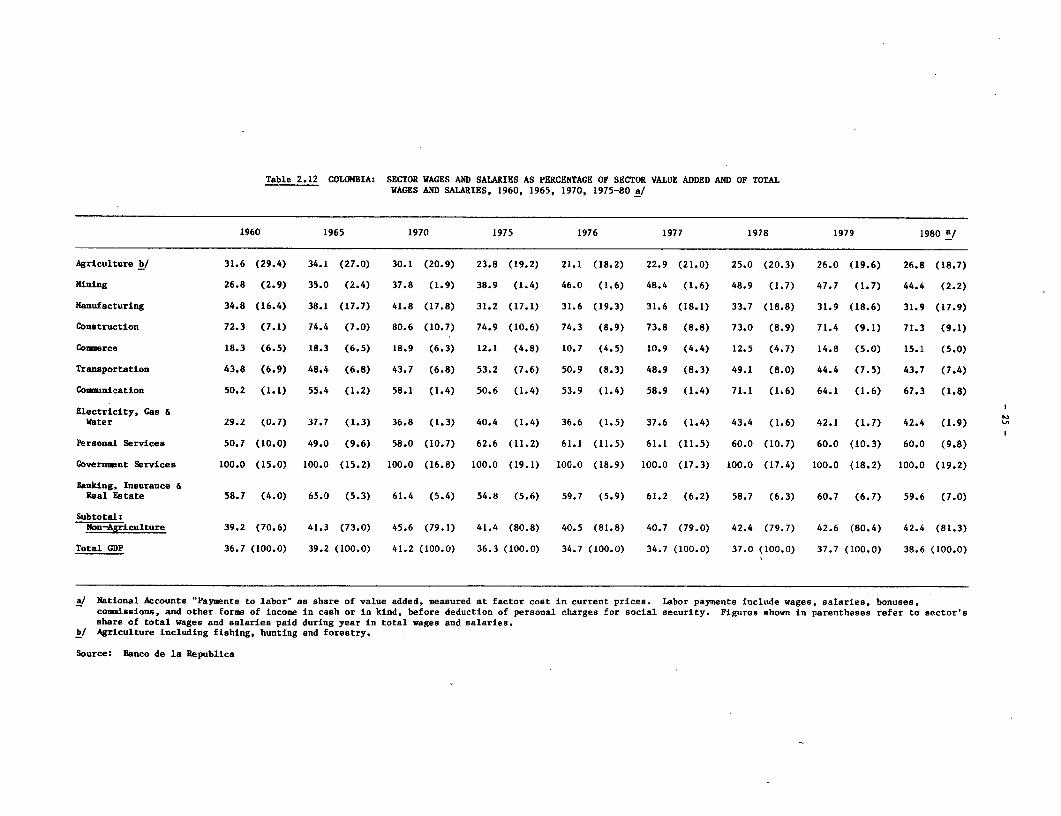
Table 2.12 COLOMBIA: SECTOR WAGES AND SALARIES AS PERCENTAGE OF SECTOR VALUE ADDED AND OF TOTALWAGES AND SALARIES, 1960, 1965, 1970, 1975-80 a/
1960 1965 1970 1975 1976 1977 1978 1979 1980 a/
Agriculture b/ 31.6 (29.4) 34.1 (27.0) 30.1 (20.9) 23.8 (19.2) 21.1 (18.2) 22.9 (21.0) 25.0 (20.3) 26.0 (19.6) 26.8 (18.7)
Mining 26.8 (2.9) 35.0 (2.4) 37.8 (1.9) 38.9 (1.4) 46.0 (1.6) 48.4 (1.6) 48.9 (1.7) 47.7 (1.7) 44.4 (2.2)
Manufacturing 34.8 (16.4) 38.1 (17.7) 41.8 (17.8) 31.2 (17.1) 31.6 (19.3) 31.6 (18.1) 33.7 (18.8) 31.9 (18.6) 31.9 (17.9)
Construction 72.3 (7.1) 74.4 (7.0) 80.6 (10.7) 74.9 (10.6) 74.3 (8.9) 73.8 (8.8) 73.0 (8.9) 71.4 (9.1) 71.3 (9.1)
Coemrce 18.3 (6.5) 18.3 (6.5) 18.9 (6.3) 12.1 (4.8) 10.7 (4.5) 10.9 (4.4) 12.5 (4.7) 14.8 (5.0) 15.1 (5.0)
Transportation 43.8 (6.9) 48.4 (6.8) 43.7 (6.8) 53.2 (7.6) 50.9 (8.3) 48.9 (8.3) 49.1 (8.0) 44.4 (7.5) 43.7 (7.4)
Coimmnication 50.2 (1.1) 55.4 (1.2) 58.1 (1.4) 50.6 (1.4) 53.9 (1.4) 58.9 (1.4) 71.1 (1X6) 64.1 (1.6) 67.3 (1.8)
Electricity, Gas &Water 29.2 (0.7) 37.7 (1.3) 36.8 (1.3) 40.4 (1.4) 36.6 (1.5) 37.6 (1.4) 43.4 (1.6) 42.1 (1.7) 42.4 (1.9)
Personal Services 50.7 (10.0) 49.0 (9.6) 58.0 (10.7) 62.6 (11.2) 61.1 (11.5) 61.1 (11.5) 60.0 (10.7) 60.0 (10.3) 60.0 (9.8)
Government Services 100.0 (15.0) 100.0 (15.2) 100.0 (16.8) 100.0 (19.1) 100.0 (18.9) 100.0 (17.3) 100.0 (17.4) 100.0 (18.2) 100.0 (19.2)
Banking, Insurance &Real Estate 58.7 (4.0) 65.0 (5.3) 61.4 (5.4) 54.8 (5.6) 59.7 (5.9) 61.2 (6.2) 58.7 (6.3) 60.7 (6.7) 59.6 (7.0)
Subtotal:Non-Agriculture 39.2 (70.6) 41.3 (73.0) 45.6 (79.1) 41.4 (80.8) 40.5 (81.8) 40.7 (79.0) 42.4 (79.7) 42.6 (80.4) 42.4 (81.3)
Total GDP 36.7 (100.0) 39.2 (100.0) 41.2 (100.0) 36.3 (100.0) 34.7 (100.0) 34.7 (100.0) 37.0 (100.0) 37.7 (100.0) 38.6 (100.0)
a/ National Accounts "Payments to labor' as share of value added, measured at factor cost in current prices. Labor payments include wages, salaries, bonuses,commissions, and other forms of income in cash or in kind, before deduction of personal charges for social security. Figures shown in parentheses refer to sector'sshare of total wages and salaries paid during year in total wages and salaries.
b/ Agriculture including fishing, hunting and forestry.
Source: Banco de la Republica
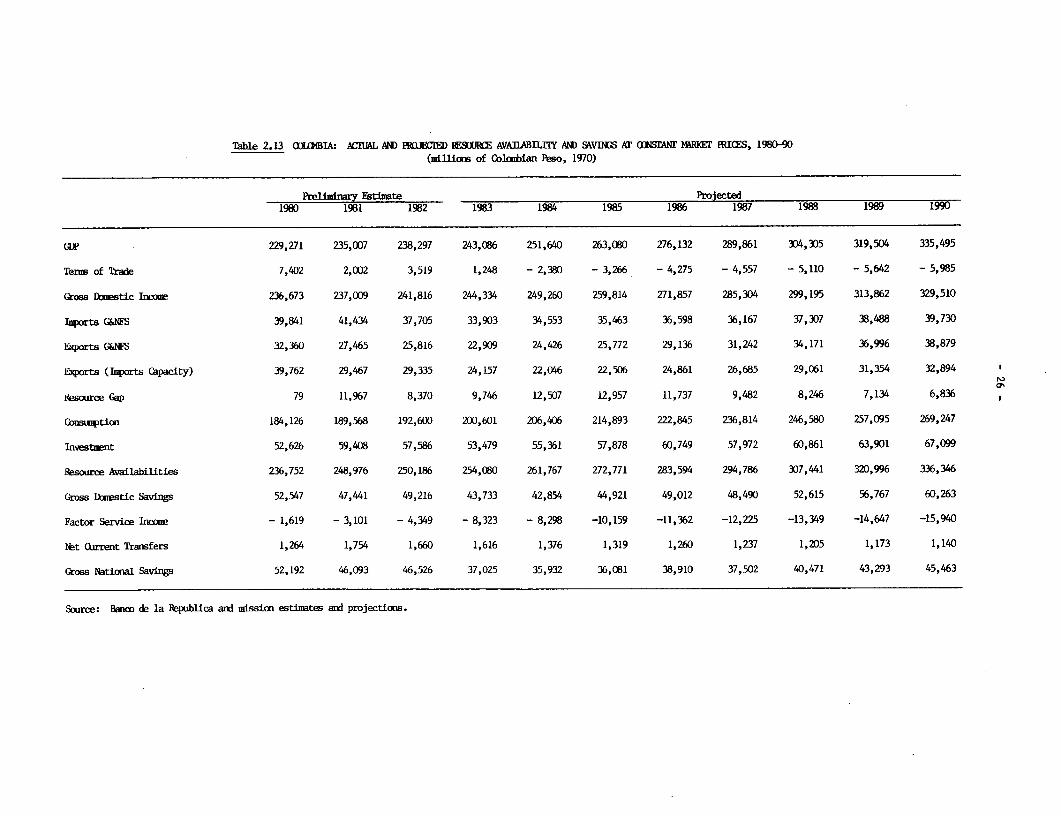
Tahle 2.13 C(L1IA: AUUAL AND RaElXMl -91UWRCE AVAIL4lTY AND SAVDUS AT NLCtANT MRIR PRICS, 1980-90(millions of Colian Peso, 1970)
P'reliinary Estilmte Projected1980 1981 1982 1983 1984 1985 1986 1987 1988 1989 1990
GI' 229,271 235,007 238,297 243,086 251,640 263,080 276,132 289,861 304,305 319,504 335,495
Ternm of Trade 7,402 2,002 3,519 1,248 - 2,380 - 3,266 - 4,275 - 4,557 - 5,110 - 5,642 - 5,985
Gross Domstic Incoe 236,673 237,009 241,816 244,334 249,260 259,814 271,857 285,304 299,195 313,862 329,510
1aports G&NFS 39,841 41,434 37,705 33,903 34,553 35,463 36,598 36,167 37,307 38,488 39,730
Exqorts G&NFS 32,360 27,465 25,816 22,909 24,426 25,772 29,136 31,242 34,171 36,996 38,879
Elxports (Imports Capacity) 39,762 29,467 29,335 24,157 22,046 22,506 24,861 26,685 29,061 31,354 32,894
Resource Gap 79 11,967 8,370 9,746 12,507 12,957 11,737 9,482 8,246 7,134 6,836
(bnrsipticu 184,126 189,568 192,600 200,601 206,406 214,893 222,845 236,814 246,580 257,095 269,247
Investment 52,626 59,408 57,586 53,479 55,361 57,878 60,749 57,972 60,861 63,901 67,099
Resource Availabilities 236,752 248,976 250,186 254,080 261,767 272,771 283,594 294,786 307,441 320,996 336,346
CGross Lbnestic Savings 52,547 47,441 49,216 43,733 42,854 44,921 49,012 48,490 52,615 56,767 60,263
Factor Service Irc - 1,619 - 3,101 - 4,349 - 8,323 - 8,298 -10,159 -11,362 -12,225 -13,349 -14,647 -15,940
Net Qirrent Transfers 1,264 1,754 1,660 1,616 1,376 1,319 1,260 1,237 1,205 1,173 1,140
Gross National Savings 52,192 46,093 46,526 37,025 35,932 36,081 38,910 37,502 40,471 43,293 45,463
Source: Barm de la Pepublica and mission estimates aid projections.
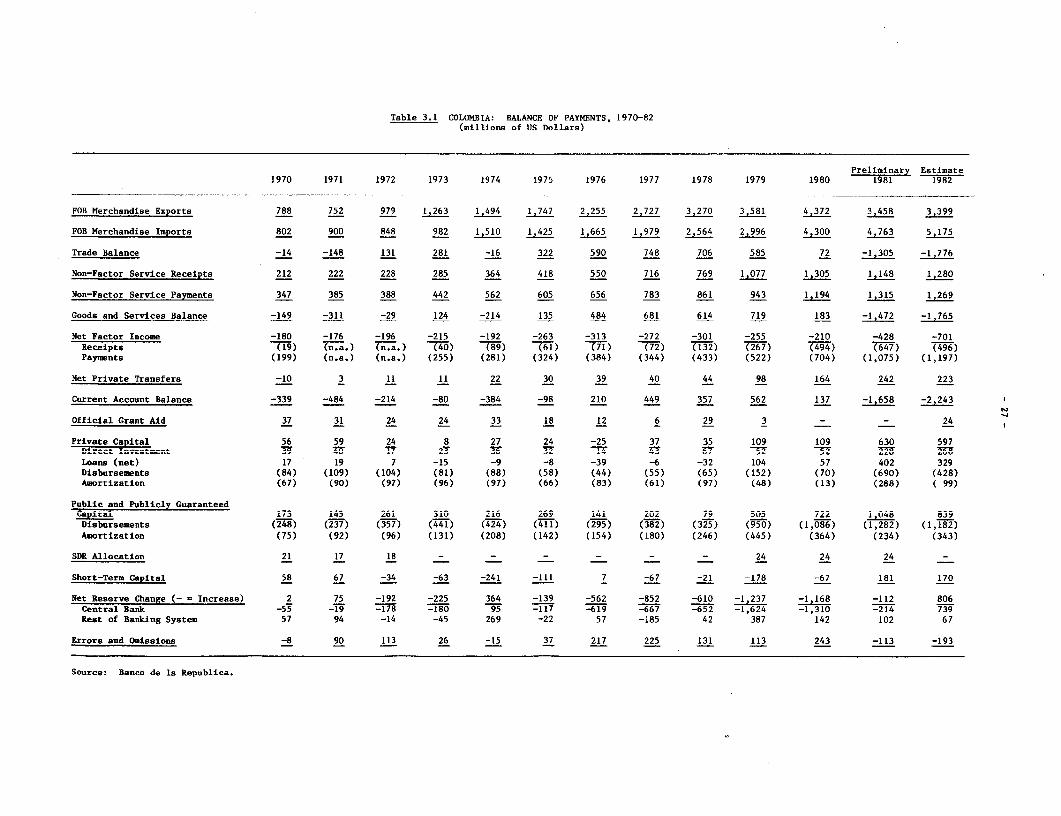
Table 3.1 COLOMBIA: BALANCE OF PAYMENTS, 1970-82(millions of US Dollars)
Preliminary Estimate1970 1971 1972 1973 1974 1975 1976 1977 1978 1979 1980 1981 1982
FOB Merchandise Exports 788 752 979 1,263 1,494 1,747 2,255 2,727 3,270 3,581 4,372 3,458 3,399
FOB Merchandise Imports 802 900 848 982 1,510 1,425 1,665 1,979 2,564 2,996 4,300 4,763 5,175
Trade Balance -14 -148 131 281 -16 322 590 748 706 585 72 -1,305 -1,776
Non-Factor Service Receipts 212 222 228 285 364 418 550 716 769 1,077 1,305 1,148 1,280
Non-Factor Service Payments 347 385 388 442 562 605 656 783 861 943 1,194 1,315 1,269
Goods and Services Balance -149 -311 -29 124 -214 135 484 681 614 719 183 -1,472 -1,765
Net Factor Income -180 -176 -196 -215 -192 -263 -313 -272 -301 -255 -210 -428 -701Receipts (19) (n.a.) (n.a.) (40 78) (861) (71) (72 T2) ( 3267 4) (647) (496)Payments (199) (n.a.) (n.a.) (255) (281) (324) (384) (344) (433) (522) (704) (1,075) (1,197)
Net Private Transfers -10 3 11 11 22 30 39 40 44 98 164 242 223
Current Account Balance -339 -484 -214 -80 -384 -98 210 449 357 562 137 -1,658 -2,243
Official Grant Aid 37 31 24 24 33 18 12 6 29 3 - - 24
Private Capital 56 59 24 8 27 24 -25 37 35 109 109 630 597Dt__:t l^veat=nt IffW- so g ^v 2'f j~' 7T -- :-r, Z---T Zs -17- -5 r -, 4Loans (net) 17 19 7 -15 -9 -8 -39 -6 -32 104 57 402 329Disbursements (84) (109) (104) (81) (88) (58) (44) (55) (65) (152) (70) (690) (428)Amortization (67) (90) (97) (96) (97) (66) (83) (61) (97) (48) (13) (288) ( 99)
Public and Publicly GuaranteedCapital 273 1~~ ~ ~~~~ ~~~~ ~~~~ ~~~45 261 310 216 269 141 202 79 505 721,V04 839v
Disbursements (248) (237) (357) (441) (424) (411) (2) (382) (325) (950) (1,086) (1,282) (1,182)Amortization (75) (92) (96) (131) (208) (142) (154) (180) (246) (445) (364) (234) (343)
SDR Allocation 21 17 18 - - - - - - 24 24 24 -
Short-Term Capital 58 67 -34 -63 -241 -111 7 -67 -21 -178 -67 181 170
Net Reserve Change (- - Increase) 2 75 -192 -225 364 -139 -562 -852 -610 -1,237 -1,168 -112 806Central Bank -55 -19 -178 -180 95 -117 -619 -667 -652 -1,624 -1,310 -214 739Rest of Banking System 57 94 -14 -45 269 -22 57 -185 42 387 142 102 67
Errors and Omissions -8 90 113 26 -15 37 217 225 131 113 243 -113 -193
Source: Banco de la Republica.

Table 3.2 COLOMBIA: COMMODITY EXPORTS, 1970-81 a/(millions of US Dollars)
Preliminary Estimate1970 1971 1972 1973 1974 1975 1976 1977 1978 1979 1980 1981
Major Export:Green Coffee 467.0 400.0 430.0 598.0 622.0 672.0 967.2 1,497.9 1,979.0 2,005.0 2,361.0 1,423.3
Minor Exports:Agro-based Products 101.4 105.2 155.0 166.5 229.5 327.4 267.5 353.8 339.3 381.1 566.7 535.3Cotton 34.6 29.7 51.2 38.1 -T§7; 76.1 59.4 164.0 72.5 52.0 83.0 93.0Cattle & Beef 21.8 28.2 37.7 43.4 36.0 56.8 52.1 45.0 46.5 37.2 27.3 53.2Sugar 14.0 15.7 28.4 30.2 68.6 95.1 24.1 2.2 19.5 49.6 165.0 77.0Bananas 18.1 14.7 13.7 15.4 25.4 31.6 40.9 45.6 76.0 84.8 94.0 122.5Tobacco 7.2 9.2 9.9 15.0 18.9 12.8 25.5 19.2 27.5 24.2 25.7 19.3Flowers 1.0 1.8 3.1 8.4 16.0 19.3 21.6 32.6 53.4 79.2 99.4 110.8Rice 0.0 0.0 0.7 3.4 0.5 22.9 21.4 19.9 4.6 8.8 16.6 9.5Cheese - 0.2 1.4 3.3 0.4 1.2 2.8 6.8 16.1 17.1 20.4 16.6Fish 4.7 5.7 8.9 9.3 11.5 11.6 19.7 18.5 23.2 28.2 35.3 33.4
Manufactured Products: 83.3 118.4 168.5 256.4 479.3 392.5 448.0 469.7 620.5 695.4 837.2 898.8Food Products b/ 11.1 11.7 15.7 8.1 11.9 19.3 16.1 30.5 31.3 34. 0O 47.3 51.6Footwear, Clothing & Textiles c/ 18.7 26.7 42.6 81.9 154.0 102.4 139.0 88.0 194.7 150.4 146.7 157.6Leather & Hides 6.7 7.0 19.0 25.5 16.0 16.5 20.4 30.0 33.8 37.7 31.7 39.2Chemicals & Pharmaceuticals 7.6 11.4 16.9 32.2 70.7 53.0 44.5 45.9 12.2 60.7 82.2 78.9Basic Metals & Products 4.9 6.9 10.9 20.9 28.0 21.5 23.6 32.7 36.4 65.9 43.8 60.8Mechanical & Electrical
Equipment 3.7 5.3 7.3 13.1 23.6 23.1 29.4 43.9 41.1 52.1 63.3 51.5Timber & Wood Products 5.4 5.6 8.7 22.0 30.6 8.0 13.6 14.7 7.5 15.1 11.3 11.4Paper, Cartons & Books 3.6 4.4 10.0 11.0 14.2 16.4 25.1 28.3 72.2 53.0 74.2 86.8Cement 3.3 3.2 5.7 6.9 9.8 11.9 23.3 14.9 21.9 30.7 35.7 29.0Glass 4.2 3.9 4.2 4.8 6.6 7.3 10.0 10.0 9.7 14.3 15.2 14.2Plastics 1.3 2.3 3.5 4.7 5.9 7.6 9.8 10.7 14.4 17.3 19.8 22.3Transport Equipment 0.7 9.5 2.3 2.8 5.4 7.1 9.2 15.6 21.1 17.9 25.7 29.1Fuel Oil d/ 12.1 20.5 21.7 22.5 102.6 98.3 84.0 104.5 124.2 146.3 240.3 266.4
Other Products: 83.9 66.4 112.5 156.4 86.1 33.3 62.5 121.8 63.9 218.9 180.1 99.0
Total Goods 735.6 690.0 866.0 1,177.3 1,416.9 1,465.2 1,745.2 2,443.2 3,002.7 3,300.4 3,945.0 2,956.4 e/
Balance of Payments Adjustment 52.4 62.0 113.0 85.7 77.1 281.8 509.8 283.8 267.3 280.6 427.0 501.6
Total Goods Adjusted 788.0 752.0 979.0 1,263.0 1,494.0 1,747.0 2,255.0 2,727.0 3,270.0 3,581.0 4,372.0 3,458.0
Freight & Insurance 43.0 49.0 49.0 65.0 98.0 93.0 120.0 144.0 140.0 153.0 142.4 114.1
Other Transportation 52.0 58.0 55.0 69.0 80.0 82.0 142.0 146.0 165.0 182.0 290.0 366.3
Travel 54.0 61.0 59.0 72.0 105.0 141.0 175.0 231.0 260.0 357.0 402.4 375.6
Other 63.0 54.0 65.0 79.0 81.0 102.0 113.0 195.0 204.0 385.0 470.3 291.5
Total Goods and NFS 1,000.0 974.0 1,207.0 1,548.0 1,858.0 2,165.0 2,805.0 3,443.0 4,039.0 4,658.0 5,677.0 4,606.0
a/ Based on Cuseoms data.b/ Excluding sugar.c/ Excluding cotton fiber.d/ ECOPETROL figures for 1976-81.e/ Adjusted to accommodate ECOPETROL's higher figure for fuel oil.
Source: DANE and Banco de la Republica

Table 3.3 COLOMBIA: IMPORTS BY ECONOMIC CATEGORY, 1970-81 a/(millions of US Dollars)
1970 1971 1972 1973 1974 1975 1976 1977 1978 1979 1980 1981
CONSuMER GOODS 91.9 101.1 105.4 161.6 190.3 168.5 204.5 287.6 503.5 451.1 619.6 667.6
Durables 43.9 45.1 48.4 57.5 87.9 78.5 93.7 130.3 187.4 196.8 312.2 336.2
-- on=U>rabls ,43.0 56.0 57.0 i04.i i02.4 90.0 ii0.8 157.3 316.1 254.3 307.4 331.4
RAW MATERIALS AND INTERMEDIATEGOODS 366.1 410.7 405.7 490.1 936.4 780.8 843.0 1,076.5 1,434.8 1,705.3 2,458.8 2,701.1
Fuels 1.2 8.1 5.4 2.1 3.0 14.5 39.9 136.2 204.5 322.2 562.8 724.1
Agricultural Inputs 8.3 10.1 21.2 34.8 99.4 54.8 22.9 69.7 104.5 95.8 162.2 147.0
Industrial Inputs 356.6 392.5 379.1 453.2 834.0 711.5 780.2 870.6 1,125.8 1,287.3 1,734.0 1,830.0
CAPITAL GOODS 368.2 397.6 330.8 386.7 464.9 539.3 660.6 664.2 898.0 1,076.8 1,584.2 1,830.5
Construction Equipment 20.3 15.8 10.1 18.9 32.4 35.4 42.6 26.1 44.7 63.1 98.3 159.6
Agricultural Equipment i3.0 8.i 10.6 i8.3 24.3 29.0 30./ 44.1 54.2 39.3 63.1 66.1
Industrial Equipment 194.7 246.3 216.7 225.1 260.5 269.1 330.5 387.8 517.0 603.1 955.0 1,113.2
Transport Equipment 140.2 127.4 93.4 124.4 147.7 205.8 156.7 206.2 282.1 371.2 467.8 491.6
UNCLASSIFIED 17.8 20.0 17.1 23.1 5.6 6.2 - - - - - -
TOTAL GOODS 844.0 929.4 859.0 1,061.5 1,597.2 1,494.8 1,708.1 2,028.3 2,836.3 3,233.2 4,662.6 5,199.2
a/ Based on Customs data.
Notes: Subcategories were calculated on the basis of import registrations as shares of totals for the years 1970 to 1973.Figures for total merchandise imports have been adjusted in the Balance of Payments by Banco de la Republica.
Source: DANE

- 30 -
Table 3.4 CULUMiLA: CU.ThAL BANK GKUSS RkECEIPS OF FOREIGN EXCHANGE, 1965-82
(tnousands ot US Dollars)
?erchandise Petroleum
hxport Capital
surrenaer a/ and
lear Cottee Other New Gold Services b/ Capital Total
19b5 346,b75 98,729 36,549 13,789 225,545 721,331
196b 304,3U2 95,7z9 36,484 37,138 371,657 843,31010b7 318,813 117,060 24,604 171,289 367,950 999,71619bb 314,144 178,434 30,977 123,365 262,235 909,155
1969 332,853 Z07,197 22,313 124,995 257,542 944,900
197U 405,543 237,011 27,991 129,398 313,559 1,113,5021971 358,610 297,828 22,198 129,973 380,188 1,188,797
9lYZ 433,b3b 4U6,877 14,276 147,109 464,299 1,466.1971973 535,41U 473,281 12,863 232,633 410,261 1,664,4481974 543,209 671,259 16,622 253,868 381,538 1,866,541
1975 534,542 779,151 39,146 465,266 409,924 2,328,029197c 917,678 734,627 23,597 872,954 453,714 3,002,570
1977 1,447,477 795,289 43,087 922,769 642,417 3,851,0391978 1,7U2,547 866,515 69,508 960,218 911,098 4,509,8861979 1,769,399 1,274,369 126,261 1,452,640 1,839,515 6,462,184198b 1,981,171 1,413,U86 395,447 1,8b4,215 2,139,178 7,793,0971981 1,J61,421 1,364,434 325,470 1,735,751 2,452,516 7,439,592
196i 1,5U8,1Z4 1,224.4bS 344,14b 1,319,55 2,163,575 6,561,465
19/9 - I 269,764 248,37U 18,222 279,171 324,828 1,14U,3551979 - II 45b,U89 339,bb5 31,945 382,4U9 709,848 1,919,95619/9 - III 415,36b 327,659 35,474 366,785 342,965 1:,488,2491979 - iV b62,18U 358,b15 40,62U 424,275 461,874 1,913,624
198U - I 412,372 299,697 85,590 469,438 470,788 1,737,885±9ou - 11 5J6,o84 358,U9b 77,b17 393,695 415,390 1:,776,682
198U - Ili 517,832 353,7UZ 101,358 486,887 803,035 2,.262,8141980 - IV 514,U83 406,591 130,882 514,195 449,965 2.,1015,716
i9b1 - 1 390,491 3U9,719 101,882 428,709 467,259 1.,698,0601981 - 11 343,904 361,471 80,986 475,448 485,591 1:,747,4001961 - 1II 3U4,150 321,377 71,260 329,437 743,728 1.,769,9521981 - Iv 522,876 371,867 71,342 502,157 755,938 2,224,180
1982 - I 312,749 297,576 101,106 424,167 419,385 1,.554,9831982 - II 384,142 317,891 78,804 328,170 646,372 1,755,3791982 - 1l1 307,190 284,129 76,708 265,762 598,040 1,531,8291982 - iV 504,U43 325,3b9 88,528 301,556 499,778 1,719,274
a/ inciuaes advance surrender.D| includes interest and transter.
bource: banco dce la Kepublica

- 31 -
Table 3.5 - COLOMBIA: CENTRAL BANK DISBURSEMENTS OF FOREIGN EXCHANGE, 1960, 1965-82(thousands of US Dollars)
Year Ordinary a/ AID Other b/ Petroleuma ServiLces Capital Total
1960 320,802 - 15,334 19,470 48,500 107,977 512,0831965 249,868 10,000 40,827 27,464 59,,178 328,172 715,5091966 312,480 40,617 68,249 35,582 101,342 284,902 843,17219167 343,359 58,310 47,242 29,017 122,753 399,251 c/ 999,9321968 249,004 77,959 92,891 38,961 182,143 205,480 846,4381969 321,388 66,031 87,069 33,434 198,298 198,404 905,2541970 395,097 81,876 81,124 40,427 260,081 254,706 1,113,3111971 487,945 49,346 75,370 39,768 265,460 263,103 1,180,9921972 548,522 11,526 94,613 47,287 296,678 340,099 1,338,7251973 661,990 9,550 72,764 51,357 388,985 349,714 1,534,3601974 927,650 1,542 120,750 67,530 479,592 356,706 1,953,7701975 1,187,290 28 130,091 65,692 504,935 322,991 2,211,0271976 1,086,801 - 149,511 75,246 555,640 516,452 2,383,6501977 1,609,141 - 163,078 71,270 538,073 305,429 3,186,9911978 1,880,872 - 218,640 88,045 607,902 1,057,373 3,852,8321979 2,281,758 - 275,913 77,766 852,711 1,353,679 4,841,8271980 3,269,213 - 234,659 107,495 1,307,201 1,567,745 6,486,3131981 3,670,243 - 191,488 96,948 1,674,081 1,592,013 7,224,77313982 3,149,967 - 155,641 275,397 1,933,285 1,6586,657 7,300,942
1979-I 491,472 - 67,977 15,934 139,386 :276,013 990,7821979-II 497,857 - 59,327 20,170 207,261 376,270 1,160,8851979-III 615,143 - 73,466 22,564 216,213 :332,910 1,260,2961979-IV 677,286 - 75,143 19,098 289,851 368,486 1,429,864
1980-I 680,394 - 74,520 42,530 234,894 390,616 1,422,9541980-II 784,777 - 33,447 28,821 349,678 :381,759 1,588,4821980-III 888,601 - 55,935 26,904 335,002. 412,842 1,719,2841980-IV 905,441 - 70,757 9,240 387,627 :382,528 1,755,593
1981-I 905,601 - 45,739 35,013 371,035 :379,232 1,736,6201981-II 892,612 - 59,489 6,267 437,988 :158,528 1,754,8841981-III 978,760 - 43,373 40,342 434,926 408,847 1,906,2481981-IV 893,270 - 42,887 15,326 430,132 445,406 1,827,021
1982-I 820,144 - 37,797 56,247 472,263 397,475 1,883,9211982-II 816,401 - 43,445 42,636 427,394 413,456 1,743,3321182-III 828,796 - 49,244 85,912 578,373 457,176 1,999,50115182-IV 684,626 - 25,155 90,602 455,255 418,550 1,674,188
a} Exchange certificate itcportsb/ Bilateral Agreements, Plani Vallejo, IBRD, Lines of credit for vehicles and mnchineryc} Includes some inte!rest payments (interest normally appears under services)
3curce: Banco de la IRepublica

- 32 -
Table 3.6 COLOMBIA: SUPPLY AND DISTRIBUTION OF EXPORT GRADE GREEN COFFEE, 1958-59 TO 1981-82(thousands of 60-kilogram bags)
Coffee ExportsYear Stocks Domestic Normal Other Stocks
(Oct./Sept.) Carry-In Production a/ Consumption Markets Markets Total Carry-Out b/
1958-59 11 7,442 908 6,372 59 6,431 1141959-60 114 7,648 1,197 5,597 74 5,671 8941960-61 894 7,500 1,270 5,990 53 6,043 1,0811961-62 1,081 8,035 1,526 5,536 58 5,594 1,9961962-63 1,996 7,500 1,416 5,952 104 6,056 2,0241963-64 2,024 7,800 1,375 6,228 82 6,310 2,1391964-65 2,139 8,547 1,354 5,612 131 5,743 3,5891965-66 3,589 8,224 1,202 5,670 195 5,865 4,7461966-67 4,746 7,507 1,250 5,421 213 5,634 5,3691967-68 5,369 7,995 1,270 6,344 251 6,595 5,4991968-69 5,499 7,375 1,290 6,204 330 6,534 5,0501969-70 5,050 8,450 1,043 6,467 407 6,874 5,5831970-71 5,583 7,683 1,300 6,008 322 6,331 5*6351971-72 5,635 5,723 1,300 6,349 137 6,487 3,5711972-73 3,571 8,818 1,300 6,067 188 6,255 4,8341973-74 4,834 7,214 1,400 7,015 393 7,408 3,2401974-75 3,240 8,102 1,400 7,196 346 7,542 2,4001975-76 2,400 7,835 1,400 6,625 630 7,255 1,5801976-77 1,580 8,879 1,500 5,292 559 5,851 3,1081977-78 3,108 10,765 1,605 7,558 73 7,631 4,6371978-79 4,637 11,568 1,638 10,718 - 10,718 3,8491979-80 3,849 12,548 1,730 11,540 555 12,095 2,5721980-81 c/ 2,572 13,037 1,478 9,031 - 9,031 5,1001981-82 d/ 5,100 12,893 1,592 8,990 - 8,990 7,411
a/ Registered production. Series deduced from data on stocks, consumption and exports.b/ Stocks include private holdings.c/ Preliminary.d/ Estimate.
Source: National Coffee Growers Federation
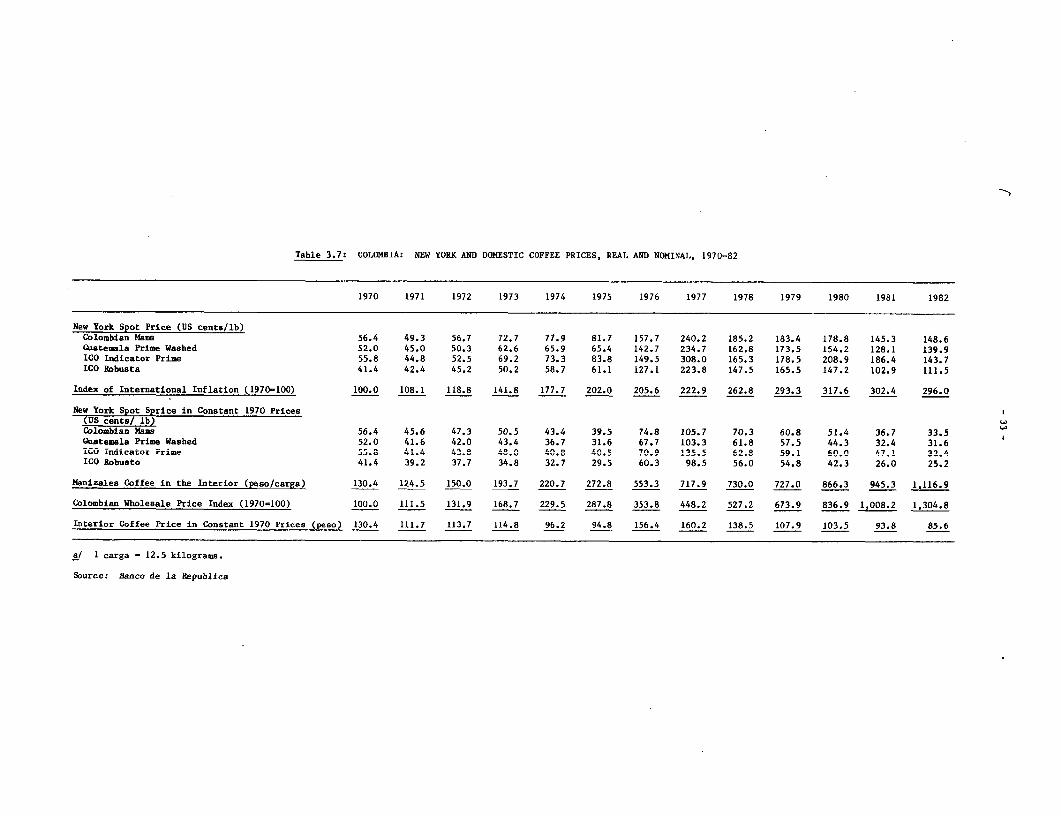
Table 3.7: COLOMBIA: NEW YORK AND DOMESTIC COFFEE PRICES, REAL AND NOMINAL, 1970-82
1970 1971 1972 1973 1974 1975 1976 1977 1978 1979 1980 1981 1982
New York Spot Price (US cents/lb)Colombian Mama 56.4 49.3 56.7 72.7 77.9 81.7 157.7 240.2 185.2 183.4 178.8 145.3 148.6Guatemala Prime Washed 52.0 45.0 50.3 62.6 65.9 65.4 142.7 234.7 162.8 173.5 154.2 128.1 139.9ICO Indicator Prime 55.8 44.8 52.5 69.2 73.3 83.8 149.5 308.0 165.3 178.5 208.9 186.4 143.7ICO Robusta 41.4 42.4 45.2 50.2 58.7 61.1 127.1 223.8 147.5 165.5 147.2 102.9 111.5
Index of International Inflation (1970-100) 100.0 108.1 118.8 141.8 177.7 202.0 205.6 222.9 262.8 293.3 317.6 302.4 296.0
New York Spot Sprice in Constant 1970 Prices(U1 cents/ lb) Colombian MNss 56.4 45.6 47.3 50.5 43.4 39.5 74.8 105.7 70.3 60.8 51.4 36.7 33.5Guatemala Prime Washed 52.0 41.6 42.0 43.4 36.7 31.6 67.7 103.3 61.8 57.5 44.3 32.4 31.6!CO indicaror Prime *5.S 41.4 43.- 48.0 40.S 40.5 70.9 135.5 62.8 59.! 60.0 4?.! 32.4ICO Robusto 41.4 39.2 37.7 34.8 32.7 29.5 60.3 98.5 56.0 54.8 42.3 26.0 25.2
Manizales Coffee in the Interior (peso/carga) 130.4 124.5 150.0 193.7 220.7 272.8 553.3 717.9 730.0 727.0 866.3 945.3 1,116.9
Colombian Wholesale Price Index (1970=100) 100.0 111.5 131.9 168.7 229.5 287.8 353.8 448.2 527.2 673.9 836.9 1,008.2 1,304.8
Interior Coffee Price in Constant 1970 Prices (peso) 130.4 111.7 113.7 114.8 96.2 94.8 156.4 160.2 138.5 107.9 103.5 93.8 85.6
a/ I carga - 12.5 kilograms.
Source: Banco de la Republica

- 34 -
Table 3.8 COLOMBIA: CRUDE PETROLEUM PRODUCTION, APPARENT DOMESTIC CONSUMPTION ANDNET EXPORTS, 1958-82 a/
Crude Apparent Crude Petroleum Net ExportsPetroleum Domestic By By Unit Value
Year Production b/ Consumption b/ Volume b/ Value c/ per Barrel
1958 46,878 22,489 24,389 66,571 2.731959 53,574 25,208 28,366 73,292 2.581960 55,770 24,438 31,332 79,998 2.551961 53,242 25,712 27,530 68,239 2.481962 51,908 27,597 24,311 60,584 2.491963 60,243 29,072 31,171 77,198 2.481964 62,586 31,874 30,712 74,962 2.441965 73,206 32,524 40,682 88,169 2.171966 71,915 36,340 35,575 70,596 1.981967 69,416 38,268 31,148 61,212 1.961968 63,573 45,125 18,448 36,334 1.971969 77,275 47,422 29,853 56,672 1.901970 80,050 48,804 31,246 58,618 1.881971 78,635 53,229 25,406 51,236 2.021972 71,674 56,750 14,924 30,791 2.061973 67,089 57,690 9,399 26,733 2.841974 61,387 60,907 480 4,452 9.281975 57,259 57,259 - - -1976 53,376 60,101 -6,725 -84,063 12.501977 50,222 59,622 -9,400 -130,660 13.901978 47,742 56,576 -8,834 -120,142 13.601979 45,297 54,028 -8,731 -203,432 23.301980 45,944 53,283 -7,339 -217,968 29.701981 48,852 56,656 -7,804 -268,458 34.401982 51,765 59,092 -7,327 -249,047 34.00
a/ Does not include imports of petroleum derivatives.h/ Quantities in thousands of 42-gallon barrels. Apparent domestic refinery consumption is
production minus exports or plus imports.c/ Value in thousands of US Dollars.
Source: National Planning Department and ECOPETROL

Table 3.9 COLOMBIA: IMPORTS BY PRINCIPAL PRODUCT GROUPS, 1970-81 a/(millions of US Dollars)
Machinery & Vehicles & Fuels,Electrical Transportation Mineral Oils Chemicals & Paper Materials RubberEquipment Equipment h Products Pharmaceuticals Iron & Steel Plastics & Products Products Foodstuffs Other Total
1970 231.2 136.8 8.7 76.6 78.6 22.5 35.9 14.0 31.0 200.9 836.2
1971 275.5 127.7 10.8 87.6 81.6 25.4 35.1 16.9 62.7 206.1 929.4
1972 256.0 117.3 5.4 92.4 64.6 21.0 37.8 17.0 46.7 200.8 859.0
1973 359.3 128.0 3.9 127.0 72.2 21.8 48.4 21.3 80.1 199.5 1,061.5
1974 306.7 191.6 3.7 210.8 139.6 45.1 67.9 35.1 143.5 453.2 1,597.2
1975 329.7 238.4 18.4 199.1 135.3 41.1 68.3 28.7 94.8 341.0 1,494.8
1976 406.4 251.4 41.7 200.6 122.9 48.8 66.6 40.5 146.2 383.0 1,708.1
1977 475.5 273.7 136.3 236.8 123.6 61.0 72.2 45.3 156.6 447.3 2,028.3
1978 618.4 380.7 205.1 300.6 180.9 84.0 96.3 55.3 180.6 734.4 2,836.3
1979 719.4 455.4 324.3 291.4 251.6 101.2 103.4 69.4 213.6 703.5 3,233.2
1980 b/ 1,099.1 619.3 566.5 396.3 316.1 145.3 138.2 73.1 338.1 970.6 4,662.6
1981 b/ 1,244.9 641.8 729.1 436.0 382.5 135.6 163.2 95.8 366.4 1,003.9 5,199.2
a/ Based on Customs data.b/ Prellminary.
Source: DANE

- 36 -
Table 3.10 CULUOHIA: DIRECTION OF TRADE, 1960, 1965, 1970, 1976-82(percentages and millions of US Dollars)
1960 1965 1970 1976 1977 1978 1979 1980 1981 1982
(Export Registrations in millions of US Dollars)
cortn america 303.3 25o.6 233.2 537.7 665.1 805.9 969.1 1,130.7 694.9 728.9
Lentral America and Caribbean 11.o 39.8 30.1 104.4 104.6 89.2 142.5 157.6 201.2 195.1
Latin America b.2 2Z.0 58.7 315.7 388.2 433.8 659.8 579.7 589.9 552.7o.w. anoea. Croup a! (o.U) (13.2) (44.3) (218.8) (337.1) (366.8) (552.3) (417.6) (499.6) (495.7)
Lurope b/ 137.5 209.2 330.0 816.2 1,199.7 1,600.2 1,537.6 1,870.7 1.329.0 1,354.2
asia 5.u 5.2 20.0 84.2 90.5 104.8 153.8 160.2 146.4 132.3
Atrica 0.3 5.7 1.9 0.8 1.6 6.9 23.0 16.4 35.0 25.0
vther 0.3 5.7 1.9 0.8 1.6 6.9 23.0 16.4 7.0 10.7
Gross Total 464.5 539.2 674.4 1,865.7 2,455.0 3,088.8 3,531.8 3,987.5 3,003.4 2,998.9
(As Percentage of Total Exports Registrations)
6ortkl America 65.3 48.0 34.6 28.8 26.6 26.1 27.4 28.4 23.1 24.3
Central Aerica and Caribbean 2.U 7.4 4.4 5.6 4.2 2.9 4.0 4.0 6.7 6.5
Latnn America 1.3 3.7 3.7 16.9 16.3 14.0 18.7 14.5 19.6 18.4o.w. Andean Group a/ (1.3) (2.4) (6.6) (15.1) (13.7) (11.9) (15.6) (10.5) (16.6) (16.5)
Europe b/ 29.6 38.8 49.0 43.7 48.9 51.8 43.5 46.9 44.3 45.2
Asia 1.1 1.0 3.0 4.5 3.7 3.4 4.4 4.0 4.9 4.4
Atrica 0.1 0.1 0.1 0.4 0.2 1.5 1.3 1.8 1.2 0.8
Uther 0.6 1.0 0.2 0.1 0.1 0.3 0.7 0.4 0.2 0.4
tiross 'otal 1UO.U 1U0.U 100.0 100.0 100.0 100.0 100.0 100.0 100.0 100.0
(import 8egistrations in millions of US Dollars)
aorta america 3U9.3 230.1 438.8 805.4 1,002.1 1,296.0 2,027.0 2,159.7 2,192.3 2,217.4
central America and Laribbean 18.0 11.b 10.7 b7.4 139.6 171.4 242.7 471.2 640.5 632.8
Latin america 8.U 39.3 84.3 308.4 495.7 633.5 717.9 896.8 1,187.7 1.268.6o.w. Andean Group a/ (6.5) (14.7) (43.8) (210.8) (288.8) (261.0) (274.5) (552.0) (801.0) (809.1)
Lurope b/ 165.5 155.4 338.2 615.6 754.7 971.7 1,241.6 1,281.5 1,420.5 1,351.5
Asia 17.1 15.9 56.4 168.7 265.5 332.2 379.0 577.9 627.0 594.3
Africa 0.3 0.4 1.3 2.2 3.4 4.6 18.5 11.9 11.1 15.0
Uther 0.3 0.7 0.4 3.4 4.8 3.3 3.1 13.7 14.7 15.2
Gross Total 518.5 453.4 930.1 1,991.1 2,665.8 3,412.7 3,629.8 5,412.7 6,093.8 6,094.8
(As Percentage of Total Import Registrations)
norta America 59.7 50.8 47.2 40.4 37.6 38.0 43.8 39.9 36.0 36.4
Central America and Laribbean 3.5 2.5 1.1 4.4 5.2 5.0 5.2 8.7 10.5 10.4
Latin Aerica 1.b 8.7 9.1 15.5 18.6 18.6 15.5 16.6 19.5 20.8o.w. ancean Group a/ (1.2) (3.2) (4.7) (10.6) (10.8) (7.6) (5.9) (10.2) (13.1) (13.3)
Lurope b/ 31.9 34.3 36.3 30.9 28.3 28.5 26.8 23.7 23.3 22.2
Asia 3.3 3.5 6.1 8.5 10.0 9.7 8.2 10.7 10.3 9.8
Africa - 0.1 U.1 0.1 0.1 0.1 0.4 0.2 0.2 0.2
Uther - 0.1 0.1 0.2 0.2 0.1 0.1 0.2 0.2 0.2
Gross Total 100.0 100.0 100.0 100.0 100.0 100.0 100.0 100.0 100.0 100.0
a/ Venezuela joined the Andean Group in 1973. However, the figures for the Andean Group for all years include Venezuelain order to make them comparable.
b/ Includes Eastern Isurope.
bource: iNCUOiWk
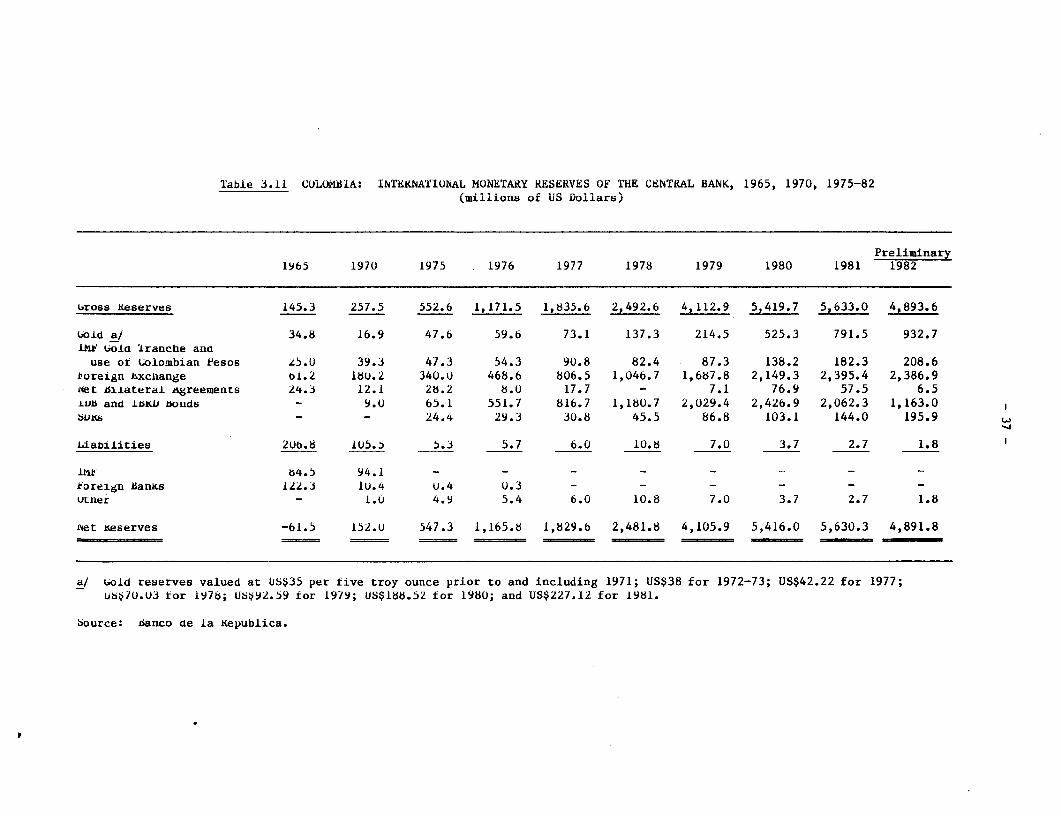
Table 3.11 CULOMKIA: INTEKXATI0NAL MONETARY RESERVES OF THE CENTRAL BANK, 1965, 1970, 1975-82
(millions of US Dollars)
Preliminary1965 1970 1975 1976 1977 1978 1979 1980 1981 1982
bross iCeserves 145.3 257.5 552.6 1,171.5 1,835.6 2,492.6 4,112.9 5,419.7 5,633.0 4,893.6
bold a/ 34.8 16.9 47.6 59.6 73.1 137.3 214.5 525.3 791.5 932.71hE bold Iranche ann
use of Colombian Pesos /5.U 39.3 47.3 54.3 90.8 82.4 87.3 138.2 182.3 208.6r'oreign hxchlange b1.2 180.2 340.0 468.6 806.5 1,046.7 1,687.8 2,149.3 2,395.4 2,386.9i'et Bilateral agreements 24.3 12.1 Z8.2 8.0 17.7 - 7.1 76.9 57.5 6.5.LDB and lbKU sonds - 9.U 65.1 551.7 816.7 1,180.7 2,029.4 2,426.9 2,062.3 1,163.0 1zis - - 24.4 29.3 30.8 45.5 86.8 103.1 144.0 195.9 w
Liabilities zu2.8 105.5 5.3 5.7 6.0 10.8 7.0 3.7 2.7 1.8
fink 84.5 94.1 - - - - -
Loreign tanKs 12Z.3 1U.4 U.4 U.3 - - - - -
Vtner - 1.U 4.9 5.4 6.0 10.8 7.0 3.7 2.7 1.8
Aet I%eserves -61.5 152.U 547.3 1,165.8 1,829.8 2,481.8 4,105.9 5,416.0 5,630.3 4,891.8
a/ wold reserves valued at US435 per five troy ounce prior to and including 1971; US$38 for 1972-73; US$42.22 for 1977;ub47U.03 tor 1978; Ub>92.59 for 1979; US$188.52 for 1980; and US$227.12 for 1981.
Source: sanco de La Republica.
p~~~~~~~~~~~
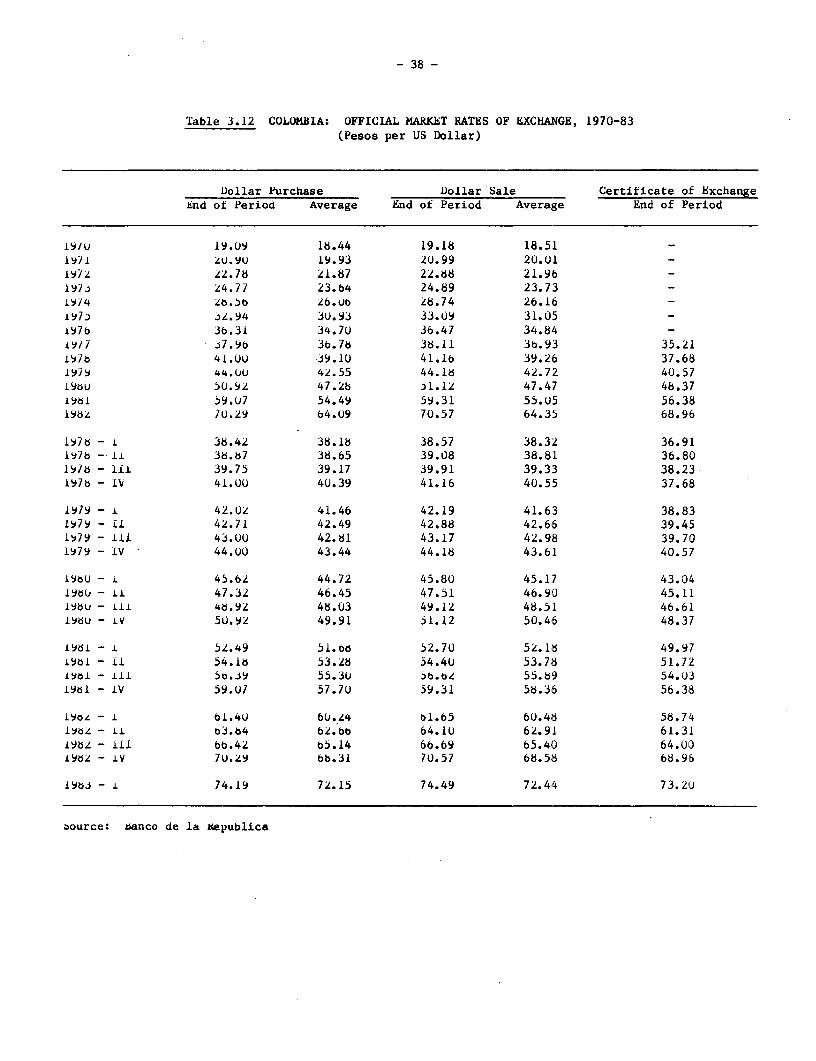
- 38 -
Table 3.12 COLOBIA: OFFICIAL MARKET RATES OF EXCHAIGE, 1970-83(Pesos per US Dollar)
Dollar Purchase Dollar Sale Certificate of ExchangeEnd of Period Average End of Period Average End of Period
19Iu 19.09 18.44 19.18 18.51 -1971 2U.9U 19.93 20.99 20.01 -1972 22.78 21.87 22.88 21.9b -1973 24.77 23.64 24.89 23.73 -liY4 zb.)b Z6.ub Z8.74 26.16 -i97) :Z.94 3U.93 33.09 31.05 -1976 b3.31 34.7U 36.47 34.84 -19/7 J7.9b 36.78 38.11 3b.93 35.211976 41.UU .39.1t 41.16 39.26 37.6819)9 44.UU 42.55 44.18 42.72 40.5719bU 50.9Z 47.28 51.12 47.47 48.3719b1 S9.U7 54.49 59.31 55.05 56.3819dz 7U.Z9 64.09 70.57 64.35 68.96
1976 - i 38.42 38.18 38.57 38.32 36.'911976 - 1i 38.87 38.65 39.08 38.81 36.801976 - lII 39.75 39.17 39.91 39.33 38.23197b - IV 41.U0 40.39 41.16 40.55 37.68
1979 - 1 42.02 41.46 42.19 41.63 38.831979 - Ii 42.71 42.49 42.88 42.66 39.451979 - i11 43.0U 42.81 43.17 42.98 39.701979 - IV 44.U0 43.44 44.18 43.61 40.57
19%U - 1 45.62 44.72 45.80 45.17 43.04196b - Ii 47.32 46.45 47.51 46.90 45.1119du - Ill 48.92 48.03 49.12 48.51 46.6119dU - iv 5U.9Z 49.91 51.12 50.46 48.37
1961 - i52.49 51.bt 52.70 52.18 49.97i9d1 - II 54.1d 53.Z8 54.40 53.78 51.721961 - 111 5o.J9 55.3U 5b.bZ 55.89 54.0319b1 - iV 59.U7 57.7U 59.31 58.36 56.38
190L - 1 61.4U 6U.24 01.65 60.48 58.741962 - il t3.b4 62.bb 64.10 6Z.91 61.311982 - ill bb.42 b5.14 66.69 65.40 64.00i96z - LV 7U.29 6b.31 7U.57 68.58 68.96
19b6 - i 74.19 7Z.15 74.49 72.44 73.20
bource: banco de la "epublica

- 39 -
llile 3.13 aUMIA: BfANW CF PADMtS, E1NfT P83KI(lCH3, 198D-90(in milLom of US dol]anr)
Actual Prel_i_rg__ __jected_1980 1981 1982 1983 1984 1985 1986 1987 1988 1989 1990
Ccnstant (1970) US$ millions
Ccffee 563 475 436 442 447 453 459 465 471 477 43Cctton 35 35 24 26 32 34 37 39 42 45 49Sugar 27 19 13 14 19 20 21 22 23 24 26Bananes 42 55 67 69 71 74 77 79 82 85 88Cattle and Beef 6 16 14 11 14 15 16 17 18 18 19Petro;Len Derivatives 18 20 26 22 26 27 27 36 47 62 83Nickel - - - 49 61 64 65 62 64 64 65Coal 3 2 3 14 26 45 147 197 262 329 333Ma3Dr Maafacturei Goods 202 194 201 197 210 223 240 260 28D 303 327All Other Goods 295 237 197 152 161 171 184 199 215 232 251Total Goods 1,191 1,053 981 995 1,067 1,125 1,272 1,375 1,504 1,641 1,724NoirFactor Services 386 356 397 326 341 360 407 426 466 492 517Total Exports 1,577 1,409 1,378 1,321 1,408 1,486 1,680 1,801 1,970 2,133 2,241
Price Idlices (1970 - 100)
Coffee 392.2 325.6 351.0 319.8 302.0 287.5 289.1 290.6 292.2 293.8 295.3Cotton 240.5 268.5 270.1 293.2 313.0 326.1 328.7 331.4 334.0 336.6 339.3Sugar 605.0 409.5 409.5 440.0 522.2 606.7 645.4 686.6 730.4 777.0 826.6Bananas 225.7 224.3 224.3 244.3 230.8 213.1 208.6 204.2 199.8 195.6 191.4Cattle and Beef 442.4 336.8 336.8 442.3 466.4 490.5 477.8 465.5 453.5 441.8 430.4Petroleum Derivatives 1,340.0 1,362.0 1,362.0 1,153.1 1,088.8 1,096.9 1:,127.3 1,158.5 1,190.6 1,223.6 1,257.5Nickel - - - 247.9 264.4 280.9 290.6 301.1 312.1 323.4 335.1Coil 379.4 419.9 419.9 351.2 358.8 366.5 373.8 381.3 388.9 396.7 404.6;;llr Manifaetured Goods 272.0 299.5 299.5 309.1 338.4 370.6 400.2 424.3 449.7 476.7 505.3ALL iDther Goods 337.3 299.0 299.0 30B.6 337.9 370.0 399.6 423.6 449.0 475.9 504.5Total Goods 367.1 328.4 346.5 328.1 334.6 343.3 358.1 375.6 394.5 4i5.4 439.7NorFactor Services 337.7 322.4 322.4 332.7 364.3 398.9 430.9 456.7 484.1 513.1 543.9Total Exports 360.0 326.9 339.6 329.2 341.8 356.8 375.7 394.8 415.7 438.0 463.8
Current US$ millons
CaEfee 2,208 1,546 1,529 1,412 1,351 1,303 1,327 1,352 1,377 1,402 1,428Cdtton 83 93 66 75 99 111 120 130 141 153 165kqyr 165 77 54 60 97 119 133 150 168 188 212Uaneas 94 123 151 169 165 158 160 162 164 166 168Cat:tle and Beef 27 53 46 50 67 74 76 78 80 81 83Petroleum Derivstives 240 266 349 249 283 298 303 412 561 764 1,040Nickel - - - 120 160 180 190 186 198 208 219i3maO 11 9 12 49 93 165 549 750 1,019 1,304 1,349Major MISufactured Goods 550 581 602 609 711 825 962 1,102 1,261 1,444 1,6534l L Other Goods 994 710 590 469 544 631 736 843 965 1,105 1,265Total Goods 4,372 3,458 3,399 3,263 3,569 3,864 4,557 5,164 5,932 6,815 7,5813cariPactor Services 1,305 1,148 1,280 1,085 1,244 1,437 1,754 1,946 2,257 2,525 2,813'otaL Exports 5,677 4,606 4,679 4,348 4,8L3 5,301 6,311 7,110 8,189 9,340 10,394
Note SacSe of the values of tie erport ommodities slxn for the yeam 198D-81 differ frca thDoe sAm. in Table 3.2 bceuse of bhanoe of paymtsadjuttmts Introduced.
Some: DAM, de la Reqblic, Bark staff estlaetes aal projectionr

Table 3.14 C(XllMBIA: BA(NCE CF PffAiMWIS, D]PCRI PFTaRICONS, 1980-90(in dillions of US dollars)
Actual Pre Projected1980 1981 1982 1983 1984 1985 1986 1987 1988 1989 1990
Cmatant (1970) US$ mflions
Nbn-Durable Consumr GDods 89 103 149 135 135 136 137 138 139 140 141Dkirable Cxumer Goods 94 104 172 140 140 141 142 143 144 145 146Fuel. 20 25 21 21 17 12 13 8 8 7 8Rin Materials & Internuixate Goods 560 699 631 549 562 579 598 618 638 659 681Capital Goods 469 568 628 668 686 710 737 706 733 761 790Total Coods 1,232 1,499 1,601 1,513 1,540 1,578 1,627 1,613 1,661 1,712 1,765Nom-rar-tor Services 506 408 394 332 338 346 357 354 365 376 388TDtal IpWorts 1,699 1,887 1,995 1,845 1,878 1,924 1,984 1,967 2,026 2,088 2,153
Frice Wiices (1970 - 100)
Nci-Durahble Ozmumer Goods 343.1 322.4 268.1 222.3 228.0 228.0 232.4 236.9 241.5 246.1 250.8bhrgbla Consumer GDods 332.3 322.4 322.4 328.1 359.3 393.4 424.9 450.4 477.4 506.0 536.4Fuel 2,753.4 2,850.0 2,751.7 2,169.7 2,048.7 2,063.8 2,121.0 2,179.8 2,240.2 2,302.3 2,366.1byw Mater1als & Intermediate Goods 337.7 282.9 306.8 316.5 346.6 379.5 409.9 434.5 460.6 488.2 517.5Caidtal Goods 337.7 322.4 322.4 305.3 334.3 366.1 395.9 419.1 444.2 470.9 499.2Ibtal Goods 349.3 351.2 323.2 329.9 350.6 374.0 402.8 421.0 445.0 470.1 380.6Nt*rfactor Services 235.9 322.1 322.1 232.9 255.0 279.2 301.5 319.6 338.8 359.1Ibtal lmports 379.4 344.2 323.0 312.5 333.4 357.1 384.6 402.8 425.8 450.1 476.8
Carrnt US$ nd 1 1
Nm-Drable Cbimer Goods 307 331 402 300 308 310 318 327 336 345 354Dirable Consumer Gbods 312 336 556 459 503 555 603 644 687 734 783Puela/ 563 724 584 456 348 241 265 177 175 170 189Eb&mwiterials & Internediate Goods 1,890 1,977 1,937 1,738 1,947 2,198 2,452 2,685 2,940 3,218 3,524Capital Goods 1,584 1,830 2,026 2,039 2,293 2,598 2,913 2,957 3,254 3,581 3,942Balance of PaymEnt Adjustment -356 -435 -330 0 0 0 0 0 0 0 0Total Goods 4,300 4,763 5,175 4,991 5,399 5,902 6,553 6,790 7,391 8,048 8,792Non-Factor Services 1,194 1,315 1,269 774 862 967 1,076 1,131 1,236 1,350 1,475Total Inports 5,494 6,078 6,444 5,765 6,261 6,869 7,629 7,921 8,627 9,398 10,267
a/ For this table, the petroleLn data source is BXFE11EDL.
Source: DAME, Banco de la Republica, ECXOPEnMlL, Bank staff estilates and projections

Tahle 3.15 00LLMBIA: SEH4ARY CF BALANCE CF PAI§NT, 1980-82(in ndllons of US dollars)
A&tul Preliminary Projected1980 1981 1982 1983 1984 1985 1986 1987 1988 1989 1990
Exports of Gbods & Non-Factor Services 5,677 4,606 4,679 4,348 4,813 5,301 6,311 7,110 8,189 9,340 10,394
Imports of Goods & 1N*-Factor Services 5,494 6,078 6,444 5,765 6,261 6,870 7,629 7,921 8,627 9,398 10,267
Resotrce Balance 183 -1,472 -1,765 -1,417 -1,448 -1,569 -1,318 -810 -438 -58 127
Net Factor Incone -210 -428 -701 -1,183 -1,336 -1,514 -1,633 -1,735 -1,817 -1,955 -2,126
Net Private TrInsfers 164 242 223 230 237 244 251 259 266 274 282
Obrrent AccouLt BaLazxP 137 -1,658 -2,243 -2,370 -2,547 -2,839 -2,700 -2,287 -1,989 -1,739 -1,717
Net Direct Fore4p Tnvestinit 52 222 268 300 350 400 400 400 400 400 400 >
Net Public and Publicly Qwranteed Capital 722 1,048 1,195 692 1,318 1,710 2,260 1,730 1,436 1,101 1,103DIsbursewnts 1,086 1,282 1,538 1,086 1,849 2,362 3,009 2,698 2,735 2,763 2,970Rwepyunnts 364 234 343 394 531 652 749 968 1,299 1,662 1,867
Net Private loam 57 402 -27 0 50 100 200 200 300 400 400Dislxlrs.rEnts 70 690 72 100 150 200 300 300 400 500 5001?epayusnts 13 288 99 100 100 100 100 100 100 100 100
Capita n.e.i. 200 98 i 28 29 30 30 30 30 30 30
Capital Arnt Blance 1,031 1,770 1,437 1,020 _1747 2,240 2,890 2,360 2,166 1,931 1,933
Net Reserve Change -1,168 -112 806 1,350 800 599 -190 -73 -177 -192 -216
Menwrarxl Items
Net Central Bank International Reserves 5,416 5,630 4,892 3,542 2,742 2,143 2,333 2,406 2,583 2,775 2,991
Public Debt Service Ratio 9.7 14.6 19.9 19.8 21.9 24.1 23.6 25.2 27.0 28.3 28.1
Source: Banwo de la Republica; missimn estimates and projections.

PAGE 1
Table 4.1 COLOMBIA: EXTERNAL PUBLIC DEBT OUTSTANDING INCLUDING UNDISBURSED AS OF DECEMBER 31, 1981
DEBT REPAYABLE IN FOREIGN CURRENCY AND GOODS a/(in thousands of US dollars)
D E B T O U T S T A N D I N GTYPE OF CREDITOR - - - - - - - - - - - - - - - - - - -
CREDITOR COUNTRY DISBURSED : UNDISBURSED : TOTAL
SUPPLIERS CREDITSARGENTINA 221 221AUSTRALIA 172 - 172
BELGIUM 6,734 15,845 22,579
BRAZIL 6,554 6,396 12,950
CANADA 641 2,566 3,207
FRANCE 4,295 7,550 11,845
GERMANY, FED. REP. OF 51,162 182,825 233,987
ITALY 50,500 113,600 164.100
JAPAN 11,886 - 11,886
NETHERLANDS 8,208 14,820 23,028
PANAMA 3,696 - 3,696
POLAND 70 70
SPAIN 9,177 - 9,177
SWEDEN 47,232 29,768 77,000
SWITZERLAND 4,011 99 4,110
UNITED KINGDOM 4.720 1,908 6,628
UNITED. STATES 14,966 2,110 17,076
VENEZUELA 93 - 93
TOTAL SUPPLIERS CREDITS 224,338 377,487 601,825
FINANCIAL INSTITUTIONSBULGARIA 643 - 643
BRAZIL _ _
CANADA 16,852 9,840 26,692
FRANCE 66,288 24,641 90,929
JAPAN 39,142 9,521 48,663
SWITZERLAND 3,780 17,220 21,000
MEXICO 4,439 - 4,439-
NETHERLANDS - 2,610 2,610
PANAMA 3,722 - 3,722
SWEDEN 4,155 3,265 7,420
TUNITED KINGDOM 1,259 - 1,259
UNITED STATES 123,452 8,567 132,019MULTIPLE LENDERS 1,919,808 278,589 2,198,397
TOTAL FINANCIAL INSTITUTIONS 2,183,540 354,253 2,537,793

PA.RF 2
rable 4.1 COLOMBIA: EXTERNAL PUBLIC DEBT OUTSTANDING INCLUDING UNDISBURSED AS OF DECEMBER 31, 1981DEBT REPAYABLE IN FOREIGN CURRENCY AND GOODS a/
(in thousands of US dollars)
D E B T 0 U T S T A N D I N GTYPE OF CREDITOR - - - - - - - t - - - - - - - - - - - - - - -
CREDITOR COUNTRY DISBURSED UNDISBURSED TOTAL
BONDSJAPAN 15,155 - 15,155UNITED STATES 10,487 - 10,487
TOTAL BONDS 25,649 - 25,642
NATIONALIZATIONUNITED STATES 2,657 - 2,657
TOTAL NATIONALIZATION 2,657 - 2,657
MULTILATERAL LOANSCORP. ANDINA FOMENTO 18,651 23,494 42,145IBRD 1,164,832 1,073,160 2,237,992IDA 20,837 - 20,837IDB 396,156 419,361 815,517 p
TOTAL MULTILATERAL LOANS 1,600,476 1,516,015 3,116,491
BILATERAL LOANSBELGIUM 6,623 935 7,558CANADA 35,795 665 36,460CZECHOSLOVAKIA - 160 160DENMARK 873 - 873FRANCE 18,553 212 18,765GERMAN DEM. REP. 22,183 23,650 45,833GERMANY, FED. REP. OF 105,650 34,863 140,513ITALY 86 - 86JAPAN 17,502 186,112 203,614NETHERLANDS 27,124 9,206 36,330UNITED KINGDOM 9142 7n7 9,849UNITED STATES 794,362 49,103 843,465VATICAN CITY 736 - 736VENEZUELA 978 - 978
TOTAL BILATERAL LOANS 1,039,607 305,613 1,345,220
TOTAL EXTERNAL PUBLIC DEBT 5,076,260 2,553,368 7,629,628a/ EstimatedNOTES: (1) ONLY DEBTS WITH AN ORIGINAL OR EXTENDED MATURITY OF OVER ONE YEAR ARE INCLUDED IN THIS TABLE.
(2) DEBT OUTSTANDING INCLUDES PRINCIPAL IN ARREARS BUT EXCLUDES INTEREST IN ARREARS.

Table 4.2 COLOMBIA: SERVICE PAYMENTS, COkMITMENTS, DISBURSEMENTS AND
OUTSTANDING AMOUNTS OF EXTERNAL PUBLIC DEBT
PROJECTIONS BASED ON DEBT OUTSTANDING INCLUDING UNDISBURSED AS OF DEC. 31, 1981DEBT REPAYABLE IN FOREIGN CURRENCY AND GOODS
(IN THOUSANDS OF U.S. DOLLARS)TOTAL
YEAR DEBT OUTSTANDING AT T R A N S A C T I O N S D U R I N G P E R I O D LOTHER CHANGES: BEGINNING OF PERIOD
DISBURSED INCLUDING COMMIT- DISBURSE- S E R V I C E P A Y M E N T S CANCEL- ADJUST-* ONLY UNDISBURSED MENTS MENTS ----------------------- :----------- LATIONS MENT t
PRINCIPAL INTEREST TOTAL* (1) (2) (3) (4) (5) (6) (7) (8) (9)
1973 1,631,697 2,364,050 530,058 408,075 131,446 78,205 209,651 43,483 16.8381974 1,913,701 2,736.017 236,342 377,891 207,565 102,832 310,397 12,725 i4.4901975 2.092.942 2,766.559 411,431 390,211 135,285 113,680 248,965 24,191 -8,0261976 2,347,962 3.010,488 514,926 258,403 152.873 125,430 278,303 10,565 -4,6011977 2,449,410 3.357,375 499,515 361,346 175,496 137,077 312,573 19,435 i7,3751978 2,657,573 3,679,334 805,832 300,919 224,832 168,171 393,003 20,906 51,2991979 2.774,318 4.290.727 1,356,11S 982,609 430,122 227,139 657.261 4,595 33,0511980 3,342,650 5.245,176 1,596,807 1,005,144 263,947 282,230 546,177 9,650 -65,6001981 4.047,740 6,502.786 1,564,996 1.412,264 308,678 416,916 725,594 1,885 -127,5911982 5,076,260 7,629,628
* * * * * * THE FOLLOWING FIGURES ARE PROdECTED * * * * * *
1982 5,076,260 7,629.628 - 749,793 329.071 526,443 855,514 - -1983 5,496,981 7,300,557 - 643,041 404,572 560,219 964,791 - 81984 5,735,449 6.895,993 - 500,372 558,918 571,005 1,129,923 - 51985 5,676,900 6,337,080 - 356,240 643,282 550,132 1,193,414 - -21986 5,389,861 5,693,796 - 167,814 699,759 504.063 1,203,822 - -51987 4,857,912 4,994,032 - 73,913 776,474 433,938 1,210,412 - 11988 4,155,351 4,217,559 - 37,218 776,600 346,539 1,123,139 - -11989 3.415,970 3,440.958 - 16,415 679,465 257,739 937,204 - -1990 2,752,920 2,761,493 - 6,112 562,754 185,374 748,128 - 41991 2,196,282 2,198,743 - 1,700 411,483 129,157 540,640 - 11992 1.786,500 1,787,261 - 597 273,506 98,158 371,664 - 21993 1.513,593 1.513,757 - 164 251.315 79,753 331,068 - 81994 1,262,450 1,262,450 - - 218,252 62,998 281,250 - -41995 1,044,194 1,044,194 - - 189,253 48,632 237,885 - -141996 854.927 854,927 - - 158,925 36.894 195,819 - -21997 696,000 696,000 - - 130,100 27,160 157,260 - -31998 565,897 565,897 - - 94,971 19,929 114,900 - -21999 470,924 470,924 - - 76,800 15.085 91,885 - -92000 394,115 394,115 - - 66,937 1t,573 78,510 - -2001 327,178 327,178 - - 50,005 8,780 58,785 - -
* THIS COLUMN SHOWS THE AMOUNT OF ARITHMETIC IMBALANCE IN THE AMCUNT OUTSTANDING INCLUDING UNDISBURSED FROM ONEYEAR TO THE NEXT. THE MOST COMMON CAUSES OF IMBALANCES ARE CHANGES IN EXCHANGE RATES AND TRANSFER OF DEBTSFROM ONE CATEGORY TO ANOTHER IN THE TABLE.
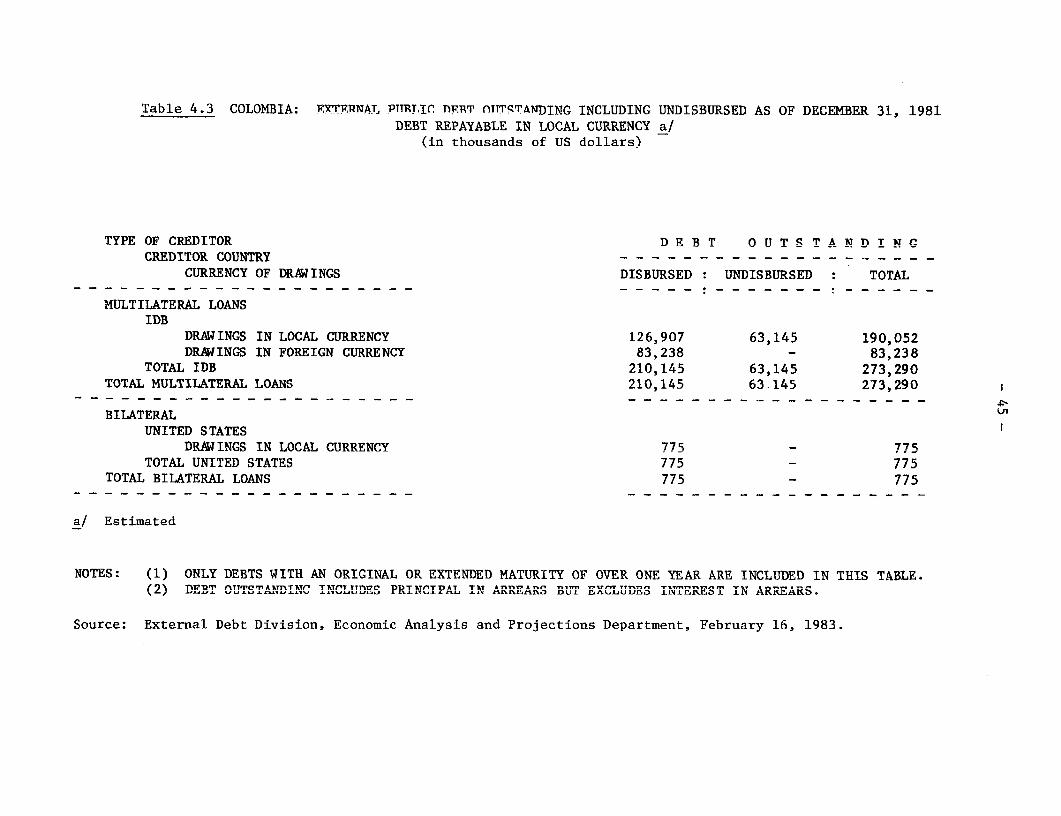
Table 4.3 COLOMBIA: .ETERNAT. PTRTIC DERT nTTT!TANDING INCLUDING UNDISBURSED AS OF DECEMBER 31, 1981DEBT REPAYABLE IN LOCAL CURRENCY a/
(in thousands of US dollars)
TYPE OF CREDITOR D E B T Q TT T S T A N n I N GCREDITOR COUNTRY - - - - - - - - - - - - - - - - - - - -
CURRENCY OF DRAW INGS DISBURSED UNDISBURSED TOTAL- - - - - - - - - - - - - - - - - - - - - - - - - - - - -_ - - - - - - - - - - -_…
MULTILATERAL LOANSIDB
DRAWINGS IN LOCAL CURRENCY 126,907 63,145 190,052DRAWINGS IN FOREIGN CURRENCY 83,238 - 83,238
TOTAL IDB 210,145 63,145 273,290TOTAL MULTILATERAL LOANS 210,145 63.145 273,290
- - - - - - - - - - - - - - - - - - - - - - - - - - - - - - - - - - - - - - - - - ,S4
BILATERALUNITED STATES
DRAWINGS IN LOCAL CURRENCY 77s 775TOTAL UNITED STATES 775 775
TOTAL BILATERAL LOANS 775 775
a/ Estimated
NOTES: (1) ONLY DEBTS WITH AN ORIGINAL OR EXTENDED MATURITY OF OVER ONE YEAR ARE INCLUDED IN THIS TABLE.(9'M n fla~'1 nTT'0PcA,JTIT7,7 TMm,TOTITNVO 'rT/flT 7T'TAT Tlk.T AflY1A' 0%2) -.IEBT 0-T-4-1- t" DiLL DXUBl,AL'UDUVES iLN1EREST IiN ARREARS.
Source: External Debt Division, Economic Analysis and Projections Department, February 16, 1983.

Table 4.4 COLOMBIA: SERVICE PAYMENTS, COMMITMENTS, DISBURSEMENTS ANDOUTST'PTGI" AM^.TTFTS O'F EYTERNAL PUBLIC DEBT
PROJECTIONS BASED ON DEBT OUTSTANDING INCLUDING UNDIS'.URSED AS OF DEC. 3t, i981
DEBT REPAYABIE IN LOCAL CURRENCY(IN THOUSANDS OF U.S. DOLLARS)TOTAL
YEAR DEBI OUTSTANDING AT T R A N S A C T I 0 N 5 D U R I N G P E P I 0 D OTHER CHANGES
: BEGINNING OF PERIOD
DISBURSED INCLUDING COMMIT- DISBURSE- S E R V I C E P A Y M E N T S CANCEL- ADJUST-
: ONLY UNDISBURSED MENTS :MENTS - ----- :-----------:----------- LATIONS MENTPRINCIPAL INTEREST TOIAL
: (1) (2) (3) (4) (5) (6) (7) (8) (9)
1973 143.102 243,367 3,100 22,363 7,490 5,991 13,481 - -532
1974 157,342 238, 445 9,200 25,007 7,294 6,073 13,367 2,711 -1,273
1975 173,780 236.367 - 17,102 8,310 6,554 14,864 2,412 877
1976 181,850 226,522 49.730 13.172 10,207 6,837 17.044 2,215 -399
1977 184.416 263,431 35,000 11,171 11,483 6,854 18.337 4.217 -148
1978 183,956 282.583 - 17,860 13,105 6,912 20,017 3,189 -202
1979 188.508 266.087 21,200 15,668 13.132 6,598 19,'730 283 -154
1980 190,887 273,718 24,000 21,918 14.979 6,559 21,538 - -241
1981 197,586 282,498 6,889 28,654 15,781 6,409 22,190 - 459
1982 210.920 274,065
* * ~ * * * THE FOLLOWING FIGURES ARE PROJECTED * * * * * I
1982 210,920 274,065 - 19,118 17,126 6,831 23,957 - 3 O1983 212,916 256.942 - 15,769 16,653 6,590 23,243 - 2
1984 212,034 240,291 - 12,876 17,208 6,318 23',526 - 2
1985 207,704 223,085 - 7,673 17.545 5,976 23,521 - -3
1986 197,829 205,537 - 4,262 16,830 5,505 22,335 - -
1987 185.261 188,707 - 2,070 16,881 4,988 21,869 - 1
1988 170,451 171,827 - 896 16,403 4,443 20,846 - 2
1989 154,946 155,426 - 420 15,723 3,930 19,653 - -3
1990 139,640 139,700 - 60 15,041 3,436 18,477 - 4
1991 124,663 124,663 - - 14,167 2,952 17,119 - -1
1992 110,495 110,495 - - 11,426 2.545 13,971 - -1
1993 99,068 99,068 - - 10,552 2,201 12,753 - 1
1994 88.517 88,517 - - 9,653 1,909 11,562 -1
1995 78.865 78,865 - - 8,341 1,650 9,991 - 1
1996 70,525 70,525 - - 6,878 1,455 8,333 - 1
1997 63.648 63.648 - - 6,675 1,300 7,975 - -2
1998 56,971 56,971 - - 6,680 1,159 7,839 - 3
1999 50,294 50,294 - - 6 309 1,017 7,326 - -2
2000 43,983 43,983 - - 5.873 886 6,759 - -1
2001 38,109 38,109 - - 5,811 764 6,575 - 1
* THIS COLUMN SHIOWS THE AMOUNT OF ARITHMETIC IMBALANCE IN THE AMOUNT OUlSTANDING INCLUDING UNDISBURSED FROM ONFYEAR TO THE NEXT. THE MOST COMMON CAUSES OF IMBALANCES ARE CHANGES IN EXCHANGE RATES AND TRANSFER OF DEBTS
FROM ONE CATEGORY TO ANOTHER IN fliE TABLE.
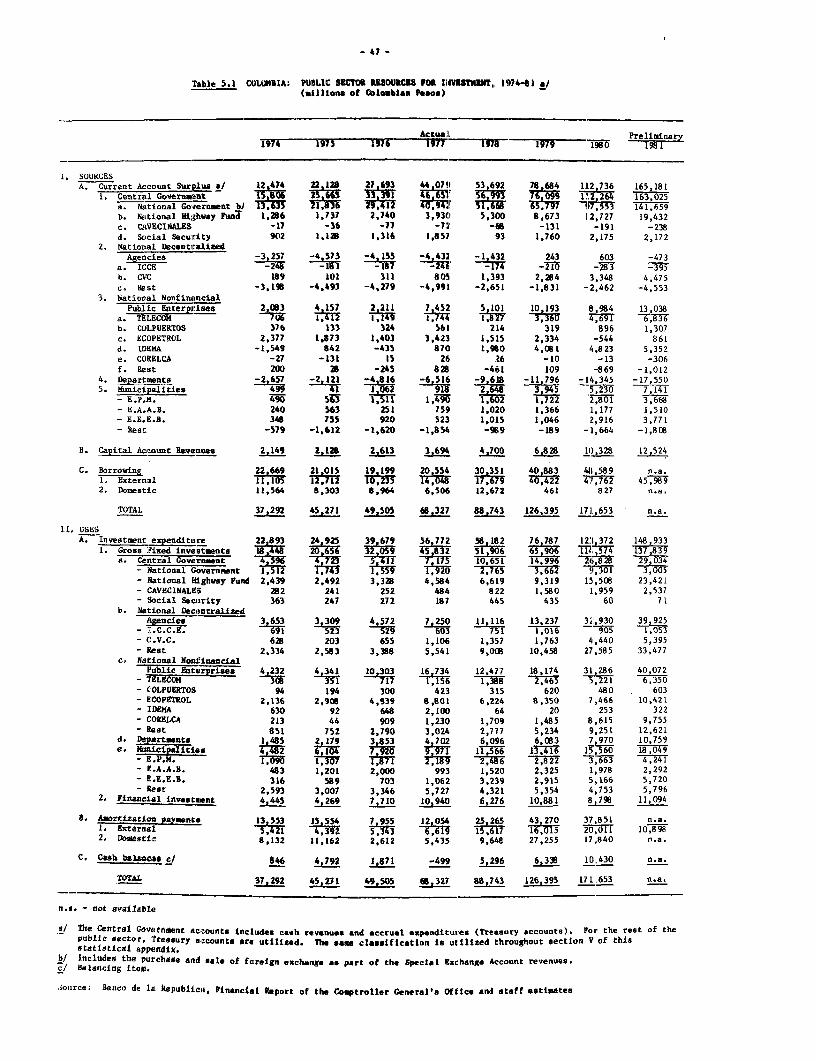
- 47 -
Table 5.1 COLOMIA: PUULIC SEc70 RDISOU8C8S F08 FORIIMs , 1974-81 a/(nillions of Colosblan Pesos)
Actua3_________ Preliminar-y
1974 197S 1976 1977 1999 Peioin
I. SOURCESA. Current Account Surplu a 12 474 22 13 27 693 44 0711 53 692 78 684 112.736 165,181
1. Central Governaent ;I15,8 263S1 U ,61'W 12,264 163,025a. Nitional Government bJ I 11 !T,IU 5 1,66 ' 147, 55 7 16,6j59b. National Highway Fund 1,266 1,737 2,740 1,9311 5,300 8,673 12,127 19,432c. CAVECINALES -17 -36 -77 -71 -68 -131 -191 -238d. Social Secuirity 902 1,132 1,316 1,857 93 1,760 2,175 2,172
2. National DecentralizedAgeicies -3 257 -4 573 -4 155 -4 43 -1,432 243 603 -473
a. ICCE `-248 i- 1 8 1 11J -To -N -395b. CVC 1U9 101 311 805 1,393 2,284 3,348 4,475c. Rest -3,198 -4,493 -4,279 -4,991 -2,651 -1,831 -2,462 -4,553
3. National Nonf inncialPublic Enterp!ises 2 063 4 157 2 211 7.452 5 101 10 193 8,984 13,038
a. TELECOM -7i 1 f T,149 1,744 t!ffT 3 !l~ 360t 6,836b. COLPUERIOS 376 131 324 561 214 319 896 1,307c. ECOPETROL 2,377 1,873 1,403 3,423 1,515 2,334 -544 861d. .UEM -1,549 S42 -435 870 1,980 4,081 4,823 5,352e. CORELCA -27 -131 Is 26 26 -10 -13 -306f. Rest 200 as -245 828 -461 109 -869 -1,012
4. Departments -2.657 -2,121 -4 816 -6 516 -9 618 -11,796 -14,345 -17,5505. Municipalities 499 4 1 . 1,06 2 1 2,648 3,945 5,230 7,141
- E.P.A. 490 363 1,511 1,490 1,602 1,722 2,801 3,668- E.A.A.B. 240 563 251 759 1,020 1,366 1,177 1,510- E.E.E.B. 348 755 920 523 1,015 1,046 2,916 3,771- Rest -579 -1,612 -1,620 -1,854 -989 -189 -1,664 -1,808
B. Capital Account Revenues 2,149 2,128 2,613 3,694 4,700 6.828 10,328 12,524
C. Borrowing 22 669 21 015 19 199 20 554 30 351 40,883 41,589 n.a.1. External 11.iT I0S TN2 10,23S 1T,W 91irii 40,422 4T,762 45,9892. Domestic 11,564 8,303 6,964 6,506 12,672 461 827 n.a.
TOTlAL 37,292 tl 49,505 66,327 88,743 126,395 171,653 n.a.
11L USESA. Investment expenditure 22,893 24 925 39 679 56 772 58 182 76,787 12:1 372 148,933
1. Gross Fixed investments 18 448 20 656 32W 059 41906 65 906 152 137,839a. Central Governaent 5 4 723 5 411 R7 10 651 149 2ti,82 29 034
- National Government 1,512 TT 1 ,5 1,2 3 l1 3,0 0 5- National IHlghvay Fund 2,439 2,492 3,328 4,584 6,619 9,319 15,508 23,421- CAVECIMALES 282 241 252 484 822 1,580 1,959 2,537- Social Security 363 247 272 187 445 435 60 71
b. National DecentralizedAgencies 3,653 3,309 4_572 7,250 11,116 13,237 3i',930 39,925
- T.C.C-.e. 523 § 6 0 3 7t51 1,016 - 0 1,053- C.V.C. 628 203 655 1,106 1,357 1,763 4,440 5,395- Eest 2,334 2,583 3,388 5,541 9,003 10,458 27,585 33,477
c. National Nonf.inancialPublic Enterprises 4,232 4,341 10 303 16,734 12,477 18,174 31,286 40,072
- TELZCOIM 351 77 1,1 6 1,88 2,465 5 6,350- COLPUERTOS 94 194 300 423 315 620 480 603- ECOPETROL 2,136 2,903 4,939 8,801 6,224 8,350 7,466 10,421- IDEMA 630 92 648 2,100 64 20 253 322- CORELCA 213 44 909 1,230 1,709 1,485 8,615 9,755- Rest 851 752 2,790 3,024 2,777 5,234 9,251 12,621
d. Departasts 1,485 2,179 38S53 4 702 6 096 6,083 7 970 10,759e - P. Huiciplitig 4,482 6,104 920 1 ,560 18 1,04 9
- E.P,MI. I , 0 3 1,201 2 2,486 2,822 3, 4,241- E.A.A.B. 483 1,201 2,000 993 1,520 2,325 1,978 2,292- E.a.t.B. 316 589 703 1,062 3,239 2,915 5,166 5,720- Reat 2,593 3,007 3,346 5,727 4,321 5,354 4,753 5,796
2. Pirncial inveatglent 4,445 4,269 7,710 10,940 6,276 10,881 8,798 11,094
1. xtrna io P 13 553 15 554 7 955 12 054 25 265 43,270 37,851 n.s.2. ttseranial 5i 4 3 L. 34 61 1 6T7 16,015 20,011 10,8982. Dowsaesic 8,132 11,162 2,612 5,435 9,648 27,255 17,840 n.a.
C. C"h bal.Ans c/ 846 4,792 1,871 -499 5,296 6,338 10,430 n.a.
TOTAL 37,292 45,271 49,505 6S,327 8$6,743 126,395 171,653 n.a.
0 - not availala
f/ The Central Govearnent accounts includes cash revenues and accrual expenditures (Treasury accounts). For the rest of thepublic sector, Treasury accounts Sre utilized, The sma classification Is utili2ed throughout section V of thisStatlgtical appendix.
b/ lincludes the purchase and sale of foreign exchange as part of the Special lExchange Account revenues./ Bealancing item.
;oiirce: Banco de 1Ig Republica, Pinancial Report of the Comptroller General's Office and staff estimates

- 48 -
Table 5.2 COLOMBIA: ANALYSIS OF CONSOLIDATED PUBLIC SECTOR FINANCFES, 1974-81(millions of Colombian Pesos)
Actual Preliminary1974 1975 1976 1977 1978 1979 1980 1981
CENTRAL GOVERNMENTCurrent revenue 32,282 46,200 59,326 78,664 101,944 140,521 192,905 261,499Current expenditure 16,993 20,248 25,331 31,883 44,548 63,783 84,248 107,463Current account surplus/deficit a/ 14,265 24,667 33,391 46,657 56,993 76,099 112,264 163,025Savings ratio 0.44 0.53 0.56 0.59 0.56 0.54 0.58 0.62Gross fixed investment 4,596 4,723 5,411 7,175 10,651 14,956 26,828 29,034Savings as per cent of gross fixed
investment 310.3 522.2 627.0 650.2 535.1 508.8 418.4 561.4
NATIONAL DECENTRALIZED AGENCIESCurrent revenue 2,098 3,211 4,524 5,133 9,320 14,521 18,994 23,910Current expenditure 5,355 7,784 8,409 9,565 10,752 14,278 18,391 24,383Current account surplus/deficit a/ -3,257 -4,573 -4,155 -4,432 -1,432 243 603 -473Savings ratio -1.55 -1.42 -0.91 -0.86 -0.15 0.01 0.03 -0.02Gross fixed investment 3,653 3,309 4,572 7,250 11,116 13,237 32,930 39,935Savings as per cent of gross fixedinvestment -89.1 -138.1 -90.8 -61.1 -12.8 1.8 1.8 -1.1
NATIONAL NONFINANCIAL PUBLIC ENTERPRISESCurrent revenue 13,559 23,352 32,082 38,698 50,097 74,471 111,748 161,301Current expenditure 11,476 19,195 29,871 31,246 44,996 64,278 102,764 148,263Current account surplus/deficit a/ 2,083 4,157 2,211 7,452 5,101 10,193 8,984 13,038Savings ratio 0.51 0.17 0.06 0.19 0.10 0.13 0.08 0.08Gross fixed investment 4,232 4,341 10,303 16,734 12,477 18,174 31,286 40,072Savings as per cent of gross fixed
investment 49.2 95.7 21.4 44.5 40.8 56.0 28.7 32.5
DEPARTMENTSCurrent revenue 9,059 12,686 15,920 21,737 28,510 35,367 44,844 57,265Current expenditure 11,716 14,807 20,736 28,253 38,128 47,163 59,189 74,815Current account surplus/deficit a/ -2,657 -2,121 -4,816 -6,516 -9,618 -11,796 -14,345 -17,550Savings ratio -0.29 -0.16 -0.30 -0.30 -0.33 -0.33 -0.32 -0.30Gross fixed investment 1,485 2,179 3,853 4,702 6,096 6,083 7,970 10,759Savings as per cent of gross fixedinvestment -178.9 -97.3 -124.9 -138.5 -157.7 -193.9 -179.9 -163.1
MUNICIPALITIESCurrent revenue 9,467 11,999 15,414 19,890 25,666 33,109 44,697 57,659Current expenditure 8,968 11,958 14,352 18,972 23,018 29,164 39,467 50,518Current account surplus/deficit a/ 499 41 1,062 918 2,648 3,945 5,230 7,141Savings ratio 0.05 - 0.06 0.04 0.10 0.11 0.11 0.12Gross fixed investment 4,482 6,104 7,920 9,971 11,566 13,416 15,560 18,049Savings as per cent of gross fixedinvesment 11.1 0.6 13.4 9.2 22.8 29.4 33.6 39.5
CONSOLIDATED PUBLIC SECTORCurrent revenue 66,157 97,070 126,922 163,576 215,537 297,989 413,188 561,634Current expenditure 54,290 73,725 98,337 119,501 161,442 218,666 304,059 405,442Adjustment for intrapublic sector
current transfers 8,073 5,641 5,874 8,563 8,874 11,673 21,827 6,523Current account surplus/deficit b/ 19,006 27,812 33,837 52,642 62,969 90,996 130,956 1L62,715Savings ratio 0.28 0.28 0.26 0.32 0.29 0.30 0.32 0.29Capital revenue 2,149 2,128 2,613 3,694 4,700 6,828 10,328 12,524Gross fixed investment 18,448 20,656 32,059 45,832 51,906 65,906 114,574 137,839Savings as per cent of gross fixedinvestment 103.0 134.6 105.5 114.8 136.3 138.1 114.2 118.0
Financial investment 4,445 4,269 7,710 10,940 6,276 10,881 8,798 11,094Adjustment for intrapublic sectorcapital transfers -8,224 -15,268 -9,796 -7,565 -19,869 -24,988 -39,080 -56,463
Overall surplus or deficit -9,962 -10,253 .-13,115 -8,001 -10,382 -3,951 -21,168 -30,157
FINANCING 9,962 10,253 13,115 8,001 10,382 3,951 21,168 30,1571. External (net) 5,684 8,320 4,892 7,429 2,062 24,407 27,751 35 091
- Borrowing 11,105 12,712 10,235 14,048 17,679 40,422 47,762 4598- Amortization 5,421 4,392 5,343 6,619 15,617 16,015 20,011 10,898
2. Domestic (net) 3,432 -2,859 6,352 1,071 3,024 -26,794 -17,013 n.a.- Borrowing 11,564 8,303 8,964 6,506 12,672 461 827 n.a.- Amortization 8,132 11,162 2,612 5,435 9,648 27,255 17,840 n.a.
3. Cash balance 846 4,792 1,871 -499 5,296 6,338 10,430 n.a.
a/ Before public sector transfers.b/ Includes adjustments due to discrepancies related to Social Security contributions.
Source: Financial Report of the Comptroller General's Office and Ministry of Finance

Table 5.3 COLOMBIA: CENTRAL COVERNMF1NT OPERATIONS 1974-RI(millions of Colombian Pesos)
Preliminary1974 1975 1976 1977 1978 1979 1980 1981
Current revenue 32,282 46,200 59,326 78,664 101,944 140,521 192,905 261,4991. S.S.C. from public sector 308 378 344 546 255 472 440 5612. Tax revenue 26,253 38,693 50,394 65,332 85,324 118,332 160,919 218,3383. Nontax revenue 5,721 7,129 8,588 12,786 16,365 21,717 31,546 42,600
Current expenditure 16,993 20,248 25,331 31,883 44,539 63,783 84,248 107,4631. Wages and salaries 10,237 11,249 12,793 15,016 21,583 28,878 37,117 45,5762. Purchases of goods & services 2,441 3,140 4,474 5,916 7,791 11,997 15,336 18,2613. Interest 1,721 2,308 3,215 3,239 3,566 5,195 8,043 9,8564. Transfers to private sector 2,594 3,551 4,849 7,712 11,599 17,713 23,752 33,750
& other
Adjustments a/ -1,024 -1,285 -604 -124 -403 -639 3,607 8,989
Savings generated 14,265 24,667 33,391 46,657 56,993 76,099 112,264 163,025
Public sector transfers (net) -4,655 -7,754 -12,226 -17,564 -24,985 -36,774 -49,378 -86,7431. From rest of public sector 155 50 51 30 19 82 14 222. To rest of public sector 4,810 7,804 12,277 17,594 25,004 36,856 49,392 86,765
Current account surplus or deficit 9,610 16,913 21,155 29,093 32,008 39,325 62,886 76,282
Other revenue 1,309 1,135 1,276 1,716 1,791 3,147 3,152 3,750
Capital expenditure 16,187 18,900 18,631 25,508 32,859 42,602 76,000 90,9141. Fixed capital formation 4,596 4,723 5,411 7,175 10,651 14,956 26,828 29,0342. Financial investment 1,884 2,618 2,364 4,062 4,004 5,353 5,833 7,1263. Capital transfers 9,707 11,559 10,856 14,271 18,204 22,293 43,339 54,754
Aditirtmenta b/ -29 -24 -28 -26 -67 -79 -235 -33R
Overall Surplus/Deficit -5,297 -876 3,782 5,275 873 -209 -10,197 -11,220
a/ Discrepancies related to Social Security contributions of the National Government.h/ Due to intra-public sector transfers.
Note: Central Government includes the National Government, the National Highway Fund, Cavecinales and Social SecurityInstitutions.
Source: Banco de la Republica, Financial report of the Comptroller General's Office and staff estimates
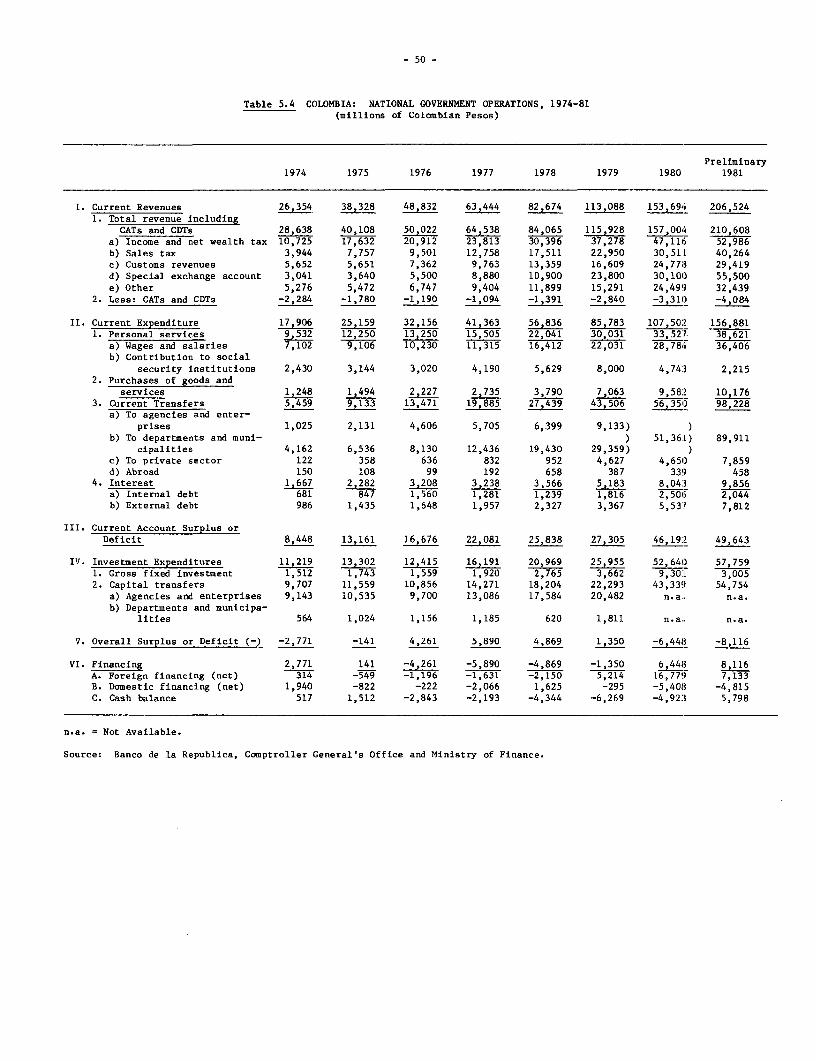
- 50 -
Table 5.4 COLOMBIA: NATIONAL GOVERNMENT OPERATIONS, 1974-81(millions of Colombian Pesos)
Preliminary1974 1975 1976 1977 1978 1979 1980 1981
1. Current Revenues 26,354 38,328 48,832 63,444 82,674 113,088 153,694 206,5241. Total revenue including
CATs and CDTs 28,638 40,108 50,022 64,538 84,065 115,928 157,004 210,608a) Income and net wealth tax 10,725 17,632 20,912 23,813 30,396 37,278 47,116 52,986b) Sales tax 3,944 7,757 9,501 12,758 17,511 22,950 30,511 40,264c) Customs revenues 5,652 5,651 7,362 9,763 13,359 16,609 24,7713 29,419d) Special exchange account 3,041 3,640 5,500 8,880 10,900 23,800 30,100 55,500e) Other 5,276 5,472 6,747 9,404 11,899 15,291 24,499 32,439
2. Less: CATs and CDTs -2,284 -1,780 -1,190 -1,094 -1,391 -2,840 -3,310 -4,084
II. Current Expenditure 17,906 25,159 32,156 41,363 56,836 85,783 107,502 156,8811. Personal services 9,532 12,250 13,250 15,505 22,041 30,031 33,527 38,621
a) Wages and salaries 7,102 9,106 10,230 11,315 16,412 22,031 28,784 36,406b) Contribution to social
security institutions 2,430 3,144 3,020 4,190 5,629 8,000 4,74:3 2,2152. Purchases of goods and
services 1,248 1,494 2,227 2,735 3,790 7,063 9,582 10,1763. Current Transfers 5,459 9,133 13,471 19,885 27,439 43,506 56,350 98,228
a) To agencies and enter-prises 1,025 2,131 4,606 5,705 6,399 9,133)
b) To departments and muni- ) 51,361) 89,911cipalities 4,162 6,536 8,130 12,436 19,430 29,359)
c) To private sector 122 358 636 832 952 4,627 4,650 7,859d) Abroad 150 108 99 192 658 387 339 458
4. Interest 1,667 2,282 3,208 3,238 3,566 5,183 8,043 9,856a) Internal debt 681 847 1,560 1,281 1,239 1,816 2,5065 2,044b) External debt 986 1,435 1,648 1,957 2,327 3,367 5,537 7,812
III. Current Account Surplus orDeficit 8,448 13,161 16,676 22,081 25,838 27,305 46,192 49,643
IV. Investment Expenditures 11,219 13,302 12,415 16,191 20,969 25,955 52,640 57,7591. Gross fixed investment 1,512 1,743 1,559 1,920 2,765 3,662 9,301 3,0052. Capital transfers 9,707 11,559 10,856 14,271 18,204 22,293 43,339 54,754
a) Agencies and enterprises 9,143 10,535 9,700 13,086 17,584 20,482 n.a.. n.a.b) Departments and municipa-
lities 564 1,024 1,156 1,185 620 1,811 n.a. n.a.
V. Overall Surplus or Deficit (-) -2,771 -141 4,261 5,890 4,869 1,350 -6,448 -8,116
VI. Financing 2,771 141 -4,261 -5,890 -4,869 -1,350 6,448 8,116A. Foreign financing (net) 314 -549 -1,196 -1,631 -2,150 5,214 16,779 7,133B. Domestic financing (net) 1,940 -822 -222 -2,066 1,625 -295 -5,408 -4,815C. Cash balance 517 1,512 -2,843 -2,193 -4,344 -6,269 -4,92:3 5,798
n.a. = Not Available.
Source: Banco de la Republica, Comptroller General's Office and Ministry of Finance.

- 51 -
Table 5.5 COLOMBIA: NATIONAL GOVERNMENT REVENtlES, 1974-81(millions of Colombian Pesos)
Actual Preliminary1974 1975 1976 1977 1978 1979 1980 1981
TTotal Revenue Including CATS and CDTs 28,638 40,108 50,022 64,358 84,065 115,928 157,004 210,608
A) Taxes on Income and Property 11,259 17,885 21,050 23,944 30,538 37,440 47,315 53,1831. Income and net wealth tax 10,725 17,633 20,912 23,813 30,396 ;7,278 47,116 52,9862. Other 534 252 138 131 142 162 199 197
a) Inheritance and gift taxes (380) (218) (104) (90) (97) (108) (136) (121)b) Cattle tax (125) - - - (-) () () ()c) Tax on land property (29) (34) (34) (41) (45) (54) (63) (76)
3) Taxes on Foreign Trade 8,697 9,293 12,862 18,563 24,259 41,760 60,066 90,5721. Customs 4,846 5,308 7,362 9,763 13,359 16,609 24,778 29,4192. Three percent import
surcharge a/ 801 341 - - - 1,350 1,968 2,409
3. Special exchange account 3,040 3,640 5,500 8,800 10,900 23,800 30,100 55,500a) Coffee exporL tax (1,982) (2,364) (4,257) (6,604) (7,825) (8,496) (10,152) (7,090)b) Others b/ (1,058) (1,271) (1,243) (2,196) (3,075) (15,304) (19,948) (48,410)
4. Others c/ 5 2 - - - 1 3,220 3,244
C) Taxes on Domestic Consumptionand Transactions 7,340 11,608 15,019 20,127 27,168 34,718 46,587 63,012
_~~~~~~~~~~~~~~~~~§,50 2 - _ -- 4,261. Sales tax 3,944 7,757 9,501 12,758 17,511 22,950 30,511 40,2642. Gasoline tax 1,546 1,726 1,208 4,491 5,860 8,013 11,333 18,0903. Stamp taxes 1,791 1,658 1,748 2,176 2,877 3,177 4,732 4,6414. Service tax (pro turismo) 59 77 100 141 178 - 11 175. Liquor sales tax - 390 462 561 742 578 - -
D) Nontax Revenue 1,347 1,324 1,091 1,904 2,100 2,010 3,036 3,8411. Fees and fines 962 942 830 1,709 1,814 1,529 2,342 2,7402. Royalties and contractual
income 385 382 261 195 286 481 694 1,101a) Shar-e in petroleum
explorationi (205) (85) (63) (59) (91) n.a. n.a. n.a.b) Other (180) (297) (198) (136) (195) n.a. n.a. n.a.
.ess: Tax Credits Certificates di -2,284 -1,780 -1,190 -1,094 -1,391 -2,840 -3,310 -4,084
Total Current Revenue 26,354 38,328 48,832 63,444 82,674 113,088 153,694 206,524
a/ Beginning in 1975, resources Earmarked for PROEXPO are transferred directly.'I/ Includes tratnsfers of profits from the Banco de la Republica, earnings on international reserves and gains from foreign
exchange transactions.,:/ Includes 4% ad valorem tax on coffee in 1980 and 1981.1/ CATs and CDOTs.
Source: Banco cle la Repuiblica, Ccmptroller General's Office and Ministry of Finance

Table 5.6 COLOMBIA: TAX BURDEN, 1972-81 a/(percent of GDP)
1972 1973 1974 1975 1976 1977 1978 1979 1980 1981
Total Revenue IncludingCATs and CDTs 9.3 9.0 8.7 9.7 9.3 9.0 9.2 9.7 9.9 10.5
A) Taxes on Income and Property 4.3 3.8 3.4 4.3 3.9 3.3 3.3 3.1 3.0 2.71. Income and net wealth tax 4.1 3.6 3.3 4.3 3.9 3.3 3.3 3.1 3.0 2.62. Other 0.2 0.2 0.1 - - - - - - -
B) Taxes on Foreign Trade 2.2 2.5 2.6 2.4 2.4 2.6 2.6 3.5 3.8 4.51. Customs 1.5 1.5 1.5 1.4 1.4 1.4 1.4 1.4 1.6 1.52. Three percent import
surcharge 0.2 0.2 0.2 0.1 - - - 0.1 0.1 0.13. Special exchange account 0.5 0.8 0.9 0.9 1.0 1.2 1.2 2.0 1.8 2.74. Other - - - - - - - - 0.3 0.2 M
C) Taxes on Domestic Consumptionand Transactions 2.4 2.2 2.2 2.8 2.8 2.8 2.9 2.9 2.9 3.1
1. Sales tax 1.0 1.0 1.2 1.9 1.8 1.8 1.9 1.9 1.9 2.02. Gasoline tax 0.7 0.6 0.5 0.4 0.6 0.6 0.6 0.7 0.7 0.93. Stamp taxes 0.7 0.6 0.6 0.4 0.3 0.3 0.3 0.3 0.3 0.24. Service tax (pro turismo) - - - - - - - - - -5. Liquor sales tax - - - 0.1 0.1 0.1 0.1 - - -
D) Nontax Revenue 0.4 0.5 0.4 0.3 0.2 0.3 0.3 0.2 0.2 0.2
Less: Tax Credit Certificates -0.6 -0.6 -0.7 -0.4 -0.2 -0.2 -0.2 -0.2 -0.2 -0.2
Total Current Revenue 8.7 8.4 8.0 9.3 9.1 8.8 9.0 9.5 9.7 10.3
a/ Differences d-ue to rounding.
Source: Tables 5.5 and 2.3

Table 5.7 COLOMBIA: BUOYANCIES WITH RESPECT TO GDP OF NATIONAL GOVERNMENT REVENUE - 1974-Rl(millions of Colombian Pesos)
Actual Preliminary1974 1975 1976 1977 1978 1979 1980 1981
Total Revenue IncludinR CATS and CDTs 0.89 1.58 0.84 0.83 1.11 1.25 1.09 1.28
A) Taxes on Income and Property 0.64 2.32 0.60 0.40 1.00 1.23 0.81 0.471. Income and net wealth tax 0.63 2.53 0.63 0.40 0.54 1.23 0.81 0.452.. OELer 0.5J7 -2.08, -J.54 ) -0..o1 j.1 1.;4 0.70 -0.04
a) Inheritance and gift taxes 1.36 -1.68 -1.78 0.39 0.29 1.11 0.80 -0.41b) Cattle tax -0.25 - - - - - - -
c) Tax on land property 0.10 0.68 - 0.60 0.35 1.20 0.51 0.77
B) Taxes on Foreign Trade 1.16 0.27 1.31 1.28 1.11 1.72 1.35 1.911. Customs 0.87 0.37 1.32 0.94 1.33 1.24 1.51 0.702. Three percent import
surcharge 2.20 -2.26 - - - - 1.41 0.843. Special exchange account 1.47 0.78 1.74 1.74 0.87 2.18 0.81 3.174. Other -0.47 0.79 - - - - - 0.03
C) Taxes on Domestic.Consumption andTransactions 1.07 2.29 1.00 0.98 1.27 0.91 1.05 1.33
1. Sale5 Lax 1.,1I J.ol 0.76 V.77 I.JJ L.Vj ;.O1 1.zI
2. Gasoline tax 0.18 0.46 2.38 1.16 1.10 1.21 1.41 1.603. Stamp taxes 0.86 -0.29 0.18 0.71 1.17 0.34 1.49 -0.084. Service tax (pro turismo) 1.05 1.20 1.02 1.19 0.95 - e 2.05K. Liquor sales -ax - - 0.63 - 1.17 -0.73 - -
D) Nontax Revenue 0.53 -0.06 -0.60 2.16 0.37 -0.14 1.51 1.001. Fees and fines 0.50 -0.08 -0.40 3.07 0.22 -0.52 1.53 0.642. Royalties and contractual income 0.61 -0.03 -1.08 -0.73 1.69 2.24 1.44 2.20
a) Share in petroleum exploration 1.29 -2.30 0.88 -0.18 1.96 n.a. n.a. n.a.b) Other 0.06 2.56 -1.13 -0.91 1.57 n.a. n.a. n.a.
Less: Tax Credits Certificates 1.61 -0.87 -1.13 -0.23 0.98 3.43 1.16 0.88
Total Current Revenue 0.83 1.79 0.93 0.87 1.10 1.21 1.36 1.29
n.a. - not available
Source: Tables 5.5 and 2.3
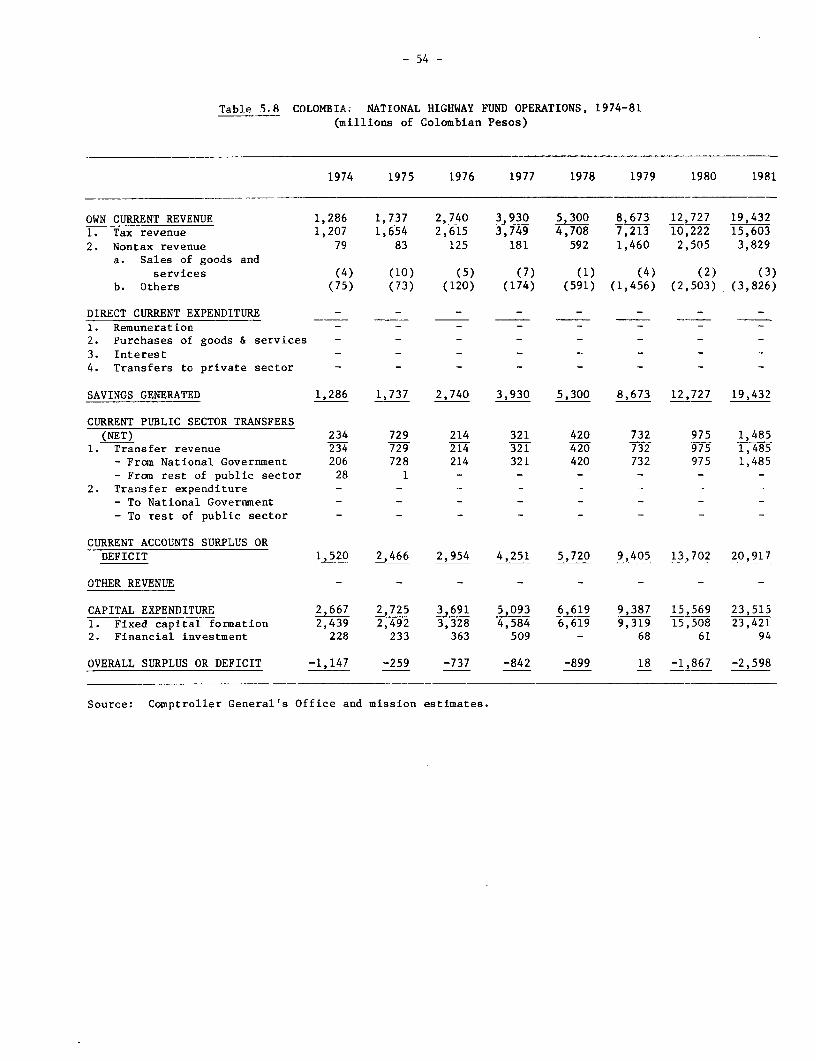
- 54 -
Table 5.8 COLOMBIA: NATIONAL HIGHWAY FUND OPERATIONS, 1974-81(millions of Colombian Pesos)
1974 1975 1976 1977 1978 1979 1980 1981
OWN CURRENT REVENUE 1,286 1,737 2,740 3,930 5,300 8,673 12,727 19,4321. Tax revenue 1,207 1,654 2,615 3,749 4,708 7,213 10,222 15,6032. Nontax revenue 79 83 125 181 592 1,460 2,505 3,829
a. Sales of goods andservices (4) (10) (5) (7) (1) (4) (2) (3)
b. Others (75) (73) (120) (174) (591) (1,456) (2,503) (3,826)
DIRECT CURRENT EXPENDITURE - - - - - - - -
1. Remuneration - - - -2. Purchases of goods & services - - - - - - - -
3. Interest - - - - -- - -
4. Transfers to private sector - - - - - - - -
SAVINGS GENERATED 1,286 1,737 2,740 3,930 5,300 8,673 12,727 19,432
CURRENT PUBLIC SECTOR TRANSFERS(NET) 234 729 214 321 420 732 975 1,485
1. Transfer revenue 234 729 214 321 420 732 975 1,485- From National Government 206 728 214 321 420 732 975 1,485- From rest of public sector 28 1 - - - - - -
2. Transfer expenditure - -
- To National Government - - - - _ _ _ _- To rest of public sector - - - - - - - -
CURRENT ACCOUNTS SURPLUS ORDEFICIT 1,520 2,466 2,954 4,251 5,720 9,405 13,702 20,917
OTHER REVENUE - - - - - - - -
CAPITAL EXPENDITURE 2,667 2,725 3,691 5,093 6,619 9,387 15,569 23,5151. Fixed capital formation 2,439 2,492 3,328 4,584 6,619 9,319 15,508 23,4212. Financial investment 228 233 363 509 - 68 61 94
OVERALL SURPLUS OR DEFICIT -1,147 -259 -737 -842 -899 18 -1,867 -2,598
Source: Comptroller General's Office and mission estimates.

- 55 -
Table 5.9 COLOMBIA: CAVECINALES OPERATIONS, 1974-81(millions of Colombian Pesos)
1974 1975 1976 1977 1978 1979 1980 1981
O'WN CURRENT REVENUE 44 41 49 56 61 77 46 621. Tax revenue 34 33 38 4342 41 39 522. Nontax revenue 10 8 11 13 29 36 7 10
a. Sales of goods andservices (-) (-) C-) (-) (1) (26) (-) (-)
b. Others (10) (8) (11) (13) (28) (10) (7) (10)
DIRECT CURRENT EXPENDITURE 61 77 126 128 129 208 237 3001. Remuneration 39 50 64 66 67 94 116 1472. Purchases of goods & services 21 24 43 46 51 96 56 723. Interest - - - - - - -
4. Transfers to private sector 1 2 19 16 11 18 65 81
SAVINGS GENERATED -17 -36 -77 -72 -68 -131 -191 -238
CUtRENT PUBLIC SECTOR TRANSFERS(NET) 275 218 341 336 484 1,066 1,247 1,653
1. Transfer revenue 281 226 344 345 495 1,080 1,270 1,683From National Government (178) (177) (293) (315) (476) f998) (1,256) (1,661)
- From rest of public sector (103) (49) (51) (30) (19) (82) (14) (22)2. Transfer expendituare 6 8 3 8 11 14 23 30
- To National Government (3) (4) (-) (5) (6) (8) (10) (13)- To rest of public sector (3) (4) (3) (4) (5) (6) (13) (17)
CIDRRENT ACCOUNTS SURPLUS ORDEFICIT 258 182 264 264 416 935 1,056 1,415
OTHER REVENUE - - - - 2 - - -
CAPITAL EXPENDITURE 286 244 260 489 822 1,580 1,959 2,5371. Fixed capital fonaation 282 241 2 52 484 822 1,580 1,959 2,5372. Financial investment 4 3 8 5 - - - -
OVERALL SURPLUS OR DEFICIT -28 -62 4 -225 -406 -645 -903 -1,122
Source: Comptroller General's Office and mission estimates.

Table 5n10 COLOMBIA: SOCIAL SECURITY SYSTEMS OPERATIONS a/, 1974-31
(millions of Colombian Pesos)
PrelimInari
1974 1975 1976 1977 1978 1979 1980 1981
I. OWN CURRENT REVENUES 5,997 7,951 10,121 15,300 19,125 26,044 34,788 46,685
1. Social Security contributions 1,712 2,237 2,760 4,612 5,481 7,833 8,790 11,765
a) National Government (1,404) (1,859) (2,416) (4,066) (5,226) (7,361) (18,350) (11,204)
b) Rest of Public sector (308) (378) (344) (546) (255) (472) (440) (561)
2. Sale of goods and services 156 204 280 428 552 562 369 513
3. Other current revenues 4,129 5,510 7,081 10,260 13,092 17,649 25,629 34,407
II. DIRECT CURRENT EXPENDITURE 5,095 6,823 8,805 13,443 19,032 24,284 32,613 44,513
1. Remunerations 1,548 2,093 2,499 3,635 5,104 6,753 8,217 11,128
2. Purchases of goods and
services 1,172 1,622 2,204 3,135 3,950 4,838 5,698 8,013
3. Interest 54 25 7 1 -- 12 -- --
4. Transfers to private sector 2,321 3,083 4,095 6,672 9,978 12,681 18,698 25,372
IIIa. SAVINGS GENERATED 902 1,128 1,316 1,857 93 1,760 2,175 2,172
IIIb. CURRENT PUBLIC SECTOR TRANSFERS(NET) -30 -58 -73 -106 -127 -167 -470 -678 1
1. Transfer revenues -- -- -- -- -- -- -- L
a) From National Government (--) (--) (--) (-) (-) (--) (-) (--)
b) From rest of public sector (--) (-) (--) (--) (--) (--) (--) (--)
2. Transfer expenditure 30 58 73 106 127 167 470 678
a) To National Government (26) (20) (28) (21) (61) (71) (225) (325)
b) To rest of public sector (4) (38) (45) (85) (66) (96) (245) (353)
IIIc. CURRENT ACCOUNT SURPLUS OR DEFICIT 872 1,070 1,243 1,751 -34 1,593 1,705 1,494
IV. OTHER REVENUE 1,309 1,135 1,276 1,716 1,789 3,147 3,152 3,750
V. CAPITAL EXPENDITURE 2,015 2,629 2,265 3,735 4,449 5,720 5,832 7,112
1. Fixed capital formation 363 247 272 187 445 435 60 71
2. Financial investment 1,652 2,382 1,993 3,548 4,004 5,285 5,772 7,032
VI. OVERALL SURPLUS OR DEFICIT 166 -424 254 -268 -2,694 -980 -975 -1,859
VII. FINANCING -166 424 -254 268 2,694 980 975 1,859
1. External - -- - -- -- -- - --
2. Domestic 5 -- -- -- -- -- -- --
3. Cash balance -171 424 -254 268 2,694 980 975 1,859
a/ Includes CAPRECOM, CAJANAL, ISS, Caja de Prevision Social de la Superintendencia Bancaria, Caja de Sueldos de Retiros de
las Fuerzas Militares y Caja de Sueldos de Retiros de la Policia Nacional.
Source: Comptroller General's Office and mission estimates
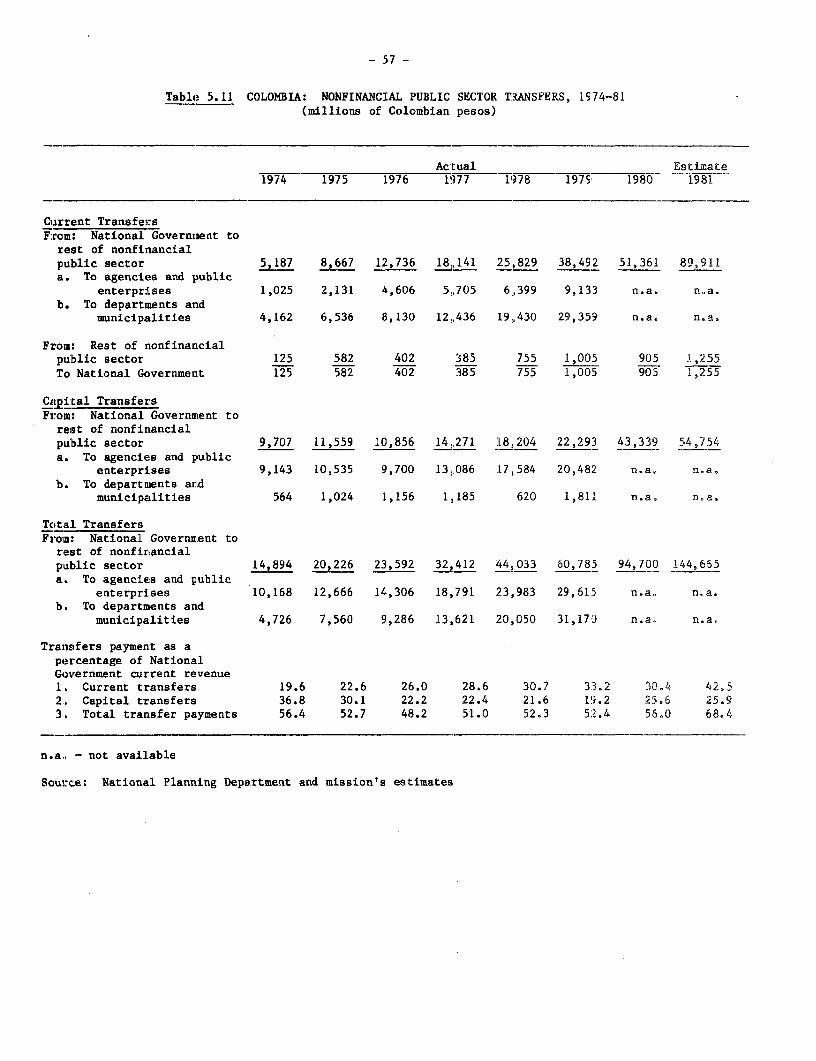
-57 -
Table 5.11 COLOMBIA: NONFINANCIAL PUBLIC SECTOR TRANSFERS, 1S74-81(millions of Colombian pesos)
Actual _ Estimate1974 1975 1976 1977 1978 1979 1980 1981
Current TransfersFrom: National Governmnent to
rest of nonfinancialpublic sector 5,187 8,667 12,736 18,141 25,829 38,492 51,361 89,911a. To agencies and public
enterprises 1,025 2,131 4,606 5,705 6,399 9,133 n.a. n.a.b. To departments and
municipalities 4,162 6,536 8,130 12,436 19,430 29,359 n.a. n.a.
From: Rest of nonfinancialpublic sector 125 582 402 385 755 1,005 905 1,255To National Government 125 582 402 385 755 1,005 905 1,255
Cagital TransfersFrom: National Government to
rest of nonfinancialpublic sector 9,707 11,559 10,856 14,271 18,204 22,293 43,339 54,754a. To agencies and public
enterprises 9,143 10,535 9,700 13,086 17,584 20,482 n.a. n.a.b. To departments and
municipalities 564 1,024 1,156 1,185 620 1,811 n.a. n.a.
TotaL TransfersFrom: National Governmtent to
rest of nonfinancialpublic sector 14,894 20,226 23,592 32,412 44,033 60,785 94,700 144,665a. To agencies and public
enterprises 10,168 12,666 14,306 18,791 23,983 29,615 n.a. n.a.b. To departments and
municipalities 4,726 7,560 9,286 13,621 20,050 31,17) n.a. n.a.
Transifers payment as apercentage of NationalGovernment current revenue1. Current transfers 19.6 22.6 26.0 28.6 30.7 33.2 30.4 42.52., Capital transfers 36.8 30.1 22.2 22.4 21.6 19.2 25.6 25.93, Total transfer payments 56.4 52.7 48.2 51.0 52.3 5,2.4 5560 68e4
n.a,. - not available
Source: National Planning Department and mission's estimates

- 58 -
Table 5.11-1 0)LaLIA: NTIONAL GDVENT CCURRENT TRANSFERS REBEIVED BY IHE RESI OF NOD AIALPUBLIC SE(CR, 1974-81 a/
(millions of Colanbian pesos)
Actual Prelimary1974 1975 1976 1977 1978 1979 1980 1981
1. T¶IAL RECEIVED 12,851 14,577 18,037 24,149 33,901 48,236 72,371 94,881
2. NATIONAL 1ECENrRALIZEDACEN_IS 4,993 7,183 6,240 8,330 12,350 16,702 31,201 36,730
- ICBF 146 132 28 599 646 705 969 1,140- INOxA 393 470 567 466 579 32 1,032 1,215- ICA 397 363 437 547 7EB 947 1,547 1,821- HIMAT 45 48 63 112 392 597 973 1,145- cvc 38 259 165 145 1811 233 1,159 1,364- ICEL 616 895 689 519 1,235 2,370 6,019 7,084- FN 192 208 263 366 188 393 852 1,002- FAN 189 57 207 119 86 9 1,204 1,417- SENA 8 2 9 20 147 146 310 364- Universidad Nacional de
Colanbia 421 600 660 937 1,283 1,761 2,309 2,718- ICCE 204 585 401 759 859 659 1,183 1,392- lPErC 70 94 124 175 21.3 345 374 440- INSFOPAL 194 522 672 663 790 1,040 1,683 1,981- Instituto Geografico
'Agustin Codazzi" 181 238 258 358 505 768 1,052 1,238- Fordo Irmuebles Nacionales n.a. 138 166 n.a. 227 474 716 842- Rest 1,899 2,572 1,531 2,545 4,236 6,223 9,819 11,567
3. NONFINANCIAL PUBLICE'IERPRISES 2,118 601 1,119 663 989 4,011 7,653 11,794
-TEIEO- - - -
- ECOPETRL - - - - -
- IIEMA 1,711 30 -- C01IPE1F - - - - - - - -
- O0RELC0 b/ 72 244 472 127 696 1,538 3,108 4,786- National Ral-ways 280 248 531 417 1 1,500 2,226 3,428-ISA - - - - 168 821 1,982 3,052- Rest 55 79 116 119 124 152 337 528
4. lEPAmE1 4,952 5,108 8,283 11,766 16,199 20,141 27,944 39,117
5. MUNICIPALITIES 788 1,685 2,395 3,390 4,363 7,382 5,573 7,240
a/ T1e infomation originates frau the iradividual accouts of each agrcy, enterprise, depa:rtnent andmunicipality. Statistical discreparcies between the above figures ani those includecd in ithe sLmiaryaccmmts of the National Goverrment have been treatal as adjustments for the purpose ofconsolidation of the nornfinancial public sector.
b/ Does not include the gas subsidy.
Source: Financial Report to the Canptroller's General Office

- 59 -
Table 5.12 COLOMBIA: NATIONAL DECENTRALIZED AGENCIES OPERATIONS, 1974-31(millions of Colombian Pescs) a/
Actual Preliminary1974 1975 1976 1977 1978 1979 1980 1981
OWN CURRENT REVENUES 2,098 3,211 4,524 5,133 9,320 14,321 18,994 23,9101. Sale of goods and services 1,512 1,817 2,247 2,834 3,656 5,231 6,817 8,5832. 01:her current revenue 586 1,394 2,007 2,299 5,664 9,290 12,177 15,327
CURRE]T EXPENDITURES 5,355 7,784 8,409 9,565 10,752 14,278 18,391 24,3831. Personal services 2,688 2,980 4,105 5,438 6,212 8,293 10,994 13,852
a Remuneration (2,571) (2,828) (3,865) (5,160) (5,925) (7,982) (10,841) (13,658)b. Social security contributions (117) (152) (240) (278) (287) ('311) (513) (194)
2. Purchases of goods and services 1,634 2,644 2,162 3,174 2,674 3,725 4,610 6,5663. Interest 827 1,923 1,798 597 1,357 1,542 1,589 2,2584. T-ansfers to private sector 206 237 344 356 509 718 1,198 1,707
SAVINGS GENERATED -3,257 -4,573 -4,155 -4,432 -1,432 243 603 -473
CURRENT PUBLIC SECTOR TRANSFERS (NET) 4,377 6,154 5,936 8,376 12,220 16,'553 30,817 35,9301. Transfer revenue 5,016 7,190 6,259 8,657 12,596 17,007 31,444 36,663
a. From National Government (4,993) (7,183) (6,240) (8,330) (12,350) (16,'02) (31,201) (36,370)bo From rest of nonfinancial
public sector (23) (7) (19) (327) (246) (305) (243) (293)c. From financial institutions (-) (-) (-) (-) (-) () () (-)
2. Transfer expenditure 639 1,036 323 281 376 454 627 733a To National Government (69) (218) (302) (188) (239) (250) (295) (344)b. To rest of nonfinancial
public sector (568) (818) (21) (93) (31) 157) (52) (62)c. To financial institutions (2) (-) (-) (-) (106) (147) (280) (327)
CURRENT ACCOUNT SURPLUS OR DEFICIT 1,120 1,581 1,781 3,944 10,788 16,796 31,420 35,457
OTHER REVENUE 306 461 309 490 690 9'58 2,064 1,780
CAPITAL EXPENDITURE 4,729 4,721 5,756 10,071 13,668 20,092 35,210 42,7011. Fixed capital formation 3,653 3,309 4,572 7,250 11,116 13,237 32,930 39,9252. Financial investment 474 942 740 2,301 1,810 3,952 889 1,0673. Capital transfers 602 470 444 520 742 3,;03 1,391 1,709
ADJUSIMENTS -184 -236 10 1,618 72 40 24 18
OVERALL SURPLUS OR DEFICIT -3,487 -2,915 -3,965 -4,019 -2,190 -3,138 -1,726 -5,446
FINANCING 3,487 2,915 3,965 4,019 2,190 3,138 1,726 n.a.L. Eitternal (net) -230 420 510 L,701 -437 452 -997 n.a.2. Dcm,estic (net) -2,423 -5,514 -13,144 L,657 456 -20 -361 n.a.3. Cash balances 6,140 8,009 16,599 661 2,171 2,106 3,084 n.a.
a/ Includes: ICBF, FNBS, Instituto Casas Fiscales del Ejercito, DCC, INCORA, ICA, HIMAT, INDERENA, CVC, CAR, CUS, CDMB,CRAMSA, COURABA, ICEL, IAN, INGEOMINAS, Fondos Rotatorics de Advanas Aramada, Fuerza Aerea, Policia, Ejercito, Justicia yEstadistica, Fondo Nacional Hospitalano, INAS, Instituto Nacional de Cancerologia, INTRA, FAN, SENA, Universidad Nacional,ICCE, COLDEPORTES, ICFES, Universidad Industrial Santander, COLCULTURA, Universidades de Cartagena, Atlantico, PedagogioNacional, Cauca, Caldas, Pereira, Tolisa, Quindio, Cordoba, Magdalena, Surcolombiana, Fondo Ca;acitacion de Inravision,Insitituto Caro y Cuerro, Instituto Colombiano de Cultura Hispanica, CoLegio Boyaca, INSOR, INCCMEX, Instituto GeograficaA. Cadazzi, CNT, INSFOPAL, Fondo Iimubles Nacionales, CIAF, AUDIOVISUALES, Fondo Nacional Notariado, Fondo RotarorioValorizacion y Hospital Militar Cenitral.

60 - Palle 1 of 8
Table 5.12-1 COLOMBIA: SUMKARY ACCOUNTS OF MAJOR NATIONAL DECENTRALIZEDAGENCIES OPERATIONS, 1974-81(millions of Colombian Pesoa)
Actual Preliminary1974 1975 1976 1977 1978 1979 1980 1981
1. ICBF
I. OWN CURRENT REVENUES 12 7 182 150 359 2,486 3,763 4,734Sale of goods and services - - 74 - 260 225 - -
Other current revenuea 12 7 108 150 99 2,261 3,763 4,734
II. DIRECT CURRENT EXPENDITURES 264 1,070 465 1,112 327 339 451 598Personal services 16 205 282 486 75 Tl 277 350Purchases of goods and
services 58 74 102 602 137 120 156 222Interest payments - 732 19 - 15 - - -Current transfers to private
sector 11 14 62 24 - 6 18 26Others 35 45 - - - - - -
IIIa. SAVINGS GENERATED -252 -1,063 -283 -962 32 2,147 3,312 4,136IlIb. CURRENT PUBLIC SECTOR
TRANSFERS (NET) 147 14 -132 520 636 633 912 1,045IIIc. CURRENT ACCOUNT SURPLUS OR
DEFICIT -105 -1,049 -415 -442 668 2,780 4,224 5,181
IV. OTHER REVENUE 168 202- 204 195 186 306 351 302Capital transfers from
public sector - - - - - - - -Others 168 202 204 195 186 306 351 302
V. CAPITAL EXPENDITURES 46 59 81 1,244 951 3,726 4,871 5,905Fixed capital formation 37 47 65 249 951 223 4,871 5,905Financial investment 9 12 16 995 - 3,503 - -Capital transfers - - - - - - - -
VI. ADJUSTMENTS -84 29 - 50 -1 - -2 -
VII. OVERALL SURPLUS OR DEFICIT -67 -877 -292 -1,441 -98 -640 -298 -422
VIII. LONG TERM FINANCING -35 -45 152 1,330 -84 - - .Loans granted - - - - - - - n.e.Loans received -35 -45 152 1,330 -84 - - n.a.a. Foreign (net) - - - 1,501 - - - n.a.b. Domestic (net) -35 -45 152 -171 -84 _ n.a.
IX. SHORT TERM FINANCING ANDCASH 102 922 140 111 182 640 298 n.e.
2. INCORA
I. OWN CURRENT REVENUES 209 511 614 653 646 527 378 478Sale of goods and services X! 5N 74 6 - -lo 12Other current revenues 172 457 540 647 646 526 368 466
II. DIRECT CURRENT EXPENDITURES 438 581 543 529 266 274 399 478Personal services 245 325 304 378 118 169 205 253Purchases of gooda and
services 128 169 158 151 70 66 125 178Interest payments 65 87 79 - 56 24 9 13Current transfers to private
sector - - - - 22 15 60 85Others - - 2 - - - - -
Illa. SAVINGS GENERATED -229 -70 71 124 380 253 -21 -51IIIb. CURRENT PUBLIC SECTOR
TRANSFERS (NET) 381 455 552 458 539 21 1,013 1,154IIIc. CURRENT ACCOUNT SURPLUS OR
DEFICIT 152 385 623 582 919 274 992 1,103
IV. OTHER REVENUE 95 167 - 151 110 118 220 190Capital transfers from
public aector - - - - - - - -Others 95 167 - 151 110 118 220 190
V. CAPITAL EXPENDITURES 661 877 818 954 1,252 1,501 1,999 2,412Fixed capital formation 4 IF E 21 1,252 315 1,113 1,349Financial investment 286 379 354 933 - 1,186 886 1,063Capital transfers 11 15 14 - - - -
VI. ADJUSTMENTS - - - -75 - -48 -23 -
VII.- OVERALL SURPLUS OR DEFICIT -414 -325 -195 -296 -223 57 -810 -1,119
VIII. LONG TM FINANCING 196 33 -67 296 -70 569 60 n.a.Loans granted -- - - n.a.Loana recelved 196 33 -67 296 -70 569 60 n.e.a. Foreign (net) -44 128 7 -103 -6 134 44 n.a.b. Domestic (net) 240 -95 -74 399 -64 435 16 n.s.
IX. SHORT TERM FINANCING ANDCASH 218 292 262 - 293 588 750 n.e.

-61 - Page 2 of
TabLe 5.12-1 COLOMBIA: SMUEARY ACCOUNTS OF MAJOR NATIONAL DECENTRALIZEDAGENCIES OPERATIONS, 1974-81(millions of Colombian Peo30s)
Actu~al Prelimiuary1974 1975 1976 197! 1978 1979 1980 1981
3. ICA
I. OWN CURRENT REVENUES 87 282 383 155 373 417 448 550Sale of goods sod services 32 22T 318 T[6 f40 T81 173 217Other current revenues 56 61 65 49 233 236 275 333
II. DIRECT CURRENT EXPENDITURES 523 632 533 771 177 171 247 327Personal servi:es 301 50 297 5d 2 88 106 T30 161Purchases of gnods and
services 194 570 197 1'11 26 37 60 85Interest paymenats - 8 12 - 35 24 53 75Current transfers to private
sector 23 4 22 .38 28 4 4 6Others 5 - 5 - - - -
IIIa. SAVINGS GENERATED -436 -350 -150 -606 196 246 201 223IIIb. CURRENT PUBLIC SECTOR
TRANSFERS (NET) 395 353 397 6,i3 767 923 1,516 1,778IIIc. CURRENT ACCOUNr SURPLUS OR
DEFICIT -41 3 247 .S7 963 1,169 1,717 2,001
IV. OTHER REVENUE - - - - - - 155 133Capital transfers from
public secto:r - - - -Others - - - - - 155 133
V. CAPITAL EXPENDITURES 25 49 222 3 1,028 1,526 1,707 2,070Fixed capital Eormation 25 46 222 -3 1,020 115 1,707 2,070Financial invelstment - - - 1,411 - -Capital transfers - 3 - - - - _
VI. ADJUSTMENTS -11 - 1 -40 18 28 9 -
VII. OVERALL SURPLUS OR DEFICIT -77 -46 26 *L4 -47 -329 174 64
VIII. LONG TERN FINANCING 62 44 -7 -40 3 163 -56 n.eLoanas granted - - - - - - - n.a.Loans received 62 44 -7 -40 3 163 -56 n.a.a. Foreign (net) - 58 30 I0 19 166 -60 n.a.b. Domestic (net) 62 -14 -37 -100 -16 -3 4 n.a.
IX. SHORT TERM FINANCING ANDCASH 15 2 -19 26 44 166 -118 n.a .
4. HhIAT
I. OWN CURRENT REVENUES 2 3 1 52 49 54 93 119Sale of goods and services 1 3 1 i2 49 54 93 11gOther current revenues I - - - - - -
II. DIRECT CURRENT EXPENDITURES 36 51 105 1 10 48 97 108 143Personal services 21 31 58 120 35 58 60 76Purchases of gnods and
services 13 8 24 7O 7 38 32 45Interest payments - - - - 6 1 10 14Current transfers to private
sector 2 12 23 - - - 6 8Others - - - - - - -
IIIa. SAVINGS GENERATED -34 -48 -104 -138 1 -43 -15 -24IlIb. CURRENT PUBLIC SECTOR
TRANSFERS (NET) 44 45 56 1L2 392 588 960 1,117IlIc. CURRENT ACCOUNT SURPLUS OR
DEFICIT 10 -3 -48 -76 393 545 945 1,093
IV. OTHER REVENUE - - - _ _ 52 - -Capital transfers from
public sector - - - - - 52Others -
V. CAPITAL EXPENDITURES 12 3 - 34 480 737 1,160 1,406FLxed capital formation 12 3 - 34 431 - 1,160 1,406Financial investment - - - - 49 737 - -Capital transfers - - - - - -
VI. ADJUSTMENTS _ _ 10 52 -1 -3 -2 -
VII. OVERALL SURPLUS OR DEFICIT -2 -6 -38 2 -88 -143 -217 -313
VIII. LONG TERN FINANCING - 1 5 - 13 61 -9 n.eLoans granted - - - - - - - n.e.Loana received - 1 5 - 13 61 -9 n.a.a. Foreign (net) - 1 - - - 65 - n.a.b. Domestic (not) - - 5 - 13 -4 -9 n.a.
IX. SHORT TERM FINANCING ANDCASH 2 5 33 -2 75 82 226 n.a.
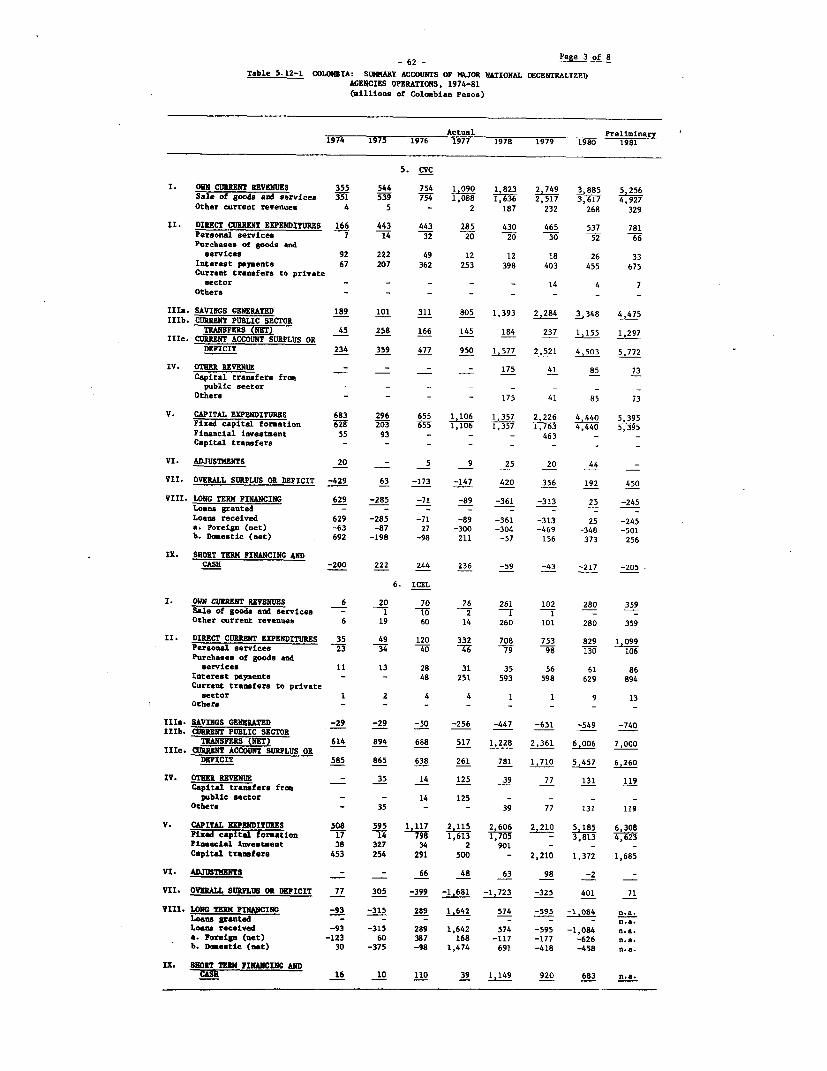
-62 - Page3 of 8
Table 5. 12-1 COLONMBA: SUNLARY ACCOUNTS OF N&JOR NATIONAL DECENTRALIZEDAGENCIES OPERATIONS, 1974-81(millions of Colinbian Pesos)
Actual Preliminary1974 1975 1976 1977 1978 1979 1980 1981
5. CVC
I. OWN CURRENT REVENUES 355 544 754 1,090 1,823 2,749 3,885 5,256Sale of goods and services 351 539 754 1,088 1,636 2,517 3,617 4,927Other current revenues 4 5 - 2 187 232 268 329
II. DIRECT CURRENT EXPENDITURES 166 443 443 285 430 465 537 781Personal services 7 14 32 20 20 30 52 66Purchases of goods and
services 92 222 49 12 12 18 26 33Interest psyments 67 207 362 253 398 403 455 675Current transfers to private
sector - - - - - 14 4 7Others - - - - - -
IIIs. SAVINGS GENERATED 189 101 311 805 1,393 2,284 3,348 4,475IIIb. CURRENT PUBLIC SECTOR 3
TRANSFERS (NET) 45 258 166 145 184 237 1,155 1,297IlIc. CURRENT ACCOUNT SURPLUS OR
DEFICIT 234 359 477 950 1,577 2,521 4,503 5,772
IV. OTHER REVENUE - - - - 175 41 85 73Capital transfers from
public sector - _ _ Others - - - - 175 41 85 73
V. CAPITAL EXPENDITURES 683 296 655 1,106 1,357 2,226 4,440 5,395Fixed capital forsation 628 203 655 1,106 1,357 1,763 4,440 5,395Financial investment 55 93 - - - 463 - -
Capital transfers - - - -
VI. ADJUSTMENTS 20 - 5 9 25 20 44 -
VII. OVERALL SURPLUS OR DEFICIT -429 63 -173 -147 420 356 192 450
VIII. LONG TERM FINANCING 629 -285 -71 -89 -361 -313 25 -245Loans granted - - -
Loans received 629 -285 -71 -89 -361 -313 25 -245a Foreign (net) -63 -87 27 -300 -304 -469 -348 -501b. Domestic (net) 692 -198 -98 211 -57 156 373 256
IX. SHORT TERM FINANCING ANDCASH -200 222 244 236 -59 -43 -217 -205
6. ICEL
I. OWN CURRENT REVENUES 6 20 70 76 261 102 280 359Sale of goods and services - 1 10 2 1 1-Other current revenues 6 19 60 14 260 101 280 359
II. DIRECT CURRENT EXPENDITURES 35 49 120 332 708 753 829 1,099Personal services 23 34 40 46 79 98 130 106Purchases of goods and
services 11 13 28 31 35 56 61 86Interest payments - - 48 251 593 598 629 894Current transfers to private
sector 1 2 4 4 1 1 9 13Otbers - - - - - -
IIIa. SAVINGS GENERATED -29 -29 -50 -256 -447 -651 -549 -740IlIb. CURRENT PUBLIC SECTOR
TRANSFERS (NET) 614 894 688 517 1,228 2,361 6,006 7,000IlIc. CURRENT ACCOUNT SURPLUS OR -
DEFICIT 585 865 638 261 781 1,710 5,457 6,260
IV. OTHE REVENUE - 35 14 125 39 77 131 119Capital transfers from
public sector - - 14 125 - - - -Others - 35 - - 39 77 131 119
V. CAPITAL EXPENDITURES 508 595 1,117 2,115 2,606 2,210 5185 6,308Fixed capital formUtion 17 14 798 1,613 1,705 - 3,813 4,623Finsncial investment 38 327 34 2 901 - - -
Capital transfers 453 254 291 500 - 2,210 1,372 1,685
VI. ADJUSTMENTS - - 66 48 63 98 -2 -
VII. OVERALL SURPLUS OR DEFICIT 77 305 -399 -1,681 -1,723 -325 401 71
VIII. LONG TRM FINANCING -93 -315 289 1,642 574 -595 -1.084 n.a.Loans granted - - - - - - - T.e-.
Loans received -93 -315 289 1,642 574 -595 -1,084 n.a.a. Foreign (net) -123 60 387 168 -117 -177 -626 n.a.b. Domestic (net) 30 -375 -98 1,474 691 -418 -458 n.a.
IX. SHORT TERM FINANCING ANDCASH 16 10 110 39 1,149 920 683 n.e
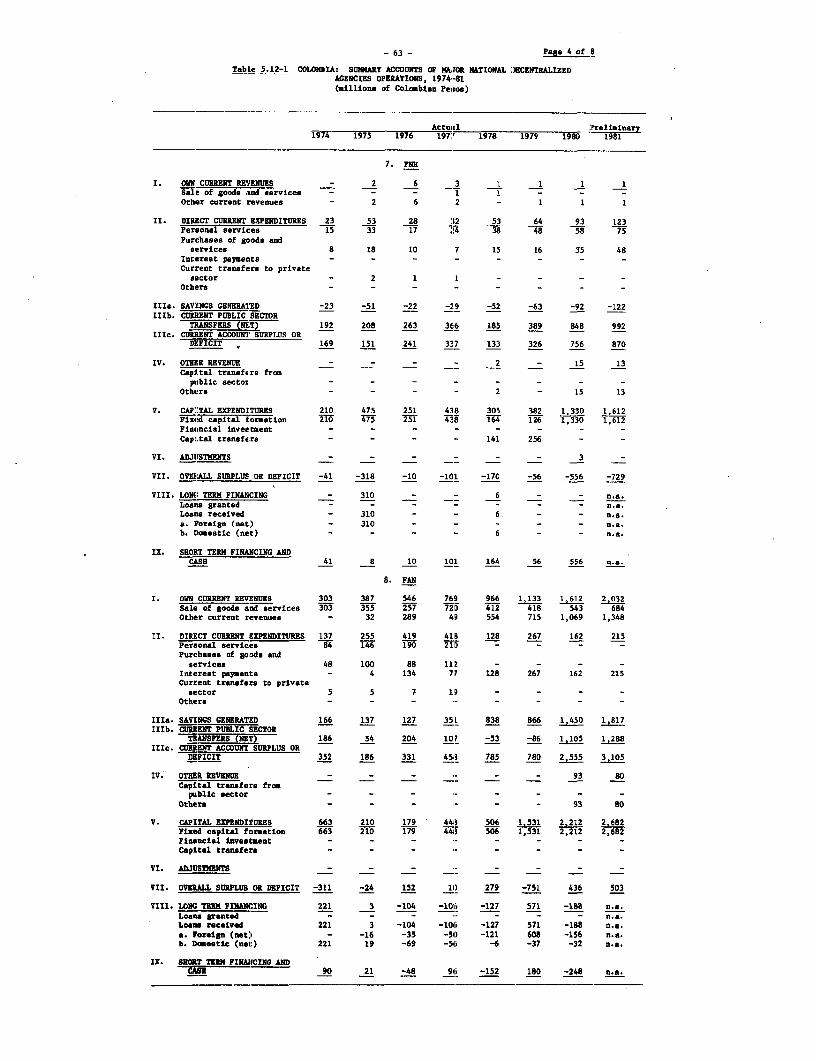
- 63 - Page 4 of S
Table 5.12-1 COLOHBIA: SUIIARY ACCOUNTS OF MAJOR NATIONAL DECENTRALIZEDAGENCIES OPERATIONS, 1974-81(millions of Colombian Peeos)
Actuil Prelininary1974 1975 1976 1972 - 1978 1979 1980 ' 1981
7. FNH
I. OWN CURRENT RYEENUES - 2 6 3 1 1 1 1Sale of goods end services - - - I 1 - - -Other current revenues - 2 6 2 - 1 1 1
II. DIRICT CURRENT EXPENDITURES 23 53 28 :12 53 64 93 123Personal serviD:es 15 33 17 ;-!.4 38 48 58 75Purc2hases of goods and
searvices 8 18 10 7 15 16 35 48Interest paymetits - - - - - - - -Current transfers to private
ssetor - 2 1 1 - - - -Othears - - - - - - - -
III&. SAVINGS GENERATED -23 -51 -22 -i 9 -52 -63 -92 -122lIIb. CURIUENT PUBLIC SECTOR
TRANSFERS (NET) 192 208 263 3f6 185 389 848 992IlIc. CRRtENT ACCOUNT SURPLUS OR
DtFYICIT . 169 151 241 3'7 133 326 756 870
IV. OTHER REVENUE - - - - 2 - 15 13CapiLtal tranafers from
piblic sector - - - - - - - -Otherrs - - - - 2 - 15 13
V. CAPITAL EXPENDITURES 210 475 251 438 305 382 1,330 1,612Fidxid capital formation f21 475? 21T 438 164 126 1,330 1,612Financial inveetmsnt - - - -CapiLtal transfers - - - - 141 256 - -
VI. ADJUSTMENTS _ - - - - - 3 -
VII. OVERALL SURPLUS OR DEFICIT -41 -318 -10 -101 -170 -56 -556 -729
VIII. LONG TERM FINANCING - 310 - - 6 - - na.Loans granted - - - - - - - n.a.Loats received - 310 - - 6 - - n.a.a. Foreign (net) - 310 - - - - - n.a.b. Domestic (net) - - - - 6 - - n.a.
IX. SHORT TERM FINANCING ANDCASH 41 8 10 101 164 56 556 0.8.
8. FAN
I. OWN CURFENT REVENUES 303 387 546 769 966 1,133 1,612 2,032Sale of goode and services 303 355 257 72D 412 418 543 684Other current revenues - 32 289 49 554 715 1,069 1,348
II. DIRECT CURRENT EXPENDITURES 137 255 419 418 128 267 162 215Personal services 84 146 190 21D-Purchases of goods and
eervices 48 100 88 112 - - - -Interest payments - 4 134 77 128 267 162 215Current transfers to private
sector 5 5 7 19 - - - -Others - - - - - - - -
III&. SAVINGS GENERATED 166 137 127 351 838 866 1,450 1,817IIIb. CURRENT PUBLIC SECTOR
TRANSFERS (NET) 186 54 204 107 -53 -86 1.105 1,288IIIc. CURRENT ACCOUNT SURPLUS OR
DEFICIT 352 186 331 453 785 780 2,555 3,105
IV. OTHER REVENUE - - - - - - 93 80Capital transfers froa
public sector - - - - - - - -Others - - - - - - 93 80
V. CAPITAL EXPENDITURES 663 210 179 4411 506 1,531 2.212 2.682Fixed capital formation 663 210 179 411 506 1,531 2,212 2,682Financial investment -Capital transfers
VI. ADJUSTMENTS - - _ _ _ _ _
VII. OVERALL SURPLUS OR DEFICIT -311 -24 152 lt) 279 -751 436 503
VIII. LONG THIN FINANCING 221 3 -104 -lOb -127 571 -188 n.a.Loans granted - - - - - - - .a.Loans received 221 3 -104 -lOi -127 571 -188 n.a.a. Foreign (net) - -16 -35 -5t) -121 608 -156 n.a.b. Diestic (net) 221 19 -69 -Sti -6 -37 -32 n.a.
Ix. SHOr TERM FINANCING ANDmld - 90 21 -48 9ti -152 180 -248 n.a.
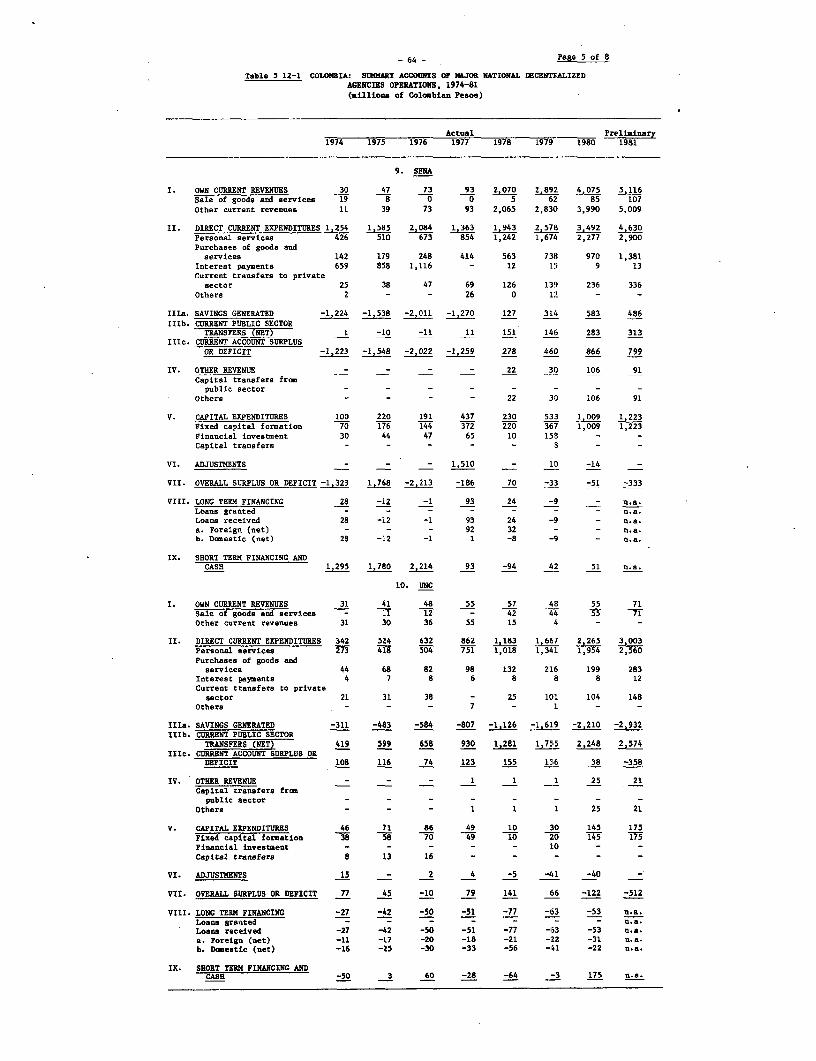
-64 - Page 5 of 8
Table 5 12-1 COLOMBIA: SIMMRY ACCOUNTS OF MAJOR NATIONAL DECENTRALIZEDAGENCIES OPERATIONS, 1974-81(uilliona of Coloxbian Pesos)
Actual Preliminary1974 1975 1976 1977 1978 1979 1980 1981
9. SENA
I. OWN CURRENT REVENUES 30 47 73 93 2,070 2,892 4,075 5,116Sale of goods and services 19 8 0 0 5 62 85 107Other current revenues 11 39 73 93 2,065 2,830 3,990 5,009
II. DIRECT CURRENT EXPENDITURES 1,254 1,585 2,084 1,363 1,943 258 3,492 4,630Personal services 426 510 673 854 1,242 1,674 2,277 2,900Purchases of goods and
services 142 179 248 414 563 738 970 1,381Interest payments 659 858 1,116 - 12 1 9 13Current transfers to private
sector 25 38 47 69 126 139 236 336Others 2 - - 26 0 12 - -
IlIa. SAVINGS GENERATED -1,224 -1,538 -2,011 -1,270 127 314 583 486IIIb. CURRENT PUBLIC SECTOR
TRANSFERS (NET) I -10 -11 11 151 146 283 313IIIc. CURRENT ACCOUNT SURPLUS
OR DEFICIT -1,223 -1,548 -2,022 -1,259 278 460 866 799
IV. OTHER REVENUE - - - - 22 30 106 91Capital transfers from
public sector - - - - - _ -
Others - - - - 22 30 106 91
V. CAPITAL EXPENDITURES 100 220 191 437 230 533 1,009 1,223Fixed capital formation 70 176 144 372 220 367 1,009 1,223Financial investment 30 44 47 65 10 15S - -Capital transfers - - - - - 8 - -
VI. ADJUSTMENTS _ _ - 1,510 - 10 -14 -
VII. OVERALL SURP-LUS OR DEFICIT -1,323 1,768 -2,213 -186 70 -33 -51 -333
VIII. LONG TERM FINANCING 28 -12 -1 93 24 -9 - n.a.Loans granted - - - - - - - n.a.Loans received 28 -12 -1 93 24 -9 - n.a.a. Foreign (net) - - - 92 32 - - n.a.b. Domeatic (net) 28 -12 -1 1 -8 -9 - n.a.
IX. SHORT TERM FINANCING ANDCASH 1,295 1,780 2,214 93 -94 42 51 n.a.
10. UNC
I. OWN CURRENT REVENUES 31 41 48 55 57 48 55 71Sale of goods and services - 11 12 - 42 44 55 71Other current revenues 31 30 36 55 15 4 - -
1I. DIRECT CURRENT EXPENDITURES 342 524 632 862 1,183 1,667 2,265 3,003Personal services 273 4 30 751 1,018 1,341 1,954 2,560Purchases of goods and
services 44 68 82 98 132 216 199 283Interest payments 4 7 8 6 8 8 8 12Current transfers to private
sector 21 31 38 - 25 101 104 148Others - - - 7 - 1 - -
IIIa. SAVINGS GENERATED -311 -483 -584 -807 -1,126 -1,619 -2,210 -2,932IIIb. CURRENT PUBLIC SECTOR
TRANSFERS (NET) 419 599 658 930 1,281 1,755 2,248 2,574IlIc. CURRENT ACCOUNT SURPLUS OR
DEFICIT 108 116 74 123 155 136 38 -358
IV. OTHER REVENUE - - - 1 1 1 25 21Capital transfers frm
public sectorOthers - - - 1 1 1 25 21
V. CAPITAL EXPENDITURES 46 71 86 49 10 30 145 175Fixed capital formation 38 58 70 49 10 20 145 175Financial investment - - - - - 10Capital transfers 8 13 16 - - -
VI. ADJUSTMENTS 15 - 2 4 -5 -41 -40 -
VII. OVERALL SURPLUS OR DEFICIT 77 45 -10 79 141 66 -122 -512
VIII. LONG TERM FINANCING -27 -42 -50 -51 -77 -63 -53 n.a.Loans granted - - - - - - - n.a.Loans received -27 -42 -50 -51 -77 -63 -53 n.m.a. Foreign (net) -11 -17 -20 -18 -21 -22 -31 n.a.b. Domestic (net) -16 -25 -30 -33 -56 -41 -22 n.e.
IX. SHORT TERM FINANCING ANDCASH -50 3 60 -28 -64 -3 175 n.a.
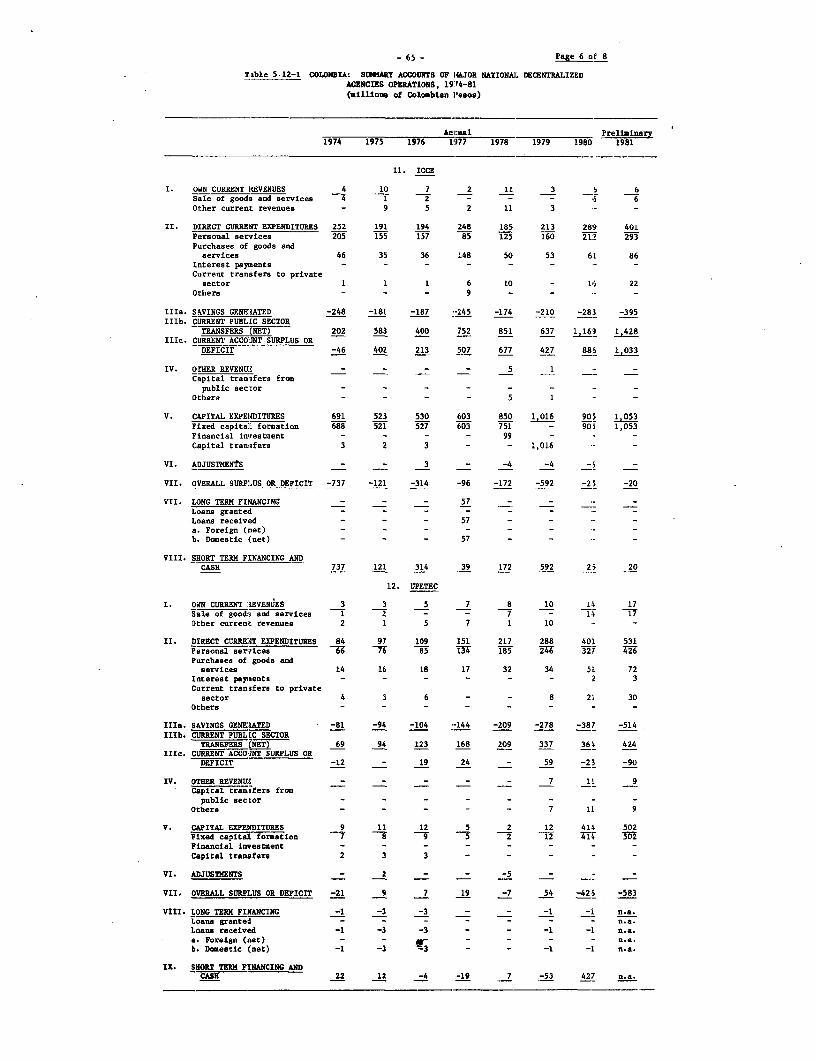
-65 - Page 6 of 8
Table 5. 12-1 COLOMBIA: SUI4ARY ACCOUNTS OF 1AJOR NATIONA1. DECENTRALIZEDAGENCIES OPERATIONS, 19!4-81(millions of Colombian Plesos)
Aci:ual Preliminary1974 1975 1976 19I77 1978 1979 1980 1981
11. ICCE
I. OWN CURRENT REVENUES 4 10 7 2 11 3 5 6Sale of goodas and services 4 1 2 - - - 5 6Other current revenues - 9 5 2 11 3 - -
II. DIRECT CURREI1T EXPENDITURES 252 191 194 248 185 213 28M 401Personal services 205 155 157 85 125 160 212 293Purchases of goods and
services 46 35 36 148 50 53 61 86Interest paynaents - - - - - - - -Current transfers to private
sector 1 1 1 6 10 - 15 22Others - - - 9 - - - -
IIIa. SAVINGS GENEIATED -248 -181 -187 *-245 -174 -210 -283 -395IIIb. CURRENT PUBLIC SECTOR
TRANSFERS _NET) 202 583 400 752 851 637 1,163 1,428IIIc. CURRENT ACCOIUNT SURPLUS OR
DEFICIT -46 402 213 507 677 427 885 1,033
IV. OrHER REVENUE - - - - 5 1 - -Capital trasnifers from
public sector - -Others - - - - 5 1
V. CAPITAL EXPENDITURES 691 523 530 603 850 1,016 905 1,053Fixed capital formation 688 521 527 603 751 - 90; 1,053Financial investnent - - - - 99 - - -Capital transfers 3 2 3 - - 1,016
VI. ADJUSTMENrS - - 3 - -4 -4 -' _
VII. OVERALL SURPLUS OR DEFICIT -737 -121 -314 -96 -172 -592 -2.5 -20
VII. LONG TERl FIINCING - - - 57 - - -Loans granted - - - - ' _ _ -Loans received - - - 57a. Foreign (naet) - - - - - - - -b. Domestic (net) - - - 57
VIII. SHORT TERM FINANCING ANDCASH 737 121 314 39 172 592 25 20
12. UPETEC
I. ODN CURRENT REVENUES 3 3 5 7 8 10 1 17Sale of goodsl and services 1 2 - - 7 - 14 17Other current revenues 2 1 5 7 1 10
II. DIRECT CURRENT EXPENDITURES 84 97 109 151 217 288 401 531Personal services 66 76 85 134 185 246 32T 426Purchases of goods and
services 14 16 18 17 32 34 5L 72Interest pay)nents - - - - - - 2 3Current tranafers to private
sector 4 5 6 - - 8 21 30Others - - - - - - . -
IIIa. SAVINGS GENERATED -81 -94 -104 -144 -209 -278 -387 -514IIlb. CURRENT PUBLIC SECTOR
TRANSFERS (NET) 69 94 123 168 209 337 363 424IlIc. CURRENT ACCOUNT SURPLUS OR
DEFICIT -12 - 19 24 - 59 -23 -90
IV. OTHER REVENUS - - - - - 7 11 9Capital tranifers from
public sectorOthers - - - - - 7 11 9
V. CAPITAL EXPENDITURES 9 11 12 5 2 12 414 502Fixed capital formation 7 8 9 5 2 12 41$ 502Pinancial investment - - - - - - - -Capital transfers 2 3 3 - - - . -
VI. ADJUSTIIENTS - 2 - - -5 - _ _
VII. OVERALL SURPLUS OR DEFICIT -21 9 7 19 -7 54 -426 -583
VIII. LONG TERN FINANCING -1 -3 -3 - - -1 -I n.a.Loans granted - - - - - - - n.a.Loans received -1 -3 -3 - - -1 -1 n.a.a. Foreign (net) - - , - - - - n.a.b. Domestic (net) -1 -3 3 - - -1 n.a.
IX. SHORT TERM FINANCING ANDCASH 22 12 -4 -19 7 -53 427 n.a.

-66 - Page 7 of 8
Table 5.12-1 COLOMBLIA: SUMIARY ACCOUNTS OF MAJOR NATIONAL IECENTRALIZEDAGENCIES OPERATIONS, 1974-81(millions of Colombian Pesos)
Actual Prelilinary1974 1975 1976 1977 1978 1979 1980 1981
13. INSFOPAL
I. OWN CURRENT REVENUES 85 99 127 109 125 172 124 156Sale of goods and services 69 81 112 71 28 35 107 135Other current revenues 16 18 15 38 97 137 17 21
II. DIRECT CURRENT EXPENDITURES 238 165 255 146 217 269 496 658Personal services 135 91 146 91 96 119 156 175Purchases of goods and
services 84 56 89 43 39 37 48 68Interest payments 7 11 9 - 59 99 217 308Current transfers to private
sector 12 7 11 12 23 14 75 107Others - - - - - - - -
IIIa. SAVINGS GENERATED -153 -66 -128 -37 -92 -97 -372 -502IIIb. CURRENT PUBLIC SECTOR
TRANSFERS (NET) 187 518 664 770 782 1,032 1,675 1.948IIIc. CURRENT ACCOUNT SURPLUS OR
DEFICIT 34 452 536 733 690 935 1.303 1.446
IV. OTHER REVENUE - - 16 - - - 233 200Capital transfers from
public sectorOthers - - 16 - - - 233 200
V. CAPITAL EXPENDITURES 136 355 566 943 861 913 1,686 2,044Fixed capital formation E T 3566 13T 913 1,686 2,044Financial investment 40 - 10Capital transfers - -
VI. ADJUSTMENTS _ -65 -103 - -2 -3 -4 -
VII. OVERALL SURPLUS OR DEFICIT -102 32 -117 -210 -173 19 -154 -398
VIII. LONG TERE FINANCING -23 -26 80 293 106 110 229 n.a.Loans granted - - - - - - - n.aLoans received -23 -26 80 293 106 110 229 n.e.a. Foreign (net) -8 -5 110 336 94 121 197 n.a.b. Domestic (net) -15 -21 -30 -43 12 -11 32 n.a.
IX. SNORT TERN FINANCING ANDCASH 125 -6 37 -83 67 -129 -75 n.e.
14. IGAC
I. OWN CURRENT REVENUES 13 9 23 26 49 44 42 53Sale of goods and services 12 9 18 26 T48 52Other current revenues 1 0 5 0 1 1 1 1
II. DIRECT CURRENT EXPENDITURES 78 250 252 363 102 103 138 183Personal services l n T7 219 9 359 7T2Purchases of goods and
services 11 224 75 113 32 24 35 50Interest payments - - 3 3 6 10 10 14Current transfers to private
sector 1 5 1 28 15 10 21 30Others - - - - - - - -
IIIa. SAVINGS GENERATED -65 241 -229 -337 -53 -59 -96 -130IlIb. CURRENT PUBLIC SECTOR
TRANSFERS (NET) 179 236 253 343 502 756 1.023 1.197IIIc. CURRENT ACCOUNT SURPLUS OR
DEFICIT 114 -5 24 6 449 697 927 1,067
IV. OTHER REVENOE - - - - 1 - 1 1Capital transfers from
public sector - - - - - - - -Others - - - - 1 - 1 1
V. CAPITAL EXPENDITURES 159 1 14 11 503 700 902 1,093Fixed capital formation T5 1 14 11 lt - 902 1,093Financial investment - - - - 286 700Capital transfers - - -
VI. ADJUSTMENTS 5 2 -12 7 8 6 4 _
VII. OVERALL SURPLUS OR DEFICIT -40 -4 -2 2 -45 3 30 -25
VIII. LONG TERE FINANCING 23 -10 -10 -12 63 15 11 n.e.Loans granted - - - - - - - n.Loans received 23 -10 -10 -12 63 15 11 n.a.a. Foreign (net) 28 - -6 -13 -14 -9 -5 n.a.b. Domestic (net) -5 -10 -4 1 77 24 16 n.a.
IX. SHORT TFRM FINANCING ANDCASE 17 14 12 10 -18 -18 -41 n.e.

-67 - Page 8 o 8
TiLble 5. 12-1 COLOMBIA: SU19L4RY ACCOUNTS OF IULJOR NATIONAI. DECENTRALIZEDAGENCIES OPERATIONS, 19i4-81(millions of Colombian E'esos)
Aoltual Prelisinary1974 1975 1976 11177 1978 1979 1980 1981
15. Fondo Insuebles Nacionales
I. OWN CURRENT REVENUES n.a. 2 3 ,l.a. 11 82 9 11Sale of goods& and services n.a. a - ,L.a.Other curreni: revenues n.a. 2 3 IA.a. 11 82 t 11
II. DIRECT CURRENT EXPENDITURES n.a. - - i.m. - - -
Personal services n.a. - - in.a. - -
Purchases of goods andservices n.a. - - ni.a. - -
Interest paynents n.a. - - il.a. - -Current transfers to private
sector n.a. - - l.a.Others
Illa. SAVINGS GENE17ATED - 2 3 - 11 82 9 11IlIb. CURRENT PUBLItC SECTOR
TRANSFERS (NET) n.a. - - ]l.a. - - _ -
Ille. CURRENT ACCOIUNT SURPLUS ORDEFICIT - 140 169 - 238 556 725 845
IV. OTHER REVENUE n.a. - - l.a. - 2 -
Capital transfers frompublic sector n.a. - - l.a. - - -
Others n.a. - - l.a. - 2 - -
V. CAPITAL EXPENDITURES n.a. 219 317 2.a. 256 551 1,1 95 1449Fixed capital fornation n.a. 219 317 nl.a. 256 551 1,195 1,449Financial investment n.a. - - a.a. - - - -Capital transfers n.a. - - .a. - - - -
VI. ADJUSTMENTS n.a. - - 2.a. - - - -
VII. OVERALL SURPLUS OR DEFICIT - -79 -148 _ -18 7 -470 -604
VIII. LONG TERM FISANCING n.a. - 48 l.a. 7 18 - n.a.Loans granted n.a. - - l.a.toansa received n.a. - 48 I.a. 7 18s. Foreign (net) n.a. - 48 n.a. - -
b. Domestic (net) n.a. - - a.a. 7 18 -
IX. SHORT TERM FINANCING ANDCASH n.a. 79 100 n.a. 11 -25 470 U. a.
16. REST
I. OWiN CURRENT REVENUES 958 1,244 1,682 1 883 2 511 3,801 4 29 4 951Sale of goods and services 683 514 615 75 1,027 1,650 3 2,3Other current revenues 275 730 1,067 1,131 1,484 2,151 2,136 2,715
II. DIRECT CURRENT EXPENDITURES 1,485 1,838 2,227 2,763 4,768 6.730 8,4E4 11,162Plersonal services 619 825 1,139 1,436 2,944 3,972 5,04 6,322Purchases of goods and
services 741 892 958 1,165 1,524 2,272 2,751 3,929Interest payments 25 9 8 7 41 80 25 22Current transfers to private
sector 100 112 122 155 259 406 624 889Others
IIIa. SAVINGS GENERATED -527 -594 -545 -880 -2.257 -2,929 -4,275 -6,211ITTb. CURRENT PUBLIC SECTOR
TRANSFERS (NET) 1,316 1,715 1,489 2,514 4,339 6.350 9.824 11,541IIlc. CURRENT ACCOUNT SURPLUS OR
DEFICIT 789 1,121 944 1,634 2.082 3.421 5,549 5.330
IV. OTHER REVENUlE 43 57 75 18 149 323 6.8 548Capital tranisfers from
public sector - - - - _ _ _ _Others 43 57 75 18 149 323 6.18 548
V. CAPITAL EXPENDITURES 780 757 717 1]681 2,471 3,298 6,030 7,372Fixed capitaLl formation 639 490 TIT i,355 rT441 2,116 6,O:!0 8Financial Investment 16 87 289 306 454 969 3 4Capital tranisfers 125 180 117 20 593 213 19 24
VI. ADJUSTMENTS -129 -204 38 43 -24. -23 - 18
VII. OVERALL SURP'LUS OR DEFICIT -77 217 340 14 -264 423 137 -i,476
VIII. ]LONG TERM FIENANCING -3,633 -4,747 -12,895 -56 -51! -94 -292 n.a.Loans granted - - - - - - - n.*.Loans received -3,633 -4,747 -12,895 -56 -5tl -94 -292 n.a.a. Foreign 'net) -9 -12 -38 28 1. 35 -12 n.a.b. Domestic (net) -3,624 -4,735 -12,857 -84 -59 -129 -2130 n.8.
IX. SHORT TERM F?INANCING ANDCASH 3.710 4,530 12,555 42 322 -329 155 n.-.
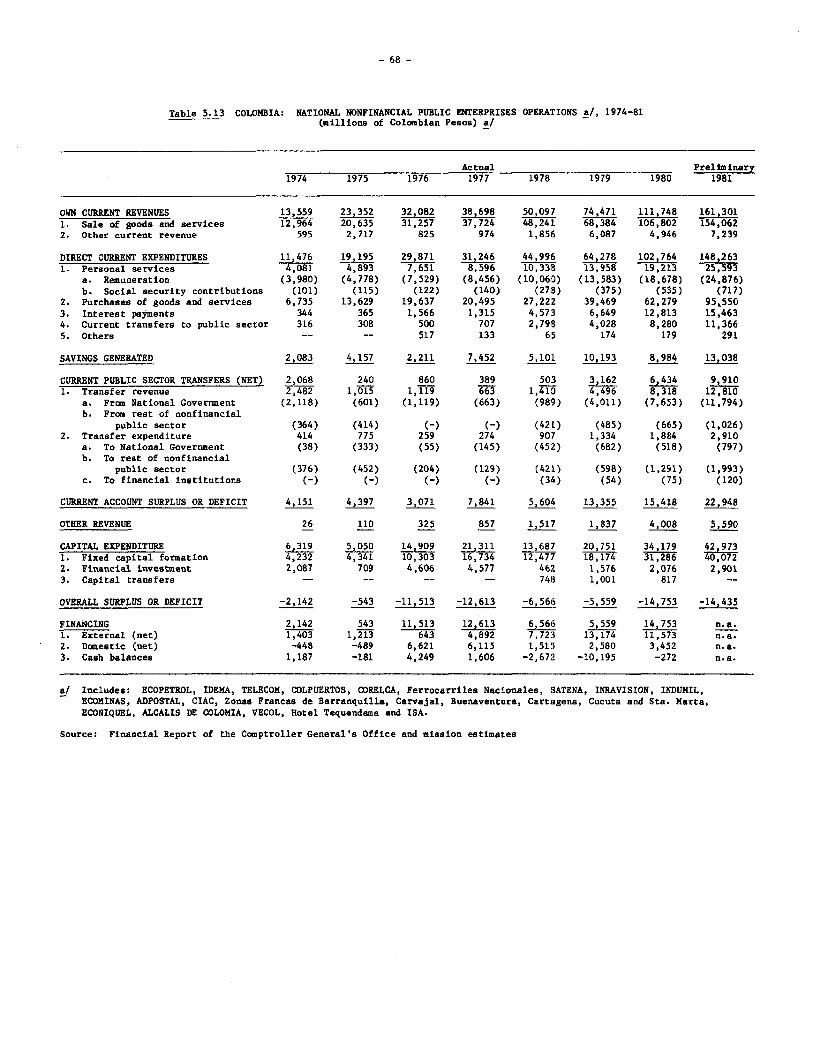
- 68 -
Table 5.13 COLOMBIA: NATIONAL NONFINANCIAL PUBLIC ENTERPRISES OPERATIONS a/, 1974-81(millions of Colombian Pesos) a/
Actual Preliminary1974 1975 1976 1977 1978 1979 1980 1981
OWN CURRENT REVENUES 13,559 23,352 32,082 38,698 50,097 74,471 111,748 161,301
1. Sale of goods and services 12,964 20,635 31,257 37,724 48,241 68,384 106,802 154,0622. Other current revenue 595 2,717 825 974 1,856 6,087 4,946 7,239
DIRECT CURRENT EXPENDITURES 11,476 19,195 29,871 31,246 44,996 64,278 102,764 148,2631. Personal services 4,081 4,893 7,651 8,596 10,338 13,958 19,213 25,593
a. Remuneration (3,980) (4,778) (7,529) (8,456) (10,060) (13,583) (18,678) (24,876)b. Social security contributions (101) (115) (122) (140) (278) (375) (535) (717)
2. Purchases of goods and services 6,735 13,629 19,637 20,495 27,222 39,469 62,279 95A5503. Interest payments 344 365 1,566 1,315 4,573 6,649 12,813 15,4634. Current transfers to public sector 316 308 500 707 2,798 4,028 8,280 11,3665. Others -- -- 517 133 65 174 179 291
SAVINGS GENERATED 2,083 4,157 2,211 7,452 5,101 10,193 8,984 13,038
CURRENT PUBLIC SECTOR TRANSFERS (NET) 2,068 240 860 389 503 3,162 6,434 9,9101. Transfer revenue 2,482 1,015 i,119 663 1,410 4,496 8,318 12,810
a. From National Government (2,118) (601) (1,119) (663) (989) (4,011) (7,653) (11,794)b. From rest of nonfinancial
public sector (364) (414) (-) (-) (421) (485) (665) (1,026)2. Transfer expenditure 414 775 259 274 907 1,334 1,884 2,910
a. To National Government (38) (333) (55) (145) (452) (682) (518) (797)b. To rest of nonfinancial
public sector (376) (452) (204) (129) (421) (598) (1,291) (1,993)c. To financial institutions (-) (-) (-) (-) (34) (54) (75) (120)
CURRENT ACCOUNT SURPLUS OR DEFICIT 4,151 4,397 3,071 7,841 5,604 13,355 15,418 22,948
OTHER REVENUE 26 110 325 857 1,517 1,837 4,008 5,590
CAPITAL EXPENDITURE 6,319 5,050 14,909 21,311 13,687 20,751 34,179 42 9731. Fixed capital formation 4 232 4,341 10,303 16,734 12,477 18,174 31,286 40,0722. Financial investment 2,087 709 4,606 4,577 462 1,576 2,076 2,9013. Capital transfers -- -- -- -- 748 1,001 817 --
OVERALL SURPLUS OR DEFICIT -2,142 -543 -11,513 -12,613 -6,566 -5,559 -14,753 -14,435
FINANCING 2,142 543 11,513 12,613 6,566 5,559 14,753 n.a.1. External (net) 1,403 1,213 643 4,892 7,723 13,174 11,573 n.a.2. Domestic (net) -448 -489 6,621 6,115 1,515 2,580 3,452 n.a.3. Cash balances 1,187 -181 4,249 1,606 -2,672 -10,195 -272 n.a.
a/ Includes: ECOPETROL, IDEMA, TELECOM, COLPUERTOS, CORELCA, Ferrocarriles Nacionales, SATENA, INRAVISION, INDUMIL,ECOMINAS, ADPOSTAL, CIAC, Zonas Franceas de Barranquilla, Carvajal, Buenaventura, Cartagena, Cucuta and Sta. Marta,ECONIQUEL, ALCALIS DE COLOMIA, VECOL, Hotel Tequendama and ISA.
Source: Financial Report of the Comptroller General's Office and mission estimates

- 69 -Page 1 of 3
Table 5.13-1 COLOMBIA: SUtQARY ACCOUNTS OF NAJOR K)NFNANC&IAL PUBIIC ENTERPRISES, 1974-81(uill£ons of Colombian P,asoa)
Jctual Preliminary1974 1975 1976 1977 31978 1979 1980 1981
I. ECOPETROL
OWN CURRENT REVENUES 6,940 9,229 15,324 21,283 2'l,206 37,271 60,762 92,8991. Sale of goods and services 6,759 7,334 14,956 151,135 2S!,733 36,668 58,609 89,4912. Other current revenue 181 1,895 368 148 473 603 2,153 3,408
DIRECT CURRENT EXPENDITIRES 4,563 7,356 13,921 17,860 21,691 34,937 61 306 92 0381. Resunaration 988 915 2,331 1,814 2,281 2,997 454892. Purchases of goodi; and services 3,433 6,280 10,677 1.4,639 16,621 27,390 45,448 72,6243. Interest payments 41 125 307 1,035 1,868 3,514 8,022 8,2354. Current transfers to private
sector 101 36 262 372 921 1,036 3,832 5,6905.others - - - -- -- - --
SAVINGS GENERATED 2,377 1,873 1,403 3,423 3,515 2,334 -544 861
CURRENT PUBLIC SECTOR TlRANSFERS (IIET) -94 -150 -77 -- -365 -494 -1,342 -1,245
CURRENT ACCOUNT SURPLUS OR DEFICI: 2,283 1,723 1,326 3,423 j,150 1,840 -1,886 -384
OTHER REVENUE - -- 3 103 366 63 983 1,5561. Capital transfers from public
sector - - -- -- -2. Others - -- 3 103 366 63 983 1,556
CAPITAL EXPENDITURE 4,020 3,378 7,602 9,372 6,492 8,818 9,533 13,3081. Fixed capital formation 2136 2,908 4,939 8,801 6,224 8,350 7,466 10,4212. Financial investment 1,884 470 2,663 571 268 468 2,067 2,888
OVERALL SURPLUS OR DEFICIT -1,737 -1,655 -6,273 -5,846 -4,976 -6,915 -10,436 -12,137
LONG TERN FINANCING 934 732 4,087 5,099 6,588 9,876 2,468 n.a.1. Loans granted (net) - - -- - -- - - n.a.2. Loans received 934 732 4,087 5,099 6,588 9,876 2,468 n.a.
a) Foreign (net) (970) (724) (141) 13,487) (6,588) (9,902) (3,879) n.a.b) Domeetic (net) (-36) (8) (3,946) 4:1,612) (-) (-26) (-1,411) n.a.
SHORT TERN FINANCING AND CASH 803 923 2,186 747 -] ,612 -2,961 7,968 n.a.
II. IDENA
OWN CURRENT REVENUES 360 5,976 5,841 2,095 7,515 9,263 13,539 17,2651. Sale of goods and services 182 5,403 5,763 1,958 ,377 ,153 13,311 16,9712. Other current revenues 178 573 78 137 138 110 228 294
DIRECT CURRENT EXPENDIT'URES 1,909 5,134 6,276 1,225 5,535 5,182 8,716 11,9131. Reruneration 293 418 577 549 471 592 806 1,0362. 'Purchases of goods and services 1,520 4,645 9,917 612 4,662 3,814 6,908 8,9183. Interest payments 49 12 782 14 365 60C0 775 1,6494. Current transfers to private
sector 47 59 - 50 1 155 227 3105. Others -- -- -- - 36 21 - --
SAVINGS GENERATED -1,549 842 -435 870 L,980 4,081 4,823 5,352
CURRENT PUBLIC SECTOR TRANSFERS (WET) 1.678 -26 -24 -64 -12 -63 -18 -21
CURRENT ACCOUNT SURPLUS OR DEFICrr 129 816 -459 806 'L,968 4.01i1 4,805 5,331
OTHER REVENUE -- - - - 55 106' - -1. Capital transfers from public
sector -- - -- -- -- - - -
2. Others - -- - - 55 10 - -
CAPITAL EXENDITURE 723 92 1 471 3,152 64 10'1 253 3221. Fixed cepital fosRulation Wi T 648 2,100 64 20 253 3222. Financial investment 93 -- 823 1,051 - 82j - -
OVERALL SURPLUS OR DEFICIT -594 724 -1,930 -2,346 ',959 4,021 4.552 5,009
LONG TERM FINANCING 112 207 572 1,976 553 80,' 3,828 n.a.1. Loans granted (net) - - - - - - - n.a.2. Loans received 112 207 572 1,976 553 801 3,828 n.a.
a) Foreign (net) (21) (6) (38) (-9) (26) (-29) (-32) n.a.b) Damestic (net) (91) (201) (534) 1 1,985) (527) (836) 3,860 n.a.
SHOLT TERN FINAUCING AND CASE 482 -931 1,358 370 -:1,512 -4,821! -8,380 n.a.

- 70 Page 2 of 3
Table 5.13-1 COLOMBIA: SUIQIARY ACCOUNTS OF MAJOR RN)FINANCIAL PUBLIC ENTERPRISES, 1974-81(millions of Colombian Pesos)
Actual Prelimin-ry1974 1975 1976 1977 1978 1979 1980 1981
III. TELECOM
OWN CURRENT REVENUES 1,991 2,939 3,909 5,097 5 829 9,111 11,981 11 5201. Sale of goods end services 1,952 2,852 3,868 4,998 i2; 8,819 11,637 16,0402. Other current revenue 38 87 41 99 209 292 344 480
DIRECT CURRENT EXPENDITURES 1,285 1,527 2,760 3,353 4,002 5,751 7,290 9,6841. Remuneration 7422. Purchases of goods and services 449 528 1,272 1,618 1,650 2,428 2,643 3,9233. Interest payments 54 15 101 85 177 292 299 3084. Current transfers to private
sector 40 43 -- - 246 353 443 4525. Others - - 138 122 12 -- 12 18
SAVINGS GENERATED 706 1,412 1,149 1,744 1,827 3,360 4,691 6,836
CURRENT PUBLIC SECTOR TRANSFERS (NET) -228 -461 -67 -75 -176 -264 -170 -62
CURRENT ACCOUNT SURPLUS OR DEFICIT 478 951 1,082 1,669 1,651 3,096 4,521 6,774
OTHER REVENUE - - -- -- 196 325 363 3281. Capital transfers from public
sector - - - - -- -- -2. Others - -- - - 196 325 365 328
CAPITAL EXPENDITURE 318 376 747 1,859 2,388 2,465 5,221 6,3501. Fixed capital formation 308 351 m17 1,156 1,388 26 5,221 6,3502. Financial investment 10 25 30 703 -- -- -- -
OVERALL SURPLUS OR DEFICIT 160 575 335 -190 459 956 -335 752
LONG TERM FINANCING 8 -234 82 125 203 326 521 n.a.1. Loans granted (net) - -- -- - -- - -- n.a.2. Loans received 8 -234 82 125 203 326 521 n.a.
a) Foreign (net) (40) (68) (43) (156) (16) (331) (570) n.a.b) Domestic (net) (-32) (302) (39) (-31) (187) (-5) (-49) n.a.
SHORT TERM FINANCING AND CASH -168 -341 -417 65 -662 -1,282 -186 n.a.
IV. COLPUERTOS
OWN CURRENT REVENUES 1,384 1,648 2,201 3,557 4,349 6,541 9,408 11,8651. Sale of goods and services 1,384 1,648 2,192 3,553 4293 6,458 9,328 11,7582. Other current revenues -- - 9 4 56 83 80 107
DIRECT CURRENT EXPENDITURES 1,008 1,515 1,877 2,996 4,135 6,222 8,512 10,5581. Remuneration 817 1,187 1,433 2,249 2,630 3,838 53285 6,6212. Purchases of goods and services 114 215 289 576 726 1,204 1,282 1,6021. Interest payments 20 28 24 31 58 51 98 1384. Current transfers to private
sector 57 85 131 140 721 1,129 1,847 2,1975. Others - -
SAVINGS GENERATED 376 133 324 561 214 319 896 1,307
CURRENT PUBLIC SECTOR TRANSFERS (NET) -25 -10 -44 -- -22 -35 -51 -61
CURRENT ACCOUNT SURPLUS OR DEFICIT 351 123 280 561 192 284 845 1,246
OTHER REVENUE - - - - _ 1. Capital transfers from public
sector - - -- -- --2. Others -- -- - - - -- --
CAPITAL EXPENDITURE 94 194 300 423 315 620 480 6031. Fixed capital formulation -a W I0423 315 620 480 6032. Financial investment - -- _ __- - -
OVERALL SURPLUS OR DEFICIT 257 -71 -20 138 -123 -336 365 643
LONG TERM FINANCING -177 -68 45 -113 124 304 1 n.a.1. Loans granted (net) - - - - -- - -- -
2. Loans received -177 -68 45 -113 124 304 1 n.a.a) Foreign (not) (7) (-40) (-) (-6) (30) (140) (-21) n.a.b) Domestic (net) (-184) (-28) (45) (-107) (94) (164) (22) n.a.
SHORT TRN FINANCING AND CASH -80 139 -25 -25 -1 32 -366 n.a.

- 71 -Page 3 of 3
Table 5.13-1 COLOMBIA: SUMMARY ACCOUNTS OF MAJOR NDNFINANCIAL PUBLIC ENTERPRISES, 1974-81(millions of Colombian Pesos)
Actual PrelUminary1974 1975 1976 1977 1978 1979 1980 1981
V. CORELCA
OWN CURRENT REVENUES 138 219 373 625 963 1,615 2 369 2,8591. Sale of goods and services 73 196 362 622 745 1,095 1,663 1,9982. Other current revenue 65 23 11 3 218 520 706 861
DIRECT CURRENT EXPENDITURES 165 350 358 599 937 1,625 2.382 3,1651. Reiuneration 21 31 41 75 117 181 285 3782. Purchases of goods and services 60 249 190 369 486 801 1,112 1,4803. Interest payments 82 67 124 148 327 632 893 1,2244. Current transfers to private
sector 2 3 3 7 7 11 28 835. Others -- -- -- - - - 64 -
SAVINGS GENERATED -27 -131 15 26 26 -10 -13 -306
CURRENT PUBLIC SECTOR TRANSFERS (NET) 71 243 472 127 694 1,533 3,085 3,708
CURRENT ACCOUNT SURPLUS OR DEFICIT 44 112 487 153 720 1,523 3.072 3,402
OTHER REVENUE -- - - 247 -- -- --1. Capital transfers from public
sector -- -- -- 247 - -- --2. Others - - -- - -- ---
CAPITAL EXPENDITURE 213 44 915 1,230 1 822 2-066 8,615 9,7551. Fixed capital formation 213 U 909 T1,230 1709 1,485 8,615 9,7552. Financial investament -- -- 6 - 113 581 -
OVERALL SURPLUS OR DEFICIT -169 68 -428 -830 -1,102 -543 -5,543 -6,353
LONG TERM FINANCING 163 -59 426 893 1,019 1,059 4.196 n.a.1. Loans granted (net) -- -- -- -- -- -- - n.a.2. Loans received 163 -59 426 893 1,019 1,059 4,196 n.a.
a) Foreign (net) (45) (-122) (342) (446 (338) (542) (4,206) n.e.b) Dosestic (net, (118) (63) (84) (447) (681) (517) (-10) n.a.
SHORT TERN FINANCING ANID CASH 6 -9 2 -63 83 -516 1,347 n.a.
VI. REST OF NONFINANCIAL PUBLIC ENTERPRISES
OWN CURRENT REVENUES 2,746 3,341 4,434 6,041 8,235 10,670 13,689 19,8931. Sale of goods and services 2,614 3,202 4,116 5,458 7,473 6,191 12,254 17,8042. Other current revenues 133 139 318 583 762 4,479 1,435 2,089
DIRECT CURRENT EXPENDITURES 2,546 3,313 4,679 5,213 8,696 10 561 14 558 20,9051. Remuneration 1,220 1,401 2,020 2,381 2,922 2i 7,0862. Purchases of goodts and services 1,159 1,712 2,292 2,681 3,077 3,832 4,886 7,0033. Interest paymentes 98 118 228 2 1,778 1,560 2,726 3,9094. Current transfer.: to private
sector 69 82 104 138 902 1,344 1,839 2,6345. Others - -- 35 11 17 153 167 273
SAVINGS GENERATED 200 28 -245 828 -461 109 -869 -1,012
CURRENT PUBLIC SECTOR TRANSFERS (NET) 666 644 600 401 384 2,485 4,930 7,591
CURRENT ACCOUNT SURPLUS OR DEFICIT 866 672 355 1,229 -77 2,594 4,061 6,579
OTHER REVENUE 26 110 322 507 900 1,343 2,660 3,7061. Capital transfers from public
sector - - -- -- -- -- 2,204 -2. Others 26 110 322 507 900 1,343 456 3,706
CAPITAL EXPENDITURE 951 966 3,874 5,275 3.606 6-679 10,077 12 6341. Fized capital formulation 851 752 2,790 3,024 3,525 6,235 10,068 12,6212. Financial investment 100 214 1,084 2,251 81 444 9 13
OVERALL SURPLUS OR DEFICIT -59 -184 -3,197 -3,539 -2,783 -2,742 -3,356 -2,349
LONG TERM FINANCING -85 146 2,052 3,027 751 3,382 4,Dl1 n.a.1. Loans granted (net) - - - - -- -- -- n.a.2. Loans received -85 146 2,052 3,027 751 3,382 4,011 n.a.
a) Foreign (net) (320) (577) (79) (818) (725) (2,288) (2,971) n.a.b) Domestic (net). (-405) (-431) (1,973) (2,209) (26) (1,094) (1,040) n.a.
SHORT TERN FINANCING ANID CASH 144 38 1,145 512 2,032 -640 -655 n.a.
Source: Cmptroller General's Office and sission estimates

- 72 -
Table 5.14 COLOMBIA: SUMMARY ACCOUNTS OF THE DEPARTMENTS OPERATIONS, 1974-81 a/ b/(millions of Colombian Pesos)
Actual Preliminary1974 1975 1976 1977 1978 1979 1980 1981
Current Revenue 9,059 12,686 15,920 21,737 28,510 35,367 44,844 57,2651. Tax revenues 3,025 3,908 4,910 6,570 9,997 10,302 13,046 16,7782. Nontax revenues 6,034 8,778 11,010 15,167 18,513 25,065 31,798 40,487
a) Sales of goods andservices (5,401) (7,550) (9,084) (12,075) (14,597) (20,725) (26,060) (33,158)
b) Others (633) (1,228) (1,926) (3,092) (3,916) (4,340) (5,738) (7,329)
Current Expenditure 11,716 14,807 20,736 28,253 38,128 47,163 59,189 74,8151. Wages and salaries 6,599 8,455 11,770 15,760 22,114 27,860 33,630 42,4942. Purchases of goods and
services 3,326 3,641 5,398 7,560 9,810 12,436 16,317 20,5743. Interest 599 740 1,131 1,357 1,735 2,203 3,038 3,8154. Others 1,192 1,971 2,437 3,576 4,469 4,664 6,204 7,932
Savings Generated -2,657 -2,121 -4,816 -6,516 -9,618 -11,796 -14,345 -17,550
Current Public SectorTransfers (Net) 4,801 4,952 8,134 11,946 16,121 20,200 27,961 39,2661. Transfer revenues 4,992 5,126 8,323 12,117 16,498 20,626 28,453 39,834
s) From National Government (4,952) (5,108) (8,283) (11,766) (16,199) (20,141) (27,944) (39,117)b) From rest of National
Public Sector (40) (18) ( - ) (302) (254) (359) (116) (159)c) Municipalities ( - ) ( - ) (40) (49) (45) (126) (393) (558)
2. Transfer expenditures 191 174 189 171 377 426 492 568a) To National Government (7) (16) (24) (13) (22) (25) (30) (34)b) To rest of National
Public Sector (-) (-) (-) (-) (-) (-) (-) (-)c) Municipalities (184) (158) (165) (158) (355) (401) (462) (534)
Current Account Surplus or Deficit 2,144 2,831 3,318 5,430 6,503 8,404 13,616 21,716
Other Revenues 181 171 510 465 505 709 946 1,262
Capital Expenditures 1,485 2,179 3,853 4,702 6,096 6,083 7,970 10,7591. Fixed capital formation 1,485 2,179 3,853 4,702 6,096 6,083 7,970 10,7592. Financial investment - - - - - - - -
Overall Surplus or Deficit 840 823 -25 1,193 912 3,030 6,592 12,219
Financing -840 -823 25 -1,193 -912 n.a. n.a. n.a.1. External (net) - 43 55 - - n.a. n.a. n.a.2. Internal (net) 545 1,537 1,594 1,383 1,509 n.a. n.a. n.a.3. Cash balance -1,385 -2,403 -1,624 -2,576 -2,421 n.a. n.s. n.a.
a/ Includes departmental governments, decentralized agencies and nonfinancial public enterprises.b/ Accrual basis.
n.a. - Not available.
Source: Comptroller General's Office, Planning Office and IBRD mission's estimates.

- 73 -
Table 5.15 COLCIMEIA: SUMMARY ACCOUNTS OF THE MUNICIPALITIES OPERATIONS, 1!'74-81(millions of Colombian Peaios)
Actual Preliminary1974 1975 1976 1977 1978 197" 1980 1981
Current Revenue 9,467 11,999 15,414 19,890 25,666 33,109 44,697 57,6591. Tax revenue 2,967 3,537 4,115 4,137 6,514 8,903 23,023 15,5102. Nontax revenue 6,500 8,462 11,199 14,753 19,152 24,206 32,674 42,149
a) Sales of goods andservices (5,842) (7,846) (10,019) ('13,151) (17,234 (21,785) (29,406) (37,934)
b) Other (658) (976) (1,280) (1,602) (1,918) (2,421) (3,268) (4,215)
Curreit Expenditure 8,968 11,958 14,352 18,972 23,018 29,164 39,467 50,5181. Wages and salaries 4,417 5,867 7,248 10,035 l.1,934 14,8L5 20,049 25,6122. Purchases of goods and
services 2,507 3,569 3,825 5,150 5,748 7,932 10,735 13,7403. Interest 1,760 2,220 2,924 3,279 4,696 5,600 7,538 9,6484. Others 384 302 355 508 640 1,447 1,145 1,518
Savinjs Generated 499 41 1,062 918 2,648 3,945 5,230 7,141
Currenit Public Sector Transfers(net) 1,664 2,285 3,160 3,788 4,803 8,290 5,614 7,3021. Transfer revenues 1,832 2,592 3,597 T0 5,268 8,893 6,395 8,313
a) From National Goverrment (788) (1,685) (2,395) (3,390) (4,363) (7,382) (5,573) (7,240)b) From rest of National
Public Sector (126) (42) (52) (104) (85) (133) (173) (224)c) Departments (918) (865) (1,150) (566) (820) (1,378) (649) (849)
2. Transfer expenditures 168 307 437 272 465 603 781 1,011a) To National Government (11) (25) (21) (39) (42) (49) (62) (80)b) To rest of National
Public Sector (11) (13) (14) (21) (28) (36) (48) (62)c) To Departments (146) (269) (402) (212) (395) (5]L8) (671) (869)
Current Account Surplus or Deficit 2,163 2,326 4,222 4,706 7,451 12,235 10,844 14,443
Other Revenues 327 251 193 166 197 1'7 158 142
Capital Expenditure 4,482 6,104 7,920 9,971 11,566 13,4L6 15,560 18,0491. Fixed capital formation 4482 7,104 7 920 9,971 T1,566 T46 15,560 18,0492. Financial investment - - - - - - -
OveralLl Surplus or Deficit -1,992 -3,527 -3,505 -5,099 -3,918 -1,004 -4,558 -3,464
Finsancin 1,992 3,527 3,505 5,099 3,918 1,00)4 n.a. n.a.1. External (net) 1,138 1,284 2,713 2,331 2,162 n.a. n.a. n.a.2. Internal (net) 1,043 1,724 1,509 2,631 2,535 n.a. n.a. n.a.3. Cash balance -189 519 -177 137 -779 n.a. n.a. n.a.
n.a. *- Not Available.
SourcIe: Comptroller General"s Office and IBRD mission's estimates.

- 74 -Page 1 of 2
Table 5.15-1 COLOMBIA: SUMMARY ACCOUNTS OF MAJOR MUNICIPAL NONFINANCIALPUBLIC ENTERPRISES, 1974-81)(millions of Colombian Pesos)
Actual Preliminary1974 1975 1976 1977 1978 1979 1980 1981
I. Empresas Publicas de Medellin (EPM)
I. OWN CURRENT REVENUES 996 1,160 2,303 2,664 3,265 4,000 7,216 9,225Sale of goods and services 883 1 019 1,881 2,294 2,998 3,680 5,347 6, 826Other current revenues 113 141 422 370 267 320 1,869 2,399
II. DIRECT CURRENT EXPENDITURES 505 596 792 1,174 1,663 2,355 4,415 5,557Remuneration n.a. n.a. n.a. n.a. n.a. n.a. n.a. n.a.Purcbases of goods and
services n.a. n.a. n.a. n.a. n.a. n.a. n.a. n.a.Interest payments n.a. n.a. n.a. n.a. n.a. n.a. n.a. n.a.Current transfers to
private sector n.a. n.a. n.a. n.a. n.a. n.a. n.a. n.a.Others n.a. n.a. n.a. n.a. n.a. n.a. n.a. n.a.
IIIa. SAVINGS GENERATED 490 563 1,511 1,490 1,602 1,722 2,801 3,668IIIb. CURRENT PUBLIC SECTOR
TRANSFERS (NET) -35 -44 -50 -98 -122 -152 -12 -16IlIc. CURRENT ACCOUNT SURPLUS OR
DEFICIT 455 520 1,461 1,392 1,480 1,570 2,789 3,652
IV. OTHER REVENUES - - - 107 420 800 - -Capital transfers from
public sector - - - 107 420 800 - -
V. CAPITAL EXPENDITURE 1,181 1,422 2,021 2,189 2,486 2,822 3,663 4,241Fixed capital formation 1,090 1,307 1,871 2, 189 2,486 2,822 3,663 4,241Financial investment 91 114 150 - - - - -
VI. OVERALL SURPLUS OR DEFICIT -726 -902 -560 -690 -586 -452 -874 -589
VII. LONG TEEM FINANCING 392 491 556 888 948 205 -55 n.a.Loans granted 11 13 - - - n.S. - n.a.Loans received 381 477 556 888 948 n.a. -55 n.a.a. Foreign (net) 132 165 106 552 - - n.a.b. Domestic (net) 249 312 450 336 - -55 n.a.
VIII. SHORT TERM FINANCING ANDCASH 334 411 4 -198 -362 -247 929 n.a.
II. Empresa de Acueducto y Alcantarillado de Bogota (EAAB)
I. OWN CURRENT REVENUES 570 744 960 1,485 1,912 2,461 3,115 4,036Sale of goods and services 488 626 928 1,141 1,875 2,412 2,922 3,786Other current revenues 82 118 32 344 37 49 193 250
II. DIRECT CURRENT EXPENDITURES 330 409 709 726 892 1 095 1,938 2,526Operating expenditures 289 366 632 726 892 1,095 1,938 2,526Interest payments 41 43 77 - - - - -
IIIa. SAVINGS GENERATED 240 355 251 759 1,020 1,366 1,177 1,510IIlb. CURRENT PUBLIC SECTOR
TRANSFERS (NET)- - - - 11 234 313 1 -IIIc. CURRENT ACCOUNT SURPLUS OR
DEFICIT 240 335 251 770 1,254 1,679 1,178 1,510
IV. OTHER REVENUES 36 8 _ _ - - - _
V. CAPITAL EXPENDITURES 483 1,201 2,000 993 1,520 2,325 1,978 2,292Fixed capital formation 483 1201 2, 000 993 1,520 2,325 1,978 2.292Financial investment - - - - - - - -
VI. OVERALL SURPLUS OR DEFICIT -207 -858 -1,749 -223 -266 -646 -800 -782
VII. LONG TERM FINANCING 97 629 1,149 308 213 516 334 n.a.Loans granted - - 300 - - - - n.a.Loans received 97 629 849 308 213 516 334 n.a.a. Foreign (net) 82 580 249 - - - - n.a.b. Domestic (net) 15 49 600 - - - 334 n.a.
VIII. SHORT TERM FINANCING ANDCASH 110 228 600 -85 53 130 466 n.a.
n.a. - not available
Source: Financial Report of the Ccmptroller's Office

- 75 -
Page 2 of 2
Table 5.15-1 COLOMBIA: SUMMARY ACCOUNTS OF MAJOR MUNICIPAL NONFII1ANCIALPUBLIC ENTERPRISES, 1974-81(millions of Colombian Pesos)
Actual Preliminary1974 1975 1976 1977 19S78 1979 1980 1981
III. Empresa de Energia Electrica de Bogota. (EEEB)
I. OWN CURRENT REVENUES 910 1,422 1,701 2,470 3,408 4,753 5,910 7,610Sale of goods and servicesw 767 1,016 1,378 1,,982 3,020 4,248 5,645 7,267Other current revenues 143 406 323 488 388 50'i 265 343
II. DIRECT CURRENT EXXPENDITURES 562 667 781 1,947 2,393 3,527 2,994 3,839Operating expenditures 358 - 558 1,815 1,905 2,578 2,994 3,839Interest payments 158 - 198 132 488 949 - -Others 47 - 25 - - - - -
IIIa. SAVINGS GENERATED 348 755 920 523 1,015 1,046i 2,916 3,771IITb. CURRENT PUBLIC SECTOR
TRANSFERS (NET) - - - - - - -67 -87
IlIc:. CURRENT ACCOUNT StRPLUS ORtDEFICIT 348 755 920 523 1,015 1,046 2,849 3,684
IV. OTHER REVENUES - - - 978 493 584 80 72
V. CAPITAL EXPENDITURE 510 937 996 1,062 3,956 3,852 5,166 5,720Fixed capital formation 316 589 703 1,062 3,239 2,915 5,166 5,720Financial investment 193 349 293 - 717 937 -
VI. OVERALL SURPLUS OR DEFICIT -162 -182 -76 439 -2,448 -2,222 -2,237 -1,964
VII. LONG TERM FINANCING 59 529 50 -438 1,752 2,088 1,524 n.a.Loans granted (net) 18 - - - - n.a.Loans received 41 529 50 n.a. n.a. n.a, 1,524 n.a.a. Foreign (net) (-7) (529) (50) (ni.a.) (n..a) (n-a,) - n.a.b. Domestic (net) (48) (-) C-) (n.a.) (rn.a.) (n.am,) 1,524 n.a.
VII]. SHORT TERM FINANCING ANDCASH 103 346 26 -1 696 134 713 n.a.
n.a<,- not available
Source: Financial Report of the Comptroller's Office and miss:Lon's estimates

- 76 -
Table 5.16 COLOMBIA: PUBLIC SECTOR GROSS FIXED INVESTMENT 1974-81(aillions of Colombian Pesos)
Actual Preliminary1974 1975 1976 1977 1978 1979 1980 1981
TOTAL GROSS FIXED INVESTMENT 18,448 20,656 32,059 45,832 51,906 65,906 114,574 137,8391. Central Government 4,596 4,723 5,411 7,175 10,651 14,996 26,828 29,034
- National Goverment 1,512 1,743 1,559 1,920 2,765 3,662 9,301 3,005- National Highway Fund 2,439 2,492 3,328 4,584 6,619 9,319 15,508 23,421- CAVECINALES 282 241 252 484 822 1,580 1,959 2,537- Social Security 363 247 272 187 445 435 60 71
2. National Decentralized Agencies 3,653 3,309 4,572 7,250 11,116 13,237 32,930 39,925- ICBF 36 47 65 249 950 223 4,871 5,905- INCORA 364 482 450 20 1,251 315 1,113 1,349- ICA 25 46 222 2 1,020 1,526 1,707 2,070- HIMAT 11 3 - 34 480 737 1,160 1,406- ICEL 16 14 791 1,612 1,889 1,602 3,813 4,623- Fondo Nactonal Hospitalario 210 475 251 437 164 382 1,330 1,612- CVC 628 203 655 1,106 1,357 1,763 4,440 5,395- INAS 127 142 160 194 320 700 1,004 1,180- FAN 663 210 178 447 506 1,530 2,212 2,682- SENA 69 176 144 371 230 533 1,009 1,223- ICCE 691 523 529 603 751 1,016 905 1,053- INSFOPAL 96 354 566 943 861 913 1,686 2,044- Fondo Inmuebles Nacionales --- -- - 256 551 1,195 1,449- Rest. 717 634 561 1,232 1,081 1,446 6,485 7,934
3. National Nonfinancial PublicEnterprises 4,232 4,341 10,303 16,734 12,477 18,174 31,286 40,072
- TELECOM 308 351 717 1,156 1,388 2,465 5,221 6,350- COLPUERTOS 94 194 300 423 315 620 480 603- ECOPETROL 2,136 2,908 4,939 8,801 6,224 8,350 7,466 10,421- IDEMA 630 92 648 2,100 64 20 253 322- CORELCA 213 44 909 1,230 1,709 1,485 8,615 9,755- ISA 333 294 1,930 2,196 2,607 4,511 8,156 6,768- Rest. 518 458 860 828 170 723 1,095 5,853
4. Departoents 1,485 2,179 3,853 4,702 6,096 6,083 7,970 10,759
5. Municipalities 4,482 6,104 7,920 9,971 11,566 13,416 15,560 18,049- EPM 1,090 1,307 1,871 2,189 2,486 2,822. 3,663 4,241- EAB 483 1,201 2,000 993 1,520 2,325 1,978 2,292- EEEB 316 589 703 1,062 3,239 2,915 5,166 5,720- Rest. 2,593 3,007 3,346 5,727 4,321 5,354 4,753 5,796
Source: Financial Report of the Comptroller General's Office

Table 5.i7 COL7POIBA: REAL PUBLiC SEiCTOR GROSS FIXED INVESTMEFNT, 1974-81(millions of 1970 Colombian Pesos)
Actual Preliminary1974 1975 1976 1977 1978 1979 1980 1981
TOTAL REAL GROSS FIXED INVESTMENT 9,155 8,479 10,832 11,728 10,711 10,771 14,754 13,971
1. Central Government 2,281 1,939 1,828 1,836 2,198 2,450 3,455 2,943- National Government 750 716 527 491 571 J90 ;1 30;- Transport 1,350 1,122 1,209 1,297 1,528 1,781 2,249 2,631- Health 180 101 92 48 99 71 8 7
2. National Decentralized Agencies 1,813 1,358 1,545 1,856 2,294 2,163 4,240 4,046- Family Welfare 18 19 22 64 196 36 627 596- Agriculture 199 218 227 14 568 421 512 507- Power 320 89 489 697 670 550 1,063 1,204- Health 104 195 85 112 34 62 171 127- Water Supply 111 204 245 291 244 264 346 305- Transportation 329 86 60 114 104 250 285 332- Education 377 287 227 249 202 253 246 220- Public Buildings - - - - 53 90 154 93- Rest 356 260 190 315 223 237 835 662
3. National Non-Financial PublicEnterprises 2,100 1,782 3,481 4,282 2,574 2,970 4,029 4,062- Telecommunications 153 144 242 296 286 403 672 644- Transportation 47 80 101 1U 65 101 62 61- Petroleum 1,060 1,194 1,669 2,252 1,284 1,365 961 1,056- Agriculture 313 38 219 537 13 3 33 33- Power 271 139 959 877 891 980 2,160 1,675- Rest 257 188 291 212 35 118 141 593
4. Departments 737 894 1,302 1,203 1,258 994 1,026 1,091
5. Municipalities 2,224 2,506 2,676 2,551 2,387 2,193 2,004 1,829- Power 698 778 870 832 1,181 938 1,137 1,010- Water Supply 240 493 676 254 314 380 255 232- Rest 1,286 1,235 1,130 1,465 892 875 612 587
Source: Table 5.16 and mission estimates.

- 78 -
Table 5.18 COLOMBIA: SUMMARY ACCOUNTS OF THE NATIONAL FINANCIALENTERPRISES OPERATIONS, 1974-81(millions of Colombian pesos)
Actual Estimate1974 1975 1976 1977 1978 1979 1980 1981
Current Revenue 4,780 5,938 8,044 9,925 33,156 34,345 43,956 56,2631. Tax revenue 290 1,154 1,881 2,537 3,517 4,146 6,661 7,1232. Nontax revenue 4,490 4,784 6,163 7,388 29,639 30,199 37,195 49,140
a. Sale of goods andservices (20) (53) (113) (94) (310) (148) (41) (54)
b. Current transfers (1,745) (1,595) (1,339) (1,969) (1,808) (3,588) (5,170) (6,830)c. Others (2,725) (3,136) (4,711) (5,325) (27,521) (26,463) (32,084) (42,256)
Current Expenditure 1,928 2,057 2,133 3,006 3,705 4,803 6,681 9,2861. Wages and salaries 256 366 451 592 811. 1,083 1,186 1,6432. Purchases of goods and
services 141 161 295 394 466 589 635 8823. Current transfers 927 918 507 649 832 899 1,278 1,7744. Interest payments 604 612 880 1,371 1,596 2,232 2,582 4,987
Savings Generated 2,852 3,881 5,911 6,919 29,451 29,542 37,275 46,977
Capital Revenue 1,012 535 749 864 1,093 1,084 2,016 3,729
Capital Expenditure 4,424 6,554 7,118 9,440 33,607 33,118 43,172 56,1231. Direct investment 2,782 4,661 5,623 4,286 5,728 7,278 14,725 19,1372. Indirect investment 1,642 1,893 1,495 5,154 27,879 25,840 28,447 36,986
Overall Surplus or Deficit -560 -1,238 -458 -1,657 -3,063 -2,492 -3,881 -5,417
Financing 560 2,138 458 1,657 3,063 2,492 3,881 5,4171. External -128 32 -178 -209 143 78 1,055 1,4622. Internal 685 2,019 1,302 2,084 3,130 3,586 2,944 4,1063. Cash balance 3 87 -671 -218 -21.0 -1,172 -118 -151
Note: The National Financial Enterprises include PROEXPO, CFT, IFI, ICETEX, INSCREDIAL, FONADE, FNAand CAVIMILITAR.
Source: Financial report of the Comptroller General's Office and mission estimates
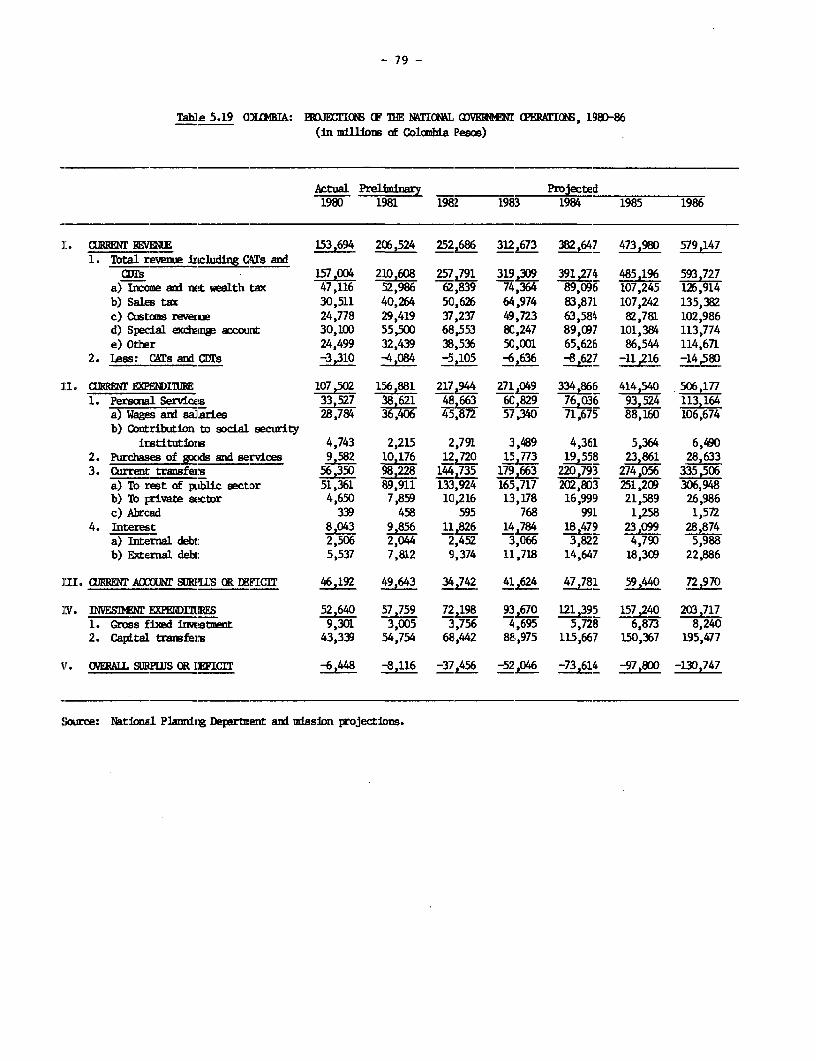
- 79 -
Table 5.19 COMBIA: ILEXIGS CF THE NMllON.L WVER4MI (PERATI(O, 1980-86(in mUilons of ColmbiLa Pesos)
Actual Predim - Projected1980 1981 1982 1983 1984 1985 1986
:'. aCLIENT REVENEE 153,694 206,524 252,686 312,673 382,647 473,980 579,1471. Total revenue irwluding CATS and
CDTs 157,004 210,608 257,791 319,309 391,274 485,19 593,727a) Income and net wealth tax 47,116 52,986 62,839 74,364 89,096 107,245 126,914b) Sales tax 30,511 40,264 50,626 64,974 83,871 107,242 135,382c) Custxs revene 24,778 29,419 37,237 49,723 63,584 82,781 102,986d) Special ecxgW account 30,100 55,500 68,553 80,247 89,097 101,384 113,774e) Other 24,499 32,439 38,536 50,001 65,626 86,544 114,671
2. Less: CATs and CDrs -3,310 -4,084 -5,105 -6,636 8 _7 -11,216 -14,580
]:. *CLRRENT EXPENDI1TIE 107,502 156,881 217,94 271,049 334,866 414,540 506,1771. Personal Services 33,527 38,621 48,663 6C,829 76,036 93,524 113,164
a) Wages and sallaries 28,784 36,406 45,872 57,340 71,675 88,160 106,674b) Contribution to social security
iustitutiols 4,743 2,215 2,791 3,489 4,361 5,364 6,4902. Purchases of gocds and services 9,582 10,176 12,720 15,7n73 19558 23,861 28,6333. Current transfers 5;35-0 98,228 144.735 179,663 220,793 274,056 335,506
a) To rest of ptiblc sectDr 51,361 89,911 133,924 165,717 202,803 251,209 306,948b) TD private sectur 4,650 7,859 1C,216 13,178 16,999 21,589 26,986c) Abroad 339 458 595 768 991 1,258 1,572
4. Interest 8,043 9,856 11U826 14J784 18,479 23,099 28,874a) Internal debt: 2,506 2,044 2,452 3,066 3,822 4,79D 5,988b) External debt: 5,537 7,812 9,374 11,718 14,647 18,309 22,886
III. CtEENT A)X1INf SURPLUS CR DEFICIT 46,192 49,643 34,742 41,624 47,781 5944 0
XV. INESMNT EXPENDITEES 52,640 57,79 72,198 93,670 121,395 157,240 203,7171. Gross fixed inrv!strent 9,301 3,005 3,756 4,695 5,728 6,873 8,2402. Capiltal trasfers 43,339 54,754 68,442 88,975 115,667 150,367 195,477
V. OVERIL SUEEtuS OR IICIT -6,448 -8,116 -37,456 -52,046 f1,!14 -97,800 -13,747
'Surce: National Plaxmdig Department and mission projections.
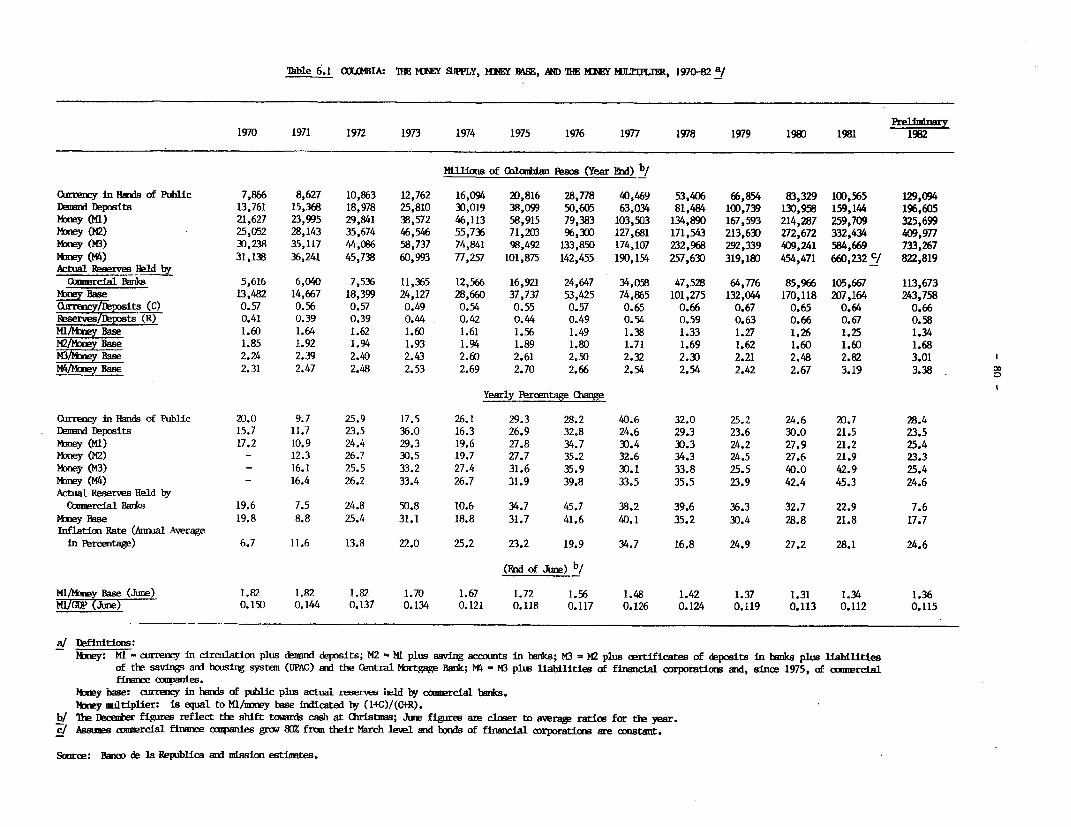
Tble 6.1 CaMBIA: ITE KfEY SIPPLY, MNEY MAM, AND MIHE EY ML1UL, 1970-82 a/
1970 1971 1972 1973 1974 1975 1976 1977 1978 1979 1980 1981 1982
Miions of Colcmian Pesos (Year End) I/
Currency in Haids of Public 7,866 8,627 10,863 12,762 16,094 20,816 28,778 40,469 53,406 66,854 83,329 100,565 129,094
Dwmd Deosits 13,761 15,368 18,978 25,810 30,019 38,099 50,605 63,034 81,484 100,739 130,958 159,144 196,605
Maoy (M4) 21,627 23,995 29,841 38,572 46,113 58,915 79,383 103,503 134,890 167,593 214,287 259,709 325,699
MneY (M2) 25,052 28,143 35,674 46,546 55,736 71,203 96,3C0 127,681 171,543 213,630 272,672 332,434 409,977
MD-Y (M3) 30,238 35,117 44,086 58,737 74,841 98,492 133,850 174,107 232,968 292,339 409,241 584,669 733,267
MDney (M4) 31,138 36,241 45,738 60,993 77,257 101,875 142,455 190,154 257,630 319,18 454,471 660,232 C/ 822,819
Actual Reserves HeI tbyCimmrcial Banks 5,616 6,040 7,536 11,365 12,566 16,921 24,647 34,058 47,528 64,776 85,966 105,667 113,673
Money BaSe 13,482 14,667 18,399 24,127 28,660 37,737 53,425 74,865 101,275 132,044 170,118 207,164 243,758
7 ;rrencytD8p-its (C) 0.57 0.56 0.57 0.49 0.54 0.55 0.57 0.65 0.66 0.67 0.65 0.64 0.66
Reserves/Daposts (R) 0.41 0.39 0.39 0.44 0.42 0.44 0.49 0.54 0.59 0.63 0.66 0.67 0.58
Ml Base 1.60 1.64 1.62 1.60 1.61 1.56 1.49 1.38 1.33 1.27 1.26 1.25 1.34
M 2 Base 1.85 1.92 1.94 1.93 1.94 1.89 1.80 1.71 1.69 1.62 1.60 1.60 1.68
/Money BaSP 2.24 2.39 2.40 2.43 2.60 2.61 2.50 2.32 2.30 2.21 2.48 2.82 3.01 1
/M4ney Bafie 2.31 2.47 2.48 2.53 2.69 2.70 2.66 2.54 2.54 2.42 2.67 3.19 3.38 O0
Yearly Percentage C hn
Currency in Hands of Public 20.0 9.7 25.9 17.5 26.1 29.3 28.2 40.6 32.0 25.2 24.6 20.7 28.4
Demand Deposits 15.7 11.7 23.5 36.0 16.3 26.9 32.8 24.6 29.3 23.6 30.0 21.5 23.5
Maiey (Ml) 17.2 10.9 24.4 29.3 19.6 27.8 34.7 30.4 30.3 24.2 27.9 21.2 25.4
Money (M2) - 12.3 26.7 30.5 19.7 27.7 35.2 32.6 34.3 24.5 27.6 21.9 23.3
M-ey (M3) - 16.1 25.5 33.2 27.4 31.6 35.9 30.1 33.8 25.5 40.0 42.9 25.4
M,ney (M4) - 16.4 26.2 33.4 26.7 31.9 39.8 33.5 35.5 23.9 42.4 45.3 24.6
Actual Reserves Held byCQmercial Banks 19.6 7.5 24.8 50.8 10.6 34.7 45.7 38.2 39.6 36.3 32.7 22.9 7.6
MXey Base 19.8 8.8 25.4 31.1 18.8 31.7 41.6 40.1 35.2 30.4 28.8 21.8 17.7iflation Rate (Annual Average
in Peroentage) 6.7 11.6 13.8 22.0 25.2 23.2 19.9 34.7 16.8 24.9 27.2 28.1 24.6
(End of june) b/
Ml/ ney Base (June) 1.82 1.82 1.82 1.70 1.67 1.72 1.56 1.48 1.42 1.37 1.31 1.34 1.36MI/IP' (June) 0.150 0.144 0.137 0.134 0.121 0.118 0.117 0.126 0.124 0.119 0.113 0.112 0.115
a/ Definitions:MDney: Ml = currency in circulation plus demnd deposits; M2 = Ml plus saving accotmts in bmns; M3 - M2 plus certificates of deposits in banks pls liabilities
of the savings ani housirg system (UPAC) ard the Central Ibrtgage Bank; A4 = M3 pltu liabilities of financial corporations and, sinue 1975, of amircialfirnce cnanies.
14oney base: curnency in bnans of jxibc plus actual reserves beld 'by Paxrcial banks.IMey nuiltiplier: is eual to Ml/mney base indicated by (1+C)/(C+R).
b/ jChe lbrr figures reflect the shift tacrds cash at QtristnEs; June figures are closer to average raticas for the year.Assms comsercial finance aipanies grm 80% from their March level and bonds of financial orporatiens are constant.
Satrce: Banco de la Republica and mLssion estisetes.

- 81 -
Table 6.2 COLOMBIA: COMPOSITION AND GROWTH OF THE MONEY SUPPLY 196C, 1970-82(millions of Pesos)
Currency Total Percentage Currency withEncl of Currency with the Demand Money Increase Public as Z ofPeriod Outstanding Public Deposits Supply a, During Period Money Supply
1960 1,724 1,606 2,497 4,103 10.4 39.115'70 8,357 7,866 13,761 21,627 17.2 36.415971 9,137 8,627 15,368 23,995 10.9 36.01972 11,400 10,863 18,978 29,841 24.4 36.41S'73 13,432 12,762 25,810 38,572 29.3 33.11574 16,895 16,094 30,019 46,113 19.6 34.91975 22,075 20,816 38,099 58,915 27.8 35.315976 30,105 28,778 50,605 79,383 34.7 36.31977 42,160 40,469 63,034 103,503 30.4 39.11978 55,485 53,406 81,484 134,890 30.3 39.61179 69,928 66,854 100,739 167,593 24.2 39.91980 89,331 83,329 130,958 214,287 27.9 38.919181 108,338 100,565 159,144 259,709 19.0 38.71982 137,759 129,094 196,605 325,699 19.0 39.6
1977 I 20,420 17,838 63,167 81,005 2.0 22.01977 II 21,410 20,721 69,536 90,457 11.7 22.91977 III 23,045 21,076 69,596 90,672 0.2 23.21977 IV 42,160 40,469 63,034 103,503 14.2 39.1
1978 I 28,296 25,286 79,219 104.505 1.0 24.21978 II 31,154 28,442 85,184 113,626 8.7 25.01978 III 31,583 28,979 90,664 119,643 5.3 24.21978 IV 55,432 53,406 81,484 134,890 12.7 39.6
1979 I 35,850 32,771 96,426 129,197 -4.2 .25.41979 II 41,078 3?,873 104,113 141,986 9.9 26.71979 III 39,551 36,501 111,646 148,147 4.3 24.61979 IV 69,928 66,854 100,739 167,593 13,1 39.9
1980 I 50,629 45,174 123,672 168,846 0.7 26.81980 II 52,943 46,470 131,869 178,339 5.6 26.11980 III 51,401 44,988 131,458 176,446 -1.1 25.51980 IV 89,331 83,329 130,958 214,287 21.4 38.9
1981 I 61,686 53,869 155,217 209,086 -2A4 25.81981 II 71,010 65,161 157,622 222,783 6.6 29.21981 III 65,201 62,635 155,632 218,267 -2.0 28.71981 IV 108,338 100,565 159,144 259,709 19.0 38.7
1982 I 76,393 68,059 182,397 250,456 -3.6 27.21982 II 88,693 80,331 195,747 276,078 10.2 29.11982 III 86,370 79,505 194,255 273,760 -0.8 29.01982 IV 137,759 129,094 196,605 325,699 19.0 39.6
a/ Currency Outstanding less cash holdings of banks equals Currency with the Public. Adding Demand Deposits toCurrency with the Public gives Total Money Supply, Ml, defined as to exclude deposits of the Government andofficial entities in the Central Bank.
Souarce: Banco de la Republica

- 82 -
Y'able 6.a COLIAtlA: CUUMKhAL bANK LOAhS, BY qUARTEk, 1970-82 a/(wans uutstanaiuig at end of quarter, millions of Pesos)
Table 6.3 COLOMBIA: COMMERCIAL BANK LOANS, BY QUARTER, 1970-82 al(Loans Outstanding at end of Quarter, millions of Pesos)
AgricultureConstruc- Govern-
Coffee Other b/ Total Livestock Commerce Industry Mining tion ment Other c/ Total
197J 1 310.7 667.1 977.8 1,567.8 2,646.8 2,953.6 45.9 446.9 673.2 875.0 10,186.8It 339.5 740.6 1,080.1 1,622.3 2,817.0 2,947.0 40.1 471.1 721.3 902.0 10,600.9
III 360.8 1,468.5 1,829.3 1,675.2 2,907.2 2,659.0 39.2 421.3 774.1 930.4 11,235.8IV 383.8 1,409.5 1,793.3 1,788.3 3,137.2 2,727.6 48.1 483.1 849.8 1,010.3 11,837.7
1971 1 362.6 1,629.6 1,992.2 1,811.6 3,147.3 2,796.3 54.4 459.9 872.8 1,098.8 12,269.5II 412.6 1,473.6 1,886.2 1,869.8 3,237.0 2,799.3 54.3 493.9 942.2 1,210.8 12,493.5
III 460.6 1,682.5 2,143.1 1,927.6 3,477.7 2,894.0 57.4 497.6 948.4 1,340.3 13,810.6IV 485.3 1,635.4 2,120.7 1,999.9 3,657.9 2,355.5 60.1 519.1 701.3 2,396.1 13,810.6
1972 1 476.0 1,981.5 2,457.5 2,004.8 3,431.6 2,925.6 45.7 557.1 1,034.2 2,234.2 14,690.7II 497.5 1,774.9 2,272.4 2,055.0 3,699.1 3,015.1 61.2 603.4 1,195.9 2,254.5 15,156.6
III 526.5 2,168.1 2,694.6 2,035.5 3,613.6 2,946.0 58.4 620.3 1,306.0 2,337.6 15,612.0IV 543.2 2,036.2 2,579.4 2,065.5 3,949.0 3,310.5 76.6 644.6 1,436.2 2,166.6 16,228.4
1973 1 188.2 2,678.1 2,886.3 2,096.1 4,215.0 3,583.3 59.8 663.0 1,513.0 1,701.8 16,698.3II 200.8 2,327.3 2,528.1 2,069.9 4,070.4 3,907.3 77.0 662.8 1,531.6 2,004.9 16,832.0
III 247.2 2,720.9 2,698.1 2,073.8 4,276.9 5,174.8 90.6 674.0 1,536.4 1,870.3 18,691.9IV 318.4 2,683.9 3,002.3 2,026.6 4,807.3 5,983.2 96.5 753.9 2,545.2 1,944.2 21,159.2
1974 I 367.6 3,964.2 3,431.8 1,871.2 5,078.7 6,396.0 93.5 802.4 2,680.5 2,178.8 22,533.2II 481.6 3,427.1 3,908.7 1,754.6 5,275.3 6,762.6 85.7 822.9 2,948.0 2,081.8 23,639.7
III 605.1 4,910.5 5,515.6 1,638.4 5,701.2 7,075.4 106.6 875.2 2,919.1 2,204.7 26,036.3IV 839.9 4,099.7 4,939.6 1,567.8 5,857.3 8,250.4 138.5 895.4 2,397.6 5,434.6 29,481.2
1975 I 800.1 4,017.4 4,817.5 1,470.5 5,987.4 8,494.0 155.0 911.0 2,522.5 6,936.1 31,294.1II 871.4 4,450.9 5,322.3 1,455.8 6,518.9 8,827.8 190.3 945.6 2,688.7 6,795.9 32,745.3
III 1,007.2 4,797.4 5,804.6 1,464.8 7,684.1 9,757.7 222.6 1,014.4 2,871.5 8,094.7 36,914.4IV 1,024.5 5,311.2 6,335.7 1,432.6 8,611.4 10,260.0 223.1 1,027.9 2,872.7 7,300.1 38,063.5
1976 I 965.6 4,995.6 5,961.2 1,409.5 9,036.8 10,693.3 222.7 1,079.6 2,842.9 8,579.7 39,825.7II 1,167.2 5,401.6 6,568.8 1,393.5 9,320.4 11,338.1 271.2 1,071.8 2,819.1 7,398.3 40,182.2
III 1,465.6 5,976.3 7,441.9 1,278.6 10,117.5 12,739.9 309.8 1,078.6 2,816.0 8,827.4 44,609.7IV 1,551.8 6,800.0 8,351.0 1,301.0 11,821.7 13,962.8 292.7 1,093.2 3,281.3 8,548.3 48,652.0
1977 1 1,476.2 6,714.1 8,190.3 1,357.5 11,236.1 14,734.2 325.6 1,175.5 5,183.2 10,722.6 52,925.0II 1,648.4 7,582.6 9,231.0 1,384.1 12,226.4 16,182.1 307.5 1,183.4 6,655.2 10,173.8 57,343.5
III 1,551.0 9,453.7 11,004.7 1,438.3 12,705.2 18,190.8 286.1 1,082.7 7,734.1 11,514.2 63,956.1IV 1,904.0 11,010.8 12,914.8 1,282.0 14,516.0 20,276.8 365.2 1,115.7 9,037.2 11,137.8 70,028.6
1978 1 1,544.1 10,389.6 11,933.7 1,487.8 12,458.6 21,123.2 392.8 1,263.5 9,348.3 12,924.5 70,932.4II 1,752.0 11,933.0 13,685.0 1,577.4 14,167.2 22,520.5 368.7 1,370.9 10,187.2 13,533.6 77,410.5
III 1,393.7 12,964.2 14,357.9 1,704.8 14,524.0 22,788.2 420.6 1,506.5 10,601.3 14,679.3 80,583.1IV 2,035.0 13,398.0 15,433.0 1,772.0 17,151.0 459.0 1,469.0 10,764.0 85,422.0
1979 I n.a n.a 10,581.9 6,285.6 15,412.8 12,876.7 499.4 1,465.5 11,619.6 26,019.9 84,761.4II 11,801.4 7,173.2 16,385.9 13,367.2 520.9 1,570.0 11,683.2 24,475.7 86,977.5
III 12,645.3 7,838.1 15,735.3 13,327.6 508.6 1,535.0 11,608.5 27.130.3 90,328.7IV 13,369.0 8,450.5 18,248.5 14,471.9 373.7 1,717.9 11,869.0 27,388.9 95,889.1
1980 I u.a n.a 12,689.0 8,470.9 18,268.6 14,230.5 435.3 1,769.4 12,057.1 29,115.2 97,036.6II 13,965.0 9,054.9 20,697.8 15,369.8 294.7 1,964.9 11,750.4 30,807.5 103,905.0
III 14,986.9 10,018.2 19,962.6 16,266.6 211.6 2,102.6 9,661.5 34,397.9 107,607.9IV 16,660.8 11,220.4 38,055.0 21,268.0 197.0 2,786.9 11,317.6 46,555.8 148,061.5
1981 I n.a n.a 15,576.0 11,218.4 36,886.6 22,107.2 224.9 2,795.3 12,645.3 57,029.9 158,483.6II 17,373.5 11,676.7 40,334.0 22,874.3 197.2 2,915.7 12,326.5 54,096.9 161,794.8
III 18,345.4 12,289.9 38,507.5 23,836.8 205.0 3,038.6 12,301.5 63,925.3 172,450.0IV n.a n.a. 19,806.0 13,498.5 54,764.3 30,975.1 229.6 3,662.5 17,200.8 71,577.9 211,714.7
1982 I n.a n.a 19,868.5 13,781.9 52,815.9 30,113.4 241.5 3,439.4 17,265.0 73,618.4 211,144.0II n.a n.a 22,472.8 14,695.5 57,047.9 32,005.8 254.4 3,692.1 17,364.9 81,266.6 228,800.0
a/ Figures may not add to row totals because of roundings.9/ Includes warehouse bonds after second quarter of 1970.cf "Export Development' account included starting Dec. 1978 in 'other" (previously included in industry).
Source: Banco de la Republica.

- 83 -
Table 6.4 COLOMBIA: BANKING SYSTEM LOAIS, BY QUARIER, 1970-82 a/(Loans Outstanding at end of Quarter, millions of Pesos)
Commercial Bank Loans b/ Total Banking System Loans c|Short d/ Medium e/ Long 'I Total Short d/ Medium _/ Long f/ Total
1970 I 7,208.5 1,714.2 1,264.1 10,186.8 9,054.7 4,629.3 5,281.1 18,965.11I 7,530.1 1,741.7 1,329.1 10,600.9 9,315.1 4,730.8 5,703.8 19,469.7
III 8,173.1 1,677.1 1,395.6 11,235.8 10,100.4 4,819.0 6,198.8 21,118.2IV 8,490.9 1.752.5 1,594.3 11,837.7 10,518.7 5,070.5 6,916.7 22,505.9
1971 I 8,715.5 1,771.9 1,782.1 12,269.5 10,715.4 5,240.9 7,650.1 23,606.4II 8,830.8 1,909.7 1,753.0 12,493.5 10,811.4 5,505.8 8,264.1 24,581.3
III 9.,440.7 2,041.1 1,804.4 13,286.2 11,676.6 5,840.8 9,023.5 26,540.9IV 9,844.1 2,078.6 1,887.8 13,810.5 12,187.4 6,045.0 9,739.5 29,413.5
1972 I 10,578.1 2,107.6 2,005.1 14,680.8 13,062.3 6,044.7 .O,306.5 29,413.5II 10,836.9 2,214.1 2,105.5 15,156.5 13,276.9 6,362.4 [0,880.4 30,519.7III 11, 106.3 2,310.6 2,195.2 15,612.1 13,760.8 6,513.2 11,427.8 31,701.8IV 11,559.7 2,338.9 2,392.6 16,228.3 14,169.5 6,598.4 12,043.4 32,811.3
1973 I 12,067.6 2,409.3 2,221.2 16,698.1 14,704.5 6,720.7 12,361.6 33,786.8II 12,075.6 2,476.4 2,299.7 16,851.7 14,770.5 6,884.6 12,905.6 34,560.7III 13,804.5 2,514.4 2,372.8 18,691.7 16,858.2 7,092.7 13,328.3 37,219.2IV 15,876.7 2,688.4 2,604.2 21,169.3 18,944.7 7,247.4 13,866.8 40,058.8
1974 I 17,103.0 2,521.3 2,908.9 22,532.2 20,323.6 7,076.9 14,282.0 41,682.4II 17,406.4 2,734.4 3,498.8 23,639.7 20,637.0 7,223.2 14,981.8 42,842.0tII 19,046.0 3,007.4 3,982.9 26,036.3 22,641.3 7,513.5 15,502.9 45,657.7IV 21,444.4 3,555.3 4,481.5 29,481.2 24,802.9 7,993.9 16,198.2 48,995.0
1975 I 23,040.4 3,487.5 4,766.2 31,294.1 27,057.7 7,865.3 16,587.0 51.510.0II 24,050.3 3,814.3 4,880.7 32,745.3 28,143.7 8,099.4 16,839.6 53,082.7III 28,095.4 3,788.3 5,030.6 36,914.3 32,339.6 8,225.6 17,036.4 57,601.6IV 29,016.8 3,796.8 5,249.9 38,063.5 33,422.1 8,565.5 17,407.8 59,395.5
1976 I 30,817.2 3,712.2 5,296.3 39,825.7 35,152.6 8,406.0 17,477.7 61,036.2II 30,997.2 3,721.6 5,463.4 40,182.2 35,510.4 8,630.4 17,777.1 61,917.9III 35,087.6 3,976.7 5,545.4 44,609.7 40,018.6 9,171.3 17,793.8 66,983.7IV 38,298.5 4,387.3 5,966.2 48,652.0 43,522.4 9,936.5 18,137.7 71,626.6
1977 1 41,728.6 4,932.9 6,263.5 52,925.0 47,292.0 10,919.0 18,399.0 76,609.0II 44,423.0 6,244.4 6,676.1 57,343.5 50,290.0 12,831.0 18,832.0 81,962.0III 48,788.5 7,773.2 7,394.4 63,956.1 55,269.0 15,212.0 19,513.0 89,944.0IV 50,831.8 10,754.2 8,442.6 70,028.6 58,375.0 19,177.0 20,598.0 98,150.0
1978 I 49,679.8 12,352.4 8,900.2 70,932.4 57,455.0 21,907.0 21,001.0 100,360.0II 54,009.5 14,035.1 9,365.8 77,410.5 61,698.0 23,990.0 21,732.0 104,420.0
III 55,374.9 15,062.8 10,145.4 80,583.1 63,799.0 26,196.0 22,789.0 112,780.0IV 58,752.0 15,706.0 10,964.0 85,422.0 67,653.0 27,565.0 23,831.0 119,049.0
1979 I 57,762.0 16,303.0 10,697.0 84,762.0 66,808.0 28,393.0 25,095.0 120.296.0II 57,862.0 17,436.0 11,680.0 86,978.0 67,940.0 30,444.0 26,569.0 124,953.0III 59,965.0 18,085.0 12,279.0 90,329.0 70,972.0 31,601.0 27,450.0 130,023.0IV 64,464.0 18,497.0 12,928.0 95,889.0 75,892.0 32,575.0 28,505.0 136,972.0
1980 I 65,189.0 18,767.0 13,081.0 97,037.0 76,774.0 33,394.0 28,789.0 138,957.0II 71,468.0 18,791.0 13,646.0 103,905.0 84,050.0 34,801.0 30,673.0 149,524.0
III 73,821.0 18,995.0 14,792.0 107,608.0 87,403.0 35,287.0 33,169.0 155,859.0IV 111,780.0 20,520.0 15,762.0 148.062.0 126.151.0 38,483.0 35,229.0 199,863.0
1981 I 119,952.0 21,994.0 16,538.0 158,484.0 133,964.0 40,956.0 36,662.0 211,582.0II 123,283.0 21,658.0 16,854.0 161,795.0 139,065.0 42,682.0 38,127.0 219,874.0III 132,353.0 22,235.0 17,862.0 172,450.0 149,732.0 45,841.0 40,276.0 235,849.0IV 166,504.0 25,437.6 19,773.2 211,714.8 184,530.0 51,389.6 44,054.2 279,973.8
1982 I 164,719.1 26,233.4 20,191.5 211,144.0 183,640.1 53,156.4 46,547.5 283,344.0II 180,191.2 26,604.2 22,004.6 228,800.0 201,370.2 56,438.2 50,649.6 308,458.0
a/ Figures may not add to row totals because of rounding.b/ Includes Popular Bank and Livestock Bank.c/ Includes Commercial Banks, Mortgage Banks and Agricultural Creclit Bank.d/ Less than one year.e/ One to five years.f/ More than five years.
Source: Banco de la Republics

Table 6.5 COLOMBIA: BOGOTA AND MEDELLIN STOCK EXCHANGES, 1970-82
1970 1971 1972 1973 1974 1975 1976 1977 1978 1979 1980 1981 1982
Total transactions (millions of Colombianpesos) 1,973 1,524 2.172 3,237 4,877 3 720 6,473 7 772 12,101 16 860 41 638 65 473 38 906
Bogota TT1W 1,104 1 ,526 372 5 056 6O3T 05W7 8FFW 6190 487S6 24 64Medellin 557 420 646 985 1,510 1,192 1,417 1,715 3,470 4,862 11,276 16,717 14,265
Percentage of transactions (Bogota) 100 100 100 100 100 100 100 100 100 100 100 100 100Banking and financial shares T7 1 T 6 9 -7 6Industrial shares 39 30 20 22 15 16 10 15 26 32 14 8 8 aBonds 21 14 16 18 29 22 21 22 15 10 5 4 9CATs and CDTs a/ 21 38 55 49 47 35 17 29 23 18 7 11 57Other b/ I 1 - - - 19 46 26 18 26 66 60 20
Percentage change in prices (Bogota -end of year)
Banking and financial shares -21.0 -20.3 -16.1 11.1 -13.6 -2.5 -19.4 1.8 56.7 26.1 -20.4 134.3 -9.0Industrial shares -2.4 -23.6 -2.7 12.8 -13.6 4.3 42.1 20.1 48.6 38.3 -32.5 20.8 -13.7Cost of living (national - white collar) 7.2 10.9 13.2 19.6 23.3 22.1 20.5 31.3 18.9 23.9 24.9 26.0 24.5
a/ Tax credit certificates granted by the Government for minor exports and tourist development projects.b/ Pagares de Emergencia Economica (PAS); Titulos de Ahorro Cafetero (TAC); and Titulos de Participacion (TP).
Source: Banco de la Republica
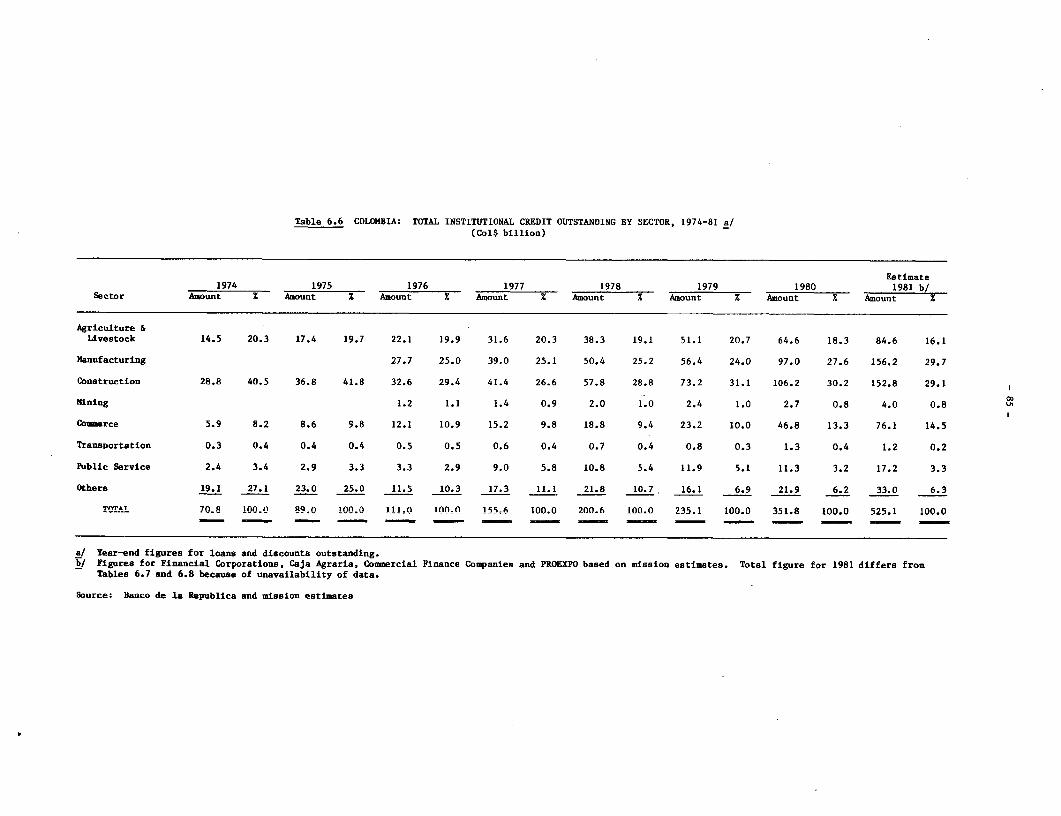
Table 6.6 COLOMBIA: TOTAL INSTITUTIONAL CREDIT OUTSTANDING BY SECTOR, 1974-81 a/(Col$ billion)
Estimate1974 1975 1976 1977 1978 1979 1980 1981 b/
Sector Amount X Amount X Amount X Amount % Amount % Amount X Amount X Amount %
Agriculture &Livestock 14.5 20.3 17.4 19.7 22.1 19.9 31.6 20.3 38.3 19.1 51.1 20.7 64.6 18.3 84.6 16.1
Manufacturing 27.7 25.0 39.0 25.1 50.4 25.2 56.4 24.0 97.0 27.6 156.2 29.7
Construction 28.8 40.5 36.8 41.8 32.6 29.4 41.4 26.6 57.8 28.8 73.2 31.1 106.2 30.2 152.8 29.1
Mining 1.2 1.1 1.4 0.9 2.0 1.0 2.4 1.0 2.7 0.8 4.0 0.8
Commerce 5.9 8.2 8.6 9.8 12.1 10.9 15.2 9.8 18.8 9.4 23.2 10.0 46.8 13.3 76.1 14.5
Transportation 0.3 0.4 0.4 0.4 0.5 0.5 0.6 0.4 0.7 0.4 0.8 0.3 1.3 0.4 1.2 0.2
Public Service 2.4 3.4 2.9 3.3 3.3 2.9 9.0 5.8 10.8 5.4 11.9 5.1 11.3 3.2 17.2 3.3
Others 19.1 27.1 23.0 25.0 11.5 10.3 17.3 11.1 21.8 10.7 16.1 6.9 21.9 6.2 33.0 6.3
TOTA i70.8 100 0 89.0 WM=O 111 0 f100 1 55-6 1O-00 200.6 100.0 235.1 100.0 351.8 100.0 525.1 100.0
a/ Year-end figures for loans and discounts outstanding.b/ Figures for Financial Corporations, Caja Agraria, Commercial Finance Companies and PROEXPO based on mission estimates. Total figure for 1981 differs from
Tables 6.7 and 6.8 because of unavailability of data.
Source; Banco de la Republica and mission estimates
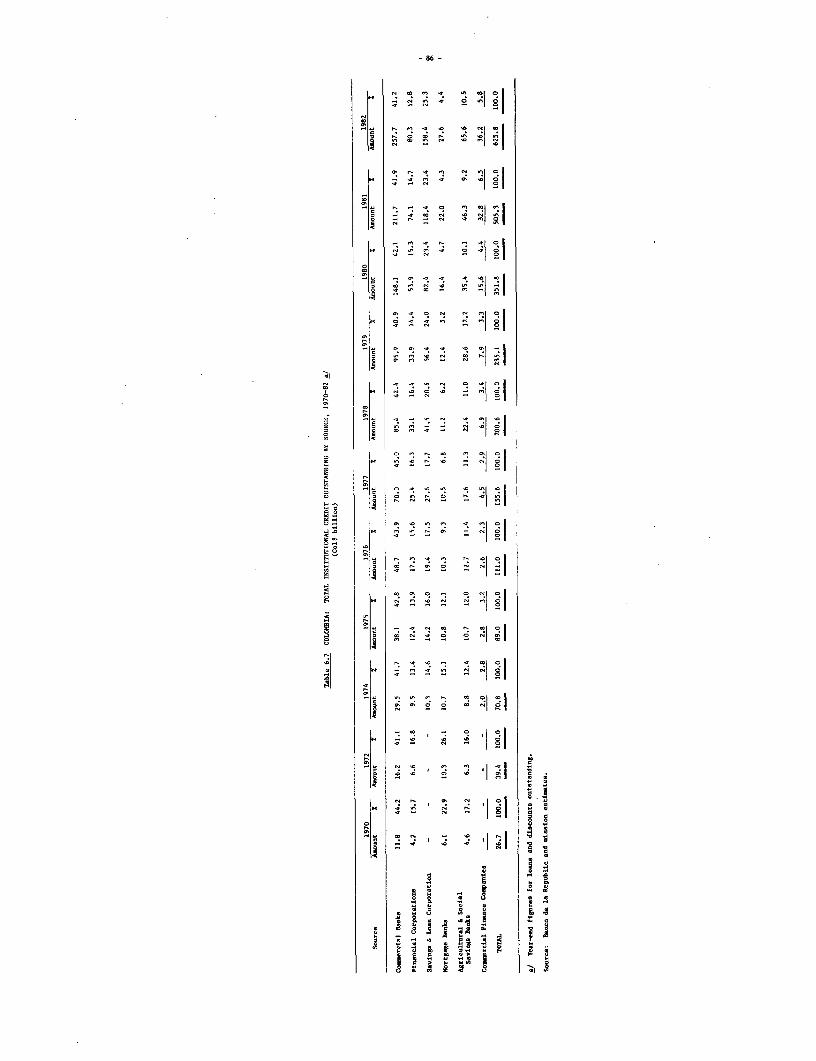
- 86 -
N N N uN C _ .I8I
CNl_ CflI N NI Oa
H - C N c N o l N I
3~ r N 121|o
ol~~~ N V N _
C IN
-V m C C
G e < q~o N I O '1°C CH N C° N _ j |O
Z C H .e _ _
*C H * ' N1 N IC
4 N N o. - RN l .3: 1< N N7 C0 N N NI°
N | V _ II s 1
> g N N4 O N |
cJ ~~ N! r C -_ _
o ~ ~ l- -° IN*1 °
NO NS _ N V N Nj N I
QOg ~ NNI ' N4jR
NI N '° NO N
"> N Ns C N. I °| °
C C C
I

Table 6.8 0X10fIA: TUPAL W6TrJIl(AL GREDIT CIBSrANDITN BY TERM, 1970-82 a/(01$ biLlion)
1970 1972 1974 1975 1976 1977 1978 1979 1980 1981 1982Term A t X nt % Ahtt % biAixt % hixAint % hnit X AEt 1 Aint % Amnunt % hstmt % Airunt %
Short-term 10.9 40.8 14.4 36.6 33.8 47.8 44.7 50.2 57.3 51.7 79.2 50.9 98.1 48.9 112.0 47.7 183.3 52.1 309.8 61.3 364.3 58.2
diu-term 6.6 24.7 8.4 21.3 11.4 16.1 13.2 14.8 15.2 13.7 28.0 18.0 38.7 19.3 42.1 17.9 58.2 16.5 64.6 12.8 85.0 13.6
Log-term 9.2 34.5 46.6 42.1 25.5 36.1 31.1 35.0 38.4 34.6 48.5 31.1 63.8 31.8 81.0 34.4 110.3 31.4 130.9 25.9 176.5 28.2
of 4dch homing (4.6) (17.3) (8.5) (21.6) (15.2) (21.5) (17.7) (19.9) (21.5) (19.4) (22.4) (14.4) (37.1) (18.5) (50.3) (21.4) (71.9) (20.4) (96.7) (19.1) (111.3) (17.8)
iT3 26.7 100.0 39.4 100.0 70.8 100.0 89.0 100.0 111.0 100.0 155.6 100.0 200.6 100.0 235.1 100.0 351.8 100.0 505.3 100.0 625.8 100.0
a/ Year-ed figuies for lns amd disanmts rutstaxxidng. Short-term, up to ale year; umedir-term, 1-5 years; long-term, over five years.
bource: sBan de la Republica ad mission estimates

M66le 6.9 3L1IA: =ITo 103 MIE IIAIVlAE gLl AND ME 10100E ( 11 01 1 M n1N)S, 1970-82
(blUl PX -nle- otetlZse sttd)
1970 1 971 1972 1973 19/4 191-1 1976 1977X 97 1979 1980 1931 \98'
*10 AO'ot % ~ ± % mmt % koomt % A'ot % Awl.* X A,rot % Aont I Aont S oA~t % Amnt S Am=o
1ao & 18oO, fallFThW.W b18edi1im 26.7 33.1 39.5 51.8 70.8 89.0 111.0 155.6 200.6 235.1 351.8 505.3 625.8
e -i9elapt Palo &IFOMM 1.6 2.0 3.5 6.0 9.8 13.1 16.2 26.8 37.5 46.2 55.8 72.9 04.6
l1 & IY8o1a PFimxW1ntemoat0es (o f-da) 25.1 71.0 31.1 73.0 36.2 70.0 45.8 71.0 61.0 75.0 75.9 74.0 94.8 75.0 128.8 75.0 163.1 75.1 180.9 74.0 296.0 78.0 432.4 77.1 541.2 76.3
DlYaat EId l Dkt 6.5 19.0 8.3 19.0 10.1 20.0 10.1 16.0 9.3 12.0 12.8 12.0 15.3 12.0 16.0 9.0 15.6 7.0 21.4 8.0 26.4 7.0 52.4 9.3 80.2~/ 11.3
EB de a s1'ol1i (thrmg tF6b) 1.6 5.0 2.0 5.0 2.1 4.0 2.9 5.0 5.1 6.0 7.7 8.0 9.7 8.0 17.5 10.0 24.5 11.0 29.5 11.0 35.6 9.0 45.2 8.1 51.1 7.2
RIEYFOo -- - - 1.4 3.0 3.1 5.0 4.7 6.0 5.4 5.0 6.5 4.0 9.3 5.0 13.0 6.0 16.7 6.0 20.2 5.0 27.7 4.9 33.5 4.7
I ld 46 D kpjAM (cxedit) 1.9 5.0 1.2 3.0 1.5 3.0 1.9 3.0 0.9 1.0 1.6 1.0 1.8 1.0 2.3 1.0 2.5 1.0 2.8 1.0 2.8 1.0 3.1 0.6 3.5 0.5
Tx.1 Crdt (1 & 1is-ot) 35.1 100.0 42.6 10D.0 51.3 102.0 63.8 100.0 81.0 100.0 103.1 103.0 127.9 100.0 173.4 100.0 218.5 100.0 259.0 119.0 381.0 100.0 560.8 100.0 703.5 100.0
3btal Cndt/QP (in lp ) 27 28 28 26 25 24 24 22 24 24 29 28
.v T. Gaa of 1982.
Sam: BI. de 7. Ia .n aol ssala- eoti,tr

T.1A 6.!0 OMMS _, TT . TITDTDTTPW ( T AU - fa , .,
(pmu3tag uII1AR nDted)
1967 1970 1971 1972 1973 1974 1975 1976 1977 1978 1979 1980 1981 1982
Qeddng Dposits b/ 66.4 58.1 54.4 53.7 52.1 48.2 45.0 43.9 42.0 39.7 39.7 33.9 28.5 31.0
Savings Ac Rmts (Q(mrcial Bnks) 15.3 14.4 14.6 16.5 16.3 15.5 14.6 14.7 16.2 18.0 18.3 15.2 13.1 13.3
SavingsAseuns(UPMC) - - - - - - - 0.8 1.2 2.6 1.2 0.7 0.6 0.5
BEO Betge brtificatea C/ 16.8 24.6 27.4 25.5 17.3 14.8 11.4 8.3 6.2 5.0 4.7 3.5 2.8 3.0
CD's (Baking Systen) - - - - - 4.2 d/ 6.2 d/ 7.9 d/ 8.6 8.0 5.4 13.9 20.6 20.9
CD's (Financal Corporations) - 0.4 e/ 1.1 e/ 1.4 e/ 1.4 e/ 1.3 e/ 2.3 e/ 3.5 5.9 8.7 5.3 5.1 4.8 4.6
Bond (Financial Cbrporatiuxu) 1.5 2.5 2.5 2.6 3.3 2.6 1.8 1.3 1.0 0.7 1.5 1.8 1.5 n.a.
Rqoits (ULPhC) - - - - 4.7 8.4 9.9 10.4 10.6 10.3 14.8 15.3 15.1 19.4 co
Termkcmnmts (UPAC) - - - 0.3 4.9 5.0 8.4 6.5 4.5 4.3 5.2 5.7 6.3 7.3
Q(urcialFinaneCoqpaies - - - - 2.4 f/ 2.7 3.9 3.7 3.9 4.9 6.6 n.a.
Total Assets (billiu pesos) 13.1 23.6 28.1 35.1 49.2 62.0 84.0 114.9 149.5 203.7 251.8 383.8 554.5 638.0
'otal Assets: GDP g/ 15 17 17 17 17 17 18 19 18 20 18 21 24 26
Total Iterest Bearing Assets: GDP S/ 5 7 8 8 8 9 10 11 11 12 11 14 17 18
ihted lnterest Rate for InterestBearing Instruments 7.0 9.2 9.6 11.0 15.6 16.1 20.6 22.1 22.5 22.0 22.8 27.4 31.3 n.a.
All Financial Assets 2.4 3.9 4.4 5.1 7.5 8.4 11.3 12.4 13.1 13.3 13.7 18.1 22.4 n.a.
a/ Year end.b/ Ewludes cbecking acnmts in Banco de la Republics.c/ Overstated by hDldirgs in BCH.d/ Revista Bano de la Pepulica 3/81.e/ Frtiasted using requirables after 30 days, local currency, and 6CF/. of such requirables 1970-72.f/ Estiatd; based an assets of the Qmnercial Finance Cowpanies.
Y Year end GAP, calculated using average gwth rate betwen each year's rminal GDP. For 1981 assumed 302.
n.a. - sDt awailable.
Surce: 1981, Revista del Banco de ls Republica - 3/82; 1976-80, Revista del Bac de la Republica - 8/81; 1972-75, Inforne al Gerente Banm de la Republica- 1972-77; 1970-71, Informe al Gerete Beno de la Republica - 1970-71; and mission estinates.

Table 6.11 COLOMBIA: ESTIMATES OF REAL INTEREST RATES ON EASILY AVAILABLE ASSETS, 1968-82(in percent)
Average InterestChange in CPI Rate Saving Accounts Average Interest Rate Realized After Tax
Year (white collar workers) and UPAC Deposits a/ Realized Real Rate b/ After Taxes C/ Real Rate d/(1) (2) (3) (4) (5)
1968 7.4 4.1 -3.2 4.1 -3.2
1969 7.0 4.1 -2.7 4.1 -2.7
1970 7.3 4.1 -3.0 4.1 -3.0
1971 10.9 4.1 -6.5 4.1 -6.5
1972 13.2 4.1 -8.7 4.1 -8.7
1973 19.6 8.8 -9.9 8.8 -9.9
1974 23.3 17.5 -4.9 16.1 -5.8
1975 22.1 19.4 -2.6 16.5 -4.6
0
1976 20.5 20.8 -0.3 15.4 -4.6
1977 31.3 20.8 -8.0 16.1 -11.6
1978 19.4 21.0 1.3 16.3 -2.6
1979 23.8 20.5 -2.7 15.9 -7.4
1980 24.6 22.0 -2.1 17.3 -6.1
1981 25.7 24.9 -0.7 21.0 -3.7
1982 24.5 25.6 0.9 22.3 -1.8
a/ Unweighted average of base year interest rate.b/ Realized real rate = [(100 + Col (2)) / (100 + Col. (1))] 100 - 100.c/ Interest rates from Table 6.16. Before 1974, no tax on interest income from saving accounts; after 1974 assumes 20% tax on the
interest income and .8% on the account. On UPACs assumes 30% of the interest after monetary correction and 1% of the accounttaxed between 1973 and 1974. Between 1975 and 1979 assumes 12 of the 20 permitted points of monetary correction were taxed at20%; after 1979 at 10%. See Banco de la Republica, "Algutios Aspectos Especificos del Mercado de Capitales Colomblanos"; CEMLABoletin Mensual, Octubre 1975; and Ley de Alivio Tributario (Ley 20 de 1979).
d/ Realized after tax real rate = [(100 + Col. (4)) / (100 + Col. (1))] 100 - 100.
Source: Mission estimates

- 91 -
Tabla 6.12 (IISDIU fFECIVE DaE RAD3S CN 91D FDWiNZ4L AS9E5, 1970-82(mud peroetag rates)
1970 1971 1972 1973 1974 .975 1976 1977 1978 1979 19s0 1981 1982
1. Swings Acounts 4.1 4.1 5.3 5.3 12.6 .7.0 19.3 19.3 19.3 19.3 22.7 22.7 22.7
2. lmn Accounts 7.1 7.1 8.7 8.7 12.6 .6.6 18.8 18.8 18.5 18.5 22.7 22.7 22.7
3. G0rcificates of DposJLta) Banks - 13.6 13.6 13.6 26.2 26.6 25.6 25.6 24.4 25.6 32-36 38.6 35.9b) lXvelopment FEian C saies - 13.6 13.6 13.6 13.6 :!6.8 26.3 26.3 26.5 25.6 32-36 38.6 35.9
4. Swing & lH Eing Corporatioxnsa) Accomta UPAnt - - - 26.2 26.2 24.5 22.3 22.7 21.6 24.7 27.1 27.1 29.2bl Certificates UPAM - - - 26.3 27.4 25.7 23.5 23.9 22.4 26.9 28.9 37.4 31.6c) l0.inary lbposits - - - - - - 19.0 19.0 19.0 19.0 19.0 19.0 19.0
5. Bno Cbntraml Hlpotecaro Mrtgaesa) 'Very low RLsk 11.5 11.5 11.5 15.3 15.3 .5.3 15.3 14.9 14.9 15.3 15.9) 15.3 15.3b) low cJsk - - - - - 23.2 23.2 23.2 23.2 23.2 24.6) 23.2 23.2
6. Dwvelopment Finmace Gxiades: foods - - 18.0 19.7 19.7 .9.7 19.7 19.7 19.7 19.7 19.7 19.7 19.7
7. Cartificates of Max ESezptixn - CATa) 3 months 16.4 16.4 16.4 24.5 32.0 28.1 29.7 29.7 33.7 42.0 48.7 89.4 55.3
8. 11nmo de la Hepiblicaa) Treasury 1iI1s
6mitlu - - - - 22.1 :2.1 22.7 22.7 22.7 - - - n.a.3 months - - - - 21.0 21.0 21.6 21.6 21.6 36.05 36.1 31.1 26.22 mntbu - - - - - - - - - 34.01 35.4 30.2 25.31 month - - - - - - - - - 33.18 34.5 29.3 24.415 days - - - - - - - - - 32.1 33.6 28.2 23.3
b) l]hge CcrtLficates - - - - - - - 40.0 39.5 37.6 31.8 32.7 34.9
9. Sco*sa) InuStrlals icXliing appreciatimi 25.2 -9.3 12.1 28.5 1.2 26.3 69.6 55.3 64.3 31.6 n.a. n.a. n.a.b) Financial Corporatiaos including
appreciation 20.4 -0.6 9.6 31.3 5.5 :3.7 38.0 57.1 57.6 22.6 n.a. n.a. n.a.
10. Eera Ebnk arket InstitutiLrl - 18.0 18.0 21.0 23.5 25.5 26.0 26.0 27.0 3D-35 34.40 45.0 45.0
Wdgied Avgeq of: a/iaterest Haaring seta 9.2 9.6 11.0 15.6 16.1 :!.6 22.1 22.5 22.0 22.8 27.4 31.3 n.a.All Assets includirg xomy 3.9 4.4 5.1 7.5 8.4 .1.3 12.4 13.1 13.3 13.7 18.1 22.4 n.a.
riTSLicit Pad Rates D/Interest arIng Assets -1.5 -3.2 -7.2 -6.2 -4.9 0.1 -7.0 2.6 -1.5 -1.4 1.4 5.0 n.a.All Assets including :xey -6.7 -7.8 -12.1 -12.8 -11.2 --7.6 -14.4 -5.3 -8.5 -8.8 -6.1 -2.1 n.a.
a/ Inc:Ludes cmly llAhilities of priate finsal intermudLarles md CEH. Weights based m yearend stock of assets.b/ 1saL rates calculated by dividIN; 1 plw tha nLm rata pIw thb expost chang in tlu annual averagp of the white collae v.,ers' asur prica indx.
n.a. - nDt available.
Sxiroc: Ban= da la Republia; IBR; Blaetin Mnsual de la Bolaa de dlsa de Bgota, juiio 1982; and Encusta Issada hitres de Ims CDI a 90 Dias, Mcy, 1983.

-92-
TAble 6.13 aCUMIA: NNAL AIM WEAL TNM R4ES CQl THW NN (aIWIFCAS OF IEOSIT (C)'s), 1980-83(amaliUad percenta rates)
CPI for iaers Peal e-Tost Actual Interest Rate Et1s of RateEffective Rte oaer priod of Interest Rate Devaluation ca 90 day on (bilciian
Year Cal$ CD's a/ 1$ CD's Cal$ b/ tb1$A2 S$ US$ CD's CD's c/(1) (2) (3) (4) (5) (6)
1980May 8 32.0 12.5 17.3 14.7 8.6 6.0Jun 18 34.8 14.0 18.0 12.4 8.6 10.4Jul 17 35.4 20.5 12.4 15.6 8.45 8.0ALg 15 36.9 27.7 7.2 17.0 10.95 5.5Sep 19 33.6 26.9 5.2 18.2 11.15 1.7Oct 10 35.0 38.0 -2.2 15.3 14.30 2.4Nov 13 37.2 30.7 5.0 16.1 16.95 1.0Dec 16 37.9 35.9 1.5 16.8 17.75 .5
1981Jn 16 37.3 38.1 -0.6 14.4 16.8 2.8Feb 27 37.4 36.9 0.4 12.2 15.6 5.9Mar 16 34.4 37.8 -2.5 14.2 13.9 3.3Apr 13 35.3 34.0 1.0 14.4 15.15 2.7?gy 11 36.3 26.0 8.2 16.5 17.50 -0.4.)z 15 36.8 16.1 17.8 15.9 17.15 0.8Jul 13 37.7 21.4 13.4 17.2 17.75 -0.3Aug 17 37.6 15.6 19.0 18.6 18.20 -1.8Sep 14 38.4 18.6 16.7 19.8 16.00 -0.4Oct 13 39.1 21.1 14.9 20.6 14.90 0.4Nov 16 38.8 22.5 13.3 19.7 11.25 4.2Dec 14 39.4 26.5 10.1 17.7 13.25 3.9
1982Jan 18 39.6 31.2 6.4 16.5 14.15 5.0Feb 15 39.5 35.4 3.0 16.8 13.85 4.9Mar 15 38.1 36.6 1.1 17.7 14.35 2.6Apr 12 38.6 28.6 7.8 16.7 14.35 3.9May 17 38.8 21.1 14.6 17.3 13.40 4.3.m 14 39.1 17.9 18.0 16.4 15.30 3.6Jul 12 38.4 21.4 14.0 18.2 12.10 4.5Aug 16 37.6 21.1 13.6 20.8 9.75 3.8Sep 13 37.2 15.7 18.6 23.7 10.45 0.4Oct 11 36.6 11.0 23.1 25.3 9.20 -0.2NDv 15 37.3 11.0 23.7 23.6 8.75 2.1Dec 13 36.3 18.7 14.8 24.3 8.80 0.8
1983Jm 17 35.5 29.9 4.3 24.5 8.55 0.3Feb 14 35.2 38.8 -2.6 8.30
a/ Effectie mtes e stimtd te basis of prepayet of interest.b/ Peal eylpat rate - [(1 + (1))/(1 + (2))] - 1 expresed a percentage.c/ a£of rate - [(1 + (1))/(1 + (4)) (1 + (5))] -1 wes as a percentage.
Source: de la Rpiblica and ndan estimates.

- 93 -
Table 6.14 CLNeIABL ES;M&IE CF SLBSIDIES cF HE CENIRAL B&K AND lRW(ED0 (REl= LIES, 1980-81 a/(biUicn pesos unless othrwIse noted)
Average Loans iterest Rate Subcidy Interest Rate 9Sbsidy(ltstarKiing Interest Rate Ubsidy (Z) t (3)X(:I)/100 Subsidy c/ (5)X(1)/100
(1) (2) (3) (4) (5) (6)
191301. *9riculture 27.55 4.,5 2.6
it. POEXPO 4.40 19.0 17.6 0..8 10.5 0.51). FFAP 21.35 21.0 15.7 314 8.7 1.9c. Direct loans (livestocd) 1.80 21.0 15.7 03 8.7 0.2
2. I2mifactu2ng Z.15 3.5 2.0. PROEMO 23.85 19.0 17.6 2.4 10.5 1.5
1b. FFI 4.60 22.0 14.8 0.7 7.8 0.4IP. I 3.70 27.0 10.2 0.4 3.5 0.1
3. Electrical paer d/ 6.05 28.0 9.4 0.6 2.7 0.2
TI[AL 55.75 8.6 4.2
19311. iriacuture 40.90 8.2 3.7
R. OEXPO 5.70 19.0 21.8 T. 10.5 0.61). FFAP 33.20 21.0 19.8 6.6 8.7 2.9c. Direct loans (livesto-ck) 2.00 21.0 19.83 0.4 8.7 0.2
2. Iamifacturirg 26.80 5.2 2.2it. PR0EKPO 17.85 19.0 21.8 3.9 10.5 1.91). FFI 4.80 26.0 15.1 0.7 4.4 0.2c-. PIP 4.15 27.0 14.2 0.6 3.5 0.1
3. Electrical paBpr d/ 8.55 28.0 13.3 1.1 2.7 0.2
TOIAL 76.25 14.5 6.1
a/ '[he subsidy estimates constitute an uper limit to actual subsidies granted because the average effective interest rates changediay be somthat higher thai the nrbnIal rates used in these calculations as a result of prepaid interest chages an some of theJnans.
b/ Estimated as (14iR/1fbl2)-1, share R = 40% in 1980 and 45% in 1981.c/ Estimated as (1R/1+Col2)-1, utere R = 31.5% (equivalent to the prima lending rate of 11.5% in the US in December 1982 adjusted for
a1 20% devaluation).d/ FardD de IbsarroUo ElectrLco.
Sotrme: Banco de la Republica, Table 6.14 and mDision estimates

Table 7.1 COLOMBIA: PRODUCTION OF PRINCIPAL CROPS, 1970-82(000 metric tons)
Least SquarePreliminary Growth Rate
1970 1971 1972 1973 1974 1975 1976 1977 1978 1979 1980 1981 1982 1970-82
CEREALSRice (paddy) 702.2 851.9 997.5 1,151.1 1,540.4 1,614.0 1,560.0 1,307.0 1,714.7 1,932.5 1,797.9 1,798.7 2,018.3 8.0Barley 88.0 107.2 98.0 81.5 96.9 121.8 71.4 81.3 118.9 136.6 109.5 56.4 55.6 -2.0Wheat 110.0 53.2 69.2 72.4 58.8 38.9 45.3 38.5 37.7 42.0 45.7 62.3 70.7 -3.0Corn 876.8 818.5 806.2 739.1 791.5 722.6 883.7 752.8 862.2 870.2 853.6 880.0 898.5 1.0Sorghum 87.0 239.6 210.0 280.2 336.6 335.0 427.7 406.2 516.7 501.3 430.5 532.0 575.5 12.0
OTHER FOODCROPSYuca 1,956.0 1,990.4 2,010.4 1,998.4 2,125.9 2,021.1 1,845.7 1,972.6 2,044.1 1,908.9 2,150.4 2,150.1 2,000.0 0.3Potatoes 868.9 868.9 823.4 1,030.5 1,012.0 1,320.0 1,515.8 1,608.5 1,995.6 1,966.1 1,726.7 2,006.1 2,149.0 9.0Platano 1,382.8 1,517.3 1,562.3 1,653.1 1,678.9 1,791.7 1,852.0 1,844.0 2,192.0 2,235.8 2,348.0 2,400.0 2,145.0 4.0Panela 444.0 457.0 508.0 524.0 557.2 805.6 833.6 837.6 965.4 984.7 987.8 802.6 750.5 6.0Beans (common) 38.8 35.6 61.1 56.9 67.1 89.9 67.6 74.9 74.8 74.7 83.6 79.3 72.9 5.0Cacao 18.5 19.0 20.0 22.0 23.0 21.2 29.2 27.0 31.0 32.3 35.7 38.3 39.4 7.0
COFFEE 458.8 374.7 531.8 432.7 473.3 513.0 563.0 659.9 751.5 719.5 769.2 798.8 774.0 6.0
COTTON AND OILSEEDSCotton 376.4 322.4 412.1 344.8 420.3 400.9 408.6 480.4 330.3 281.6 353.2 366.2 153.2 -3.0Soybeans 131.9 100.7 104.6 97.2 114.0 168.9 75.1 102.9 130.8 143.6 154.5 89.0 98.8 1.0Sesame 17.9 31.4 28.3 18.1 17.2 20.7 20.7 13.0 13.7 15.6 12.9 11.6 7.2 -8.0African palm oil 26.9 36.2 41.4 44.0 50.8 39.2 38.6 48.1 52.6 59.6 70.0 79.9 85.2 8.0
OTHER EXPORT CROPSSugar cane a! 672.2 744.0 823.7 809.9 894.8 969.7 934.6 853.3 1,025.9 1,096.0 1,188.6 1,148.1 1,254.6 5.0Bananas a/ 335.0 351.0 282.0 301.0 469.7 559.0 521.5 593.1 719.0 800.5 944.3 1,109.6 1,146.6 12.0Tobacco 42.0 39.3 36.1 39.7 41.1 57.6 38.6 58.3 46.6 69.6 47.4 43.8 40.8 -2.0
a/ Refers to calendar year.
Source: Ministry of Agriculture (OPSA), ANDI for data on coffee and DNP.
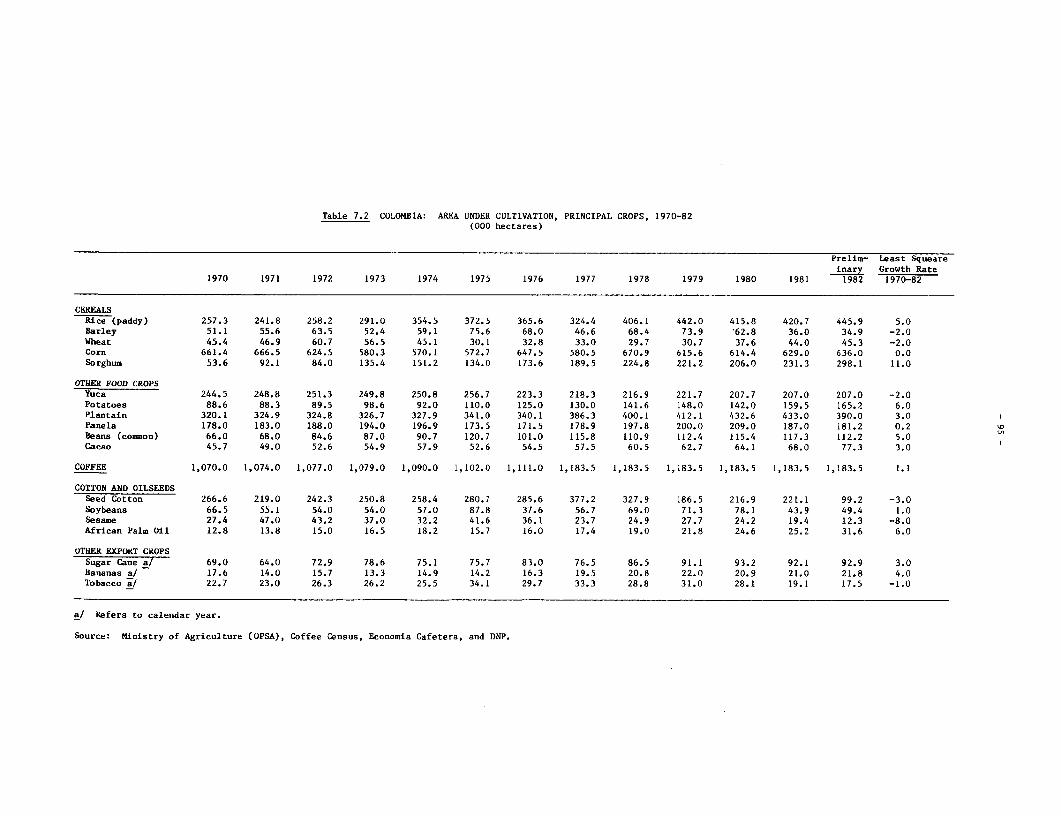
Table 7.2 COLOMBIA: AREA UNDER CULTIVATION, PRINCIPAL CROPS, 1970-82(000 hectares)
Prelim- Least Squeareinary Growth Rate
1970 1971 1972 1973 1974 1975 1976 1977 1978 1979 1980 1981 1982 1970-82
CEREALSRice (paddy) 257.3 241.8 258.2 291.0 354.5 372.5 365.6 324.4 406.1 442.0 415.8 420.7 445.9 5.0Barley 51.1 55.6 63.5 52.4 59.1 75.6 68.0 46.6 68.4 73.9 *62.8 36.0 34.9 -2.0Wheat 45.4 46.9 60.7 56.5 45.1 30.1 32.8 33.0 29.7 30.7 37.6 44.0 45.3 -2.0Corn 661.4 666.5 624.5 580.3 570.1 572.7 647.5 580.5 670.9 615.6 614.4 629.0 636.0 0.0Sorghum 53.6 92.1 84.0 135.4 151.2 134.0 173.6 189.5 224.8 221.2 206.0 231.3 298.1 11.0
OTHER FOOD CROPSYuca 244.5 248.8 251.3 249.8 250.8 256.7 223.3 218.3 216.9 221.7 207.7 207.0 207.0 -2.0Potatoes 88.6 88.3 89.5 98.6 92.0 110.0 125.0 130.0 141.6 148.0 142.0 159.5 165.2 6.0Plantain 320.1 324.9 324.8 326.7 327.9 341.0 340.1 386.3 400.1 412.1 432.6 433.0 390.0 3.0Panela 178.0 183.0 188.0 194.0 196.9 173.5 171.5 178.9 197.8 200.0 209.0 187.0 181.2 0.2 x
Beans (common) 66.0 68.0 84.6 87.0 90.7 120.7 101.0 115.8 110.9 112.4 115.4 117.3 112.2 5.0Cacao 45.7 49.0 52.6 54.9 57.9 52.6 54.5 57.5 60.5 62.7 64.1 68.0 77.3 3.0
COFFEE 1,070.0 1,074.0 1,077.0 1,079.0 1,090.0 1,102.0 1,111.0 1,183.5 1,183.5 1,183.5 1,183.5 1,183.5 1,183.5 1.1
COTTON AND OILSEEDSSeed Cotton 266.6 219.0 242.3 250.8 258.4 280.7 285.6 377.2 327.9 186.5 216.9 221.1 99.2 -3.0Soybeans 66.5 55.1 54.0 54.0 57.0 87.8 37.6 56.7 69.0 71-3 7R81 41.9 49.4 i.nSesame 27.4 47.0 43.2 37.0 32.2 41.6 36.1 23.7 24.9 27.7 24.2 19.4 12.3 -8.0African Palm Oil 12.8 13.8 15.0 16.5 18.2 15.7 16.0 17.4 19.0 21.8 24.6 25.2 31.6 6.0
OTHER EXPORT CROPS
Sugar Cane a/ 69.0 64.0 72.9 78.6 75.1 75.7 83.0 76.5 86.5 91.1 93.2 92.1 92.9 3.0Bananas a/ 17.6 14.0 15.7 13.3 14.9 14.2 16.3 19.5 20.8 22.0 20.9 21.0 21.8 4.0Tobacco a! 22.7 23.0 26.3 26.2 25.5 34.1 29.7 33.3 28.8 31.0 28.1 19.1 17.5 -1.0
a/ Refers to calendar year.
Source: Ministry of Agriculture (OPSA), Coffee Census, Economia Cafetera, and DNP.

Table 7.3 COLOMBIA: CROP YIELDS PER HECTARE, 1970-82(metric tons/ha)
Preliminary Least Square Growth Rate1970 1971 1972 1973 1974 1975 1976 1977 1978 1979 1980 1981 1982 1970-82
CEREALSRice (paddy) 2.7 3.5 3.9 4.0 4.3 4.3 4.3 4.0 4.2 4.4 4.3 4.2 4.5 3.0Barley 1.7 1.9 1.5 1.6 1.6 1.6 1.1 1.7 1.7 1.8 1.8 1.6 1.6 0.0Wheat 1.2 1.1 1.1 1.3 1.3 1.3 1.4 1.2 1.3 1.4 1.2 1.4 1.6 -1.0Corn 1.3 1.2 1.3 1.3 1.4 1.3 1.4 1.3 1.3 1.4 1.4 1.4 1.4 1.0Sorghum 2.2 2.6 2.5 2.1 2.2 2.5 2.5 2.1 2.3 2.3 2.1 2.3 1.9 1.0
OThER FOODCROPSYuca 8.0 8.0 8.0 8.0 8.5 7.9 8.3 9.0 9.4 8.6 10.4 10.4 9.7 2.3Potatoes 10.9 9.8 9.2 10.5 11.0 12.0 12.1 12.4 14.1 13.3 12.2 13.2 13.0 3.0Plantain 4.3 4.7 4.8 5.1 5.1 5.3 5.4 4.8 5.5 5.4 5.4 5.5 5.5 1.0Panela 2.5 2.5 2.7 2.7 2.8 4.6 4.9 4.7 4.9 4.9 5.0 4.3 4.1 6.0Beans (common) 0.58 0.59 0.62 0.61 0.64 0.7 0.7 0.6 0.6 0.7 0.7 0.6 0.6 2.0Cacao 0.40 0.39 0.38 0.40 0.40 0.35 0.54 0.47 0.51 0.5 0.5 0.6 0.5 4.0
COFFEE 0.43 0.35 0.49 0.40 0.43 0.47 0.51 0.56 0.66 0.62 0.76 0.67 0.65 5.4
COTTON AND OILSEEDSSeed Cotton 1.4 1.5 1.7 1.3 1.6 1.4 1.4 1.3 1.0 1.5 1.6 1.7 1.5 0.0Soybeans 2.0 1.8 1.9 1.8 2.0 1.9 1.0 1.8 1.9 2.0 2.0 2.0 2.0 0.0Sesame 0.65 0.67 0.66 0.49 0.53 0.5 0.6 0.5 0.6 0.6 0.5 0.6 0.6 0.0African palm oil 2.1 2.6 2.8 2.7 2.8 2.6 2.4 2.5 2.5 2.7 2.8 3.2 2.7 1.3
OTRER EXPORT CROPSSugar Cane 9.7 11.6 11.3 10.3 11.9 12.8 11.3 11.2 11.9 12.0 12.8 12.5 13.5 2.0Bananas 19.0 25.1 18.0 22.6 31.5 39.4 32.0 30.4 34.6 35.6 45.0 52.8 52.7 8.0Tobacco 1.9 1.7 1.4 1.5 1.6 1.7 1.3 1.8 1.6 1.9 1.6 1.6 1.6 -1.0
Source: Ministry of Agriculture (OPSA)
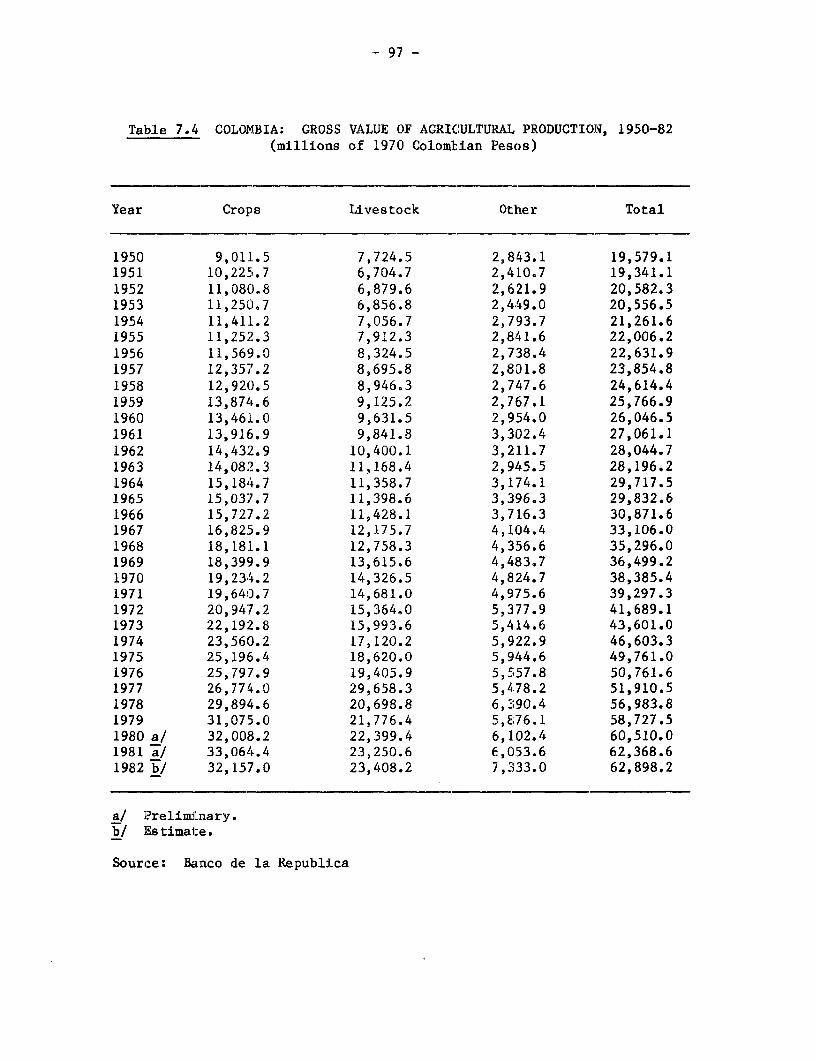
- 97 -
Table 7.4 COLOMBIA: GROSS VALUE OF AGRICULTURAL PRODUCTION, 1950-82(millions of 1970 Colomblian Pesos)
Year Crops Livestock Other Total
1950 9,011.5 7,724.5 2., 843.1 19,579.11951 10,225.7 6,704.7 2,410.7 19,341.11952 11,08)0.8 6,879.6 2,621.9 20,582.31953 11,250.7 6,856.8 2,449.0 20,556.51954 11,411.2 7,056.7 2,793.7 21,261.61955 11,252.3 7,912.3 2,841.6 22,006.21956 11,569.0 8,324.5 2,738.4 22,631.91957 12,357.2 8,695.8 2,801.8 23,854.81958 12,920.5 8,946.3 2,747.6 24,614.41959 13,874.6 9,125.2 2,767.1 25,766.91960 13,461L.0 9,631.5 2,954.0 26,046.51961 13,916.9 9,841.8 3,302.4 27,061.11962 14,432.9 10,400.1 3,211.7 28,044.71963 14,082.3 11,168.4 2,945,5 28,196.21964 15,184.7 11,358.7 3,174.1 29,717.51965 15,037.7 11,398.6 3,396.3 29,832.61966 15,727.2 11,428.1 3,716.3 30,871.61967 16,825.9 12,175.7 4,104.4 33,106.01968 18,181.1 12,758.3 4,356.6 35,296.01969 18,3993.9 13,615.6 4,483.7 36,499.21970 19,234.2 14,326.5 4,824.7 38,385.41971 19,640.7 14,681.0 4,975.6 39,297.31972 20,947.2 15,364.0 5,377.9 41,689.11973 22,192.8 15,993.6 5,414.6 43,601.01974 23,5610.2 17,120.2 5,9122.9 46,603.31975 25,1915.4 18,620.0 5,944.6 49,761.01976 25s797.9 19s405.9 5,557.8 50,761.61977 26,77l4.0 29,658.3 5,478.2 51,910.51978 29,894.6 20,698.8 6,390.4 56,983.81979 31s075.0 21,776.4 5,876.1 58,727.51980 a/ 32,008.2 22,399.4 6,J.02.4 60,510.01981 a/ 33,064.4 23,250.6 6,053.6 62,368.619821b/ 32,157.0 23,408.2 7,333.0 62,898.2
a/ PrelimiLnary.b/ Estimalte.
Source: Banco de la Republica
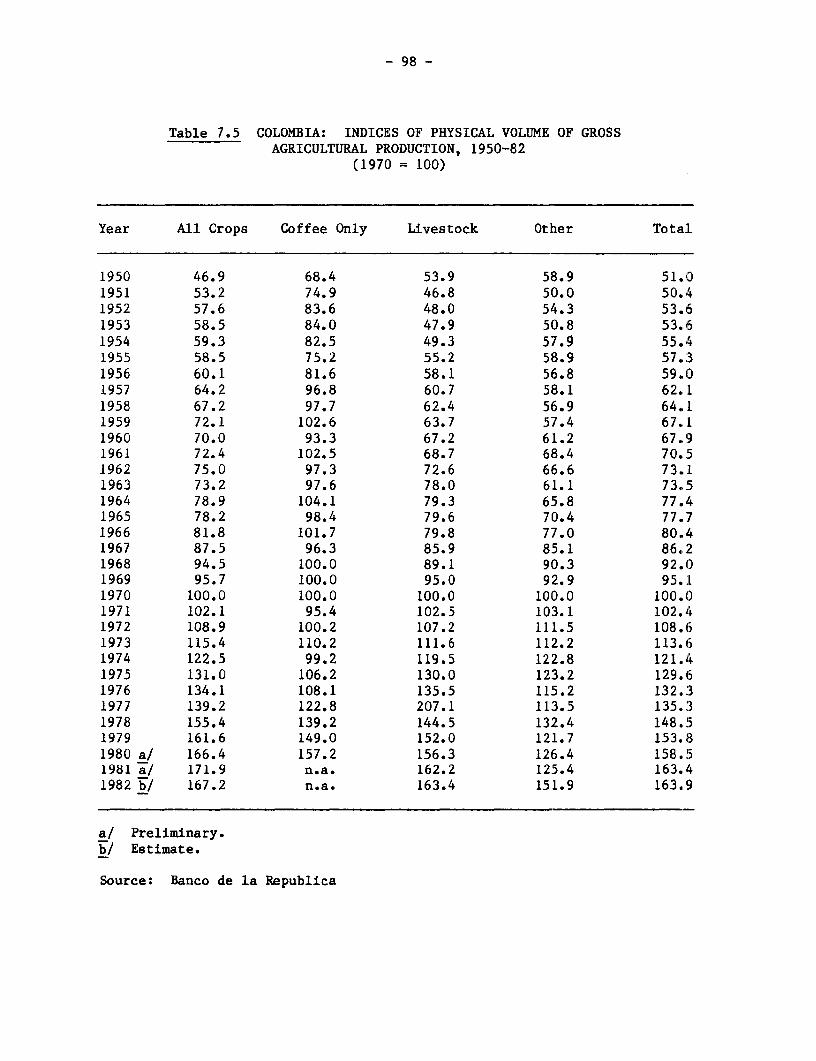
- 98 -
Table 7.5 COLOMBIA: INDICES OF PHYSICAL VOLUME OF GROSSAGRICULTURAL PRODUCTION, 1950-82
(1970 = 100)
Year All Crops Coffee Only Livestock Other TotaL
1950 46.9 68.4 53.9 58.9 51.01951 53.2 74.9 46.8 50.0 50.41952 57.6 83.6 48.0 54.3 53.61953 58.5 84.0 47.9 50.8 53.61954 59.3 82.5 49.3 57.9 55.41955 58.5 75.2 55.2 58.9 57.31956 60.1 81.6 58.1 56.8 59.01957 64.2 96.8 60.7 58.1 62.11958 67.2 97.7 62.4 56.9 64.11959 72.1 102.6 63.7 57.4 67.11960 70.0 93.3 67.2 61.2 67.91961 72.4 102.5 68.7 68.4 70.51962 75.0 97.3 72.6 66.6 73.11963 73.2 97.6 78.0 61.1 73.51964 78.9 104.1 79.3 65.8 77.41965 78.2 98.4 79.6 70.4 77.71966 81.8 101.7 79.8 77.0 80.41967 87.5 96.3 85.9 85.1 86.21968 94.5 100.0 89.1 90.3 92.()1969 95.7 100.0 95.0 92.9 95.11970 100.0 100.0 100.0 100.0 100..01971 102.1 95.4 102.5 103.1 102.41972 108.9 100.2 107.2 111.5 108.61973 115.4 110.2 111.6 112.2 113.61974 122.5 99.2 119.5 122.8 121.41975 131.0 106.2 130.0 123.2 129.61976 134.1 108.1 135.5 115.2 132.31977 139.2 122.8 207.1 113.5 135.:31978 155.4 139.2 144.5 132.4 148.51979 161.6 149.0 152.0 121.7 153.81980 a/ 166.4 157.2 156.3 126.4 158.,51981 a/ 171.9 n.a. 162.2 125.4 163.41982 b/ 167.2 n.a. 163.4 151.9 163.9
a/ Preliminary.b/ Estimate.
Source: Banco de la Republica

- 99 -
Table 7.6 COLOMBIA: AGRICULTURAL GROSS VALUE ADDEDAT CONSTANT 1970 PRICES, 1950-82
(millions of 1970 Pesos)
Year Crops Livestock Other Total
1950 8,345.3 6,740.8 2,270.1 17,356.21951 9,400.8 5,850.4 1,944.3 17,195.51952 10,199.4 6,006.5 2,104.9 18,310.81953 10,328.9 5,983.0 1,987.0 18,298.91954 10,449.7 6,162.6 2,244.1 18,856.41955 10,286.6 6,904.6 2,274.5 19,465.71956 10,608.1 7,271.8 2,197.1 20,077.01957 11,407.7 7,592.0 2,246.5 21,246.21958 11,860.4 7,811.2 2,1301.3 21,872.91959 12,693.4 7,966.9 2,216.1 22,876.41960 12,287.0 8,412.5 2,365.9 23,065.41961 12,772.0 8,592.4 2,615.2 23,979.61962 13,149.3 9,076.4 2,543.2 24,768.91963 12,867.7 9,748.5 2,414.1 25,030.31964 13,885.7 9,920.3 2,~523.0 26,329.01965 13,742.8 9,951.5 2,680.9 26,375.21966 14,329.9 9,974.9 2;,918.5 27,223.31967 15,187.1 10,184.9 3,208.3 28,580.31968 16,271.2 10,833.8 3,399.3 30,504.31969 16,375.4 11,667.1 3,529.6 31,635.11970 17,059.3 12,222.6 3,720.9 33,002.81971 17,463.0 12,512.4 2,842.7 33,818.11972 18,534.5 13,113.2 4,149.4 35,797.11973 19,464.8 13,613.6 4,168.1 37,246.51974 20,602.2 14,740.2 4,580.7 39,923.11975 21,908.4 16,091.0 4,336.8 42,336.21976 22,177.0 16,756.1 4,173.4 43,106.51977 22,972.5 17,009.0 4,125.2 44,106.71978 26,076.5 17,986.9 4,571.4 48,634.81979 27,524.7 18,898.2 4,338.7 50,761.61980 28,242.7 19,485.0 4,497.8 52,225.51981 a/ 28,962.6 20,230.6 4,303.0 53,496.21982 b/ 28,266.4 20,412.7 4,388.6 53,067.7
a/ Preliminary.i/ Estimate.
Source: Banco de la Republica

Table 7.7 COLOMBIA: AGRICULTURAL TERMS OF TRADE (TOT), 1965-82(1970 - 100)
National Accounts Price Deflators a/National Accounts Price Deflators a/ Excluding Coffee Wholesale Price Index b/
Agriculture Non-Agriculture TOT Agriculture Non-Agriculture TOT Agriculture Non-Agriculture TOT
1965 64.3 60.6 106.1 71.8 60.6 118.5 68.3 61.6 110.9
1966 73.4 69.9 105.0 83.0 69.9 118.7 79.6 73.1 108.9
1967 78.2 76.2 102.6 87.4 76.2 114.7 83.8 79.7 105.1
1968 84.7 83.7 101.2 93.3 83.7 111.5 89.4 84.2 106.2
1969 91.7 90.4 101.4 104.9 90.4 116.0 94.2 91.3 103.2
1970 100.0 100.0 100.0 100.0 100.0 100.0 100.0 100.0 100.0
1971 111.1 110.2 100.8 113.5 110.2 103.0 116.0 109.5 105.9
1972 130.4 123.5 105.6 132.6 123.5 107.4 136.4 126.0 108.3
1973 171.0 147.2 116.2 174.4 147.2 118.5 182.0 155.2 117.3
1974 212.0 189.8 111.7 218.2 189.8 115.0 247.2 215.0 115.0
1975 257.0 228.8 112.2 264.0 228.8 115.6 333.4 262.9 126.8
1976 330.4 279.3 118.3 315.9 279.3 113.1 413.3 324.2 127.5
1977 461.4 347.0 133.0 442.8 347.0 127.6 581.1 398.6 145.8
1978 501.9 418.4 120.0 491.9 418.4 117.6 702.6 460.0 152.7
1979 584.4 530.7 110.1 589.3 530.7 111.0 894.5 597.7 149.7
1980 719.3 682.6 105.4 729.6 682.6 106.9 1,101.4 761.4 144.7
1981 c/ 861.2 850.7 101.2 961.0 850.7 113.0. 1,357.2 955.0 142.1
1982 d/ 1,077.1 1,080.4 99.7 n.a. 1,080.4 n.a. 1,794.9 1,148.3 156.3
a/ At market prices.b/ Non-agriculture wholesale index includes price variations in processed foods after 1970.c/ Preliminary.dI Estimate.
Source: Banco de la Republica.

Table 7.8 COLOMBIA: LOANS EXTENDED TO THE AGRICULTURAL SECTOR, 1971-82(millions of Pesos)
197i i972 1973 1974 1975 1976 1977 1978 1979 1980 1981 1982
1. Agricultural Financial Fund 1,032.3 1,291.7 1,897.5 6,153.6 6,047.3 7,664.7 10,778.9 12,002.9 16,792.2 21,669.2 27,703.0 37,373.0
1.1. Rotated crops 1,032.3 1,291.7 1,897.5 3,316.8 3,902.4 4,333.7 5,818.9 6,225.7 8,873.2 11,305.7 14,406.7 18,641.01.2. Other Activities - - - 2,836.8 2,144.9 3,331.0 4,960.0 5,777.2 7,919.0 10,363.5 13,296.3 18,732.0
1.2.1. Permanent and semi-permanent crops - - - 354.6 234.3 632.3 728.3 638.5 1,113.2 2,139.3 2,483.6 3,375.0
1.2.2. Annual crops - - - 4.4 68.6 68.8 78.5 84.8 134.0 - - -1.2.3. Fishery - - - 1,822.4 1,237.7 1,447.7 2,114.6 2,988.5 3,810.1 4,797.3 6,122.4 8,991.01.2.4. Other agricultural
activities - - - 655.4 604.3 1,182.3 2,038.5 2,065.4 2,861.7 3,426.9 4,690.3 6,366.0
2. Caja Agraria 2,648.8 3,130.7 4,040.4 4,601.7 5,136.6 6,015.4 9,721.5 10,343.5 12,044.5 10,082.6 15,356.8 18,072.8
2.1. Crops 1,514.8 1,592.8 2,007.1 2,337.3 3,254.1 3,747.3 5,355.7 5,602.7 7,684.4 7,124.1 9,787.0 10,776.92.2. Livestock 619.1 1,052.4 1,394.8 837.9 578.5 1,436.4 3,024.0 3,066.9 3,408.6 2,176.7 3,836.0 4,326.22.3. Other 514.9 485.5 638.5 1,178.4 1,203.9 708.1 1,155.8 1,536.1 951.5 781.8 1,733.8 2,969.72.4. Crop and Livestock Industry - - - 248.1 100.1 123.6 186.0 137.8 - - - -
3. LEY 26 1,819.9 1,416.8 1,219.5 - - - - _ _
3.1. Crops 635.1 606.8 565.2 - - - - - - - - -3.2. Livestock 1,184.8 810.0 654.3 - - - - - - - - -
4. INCORA 228.1 267.2 485.2 489.7 434.6 322.5 584.1 564.2 986.2 770.2 1,199.9 1,284.0
4.1. Crops 97.7 82.2 125.7 196.4 169.0 125.5 227.8 203.1 423.2 254.4 606.2 545.34.2. Livestock 68.3 137.6 200.7 130.9 154.8 114.8 251.2 214.4 408.9 398.2 411.6 542.74.3. Other 62.1 47.4 158.8 162.4 11U.6 o2.z io5.i i46.7 i54.i iio8. io2.i i96.u
5. Prodesarrollo 58.9 88.1 111.1 89.2 91.5 95.6 130.5 211.7 134.2 285.5 220.9 279.1
5.1. Crops 26.1 30.8 36.0 31.2 59.9 77.0 106.5 127.9 95.0 132.5 162.0 189.45.2. Livestock 32.8 57.3 75.1 58.0 31.6 18.6 24.0 10.5 30.9 63.2 58.8 58.15.3. Other - - - - - - - 73.3 8.3 89.8 - 31.6
60 Rence .An&dere - - - 363.9 350.8 1.047.4 1.779.4 2.363.6 4.195.7 1.076.4 1.813.0 2,340.4
TOTAL 5,788.0 6,194.5 7,753.7 11,698.1 12,060.8 15,145.6 22,994.4 25,485.9 34,152.8 33,883.9 46,293.6 59,349.3
ANNUAL CHANGE Z 18.1 7.0 25.2 50.9 3.1 25.6 51.8 10.8 34.0 -0.8 36.6 28.2
Sources: Ministry of Agriculture (OPSA) and DNP

Table 7.9 COLOMBIA: VALUE OF PRINCIPAL AGRICULTURAL IMPORTS, 1971-82(millions of US Dollars)
Preliminary Preliminary1971 1972 1973 1974 1975 1976 1977 1978 1979 1980 1981 1982
Crops 53.8 41.5 104.5 158.9 97.2 144.4 150.1 190.1 217.2 325.5 436.0 303.7
Wheat 30.1 28.5 33.9 79.1 54.1 65.1 26.7 50.7 52.6 128.8 71.4 104.3
Pulses 3.1 1.2 6.7 9.0 6.2 9.1 14.1 14.2 14.2 28.8 11.4 7.9Apples and grapes 2.0 2.4 1.5 3.2 3.1 4.8 3.7 3.2 9.0 13.0 11.9 16.0Barley 3.0 0.0 6.5 7.4 2.4 9.7 14.9 15.4 11.0 8.8 19.5 27.2Oats 1.2 1.5 2.2 2.9 2.3 2.7 2.8 2.8 4.2 3.5 3.6 4.3Corn 3.6 0.1 10.0 6.2 0.0 2.2 13.4 8.0 8.7 30.8 15.2 17.2Rice 0.0 0.0 0.0 0.0 0.0 0.0 0.9 5.0 3.6 0.6 - -Soybean and soybean oil 1.7 1.3 7.3 14.1 4.4 14.3 22.9 33.5 54.5 66.4 102.8 96.7Cotton oil 0.0 0.0 0.0 0.9 0.0 0.0 0.4 0.6 0.0 0.0 1.7 0.8 oCacao 8.0 5.1 7.6 10.2 5.9 0.6 0.0 0.1 0.0 0.0 0.2 1.9
Other 1.1 1.4 28.8 25.9 18.8 32.9 50.3 56.6 59.4 44.8 198.3 27.4
Livestock 0.7 1.6 2.2 2.6 19.3 29.7 48.0 42.0 40.5 73.0 84.8 90.9
Cattle 0.1 0.1 0.1 0.3 0.2 0.4 0.9 2.6 3.7 3.3 1.8 3.0Poultry and eggs 0.4 0.6 0.7 0.1 0.7 1.2 1.1 1.1 1.5 1.4 2.0 2.3
Livestock products 0.2 0.8 1.3 2.1 1.7 8.3 20.6 11.2 7.0 30.5 n.a. n.a.Other - 0.1 0.1 0.1 16.7 19.8 25.4 27.1 28.3 37.8 n.a. n.a.Fish - - 10.4 18.1 13.2 24.6 30.4 41.1 63.3 60.9 81.0 85.6
Total 54.5 43.1 117.1 179.6 129.7 195.7 228.5 273.2 321.0 459.4 601.8 480.2
Source: Ministry of Agriculture (OPSA)

able 7.10 aXlalIA: AREA PKAM=ED WrIH ]MPD Sl EW FM ECIED CROPS, 1970, 1975-82 a/(COO ha. ad percent of total area)
1970 1975 1976 1977 1978 1979 1980 1981 1982Area kea Area Area Area Area Area Area AreaWith X of With X of Wth X of With of With Zof With Z of With Z of With X of With Z of
lWprved Total !Wroved Total improved Total inproved Total IDwved TiLOl Taroved Total ilproved Mi !tprove W' 1 lwm1 '-'
Ptoijet S Area Se Area Seed Area Seed Area Seed Area Seed Area Seed Area See Area Seed Area
seane 25.2 70.0 19.7 40.3 5.5 16.5 11.1 3D.7 13.2 50.4 9.6 27.5 7.1 34,0 1.3 11.3 1.0 8.3
Cott,m 225.6 100.0 220.0 100.0 389.0 100.0 377.2 92.0 149.8 85.2 211.0 93.5 218.8 100.0 134.2 89.1 57.3 57.8
Rice 88.7 38.1 205.3 54.5 195.5 55.7 158.2 46.4 195.3 45.0 188.5 42.9 237.3 57.2 301.8 69.6 359.3 80.6
Berley 31.7 61.0 45.1 57.4 31.2 55.1 32.7 53.8 46.4 64.0 47.3 64.7 0.4 0.7 13.4 39.4 16.8 48.1
Beans 2.7 4.1 3.2 3.2 3.2 3.5 4.1 4.0 3.5 3.2 2.8 2.5 2.6 2.2 1.2 1.0 n.a. n.a.
Caraota 6.2 68.9 7.3 58.9 5.2 98.1 - - - - - - 0.3 - 0.5 - 0.02 -
li ze 166.8 25.4 136.4 23.6 129.5 20.3 121.8 17.8 118.9 18.4 71.7 11.5 79.9 12.8 71.8 11.2 91.3 14.4
Lbtatoes 0.9 1.1 0.4 0.5 0.3 0.3 0.3 0.2 0.4 0.3 0.5 0.1 0.3 - 0.4 0.2 0.2 -
SDrgxum 67.9 98.4 185.0 100.0 210.5 100.0 189.5 100.0 273.3 100.0 264.4 100.0 328.0 100.0 272.4 100.0 342.2 100.0
SDybans 53.4 89.0 55.3 94.9 45.2 97.0 49.9 94.2 66.9 94.0 810.0 96.0 61.7 94.8 46.8 99.5 48.9 99.0
Wieat 16.9 37.1 u,n 901 2S.3 9.4 23.6 7.6 7_7 6.a 70 l, 73t 17,5 7.2 19.0 7.0. 15.5
Total 686.0 44.6 886.7 49.6 1,025.4 53.8 954.2 46.9 875.3 47.9 876.8 46.6 943.7 41.4 851.0 44.0 924.0 49.3
a/ lenar year.
SuveS: Pftlstry of Agriculture (CMSA) and Intituto Con1eamo 4grpeario

Table 8.1 COLOMBIA: GROSS VALUE OF PRODUCTION OF THE MANUFACTURING INDUSTRIES, 1970, 1974-81(Millions of 1970 Pesos)
Preliminary1970 1974 1975 1976 1977 1978 1979 1980 1981
Total 59,317 72,416 74,562 80,732 89,732 95,465 101,850 103,072 100,495
Food Products 13,931 15,295 18,332 19,992 19,111 21,722 21,994 22,148 20,531Beverages 4,926 5,753 5,909 6,130 7,310 7,261 8,994 10,109 9,856Tobacco 1,225 1,263 1,150 1,047 1,132 1,030 1,019 1,090 1,359Textiles 8,483 8,275 7,357 8,135 11,267 10,476 9,987 9,617 9,848Footwear and Clothing 2,335 2,444 2,772 3,464 3,481 3,793 4,161 4,377 4,443Wood Products 606 560 646 537 460 505 498 463 491Furniture 365 354 279 310 340 349 375 404 370Paper and Products 2,135 3,133 3,135 3,486 3,624 3,634 4,044 4,198 4,114Printing 1,353 1,359 1,502 1,428 1,702 1,518 1,404 1,426 1,340Leather and Products 689 538 574 610 767 786 763 736 760Rubber Products 1,275 1,686 1,738 1,910 2,134 1,909 2,310 2,409 2,539Chemical Products 6,030 9,478 8,954 7,834 10,717 11,818 13,438 13,505 12,209Petroleum Derivatives 1,871 2,406 1,662 2,177 3,197 1,990 2,734 2,975 3,347Non-Metallic Minerals 2,368 2,884 2,646 2,817 2,804 3,140 3,118 3,155 2,871Basic Metals 1,980 2,202 2,374 2,979 3,072 2,465 2,413 2,365 2,497Metal Products 2,570 3,099 3,558 3,172 3,591 3,711 4,452 4,238 4,068Non-Electrical Machinery 1,578 2,336 2,142 2,580 2,850 3,338 3,565 3,950 3,903Electrical Machinery 1,512 1,977 1,948 2,433 2,827 3,692 3,427 3,290 3,524Transport Equipment 2,403 4,201 4,647 4,064 5,155 6,724 7,329 6,230 5,445
Other 1,682 3,173 3,237 3,627 4,191 5,604 5,825 6,387 6,980
Source: ANDI and DANE.
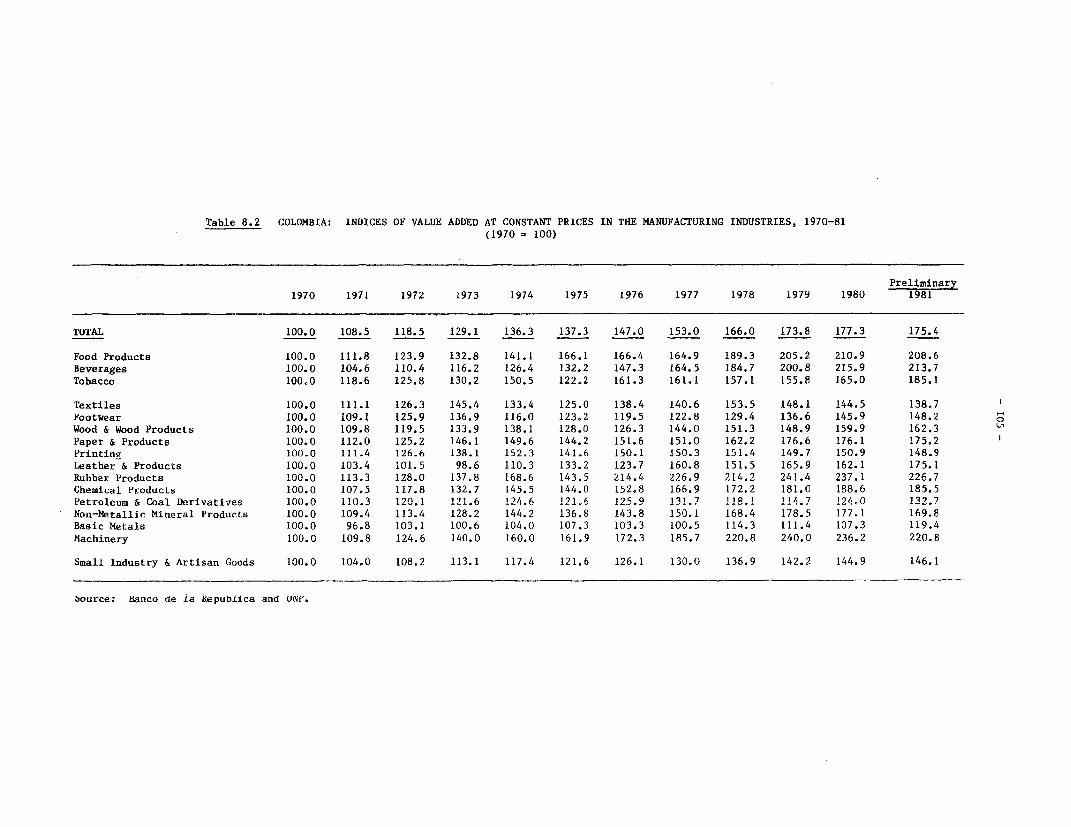
Table 8.2 COLOMBIA: INDICES OF VALUE ADDED AT CONSTANT PRICES IN THE MANUFACTURING INDUSTRIES, 1970-81(1970 = 100)
Preliminary
1970 1971 1972 1973 1974 1975 1976 1977 1978 1979 1980 1981
TOTAL 100.0 108.5 118.5 129.1 136.3 137.3 147.0 153.0 166.0 173.8 177.3 175.4
Food Products 100.0 111.8 123.9 132.8 141.1 166.1 166.4 164.9 189.3 205.2 210.9 208.6Beverages 100.0 104.6 110.4 116.2 126.4 132.2 147.3 164.5 184.7 200.8 215.9 213.7Tobacco 100.0 118.6 125.8 130.2 150.5 122.2 161.3 161.1 157.1 155.8 165.0 185.1
Textiles 100.0 111.1 126.3 145.4 133.4 125.0 138.4 140.6 153.5 148.1 144.5 138.7 1Footwear 100.0 109.1 125.9 136.9 116.0 123.2 119.5 122.8 129.4 136.6 145.9 148.2 0Wood & Wood Products 100.0 109.8 119.5 133.9 138.1 128.0 126.3 144.0 151.3 148.9 159.9 162.3Paper & Products 100.0 112.0 125.2 146.1 149.6 144.2 151.6 151.0 162.2 176.6 176.1 175.2Printing 100.0 111.4 126.6 138.1 152.3 141.6 150.1 150.3 151.4 149.7 150.9 148.9Leather & Products 100.0 103.4 101.5 98.6 110.3 133.2 123.7 160.8 151.5 165.9 162.1 175.1Rubber Products 100.0 113.3 128.0 137.8 168.6 143.5 214.4 226.9 214.2 241.4 237.1 226.7Chemical Products 100.0 107.5 117.8 132.7 145.5 144.0 152.8 166.9 172.2 181.0 188.6 185.5Petroleum & Coal Derivatives 100.0 110.3 120.1 121.6 124.6 121.6 125.9 131.7 118.1 114.7 124.0 132.7Non-Metallic Mineral Products 100.0 109.4 113.4 128.2 144.2 136.8 143.8 150.1 168.4 178.5 177.1 169.8Basic Metals 100.0 96.8 103.1 100.6 104.0 107.3 103.3 100.5 114.3 111.4 107.3 119.4Machinery 100.0 109.8 124.6 140.0 160.0 161.9 172.3 185.7 220.8 240.0 236.2 220.8
Small Industry & Artisan Goods 100.0 104.0 108.2 113.1 117.4 121.6 126.1 130.0 136.9 142.2 144.9 146.1
Source: Banco de ia Fepublica and URI'.
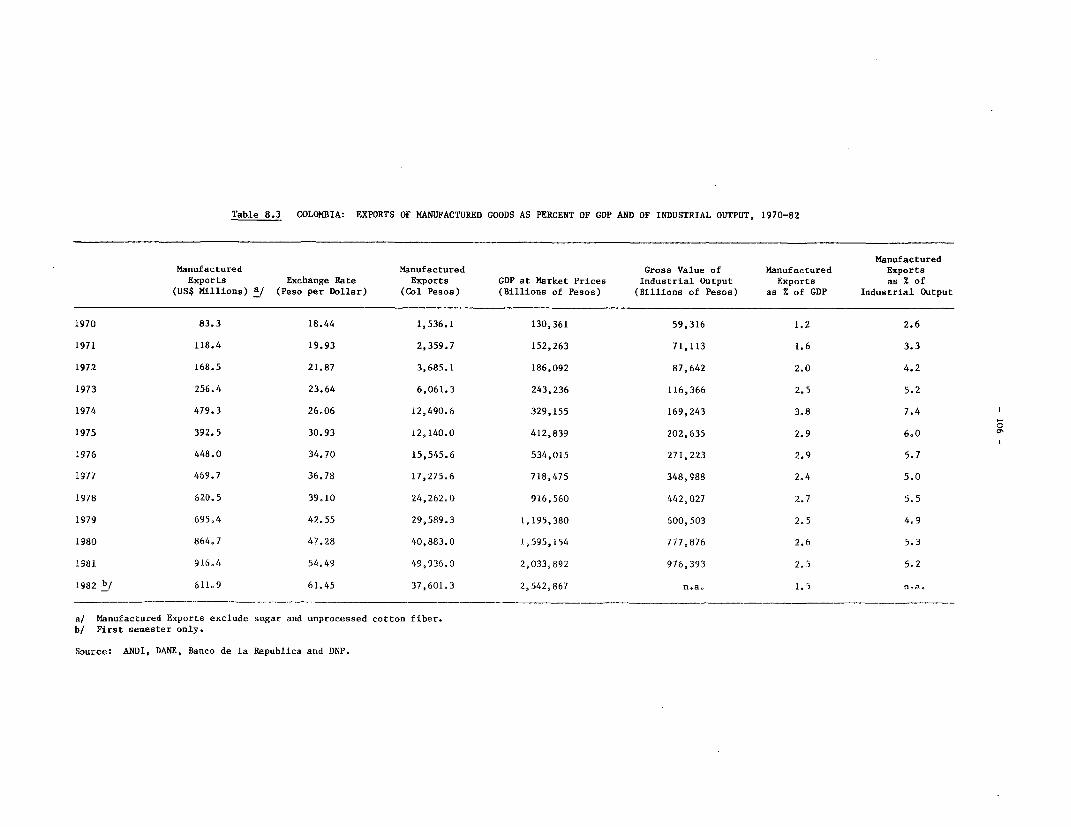
Table 8.3 COLOMBIA: EXPORTS OF MANUFACTURED GOODS AS PERCENT OF GDP AND OF INDUSTRIAL OUTPUT, 1970-82
ManufacturedManufactured Manufactured Gross Value of Manufactured Exports
Exports Exchange Rate Exports GDP at Market Prices Industrial Output Exports as % of
(US$ Millions) a/ (Peso per Dollar) (Col Pesos) (Billions of Pesos) (Billions of Pesos) as % of GDP Industrial Output
1970 83.3 18.44 1,536.1 130,361 59,316 1.2 2.6
1971 118.4 19.93 2,359.7 152,263 71,113 1.6 3.3
1972 168.5 21.87 3,685.1 186,092 87,642 2.0 4.2
1973 256.4 23.64 6,061.3 243,236 116,366 2.5 5.2
1974 479.3 26.06 12,490.6 329,155 169,243 3.8 7.4 1
1975 392.5 30.93 12,140.0 412,839 202,635 2.9 6.0 a
1976 448.0 34.70 15,545.6 534,015 271,223 2.9 5.7
1977 469.7 36.78 17,275.6 718,475 348,988 2.4 5.0
1978 620.5 39.10 24,262.0 916,560 442,027 2.7 5.5
1979 695.4 42.55 29,589.3 1,195,380 600,503 2.5 4.9
1980 864.7 47.28 40,883.0 1,595,154 777,876 2.6 5.3
1981 916.4 54.49 49,936.0 2,033,892 976,393 2.5 5.2
1982 b/ 611.9 61.45 37,601.3 2,542,867 n.a. 1.5 n.a.
a/ Manufactured Exports exclude sugar and unprocessed cotton fiber.
b/ First semester only.
Source: ANDI, DANE, Banco de la Republica and DNP.

Table 8.4 COLOMBIA: PAID EMPLOYMENT IN MANUFACTURING INDUSTRIES BY TYPE OF PRODUCTION, 1960, 1965, 1970-81(percent)
Preliminary1960 1965 1970 1971 1972 1973 1974 1975 1976 1977 1978 1979 1980 1981
Non-durable Consumer GoodsFood 14.7 14.1 14.7 13.8 14.0 13.5 13.5 14.0 13.3 13.2 13.7 14.3 13.9 13.8Beverages 5.9 5.9 4.5 4.6 4.7 4.7 4.4 4.5 4.7 4.8 4.9 5.1 5.6 5.7Tobacco Products i.7 1.3 i.i i.i 0.9 0.8 1.2 i.0 0.8 0.8 0.7 0.7 0.7 0.7Sub Total 22.4 21.3 20.3 19.5 19.6 19.1 19.2 19.5 18.8 18.8 19.3 20.1 20.2 20.2
Textiles 17.9 15.6 17.4 18.2 17.2 18.3 16.6 16.6 16.1 16.2 15.5 14.2 14.2 14.0Clothing, Footwear 11.2 11.0 9.5 10.3 10.0 10.5 10.5 10.4 10.2 10.9 10.8 10.7 10.3 10.2Printing 4.3 4.0 3.8 3.9 3.7 3.8 3.8 3.9 3.7 3.9 3.9 3.9 3.9 4.0Sub Total 33.4 30.6 30.7 32.4 30.9 32.6 3. 30.9 30.0 3 30.2 28.8 *- 28.2
Durable Consumer GoodsFurniture, Fixture a/ 1.9 1.7 1.9 1.8 1.7 1.6 1.7 1.6 1.6 1.4 1.4 1.4 1.4 1.3Rubber Products 2.4 2.5 2.0 2.0 1.6 1.8 2.1 1.8 1.7 1.8 1.6 1.8 1.8 1.8Sub Total 4.3 4.2 3.9 3.8 3.3 3.5 3.8 3T4 3.3 3.2 3.0 3.2 3.2 3.1
Intermediate Goods 0
Wooden Products 2.3 2.1 2.3 2.0 2.0 1.9 1.9 1.8 1.8 1.2 1.3 1.2 1.0 0.9Paper and Products 1.6 2.0 2.3 2.4 2.6 2.3 2.4 2.4 2.4 2.4 2.4 2.5 2.5 2.5leather and Products 1.7 1.6 1.3 1.5 1.3 1.3 1.4 1.7 1.7 1.7 1.7 1.7 1.6 1.7Chemicals 6.6 7.2 7.1 7.7 7.2 7.4 7.7 7.6 7.5 7.3 7.0 7.0 7.4 7.2Oil Products 0.8 0.7 0.7 0.8 0.7 0.6 1.0 1.0 0.9 1.0 1.0 1.0 1.0 0.9Nuuv Le.Lltic rineraiL 9.0 S.9 .,. 9.Z ,.0 9.0 64.0 4.^ 4.^ 4.2Basic Metals 1.3 1.4 3.8 1.9 3.5 3.5 3.4 3.5 3.5 3.6 3.5 3.6 3.7 3.8Metal Products 5.4 4.0 7.0 6.9 6.9 6.4 6.6 6.5 6.4 6.2 6.5 6.4 6.3 6.1Sub Total 28.7 30.9 31.8 30.4 32 0.4 3F.3 31.3 31.0 27.4 27.4 27.4 27.5 27.3
Capital GoodsMechanical Machinery 1.3 1.7 3.7 4.0 3.5 3.5 3.4 3.2 3.3 3.5 3.6 3.4 3.4 3.3Electrical Machinery 2.5 3.5 2.5 2.6 2.9 3.0 2.9 2.9 3.1 3.7 3.8 3.9 4.1 4.2Transport Equipment 4.9 5.1 2.9 2.8 2.8 3.2 3.8 4.1 4.2 4.5 4.5 4.6 4.7 4.4Sub Total 8.7 10.3 9.1 9.4 9.2 9. 10. 1 10. 17 11.9 1 1 11.9
Other b/ 2.5 2.7 4.2 4.5 5.8 4.7 4.7 4.7 6.3 7.9 8.2 8.5 8.5 9.3
Totl i100.0 iOO.O iOO.. 0.U i0.U iU.0 iU.U iOU.V iOO.O ;00.0 ioU.o 19.0 lvv.v lO.v
a/ Includes manufacturing of furniture and accessories and industry of timber and cork products except furniture.b/ Includes other manufacturing industries as well as manufacturing of professional and scientific measurement and control instruments n.e.s., photographic equipment
and optical instruments.
Source: DANE and Bank staff estimates
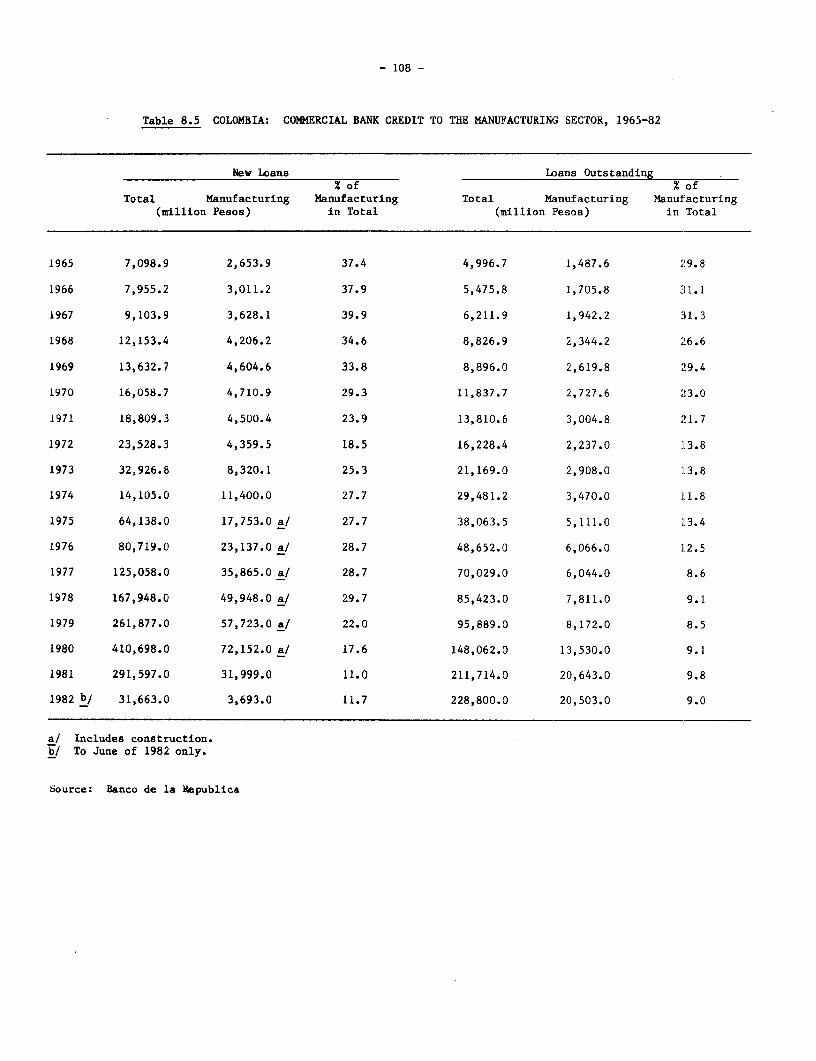
- 108 -
Table 8.5 COLOMBIA: COMMERCIAL BANK CREDIT TO THE MANUFACTURING SECTOR, 1965-82
New Loans Loans Outstanding% of % of
Total Manufacturing Manufacturing Total Manufacturing Manufacturing(million Pesos) in Total (million Pesos) in Total
1965 7,098.9 2,653.9 37.4 4,996.7 1,487.6 29.8
1966 7,955.2 3,011.2 37.9 5,475.8 1,705.8 31.1
1967 9,103.9 3,628.1 39.9 6,211.9 1,942.2 31.3
1968 12,153.4 4,206.2 34.6 8,826.9 2,344.2 26.6
1969 13,632.7 4,604.6 33.8 8,896.0 2,619.8 29.4
1970 16,058.7 4,710.9 29.3 11,837.7 2,727.6 23.0
1971 18,809.3 4,500.4 23.9 13,810.6 3,004.8 21.7
1972 23,528.3 4,359.5 18.5 16,228.4 2,237.0 13.8
1973 32,926.8 8,320.1 25.3 21,169.0 2,908.0 13:.8
1974 14,105.0 11,400.0 27.7 29,481.2 3,470.0 11.8
1975 64,138.0 17,753.0 a/ 27.7 38,063.5 5,111.0 13.4
1976 80,719.0 23,137.0 a/ 28.7 48,652.0 6,066.0 1]2.5
1977 125,058.0 35,865.0 a/ 28.7 70,029.0 6,044.0 8.6
1978 167,948.0 49,948.0 a/ 29.7 85,423.0 7,811.0 9.1
1979 261,877.0 57,723.0 a/ 22.0 95,889.0 8,172.0 8.5
1980 410,698.0 72,152.0 a/ 17.6 148,062.0 13,530.0 9.1
1981 291,597.0 31,999.0 11.0 211,714.0 20,643.0 9.8
1982 b/ 31,663.0 3,693.0 11.7 228,800.0 20,503.0 9.0
a/ Includes construction.b/ To June of 1982 only.
Source: Banco de la Republica

ole 8.6 C(MXASA WID (F HRW flGC (F H AIS, 1970-81
)lnerals Unit 1970 1971 1972 1973 1974 1975 1976 1977 1978 1979 1980 1981
Gold Troy (lne 201,518 188,847 186,811 216,201 264,671 308,676 297,892 257,070 246,446 269,369 510,439 529,214Sliver Troy (me 75,851 67,077 69,678 74,407 75,290 87,671 105,723 90,948 76,773 99,331 151,542 142,740Platixm Troy Coie 26,036 2B,081 24,111 26,358 21,125 22,114 16,778 17,315 13,939 12,932 14.345 14.804
Faeral&s a/ 1arat 2,222,812 774,433 1,881,712 660,348 32,647 248,715 499,801 484,512 894,888 1,228,488 275,111 299,006
iron Ore Ton 453,000 453,000 419,950 480,000 510,0oW0 595,000 542,000 504,800 497,000 396,900 506,269 418,900Lead(O )ntrate) Ton 585 411 126 365 301 272 347 276 200 376 312 256zinc (Qamtrt) Ibm 389 279 77 54 93 18 - - - - 303Xteiry (Gmcetrate) Poxd 17,055 6,479 4,182 10,950 - - - - - - - -Cpr (Czitrat) Tim 200 225 267 70 - - 260 310 400 336 442 450M-pNese mm 5,743 2,480 3,401 3,709 5,928 6,650 7,798 11,875 20,011 21,453 21,400 20,300Qirtulia Ton 170 180 200 12,000 - - - - - - - -Coal TMo 2,500,000 2,800,000 2,900,000 3,360,000 3,600,00 3,800,000 4,000,000 4,204,000 4,754,00w 4,885,0oo 4,947,000 5,Qm,000Oak Ton 244,0W0 271,000 194,000 310,00W 335,000 319,000 390,000 334,000 357,OOw 335,c00 - -metalUnrgic Coal Ton 380,000 408,000 481,000 470,000 545,000 541,000 632,000 554,000 582,000 546,000 - -l tm Ihi 5,007,0w0 5,341,824 6,591,127 7,000,000 7,620,000 7,800,000 7,800,000 8,112,000 9,431,(XX 9,700,330 9,760,450 10,053,200Sulhur (Refined) Ton 25,837 34,678 23,700 23,800 30,612 25,000 17,800 27,000 35,OOD 16,050 25,647 26,300(lypezn Tmx 189,062 182,000 186,174 193,501 198,000 200,000 205,000 210,000 255,0w0 257,300 262,400 270,200Bonzte Ton 13,340 13,670 28,500 43,800 28,000 30,000 23,000 22,000 31,750 28,642 14,350 15,000MEie Ton 7.125 5.aoo 5.500 1.300 7.500 8.750 10.832 8.688 12:039 16.891 17-O 16.6meazytes Tm 6,821 5,790 4,098 1,922 2,500 3,000 3,100 3,450 3,500 3,500 3,200 3,380
Feldpr To 23,152 24,836 28,619 30,000 28,700 30,000 30,aa0 26,508 26,455 29,200 27,150 27,500clay Ton 708,660 766,575 778,293 790,000 820,000 850,000 860,000 790,000 783,000 819,150 786,384 810,000Sand Ton 165,375 172,500 202,966 340,000 360,000 370,010 398,342 428,854 440,000 480,000 492,000 502,300Mlne Salt 419,788 435,283 450,451 469,504 338,446 343,560 338,869 347,020 377,193 383,459 346,568 316,250tea ialt Im 141,3U9 390,513 673,965 843,035 670,607 741,233 739,364 594,415 459,558 369,456 491,017 398,686TalcLu Ton 1,723 355 708 900 800 1,000 2,200 3,380 4,320 6,055 5,900 6,050Calcite Mon 13,424 12,736 6,400 7,000 7,500 7,200 7,800 8,280 8,500 8,500 8,620 8,740Dlatoacite TMn 280 300 100 350 550 600 650 630 630 630 630 n.a.igeite TM 1,560 2,180 1,649 1,800 1,700 785 1,632 1,770 1,400 1,582 n.a. n,a.Nfra TDO 26 32 38 - - - - - - - - -
Flurite Ton - - 4.200 - - - - _ 300 - n.a.Pameh ric Rock Tom 4,798 5,520 6,821 10,421 12,000 13,000 9,300 5,800 1,320 6,776 6,370 6,705B,toaite Ton - - 1,000 1,200 1,000 1,O W - - - - - -
a/ Faports.
Somm: Natiml PiUa g laatsent
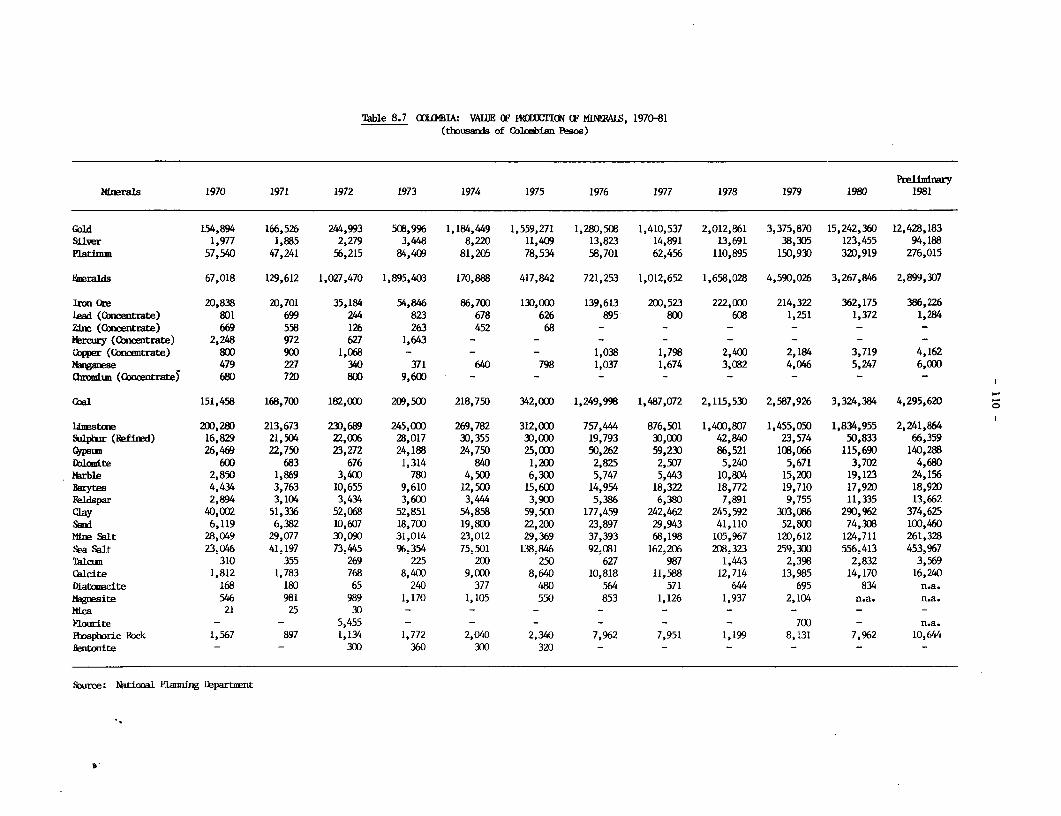
Table 8.7 (XIXBIA: VAlIE OF PRl MlCON CF MfNRAIS, 1970-81
(thousands of Colombian Pesos)
Preliminary
MInerals 1970 1971 1972 1973 1974 1975 1976 1977 1978 1979 1980 1981
Gold 154,894 166,526 244,993 508,996 1,184,449 1,559,271 1,280,508 1,410,537 2,012,861 3,375,870 15,242,360 12,428,183Silver 1,977 1,885 2,279 3,448 8,220 11,409 13,823 14,891 13,691 38,305 123,455 94,188Platinr. 57,540 47,241 56,215 84,409 81,205 78,534 58,701 62,456 110,895 150,930 320,919 276,015
Ereralds 67,018 129,612 1,027,470 1,895,403 170,888 417,842 721,253 1,012,652 1,658,028 4,590,026 3,267,846 2,899,307
Iron Ore 20,838 20,701 35,184 54,846 86,700 130,000 139,613 200,523 222,000 214,322 362,175 386,226lead (Concentrate) 801 699 244 823 678 626 895 800 608 1,251 1,372 1,284Zln (Qnicentrate) 669 558 126 263 452 68 - - - - - -
Mercury (Concetrate) 2,248 972 627 1,643 - - - - - - - -
Copper (Conentrate) 800 900 1,068 - - - 1,038 1,798 2,400 2,184 3,719 4,1621gne 479 227 340 371 640 798 1,037 1,674 3,082 4,046 5,247 6,000
uaKondu (Concentratey 680 720 800 9,600 - - - - - - - -
Coal 151,458 168,700 182,000 209,500 218,750 342,000 1,249,998 1,487,072 2,115,530 2,587,926 3,324,384 4,295,620
TLnestce 200,280 213,673 230,689 245,000 269,782 312,000 757,444 876,501 1,400,807 1,455,050 1,834,955 2,241,864Sulphr (Refined) 16,829 21,504 22,006 28,017 30,355 30,000 19,793 30,000 42,840 23,574 50,833 66,359(aip 26,469 22,750 23,272 24,188 24,750 25,000 50,262 59,230 86,521 108,066 115,690 140,288Dbolomte 600 683 676 1,314 840 1,200 2,825 2,507 5,240 5,671 3,702 4,680Marble 2,850 1,869 3,400 780 4,500 6,300 5,747 5,443 10,804 15,200 19,123 24,156Baryte 4,434 3,763 10,655 9,610 12,500 15,600 14,954 18,322 18,772 19,710 17,920 18,920Feldspar 2,894 3,104 3,434 3,600 3,444 3,900 5,386 6,380 7,891 9,755 11,335 13,662Clay 40,002 51,336 52,068 52,851 54,858 59,500 177,459 242,462 245,592 303,086 290,962 374,625Sail 6,119 6,382 10,607 18,700 19,800 22,200 23,897 29,943 41,110 52,800 74,308 100,460Mtine Salt 28,049 29,077 30,090 31,014 23,012 29,369 37,393 68,198 105,967 120,612 124,711 261,328Sea Salt 23,046 41,197 73,445 96,354 75,501 138,846 92,081 162,206 208,323 259,300 556,413 453,967Talcum 310 355 269 225 200 250 627 987 1,443 2,398 2,832 3,569lcite 1,812 1,783 768 8,400 9,000 8,640 10,818 11,588 12,714 13,985 14,170 16,240
Diatomacite 168 180 65 240 377 480 564 571 644 695 834 n.a.Magiesite 546 981 989 1,170 1,105 550 853 1,126 1,937 2,104 n.a. n.a.Mica 21 25 30 - - - - - - -
Florite - n.a - - - - - 700 -
Ehtsphric Pock 1,567 897 1,134 1,772 2,040 2,340 7,962 7,951 1,199 8,131 7,962 10,644Bentonite - - 300 360 300 320 - - - - - -
Source: National FPamui repartent
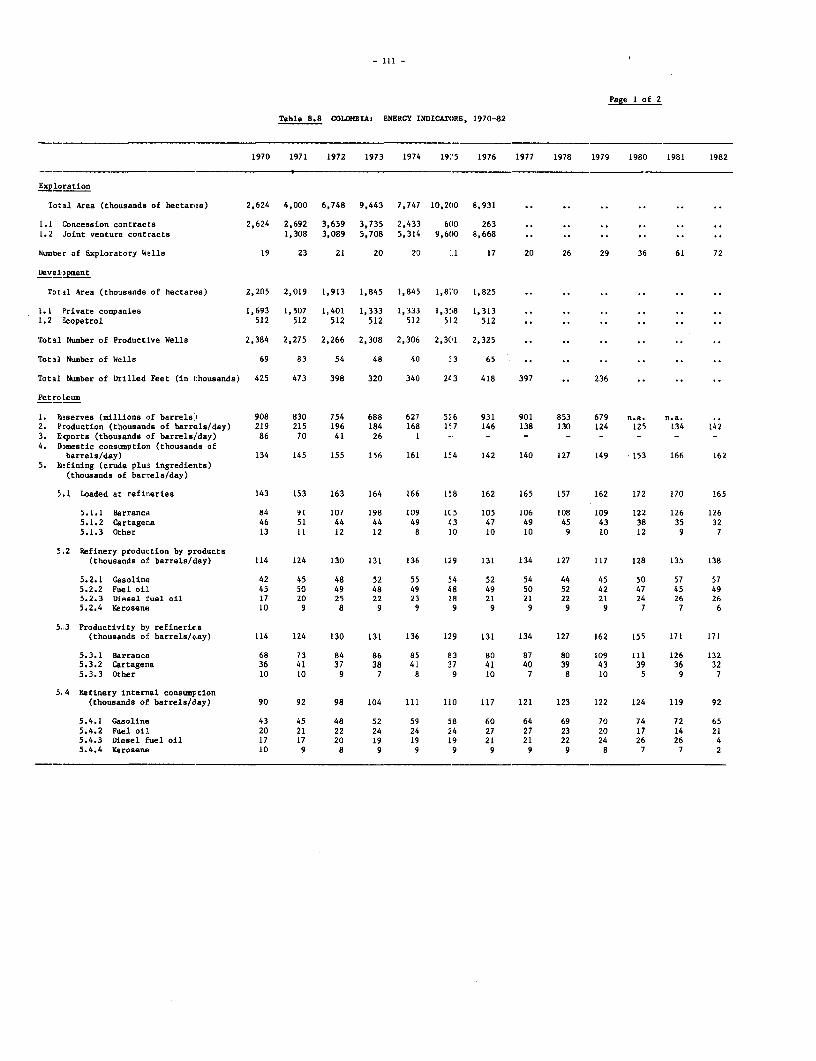
- Ill -
Page 1 of 2
Table 8.8 COLOMBIA: ENERGY INDICATORS, 1970-82
1970 1971 1972 1973 1974 19 '5 1976 1977 1978 1979 1980 1981 1982
Exploration
Total Area (thousands of hectares) 2,624 4,000 6,748 9,443 7,747 10,200 8,931 .. .. ..
1.1 Concession contracts 2,624 2,692 3,659 3,735 2,433 600 263 .. .. ..
1.2 Joint venture contracts 1,308 3,089 5,708 5,314 9,600 8,668 .. .. ..
Number of Exploratory Wells 19 23 21 20 20 1 17 20 26 29 36 61 72
Development
Total Area (thousands of hectares) 2,205 2,019 1,913 1,845 1,845 1,8;0 1,825 .. .. ..
1.1 Private comapanies 1,693 1,507 1,401 1,333 1,333 1,3'8 1,313 .. .. ..
1.2 Icopetrol 512 512 512 512 512 512 512 .. .. .. ..
Total Number of Productive Wells 2,384 2,275 2,266 2,308 2,306 2,301 2,325 .. .. ..
Total Number of Wells 69 83 54 48 40 53 65 .. .. ..
Total Number of Drilled Feet (in thousands) 425 473 398 320 340 213 418 397 .. 236
PetroLeum
1. Euserves (millions of barrels) 908 830 754 688 627 5i.6 931 901 853 679 n.a. n.a.2. Production (thousands of barrela/day) 219 215 196 184 168 1'7 146 138 130 124 125 134 1423. Exports (thousanda of barrels,lday) 86 70 41 26 1 _ _ _ _ - _ _4. DIroestic consumption (thousands of
barrels/day) 134 145 155 156 161 154 142 140 127 149 153 166 1625. Enfining (crude plus ingredienits)
(thousands of barrels/day)
5.1 Loaded at refineries 143 153 163 164 166 158 162 165 157 162 172 170 165
5.1.1 Barranca 84 91 107 198 109 105 105 106 108 109 122 126 1265.1.2 Cartagena 46 51 44 44 49 43 47 49 45 43 38 35 325.1.3 Other 13 11 12 12 8 10 10 10 9 10 12 9 7
5.2 Refinery production by products(thousands of barrels/day) 114 124 130 131 136 129 131 134 127 117 128 135 138
5.2.1 Gasoline 42 45 48 52 55 '4 52 54 44 45 50 57 575.2.2 Fuel oil 45 50 49 48 49 48 49 50 52 42 47 45 495.2.3 Diesel fuel oil 17 20 25 22 23 18 21 21 22 21 24 26 265.2.4 Kerosene 10 9 8 9 9 9 9 9 9 9 7 7 6
5.3 Productivity by refinericis(thousands of barrels/day) 114 124 130 131 136 129 131 134 127 162 155 171 171
5.3.1 Barranca 68 73 84 86 85 E3 80 87 80 109 111 126 1325.3.2 Cartagena 36 41 37 38 41 37 41 40 39 43 39 36 325.3.3 Other 10 10 9 7 8 9 10 7 8 10 5 9 7
5,4 Refinery internal consumption(thousands of barrels/dlay) 90 92 98 104 111 110 117 121 123 122 124 119 92
5.4.1 Gasoline 43 45 48 52 59 58 60 64 69 70 74 72 655.4.2 Fuel oil 20 21 22 24 24 24 27 27 23 20 17 14 215.4.3 Diesel fuel oil 17 17 20 19 19 19 21 21 22 24 26 26 45.4.4 Kerosene 10 9 8 9 9 9 9 9 9 8 7 7 2

- 112 -
Page 2 of 2
Table 8.8 COLOMBIA: ENERGY INDICATORS, 1970-82
1970 1971 1972 1973 1974 1975 1976 1977 1978 1979 1980 1981 1982
5.5 Refinery capacity (thousands ofbarrels/day) 137 174 174 174 174 174 174 174 174 196 194 194 203
5.5.1 Barranca 75 111 111 111 111 111 111 111 111 135 131 131 1405.5.2 Cartagena 46 50 50 50 50 50 50 50 50 47 50 50 475.5.3 Other 16 13 13 13 13 13 13 13 13 14 13 13 16
Natural Gas
1. Reserves (M.M.M.P.C.) 1,968 1,853 1,611 1,634 1,519 4,689 6,390 4,554 4,412 4,442 4,260 4,1722. Production (M.M.M.P.C.) 105 111 116 113 117 121 118 122 147 151 161 168 1753. Utilization
3.1 Transformed 4 4 5 5 5 5 5 4 4 4 5 5 43.2 Injected 33 33 31 30 31 30 25 22 23 16 15 15 143.3 Industry 34 38 46 47 48 48 50 58 81 93 102 112 1213.4 Fields 14 13 14 13 13 13 12 12 12 12 12 13 123.5 Burned 20 23 20 18 20 25 26 26 27 26 27 24 23
4. Gas Treated in Plants (M.M.M.P.C.) 71 72 71 74 74 74 70 65 64 63 66 62 605. Production of Derivatives (millions
of gallons) 126 126 124 123 121 118 103 94 95 94 92 91 77
5.1 Natural gasoline 46 45 43 39 38 34 29 29 30 34 32 32 275.2 Butane 33 33 30 31 30 31 28 24 25 23 23 23 195.3 G.L.P. in plants 47 48 51 53 53 53 46 41 40 37 36 36 31
6. Liquified Petroleum Gas Produced inRefineries (millions of gallons) 63 59 75 73 70 65 81 78 70 68 78 77 78
6.1 Barranca 59 54 70 67 65 58 72 68 59 56 67 65 676.2 Cartagena 4 5 5 6 5 7 9 10 11 12 11 12 11
7. Total G.L.P. Production in Plants andRefineries (millions of gallons) 110 107 126 126 123 118 127 119 110 105 114 14 109
8. G.L.P. Consumption (millions of gallons) 94 99 109 122 125 118 121 116 103 106 106 118 96
II. EXPORTS
A. Volume (thousands of barrels/day)
1. Crude Petroleum 86 70 41 26 1 - - - - - - - -2. Refined 29 32 34 29 28 24 24 24 30 25 26 29 33
2.1 By Companies
2.1.1 Ecopetrol 25 27 30 25 27 24 24 24 30 25 26 29 332.1.2 Others 4 5 4 4 1 - - - - - - - -
- not available
Source: National Planning Department
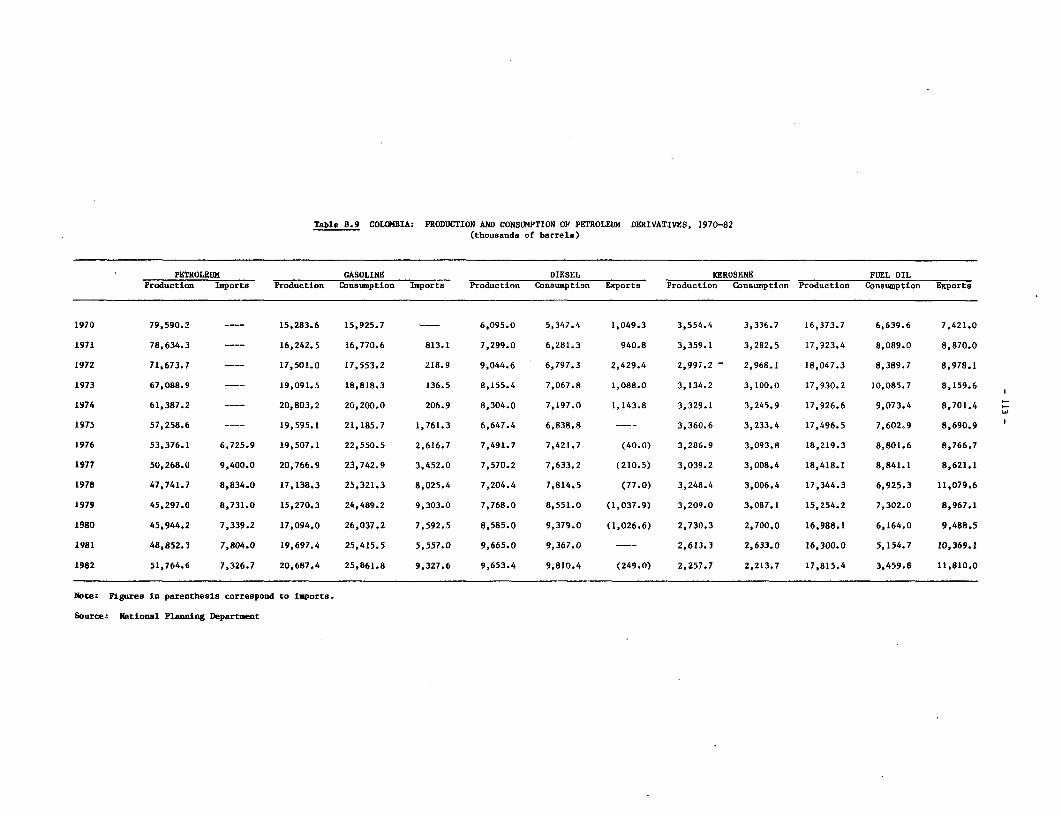
Table 8.9 COLOMBIA: PRODUCTION AND CONSUMPTION OF PETROLEUM DERIVATIVES, 1970-82(thousands of barrels)
PETROLEUM GASOLINE DIESEL KEROSENE FUEL OILProduction Imports Production Consumption Imports Production Consumption Exports Production Consumption Production Consumption Exports
1970 79,590.2 -- 15,283.6 15,925.7 --- 6,095.0 5,347.4 1,049.3 3,554.4 3,336.7 16,373.7 6,639.6 7,421.0
1971 78,634.3 -- 16,242.5 16,770.6 813.1 7,299.0 6,281.3 940.8 3,359.1 3,282.5 17,923.4 8,089.0 8,870.0
1972 71,673.7 -- 17,501.0 17,553.2 218.9 9,044.6 6,797.3 2,429.4 2,997.2 2,968.1 18,047.3 8,389.7 8,978.1
1973 67,088.9 19,091.5 18,818.3 136.5 8,155.4 7,067.8 1,088.0 3,134.2 3,100.0 17,930.2 10,085.7 8,159.6
1974 61,387.2 20,803.2 20,200.0 206.9 8,304.0 7,197.0 1,143.8 3,329.1 3,245.9 17,926.6 9,073.4 8,701.4
1975 57,258.6 -- 19,595.1 21,185.7 1,761.3 6,647.4 6,838.8 ---- 3,360.6 3,233.4 17,496.5 7,602.9 8,690.9
1976 53.376.1 6,725.9 19,507.1 22,550.5 2,616.7 7,491.7 7,421.7 (40.0) 3,286.9 3,093.8 18,219.3 8,801.6 8,766.7
1977 50,268.0 9,400.0 20,766.9 23,742.9 3,452.0 7,570.2 7,633.2 (210.5) 3,039.2 3,008.4 18,418.1 8,841.1 8,621.1
1978 47,741.7 8,834.0 17,138.3 25,321.3 8,025.4 7,204.4 7,814.5 (77.0) 3,248.4 3,006.4 17,344.3 6,925.3 11,079.6
1979 45,297.0 8,731.0 15,270.3 24,489.2 9,303.0 7,768.0 8,551.0 (1,037.9) 3,209.0 3,087.1 15,254.2 7,302.0 8,967.1
1980 45,944.2 7,339.2 17,094.0 26,037,2 7,592.5 8,585.0 9,379.0 (1,026.6) 2,730.3 2,700.0 16,988.1 6,164.0 9,488.5
1981 48,852.3 7,804.0 19,697.4 25,415.5 5,557.0 9,665.0 9,367.0 --- 2,613.3 2,633.0 16,300.0 5,154.7 10,369.1
1982 51,764.6 7,326.7 20,687.4 25,861.8 9,327.6 9,653.4 9,810.4 (249.0) 2,257.7 2,213.7 17,815.4 3,459.8 11,810.0
Note: Figures in parenthesis correspond to imports.
Source: National Planning Department

- 114 -
Table 8.10 COLOMBIA: AVERAGE WHOLESALE COAL PRICES, 1970-82
Year Coking and Thermal a/ Coking and Thermal b/(Col$ per Ton) (US$ per Ton)
1970 61.0 3.31971 60.0 3.01972 63.0 2.91973 62.0 2.61974 61.0 2.31975 90.0 2.91976 312.0 8.91977 354.0 9.61978 445.0 11.41979 530.0 12.41980 622.0 13.21981 c/ 809.0 14.91982 c/ 1,388.0 22.0
a/ The total price quoted is the national weighted average at the minehead.h/ Converted to US dollars using average annual exchange rate.ci Estimated.
Source: National Planning Department.

- 115 -
Table 8.11 COLOMBIA: NATURAL GAS PRICES, 1975-82
Producer Price Retail PriceYlear (US$ per thousand cubic feet) (US$ per thousand cubic feet)
Industry andPetrochemical Electricty_ Residential
1975 n.a. 0.75 0.75 0.75
1976 n.a. 0.98 0.98 0.98
.1977 0.80 1.03 1.03 1.03
.1978 0.81 0.97 0.97 0.97
1979 0.74 0,99 1.14 1.29
1980 1.46 1.,16 1.73 1.97
1981 1.97 1,01 1.50 1.71
1982 n.a. 0,,96 1.47 1.66
n.a. - Not available
Source: Ministry of Mines and Energy

- 116 -
Table 8.12 COLOMBIA: CONSUMER PRICES OF SELECTED PETROLEUM DERIVATIVES,1970-82
(US$ per gallon) a/
Gasoline Diesel Aviation FuelRegular Extra Oil Fuel Kerosene Oil
1970 0.13 n.a. 0.10 - -
1971 0.17 0.24 0.12 - 2.25
1972 0.16 0.21 0.11 - 2.25
1973 0.14 0.20 0.10 - 2.25
1974 0.13 0.18 0.09 - 2.25
1975 0.15 0.30 0.14 0.21 0.14
1976 0.24 0.35 0.23 0.29 0.23
1977 0.33 0.37 0.31 0.33 0.31 -
1978 0.41 0.51 0.38 0.50 0.38 13.14
1979 0.61 0.76 0.58 0.61 0.58 0.33
1980 0.93 1.11 0.93 1.04 0.93 0.44
1981 1.01 1.17 1.01 1.00 1.01 0.48
1982 1.06 1.21 1.06 1.09 1.06 0.50
a/ Converted to US dollars using annual average exchange rate.
Source: National Planning Department

Thbe 8.13 (XID6AU AVWiA flMICAL MMIW BY 88718 AM3 WMri, 1970, 1975-81
_ _ _ _ _ _ _ __R (n & DB80KIAL ThLIXMtLL QCF32L Ta1970 1975 1976 1977 1978 1979 1980 1970 1975 1976 1977 197~81979 ~1980 1970 1975 1976 1977 1978 1979 1980 1970 1975 1976 1977 1978 19799 1980 -f1lT
ktI~iq~da a/ 0.19 0.34 0.42 0.59 0.90 1.47 1.23 0.3D 0.49 0.61 0.93 1.63 1.73 1.93 0.24 0.44 0.55 0.92 1.18 1.42 1.37 0.09 0.23 0.34 0.53 0.86 1.47 1.22 1.81
k1uzZ~~~~m 0.24 0.51 0.69 0.88 1.06 1.25 1.76 0.27 0.76 0.98 1.28 1.62 1.83 2.47 0.23 0.50 0.69 1.09 1.28 1.48 2.03 0.17 0.42 0.64 0.85 0.62 1.21 1.65 3.03
ESE ~~~0.15 0.3D 0.35 0.46 0.61 0.76 0.98 0.30 0.54 0.62 0.81 1.3D 1.82 2.4.8 0.23 0.39 0.47 0.63 0.93 1.26 1.71 - 0.31 0.37 0.49 0.75 1.05 1.32 2.10
8o11,ar 0.35 0.50 0.63 0.82 1.06 1.44 1.94 0.63 0.77 1.09 1.31 1.72 2.22 2.95 0.23 0.52 0.72 0.99 1.37 1.79 2.26 0.40 0.42 0.66 0.81 1.10 1.45 2.35 3.03
Bwac 0.18 0.40 0.51 0.59 0.79 1.10 1.22 0.26 0.50 0.57 0.89 1.22 1.65 2.03 0.17 1.31 0.40 0.69 0.94 1.11 1.69 0.13 0.23 0.36 0.49 0.74 0.62 1.2D 2.90
cm ~~~0.22 0.36 0.41 0.59 0.79 0.91 1.12 0.27 0.58 0.74 1.07 0.42 1.63 2.32 0.15 0.46 0.53 0.77 0.99 1.20 1.67 0.10 0.29 0.31 0.48 0.85 0.71 1.01 2.74
(~~~mta ~~- - - - 1.04 1.O 1.30 - - - - 1.19 1.11 1.70 - - - - 1.09 1.09 1.51 - - - - 1.09 1.0 1.42 2.20
C~~~uca ~~0.16 0.35 0.44 0.67 0.71 0.88 1.34 0.16 0.45 0.56 0.80 1.16 1.44 2.01 0.15 0.50 0.61 0.74 1.01 1.56 1.95 0.15 0.32 0.48 0.52 0.76 n.a. 1.3D 2.09
dC ~~ ~~~- 0.45 0.51 0.63 0.83 1.07 1.41 - 0.54 0.61 0.81 0.99 1.38 2.09 - 0.52 0.72 1.09 1.41 1.76 2.40 - 0.34 0.41 0.54 0.45 n.a. 1.21 n.a.
0889W ~0.31 0.75 0.96 1.34 - 1.87 2.46 0.33 0.85 1.15 1.65 - 2.35 3.03 0.27 0.75 1.C2 1.48 - 2.07 2.73 0.25 0.78 1.04 1.48 - 1.9 2.48 3.41
(bninl,a 0.46 0.61 0.65 0.87 1.09 1.37 1.90 0.26 0.77 0.84 1.13 1.28 1.81 2.70 0.15 0.43 0.49 0.78 1.13 1.50 2.09 0.24 0.48 0.54 0.86 1.15 n.a. 1.89 2.91
OntLzinrca 0.29 0.35 0.45 0.63 0.89 1.37 1.47 0.29 0.45 0.63 0.94 1.34 1.65 2.27 0.25 0.31 0.40 0.58 0.83 1.23 1.60 0.22 0.31 0.40 0.84 0.88 n.a. 1.67 2.81
Q~~~a~~ -~~ 0.24 0.43 0.62 0.90 1.26 1.70 - 0.37 0.55 0.80 1.16 1.52 2.06 - 0.42 0.52 0.73 1.09 1.40 2.23 - 0.48 0.51 0.72 1.06 n.a. 2.07 2.59
Q'w1iu - 0.72 - - - 1.80 2.02 - 0.898- - - 2.18 2.49 - 0.653- - - 1.25 2.51 - 0.69 - - - 1.91 2,41 3.29
NlI&j 0.25 0.36 0.41 0.55 0.86 1.21 1.54 0.29 0.47 0.56 0.77 1.23 1.73 2.27 0.14 0.33 0.50 0.86 1.15 1.22 1.98 0.23 0.29 0.37 0.52 0.80 1.10 1.49 2.41
khja12 0.38 0.42 0.82 0.97 1.2D 1.45 1.97 0.39 0.77 1.06 1.38 1.74 2.18 2.98 0.38 0.65 0.79 1.02 1.34 1.54 2.01 0.36 0.65 0.80 1.05 1.35 1.70 2.35 3.20
EM ~~~0.18 1.27 0.33 0.38 0.49 0.60 0.75 0.29 0.56 0.80 1.09 1.32 1.71 2.2D 0.20 0.39 0.54 0.74 0.90 1.15 1.49 0.13 0.19 0.26 0.31 0.40 0.52 0.78 1.30
lNr1z 0.15 0.33 0.44 0.61 0.79 0.97 1.16 0.15 0.49 0.61 0.90 0.27 1.58 1.93 0.15 0.51 0.66 0.81 1.25 1.21 1.75 0.07 0.37 0.49 0.65 1.14 1.20 1.56 2.05
Nate de Smtamdex 0.24 0.5D 0.61 0.75 1.9 1.48 1.8D Q.30 0.60 0.78 0.99 1.42 2.06 2.63 0.13 0.42 0.56 0.76 1.06 1.33 1.87 0.18 0.40 0.59 0.76 1.03 1.2D 1.74 2.76
0.23 0.44 0.52 0.67 0.96 1.35 1.45 0.28 0.53 0.64 0.91 1.41 1.79 2.09 0.22 0.32 0.42 0.57 0.82 1.12 1.23 0.25 0.29 0.47 0.41 0.87 1.11 1.06 2.42
Sm Andoes - 0.64 0.68 1.10 1.15 1.73 1.73 - 1.11 1.20 1.71 2.02 3.04 3.04 - 0.75 0.81 1.51 1.OD 2.53 2.82 - 0.94 0.98 1.60 1.88 2.71 2.59 n.a.
0.45 0.59 0.62 0.99 1.32 1.51 1.96 0.43 0.73 0.82 1.21 1.55 1.88 2.74 0.39 0.48 0.53 1.12 1.43 1.50 2.04 0.29 0.49 0.53 1.03 1.30 1.52 2.13 3.07
TAIM ~~0.22 0.39 0.45 0.57 0.80 1.01 1.06 0.28 0.51 0.60 0.78 1.06 1.35 1.50 0.20 0.43 0.54 0.73 0.94 1.10 1.39 0.23 0.29 0.40 0.52 0.65 0.82 1.01 2.39
sl AinzM of the E1actzfI*dbm de Mtloqia. izdto E1eatr:Io de Slnfa and Cleuzro Etectrlxm de ThmO.
n.a. 3* available
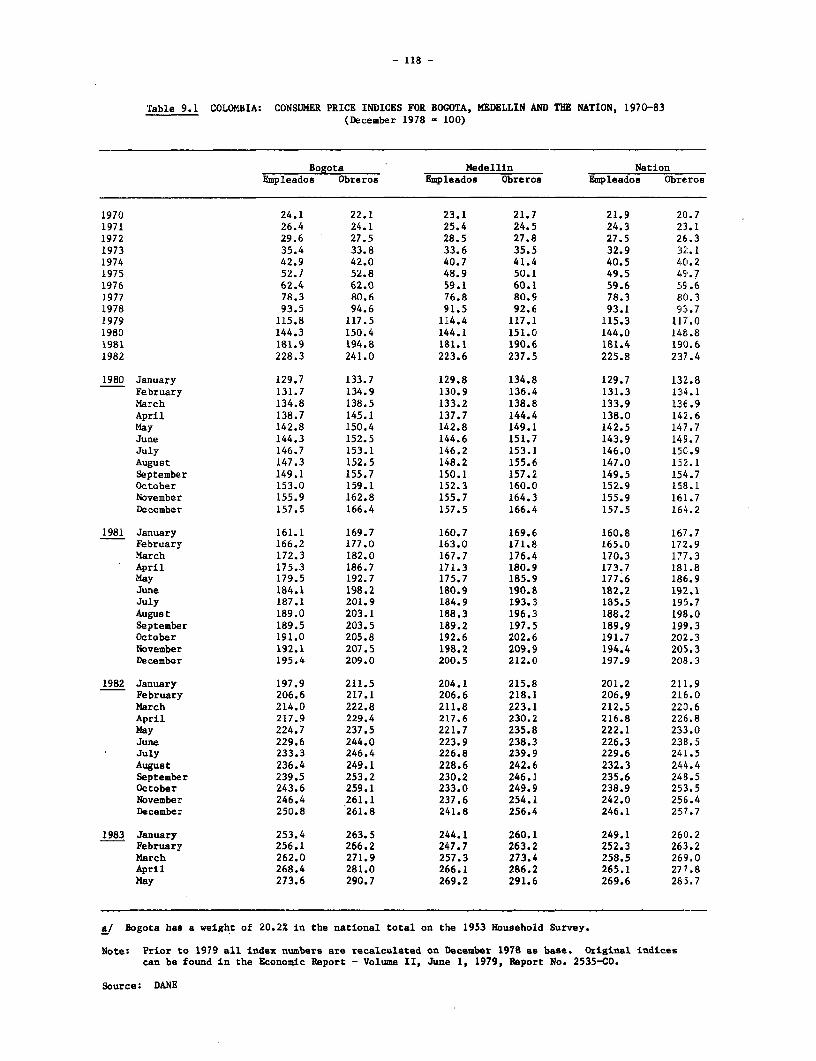
- 118 -
Table 9.1 COLOMBIA: CONSUMER PRICE INDICES FOR BOGOTA, MEDELLIN AND THE NATION, 1970-83(December 1978 - 100)
Bogota Medellin NationEmpleados Obreros Empleados Obreros Empleados Obre ros
1970 24.1 22.1 23.1 21.7 21.9 20.71971 26.4 24.1 25.4 24.5 24.3 23.11972 29.6 27.5 28.5 27.8 27.5 26.31973 35.4 33.8 33.6 35.5 32.9 32.11974 42.9 42.0 40.7 41.4 40.5 40.21975 52.7 52.8 48.9 50.1 49.5 491.71976 62.4 62.0 59.1 60.1 59.6 59.61977 78.3 80.6 76.8 80.9 78.3 80C.31978 93.5 94.6 91.5 92.6 93.1 93.71979 115.8 117.5 114.4 117.1 115.3 117.01980 144.3 150.4 144.1 151.0 144.0 148.81981 181.9 194.8 181.1 190.6 181.4 190.61982 228.3 241.0 223.6 237.5 225.8 237.4
1980 January 129.7 133.7 129.8 134.8 129.7 132.8February 131.7 134.9 130.9 136.4 131.3 134.1March 134.8 138.5 133.2 138.8 133.9 136.9April 138.7 145.1 137.7 144.4 138.0 142.6May 142.8 150.4 142.8 149.1 142.5 147.7June 144.3 152.5 144.6 151.7 143.9 149.7July 146.7 153.1 146.2 153.1 146.0 150.9August 147.3 152.5 148.2 155.6 147.0 152.1September 149.1 155.7 150.1 157.2 149.5 154.7October 153.0 159.1 152.3 160.0 152.9 158.1November 155.9 162.8 155.7 164.3 155.9 161.7December 157.5 166.4 157.5 166.4 157.5 164.2
1981 January 161.1 169.7 160.7 169.6 160.8 167.7February 166.2 177.0 163.0 171.8 165.0 172.9March 172.3 182.0 167.7 176.4 170.3 177.3April 175.3 186.7 171.3 180.9 173.7 181.8May 179.5 192.7 175.7 185.9 177.6 186.9June 184.1 198.2 180.9 190.8 182.2 192.1July 187.1 201.9 184.9 193.3 185.5 195.7August 189.0 203.1 188.3 196.3 188.2 198.0September 189.5 203.5 189.2 197.5 189.9 199.3October 191.0 205.8 192.6 202.6 191.7 202.3November 192.1 207.5 198.2 209.9 194.4 205.3December 195.4 209.0 200.5 212.0 197.9 208.3
1982 January 197.9 211.5 204.1 215.8 201.2 211.9February 206.6 217.1 206.6 218.1 206.9 216.0March 214.0 222.8 211.8 223.1 212.5 220.6April 217.9 229.4 217.6 230.2 216.8 226.8May 224.7 237.5 221.7 235.8 222.1 233.0June 229.6 244.0 223.9 238.3 226.3 238.5July 233.3 246.4 226.8 239.9 229.6 241.5August 236.4 249.1 228.6 242.6 232.3 244.4September 239.5 253.2 230.2 246.1 235.6 248.5October 243.6 259.1 233.0 249.9 238.9 253.5November 246.4 261.1 237.6 254.1 242.0 256.4December 250.8 261.8 241.8 256.4 246.1 257.7
1983 January 253.4 263.5 244.1 260.1 249.1 260.2February 256.1 266.2 247.7 263.2 252.3 263.2March 262.0 271.9 257.3 273.4 258.5 269.0April 268.4 281.0 266.1 286.2 265.1 277.8May 273.6 290.7 269.2 291.6 269.6 285.7
a/ Bogota has a weight of 20.2% in the national total on the 1953 Household Survey.
Note: Prior to 1979 all index numbers are recalculated on December 1978 as base. Original indicescan be found in the Economic Report - Volume II, June 1, 1979, Report No. 2535-CO.
Source: DANE
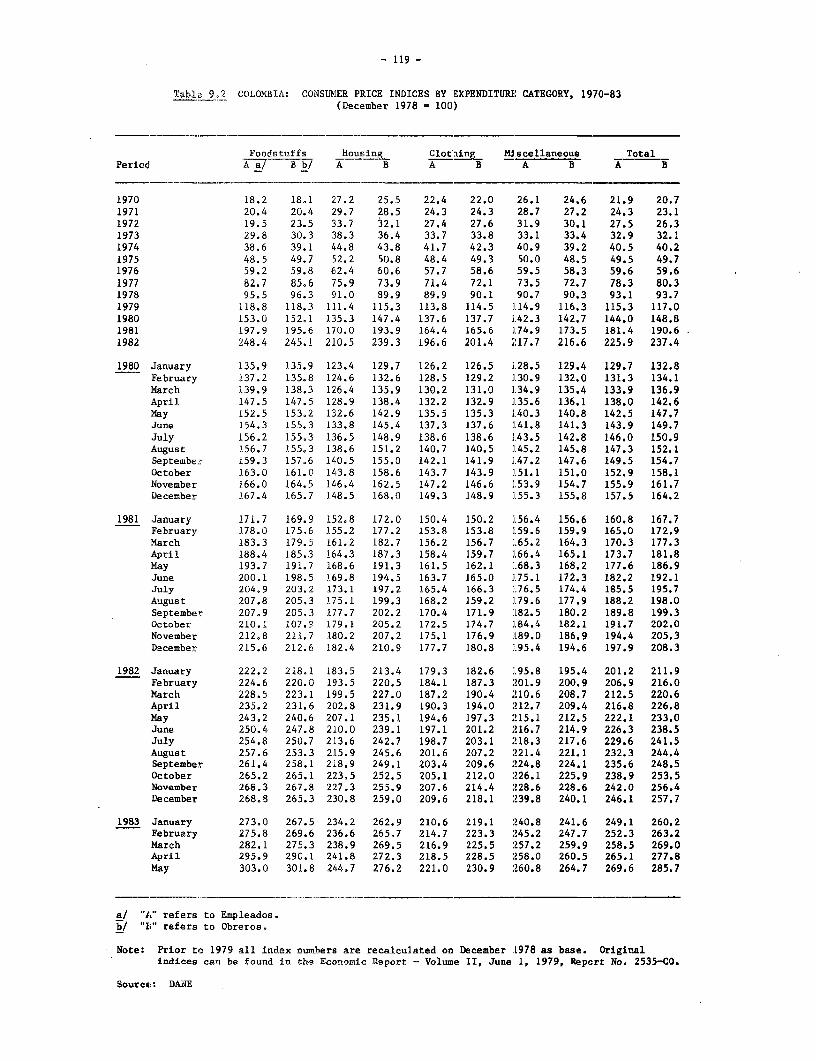
- 119 -
Tabla 9.2 COLOMBIA: CONSaIER PRICE INDICES BY EXPENDITURE CATEGORY, 1970-83(December 1978 = 100)
Foodstuffs Housing Clotaing Miscellaneous TotalPeriod A a/ B b/ A B A B A B A B
1970 18.2 18.1 27.2 25.5 22.4 22.0 26.1 24.6 21.9 20.71971 20.4 20.4 29.7 28.5 24.3 24.3 28.7 27.2 24.3 23.11972 19.5 23.5 33.7 32.1 27.4 27.6 31.9 30.1 27.5 26.31973 29.8 30.3 38.3 36.4 33.7 33.8 33.1 33.4 32.9 32.11974 38.6 39.1 44.8 43.8 41.7 42.3 40.9 39.2 40.5 40.21975 48.5 49.7 52.2 50.8 48.4 49.3 50.0 48.5 49.5 49.71976 59.2 59.8 62.4 60.6 57.7 58.6 59.5 58.3 59.6 59.61977 82.7 85.6 75.9 73.9 71.4 72.1 73.5 72.7 78.3 80.31978 95.5 96.3 91.0 89.9 89.9 90.1 90.7 90.3 93.1 93.71979 118.8 118.3 111.4 115.3 113.8 114.5 .14.9 116.3 115.3 117.01980 153.0 152.1 135.3 147.4 137.6 137.7 142.3 142.7 144.0 148.81981 197.9 195.6 170.0 193.9 164.4 165.6 2.74.9 173.5 181.4 190.61982 248.4 245.1 210.5 239.3 196.6 201.4 217.7 216.6 225.9 237.4
1980 January 135.9 135.9 123.4 129.7 126.2 126.5 1]28.5 129.4 129.7 132,8February 137.2 135.8 124.6 132.6 128.5 129.2 1.30.9 132.0 131.3 134.1March 139.9 138.3 126.4 135.9 130.2 131.0 1.34.9 135.4 133.9 136.9April 147.5 147.5 128.9 138.4 132.2 132.9 135.6 136.1 138.0 142.6May 152.5 153,2 132.6 142.9 135.5 135.3 1.40.3 140.8 142.5 147.7June 154.3 155.3 133.8 145.4 137.3 137.6 141.8 141.3 143.9 149.7July 156.2 155.3 136.5 148.9 138.6 138.6 1.43.5 142.8 146.0 150.9August 156.7 155.3 138.6 151.2 140.7 140.5 1.45.2 145.8 147.3 152.1September 159.3 157.6 140.5 155.0 142.1 141.9 1.47.2 147.6 149.5 154.7October 163.0 161.0 143.8 158.6 143.7 143.9 151.1 151.0 152.9 158.1November 166.0 164.5 146.4 162.5 147.2 146.6 1.53.9 154.7 155.9 161.7December 167.4 165.7 148.5 168,0 149.3 148.9 :155.3 155.8 157.5 164.2
1981 January 171.7 169.9 152.8 172.0 150.4 150.2 156.4 156.6 160.8 167.7February 178.0 175.6 155.2 177.2 153.8 153.8 ].59.6 159.9 165.0 172.9March 183.3 179.5 161.2 182.7 156.2 156.7 165.2 164.3 170.3 177.3April 188.4 185.3 164.3 187.3 158.4 159.7 .66.4 165.1 173.7 181.8May 193.7 191.7 168.6 191.3 161.5 162.1 2168.3 168.2 177.6 186.9June 200.1 198.5 169.8 194.5 163.7 165.0 2.75.1 172.3 182.2 192.1July 204.9 203.2 173.1 197.2 165.4 166.3 2L
76.5 174.4 185.5 195.7
August 207.8 205.3 175.1 199.3 168.2 159.2 .79.6 177.9 188.2 198.0September 207.9 205.3 177.7 202.2 170.4 171.9 182.5 180.2 189.8 199.3October 210.1 107.9 179.1 205.2 172.5 174.7 284.4 182.1 191.7 202.0November 212.8 211.7 180.2 207.2 175.1 176.9 189.0 186.9 194.4 205.3December 215.6 212.6 182.4 210.9 177.7 180.8 :295.4 194.6 197.9 208.3
1982 January 222.2 218.1 183.5 213.4 179.3 182.6 195.8 195.4 201.2 211.9February 224.6 220.0 193.5 220.5 184.1 187.3 201.9 200.9 206.9 216.0March 228.5 223.1 199.5 227.0 187.2 190.4 210.6 208.7 212.5 220.6April 235.2 231.6 202.8 231,9 190.3 194.0 212.7 209.4 216.8 226.8May 243.2 240.6 207.1 235.1 194.6 197.3 215.1 212.5 222.1 233.0June 250.4 247.8 210.0 239.1 197.1 201.2 216.7 214.9 226.3 238.5July 254.8 250.7 213.6 242.7 198.7 203.1 218.3 217.6 229.6 241.5August 257.6 253.3 215.9 245.6 201.6 207.2 221.4 221.1 232.3 244.4September 261.4 258.1 218.9 249.1 203.4 209.6 224.8 224.1 235.6 248.5October 265.2 265.1 223,5 252.5 205.1 212.0 226.1 225.9 238.9 253,5November 268.3 267.8 227.3 255.9 207.6 214.4 228.6 228.6 242.0 256.4December 268.8 265.3 230.8 259.0 209.6 218.1 239.8 240.1 246.1 257.7
1983 January 273.0 267.5 234.2 262.9 210.6 219.1 240.8 241.6 249.1 260.2February 275.8 269.6 236.6 265.7 214.7 223.3 245.2 247.7 252.3 263.2March 282.1 275.3 238.9 269.5 216.9 225.5 257.2 259.9 258.5 269.0April 295.9 290.1 241.8 272.3 218.5 228.5 258.0 260.5 265.1 277.8May 303.0 301.8 244s7 276.2 221.0 230.9 260.8 264.7 269.6 285.7
a/ "AI" refers to Empleados.b/ "B" refers to Obreros.
Note: Prior to 1979 all index numbers are recalculated on December .1978 as base. OriginalIndices can be found in the Economic Report - Volume II, June 1, 1979, Report No. 2535-CO.
Source : DANE

- 120 -
Table 9.3 COLOMBIA: WHOLe6ALE A PRICE INDICES BY M6IN CaOuDIrY GROUP. 1970-83(1970 100)
Raw Materials Machinery VariousBeverages Eacluding Fuels & Chemical anufactured & Transport Manufactured Total
Period Foodstuffs & Tobacco Fuels Lubricants Oils A Fats Products Products Equipment Products Index
1970 100.0 100.0 100.0 100.0 100.0 100.0 100.0 100.0 100.0 100.01971 111.7 114.7 115.1 117.7 108.1 108.4 107.1 110.6 110.4 111.51972 129.8 135.1 128.8 137.6 104.4 118.1 123.8 131.6 123.5 131.91973 171.4 156.9 170.8 157.1 144.7 143.1 154.0 151.2 149.3 168.71974 234.3 195.1 284.5 242.1 266.5 212.4 227.4 195.6 197.9 229.51975 300.7 268.3 311.2 301.8 323.4 282.4 267.4 247.4 230.5 287.81976 367.5 331.4 404.5 409.8 359.9 332.5 317.1 310.4 279.5 353.81977 499.9 405.5 405.9 494.5 422.3 364.1 372.2 371.7 339.8 448.21978 581.0 464.9 425.0 633.3 482.8 422.9 475.0 449.5 415.7 527.21979 742.5 591.8 548.2 906.5 558.8 507.6 623.1 524.4 512.8 673.91980 925.6 737.7 725.3 1,175.8 650.8 625.4 765.6 623.3 641.7 836.91981 1,148.5 919.9 837.2 1,523.9 787.0 809.2 946.8 770.0 800.9 1,038.21982 1,486.6 1,122.1 970.7 1,965.9 1,025.4 993.6 1,121.8 941.2 994.5 1,304.8
1979 January 647.7 538.9 483.6 735.2 519.5 458.8 570.4 485.2 465.7 594.6February 661.9 553.2 517.8 737.4 535.5 468.5 586.7 491.4 486.5 608.3March 685.4 555.5 524.2 772.4 541.6 486.7 594.1 497.5 496.8 625.0April 701.1 557.8 527.2 871.3 544.7 496.1 602.0 507.5 501.4 641.4May 727.1 557.7 537.0 875.9 546.4 501.3 614.0 512.6 507.5 658.9June 742.9 575.7 542.5 875.8 540.2 507.3 619.5 522.6 510.9 670.4July 747.3 601.3 543.9 985.1 556.9 514.7 636.0 527.3 513.1 688.8August 774.3 625.9 531.9 987.9 587.9 515.6 642.6 537.5 517.3 702.0September 787.4 627.9 558.5 1,004.3 588.2 521.9 645.6 545.4 534.6 711.6
Novesmber 810.2 634.0 603.9 1,011.6 579.9 540.3 654.9 555.2 566.3 730.2Decesber 824.6 643.0 609.9 1,013.9 572.6 545.4 657.2 559.9 568.6 739.0
1980 January 831.8 658.7 608.3 1,175.8 566.8 551.5 672.4 573.0 575.2 746.8February 839.7 661.2 644.9 1,020.9 575.0 563.6 698.3 578.3 594.2 759.2March 848.4 692.3 688.9 1,041.4 595.4 581.8 729.3 590.6 604.7 774.7April 884.3 705.3 688.6 1,046.0 615.3 587.1 750.2 597.0 628.7 797.9May 920.6 721.6 695.5 1,138.5 631.1 597.0 767.5 610.9 620.9 826.3June 925.5 722.8 730.5 1,149.6 665.8 607.9 768.6 620.6 633.4 833.7July 939.0 726.4 741.1 1,159.8 688.0 622.3 773.1 626.5 647.5 844.6August 954.3 758.7 752.1 1,163.9 684.3 649.4 779.9 633.4 655.9 858.8September 967.7 763.0 757.2 1,171.5 691.3 664.0 798.2 647.1 667.9 870.4October 986.3 766.0 760.5 1,390.4 692.2 677.0 806.0 657.0 677.2 895.1Nove-ber 994.6 834.5 798.9 1,395.1 702.2 698.0 817.0 667.1 689.0 908.8Deceaber 1,015.9 843.1 837.3 1,398.4 703.3 705.3 826.7 678.4 696.7 926.6
1981 January 1,019.0 841.2 846.3 1,408.3 727.1 712.4 851.2 688.2 708.6 934.9February 1,045.3 845.9 844.1 1,440.4 719.1 736.9 879.4 710.2 727.0 957.5March 1,061.6 851.1 803.8 1,477.9 715.0 749.7 923.1 719.7 744.0 973.4April 1,096.4 865.0 802.4 1,478.1 717.5 768.3 941.0 734.1 770.3 997.1May 1,116.9 864.4 805.6 1,499.5 716.0 787.2 951.3 752.1 786.5 1,013.1June 1,145.5 877.1 824.4 1,508.9 711.8 798.1 955.4 765.5 796.9 1,032.1July 1,161.3 950.3 846.1 1,528.3 724.2 804.1 957.5 778.8 820.6 1,048.6August 1,173.6 971.0 847.9 1,533.6 775.7 839.8 963.0 787.9 830.7 1,060.1Septasber 1,197.4 977.1 853.0 1,543.1 849.6 854.0 979.5 798.5 842.8 1,077.9October 1,222.3 981.6 858.2 1,567.2 907.6 864.9 985.1 821.6 850.3 1,096.1November 1,266.7 1,002.8 850.2 1,584.5 939.4 894.6 983.8 839.1 861.9 i,123.3DOcesber 1,275.9 1,011.1 863.8 1,825.7 941.0 899.9 991.6 844.6 8765.8 1,144.6
1982 January 1,308.7 1,031.6 909.5 1,840.3 942.9 906.4 1,018.9 871.4 885.0 1,172.0February 1,324.4 1,048.0 916.9 1,870.5 943.1 923.8 1,055.0 886.1 919.6 1,190.6March 1,372.7 1,046.5 926.4 1,908.6 966.5 935.2 1,059.4 895.5 924.6 1,220.0April 1,415.8 1,051.6 932.4 1,919.8 987.4 956.9 1,074.4 914.5 9213.7 1,247.7May 1,467.1 1,055.2 934.7 1,934.6 1,001.4 974.3 1,081.4 923.2 989.3 1,278.8June 1,489.4 1,137.5 988.6 1,941.6 1,009.1 994.4 1,089.8 932.9 991.3 1,301.2July 1,505.6 1,139.3 995.6 1,955.6 1,051.2 1,003.0 1,119.5 944.0 1,018.4 1,317.0August 1,533.5 1,153.2 1,004.2 1,964.9 1,071.7 1,018.7 1,155.4 951.6 1,030.1 1,339.2September 1,564.3 1,165.7 1,005.2 1,981.5 1,079.2 1,034.1 1,192.9 972.6 1,047.1 1,365.7October 1,605.7 1,188.9 1,005.6 1,999.0 1,082.6 1,045.3 1,199.1 980.3 1,051.8 1,391.4Novesber 1,622.2 1,223.7 1,012.7 2,038.2 1,083.5 1,059.6 1,205.6 1,000.5 1,074.1 1,408.4Deceaber 1,630.0 1,223.8 1,016.5 2,236.5 1,086.2 1,071.0 1,209.9 1,022.2 1,074.5 1,426.1
1963 January 1,658.5 1,234.2 1,124.8 2,246.9 1,099.2 1,083.1 1,245.8 1,037.0 1,085.0 1,454.2Febrnary 1,676.0 1,241.9 1,130.2 2,280.3 1,121.2 1,096.0 1,256.6 1,056.6 1,108.6 1,470.2March 1,699.1 1,364.3 1,137.4 2,288.5 1,125.0 1,120.2 1,277.0 1,059.4 1,131.9 1,493.6April 1,787.4 1,382.5 1,142.6 2,312.7 1,123.0 1,142.7 1,294.7 1,076.9 1,141.6 1,545.7May 1,871.0 1,391.2 1,148.0 2,334.2 1,128.1 1,174.6 1,319.4 1,087.4 1,145.1 1,594.9
Source: Baoro de la Republica

- 121 -
Table 9.4 COLOMBIA: WHOLESALE AND CONSDMER PRICE IDDICES AND GROWTH RATES, 1970-83(December 1978 - 100)
Wholesale Prices a/ Consumer Prices b/Year and Mouith Index Growth Rate c/ Index Growth Rate c/
1970 17.5 7.6 20.7 6.71971 19.5 11.4 23.1 11.61972 23.0 17.9 26.3 13.91973 29.4 27.8 32.1 22.11974 40.1 36.4 40.2 25.21975 50.2 25.2 49.7 23.61976 61.8 21.1 59.6 19.91977 78.2 26.5 80.3 34.71978 92.0 17.6 93.7 16.71979 117.6 27.8 1]17.0 24.91980 146.1 24.2 148.8 27.21981 181.2 23.9 190.6 28.11982 227.8 25.7 ,'37.4 24.6
1979 January 103.8 22.8 103.5 20.8Februairy 106.2 24.2 105.3 21.3March 109.1 25.3 109.6 22.3April 112.0 25.2 111.8 22.7May 115.0 26.0 114.4 22.6June 117.0 27.9 116.5 21.7July 119.4 29.0 117.8 23.7Augustl 122.5 30.4 120.0 26.1September 124.2 31.2 122.6 28.7October 125.9 31.2 124.5 27.6November 127.5 30.2 127.8 29.2December 129.0 29.0 129.8 29.8
1980 January 130.4 25.6 132.8 28.3February 132.6 24.9 134.1 27.4March 135.2 23.9 136.9 24.9April 139.3 24.4 142.6 27.6May 144.3 25.5 147.7 29.1June 145.6 24.4 149.7 28.5July 147.5 23.5 150.9 28.1August 149.9 22.4 152.1 26.8September 152.0 22.4 154.7 26.2October 156.2 24.1 158.1 27.0November 158.6 24.4 161.7 26.5December 161.7 25.4 164.2 26.5
1981 January 163.1 25.1 167.7 26.3February 167.1 26.0 172.9 28.9March 169.9 25.7 177.2 29.4April 174.0 24.9 181.8 27.5May 176.8 22.5 186.9 26.5June 180.2 23.4 192.0 28.3July 183.0 24.1 195.6 29.6August 185.0 23.4 198.0 30.2September 188.1 23.4 199.3 28.8October 191.3 22.5 202.0 27.8November 196.1 23.6 205.3 27.0Decemtber 199.8 23.6 208.3 26.9
1982 January 204.6 25.4 211.9 26.4February 207.8 24.4 216.0 24.9March 213.0 25.4 220.6 24.5April 217.8 25.2 226.8 24.8May 223.2 26.2 i33.0 24.7June 227.1 26.1 ,38.5 24.2July 229.9 25.6 ,41.5 23.4August 233.8 26.3 244.4 23.5Septemiber 238.4 26.7 248.5 24.7Octobe!r 242.9 26.9 ;53.5 25.5Novemler 245.8 25.4 1,56.4 24.9December 248.9 24.6 ,'57.7 23.9
1983 January 253.8 24.1 ;!60.2 22.8February 256.6 23.5 i63.2 21.8March 260.7 22.4 269.0 21.9April 269.7 23.8 277.8 22.5May 278.2 24.6 285.7 22.6
a/ Total wholesale prices.bI Blue Collar Workers (Obreros).c/ Annual percentage change in current year index relative to previous year index.
Source: Barico de la Republica and DANE

- 122
Table 9.5 COLOMBIA: AVERAGE ANNUAL INCREASE IN SELECTED PRICE ITDICATGRS9 1'960-82(Percentage Cnanges)
DomesticWholesale Prices Consumer Prices GDP Price Coffee
Year Total Excl. Food b/ White Collar Blue Collar Deflator Prdice
A a/ B a/
1960 4.2 4.5 6.0 5e7 S.5 1L0.8
1961 6.6 4.7 7.8 8.5 7c9 9.7
1962 2.6 4.7 5.6 4.3 6G8 1.4
1963 26.3 24.8 24.5 27.3 23o5 16/.3
1964 17.5 9.0 15.7 17.7 L508 31.9
1965 8.3 10.8 8.7 7.1 iOo1 --1.8
1966 17,4 18.6 16.8 16.7 14.5 5.1
1967 6.8 9.0 8.9 8.1 8.4 0.3
1968 6.3 5.7 7.6 7.4 9o1 17.1
1969 6.7 8.4 7.0 6.9 8.2 10.5
1970 7.6 9.6 7.3 6.7 9.8 32.7
1971 9.8 11.5 8.6 10.9 11.8 104 --4.5
1972 12.6 18.3 10.4 13.2 13.8 13,4 20.3
1973 27.9 19.6 22.0 22.0 29.3
1974 36.0 23.3 25.2 27.6 13.9
1975 25.4 22.1 23,6 20,8 23.6
1976 22.9 20.5 20.0 23,6 1)2.8
1977 26.7 31.3 34.8 28,3 29.8
1978 17.6 18,9 16,7 17.1 1.7
1979 27.8 23.9 24.8 24.1 --0.4
1980 24.2 24.9 27,2 28e1 19.2
1981 24.0 26.0 28.1 24.4 9.1
1982 25.7 24.5 24,6 23,3 :L8.2
a! A: 1952 = 100; B: 1970 = 100b/ Total index excluding foodstuffs not available after 1972.
Source; DANE

- 123 -
Table 9.6 COLOMBIA: PRICE INDICES OF CONSTRUCT]:ON MATER:IALS IN BOGOTA, 1977-83(December 1980 = 100)
NonMetallicMineraland Gray Common
Year and Month Products Cement Bricks Steel Lumber Total
1977' 36.0 35.3 42.3 40.9 48.8 42.71978; 53.2 44.3 61.5 65.1 67.9 58.119;'9i 71.7 57.3 83.9 75.6 77.6 75.1198tC1 100.0 100.0 100.0 100.0 100.0 100.01981 112.4 104.9 115.;. 105.2 120.1 118.41982 191.3 117.4 141.2 114.3 141.7 148.1
1981 January 100.0 101.4 103.3 100.1 106.0 103.3February 101.2 101.6 103.3 100.2 106.0 105.6March 103.2 103.7 103.3 100.4 106.0 106.5April 108.0 105.5 106.L 117.0 106.0 109.8May 108.0 102.1 106.L 117.5 106.0 111.6June 108.0 102.0 106.,7 114.0 106.0 112.2July 109.1 99.3 106.7r 114.1 106.0 112.0August 109.1 101.9 106.7 114.2 106.0 113.6September 112.4 102.5 109.7 114.3 106.0 115.2October 112.4 107.1 109.7 113.7 114.1 116.4November 112.4 105.3 109.7 104.9 114.1 115.1December 112.4 104.9 115.1 105.2 120.1 118.4
1982 January 119.7 99.7 115.L 105.2 124.1 120.2February 123.2 107.6 115.1 106.2 124.1 123.9March 123.2 105.6 115.1 105.3 126.0 124.7April 129.6 106.8 123.9 105.5 126.0 128.5May 141.3 100.8 123.9 106.1 126.0 128.6June 142.3 96.8 124.5 106.5 130.1 131.0July 143.6 96.5 124.3 106.2 130.1 131.7August 143.6 122.0 128.4) 106.3 134.2 135.3September 143.6 122.9 138.3 116.0 134.2 141.2October 144.5 121.7 139..5 115.7 134.2 143.1November 153.2 119.0 139.; 115.9 141.7 144.9December 191.3 117.4 141.2 114.3 141.7 148.1
198-3 January 193.7 117.1 148.7 113.6 141.7 150.3February 193.7 117.0 148.7 113.0 141.7 150.5March 198.9 116.9 150.2 113.7 141.7 151.2April 198.9 116.1 150.2 113.9 141.7 151.2
Source: Banco de la Republica
Source: Banco de la Republica

Table 10.1 COLOMBIA: STUDENT POPULATION BY LEVEL OF EDUCATION, PUBLIC AND PRIVATE, 1963, 1973, 1976-83(thousands of Students)
Preliminary Estimate Average Annual Rate of GrowthLevel of Education 1963 1973 1976 1977 1978 1979 1980 1981 1982 1983 1963-73 1981-82 1973-82
Primary EducationPublic 1,786.6 3,199.5 3,450.9 3,539.2 3,492.4 3,519.9 3,548.2 3,502.8 3,509.4 3,506.0 6.0 0.2 1.0Private 309.8 522.1 607.1 621.4 600.9 594.4 593.9 560.0 566.8 559.5 5.4 1.2 0.9Total 2,096.4 3,751.5 4,058.0 4,160.5 4,093.3 4,114.3 4,142.1 4,062.8 4,076.2 4,065.5 6.0 0.3 0.9
Secondary EducationPublic 42.7 571.1 799.9 876.2 925.5 925.6 998.3 1,027.1 1,064.0 1,084.9 14.9 3.6 7.2Private 202.2 525.7 690.9 739.9 739.8 739.8 812.7 471.0 752.6 761.5 10.0 59.8 4.1Total 344.9 1,096.8 1,490.8 1,616.1 1,665.3 1,665.4 1,811.0 1,498.1 1,816.6 1,846.4 12.3 21.3 5.8
Higher Education:Universities
Public 19.9 64.3 111.7 118.6 115.2 121.4 125.7 127.4 136.1 142.1 12.4 6.8 8.7Private 15.2 65.2 97.8 118.9 129.8 146.5 153.5 190.9 201.4 223.7 15.7 5.5 13.4Total 35.1 129.4 209.6 237.5 245.0 267.9 279.2 318.3 337.5 365.8 13.9 6.0 11.2
Source: Ministry of Education

Table 10.2 COLOMBIA: PUPIL ENROLLMENT IN PRIKARY SCHOOL, 1963, 1973, 1976-83
Preliminary Estimate Average Annual Growth Rate1963 1973 1976 1977 1978 1979 1980 1981 1982 1983 1963-73 1973-82 1981-81 1963-82
All Schools
Rural 781.8 1,239.8 1,396.3 1,436.4 1,416.1 1,436.8 1,451.6 1, 423.8 1,421.2 1,420.0 4.7 1.5 -0.2 3.2Urban 1,314.6 2,511.7 2,661.7 2,724.1 2,677.2 2,677.4 2,690.5 2,639.0 2,655.0 2,645.5 6.7 0.6 0.6 3.8Total 2,096.4 3,751.5 4,058.0 4,160.5 4,093.3 4,114.2 4,142.1 4,062.8 4,076.2 4,065.5 6.0 0.9 0.3 3.6
Public Schools
Rural 767.8 1,211.3 1,355.3 1,393.1 1,370.7 1,390.7 1,405.9 1,391.3 1,393.9 1,395.2 4.7 1.6 0.2 3.2Urban 1,018.8 1,988.1 2,095.6 2,146.1 2,121.7 2,129.1 2,142.2 2,111.5 2,115.5 2,110.8 6.9 0.7 0.2 3.9'rotal 1,186.6 3,199.5 3,450.9 3,539.2 3,492.4 3,519.8 3,548.1 3,502.8 3,509.4 3,506.0 6.0 1.0 0.2 3.6
Private Schools
Rural 13.9 28.5 41.1 43.3 45.3 46.1 45.6 32.5 27.3 24.9 7.4 -0.5 -16.0 3.6Urban 295.9 523.6 566.1 578.1 555.6 548.3 548.3 527.5 539.5 534.7 5.9 0.3 2.3 3.2Total 309.8 552.1 607.2 621.4 600.9 594.4 593.9 560.0 566.8 559.5 5.4 0.3 1.2 3.2
Source: Ministry of Education

Tible 10.3 aCOLXMIA: PUPIL llitlMENr IN S1aW 9 9 BY TYPE CI CUIaCUIM, 1963, 1973, 1976-83(thsmls of Students)
1963 % 1973 % 1976 % 1977 % 1978 % 1979 % 1980 Z 1981 Z 1982 % 1983 Z
(furse o MudyAll Sdbool 344.9 100.0 1,096.8 10D.0 1,490.6 100.0 1,616.1 100.0 1,665.2 100.0 1,706.3 100.0 1,811.0 100.0 1,768.1 100.0 1,816.6 100.0 1,846.4 100.0
Bacl1ernto 202.0 58.6 808.8 73.7 1,107.5 74.3 1,187.1 73.5 1,253.9 75.3 1,290.1 75.5 1,283.8 76.5 1,338.2 75.7 1,374.7 75.7 1,400.5 75.9Intutrial 15.1 4.4 41.9 3.8 59.9 4.0 68.4 4.2 58.3 3.5 55.4 3.3 56.9 3.1 59.4 3.4 61.0 3.4 61.4 3.3camlal 52.3 15.2 115.9 10.6 152.3 10.2 174.7 10.8 186.8 11.2 194.2 11.4 201.9 11.3 204.5 11.6 210.7 11.6 213.5 11.6
Agrim1btre 3.6 1.0 15.0 1.4 30.2 2.0 40.3 2.5 28.1 1.7 27.1 1.6 27.6 1.5 28.5 1.6 29.8 1.6 30.3 1.6FALkmeti 47.7 13.8 65.9 6.0 83.6 5.6 80.4 5.0 73.2 4.4 70.6 4.1 66.7 3.7 64.1 3.6 63.8 3.5 63.0 3.4IDE's - - 32.0 2.9 50.2 3.4 55.6 3.3 55.3 3.3 57.2 3.4 58.9 3.3 60.1 3.4 61.9 3.4 62.5 3.4Otber 24.2 7.0 17.3 1.6 6.9 0.5' 9.6 0.6 9.6 0.6 11.7 0.7 14.3 0.7 13.3 0.7 14.7 0.8 15.2 0.8
Fck SdCDlS 142.7 100.0 571.1 100.0 799.9 100.0 876.2 100.0 925.4 100.0 962.3 100.0 998.2 100.0 1,027.1 100.0 1,064.0 100.0 1,094.9 100.0llld1erRto 75.7 53.0 396.1 69.4 553.4 69.4 600.1 68.5 655.5 70.8 691.6 71.9 722.2 72.3 743.2 72.4 772.2 72.6 791.7 73.0 ,IlIJstrial 12.8 9.0 35.6 6.2 48.0 6.0 52.1 5.9 50.9 5.5 48.1 5.0 49.5 5.0 51.9 5.1 53.4 5.0 53.8 5.0 a'
mrcial 9.1 6.4 38.4 6.7 50.8 6.4 61.5 7.0 68.8 7.4 71.3 7.4 73.9 7.4 79.5 7.7 81.7 7.7 82.0 7.6Africuture 3.3 2.3 12.3 2.2 25.7 3.2 34.9 4.0 25.0 2.7 24.0 2.5 34.5 2.4 24.8 2.4 26.0 2.5 26.5 2.4E&imticmn 28.8 28.2 49.7 8.7 66.4 8.3 65.3 7.5 61.5 6.7 59.8 6.2 56.6 5.7 55.9 5.4 55.7 5.2 55.0 5.1DIM's - - 32.0 5.6 50.2 6.3 55.6 6.3 55.3 6.0 57.2 5.9 58.9 5.9 60.1 5.9 61.9 5.8 62.5 5.7Otber 13.0 9.1 7.0 1.2 5.3 0.7 6.8 0.8 8.4 0.9 10.3 1.1 12.6 1.3 11.7 1.1 13.1 1.2 13.4 1.2
Private Schols 202.2 100.0 525.7 100.0 691.0 100.0 740.0 100.0 739.8 100.0 744.0 100.0 812.8 100.0 741.0 100.0 752.6 100.0 761.5 100.0Bsc suerato 126.3 62.5 412.7 78.5 554.1 80.2 587.1 79.3 598.4 80.8 598.5 8D.4 662.6 81.5 595.0 80.3 602.5 80.1 608.8 80.0bXdutrLd 2.3 1.1 6.3 1.2 11.9 1.7 16.4 2.2 7.4 1.0 7.3 1.0 7.4 0.9 7.5 1.0 7.6 1.0 7.6 1.0camcial 43.2 21.4 77.5 14.7 101.6 14.7 113.2 15.3 118.0 16.0 122.9 16.5 128.0 15.7 125.0 16.9 129.0 17.1 131.5 17.3kcultnre 0.3 0.1 2.7 0.5 4.5 0.7 5.4 0.7 3.1 0.4 3.1 0.4 3.1 0.4 3.7 0.5 3.8 0.5 3.8 0.5
Ehwati 18.9 9.3 16.2 3.1 17.2 2.5 15.1 2.0 11.7 1.6 10.8 1.5 10.1 1.2 8.2 1.1 8.1 1.1 8.0 1.0Otbers 11.2 5.5 10.3 2.0 1.7 0.2 2.8 0.4 1.2 0.2 1.4 0.2 4.2 0.5 1.6 0.2 1.6 0.2 1.8 0.2
Source: Ministry of Fductlon
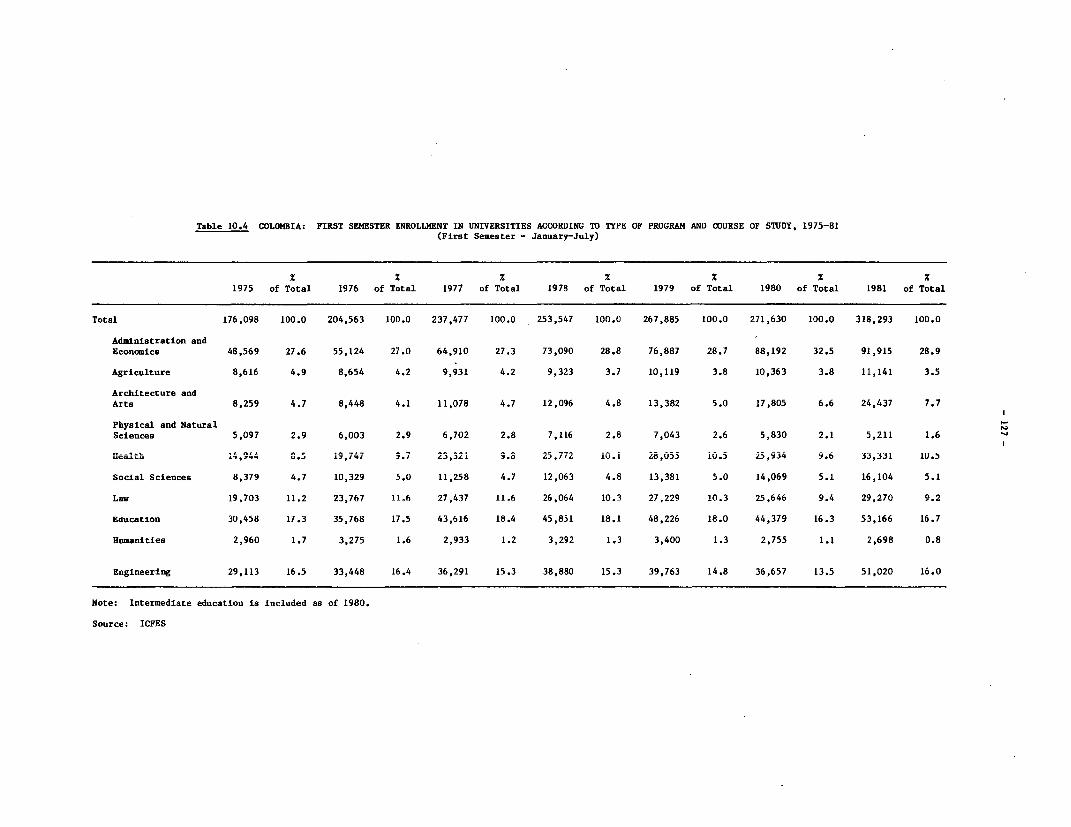
Table 10.4 COLOMBIA: FIRST SEMESTER ENROLLMENT IN UNIVERSITIES ACCORDING TO TYPE OF PROGRAM AND COURSE OF STUDY, 1975-81(First Semester - January-July)
Z X % 2 % Z X1975 of Total 1976 of Total 1977 of Total 1978 of Total 1979 of Total 1980 of Total 1981 of Total
Total 176,098 100.0 204,563 100.0 237,477 100.0 253,547 100.0 267,885 100.0 271,630 100.0 318,293 100.0
Administration andEconomics 48,569 27.6 55,124 27.0 64,910 27.3 73,090 28.8 76,887 28.7 88,192 32.5 91,915 28.9
Agriculture 8,616 4.9 8,654 4.2 9,931 4.2 9,323 3.7 10,119 3.8 10,363 3.8 11,141 3.5
Architecture andArts 8,259 4.7 8,448 4.1 11,078 4.7 12,096 4.8 13,382 5.0 17,805 6.6 24,437 7.7
Physical and NaturalSciences 5,097 2.9 6,003 2.9 6,702 2.8 7,116 2.8 7,043 2.6 5,830 2.1 5,211 1.6 4
Health ;4,944 S, i9,747 9.7 23,32i 9.8 25,772 iu.i 28,055 10.5 25,934 9.6 33,331 1U.5
Social Sciences 8,379 4.7 10,329 5.0 11,258 4.7 12,063 4.8 13,381 5.0 14,069 5.1 16,104 5.1
Law 19,703 11.2 23,767 11.6 27,437 11.6 26,064 10.3 27,229 10.3 25,646 9.4 29,270 9.2
Education 30,458 17.3 35,768 17.5 43,616 18.4 45,851 18.1 48,226 18.0 44,379 16.3 53,166 16.7
Hunanities 2,960 1.7 3,275 1.6 2,933 1.2 3,292 1.3 3,400 1.3 2,755 1.1 2,698 0.8
Engineering 29,113 16.5 33,448 16.4 36,291 15.3 38,880 15.3 39,763 14.8 36,657 13.5 51,020 16.0
Note: Intermediate education is included as of 1980.
Source: ICFES

- 128 -
Table 10.5 COLOMBIA: N1IMBER OP UNIVERSITY PROFESSORS BY TYPE OFACADEMIC FIELD AND DEDICATION, 1980 AND 1981
1980 1981
Total Full Time Part Time Minimum Total Full Time Part Time MinimumProfessors Professors Professors Dedication a/ Professors Professors Professors Dedication
Academic Field 31,104 10,495 3,523 17,086 34,844 11,461 4,101 -19,282
Administration and Economics 7,573 1,221 674 5,678 8,233 1,336 737 6,160
Agriculture 1,031 701 44 286 922 658 35 229
Architecture and Arts 2,512 599 296 1,6177,903b/ 2,30lb/ 750b1 4, 8 5 2b/
Engineering 4,126 1,428 329 2,369
Physical and Natural Sciences 2,608 1,560 150 898 2,348 1,548 119 681
Health 4,174 1,870 1,219 1,085 4,898 2,068 1,558 1,272
Social Sciences 1,360 369 132 8593,955C/ 761C/ 435c/ 2,759/
Law 2,157 315 282 1,560
Education 3,982 1,577 277 2,128 5,290 2,096 359 2,835
Humanities 1,581 855 120 606 1,295 693 108 494
A/ Traditional Latin American lecturing system, whereby a professor in charge of a coursehas as his duty to lecture on the subject (typically two or three hours a week) and toadminister the corresponding tests, without any further obligation with regard toresearch, spending a certain number of hours helping students outside the classroom, etc.
hi Includes Architecture, Arts and Engineering.
c/ Includes Social Sciences and Law.
Source: ICFES

- 129 -
Table 10.6 COLOMBIA: EDUCATIONAL LEVEL OF TILE LABOR FORCEAS REPORTED IN THE NATIONAL CENSUSES - 1951,, 1964, 197:3
AND THE HOUSEHOLD SURVEY OF 1978 a/
Educational Level Total Men Women
1951
Total * 100.C 50.8 49.2
Primary 43.1 22.2 29.9Secondary 5.5 2.8 2.7University 0.5 0.4 0.1Other Levels O.M 0.4 0.4No Instruction 50.1 25.0 25.1
1964
Total 100.0 49.0 51.0
Primary 54.S 26.7 27.6Secondary 9. 2 4.4 4.8University 0.7 0.6 0.1Other Levels - - -No Instruction 35.8 17.3 18.5
1973
Total 100.( 48.2 51.8
Primary 53.]. 25.3 27.8Secondary 15.2 7.2 8.0University 1.8 1.2 0.6Other Levels 0.3 0.1 0.2No Instruction 24.8 12.0 12.8No Information b/ 4.8 2.4 2.4
Total 100 0 70.7 29.3
Primary 54.9 40.7 14.2Secondary 24.1 14.9 9.2University 4.7 3.3 1.4No Instruction c/ 16,3 11.8 4.5
a/ lThe 1978 Household Survey is not comparable to census data.lievertheless, it is included in this table for the purpose ofshowing the changing trends in the educational level of thelabor force.
b/ This category was not included in the 1951 and 1964 censusesrnor in the 1978 household survey.
c/ Includes "Other Levels".
Source: DANE, La Poblacion en Colombia, 1973, Muestra de Avanca,Bogota; and DANE, Encuesta Nacional de Fogares, JuLrTe=8,Bogota.
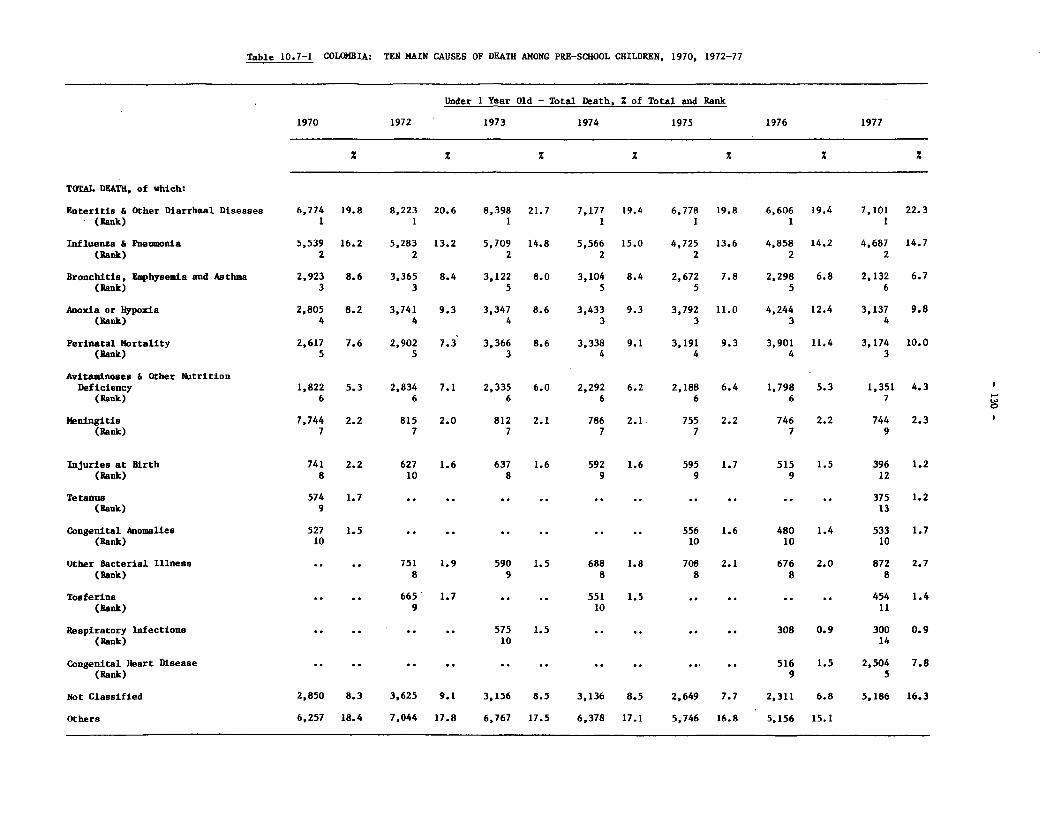
Table 10.7-1 COLOMBIA: TEN MAIN CAUSES OF DEATH AMONG PRE-SCHOOL CHILDREN, 1970, 1972-77
Under 1 Year Old - Total Death, Z of Total and Rank
1970 1972 1973 1974 1975 1976 1977
X % % % % % 2
TOTAL DEATH, of which:
Enteritis & Other Diarrheal Diseasea 6,774 19.8 8,223 20.6 8,398 21.7 7,177 19.4 6,778 19.8 6,606 19.4 7,101 22.3(Rank) 1 1 1 1 1 1 1
Influenza & Pneumonia 5,539 16.2 5,283 13.2 5,709 14.8 5,566 15.0 4,725 13.6 4,858 14.2 4,687 14.7(Rank) 2 2 2 2 2 2 2
Bronchitis, Emphysesia and Asthma 2,923 8.6 3,365 8.4 3,122 8.0 3,104 8.4 2,672 7.8 2,298 6.8 2,132 6.7(Rank) 3 3 5 5 5 5 6
Anoxia or Hypoxia 2,805 8.2 3,741 9.3 3,347 8.6 3,433 9.3 3,792 11.0 4,244 12.4 3,137 9.8(Rank) 4 4 4 3 3 3 4
Perinatal Mortality 2,617 7.6 2,902 7.3 3,366 8.6 3,338 9.1 3,191 9.3 3,901 11.4 3,174 10.0(Rank) 5 5 3 4 4 4
Avitaminoses & other NutritionDeficiency 1,822 5.3 2,834 7.1 2,335 6.0 2,292 6.2 2,188 6.4 1,798 5.3 1,351 4.3
(Rank) 6 6 6 6 6 6 7
Meningitis 7,744 2.2 815 2.0 812 2.1 786 2.1 755 2.2 746 2.2 744 2.3(Rank) 7 7 7 7 7 7 9
Injuries at Birth 741 2.2 627 1.6 637 1.6 592 1.6 595 1.7 515 1.5 396 1.2(Rank) 8 10 8 9 9 9 12
Tetanus 574 1.7 .. .. .. .. .. .. .. .. .. .. 375 1.2(Rank) 9 13
Congenital Anomalies 527 1.5 .. .. .. .. .. .. 556 1.6 480 1.4 533 1.7(Rank) 10 10 10 10
Other Bacterial Illness .. .. 751 1.9 590 1.5 688 1.8 708 2.1 676 2.0 872 2.7(Rank) 8 9 8 8 8 8
Tosferina .. .. 665 1.7 .. .. 551 1.5 .. .. .. .. 454 1.4(Rank) 9 10 11
Respiratory Infections .. .. .. .. 575 1.5 .. .. .. .. 308 0.9 300 0.9(Rank) 10 14
Congenital Heart Disease .. .. .. .. .. .. .. .. .. .. 516 1.5 2,504 7.8(Rank) 9 5
Not Classified 2,850 8.3 3,625 9.1 3,156 8.5 3,136 8.5 2,649 7.7 2,311 6.8 5,186 16.3
Others 6,257 18.4 7.044 17.8 6,767 17.5 6,378 17.1 5,746 16.8 5,156 15.1
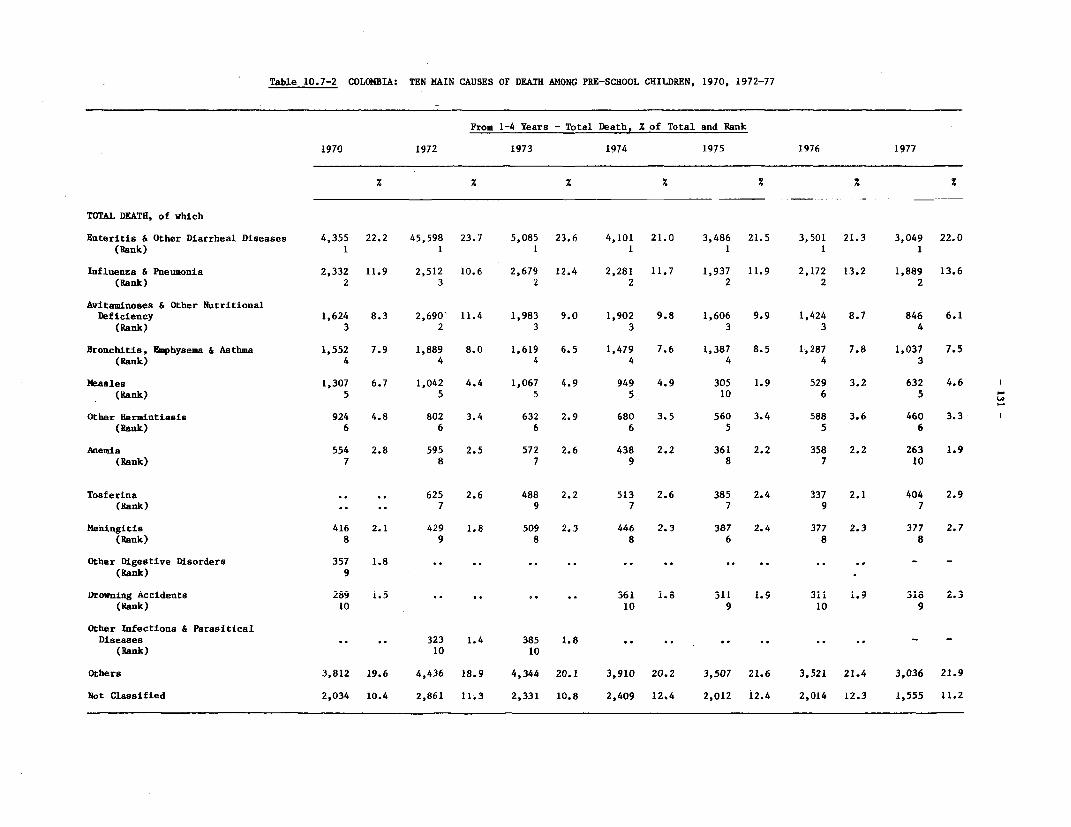
Table 10.7-2 COLOMBIA: TEN MAIN CAUSES OF DEATH AMONG PRE-SCHOOL CHILDREN, 1970, 1972-77
From 1-4 Years - Total Death, Z of Total and Rank
1970 1972 1973 1974 1975 1976 1977
TOTAL DEATH, of which
Enteritis & Other Diarrheal Diseases 4,355 22.2 45,598 23.7 5,085 23.6 4,101 21.0 3,486 21.5 3,501 21.3 3,049 22.0(Rank) 1 1 1 1 1 1 1
Influenza & Pneumonia 2,332 11.9 2,512 10.6 2,679 12.4 2,281 11.7 1,937 11.9 2,172 13.2 1,889 13.6(Rank) 2 3 2 2 2 2 2
Avitaminoses & Other NutritionalDeficiency 1,624 8.3 2,690 11.4 1,983 9.0 1,902 9.8 1,606 9.9 1,424 8.7 846 6.1
(Rank) 3 2 3 3 3 3 4
Bronchitis, Emphysema & Asthma 1,552 7.9 1,889 8.0 1,619 6.5 1,479 7.6 1,387 8.5 1,287 7.8 1,037 7.5(Rank) 4 4 4 4 4 4 3
Measles 1,307 6.7 1,042 4.4 1,067 4.9 949 4.9 305 1.9 529 3.2 632 4.6(Rank) 5 5 5 5 10 6 5
Other Hermintiasis 924 4.8 802 3.4 632 2.9 680 3.5 560 3.4 588 3.6 460 3.3(Rank) 6 6 6 6 5 5 6
Anemia 554 2.8 595 2.5 572 2.6 438 2.2 361 2.2 358 2.2 263 1.9(Rank) 7 8 7 9 8 7 10
Tosferina .. .. 625 2.6 488 2.2 513 2.6 385 2.4 337 2.1 404 2.9(Rank) .. .. 7 9 7 7 9 7
Meningitis 416 2.1 429 1.8 509 2.3 446 2.3 387 2.4 377 2.3 377 2.7(Rank) 8 9 8 8 6 8 8
Other Digestive Disorders 357 1.8 .. .. .. .. .. .. ..-(Rank) 9
Drowning ACcidents 289 i.5 .. .. .. .. 6i i.S 31i i.9 31i i.9 3a' 2.S(Rank) 10 10 9 10 9
Other Infections & ParasiticalDiseases .. .. 323 1.4 385 1.8 .. .. ..-
(Rank) 10 10
Others 3,812 19.6 4,436 18.9 4,344 20.1 3,910 20.2 3,507 21.6 3,521 21.4 3,036 21.9
Not Classified 2,034 10.4 2,861 11.3 2,331 10.8 2,409 12.4 2,012 i2.4 2,014 12.3 1,555 11,2
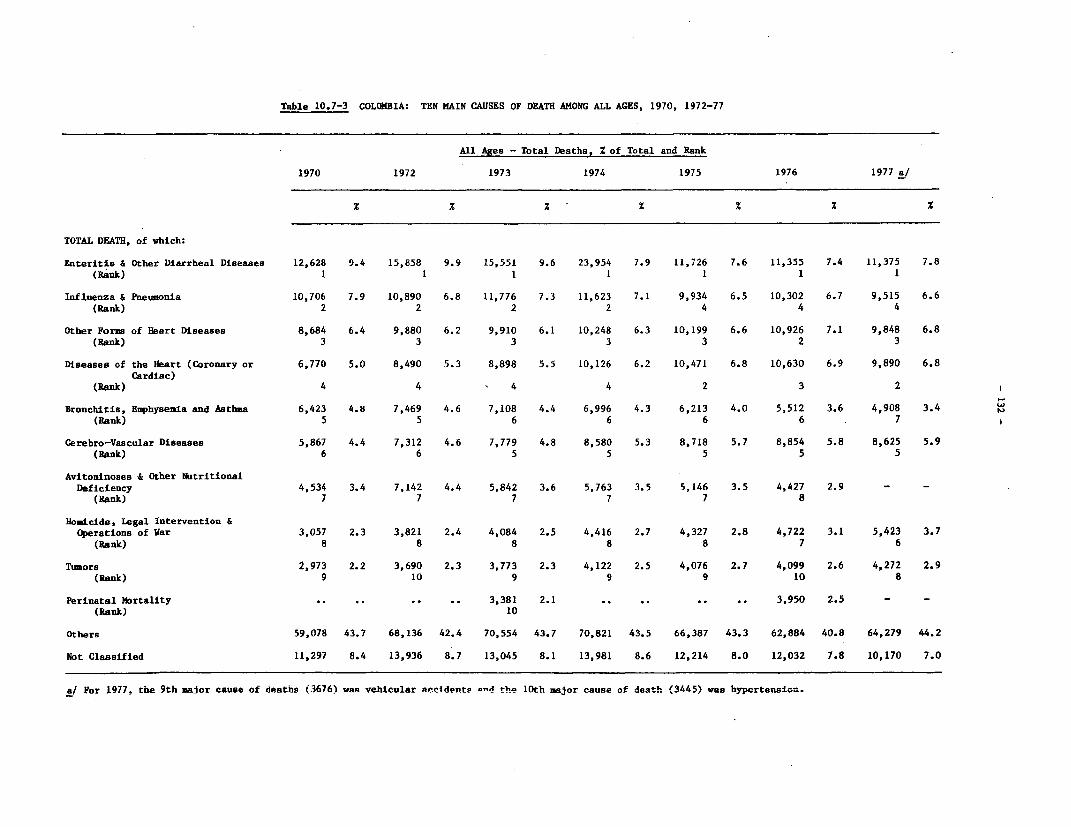
Table 10.7-3 COLOMBIA: TEN MAIN CAUSES OF DEATH AMONG ALL AGES, 1970, 1972-77
All Ages - Total Deaths, Z of Total and Rank
1970 1972 1973 1974 1975 1976 1977 a/
1 % % 1 %
TOTAL DEATH, of which:
Enteritis & Other Diarrheal Diseases 12,628 9.4 15,858 9.9 15,551 9.6 23,954 7.9 11,726 7.6 11,355 7.4 11,375 7.8(Rank) 1 1 1 1 1 1 1
Influenza & Pneumonia 10,706 7.9 10,890 6.8 11,776 7.3 11,623 7.1 9,934 6.5 10,302 6.7 9,515 6.6(Rank) 2 2 2 2 4 4 4
Other Forms of Heart Diseases 8,684 6.4 9,880 6.2 9,910 6.1 10,248 6.3 10,199 6.6 10,926 7.1 9,848 6.8(Rank) 3 3 3 3 3 2 3
Diseases of the Heart (Coronary or 6,770 5.0 8,490 5.3 8,898 5.5 10,126 6.2 10,471 6.8 10,630 6.9 9,890 6.8Cardiac)
(Rank) 4 4 4 4 2 3 2
Bronchitis, Emphysemia and Asthma 6,423 4.8 7,469 4.6 7,108 4.4 6,996 4.3 6,213 4.0 5,512 3.6 4,908 3.4(Rank) 5 5 6 6 6 6 7
Cerebro-Vascular Diseases 5,867 4.4 7,312 4.6 7,779 4.8 8,580 5.3 8,718 5.7 8,854 5.8 8,625 5.9(Rank) 6 6 5 5 5 5 5
Avitoninoses 6 Other NutritionalDeficiency 4,534 3.4 7,142 4.4 5,842 3.6 5,763 3.5 5,146 3.5 4,427 2.9 - -
(Rank) 7 7 7 7 7 8
Homicide, legal Intervention &Operations of War 3,057 2.3 3,821 2.4 4,084 2.5 4,416 2.7 4,327 2.8 4,722 3.1 5,423 3.7
(Rank) 8 8 8 8 8 7 6
Tumors 2,973 2.2 3,690 2.3 3,773 2.3 4,122 2.5 4,076 2.7 4,099 2.6 4,272 2.9(Rank) 9 10 9 9 9 10 8
Perinatal Mortality .. .. .. .. 3,381 2.1 .. .. .. .. 3,950 2.5 - -(Rank) 10
Others 59,078 43.7 68,136 42.4 70,554 43.7 70,821 43.5 66,387 43.3 62,884 40.8 64,279 44.2
Not Classified 11,297 8.4 13,936 8.7 13,045 8.1 13,981 8.6 12,214 8.0 12,032 7.8 10,170 7.0
a/ For 1977. the 9th maior cause of deaths (3676) was vehicular aetIdents and the 10th major cauae of death (3445) was hypertension.

Table 10.8 COLOMBIA: INDIRECT INDICATORS OF NUTRITIONAL STATUS, 1963-76
MeaslesPercentage of Mortality Rate Rate of Mortality by
Preschool Child Under 5 Year Old Among Less Than Intestinal Infections
Infant Mortality Rate** (A) Mortality 5 Year Old Diseases Among Under
Year Mortality Rate** (1-4 Year Old) - in General Children 5 Year Old Children***
(A) (B) (B)
1963 88.2 13.8 6.4 50.3 5.7 6.7
1964 83.2 13.3 6.3 48.2 5.7 6.5
1965 83.8 12.6 6.7 47.9 7.9 6.7
1966 80.0 10.6 7.5 46.5 4.0 6.1
1967 78.3 11.4 6.9 46.7 6.8 6.1
1968 76.0 9.7 7.8 46.4 7.0 4.9
1969 73.3 9.5 7.7 43.1 6.3 4.1
1970 (1) 70.3 9.4 7.5 40.1 4.5 3.1
1971 (1) 67.9 9.2 7.4 39.0 5.7 3.5
1973 (4) 83-77 - - - 3.0 (5) -
1976 (6) - - 37- *9
Mexico 68.4 8.9 7.7 44.1 1.4 1.3
Switzerland/69(2) 11.6 0.5 23.2 - 0.0 0.0
USA/67 (3) 22.4 0.8 28.0 0.0 0.4
* Rate for 1.000 born alive.** Rate for 1,000 of the respective age groups.
*** Rate for 10,000 of under age 5.
(1) Ministry of Public Health - Informe al Honorable Congreso de la Republica de Colombia, 1971-72.
(2) WHO - Handbook of Sanitary Statistics, 1969.(3) WHO - Handbook of Sanitary Statistics, 1967.(4) Censo de Poblacion 1964, 1973 (DANE).(5) Mission Estimate.(6) From Death Registers (Problems of Coverage).
Source: ICBF - El Problema Nutricional y Alimentario de Colombia - Bogota, 1974.

- 134 -
Table 10.9 COLOMBIA: RECOMMENDED AND AVAILABLE AVERAGE DAILY PER CAPITA DOSAGE OFCALORIES AND NUTRIENTS FOR THE COLOMBIAN POPULATION AND THE
PERCENTAGE OF ADEQUACY OF SUPPLY, 1980
1980 a/Percentage of
Recommendations b/ Availability Adequacy c/
Calories and Nutrients
Calories 2393 6870 287Proteins 47.4 60.5 gr. 128Calcium 897 601.0 mg. 67Iron 14 17.2 mg. 123Vitamin A 860 781 mg.Retinol 91Thiamin 1.2 1.1 mg. 92Riboflavin 1.4 1.4 mg. 100Niacin 15.7 14.2 mg. 90Vitamin C 56 172.0 mg. 309Phosphorous 890 1,387.0 mg. 156
Note: a/ Based on population = 26,729,242bI Weighted average derived from Food and Nutrition Board, National Academy of
Sciences - National Research Recommended Daily Dietary Allowance - Revised1980.
c/ Availability divided by Recommendations.
Source: ICBF, Hoja de Balance de Alimentos, Colombia, 1981.

- 135 -
Table 10.10 COLMBIA: PERCENTAGE OF ADEQUACY OF CALORIES AND NUTRIENT CONSUMPTION IN THE DLET OFFAMILIES FROM VARIOUS GEOGRAPHICAL AREAS, 1977
Total Ave:rage Consumption Above Average ConsumptiO Belon 70S COnaUWitiOnCOamnity Calorieji Proteins 2 of Calories S of Proteins S of Calories X Of PrOteins
S H families 2 families e fasilies families S
BoLivar 102.8 102.7 39.0 138.0 38.0 139.0 38.0 57.0 34.0 52.0BUanaventura 83.1 83.4 23.0 119.0 22.0 134.0 47.0 47.0 55.0 47.0Zarzal 88.6 87.4 22.0 139.0 26.0 139.0 51.0 53.0 58.0 50.0
ZuLta 95.2 100.3 26.0 138.0 33.0 151.0 44.0 55.0 43.0 53.0CoChira 74.6 85.5 14.0 136.0 29.0 133.0 64.0 47.0 57.0 47.0Teorama 71.0 81.0 10.0 137.0 23.0 135.0 67.0 48.0 61.0 48.0Ra 8onvalia 96.8 105.5 26.0 131.0 43.0 133.0 33.0 .55.0 31.0 54.0
Ouatica 92.1 81.0 27.0 130.0 26.0 122.0 42.0 .52.0 57.0 49.0CuLnChia 82.4 75.1 23.0 126.0 13.0 127.0 53.0 52.0 56.0 45.0Mi3trato 112.6 94.0 39.0 128.0 31.0 132.0 23.0 59.0 48.0 55.0
Arma 83.1 76.9 22.0 137.0 18.0 132.0 51.0 47.0 60.0 46.0Mermita 94.4 83.0 24.0 148.0 18.0 149.0 42.0 52.0 60.0 49.0TablazO 97.3 100.6 30.0 138.0 31.0 143.0 36.0 .54.0 37.0 49.0La Cabana 105.9 103.8 38.0 141.0 40.0 135.0 28.0 54.0 36.0 54.0
Teaerife 98.1 111.6 36.0 132.0 42.0 144.0 38.0 56.0 29.0 53.0Guamal 73.6 94.0 11.0 135.0 32.0 134.0 64.0 50.0 46.0 50.0P. Viejo 77.1 92.0 18.0 132.0 27.0 133.0 64.0 53.0 45.0 55.0PiVijay 93.5 101.0 25.0 131.0 34.0 135.0 42.0 59.0 38.0 57.0Cianaga 91.7 105.0 19.0 139.0 36.0 134.0 44.0 58.0 31.0 56.0Aracatica 91.0 107.2 24.0 134.0 38.0 139.0 48.0 55.0 28.0 49.0
ChirCales 66.8 68.0 8.0 123.0 10.0 132.0 73.0 48.0 75.0 44.0Ua an 64.9 68.2 10.0 125.0 11.0 137.0 77.0 45.0 69.0 41.0Bosa 81.2 80.2 15.0 147.0 23.0 120.0 54.0 550.0 60.0 49.0Tunjuelito 69.4 76.4 10.0 127.0 20.0 133.0 73.0 49.0 64.0 45.0
Morales 72.9 74.4 16.0 139.0 19.0 143.0 70.0 45.0 68.0 40.0Rosas 88.9 71.1 16.0 123.0 22.0 132.0 67.0 41.0 68.0 39.0Piendazo 82.1 84.9 24.0 128.0 31.0 134.0 53.0 44.0 .57.0 43.0CoconuCo 95.1 93.2 33.0 138.0 33.0 151.0 48.0 52.0 50.0 46.0
Campo de la Cruz 95.0 104.6 31.0 138.0 37.0 158.0 43.0 50.0 43.0 53.0Repelon 85.3 97.5 20.0 141.0 30.0 141.0 51.0 53.0 45.0 54.0Manati 80.7 99.0 23.0 129.0 40.0 136.0 57.0 46.0. 47.0 43.0Barranquilla 78.0 91.2 17.0 124.0 26.0 140.0 62.0 53.0 43.0 44.0Sabanalarga 85.8 100.4 18.0 131.0 39.0 137.0 50.0 40.0 44.0 51.0
Baraya 93.8 99.4 29.0 143.0 36.0 134.0 41.0 60.0 39.0 47.0San Agustin 76.1 79.0 18.0 147.0 19.0 133.0 64.0 45.0 60.0 48.0Salado Blanco 88.3 92.5 25.0 142.0 31.0 129.0 48.0 47.0 46.0 45.0
Pinillos 96.7 86.8 33.0 136.0 22.0 139.0 41.0 57.0 48.0 52.0Carmen 99.3 82.7 31.0 136.0 23.0 133.0 37.0 56.0 59.0 50.0MagangUe 85.5 85.7 18.0 124.0 23.0 129.0 52.0 58.0 58.0 68.0
Purificacion 88.8 100.5 27.0 136.0 37.0 133.0 51.0 49.0 45.0 51.0Casablanca 92.8 103.0 29.0 138.0 37.0 151.0 42.0 52.0 40.0 51.0Dolores 91.0 107.6 23.0 144.0 45.0 135.0 48.0 51.0 34.0 52.0Chaparral 101.3 101.6 36.0 144.0 43.0 145.0 34.0 53.0 36.0 55.0Planados 107.6 108.7 39.0 139.0 42.0 145.0 28.0 50.0 27.0 50.0
Average Total 87.5 89.5 23.0 139.8 29.6 141.8 50.3 56.0 48.0 54.3
Source: Plan Nacional De Alimentacion Y Nutricion, Inforue De Evaluacion Pan Ano 1977 (Documento DNL - PAN Mayo 1978)

- 136 -
Table 10.11 COLOMBIA: ANNUAL NEEDS FOR BASIC FOOD GROUPS FOR HUMAN CONSUMPTIONAND THEIR AVAILABILITY, 1966-81 a/
(thousand metric tons)
M4ilk Meat a/ LegumesYears Needs Avail. % Needs Avail. z Needs Avail. X
1966 2,240.4 1,227.0 50.3 814.7 532.7 65.4 202.7 139.8 69.01970 2,772.5 1,412.0 50.9 924.2 745.7 80.7 230.0 170.4 74.11975 2,280.0 2,096.0 91.9 1,152.0 869.0 75.4 368.0 115.0 31.31976 2,346.0 2,229.0 95.0 1,185.0 835.0 70.5 378.0 117.C0 31.01971 2,414.0 .. .. 1,220.0 .. .. 389.01978 2,484.0 .. .. 1,255.0 .. .. 400.0 ..
1981 n.a. 2,445.9 .. n.a. 916.5 .. n.a. 163.0
Cereals Vegetables Fruit bTYears Needs Avail. X Needs Avail. Needs Avail. Z
1966 1,595.9 1,572.3 98.5 597.1 223.4 37.4 3,740.5 1,853.5 49.61970 1,810.4 1,629.8 90.0 677.3 326.7 48.2 4,243.2 2,105.9 49.61975 1,863.0 2,246.0 120.6 735.0 971.0 132.1 2,402.0 1,649.0 68.71976 1,917.0 2,609.0 136.1 757.0 819.0 108.2 2,472.0 1,839.0 74.41977 1,972.0 .. .. 778.0 .. .. 2,543.01978 2,030.0 .. .. 800.0 .. .. 2,617.01981 n.a. 2,790.9 .. n.a. 852.6 .. n.a. 1,753.7
FatsYears Needs Avail. X
1966 163.7 99.8 61.01970 185.7 115.3 62.21975 221.0 139.0 62.91976 227.0 185.0 81.51977 233.01978 240.01981 n.a 243.1
Notes: a/ 1981 availability is based on stock available at beginning of year and production throughout the year, "Needs"category for 1981 is in process of completion.
bI/ Figures for 1981 includes intestinal parts, organs, etc.
Source: ICBF, Hoja de Balance de Alimentos, Colombia, various issues.