Micro-habitats' Utilization, Feeding Niche Overlapping, and ...
Upload
independentCategory
view
3download
0
JEB Journal Home page : www.jeb.co.in « E-mail : [email protected]
MRN_464
Journal of Environmental Biology, Vol. 35, P-P, Month 2014© Triveni Enterprises, Lucknow (India)
Journal of Environmental Biology ISSN: 0254-8704 CODEN: JEBIDP
Introduction
Recently, the emergence of new or invasive insect-pests is quite frequent due to certain anthropogenic changes to agro-ecosystems such as agricultural intensification, international trade, habitat fragmentation and climate change. The temperature alterations due to global climate warming have been predicted to affect significantly the geographic distribution and abundance of insect pests of agriculturally important crops (Bale et al., 2002, IPCC, 2007). Consequently, the pests of minor importance earlier, are now assuming the status of economically important pests in many parts of the world. India, during the last decade, has witnessed an increased build-up of various mealybug species in crop plants and in wild. The so called cotton
mealybug Phenacoccus solenopsis Tinsley (Hemiptera: Pseudococcidae) is one such recent example known to cause large scale epidemics in the Indian cotton growing belt during 2005-09. P. solenopsis is an exotic species native to USA which was hitherto not reported to occur in India. It has accidentally entered and spread throughout the country causing devastation, both in Bt and non-Bt cotton crops, where crop losses ranged between 30 to 60% (Dhawan et al., 2007). After its first documentation in 2005 in North-Western parts of Gujarat State (Jhala et al., 2008), now appears to be widespread in almost all cotton growing states of India (Nagrare et al., 2009). Meanwhile, P. solenopsis was also reported to infest several other crops of economic importance such as okra, chilli, brinjal, tomato, ornamentals like Hibiscus rosa-sinensis L., and weeds as well
Predicting the potential geographic distribution of cotton mealybug Phenacoccus solenopsis in India based on MAXENT ecological
niche Model
Babasaheb B. Fand*, Mahesh Kumar and Ankush L. KambleNational Institute of Abiotic Stress Management (Indian Council of Agricultural Research), Malegaon, Baramati, Pune-413 115, India.
*Corresponding Author E-mail:
Abstract
Key words
Mealybug, Phenacoccus solenopsis Tinsley has recently emerged as a serious insect pest of cotton in India. This study demonstrates the use of Maxent algorithm for modeling the potential geographic distribution of P. solenopsis in India with presence-only data. Predictions were made based on the analysis of the relationship between 111 occurrence records for P. solenopsis and the corresponding current and future climate data defined on the study area. The climate data from worldclim database for current (1950-2000) and future (SRES A2 emission scenario for 2050) conditions were used. DIVA-GIS, an open source software for conducting spatial analysis was used for mapping the predictions from Maxent. The algorithm provided reasonable estimates of the species range indicating better discrimination of suitable and unsuitable areas for its occurrence in India under both present and future climatic conditions. The fit for the model as measured by AUC was high, with value of 0.930 for the training data and 0.895 for the test data, indicating the high level of discriminatory power for the Maxent. A Jackknife test for variable importance indicated that mean temperature of coldest quarter with highest gain value was the most important environmental variable determining the potential geographic distribution of P. solenopsis. The approaches used for delineating the ecological niche and prediction of potential geographic distribution are described briefly. Possible applications and limitations of the present modeling approach in future research and as a decision making tool in integrated pest management are discussed.
DIVA-GIS, Entropy, Phenacoccus solenopsis, Potential distribution
Publication Info
Paper received:03 October 2013
Revised received:10 January 2014
Accepted:28 January 2014

(Vennila et al., 2010). P. solenopsis has been the major focus of researchers because of its invasiveness and rapid spread across India within a short period of time.
Early predictions on the pest distribution and abundance through forecasting models could facilitate better preparedness to combat outbreaks of serious insect pests by developing effective pest management strategies well in advance. Ecological niche modeling is one such suitable approach to predict potential geographic distribution and spread of agricultural pests. Availability of computer-aided modelling tools and algorithms integrated or coupled with Geographic Information System (GIS), such as MAXENT (Phillips et al., 2006), and DIVA-GIS (Hijmans et al., 2005a) have facilitated better understanding of spatial patterns of species spread in relation to climatic conditions. Geostatistical functions integrated in GIS allow predicting and mapping the trends of potential changes in geographical distribution of invasive insect pests (Liebhold et al., 1993). DIVA-GIS and MAXENT have been successfully employed in a wide range of situations for ecological modeling and predictions. MAXENT is an open source computer-aided tool (downloadable at http://www.cs.princeton.edu/~schapire/Maxent) which is extensively used in predicting species geographic distribution. It estimates probability values which represent the suitability or unsuitability of a location for presence of the species, based on the relationship between presence points and climatic conditions. Maxent is used in present study because it is one of the best among many different modeling programmes, and estimates probability distribution for species occurrence even with small sample sizes (Phillips et al., 2006; Elith et al., 2011). DIVA-GIS is also an open source computer programme (downloadable at http://www.diva-gis.org) used for mapping and analysing spatial data.
Climatic variables, especially temperature and rainfall patterns are known to play key role in population dynamics and local abundance of P. solenopsis (Jeyakumar et al., 2009; Saroja et al., 2009). With present modeling approach, the gradients of habitat suitability identified for the occurrence of P. solenopsis were further related to the spatial distribution of its main host crop i.e cotton by masking the prediction maps using a shape file of the cotton growing areas. An attempt was made to predict the potential geographical spread of the pest in the context of changing climate so that the crop growers can be informed well in advance for undertaking timely prophylactic measures.
Materials and Methods
Pest occurrence data : The data on current distribution of P. solenopsis in India were compiled from published literature (Table 1). The data comprised of total of 111 occurrence records for P. solenopsis, 100 of which were from only nine major cotton growing states of India viz., Punjab (09), Haryana (06), Rajasthan (08), Gujarat (11), Madhya Pradesh (04), Maharashtra (31),
Andhra Pradesh (09), Karnataka (09) and Tamil Nadu (12). Only 11 records for P. solenopsis occurrence were held from other states like West Bengal (08), Uttar Pradesh (01), Bihar (01) and Jharkhand (01), where cotton is grown on a very small scale. The administrative boundaries of study area (India) were digitized from a georeferrenced image in DIVA-GIS and the places of occurrence of the pest were marked as presence-only points on a digitized map.
Environmental data : The climate data required for carrying out multiple analyses such as delineation of ecological niche, prediction of potential geographic distribution and impact of climate change on future distribution and spread were obtained from DIVA-GIS website (http://www.diva-gis.org/climate). The climate data at 2.5 arc-minutes resolution (~5 km at the equator) were used for making predictions on P. solenopsis habitat distribution. The current climate data comprised of derived values of monthly temperature and precipitation using long term time series from 1950 to 2000, from a global network. The future climate data were based on climate projections for the year 2050 under the SRES A emission scenario downscaled from three 2
different global circulation models (GCM): CCCMA, HADCM3 and CSIRO (Hijmans et al., 2005b).
19 bioclimatic variables (BIOCLIM) were considered as potential predictors of P. solenopsis habitat distribution, based on their biological relevance to species distributions, habitat modeling and ability to define eco-physiological tolerance of species (Table 2). These climatic variables along with 111 presence records were used to establish the relationship between P. solenopsis habitat distribution and present climate conditions. The predictions were made based on the analysis of relationships between the presence-only data on current distribution of P. solenopsis and environmental variables defined on the study area.
Modeling software : Maxent (Maximum Entropy Species Modeling), a freely available software for predicting species geographic distribution (version 3.3.3e) was used in this study. Maxent estimates probability values which represent the suitability or unsuitability of a location for presence of the species based on the relationship between presence points and climatic conditions. The programme has different output formats like cumulative and logistic. In cumulative format, the output ranges from 0 (unsuitable) to 100 (highly suitable), and logistic format has values ranging from 0 to 1 which indicates habitat suitability ranging from low to high. Predictions from Maxent were mapped in DIVA-GIS (version 7.4), an open source computer programme for mapping and analysing spatial data.
Model fitting and interpretation : The algorithm was run with selected environmental variables, 111 presence-only points and a set of background values (pseudoabsences) drawn from the entire study region to determine the potential distribution. The
B.B. Fand et al.2

3Phenacoccus solenopsis habitat distribution model
Table 1 : Occurrence points for Phenacoccus solenopsis in India
State Location Longitude Latitude Reference
oPunjab Abohar 74°10’ E 30 10' N Dhawan et al. (2007); Nagrare et al. (2009); Tanwar et al. (2011);Sharma and Pati (2013)
oMansa 75°23’ E 29 59' NoBathinda 75°00’ E 30 11' NoMuktsar, 74°43’ E 30 30' No Faridkot 74°45’ E 30 44' NoFirozpur 75°54’ E 30 12' N oSangrur 74°40' E 30 55' NoLudhiana 75°54' E 30 55' N
o oAmritsar 74 52’E 31 38’No oHaryana Fatehabad 75 30’ E 29 31’ N Nagrare et al. (2009); Pala and Saini (2010); Tanwar et al. (2011)
oSirsa 75°1.12’E 29 31’NoHisar 76° 23’E 29 19’NoBhiwani 76°18’E 28 46’NoJind 76° 26’E 29 48’NoRohtak 75° 17’E 30 01’N
o oDelhi New Delhi 77 12’E 28 38’N Nagrare et al. (2009); Vennila et al. (2010); Tanwar et al. (2011)oRajasthan Kota 75°52’E 25 10’N Nagrare et al. (2009); Vennila et al. (2010); Tanwar et al. (2011);Verma et al. 2011oHanumangarh 74°21’E 29 35’NoSriganganagar 73°53’E 29 55’N
o oAjmer 74 38’E 26 27’No oJodhpur 73 01’E 26 14’No oNagour 73 44’E 27 11’No oPali 73 19’E 25 46’No oAlwar 76 37E 27 33’N
oGujarat Surendranagar 71°43’E 22 43’N Jhala et al. (2008); Nagrare et al. (2009);Vennila et al. (2010);Tanwar et al. (2011) oRajkot 70°56’E 22 18’NoPorbandar 69°49’E 21 37’NoJunagarh 70°36’E 21 31’NoAmreli 71°15’E 21 36’NoBhavnagar 72° 00’E 21 46’NoAhmedabad 72°40’E 23 3’NoAnand 73° 00’E 22 32’NoVadodara 73°16’E 22 00’NoBharuch 73°01’E 21 41’NoSurat 72°49’E 21 11’NoMadhya Pradesh Indore 76°22'E 21 49’N Nagrare et al. (2009); Vennila et al. (2010)oKhandwa 75°50’E 22 44’N
o oJabalpur 79 57’E 23 10’No oDevas 76 3’E 22 57’N
Maharashtra Akola 77° 02' E 20° 42’N Nagrare et al. (2009); Vennila et al. (2010) Amravati 77° 48' E 20° 56' NAurangabad 75° 23' E 19° 53' NBuldana 76° 14' E 20° 32' NDhule 74° 47' E 20° 58' NHingoli 77° 11' E 19° 43' NJalgaon 75° 40' E 21° 05' NJalna 75° 56' E 19° 51' NLatur 76° 36' E 18° 24' NNagpur 79° 09' E 21° 09' NNanded 77° 27' E 19° 09' N
0Beed 75° 50’E 19 00’NGangakhed 76° 43' E 18° 52' N Parbhani 76° 5' E 19° 08' N

4 B.B. Fand et al.
oWardha 78° 39' E 20 45' NWashim 77° 10’E 20° 05' NYeotmal 78° 11' E 20° 23' N
o oMoregaon 77 44’E 19 20’No oTemburda 79 1’E 20 20’No oWarora 79 00’E 20 13’No oSakoli 80 00’E 21 5’No oJintur 76 41’E 19 36’No oMajalgaon 76 13’E 19 9’No oGeorai 75 45’E 19 16’No oParali 76 31’E 18 51’No oBhokar 77 40’E 19 13’No oDeglur 77 34’E 18 32’No oKandhar 77 11’E 18 52’No oVasmat 77 9’E 19 19’No oAundha Nagnath 77 2’E 19 32’No oSolapur 75 54’E 17 39’N
Andhra Pradesh Kurnool, 78° 05' E 15° 50' N Nagrare et al. (2009); Vennila et al. (2010)Anantpur 77° 39’E 14° 41' NAdilabad 78°30’E 19° 37' N
oKarimnagar 79° 6’E 18 28’ NoWarangal 79° 40’E 17 58’ No Amravati 80° 15’E 16 50’ NoHyderabad 78° 30’E 17 20’ NoGuntur 80° 29’E 16 18’ N
o oShayampet 79 34’E 17 58’NoKarnataka Raichur 77°22’E 16 12' N Hanchinal et al. (2011) oBelgaon 74°34’E 15 52' NoDharwad 75°05’E 15 27' NoBijapur 75°47’E 16 50' NoGulbarga 76°54’E 17 19' NoBellary 76°55’E 15 9’N
o oHaveri 75 24’ E 14 48’No oHubly 75 7’E 15 21’No oBengaluru 77 59’E 12 58’E
o Tamil Nadu Coimbatore 77° 00’E 11 00’N Nagrare et al. (2009); Suresh et al. (2010)oMadurai 78° 10’E 9 58’NoTirunelvelli 77°44’E 8 44’NoRamnathpuram 78° 50’E 9 22' N
o oCuddalore 79 44’E 11 24'’No oVirudhanagar 78 1’E 9 52'’No oKanyakumari 77 55’E 8 08’No oDindugal 77 3’E 10 05’No oChettikulam 77 07’E 10 09’No oTrichy 77 45’E 11 3’No oSalem 77 62’E 11 6’No oPudukottai 77 82’E 10 38’No oWest Bengal Mohanpur 87 25’E 21 50’N Satpathy et al. (2009)
o oSouth 24 Parganas 88 22’E 21 51’No oNoth 24 Parganas 88 42’E 22 42’No oMurshidabad 88 16’E 24 10’No oNadia 88 33’E 23 28’No oBurdman 87 37’E 23 27’No oHoogley 88 24’E 22 53’No oBarrackpore 88 23’E 22 46’N
oJharkhand Namkum 85o22’E 23 19’N Anonymous (2013)o oBihar Pusa 85 40’E 25 59’N Tanwar et al. (2008)o oUttar Pradesh Varanasi 82 58’E 25 19’N Anonymous (2012)

available occurrence data of P. solenopsis was divided randomly into two parts to create quasi-independent data for model testing and validations (Fielding and Bell, 1997). The 75% of the data were used for model training and the remaining (25%) were used for model testing. Additionally, we also fitted model on full data set with 5-fold cross validation to estimate the errors around the fitted functions and to compare the model consistency. Maxent model was run with the following settings: auto features (feature types selected automatically based on the training sample size), output format = logistic (default output in Maxent), random test percentage = 25, regularisation multiplier = 1, maximum iterations = 1000, convergence threshold = 0.0001 and maximum number of background points = 10,000. The model was fitted to the current climate using default regularization parameters for estimation of the unknown probability distribution (species' potential distribution in present case) over a geographic region of interest (X). Individual elements of X i.e. x , x ,....., x were taken 1 2 m
as presence points for species occurrence and the environmental variables (f) defined on the X were f , f , ..., f . The maximum 1 2 n
entropy of approximate probability distribution (ρ) was estimated in accordance with Phillips et al. (2006)
The model produced a set of probabilities presented as logistic transformations of cumulative thresholds with values ranging from 0 to 1(low to high suitability range) across the entire study area. A Jackknife test was used to measure the variable importance in model development and Receiver Operating Characteristic curve analysis (ROC) was used to assess the discriminative power of the model (Fielding and Bell, 1997; Phillips et al., 2006; Elith et al., 2011). A ROC plot was built by plotting sensitivity (1- omission rate) against 1- specificity (fractional predicted area) for all available probability thresholds (Manel et al., 2001). The area under ROC curve (AUC), ranging from 0.5 to 1.0 was taken as a measure of model performance (Araujo et al., 2005). For discrimination of suitable and unsuitable areas, the threshold was applied by selecting the point on the ROC curve that was closest to the upper-left corner (0, 1), as it represents a perfect test with 100% sensitivity and specificity (Cantor et al., 1999). The areas with probability values below the threshold were excluded from predictions. Predictions were mapped in DIVA-GIS. Further, the prediction map was masked using vegetation or land cover data. For this, the shape file of cotton growing areas was used as filter to obtain map which displays pest risk for cotton growing regions only, i.e. where P. solenopsis populations could establish according to the presence of its main host plant.
Analysis of climate change impact : The downscaled data of SRES A emission scenario for the year 2050 (Hijmans et al., 2
2005b) was used to project future climatic conditions. The model was run for second time with same setting as above, except for the addition of future climate data in 'projection layer' directory option. The future changes in geographic distribution of P. solenopsis were predicted based on relationship established
between its habitat distribution and present climatic conditions. While projecting, a Multidimensional Environment Similarity Surface (MESS) analysis was applied to find out 'Novel Climate Conditions' for the predicted range of P. solenopsis. The analysis finds out future climate values outside the range in current climate and also shows how similar each point is in future climate layers to conditions seen during model training at current climate, i.e. the degree of novelness (Phillips et al., 2006; Elith et al., 2010).
The binary rasters for the presence and absence of species potential distribution areas were generated in Maxent by applying same threshold as above, which limits the potential distribution area. Each binary raster has two values: presence (1) and absence (0) of the species. The rasters for current and future potential distribution areas were reclassified in DIVA-GIS by changing their cell values to 0, 1 and 0, 2 respectively. Using option grid overlay in DIVA-GIS, the cell values of two rasters were substracted by superimposing them to visualize the impact of climate change on P. solenopsis distribution (Scheldeman and van Zonneveld, 2010). The grid overlay generated four categories of impact situations, viz., high impact zone, areas outside of the
5Phenacoccus solenopsis habitat distribution model
Table 2 : Environmental variables used in Maxent ecological niche model
Variable Variable type
Bio 1 Annual mean temperature Bio 2 Mean diurnal range: mean of monthly (max temp – min temp) Bio 3 Isothermality: (Bio 1/ Bio 7) x 100 Bio 4 Temperature seasonality (coefficient of variation) Bio 5 Maximum temperature of warmest month Bio 6 Minimum temperature of coldest month Bio 7 Temperature annual range (Bio 5 – Bio 6) Bio 8 Mean temperature of wettest quarter Bio 9 Mean temperature of driest quarter Bio 10 Mean temperature of warmest quarter Bio 11 Mean temperature of coldest quarter Bio 12 Annual precipitation Bio 13 Precipitation of wettest month Bio 14 Precipitation of driest month Bio 15 Precipitation seasonality (coefficient of variation) Bio 16 Precipitation of wettest quarter Bio 17 Precipitation of driest quarter Bio 18 Precipitation of warmest quarter Bio 19 Precipitation of coldest quarter
Table 3 : Evaluation statistics i.e. values for area under ROC curve for training and test data for model run with 5-fold cross validation and random data partitioning
Data partition Training AUC Test AUC
P. solenopsis 1 0.933 0.920P. solenopsis 2 0.940 0.884P. solenopsis 3 0.943 0.838P. solenopsis 4 0.929 0.884P. solenopsis 5 0.938 0.874P. solenopsis (75% : 25 %) 0.930 0.895
realized niche, low impact zone and potential new suitable zone.
Results and Discussion
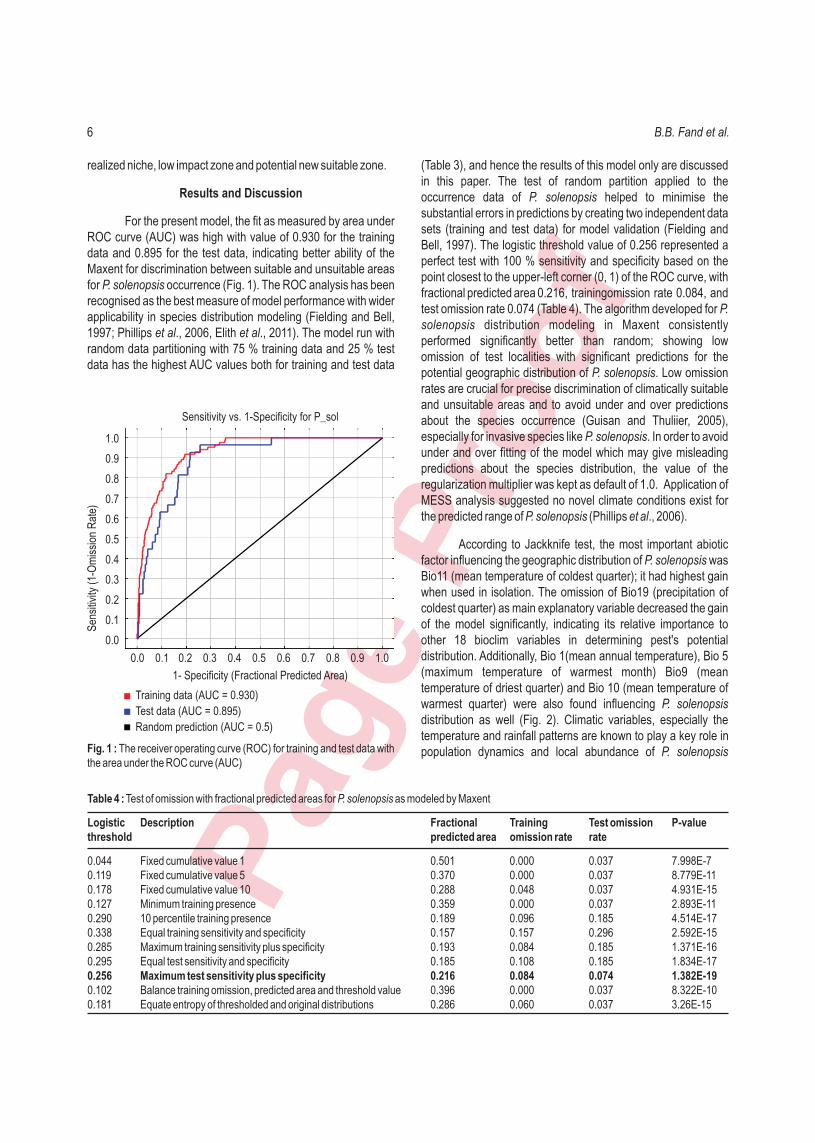
For the present model, the fit as measured by area under ROC curve (AUC) was high with value of 0.930 for the training data and 0.895 for the test data, indicating better ability of the Maxent for discrimination between suitable and unsuitable areas for P. solenopsis occurrence (Fig. 1). The ROC analysis has been recognised as the best measure of model performance with wider applicability in species distribution modeling (Fielding and Bell, 1997; Phillips et al., 2006, Elith et al., 2011). The model run with random data partitioning with 75 % training data and 25 % test data has the highest AUC values both for training and test data
(Table 3), and hence the results of this model only are discussed in this paper. The test of random partition applied to the occurrence data of P. solenopsis helped to minimise the substantial errors in predictions by creating two independent data sets (training and test data) for model validation (Fielding and Bell, 1997). The logistic threshold value of 0.256 represented a perfect test with 100 % sensitivity and specificity based on the point closest to the upper-left corner (0, 1) of the ROC curve, with fractional predicted area 0.216, trainingomission rate 0.084, and test omission rate 0.074 (Table 4). The algorithm developed for P. solenopsis distribution modeling in Maxent consistently performed significantly better than random; showing low omission of test localities with significant predictions for the potential geographic distribution of P. solenopsis. Low omission rates are crucial for precise discrimination of climatically suitable and unsuitable areas and to avoid under and over predictions about the species occurrence (Guisan and Thuliier, 2005), especially for invasive species like P. solenopsis. In order to avoid under and over fitting of the model which may give misleading predictions about the species distribution, the value of the regularization multiplier was kept as default of 1.0. Application of MESS analysis suggested no novel climate conditions exist for the predicted range of P. solenopsis (Phillips et al., 2006).
According to Jackknife test, the most important abiotic factor influencing the geographic distribution of P. solenopsis was Bio11 (mean temperature of coldest quarter); it had highest gain when used in isolation. The omission of Bio19 (precipitation of coldest quarter) as main explanatory variable decreased the gain of the model significantly, indicating its relative importance to other 18 bioclim variables in determining pest's potential distribution. Additionally, Bio 1(mean annual temperature), Bio 5 (maximum temperature of warmest month) Bio9 (mean temperature of driest quarter) and Bio 10 (mean temperature of warmest quarter) were also found influencing P. solenopsis distribution as well (Fig. 2). Climatic variables, especially the temperature and rainfall patterns are known to play a key role in population dynamics and local abundance of P. solenopsis
6 B.B. Fand et al.
Table 4 : Test of omission with fractional predicted areas for P. solenopsis as modeled by Maxent
Logistic Description Fractional Training Test omission P-valuethreshold predicted area omission rate rate
0.044 Fixed cumulative value 1 0.501 0.000 0.037 7.998E-70.119 Fixed cumulative value 5 0.370 0.000 0.037 8.779E-110.178 Fixed cumulative value 10 0.288 0.048 0.037 4.931E-150.127 Minimum training presence 0.359 0.000 0.037 2.893E-110.290 10 percentile training presence 0.189 0.096 0.185 4.514E-170.338 Equal training sensitivity and specificity 0.157 0.157 0.296 2.592E-150.285 Maximum training sensitivity plus specificity 0.193 0.084 0.185 1.371E-160.295 Equal test sensitivity and specificity 0.185 0.108 0.185 1.834E-170.256 Maximum test sensitivity plus specificity 0.216 0.084 0.074 1.382E-190.102 Balance training omission, predicted area and threshold value 0.396 0.000 0.037 8.322E-100.181 Equate entropy of thresholded and original distributions 0.286 0.060 0.037 3.26E-15
Fig. 1 : The receiver operating curve (ROC) for training and test data with the area under the ROC curve (AUC)
Sensitivity vs. 1-Specificity for P_sol
Sen
sitiv
ity (
1-O
mis
sion
Rat
e)
1.0
0.9
0.8
0.7
0.6
0.5
0.4
0.3
0.2
0.1
0.0
1- Specificity (Fractional Predicted Area)
0.0 0.1 0.2 0.3 0.4 0.5 0.6 0.7 0.8 0.9 1.0
Training data (AUC = 0.930)
Test data (AUC = 0.895)
Random prediction (AUC = 0.5)

(Jeyakumar et al., 2009; Saroja et al., 2009).
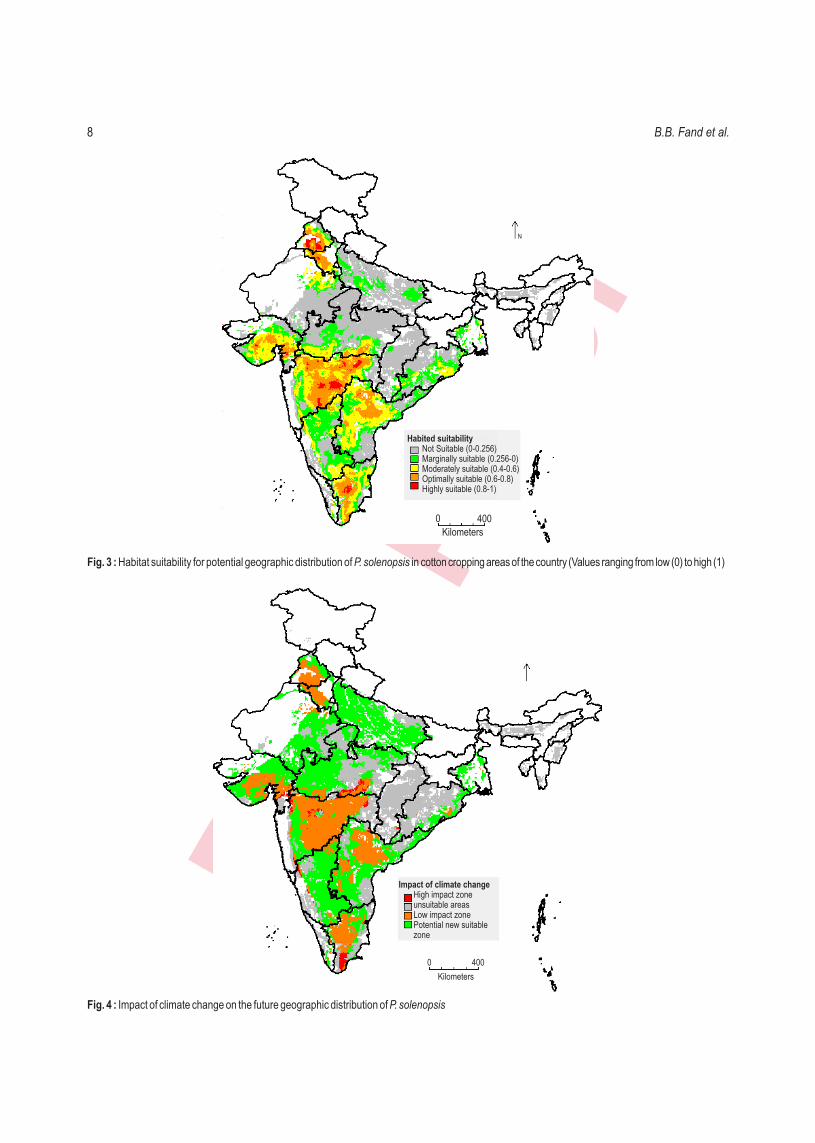
Maxent model predicted extensive areas for the occurrence of P. solenopsis almost throughout the Northern, Central and Southern regions which constitutes major cotton growing belts of India (Fig. 3). The most suitable areas were distributed in Punjab and Haryana states from North Zone; Gujarat and Maharashtra states from Central Zone; and Andhra Pradesh and Tamil Nadu states from South Zone. Severe losses in cotton crop (30-40 %) due to P. solenopsis infestation has been reported in states of Punjab (Dhawan et al., 2007), Haryana (Pala and Saini, 2010), Gujarat (Jhala et al., 2008), Maharashtra (Nagrare et al., 2009), Andhra Pradesh (Nagrare et al., 2009) and Tamil Nadu (Suresh et al., 2010), indicating high suitability of these areas for natural occurrence and abundance of P. solenopsis. Northern cotton growing area in Rajasthan, Madhya Pradesh, and South-Central Karnataka states were predicted as
moderately suitable areas for occurrence of P. solenopsis. A moderate to high infestation of P. solenopsis in cotton was reported in Karnataka state (Hanchinal et al., 2010). Uttar Pradesh, Odisha and West Bengal, where cotton is grown on small scale were predicted as marginally suitable for P. solenopsis occurrence, whereas rest of the areas are predicted unsuitable.
The results of the Maxent model, when projected to the future climate scenario for the year 2050 suggested that, the current geographic distribution of the P. solenopsis in India will be significantly affected by the climate change (Fig. 4). The areas less or marginally suitable for natural occurrence of P. solenopsis at present climatic conditions will become more conducive with changing climate for rapid spread and multiplication of P. solenopsis. The areas predicted by model with high risk of future P. solenopsis invasion are far Western part of Gujarat, South
7Phenacoccus solenopsis habitat distribution model
BIO1
BIO10
BIO11
BIO12
BIO13
BIO14
BIO15
BIO16
BIO17
BIO18
BIO19
BIO2
BIO3
BIO4
BIO5
BIO6
BIO7
BIO8
BIO9
Env
ironm
enta
l var
iabl
e
Jackknife of regularized training gain for P_sol
Without variable
With only variable
with all variables
regularized training gain
0.0 0.1 0.2 0.3 0.4 0.5 0.6 0.7 0.8 0.9 1.0 1.1 1.2 1.3
Fig. 2 : Jackknife test for relative importance of environmental variables in the development of the Maxent model
8 B.B. Fand et al.
Kilometers
0 400
N
Habited suitability Not Suitable (0-0.256) Marginally suitable (0.256-0) Moderately suitable (0.4-0.6) Optimally suitable (0.6-0.8) Highly suitable (0.8-1)
Fig. 3 : Habitat suitability for potential geographic distribution of P. solenopsis in cotton cropping areas of the country (Values ranging from low (0) to high (1)
Fig. 4 : Impact of climate change on the future geographic distribution of P. solenopsis
Impact of climate change High impact zone unsuitable areas Low impact zone Potential new suitable zone
Kilometers
4000

Sunayan Saha, Scientist (Agrometeorology), NIASM, Baramati are duly acknowledged for technical help related to basics of GIS, its applications, and ROC analysis.
References
Anonymous: IIVR Annual Report 2011-12, Indian Institute of Vegetable Research,Varanasi. p. 176 (2012).
Anonymous: INRG Annual Report 2012-13. Indian Institute of Natural Resins and Gums, Namkum, Ranchi (Jharkhand). p. 101 (2013).
Araujo, M.B., R.G. Pearson, W. Thuiller and M. Erhard: Validation of species–climate impact models under climate change. Global Change Biol .,11, 1504-1513 (2005).
Bale, J., G.J. Masters, I.D. Hodkins, C. Awmack, T.M. Bezemer, V.K. Brown, J. Buterfield, A. Buse, J.C. Coulson, J. Farrar, J.E.G. Good, R. Harrington, S. Hartley, T.H. Jones, R.L. Lindroth, M.C. Press, I. Symrnioudis, A.D. Watt and J.B. Whittaker: Herbivory in global climate change research: direct effects of rising temperature on insect herbivores. Global Change Biol., 8, 1-16 (2002).
Cantor, S.B., C.C. Sun, G. Tortolero-Luna, R. Richards-Kortum and M. Follen: A comparison of C/B ratios from studies using receiver operating characteristic curve analysis. J. Clin. Epidemiol., 52, 885-892 (1999).
Dhawan, A.K., K. Singh, S. Saini, B. Mohindrrou, A. Kaur, G. Singh and S. Singh: Incidence and damage potential of mealybug, Phenacoccus solenopsis Tinsley on cotton in Punjab. Indian J. Ecol., 34, 110-116 (2007).
Elith, J., S.J. Phillips, T. Hastie, M. Dudik, Y.E. Chee and C.J. Yates: A statistical explanation of MaxEnt for ecologists. Diver Distrib., 17, 43–57 (2011).
Fielding, A.H. and J.F. Bell: A review of methods for the assessment of prediction errors in conservation presence/ absence models. Env Conserv., 24, 38-49 (1997).
Ganeshaiah, K.N., N. Barve, N. Nath, K. Chandrashekara, M. Swamy and R. UmaShanker: Predicting the potential geographical distribution of the sugarcane woolly aphid using GARP and DIVA-GIS. Curr. Sci., 85, 1526-1528 (2003).
Guisan, A. and W. Thuliier: Predicting species distributions: Offering more than simple habitat models. Ecol. Let., 8, 993-1009 (2005).
Hanchinal, S.G., B.V. Patil, K.B. Anagoud, A. Nagangoud, D.P. Biradar and B.S. Janagoudar: Incidence of invasive mealybug (Phenacoccus solenopsis Tinsley) on cotton. Karnataka J. Agric. Sci., 24, 143-145 (2011).
Hijman, R.J., S.E. Cameron, J.L. Parra, P.G. Jones and A. Jarvis: Very high resolution interpolated climate surfaces for global land areas. Int. J. Climatol., 25, 1965-1978 (2005b).
Hijmans, R.J., L. Guarino, A. Jarvis, R. O'Brien, P. Mathur, M. Cruz, I. Barrantes and E. Rojas: DIVA-GIS (Version 5.2) Manual, 2005, p. 79 (2005a).
IPCC: Climate Change- Impacts, Adaptation and Vulnerability (Eds.: M.L. Parry, O.F. Canziani, J.P. Palutik, P.J. van der Linden and C.E. Hanson). Cambridge University Press, Cambridge, UK, p. 976 (2007).
Jeyakumar, P., R.K. Tanwar, J. Singh, S. Singh, A. Singh and A. Dhandapani: Impact of weather factors on cotton mealybug, Phenacoccus solenopsis Tinsley. Proceedings of National Symposium on IPM Strategies to combat emerging pests in the current scenario of Climate Change (College of Horticulture and Forestry, Central Agricultural University, Pashighat, Arunachal
Eastern Rajasthan, Northern Madhya Pradesh and surprisingly, extensive new areas from Gangetic Plains in Uttar Pradesh.
The Maxent modeling approach was employed in present study because of certain merits it has over the others. It is one of the best among many different computer packages and estimates probability distribution for species occurrence with presence-only data and works well even with sample sizes as small as 10 (Phillips et al., 2006; Elith et al., 2011). Presence-only modeling represents the fundamental niche of the species that determines potential habitat suitability (Guisan and Thuliier, 2005). Considering the invasiveness of P. solenopsis, it was assumed to model the fundamental niche rather than realized niche in order to estimate maximum potential distribution of the pest. This will greatly help pest management authorities in making pest management decisions such as strict quarantine inspections of plants and planting materials to slow down the spread of injurious pests and timely provision of pest management information to the farmers from areas having high risk of future pest invasion.
The entire range of natural distribution of P. solenopsis was estimated by modeling in Maxent, which indicated extensive areas for its occurrence in India. The absence of P. solenopsis from geographical areas with environmental conditions favourable for its occurrence may be due to lack of sampling from those areas, certain dispersal limitations such as reproductive and or geographical barriers and human interferences preventing the species from occupying an area (Scheldeman and van Zonneveld, 2010). The present predictions are in agreement with Wang et al. (2010), who based on CLIMEX modeling, reported that P. solenopsis represents significant threat to agriculture and horticulture in most of the tropical and subtropical countries in the world.
The species distribution model developed with Maxent can be used to forecast the potential changes in the distribution and activity of P. solenopsis in response to global climate warming. The predictions made in this study will be of great help in developing effective management strategies for this destructive and polyphagous pest of cotton, vegetables and ornamentals of economic importance under Indian conditions. More specifically, such predictions will facilitate better preparedness to combat outbreaks of serious insect pests well in advance.
Acknowledgments
This study is a part of research project entitled “Abiotic stresses affecting crop-insect pest interactions in the context of global climate change (Project Code-IXX08575)” of National Institute of Abiotic Stress Management, Baramati, funded by ICAR, New Delhi. We are thankful to the Director, NIASM for providing all the necessary facilities and extending his cooperation and support to carry out the present investigations. Dr. DVK Nageshwara Rao, Senior Scientist (Soil Chemistry), Dr. SV Ghadge, Senior Scientist (Agril. Engineering), and Dr.
9Phenacoccus solenopsis habitat distribution model

mesta. JaF News, 7, 27 (2009). Scheldeman, X. and M. van Zonneveld: Training manual on spatial
analysis of plant diversity and distribution (Bioversity International, Rome, Italy), p. 179 (2010).
Sharma, A. and P.K. Pati: First record of Ashwagandha as a new host to the invasive mealybug (Phenacoccus solenopsis Tinsley) in India. Entomol. News, 123, 59-62 (2013).
Suresh, S.R., P. Jothimani, P. Sivasubramanian, R. Karuppuchamy, Samiyappan and E.I. Jonathan: Invasive mealybugs of Tamil Nadu and their management. Karnataka J. Agric. Sci., 23, 6-9 (2010).
Tanwar, R.K., V.K. Bhamare, V.V. Ramamurthy, M. Hayat, P. Jeyakumar, A. Singh and O.M. Bambawale: Record of new parasitoids on mealy bug, Phenacoccus solenopsis. Indian J. Entomol., 70, 404-405 (2008).
Tanwar, R.K., P. Jeyakumar, A. Singh, A.A. Jafri and O.M. Bambawale: Survey for cotton mealybug, Phenacoccus solenopsis (Tinsley) and its natural enemies. J. Env. Biol., 32, 381-384 (2011).
Vennila, S., V.V., Ramamurthy, A. Deshmukh, D.B. Pinjarkar, M. Agarwal, P.C. Pagar, Y.G. Prasad, M. Prabhakar, K.R. Kranthi and O.M. Bambawale: A treatise on mealybugs of Central Indian cotton production system. Technical Bulletin no. 24 (National Centre for Integrated Pest Management, New Delhi, p. 39 (2010).
Verma, J.R., D.S. Bhati, Srivastav, S. Jasuja, B.S. Siddhu and V. Singh: Survey and surveillance of Parthenium hysterophorus as a major alternate host of cotton mealy bug in Rajasthan. World cotton research conference on technologies for prosperity, Renaissance Convention Centre, Mumbai, pp. 139 (2011).
Wang, Y., G.W. Watson and R. Zhang: The potential distribution of an invasive mealybug Phenacoccus solenopsis and its threat to cotton in Asia. Agric. Fores. Entomol., 12, 403–416 (2010).
Pradesh), pp. 39 (2009).Jhala, R.C., T.M. Bharpoda and M.G. Patel: Phenacoccus solenopsis
(Hemiptera: Pseudococcidae), the mealybug species recorded first time on cotton and its alternate host plants in Gujarat, India. Uttar Pradesh J. Zool., 28, 403-406 (2008).
Liebhold, A.M., R.E. Rossi and W.P. Kemp: Geostatistics and Geographic Information Systems in Applied Insect Ecology. Annual Rev. Entomol., 38, 303-327 (1993).
Manel, S., H.C. Williams and S.J. Ormerod: Evaluating presence–absence models in ecology: The need to account for prevalence. J. Appl. Ecol., 38, 92-931 (2001).
Nagrare, V.S., S. Kranthi, V.K. Biradar, N.N. Zade, V. Sangode, G. Kakde, R.M. Shukla, D. Shivare, B.M. Khadi and K.R. Kranthi: Widespread infestation of the exotic mealybug species, Phenacoccus solenopsis Tinsley (Hemiptera: Pseudococcidae), on cotton in India. Bull. Entomol. Res., 99, 537–541 (2009).
Pala, R. and R.K. Saini: Biological control of solenopsis mealybug, Phenacoccus solenopsis Tinsley on cotton: A typical example of fortuitous biological control. J. Biol. Cont., 24, 104–109 (2010).
Phillips, S.J., R.P. Anderson and R.E. Schapire: Maximum entropy modeling of species geographic distributions. Ecol. Modell., 190, 231-259 (2006).
Saroja, D.G.M., Y.G. Prasad and S. Dixit: Incidence of mealybug, Phenacoccus solenopsis Tinsley and its parasitoids on cotton. In: Proceedings of the National Symposium on IPM Strategies to combat emerging pests in the current scenario of Climate Change (College of Horticulture and Forestry, Central Agricultural University, Pashighat, Arunachal Pradesh), p. 42, (2009).
Satpathy, S., T. Ramasubrahmanyam and S.K. Laha: First report of cotton mealybug (Phenacoccus solenopsis Tinsley) on jute and
10 B.B. Fand et al.
Copyright © 2022 FDOKUMEN