Sociogenomics of Cooperation and Conflict during Colony Founding in the Fire Ant Solenopsis invicta
15
Sociogenomics of Cooperation and Conflict during Colony Founding in the Fire Ant Solenopsis invicta Fabio Manfredini 1 *, Oksana Riba-Grognuz 2 , Yannick Wurm 2¤ , Laurent Keller 2 , DeWayne Shoemaker 3 , Christina M. Grozinger 1 1 Department of Entomology, Center for Pollinator Research and the Huck Institutes of the Life Sciences, Pennsylvania State University, University Park, Pennsylvania, United States of America, 2 Department of Ecology & Evolution, University of Lausanne, Lausanne, Switzerland, 3 USDA-ARS, Gainesville, Florida, United States of America Abstract One of the fundamental questions in biology is how cooperative and altruistic behaviors evolved. The majority of studies seeking to identify the genes regulating these behaviors have been performed in systems where behavioral and physiological differences are relatively fixed, such as in the honey bee. During colony founding in the monogyne (one queen per colony) social form of the fire ant Solenopsis invicta, newly-mated queens may start new colonies either individually (haplometrosis) or in groups (pleometrosis). However, only one queen (the ‘‘winner’’) in pleometrotic associations survives and takes the lead of the young colony while the others (the ‘‘losers’’) are executed. Thus, colony founding in fire ants provides an excellent system in which to examine the genes underpinning cooperative behavior and how the social environment shapes the expression of these genes. We developed a new whole genome microarray platform for S. invicta to characterize the gene expression patterns associated with colony founding behavior. First, we compared haplometrotic queens, pleometrotic winners and pleometrotic losers. Second, we manipulated pleometrotic couples in order to switch or maintain the social ranks of the two cofoundresses. Haplometrotic and pleometrotic queens differed in the expression of genes involved in stress response, aging, immunity, reproduction and lipid biosynthesis. Smaller sets of genes were differentially expressed between winners and losers. In the second experiment, switching social rank had a much greater impact on gene expression patterns than the initial/final rank. Expression differences for several candidate genes involved in key biological processes were confirmed using qRT-PCR. Our findings indicate that, in S. invicta, social environment plays a major role in the determination of the patterns of gene expression, while the queen’s physiological state is secondary. These results highlight the powerful influence of social environment on regulation of the genomic state, physiology and ultimately, social behavior of animals. Citation: Manfredini F, Riba-Grognuz O, Wurm Y, Keller L, Shoemaker D, et al. (2013) Sociogenomics of Cooperation and Conflict during Colony Founding in the Fire Ant Solenopsis invicta. PLoS Genet 9(8): e1003633. doi:10.1371/journal.pgen.1003633 Editor: Neil Durie Tsutsui, University of California-Berkeley, United States of America Received February 21, 2013; Accepted May 30, 2013; Published August 8, 2013 This is an open-access article, free of all copyright, and may be freely reproduced, distributed, transmitted, modified, built upon, or otherwise used by anyone for any lawful purpose. The work is made available under the Creative Commons CC0 public domain dedication. Funding: This study was funded by US Department of Agriculture AFRI Award 2009-35302-05301 to DS and CMG. The funders had no role in study design, data collection and analysis, decision to publish, or preparation of the manuscript. Competing Interests: The authors have declared that no competing interests exist. * E-mail: [email protected] ¤ Current address: School of Biological and Chemical Sciences, Queen Mary University of London, London, United Kingdom. Introduction Behavior is a complex phenotypic trait, which results from the interactions of multiple intrinsic and extrinsic factors that associate in a nonlinear, often unpredictable fashion [1]. Intrinsic factors include the genetics, the physiology or the phenotype of an organism, while the most typical extrinsic factor is the external environment. In social systems like insect societies, environmental cues primarily are the result of the social environment, i.e. the nature and patterns of interactions among individuals within the colony [2]. The ‘‘nature-versus-nurture’’ debate has long been the major driver of the discussion as to whether internal state of an animal or the external environment (e.g., the social environment) regulates gene expression more [3]. Regardless, extrinsic and intrinsic factors clearly are reciprocally interconnected: the social environment influences the neurogenomic state of the animal, which is responsible for the social behavior performed [4,5]. A hallmark of advanced social behavior is altruistic behavior, which is achieved through a reproductive division of labor in which few individuals develop into the reproductive caste while most of the colony members become non-reproductive workers and perform all tasks related to colony maintenance and growth. Both fixed (developmental pathways) and plastic (behavioral strategies) factors contribute to this division of labor (reviewed in [6]). Consequently, there has been great interest in studying genes and biological processes that regulate the reproductive and worker divisions of labor [7]. In the advanced eusocial systems examined thus far, differences between queens and workers are largely the result of developmental factors, while differences among workers are often triggered by social signals [8]. However, primitively social systems display reproductive division of labor between females that are anatomically, physiologically and genetically very similar and this reproductive division of labor seems to be primarily established and maintained by social environment. The genes underlying this process have not yet been examined, and potentially may function as core genes associated with sociality. Variation in colony founding among ant queens is an ideal model to examine the interplay between genes and social PLOS Genetics | www.plosgenetics.org 1 August 2013 | Volume 9 | Issue 8 | e1003633
Transcript of Sociogenomics of Cooperation and Conflict during Colony Founding in the Fire Ant Solenopsis invicta

Sociogenomics of Cooperation and Conflict duringColony Founding in the Fire Ant Solenopsis invictaFabio Manfredini1*, Oksana Riba-Grognuz2, Yannick Wurm2¤, Laurent Keller2, DeWayne Shoemaker3,
Christina M. Grozinger1
1 Department of Entomology, Center for Pollinator Research and the Huck Institutes of the Life Sciences, Pennsylvania State University, University Park, Pennsylvania,
United States of America, 2 Department of Ecology & Evolution, University of Lausanne, Lausanne, Switzerland, 3 USDA-ARS, Gainesville, Florida, United States of America
Abstract
One of the fundamental questions in biology is how cooperative and altruistic behaviors evolved. The majority of studiesseeking to identify the genes regulating these behaviors have been performed in systems where behavioral andphysiological differences are relatively fixed, such as in the honey bee. During colony founding in the monogyne (onequeen per colony) social form of the fire ant Solenopsis invicta, newly-mated queens may start new colonies eitherindividually (haplometrosis) or in groups (pleometrosis). However, only one queen (the ‘‘winner’’) in pleometroticassociations survives and takes the lead of the young colony while the others (the ‘‘losers’’) are executed. Thus, colonyfounding in fire ants provides an excellent system in which to examine the genes underpinning cooperative behavior andhow the social environment shapes the expression of these genes. We developed a new whole genome microarray platformfor S. invicta to characterize the gene expression patterns associated with colony founding behavior. First, we comparedhaplometrotic queens, pleometrotic winners and pleometrotic losers. Second, we manipulated pleometrotic couples inorder to switch or maintain the social ranks of the two cofoundresses. Haplometrotic and pleometrotic queens differed inthe expression of genes involved in stress response, aging, immunity, reproduction and lipid biosynthesis. Smaller sets ofgenes were differentially expressed between winners and losers. In the second experiment, switching social rank had amuch greater impact on gene expression patterns than the initial/final rank. Expression differences for several candidategenes involved in key biological processes were confirmed using qRT-PCR. Our findings indicate that, in S. invicta, socialenvironment plays a major role in the determination of the patterns of gene expression, while the queen’s physiologicalstate is secondary. These results highlight the powerful influence of social environment on regulation of the genomic state,physiology and ultimately, social behavior of animals.
Citation: Manfredini F, Riba-Grognuz O, Wurm Y, Keller L, Shoemaker D, et al. (2013) Sociogenomics of Cooperation and Conflict during Colony Founding in theFire Ant Solenopsis invicta. PLoS Genet 9(8): e1003633. doi:10.1371/journal.pgen.1003633
Editor: Neil Durie Tsutsui, University of California-Berkeley, United States of America
Received February 21, 2013; Accepted May 30, 2013; Published August 8, 2013
This is an open-access article, free of all copyright, and may be freely reproduced, distributed, transmitted, modified, built upon, or otherwise used by anyone forany lawful purpose. The work is made available under the Creative Commons CC0 public domain dedication.
Funding: This study was funded by US Department of Agriculture AFRI Award 2009-35302-05301 to DS and CMG. The funders had no role in study design, datacollection and analysis, decision to publish, or preparation of the manuscript.
Competing Interests: The authors have declared that no competing interests exist.
* E-mail: [email protected]
¤ Current address: School of Biological and Chemical Sciences, Queen Mary University of London, London, United Kingdom.
Introduction
Behavior is a complex phenotypic trait, which results from the
interactions of multiple intrinsic and extrinsic factors that associate
in a nonlinear, often unpredictable fashion [1]. Intrinsic factors
include the genetics, the physiology or the phenotype of an
organism, while the most typical extrinsic factor is the external
environment. In social systems like insect societies, environmental
cues primarily are the result of the social environment, i.e. the
nature and patterns of interactions among individuals within the
colony [2]. The ‘‘nature-versus-nurture’’ debate has long been the
major driver of the discussion as to whether internal state of an
animal or the external environment (e.g., the social environment)
regulates gene expression more [3]. Regardless, extrinsic and
intrinsic factors clearly are reciprocally interconnected: the social
environment influences the neurogenomic state of the animal,
which is responsible for the social behavior performed [4,5]. A
hallmark of advanced social behavior is altruistic behavior, which
is achieved through a reproductive division of labor in which few
individuals develop into the reproductive caste while most of the
colony members become non-reproductive workers and perform
all tasks related to colony maintenance and growth. Both fixed
(developmental pathways) and plastic (behavioral strategies) factors
contribute to this division of labor (reviewed in [6]). Consequently,
there has been great interest in studying genes and biological
processes that regulate the reproductive and worker divisions of
labor [7]. In the advanced eusocial systems examined thus far,
differences between queens and workers are largely the result of
developmental factors, while differences among workers are often
triggered by social signals [8]. However, primitively social systems
display reproductive division of labor between females that are
anatomically, physiologically and genetically very similar and this
reproductive division of labor seems to be primarily established
and maintained by social environment. The genes underlying this
process have not yet been examined, and potentially may function
as core genes associated with sociality.
Variation in colony founding among ant queens is an ideal
model to examine the interplay between genes and social
PLOS Genetics | www.plosgenetics.org 1 August 2013 | Volume 9 | Issue 8 | e1003633
environment that has shaped the evolution of cooperative
behavior in primitively social systems. Colony founding can occur
in two modalities: haplometrosis, where a single queen indepen-
dently starts a new colony, and pleometrosis, where multiple
queens associate and cooperate to start a new colony [9].
Pleometrosis is a fascinating example of cooperative behavior that
is not fostered by kin selection, because these groups often
comprise unrelated individuals (reviewed [10]). Among social
insects, pleometrosis exists in halictine bees [11], termites [12],
paper wasps [13,14,15] and in several species of ants [8]. In ants,
pleometrosis is known to be associated with division of labor in the
leaf-cutter ant Acromyrmex versicolor [16] and in the harvester ant
Pogonomyrmex californicus [17]. Pleometrotic associations produce a
complex social environment, where individuals simultaneously are
in cooperation and conflict, and social and reproductive domi-
nance hierarchies are established. These associations represent
relatively primitive social systems in which individuals with
equivalent anatomical and physiological features develop a
division of labor through their behavioral interactions. Thus,
identification of the genes underlying establishment of these
hierarchies will not only provide insight into the effects of social
environment on an individual, but also into the evolution of social
behavior.
The red imported fire ant Solenopsis invicta is an excellent system
for studying the genes associated with haplometrotic and
pleometrotic behaviors, because queens from the monogyne social
form (characterized by a single egg-laying queen per nest once
established) can adopt either approach for colony founding
depending on multiple factors, e.g. the density of newly mated
queens in nesting sites [18]. However, monogyne fire ants
ultimately only tolerate a single reproductive queen such that
the initial cooperation among unrelated pleometrotic cofoun-
dresses slowly transitions to competition and rivalry, which will
inevitably produce only one winner and one or multiple losers
[19,20,21]. Once the first workers emerge, pleometrotic queens
engage in open fights where they injure or kill rival cofoundresses
and workers actively participate in this process until all the queens
are executed but one (see Movie S1). In both haplometrosis and
pleometrosis, founding queens initially face a critical period
(claustral period) where they are sealed in their nest and must
defend it from enemies and competitors, e.g. other fire ant colonies
that populate the same area [22,23]. During the claustral period,
fire ant queens rely exclusively on their body mass reserves to
produce the first generation of workers. There are physiological
and behavioral differences between haplometrotic queens, pleo-
metrotic ‘‘winners’’ and pleometrotic ‘‘losers’’. Haplometrotic
queens lose more weight during the claustral period, and produce
more brood per individual than queens in pleometrotic associa-
tions [24,25]. In pleometrotic associations, winners tend to have
larger head size, lose less weight [20,21,26] and occupy the top of
the brood pile while losers are usually found outside the nest
chamber [19], attempting to avoid any interaction with the winner
or with workers. However, nothing is known about the genes and
molecular pathways that underlie these processes.
We performed two separate experiments to characterize the
genomic basis for haplometrotic and pleometrotic founding
behavior in fire ants. We developed a microarray platform using
the official gene set of the fire ant genome [27] plus a set of ESTs
obtained from assemblies of the fire ant transcriptome to examine
genome-wide expression patterns across founding queens. In the
first experiment, we compared whole body gene expression
patterns among haplometrotic queens and paired pleometrotic
winners and losers that were collected shortly after emergence of
the first workers (but prior to execution of the loser). We predicted
that haplometrotic queens would be more similar to pleometrotic
winners than to pleometrotic losers, because they both will serve as
the single queen for the mature colony. For the comparison
between winners and losers alone, our expectations were less well-
defined: on one hand, we expected to find substantial differences
given that their physiology, behavior and fate differ significantly,
but on the other hand, winners and losers are not anatomically
distinct and there is only weak correlation between morphological
measures and outcome of the conflict [20]. In the second
experiment, we manipulated queen rank in pleometrotic pairs to
determine how changing social rank and social environment
would affect an individual’s gene expression patterns. This was
accomplished by pairing pleometrotic queens with a new partner
at the end of the claustral period in order to switch putative
winners to losers and vice-versa. Controls in which partners were
altered (and social environment was changed) but social rank
remained the same were also included. We hypothesized that final
social rank would be the primary regulator of gene expression
patterns. However, for both experiments our results indicated that
social environment (pleiometrosis vs. haplometrosis, switched rank
vs. maintained rank) was a much greater driver of gene expression
changes than social rank itself, suggesting that social environment,
and not reproductive state, is a key regulator of gene expression,
physiology and ultimately, behavior.
Results
Experiment 1: Effect of social environment and socialrank on global gene expression patterns
Haplometrotic queens (haplo) and paired pleometrotic winners
(win) and losers (los) were collected shortly after emergence of the
first workers (see methods, N = 8 haplo, 8 win and 8 los).
Microarray analysis of gene expression patterns (see Methods for
design and validation of microarrays) in whole bodies of these
queens revealed that 4080 of the 9388 transcripts included in the
analysis were differentially regulated at FDR,0.001 (Table S1). A
principal components analysis (PCA) of the differentially regulated
Author Summary
The characterization of the genomic basis for complexbehaviors is one of the major goals of biological research.The genomic state of an individual results from theinterplay between its internal condition (the ‘‘nature’’) andthe external environment (the ‘‘nurture’’), which mayinclude the social environment. Colony founding in thefire ant Solenopsis invicta is a complex process that servesas a useful model for investigating how the interplaybetween genes and social environment shapes socialbehavior. Unrelated, newly mated S. invicta queens maystart a new colony as a group, but ultimately only onequeen will survive and gain full reproductive dominance.By uncovering the genetic basis for founding behavior infire ants we therefore provide useful insights into howcooperative behavior evolved in a context that might beconsidered primitively eusocial, because newly matedqueens in a founding association are morphologically,physiologically and genetically very similar and display noevident division of labor. Our results suggest that socialenvironment (founding singly or in pairs, switchingdominance rank vs. maintaining rank) is a much greaterdriver of gene expression changes than social rank itself,suggesting that social environment, and not reproductivestate, is a key regulator of gene expression, physiology andultimately, behavior.
Genomics of Colony Founding in Fire Ants
PLOS Genetics | www.plosgenetics.org 2 August 2013 | Volume 9 | Issue 8 | e1003633

Figure 1. Analyses of global gene expression between haplometrotic and pleometrotic queens. A) Principal Component Analysis of 4080significantly differentially regulated transcripts. Two PCAs were identified corresponding to the effect of social environment (single queen vs. pairedqueens, 91.8%) and social rank (winner vs. loser, 8.2%). B) Pairwise comparisons of 4080 significantly differentially regulated transcripts. A total of3192 transcripts were different between haplometrotic and pleometrotic queens, while only 43 transcripts were different between winner and losers.Haplometrotic queens were more similar to pleometrotic winners than to pleometrotic losers: more transcripts were differentially regulated in haplo
Genomics of Colony Founding in Fire Ants
PLOS Genetics | www.plosgenetics.org 3 August 2013 | Volume 9 | Issue 8 | e1003633

transcripts revealed that the social environment is more important
than social rank in driving the patterns of gene expression in
founding queens (Figure 1A). Differences between haplometrotic
and pleometrotic queens accounted for 91.8% of the variation in
gene expression while differences between win and los accounted
for only 8.2%. Pairwise comparisons of transcripts differentially
regulated (FDR,0.001) among the three groups of fire ant queens
demonstrated that expression patterns in haplo are more similar to
win than to los, since there are fewer genes differentially regulated
uniquely between haplo and win (404) than haplo and los (477;
Nominal Logistic Fit: df = 1, ChiSquare = 6.78, P = 0.0092;
Figure 1B).
We performed Gene Ontology analysis on the 3003 differen-
tially regulated transcripts (out of the initial pool of 4080) that have
Drosophila orthologs with FlyBase annotations using DAVID
[28,29]. 517 GO terms were significantly enriched at a p-
value,0.05 (Functional Annotation Chart, see Table S2 for the
complete list of GO terms). Additionally, 6 KEGG molecular
pathways (Kyoto Encyclopedia of Genes and Genomes, [30]) were
significantly enriched (P,0.05): aminoacyl-tRNA biosynthesis,
basal transcription factors, dorso-ventral axis formation, endocy-
tosis, RNA degradation and ubiquitin mediated proteolysis (Table
S2). To cluster the GO categories into larger functional groups,
the 517 significantly enriched GO terms were mapped to the
GO_slim2 file in CateGOrizer [31]: 440 GO terms were assigned
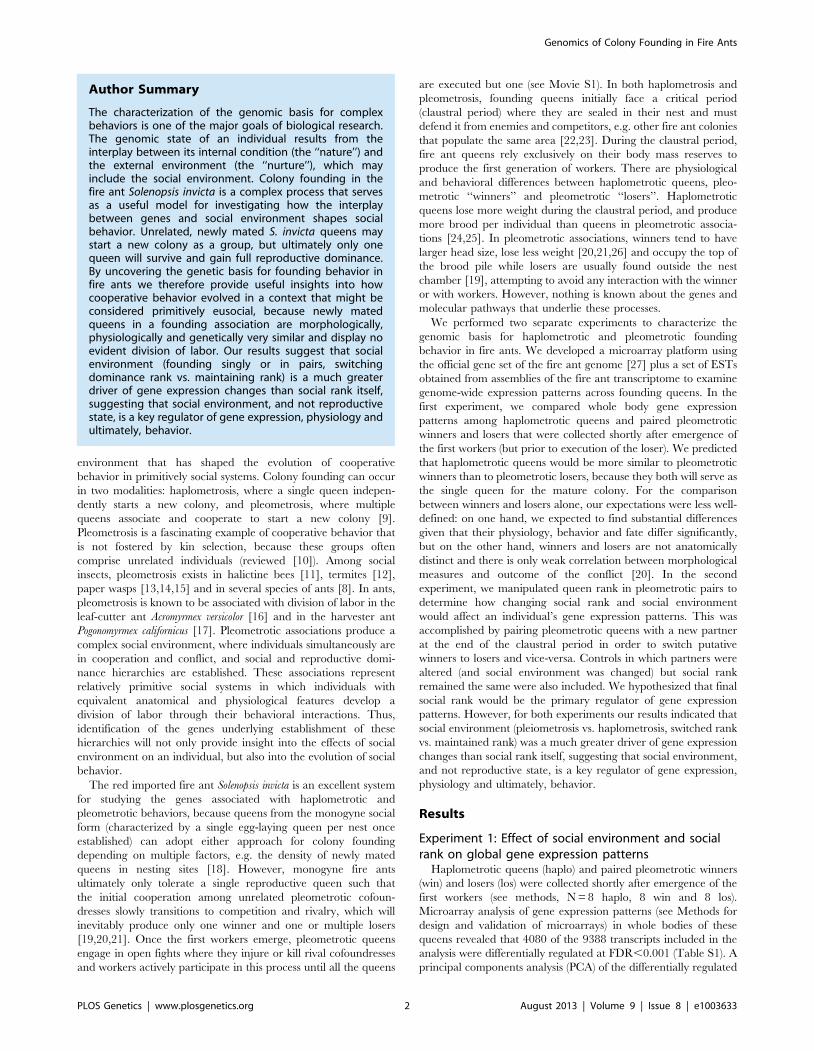
to one of the ancestor terms by single count (Figure 2). The
functional groups containing the greatest number of GO terms
were metabolism (19% of the significantly enriched GO terms),
cell organization and biogenesis (11%) and development (10%; for
a complete list of all ancestor terms represented in this analysis see
Table S3).
To further characterize the genes that were differentially
regulated between haplo and pleometrotic queens (pleo), we
examined the overlapping set of 3192 transcripts (of which 2541
had Drosophila orthologs with FlyBase annotations) that were
differentially regulated between both haplo vs. win and haplo vs.
los (Figure 1B). For clearer graphical presentation, we used k-
means Clustering in GENESIS [32] to separate these transcripts
into two large clusters according to expression patterns: 2280
transcripts that were upregulated in haplo and downregulated in
pleo (cluster 1, Figure S1) and 912 transcripts downregulated in
haplo and upregulated in pleo (cluster 2, Figure S2). We
performed GO analysis on both groups, using Functional
Annotation Clustering with medium stringency. For cluster 1
(1925 FlyBase matches), we obtained 88 significantly enriched
GO terms (see Table S4; P,0.05) and 1 KEGG pathway (basal
transcription factors, P = 0.01). Several of the GO terms were
related to aging (determination of adult life span, death),
immunity (immune system development, JNK cascade, hemo-
poiesis), reproduction (reproductive developmental process,
oocyte development, eggshell formation, morphogenesis of
follicular epithelium, regulation of oocyte development), re-
sponse to stimuli (response to stress, regulation of response to
stimulus, negative regulation of response to stimulus, response to
ecdysone), lipid biosynthetic process, locomotion and neurolog-
ical system processes (neurotransmitter secretion, neurogenesis,
central nervous system development, regulation of nervous
system development). In cluster 2 (616 FlyBase matches), 34
GO terms (Table S5, P,0.05) and 1 KEGG pathway
(glycerophospholipid metabolism, P = 0.01) were significantly
enriched. Many GO terms were similar to those in cluster 1,
and included determination of adult life span, olfactory behavior,
lipid metabolic process, detection of light stimulus, as well as
several related to morphogenesis or development of organs and
apparatuses like sensory organ, muscle, limb, wing disc, gut and
respiratory system.
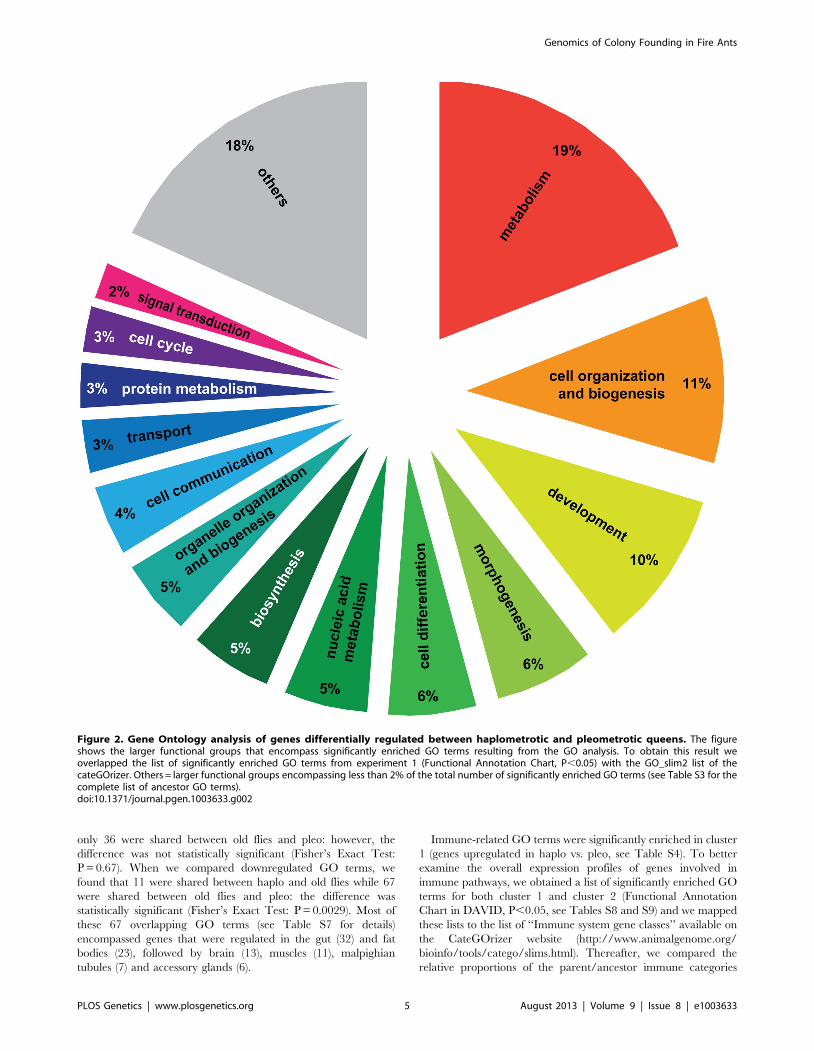
Interestingly, only 43 transcripts were differentially regulated
between win and los queens. A GO analysis performed on this
small set of transcripts revealed that fatty acid and hormone
metabolic processes were significantly enriched GO terms
(Functional Annotation Clustering, P,0.001 and P,0.01, respec-
tively, Table S6). Several transcripts in this group have interesting
functions (Table 1). Transcripts upregulated in win included: G
protein-coupled receptor kinase 2 (Gprk2), which is involved in the Toll
signaling pathway during the response against Gram positive
bacteria [33]; endosulfine (endos), which functions in the insulin-
signaling pathway during oogenesis [34]; Pheromone-binding protein-
related protein 3 (Pbprp3), a member of the odorant binding proteins
responsible for chemoreception [35]; and bubblegum (bgm), which is
involved in the metabolism of very long-chain fatty acids and
prevents neurodegeneration [36]. Transcripts upregulated in los
relative to win included: I’m not dead yet (Indy), associated with aging
[37]; pale (ple), which plays a role in the response to wounding [38]
and in the metabolism of dopamine [39]; desat1, a major regulator
of cuticular hydrocarbon biosynthesis involved in pheromone
emission and detection [40]; and juvenile hormone acid methyltransferase
(jhamt), a key enzyme in the biosynthesis of JH, the major
endocrine regulator in insects [41].
Experiment 1: Candidate gene pathwaysGO categories related to aging and longevity were significantly
enriched in sets of transcripts that were differentially regulated in
haplo vs. pleo (clusters 1 and 2; see Tables S4 and S5). Out of the
129 genes included in the Drosophila aging GO term, oligos
representing 93 putative orthologs were present on the fire ant
microarray. Of these, 90 were expressed at high enough levels to
be included in the microarray analysis and 46 were significantly
differentially regulated across the three groups of queens
(Figure 3A). The majority of these genes (34) were upregulated
in haplo: this number was significantly higher than expected by
chance (Nominal Logistic Fit: df = 2, ChiSquare = 29.58,
P,0.0001). In addition to their role in regulating aging pathways
in Drosophila, several genes in this group have been linked to queen
vs. worker caste differentiation and behavioral maturation in
honey bees [42]. These include: forkhead box (foxo) and target of
rapamycin (TOR), two major players in the insulin-signaling
pathway which is associated to caste determination in honey bees
[43] and to the workers’ transition from nursing to foraging
behavior [44,45], and Peroxiredoxin 5037 (Prx3), which is associated
with enhanced learning ability when expressed at higher levels in
honey bee workers [46].
To further investigate the patterns of expression of aging genes
in haplo and pleo queens, we compared our study to a study on
aging in Drosophila [47]. In this study, which was aimed at
investigating the temporal and spatial (tissue-specific) transcrip-
tional profiles in Drosophila, the authors listed all the age-related
GO terms that were significantly enriched and classified them
based on the tissue where they were expressed and on their
directional expression. We found that 106 GO terms were
upregulated in fire ant haplo queens and old Drosophila, while
vs. los than in haplo vs. win (477 and 404, respectively): this difference was statistically significant (Nominal Logistic Fit: df = 1, ChiSquare = 6.78,P = 0.0092). haplo = haplometrotic queens; los = pleometrotic losers; win = pleometrotic winners.doi:10.1371/journal.pgen.1003633.g001
Genomics of Colony Founding in Fire Ants
PLOS Genetics | www.plosgenetics.org 4 August 2013 | Volume 9 | Issue 8 | e1003633
only 36 were shared between old flies and pleo: however, the
difference was not statistically significant (Fisher’s Exact Test:
P = 0.67). When we compared downregulated GO terms, we
found that 11 were shared between haplo and old flies while 67
were shared between old flies and pleo: the difference was
statistically significant (Fisher’s Exact Test: P = 0.0029). Most of
these 67 overlapping GO terms (see Table S7 for details)
encompassed genes that were regulated in the gut (32) and fat
bodies (23), followed by brain (13), muscles (11), malpighian
tubules (7) and accessory glands (6).
Immune-related GO terms were significantly enriched in cluster
1 (genes upregulated in haplo vs. pleo, see Table S4). To better
examine the overall expression profiles of genes involved in
immune pathways, we obtained a list of significantly enriched GO
terms for both cluster 1 and cluster 2 (Functional Annotation
Chart in DAVID, P,0.05, see Tables S8 and S9) and we mapped
these lists to the list of ‘‘Immune system gene classes’’ available on
the CateGOrizer website (http://www.animalgenome.org/
bioinfo/tools/catego/slims.html). Thereafter, we compared the
relative proportions of the parent/ancestor immune categories
Figure 2. Gene Ontology analysis of genes differentially regulated between haplometrotic and pleometrotic queens. The figureshows the larger functional groups that encompass significantly enriched GO terms resulting from the GO analysis. To obtain this result weoverlapped the list of significantly enriched GO terms from experiment 1 (Functional Annotation Chart, P,0.05) with the GO_slim2 list of thecateGOrizer. Others = larger functional groups encompassing less than 2% of the total number of significantly enriched GO terms (see Table S3 for thecomplete list of ancestor GO terms).doi:10.1371/journal.pgen.1003633.g002
Genomics of Colony Founding in Fire Ants
PLOS Genetics | www.plosgenetics.org 5 August 2013 | Volume 9 | Issue 8 | e1003633
between the two groups (Figure 4). This analysis confirmed a
significant overrepresentation of immune-related classes in cluster
1 relative to cluster 2 (Nominal Logistic Fit: df = 1, ChiS-
quare = 61.16, P,0.0001), clearly visible in terms of total number
of immune categories present and number of GO terms within
common categories. These results suggest that haplometrotic
queens overall have higher expression levels of immune-related
genes and therefore may be better equipped in terms of immune
response.
Next, we examined the expression of the fire ant orthologs of the
177 canonical immune-related genes annotated in honey bees
[48]. Orthologs for 83 of these genes were included in our array;
82 were expressed at high enough levels to be included in the
analysis, and 34 were within our list of 3003 significantly
differentially regulated transcripts (Figure 3B). Expression levels
of these genes are not strongly coordinated, with similar numbers
of up- vs. downregulated genes in haplo vs. pleo queens. Several
genes in the Immune-deficiency (IMD) pathway were differentially
regulated, including Inhibitor of apoptosis 2 (Iap2), TGF-beta activated
kinase 1 (Tak1), immune deficiency (imd), bendless (ben) and Death related
ced-3/Nedd2-like protein (Dredd). Furthermore, several members of
the Immunoglobulin (IG) Superfamily were differentially regulat-
ed, including bent (bt), turtle (tutl), sidekick (sdk) and Down syndrome cell
adhesion molecule (Dscam).
Experiment 1: Validation of candidate gene expressionlevels using quantitative real-time PCR
We examined gene expression levels of candidate genes that
were included in one or more GO terms that were significantly
enriched in our GO analyses (Figure S3 and Table S10).
Expression patterns of all 13 candidate genes were consistent with
what observed for haplo and los in the arrays, and these expression
differences were significant for 11 genes. We validated Indy and
Sod2 for determination of adult life span. In the arrays, Indy was
downregulated in haplo and Sod2 was upregulated in haplo: qRT-
PCR analysis confirmed these trends and the difference between
groups was statistically significant for both genes (P,0.001). For
immune response, we validated Dredd and kay, which were both
upregulated in haplo in the arrays: qRT-PCR analysis confirmed
this trend and the difference between the two groups of queens was
statistically significant for kay (P,0.05) but not for Dredd (P = 0.29).
Desat1, ifc and putative fatty acyl-CoA reductase CG5065 were analyzed
for their involvement in the synthesis and metabolism of fatty
acids. In the arrays, desat1 and putative fatty acyl-CoA reductase
CG5065 were downregulated in haplo while ifc was upregulated in
haplo: these trends were confirmed by qRT-PCR analysis and the
difference in the expression levels was statistically significant for
putative fatty acyl-CoA reductase CG5065 (P,0.001) and ifc (P,0.05)
but not for desat1 (P = 0.11). Reproductive genes included br and
Btk29A, both upregulated in haplo in the arrays: this was
confirmed by qRT-PCR (P,0.001). We validated Sema-5c and
Mer because they play a role in olfactory behavior: these genes
were downregulated in haplo in the arrays and in the qRT-PCR
analysis (P,0.001 and P,0.05, respectively). Finally, we analyzed
fru for aggressive behavior and woc for neurogenesis: these genes
were upregulated in haplo in the arrays and in the qRT-PCR
analysis (P,0.05 and P,0.001, respectively).
Experiment 2: Effect of the manipulation of social rank ongene expression patterns
We further examined the role of social rank on gene expression
patterns by manipulating social rank of individuals in pleometrotic
pairs. We swapped winners and losers between groups to generate
four groups of queens: winners switched to losers (win/los), losers
switched to winners (los/win), continuing winners (win/win) and
continuing losers (los/los). Very few transcripts were differentially
regulated among these groups, with a total of 616 transcripts at a
relatively low significant threshold (FDR,0.1, see Table S11 for a
listing of these transcripts). Principal components analysis demon-
strated that 48% of the variation in gene expression was associated
with switching social rank (win/los and los/win were clustered
relative to win/win and los/los), 37% of the variation was
associated with the final rank (i.e., win/los and los/los were
clustered), while 15% was associated with the initial rank (i.e. win/
win and win/los were clustered; Figure 5).
We performed GO analysis with Functional Annotation
Clustering on the 527 differentially regulated transcripts that have
Drosophila orthologs with FlyBase annotations. 21 GO terms were
Table 1. Patterns of expression of the most relevant transcripts that were differentially regulated between winners and losers inexperiment 1 (P,0.001).
Sinv_gene Dmel_orthologs GO_terms winner loser
SINVlc3_024097 G protein-coupled receptor kinase 2 vitellogenesis; defense response to Gram-positive bacterium up Q
SINVlc3_031722 endosulfine response to nutrient; water homeostasis; oogenesis up Q
SINVlc3_008488 Probable cytochrome P450 4ac1 oxidation reduction; monooxygenase activity up Q
SI2.2.0_13106 Cytochrome P450-4c3 electron carrier activity; oxidoreductase activity up Q
SI2.2.0_06972 Pheromone-binding protein-related protein 3 odorant binding up Q
SINVlc3_031713 bubblegum long-chain fatty acid metabolic process up Q
SI2.2.0_03032 I’m not dead yet determination of adult lifespan Q up
SINVlc3_027280 pale adult locomotory behavior; dopamine metabolic process;response to wounding
Q up
SI2.2.0_08208 Loquacious central nervous system development Q up
SI2.2.0_00216 desat1 pheromone/cuticle hydrocarbon/fatty acid biosyntheticprocesses
Q up
SI2.2.0_14785 Probable phosphomevalonate kinase cholesterol biosynthetic process Q up
SINVlc3_042741 juvenile hormone acid methyltransferase juvenile hormone biosynthetic process; methylation Q up
doi:10.1371/journal.pgen.1003633.t001
Genomics of Colony Founding in Fire Ants
PLOS Genetics | www.plosgenetics.org 6 August 2013 | Volume 9 | Issue 8 | e1003633

-1.0 1.01:1
haplometrotic
winner
loser
winner
loser
haplometrotic
Myb-interacting protein 120malelesscarmineMitogen-activated protein kinase 14BBtk family kinase at 29ARPS6-p70-protein kinaseDmel_CG3810Dmel_CG6284Dmel_CG6147garnet
*Superoxide dismutase 2 (Mn)rubycarnationDmel_CG7334Peroxiredoxin 5037lethal (3) neo 18UDP-GlcNAc:a-3-D-mannoside-beta-1
*hemipterous^methuselah-like 10^Ecdysone receptorDmel_CG6666short neuropeptide F precursor
*Superoxide dismutase [Cu-Zn]Autophagy-specific gene 8a
*forkhead box^Target of rapamycin
Autophagy-specific gene 7PhosphoribosylamidotransferaseDmel_CG9172deep orangeDmel_CG5603gigasDmel_CG11546Dmel_CG7217tamasHistone deacetylase Rpd3
*Vacuolar H[+]-ATPase SFD subunitExcitatory amino acid transporter 1light
*Superoxide dismutase^methuselah-like 5^methuselah-like 3methuselah-like 1
*four wheel driveNa pump alpha subunit
^I’m not dead yet
nudelbendlesssidekickInhibitor of apoptosis 2hemipterousTGF-beta activated kinase 1Dmel_CG40006Tep2santa-mariaDreddPGRP-LCSu(var)2-10Serine protease inhibitor 4
Serine protease inhibitor 5
Dmel_CG9134Neurexin 4
draperimmune deficiencyDmel_CG6048
Dmel_CGDmel_CGDmel_CG
Dmel_CG13318Dmel_CG8170
bention transport peptideturtleDmel_CG1887DscamDmel_CG11372snakeTrypsin29FStat92Eemp
A B
Figure 3. Expression patterns of aging- and immune-associated genes. A) Heatmap of log2 transformed and normalized expression valuesfor the fire ant transcripts that are putatively involved in aging processes. This gene list was obtained by overlapping the list differentially regulatedtranscripts with FlyBase matches in experiment 1 with the list of genes included in the Drosophila GO term ‘‘aging’’. The directional expression ofthese transcripts was also compared to the expression patterns of aging genes as found in the review by Paaby and Schmidt [65]. * = gene thatextends lifespan when its activity is increased; ‘ = gene that extends lifespan when its activity is decreased. B) Heatmap of log2 transformed andnormalized expression values for the fire ant transcripts that are putatively involved in immune processes. This gene list was obtained by overlappingthe list differentially regulated transcripts with FlyBase matches in experiment 1 with the list of canonical immune-related genes annotated in honeybees [48].doi:10.1371/journal.pgen.1003633.g003
Genomics of Colony Founding in Fire Ants
PLOS Genetics | www.plosgenetics.org 7 August 2013 | Volume 9 | Issue 8 | e1003633

significantly enriched at p-value,0.05 and three survived
Benjamini correction: cellular metabolic process, cellular ketone
metabolic process and maintenance of protein location (see Table
S12). Among the other GO terms, of particular interest was lipid
metabolic process, which includes several genes involved in the
metabolism of fatty acids such as Helix loop helix protein 106
(HLH106) [49], scully (scu) [50] and two putative fatty acyl-CoA
reductases. Additional genes with significant differences in expres-
sion included Coenzyme Q biosynthesis protein 2 (Coq2), which plays a
role in the response to pathogens, aging and in the insulin-
signaling pathway [51,52], juvenile hormone acid methyltransferase
(jhamt), which was also significantly differentially regulated between
win and los in experiment 1 (see above), and radish (rad), which is
involved in learning and memory [53]. Finally, the GO term
‘‘response to stress’’ was significantly overrepresented, which
includes key immune response genes such as immune response deficient
5 (ird5) [54], Ras-related protein Rac1 (Rac1) [55], Hemolectin (Hml)
[56], Argonaute 2 (AGO2) [57] and caspar (casp) [58].
Ninety-three transcripts were differentially regulated both
between win and los in experiments 1 (548 transcripts,
Figure 4. Directional expression of immune-associated GO terms. Overview of larger functional categories encompassing the immune-associated GO terms that were overrepresented among genes upregulated in haplometrotic (grey bars) and pleometrotic (black bars) queens. Thisresult was obtained by overlapping the list of immune system gene classes available in the cateGOrizer with the two lists of significantly enriched GOterms in experiment 1 (Functional Annotation Chart, P,0.05), i.e. cluster 1 for transcripts upregulated in haplometrotic queens and cluster 2 fortranscripts upregulated in pleometrotic queens (see Tables S8 and S9, respectively).doi:10.1371/journal.pgen.1003633.g004
Figure 5. Analysis of global gene expression in pleometroticqueens after manipulation of social rank. Principal ComponentAnalysis of 606 significantly differentially regulated transcripts revealedthree principal effects corresponding to switch of the social rank (48%),final rank (37%) and initial rank (15%). win/los = winners switched tolosers; win/win = continuing winners; los/win = losers switched towinners; los/los = continuing losers.doi:10.1371/journal.pgen.1003633.g005
Genomics of Colony Founding in Fire Ants
PLOS Genetics | www.plosgenetics.org 8 August 2013 | Volume 9 | Issue 8 | e1003633
FDR,0.1) and in experiment 2 (616 transcripts, FDR,0.1): this is
significantly more than expected by chance (Hypergeometric Test:
Representation factor: 2.2, p,1.009213). These transcripts corre-
sponded to 80 Drosophila orthologs, which were used to perform a
GO analysis using Functional Annotation Clustering: 6 GO terms
appeared to be significantly enriched, including lipid metabolic
process (P,0.001) and regulation of hormone levels (P,0.05;
Table S13). The expression patterns of the 9 differentially
regulated transcripts involved in lipid metabolic process across
the two experiments are shown in Table 2.
Discussion
This study demonstrates that social environment greatly
influences gene expression in founding queens of the fire ant
Solenopsis invicta, and that the effects of social rank are secondary.
Social environment in the first experiment (haplometrosis vs.
pleometrosis) strongly influenced expression of thousands of genes,
and the difference between pleometrotic winners and losers was
much smaller. However, in terms of gene expression differences,
pleometrotic winners were more similar to haplometrotic queens,
suggesting that reproductive and social rank still does impact,
albeit more subtly, gene expression patterns. In the second
experiment, we manipulated both the social environment and
social rank of queens in pleometrotic pairs. Switching social rank
significantly affected gene expression patterns more than the initial
or final social rank of the individual. Several categories of genes
were differentially regulated among these groups of queens,
including genes involved in core processes such as metabolism,
aging and immunity.
In a recent study Ferreira et al. [59] explored the genetic basis of
the early phases of social evolution in a primitively eusocial Polistes
wasp. These authors found that 75% of the 2,442 genes
differentially expressed between queen and worker phenotypes
were novel, having no significant similarity with described
sequences. This result supports the hypothesis that novel genes
are likely important for eusocial evolution, as previously suggested
by other studies [60,61]. Interestingly, within our pool of 9,388
genes initially analyzed for experiment 1 (haplometrotic vs.
pleometrotic queens), 41% were novel but this percentage
decreased to 26% (which is a significantly smaller percentage,
Fisher’s Exact Test, P,0.0001) when we consider only the genes
that were differentially regulated between the two phenotypes of
founding queens. Thus, while caste differences in Polistes may be
associated with novel genes, plasticity in founding behavior in fire
ants seems to rely predominantly on more conserved genes.
Haplometrotic vs. pleometrotic queensDifferences in gene expression between haplometrotic and
pleometrotic queens were likely due to differences in the
physiological demands placed on singly- vs. multiply-founding
queens and differences in the costs associated with social
environment, where pleometrotic queens are more likely to incur
in higher levels of stress due to the establishment of social ranks.
We found that genes involved in core physiological processes,
including metabolism, cellular processes, development, morpho-
genesis and biosynthesis were significantly differentially regulated
between these groups of queens. Haplometrotic queens produce
more eggs and lose more weight than pleometrotic queens during
the claustral period of colony founding [20]: this seems to be due
to queen-queen reciprocal reproductive inhibition and oophagy/
cannibalism of larvae in pleometrotic associations [62]. Genes
associated with reproductive functions (including development of
reproductive tissues and production of oocytes and eggs) were
upregulated in haplometrotic queens. Furthermore, in order to
produce eggs, newly mated queens degrade wing muscle tissues
and metabolize fat body storage proteins to produce free amino
acids [63]. We found 58 protein-related GO terms and 10 amino
acid-related that were upregulated in haplometrotic queens versus
5 and 0, respectively that were upregulated in pleometrotic queens
(Functional Annotation Chart, see Tables S8 and S9).
Genes associated with stress response were differentially
regulated between haplo and pleo queens. Stress tolerance may
be achieved by reducing the production of reactive oxidant species
(via improved regulation of mitochondrial processes) and/or by
increasing the antioxidant activity [64,65]. In our study, we found
that two mitochondria-related GO terms, namely mitochondrial
electron transport, NADH to ubiquinone (15 genes) and
mitochondrion organization (18 genes) were upregulated in haplo
and none in pleo. Moreover, 9 antioxidant genes were upregulated
in haplo, including two superoxide dismutases (Sod2 and CCS), two
Peroxiredoxins (6005 and 5037), Glutathione S transferase S1 and PTEN-
induced putative kinase 1 (Pink1), which plays an essential role in
maintaining neuronal survival by preventing neurons from
undergoing oxidative stress [66]. These results suggest that haplo
queens may experience lower levels of oxidative stress either by
producing less ROS or by keeping the levels of antioxidants high.
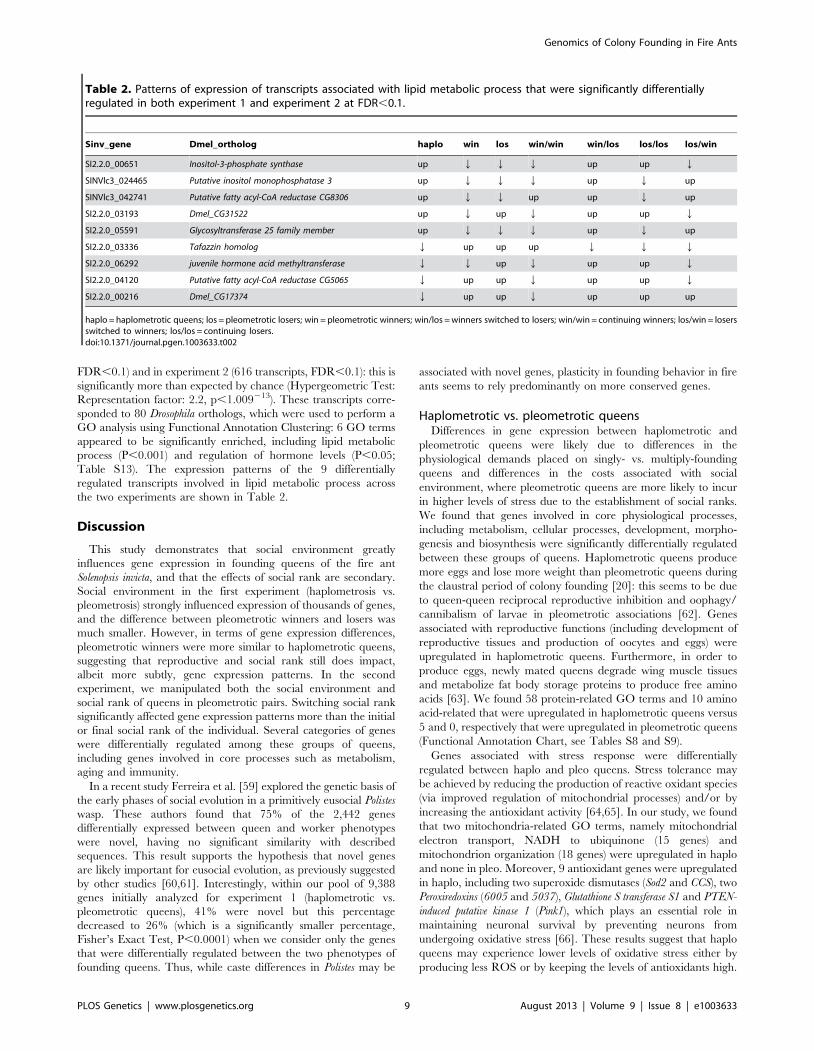
Table 2. Patterns of expression of transcripts associated with lipid metabolic process that were significantly differentiallyregulated in both experiment 1 and experiment 2 at FDR,0.1.
Sinv_gene Dmel_ortholog haplo win los win/win win/los los/los los/win
SI2.2.0_00651 Inositol-3-phosphate synthase up Q Q Q up up Q
SINVlc3_024465 Putative inositol monophosphatase 3 up Q Q Q up Q up
SINVlc3_042741 Putative fatty acyl-CoA reductase CG8306 up Q Q up up Q up
SI2.2.0_03193 Dmel_CG31522 up Q up Q up up Q
SI2.2.0_05591 Glycosyltransferase 25 family member up Q Q Q up Q up
SI2.2.0_03336 Tafazzin homolog Q up up up Q Q Q
SI2.2.0_06292 juvenile hormone acid methyltransferase Q Q up Q up up Q
SI2.2.0_04120 Putative fatty acyl-CoA reductase CG5065 Q up up Q up up Q
SI2.2.0_00216 Dmel_CG17374 Q up up Q up up up
haplo = haplometrotic queens; los = pleometrotic losers; win = pleometrotic winners; win/los = winners switched to losers; win/win = continuing winners; los/win = losersswitched to winners; los/los = continuing losers.doi:10.1371/journal.pgen.1003633.t002
Genomics of Colony Founding in Fire Ants
PLOS Genetics | www.plosgenetics.org 9 August 2013 | Volume 9 | Issue 8 | e1003633

Higher stress levels in pleo queens could be correlated to their
social environment, dominated by queen-queen aggressive inter-
actions and competition. Stress tolerance is positively correlated
with lifespan [67] and this trait has been used as a proxy for long-
lived phenotypes in studies that examine the genetic basis of
lifespan [68]. Only SOD was upregulated in pleo. Interestingly,
overexpression of SOD has been correlated to increased organis-
mal longevity in Drosophila [69], but this was not confirmed in
Lasius niger, where long-lived queens expressed lower levels of this
gene than short-lived males and workers [70]. It is evident that the
effect of SOD on longevity is highly dependent upon the sex and
genetic background [71] and also the social environment [72].
The overrepresentation of GO terms associated to biosynthesis
and metabolism (in particular those related to lipids) prompted us
to look closer at the nutritional state of founding queens. Nutrition
is closely linked to fertility and longevity [73]. In insects, the
insulin-signaling pathway regulates nutrient-sensing [74] while
juvenile hormone and ecdysone mediate reproductive processes
[75]. In honey bees, long-lived queens have low levels of insulin
and juvenile hormone, while they have high levels of FOXO,
vitellogenin and ecdysone; opposite patterns are found in sterile
short-lived workers [76]. Our results show that haplo had higher
levels of FOXO and of the ecdysone receptor. Haplo queens also
presumably had lower levels of JH, since levels of juvenile hormone
acid methyltransferase (jhamt), an enzyme that converts inactive
precursors of JHs to active JHs [41], were downregulated, and
levels of juvenile hormone epoxide hydrolase 2 (Jheh2), involved in
juvenile hormone catabolic process, were upregulated.
There is no clear prediction about which group of queens
should have a longer life-span. Our analyses show that a large set
of aging-related GO terms was upregulated in haplometrotic
queens, while a smaller set was upregulated in pleometrotic
queens. This result is not sufficient to establish which group of
queens is expected to have longer life-span, since ageing is a
quantitative trait determined by both environmental and genetic
components. Previous studies of the genetics of longevity in
Drosophila melanogaster, identified sets of genes in which upregulated
expression either accelerates or decelerates the aging process [65].
However, in our study, genes from both categories were equally
up- and downregulated across haplo and pleo queens (see
Figure 3A). Therefore, the knowledge of the genetics of longevity
in the insect model D. melanogaster cannot be transferred directly to
our study system.
Immune-related genes were overexpressed in haplometrotic vs.
pleometrotic queens. Most of the overrepresented immune-related
GO terms were associated to cellular immunity: endocytosis,
phagocytosis, cell adhesion, apoptosis, cytokinesis, the cascade
regulating mitogen-activated protein kinase (MAPKKK) and the
c-Jun amino-terminal protein kinase (JNK) cascade. In particular,
the JNK pathway controls the rapid up-regulation of cytoskeletal
genes in response to infection and plays a major role in wound
healing [77]. Key genes in the JNK pathways [78] were
upregulated in haplo, namely kayak, hemipterous, misshapen, anterior
open and Cdc42. Hemopoiesis is the process that is responsible for
production and differentiation of immune cells [79]: two key genes
involved in this process, serrate and serpent, were upregulated in
haplo. Haplo queens may have better constitutive immune
responses perhaps because they experience less social stress than
pleo queens do: in fact, once initial cooperation transitions into
open competition, pleo queens frequently engage in reciprocal
aggressions which can lead to serious injuries or death. It is
hypothesized that there is a trade-off between reproduction,
nutrition and immunity [80], suggesting that highly reproductive
haplo queens should have overall reduced immune responses
during colony foundation period when food sources are limited.
However, previous studies in honey bees demonstrated that
reproductive queens have higher expression of immune genes than
non-reproductive workers [81,82], and thus this trade-off may not
exist in social insect queens, perhaps because queens have more
energy resources than workers.
Pleometrotic queens: Winner vs. loserOnly 43 transcripts were significantly differentially regulated
between winners and losers in couples of pleometrotic queens from
experiment 1. Although surprising, this result might be explained
by the small phenotypic differences between the two types of
queens. Previous studies showed that some phenotypic traits such
as head width are weakly correlated with the reproductive
investment and survival (hence the rank) of pleometrotic
cofoundresses [20]. It has been suggested that the relatively weak
association between these parameters stems from selection to
maintain cooperation [20]. If phenotypic differences strongly
correlate with the chances of surviving, smaller queens with lower
fighting abilities would be selected not to cooperate and feed the
brood in the colony. Thus, the small differences at the genomic
level between winners and losers may reflect selection for a system
where differences between cofoundresses is sufficiently small so
that all of them have a chance of surviving, and thus an interest to
cooperate with unrelated individuals.
The two GO terms that were differentially regulated between
winners and losers were related to metabolism of lipids and
metabolism of hormones. Four transcripts, bubblegum, desat1,
Dmel_CG17374 and Dmel_CG31522, which function in fatty acid
metabolism, were differentially regulated. Long-chain fatty acids
are the precursors of cuticular hydrocarbons in insects, which can
function as nestmate recognition cues and social pheromones in
many insect species (reviewed [83]). Interestingly, bgm, which
encodes a very long-chain fatty acid CoA ligase [36], was
downregulated in losers relative to winners and haplo: thus, this
gene may be involved in regulating chemical cues related to
dominance. Similarly, desat1, which is expressed at higher levels in
losers than in winners or haplo functions in pheromonal
communication [40]. Altered bgm expression has also been
associated with infection (and correlated with changes in cuticular
hydrocarbon profiles) in honey bees [84], while desat1 appears to
play a role in autophagic responses [85]. Thus, these genes may
also be involved in signaling infection, nutrient deprivation or
other stress responses.
Behavioral manipulation of the social rank in pairs of
pleometrotic queens demonstrated that manipulation of social
environment (i.e., conditions in which the social rank of the
individual changes) had a much larger effect on gene expression
than the initial or final social rank of the individual. Note,
however, that all individuals in the study switched social partners,
which may have elicited additional (undetected) changes in gene
expression. Studies in vertebrates have demonstrated that social
interactions and changes in the social environment can be one of
the most potent stressors [86]. Indeed, genes associate with
‘response to stress’ were significantly enriched, with a set of 30
transcripts differentially regulated among the four groups of
manipulated queens (see Results and Table S12). The effects of
restructuring social ranks have not been considered broadly in
other species [87], but decreased social rank in dark-eyed junco
birds is associated with increased metabolic rates, while increased
social rank results in a much lower physiological change [88].
Similarly, for dominant, but not for subordinate, birds there is a
measurable metabolic cost to joining a new social group [88].
Genomics of Colony Founding in Fire Ants
PLOS Genetics | www.plosgenetics.org 10 August 2013 | Volume 9 | Issue 8 | e1003633
In both experiments, genes involved in lipid biosynthesis and
metabolism were differentially regulated, suggesting that these
processes play a key role in mediating fire ant founding behavior
and foundress associations. Lipids such as cuticular hydrocarbons
play a role in advertising the fertility state in many ant species: these
compounds are usually more abundant in reproductive queens and
egg-laying workers (reviewed in [89]). Indeed, ‘lipid biosynthetic/
metabolic process’ was differentially regulated in haplo vs. pleo and
in win vs. los in experiment 1 (Tables S4, S5 and S6) and in
experiment 2 (Table S12). These results support the hypothesis that
lipids (and in particular fatty acids) are of great importance in
regulating social interactions between queens and among nestmates
in general. In fire ant pleometrotic associations, the pheromones
and nestmate recognition chemicals derived from these fatty acids
are most likely an important component of the individual’s
chemical profile, which is used by nestmate queens to decipher
the physiological condition and thus the social rank of the partner.
ConclusionsWe used newly developed genomic tools to examine the gene
expression patterns associated with complex social behaviors
involved in colony founding by fire ant queens. Our results suggest
that social environment (haplometrotic vs. pleometrotic, switched
vs. maintained social rank) is more important than the social rank
or internal condition of the individual in regulating gene
expression patterns, and presumably downstream physiological
and behavioral traits. Furthermore, because the process of
pleometrotic colony founding in fire ants has all the features of a
primitively social system in which morphologically, physiological-
ly, and genetically similar individuals perform cooperative
behavior to form social groups of unrelated individuals, this is
an excellent model to examine the genes that underlie these social
behaviors. We found that several core processes were significantly
differentially regulated, including metabolism, stress response,
aging, reproductive processes, and immunity. Interestingly, lipid
metabolic processes were regulated across experiments; these may
play a role in both nutrient storage/mobilization and chemical
communication. In the future, it will be interesting to investigate
whether the molecular pathways characterized in this study also
are operating at earlier stages of the co-founding process (e.g.,
before the emergence of workers). Such studies will help elucidate
the mechanisms responsible for the transition from cooperation to
conflict in pleometrotic founding queens. Finally, fire ants also
display genetically distinct monogyne (colonies headed by a single
queen) and polygyne (colonies headed by multiple queens) social
forms. It will be of great interest to determine if the same genes
that regulate haplometrosis and pleometrosis also are involved in
regulating queen number in mature colonies.
Materials and Methods
Insect collection and rearingA total of 787 fire ant queens were collected immediately after a
nuptial mating flight on May 5th, 2010 in a large parking lot
(Target, 3970 SW Archer Rd, Gainesville, FL) and weighed. Since
the area of collection has a high prevalence of monogyne colonies,
we expected these queens to belong to the monogyne social form;
this was subsequently confirmed by screening 108 queens for social
form using Gp-9 as a marker following the protocol as described in
[90]. The remaining 679 queens were split into two groups: 308
queens were set up in pairs (pleometrosis) based on having similar
weights (range 60.2 mg) and paint-marked with different colors,
while 371 queens were set up individually (haplometrosis) and
paint-marked as well. All the queens were provided with a nesting
chamber consisting of a glass tube half-filled with water, which was
covered by a cotton ball and a layer of dental plaster: this keeps the
chamber moist but avoids an excess of water which is deleterious
for the young brood. Tubes were sealed with a loose cap to
provide air flow. Specimens were reared in the dark at 28uC, 70%
relative humidity under claustral conditions (no food and no water)
for 1 month.
Experiment 1: Effect of social environment and socialrank on gene expression patterns
After eclosion of the first batch of workers (minims), incipient
colonies were provided with water, sugar water and frozen
crickets. Glass tubes were set open in pencil boxes coated with
Fluon to prevent escape. Queens were subsequently monitored
daily until it was possible to identify the social rank of the two
cofoundresses in pleometrotic couples. Previous studies have found
that the initial cooperation between the two cofoundresses turns
into conflict after the emergence of minims, resulting in the
execution of one queen [19]. Queens that survive the competition
(winners) are usually located at the top of the brood pile within the
nest chamber and they are generally tended by workers;
conversely, queens that will be executed (losers) are normally seen
outside the nest chamber, hiding from workers in order to avoid
being attacked (Figure S4). We used these observations to establish
the social rank of the two pleometrotic queens, i.e. winner and
loser. We collected 25 pleometrotic couples and 25 haplometrotic
queens in dry ice and stored them at 280uC to be later processed.
Experiment 2: Effect of the manipulation of social rank ongene expression patterns
This assay was performed with 34 couples of pleometrotic
queens from the same pool of newly mated queens as experiment
1. The queens were paired and placed in nesting chambers as
before. After emergence of minims, queens’ behavior was
monitored as before. Once the behavioral observation revealed
the social rank of the two cofoundresses, queens were weighed
again and re-paired with a different partner. We created the
following three groups of queens: a) winner+winner (similar
weight), b) loser+loser (similar weight), and c) winner+loser
(different weights). Again, we monitored the behavior until the
social rank of the newly coupled specimens was evident and we
collected 4 new behavioral phenotypes in the same way as above:
a) winners switched into losers (win/los, N = 7), b) losers switched
into winners (los/win, N = 11), c) continuing winners (win/win,
N = 12) and d) continuing losers (los/los, N = 5).
Sample preparation for molecular analysesIndividual fire ant queens were thawed and dissected under cold
RNAlater (Qiagen, Valencia, CA) to confirm the mating status:
unmated queens were not included in the analysis. Total RNA was
extracted using the RNeasy Plus kit (Qiagen) combined with a
RNase-Free DNase step (Qiagen) to remove any possible
contamination by genomic DNA. Subsequent steps in the
microarray analysis were performed at the Penn State Genomic
Core Facility. RNA concentration and purity were assessed using
NanoDrop and Qubit and RNA quality was assessed using RNA
Nano Chips on the Agilent Bioanalyzer. 1 mg of each sample was
amplified using the Ambion (Life Technologies) Amino Allyl
MessageAmp II aRNA Amplification Kit (AM1753). 15 mg of
aRNA were dyed with Cy3 or Cy5 (GE Health Care #RPN5661)
and subsequently purified according to the Ambion Kit instruc-
tions. 1.5 mg of a Cy3 labeled sample were combined with 1.5 mg
of a Cy5 labeled sample and fragmented using RNA Fragmen-
Genomics of Colony Founding in Fire Ants
PLOS Genetics | www.plosgenetics.org 11 August 2013 | Volume 9 | Issue 8 | e1003633
tation Reagents (Ambion AM8740) according to the manufactur-
er’s instructions. Samples were hybridized with mixing in a MAUI
hybridization instrument overnight at 42uC. Arrays were scanned
using Axon GenePix 4000B.
For the first microarray developed to validate the efficiency of
probe sequences, we pooled RNA samples (2 mg total) from
different castes, developmental instars and social forms as follows:
3 female alates, 15 workers, 5 larvae and 5 pupae from both
monogyne and polygyne social forms and 5 males from monogyne
colonies only.
Microarray design and validationThe fire ant genome includes an official gene set of 16,569
protein-coding genes that were generated by a combination of ab
initio, EST-based, and sequence similarity-based methods [27]. For
our microarray studies, we combined the official gene set with a set
of ESTs obtained from assemblies of the fire ant transcriptome for
a total set of 63,436 sequences (‘‘transcripts’’). We successfully
designed 60-mer probes for 51,531 of these transcripts (Roche
NimbleGen, Inc., Madison WI). These sequences/probes were
grouped into four categories: ESTs with gene models (EWGM,
7433 transcripts), ESTs without gene models (EWOGM, 40,613),
gene models (GM, 3246) and gene models redundant with other
models (GMRWOM, 239).
We developed and used a first microarray (1-plex 385,000 probe
capacity, Roche NimbleGen, Inc., Madison WI) to validate the
probe design and test multiple probes per transcript. On average,
we designed 7 probes per transcript for a total of 355,930 probes.
Each probe was tested for both the red (Cy5) and the green (Cy3)
dyes. For transcripts with only one probe (N = 296), we verified
that the probe had acceptable intensities for both dyes. For the
other transcripts we examined the performance of the probes with
the green dye only, because these showed consistently higher
intensity compared to the red dye. Probes were ranked in the
follow manner: a) if there were only 2 probes per transcript
(N = 230), we selected the one with higher intensity; b) if there
were 3 to 6 probes (N = 744), we calculated the ratio ‘‘probe
intensity/median intensity of all probes for that transcript’’ and
selected the probe with highest ratio if the value was ,3, otherwise
we selected the probe with the second highest ratio; c) for
transcripts with 7 probes (N = 50,261), we followed the procedure
as in ‘‘b’’ but, in case the probe with the highest ratio was .3, we
removed that probe, calculated new ratios and selected a new
probe with highest ratio. This procedure allowed us to select the
probes with highest intensity that were not outliers.
Selected probes were printed in pairs on two 12-plex
microarrays (each array had a 135,000 probe capacity, Roche
NimbleGen, Inc., Madison WI). We used a loop design with dye
swaps incorporated, allowing us to hybridize 24 RNA samples to
each array. For experiment 1 we hybridized 8 haplometrotic
queens, 8 pleometrotic winners and 8 pleometrotic losers (Figure
S5) and for experiment 2 we compared 6 win/los, 6 los/win, 6
win/win and 5 los/los (Figure S6).
Analysis of gene expressionAny spots with an intensity of less than 300 (the background
level on the arrays) were removed from the analyses, as were spots
present on less than 20 out of 24 arrays. Expression data were log-
transformed and normalized using mixed-model normalization
(proc MIXED, SAS, Cary, NC) with the following model:
Y~mzdyezblockzarrayzarray1dyezarray1blockzE
where Y is expression, dye and block are fixed effects, and array,
array*dye and array*block are random effects. Transcripts with
significant expression differences between groups were detected by
using a mixed-model ANOVA with the model:
Y~mztreatmentzspotzdyezarrayzE
where Y represents the residual from the previous model.
Treatment, spot and dye are fixed effects and array is a random
effect. P-values were corrected for multiple testing using a false
discovery rate of ,0.001 for experiment 1 and ,0.1 for
experiment 2 (proc MULTTEST, SAS). Because the number of
differentially regulated transcripts for experiment 1 was very high
(,13,000 out of ,50,000), and to avoid an excess of redundancy
among the different groups of transcripts, we included only probes
corresponding to GM and EWGM (see above).
Hierarchical clustering, using the Ward method, and principal
component analysis (PCA) for global patterns of gene expression
were performed in JMP 9.0.2 (SAS, Cary, NC). We used Genesis
1.7.6 (Graz, Austria) to cluster differentially regulated genes based
on average linkage and to perform k-means clustering in
experiment 1. Gene Ontology analysis was performed using
functional annotation chart/clustering in DAVID version 6
[28,29] using DAVID default population background and a cutoff
of p,0.05. For all Gene Ontology (GO) analyses, fire ant genes
were matched to their Drosophila orthologs in FlyBase (http://
flybase.org/). CateGOrizer [31] was used to count the occurrences
of significantly enriched GO terms within each of the pre-defined
set of parent/ancestor GO terms. The array data were deposited
on the ArrayExpress website according to MIAME standards
(ArrayExpress accession: E-MEXP-3886 for experiment 1, E-
MEXP-3898 for experiment 2).
Comparative studiesWe compared the results from experiment 1 to the following
studies:
1. experiment 2 from this study: we overlapped 548 transcripts
that were significantly differentially regulated at FDR,0.1
between win and los in experiment 1 to all the significantly
differentially regulated transcripts from experiment 2 (606,
FDR,0.1).
2. aging in Drosophila: we compared directional expressions for all
the significantly enriched GO terms obtained from Functional
Annotation Chart for experiment 1 and the significantly
enriched GO terms that were associated to aging in the fruit fly
based on Zhan et al. [47].
We performed overlaps between list of transcripts and GO
terms with Venny [91]. In the first comparative study we
overlapped fire ant transcripts directly, while in the second study
we used Drosophila orthologues (FlyBase numbers) to compare fire
ant transcripts to the genes of the fruit fly. Statistical significance of
the overlap was calculated using a hypergeometric test (http://
nemates.org/MA/progs/overlap_stats.html). Selected GO analy-
ses based on study overlap were performed in DAVID as above. In
the second study, to test for the significant agreement in the
patterns of expression between two studies we performed Fisher’s
Exact Tests in JMP.
Validation of candidate gene expression usingQuantitative Real-Time PCR
We examined gene expression levels of the following candidate
genes (Table S10): Indy and Sod2 (determination of adult life span);
Genomics of Colony Founding in Fire Ants
PLOS Genetics | www.plosgenetics.org 12 August 2013 | Volume 9 | Issue 8 | e1003633
Dredd and kay (immune response); desat1, ifc and Putative fatty acyl-
CoA reductase CG5065 (synthesis and metabolism of fatty acids); br
and Btk29A (reproductive functions); Sema-5c and Mer (olfactory
behavior); fru (aggressive behavior) and woc (neurogenesis). We
used the total RNA extracted from fire ant queens for the
microarray analysis and compared gene expression between haplo
and los on an ABI Prism 7900 sequence detector (Applied
Biosystems, Foster City, CA, USA). cDNA was made using
SuperScript III First-Strand Synthesis System for RT-PCR
(Invitrogen-Life Technologies, Carlsbad, CA, USA) and Random
Hexamers according to the manufacturer’s protocol. The cDNA
was then diluted 2(x) with ultra-pure water. Amplification was
performed in a 10 ml reaction mixture containing 5 ml of 26SYBR Green Master Mix (Applied Biosystems-Life Technologies,
Carlsbad, CA, USA), 1 ml of each primer (10 mM) and 2 ml of
cDNA at the following conditions: 50uC for 2 min, 95uC for
10 min, 40 cycles of 95uC for 15 sec and 60uC for 1 min, a
dissociation step of 95uC for 15 sec and 60uC for 15 sec. We used
8 queens per group: triplicate reactions were performed for each of
the samples and averaged for use in statistical analysis. Expression
levels of candidate genes were normalized to the geometric mean
of two housekeeping genes, Rp-9 and Rp-37 [27]. Negative control
(cDNA reaction without RT enzyme) was also used. Primer
sequences were developed in Primer3Plus (http://www.
bioinformatics.nl/cgi-bin/primer3plus/primer3plus.cgi) and
primer efficiency was first validated using standard curves.
Statistical analysis was performed with nonparametric Kruskall-
Wallis rank sums in JMP 10 (SAS, Cary, NC). The data were
shown normalized to the haplo group.
Supporting Information
Figure S1 Transcripts upregulated in haplometrotic queens.
Expression patterns of 2280 significantly differentially regulated
transcripts grouped in cluster 1 by k-means clustering in Genesis
(for a GO analysis of these transcripts see Table S4).
(EPS)
Figure S2 Transcripts downregulated in haplometrotic queens.
Expression patterns of 912 significantly differentially regulated
transcripts grouped in cluster 2 by k-means clustering in Genesis
(for a GO analysis of these transcripts see Table S5).
(EPS)
Figure S3 Quantitative real-time PCR validation of expression
levels of genes of interest. Expression levels of the following genes
associated with GO terms of interest were analyzed using
quantitative real-time PCR (see Table S10 for detailed informa-
tion about these genes and the primers we used): Indy and Sod2
(determination of adult life span); Dredd and kay (immune
response); desat1, ifc and Putative fatty acyl-CoA reductase CG5065
(synthesis and metabolism of fatty acids); br and Btk29A
(reproductive functions); Sema-5c and Mer (olfactory behavior); fru
(aggressive behavior) and woc (neurogenesis). Mean expression
levels in losers were normalized to levels of expression in
haplometrotic queens. Each sample group consisted of 8
individuals; these 8 individuals were also used in the microarray
analysis. Statistical analysis was performed with Kruskall-Wallis
rank sums: * = P,0.05; ** = P,0.01; *** = P,0.001. #For a
better visualization of the results, the bar associated to the gene
Putative fatty acyl-CoA reductase CG5065 is not represented in full
length in losers: average relative expression for this gene was 14.06
with S.E. 60.35.
(EPS)
Figure S4 Behavioral observation of pleometrotic couples. Just
before the emergence of the first workers, haplometrotic queens
and pleometrotic couples were placed in pencil boxes where it was
easier to observe queen-queen and queen-workers interactions. As
shown in the figure, in pleometrotic couples the winner queen was
usually found inside the nest chamber (glass tube, where the eggs
and the brood are) while the loser was find outside the nest
chamber, frequently hiding in order to avoid any contact with the
winner or the workers.
(TIF)
Figure S5 Microarray hybridization scheme for experiment 1.
For each group of queens, 8 individuals where hybridized in a loop
design: 4 individuals were labeled with the Cy3 dye and other 4
with the Cy5 dye. 12-plex array slides with 135,000 probe capacity
where designed by Roche NimbleGen, Inc. (Madison WI).
haplo = haplometrotic queens; los = pleometrotic losers; win = -
pleometrotic winners.
(EPS)
Figure S6 Microarray hybridization scheme for experiment 2.
For each group of queens, 6 individuals where hybridized in a loop
design: 3 individuals were labeled with the Cy3 dye and other 3
with the Cy5 dye. 12-plex array slides with 135,000 probe capacity
where designed by Roche NimbleGen, Inc. (Madison WI). win/
los = winners switched to losers; win/win = continuing winners;
los/win = losers switched to winners; los/los = continuing losers.
(EPS)
Movie S1 Movie clip showing the occurrence of aggressive
interactions among cofoundresses after the emergence of workers.
Note the difference between pair #9, where pleometrotic queens
clearly perform fighting behavior and the two other pairs of
cofounding queens, where the interactions are still cooperative.
(WMV)
Table S1 Experiment 1: significantly differentially regulated
transcripts (P,0.001).
(XLSX)
Table S2 Experiment 1: significantly enriched GO terms and
KEGG pathways (Functional Annotation Chart, P,0.05).
(XLSX)
Table S3 Experiment 1, output of the cateGOrizer analysis:
representation of GO_slim2 ancestor terms.
(XLSX)
Table S4 Experiment 1, k-means clustering, cluster 1 (genes
upregulated in haplo): significantly enriched GO terms (Functional
Annotation Clustering, medium stringency, P,0.05).
(XLSX)
Table S5 Experiment 1, k-means clustering, cluster 2 (genes
downregulated in haplo): significantly enriched GO terms
(Functional Annotation Clustering, medium stringency, P,0.05).
(XLSX)
Table S6 Experiment 1: GO terms significantly enriched
(Functional Annotation Clustering, medium stringency, P,0.05)
and significantly differentially regulated transcripts (P,0.001)
between winners and losers.
(XLSX)
Table S7 Comparative studies: GO terms encompassing
significantly downregulated genes that were in common between
experiment 1 and old Drosophila in Zhan et al. [47].
(XLSX)
Genomics of Colony Founding in Fire Ants
PLOS Genetics | www.plosgenetics.org 13 August 2013 | Volume 9 | Issue 8 | e1003633

Table S8 Experiment 1, cluster 1: significantly enriched KEGG
pathways and GO terms that were used in the analyses with the
cateGOrizer ‘‘Immune system gene classes’’ (Functional Annota-
tion Chart, P,0.05).
(XLSX)
Table S9 Experiment 1, cluster 2: significantly enriched KEGG
pathways and GO terms that were used in the analyses with the
cateGOrizer ‘‘Immune system gene classes’’ (Functional Annota-
tion Chart, P,0.05).
(XLSX)
Table S10 Quantitative real-time PCR validation of expression
levels of genes of interest from experiment 1: gene lists and
primers’ sequences.
(XLSX)
Table S11 Experiment 2: significantly differentially regulated
transcripts (P,0.1).
(XLSX)
Table S12 Experiment 2: significantly enriched GO terms
(Functional Annotation Clustering, medium stringency, P,0.05).
(XLSX)
Table S13 Comparative studies: GO analysis of overlapping
transcripts that were significantly differentially regulated (P,0.1)
between win and los in experiment 1 and experiment 2.
(XLSX)
Acknowledgments
The authors would like to thank members of the Grozinger Lab for
commenting on an earlier version of the manuscript and Sarah Kocher
(Harvard) and Naomi Altman (Penn State) for providing assistance with the
statistical analysis. The authors would also like to thank Alex McMenamin
for performing the validation of candidate gene expression. Many thanks to
Craig Praul and his team at the Penn State Genomics Core Facility for
performing all the steps to prepare RNA samples for microarrays and for
providing assistance during RNA extraction and data analysis. A special
thanks to Eileen Carroll, Chin-Cheng Yang (Scotty) and all the
undergraduate research assistants in the Shoemaker Lab that provided
extraordinary support, help and advice during field work and laboratory
experiments at the USDA-ARS, CMAVE in Gainesville, Florida.
Author Contributions
Conceived and designed the experiments: FM CMG DS LK. Performed
the experiments: FM DS. Analyzed the data: FM CMG. Contributed
reagents/materials/analysis tools: CMG DS ORG YW. Wrote the paper:
FM CMG. Provided comments on the manuscript: DS LK YW ORG.
References
1. Hofmann HA (2003) Functional genomics of neural and behavioral plasticity.
Journal of Neurobiology 54: 272–282.
2. Ross KG, Keller L (1995) Ecology and evolution of social organization: insightsfrom fire ants and other highly eusocial insects. Annual Review of Ecology and
Systematics: 631–656.
3. Robinson GE (2004) Beyond Nature and Nurture. Science 304: 397–399.
4. Robinson GE, Fernald RD, Clayton DF (2008) Genes and Social Behavior.Science 322: 896–900.
5. Zayed A, Robinson GE (2012) Understanding the Relationship Between Brain
Gene Expression and Social Behavior: Lessons from the Honey Bee. AnnualReview of Genetics 46: 591–615.
6. Duarte A, Weissing FJ, Pen I, Keller L (2011) An Evolutionary Perspective onSelf-Organized Division of Labor in Social Insects. In: Futuyma DJ, Shaffer HB,
Simberloff D, editors. Annual Review of Ecology, Evolution, and Systematics.Volume 42. Palo Alto: Annual Reviews. pp. 91–110.
7. Dolezal AG, Brent CS, Holldobler B, Amdam GV (2012) Worker division of
labor and endocrine physiology are associated in the harvester ant, Pogonomyrmex
californicus. Journal of Experimental Biology 215: 454–460.
8. Smith CR, Toth AL, Suarez AV, Robinson GE (2008) Genetic and genomicanalyses of the division of labour in insect societies. Nature Reviews Genetics 9:
735–748.
9. Holldobler B, Wilson EO (1990) The ants. Cambridge, MA: Belknap Press. 732
pp.
10. Bernasconi G, Strassmann JE (1999) Cooperation among unrelated individuals:the ant foundress case. Trends in Ecology & Evolution 14: 477–482.
11. Kukuk P, Sage G (1994) Reproductivity and relatedness in a communal halictinebee Lasioglossum (Chilalictus) hemichalceum. Insectes Sociaux 41: 443–455.
12. Roisin Y (1993) Selective pressures on pleometrosis and secondary polygyny: a
comparison of termites and ants. Queen number and sociality in insects: 402–421.
13. Zanette LRS, Field J (2011) Founders versus joiners: group formation in thepaper wasp Polistes dominulus. Animal Behaviour 82: 699–705.
14. Queller DC, Zacchi F, Cervo R, Turillazzi S, Henshaw MT, et al. (2000)Unrelated helpers in a social insect. Nature 405: 784–787.
15. Liebert A, Hui J, Nonacs P, Starks P (2008) Extreme Polygyny: Multi-seasonal
‘‘Hypergynous’’ Nesting in the Introduced Paper Wasp Polistes dominulus. Journalof Insect Behavior 21: 72–81.
16. Rissing SW, Pollock GB, Higgins MR, Hagen RH, Smith DR (1989) Foragingspecialization without relatedness or dominance among co-founding ant queens.
Nature 338: 420–422.
17. Jeanson R, Fewell JH (2008) Influence of the social context on division of labor
in ant foundress associations. Behavioral Ecology 19: 567–574.
18. Tschinkel W, Howard D (1983) Colony founding by pleometrosis in the fire ant,Solenopsis invicta. Behavioral Ecology and Sociobiology 12: 103–113.
19. Balas MT, Adams ES (1996) The dissolution of cooperative groups: mechanismsof queen mortality in incipient fire ant colonies. Behavioral Ecology and
Sociobiology 38: 391–399.
20. Bernasconi G, Keller L (1998) Phenotype and individual investment in
cooperative foundress associations of the fire ant, Solenopsis invicta. Behavioral
Ecology 9: 478–485.
21. Bernasconi G, Krieger MJB, Keller L (1997) Unequal partitioning ofreproduction and investment between cooperating queens in the fire ant,
Solenopsis invicta, as revealed by microsatellites. Proceedings of the Royal SocietyB-Biological Sciences 264: 1331–1336.
22. Adams ES, Tschinkel WR (1995) Effects of foundress number on brood raidsand queen survival in the fire ant Solenopsis invicta. Behavioral Ecology and
Sociobiology 37: 233–242.
23. Balas MT, Adams ES (1996) Nestmate discrimination and competition inincipient colonies of fire ants. Animal Behaviour 51: 49–59.
24. Markin GP, Dillier JH, Collins HL (1972) Colony founding by queens of redimported fire ant, Solenopsis invicta - Hymenoptera - Formicidae. Annals of the
Entomological Society of America 65: 1053–1058.
25. Tschinkel WR (1995) Stimulation of fire ant queen fecundity by a highly specificbrood stage. Annals of the Entomological Society of America 88: 876–882.
26. Bernasconi G, Keller L (1996) Reproductive conflicts in cooperative associations
of fire ant queens (Solenopsis invicta). Proceedings of the Royal Society B-Biological
Sciences 263: 509–513.
27. Wurm Y, Wang J, Riba-Grognuz O, Corona M, Nygaard S, et al. (2011) Thegenome of the fire ant Solenopsis invicta. Proceedings of the National Academy of
Sciences of the United States of America 108: 5679–5684.
28. Huang DW, Sherman BT, Lempicki RA (2009) Bioinformatics enrichment
tools: paths toward the comprehensive functional analysis of large gene lists.Nucleic Acids Research 37: 1–13.
29. Huang DW, Sherman BT, Lempicki RA (2009) Systematic and integrative
analysis of large gene lists using DAVID bioinformatics resources. NatureProtocols 4: 44–57.
30. Kanehisa M, Goto S, Sato Y, Furumichi M, Tanabe M (2012) KEGG forintegration and interpretation of large-scale molecular data sets. Nucleic Acids
Research 40: D109–D114.
31. Hu ZL, Bao J, Reecy JM (2008) CateGOrizer: A Web-Based Program to BatchAnalyze Gene Ontology Classification Categories. Online Journal of Bioinfor-
matics 9: 108–112.
32. Sturn A, Quackenbush J, Trajanoski Z (2002) Genesis: cluster analysis of
microarray data. Bioinformatics 18: 207–208.
33. Valanne S, Myllymaki H, Kallio J, Schmid MR, Kleino A, et al. (2010) Genome-Wide RNA Interference in Drosophila Cells Identifies G Protein-Coupled
Receptor Kinase 2 as a Conserved Regulator of NF-kB Signaling. The Journalof Immunology 184: 6188–6198.
34. Drummond-Barbosa D, Spradling AC (2004) alpha-Endosulfine, a potentialregulator of insulin secretion, is required for adult tissue growth control in
Drosophila. Developmental Biology 266: 310–321.
35. Vieira FG, Rozas J (2011) Comparative Genomics of the Odorant-Binding andChemosensory Protein Gene Families across the Arthropoda: Origin and
Evolutionary History of the Chemosensory System. Genome Biology and
Evolution 3: 476–490.
36. Min K-T, Benzer S (1999) Preventing Neurodegeneration in the Drosophila
Mutant bubblegum. Science 284: 1985–1988.
37. Wang PY, Neretti N, Whitaker R, Hosier S, Chang CY, et al. (2009) Long-lived
Indy and calorie restriction interact to extend life span. Proceedings of the
National Academy of Sciences of the United States of America 106: 9262–9267.
Genomics of Colony Founding in Fire Ants
PLOS Genetics | www.plosgenetics.org 14 August 2013 | Volume 9 | Issue 8 | e1003633
38. Pearson JC, Juarez MT, Kim M, Drivenes Ø, McGinnis W (2009) Multiple
transcription factor codes activate epidermal wound-response genes in Drosophila.
Proceedings of the National Academy of Sciences 106: 2224–2229.
39. Riemensperger T, Isabel G, Coulom H, Neuser K, Seugnet L, et al. (2011)
Behavioral consequences of dopamine deficiency in the Drosophila central
nervous system. Proceedings of the National Academy of Sciences of the United
States of America 108: 834–839.
40. Houot B, Bousquet Fo, Ferveur J-Fo (2010) The Consequences of Regulation of
desat1 Expression for Pheromone Emission and Detection in Drosophila
melanogaster. Genetics 185: 1297–1309.
41. Shinoda T, Itoyama K (2003) Juvenile hormone acid methyltransferase: a key
regulatory enzyme for insect metamorphosis. Proceedings of the National
Academy of Sciences of the United States of America 100: 11986–11991.
42. Amdam GV (2011) Social context, stress, and plasticity of aging. Aging Cell 10:
18–27.
43. Wheeler DE, Buck N, Evans JD (2006) Expression of insulin pathway genes
during the period of caste determination in the honey bee, Apis mellifera. Insect
Molecular Biology 15: 597–602.
44. Ament SA, Chan QW, Wheeler MM, Nixon SE, Johnson SP, et al. (2011)
Mechanisms of stable lipid loss in a social insect. J Exp Biol 214: 3808–3821.
45. Ament SA, Corona M, Pollock HS, Robinson GE (2008) Insulin signaling is
involved in the regulation of worker division of labor in honey bee colonies.
PNAS 105: 4226–4231.
46. Baker N, Wolschin F, Amdam GV (2012) Age-related learning deficits can be
reversible in honeybees Apis mellifera. Experimental Gerontology 47: 764–772.
47. Zhan M, Yamaza H, Sun Y, Sinclair J, Li H, et al. (2007) Temporal and spatial
transcriptional profiles of aging in Drosophila melanogaster. Genome Research 17:
1236–1243.
48. Evans JD, Aronstein K, Chen YP, Hetru C, Imler JL, et al. (2006) Immune
pathways and defence mechanisms in honey bees Apis mellifera. Insect Molecular
Biology 15: 645–656.
49. Kunte AS, Matthews KA, Rawson RB (2006) Fatty acid auxotrophy in Drosophila
larvae lacking SREBP. Cell Metabolism 3: 439–448.
50. Shafqat N, Marschall HU, Filling C, Nordling E, Wu XQ, et al. (2003)
Expanded substrate screenings of human and Drosophila type 10 17-hydroxyste-
roid dehydrogenases (HSDs) reveal multiple specificities in bile acid and steroid
hormone metabolism: characterization of multifunctional 3/7/7/17/20/21-
HSD. The Biochemical Journal 376: 49–60.
51. Cheng W, Song C, Anjum KM, Chen M, Li D, et al. (2011) Coenzyme Q plays
opposing roles on bacteria/fungi and viruses in Drosophila innate immunity.
International journal of immunogenetics 38: 331–337.
52. Liu J, Wu Q, He D, Ma T, Du L, et al. (2011) Drosophila sbo regulates lifespan
through its function in the synthesis of coenzyme Q in vivo. Journal of Genetics
and Genomics [Yi chuan xue bao] 38: 225–234.
53. Lee PT, Lin HW, Chang YH, Fu TF, Dubnau J, et al. (2011) Serotonin-
mushroom body circuit modulating the formation of anesthesia-resistant
memory in Drosophila. Proceedings of the National Academy of Sciences of the
United States of America 108: 13794–13799.
54. Costa A, Jan E, Sarnow P, Schneider D (2009) The Imd pathway is involved in
antiviral immune responses in Drosophila. Plos One 4: e7436.
55. Howell L, Sampson CJ, Xavier MJ, Bolukbasi E, Heck MM, et al. (2012) A
directed miniscreen for genes involved in the Drosophila anti-parasitoid immune
response. Immunogenetics 64: 155–161.
56. Scherfer C, Karlsson C, Loseva O, Bidla G, Goto A, et al. (2004) Isolation and
characterization of hemolymph clotting factors in Drosophila melanogaster by a
pullout method. Current Biology 14: 625–629.
57. Wang XH, Aliyari R, Li WX, Li HW, Kim K, et al. (2006) RNA interference
directs innate immunity against viruses in adult Drosophila. Science 312: 452–454.
58. Kim M, Lee JH, Lee SY, Kim E, Chung J (2006) Caspar, a suppressor of
antibacterial immunity in Drosophila. Proceedings of the National Academy of
Sciences of the United States of America 103: 16358–16363.
59. Ferreira PG, Patalano S, Chauhan R, Ffrench-Constant R, Gabaldon T, et al.
(2013) Transcriptome analyses of primitively eusocial wasps reveal novel insights
into the evolution of sociality and the origin of alternative phenotypes. Genome
Biology 14: R20.
60. Johnson BR, Tsutsui ND (2011) Taxonomically restricted genes are associated
with the evolution of sociality in the honey bee. Bmc Genomics 12: 164.
61. Johnson BR, Linksvayer TA (2010) Deconstructing the superorganism: social
physiology, groundplans, and sociogenomics. The Quarterly Review of Biology
85: 57–79.
62. Tschinkel WR (1993) Resource allocation, brood production and cannibalism
during colony founding in the fire ant, Solenopsis invicta. Behavioral Ecology and
Sociobiology 33: 209–223.
63. Wurm Y, Wang J, Keller L (2010) Changes in reproductive roles are associated
with changes in gene expression in fire ant queens. Molecular Ecology 19: 1200–
1211.
64. Corona M, Hughes KA, Weaver DB, Robinson GE (2005) Gene expression
patterns associated with queen honey bee longevity. Mechanisms of ageing anddevelopment 126: 1230–1238.
65. Paaby AB, Schmidt PS (2009) Dissecting the genetics of longevity in Drosophila
melanogaster. Fly 3: 29–38.66. Wang D, Qian L, Xiong H, Liu J, Neckameyer WS, et al. (2006) Antioxidants
protect PINK1-dependent dopaminergic neurons in Drosophila. Proceedings ofthe National Academy of Sciences of the United States of America 103: 13520–
13525.
67. Vermeulen CJ, Loeschcke V (2007) Longevity and the stress response inDrosophila. Experimental Gerontology 42: 153–159.
68. Wang H-D, Kazemi-Esfarjani P, Benzer S (2004) Multiple-stress analysis forisolation of Drosophila longevity genes. Proceedings of the National Academy of
Sciences of the United States of America 101: 12610–12615.69. Orr W, Sohal R (1993) Effects of Cu-Zn Superoxide Dismutase Overexpression
on Life Span and Resistance to Oxidative Stress in Transgenic Drosophila
melanogaster. Archives of biochemistry and biophysics 301: 34–40.70. Parker JD, Parker KM, Sohal BH, Sohal RS, Keller L (2004) Decreased
expression of Cu-Zn superoxide dismutase 1 in ants with extreme lifespan.Proceedings of the National Academy of Sciences of the United States of
America 101: 3486–3489.
71. Spencer CC, Howell CE, Wright AR, Promislow DEL (2003) Testing an ‘‘aginggene’’ in long-lived Drosophila strains: increased longevity depends on sex and
genetic background. Aging Cell 2: 123–130.72. Ruan HY, Wu CF (2008) Social interaction-mediated lifespan extension of
Drosophila Cu/Zn superoxide dismutase mutants. Proceedings of the NationalAcademy of Sciences of the United States of America 105: 7506–7510.
73. Carey JR, Harshman LG, Liedo P, Muller H-G, Wang J-L, et al. (2008)
Longevity–fertility trade-offs in the tephritid fruit fly, Anastrepha ludens, acrossdietary-restriction gradients. Aging Cell 7: 470–477.
74. Wu Q, Brown MR (2006) Signaling and function of insulin-like peptides ininsects. Annu Rev Entomol 51: 1–24.
75. Hartfelder K (2000) Insect juvenile hormone: from ‘‘status quo’’ to high society.
Brazilian Journal of Medical and Biological Research 33: 157–177.76. Corona M, Velarde RA, Remolina S, Moran-Lauter A, Wang Y, et al. (2007)
Vitellogenin, juvenile hormone, insulin signaling, and queen honey beelongevity. Proceedings of the National Academy of Sciences 104: 7128–7133.
77. Brennan CA, Anderson KV (2004) Drosophila: the genetics of innate immunerecognition and response. Annu Rev Immunol 22: 457–483.
78. Ramet M, Lanot R, Zachary D, Manfruelli P (2002) JNK Signaling Pathway Is
Required for Efficient Wound Healing in Drosophila. Developmental Biology 241:145–156.
79. Williams MJ (2007) Drosophila hemopoiesis and cellular immunity. The Journalof Immunology 178: 4711–4716.
80. Schmid-Hempel P (2003) Variation in immune defence as a question of
evolutionary ecology. Proceedings of the Royal Society of London Series B:Biological Sciences 270: 357–366.
81. Grozinger CM, Fan YL, Hoover SER, Winston ML (2007) Genome-wideanalysis reveals differences in brain gene expression patterns associated with
caste and reproductive status in honey bees (Apis mellifera). Molecular Ecology 16:4837–4848.
82. Nino EL, Tarpy DR, Grozinger C (2013) Differential effects of insemination
volume and substance on reproductive changes in honey bee queens (Apis
mellifera L.) Insect Molecular Biology 22(3):233–44.
83. Blomquist GJ, Bagneres AG (2010) Insect hydrocarbons: biology, biochemistry,and chemical ecology. Cambridge University Press. 504 p.
84. Richard FJ, Holt H, Grozinger C (2012) Effects of immunostimulation on social
behavior, chemical communication and genome-wide gene expression in honeybee workers (Apis mellifera). Bmc Genomics 13: 558.
85. Kohler K, Brunner E, Guan XL, Boucke K, Greber UF, et al. (2009) Acombined proteomic and genetic analysis identifies a role for the lipid desaturase
Desat1 in starvation-induced autophagy in Drosophila. Autophagy 5: 980–990.
86. Selva N, Cortes-Avizanda A, Lemus JA, Blanco G, Mueller T, et al. (2011) Stressassociated with group living in a long-lived bird. Biology Letters 7: 608–610.
87. Tanner CJ, Salali GD, Jackson AL (2011) The ghost of social environments past:dominance relationships include current interactions and experience carried
over from previous groups. Biology Letters 7: 818–821.88. Cristoll DA (1995) Costs of switching social groups for dominant and
subordinate dark-eyed juncos (Junco hyemalis). Behavioral Ecology and Sociobi-
ology 37: 93–101.89. Monnin T (2006) Chemical recognition of reproductive status in social insects.
Helsinki: Suomen Biologian Seura Vanamo, 1964-. Ann Zool Fennici 43: 515–530.
90. Valles SM, Porter SD (2003) Identification of polygyne and monogyne fire ant
colonies (Solenopsis invicta) by multiplex PCR of Gp-9 alleles. Insectes Sociaux 50:199–200.
91. Oliveros J (2009) VENNY. An interactive tool for comparing lists with VennDiagrams. 2007.
Genomics of Colony Founding in Fire Ants
PLOS Genetics | www.plosgenetics.org 15 August 2013 | Volume 9 | Issue 8 | e1003633